platinum deposition modeling in bwr systems · epri, palo alto, ca: 2010. 1020875. protection from...
TRANSCRIPT
© 2016 Electric Power Research Institute, Inc. All rights reserved.© 2016 Electric Power Research Institute, Inc. All rights reserved.
Susan Garcia (EPRI)
Joe Giannelli (Finetech), Jim Henshaw (NNL),
International Light Water Reactor Materials
Reliability Conference and Exhibition 2016
August 1 – 4, 2016
Platinum Deposition
Modeling In BWR Systems
2© 2016 Electric Power Research Institute, Inc. All rights reserved.
Background
Majority of US BWRs are applying or planning to apply Online NobleChem™ (OLNC).
OLNC involves addition of a Na-Pt-hydroxide complex to the feedwater line of the system while the plant is at power.
Pt complex is not stable at high temperatures and decomposes to deposit Pt particles on system surfaces.
Pt on surfaces catalyse the removal of O2 and H2O2 by H2 which is also added to the feedwater.
O2 and H2O2 in BWRs can raise the electrochemical corrosion potential (ECP) of 304 and 316 stainless steels in these systems above the -230mV(SHE) required to mitigate stress corrosion cracking (SCC).
With Pt, provided there is molar excess of H2 over O2 + H2O2, the ECP remains < -230mV(SHE)
3© 2016 Electric Power Research Institute, Inc. All rights reserved.
Background
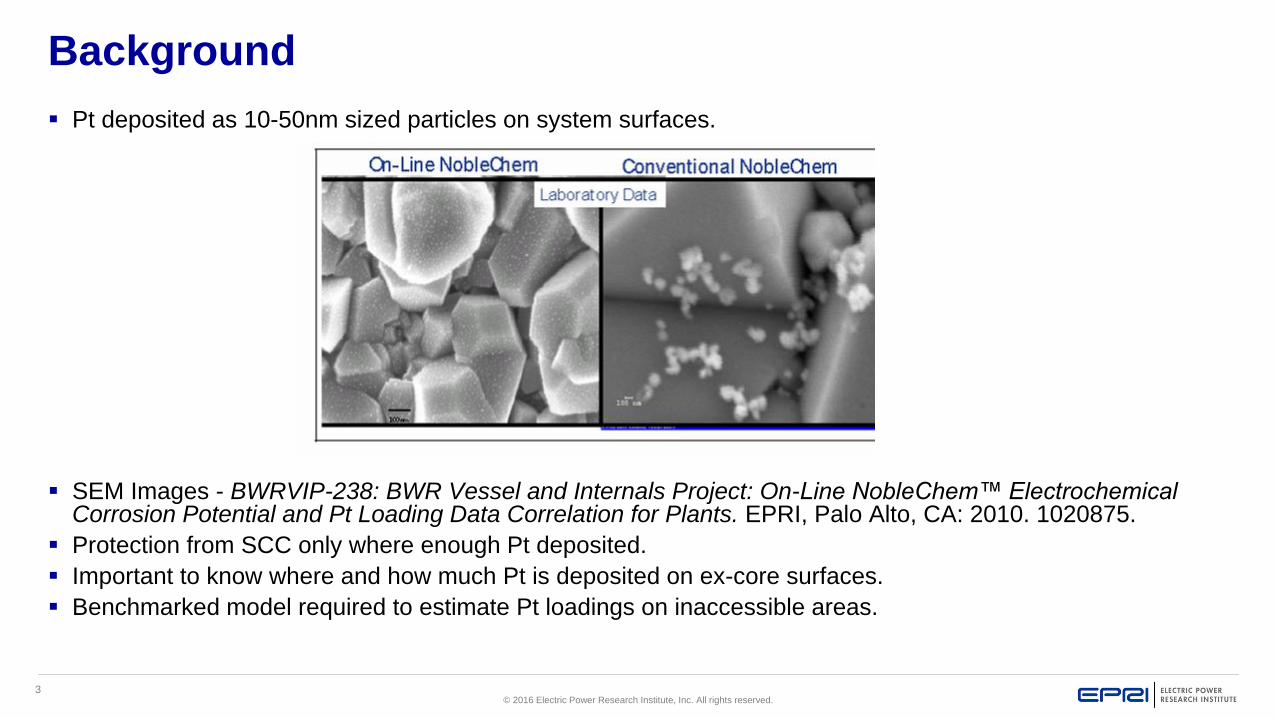
Pt deposited as 10-50nm sized particles on system surfaces.
SEM Images - BWRVIP-238: BWR Vessel and Internals Project: On-Line NobleChem™ Electrochemical Corrosion Potential and Pt Loading Data Correlation for Plants. EPRI, Palo Alto, CA: 2010. 1020875.
Protection from SCC only where enough Pt deposited.
Important to know where and how much Pt is deposited on ex-core surfaces.
Benchmarked model required to estimate Pt loadings on inaccessible areas.

4© 2016 Electric Power Research Institute, Inc. All rights reserved.
Plant Sampling Configurations
When injecting most plants monitor coolant Pt levels on the input line to the reactor water clean-up system (RWCU) via the mitigation monitoring system (MMS)
Some plants also sample coolant directly off the reactor recirculation system (RRS) line.
5© 2016 Electric Power Research Institute, Inc. All rights reserved.
Multi-Box Model Representation of Main Circuit
LP
FC
UP MP
DC
JP RL
IB OB
CU
SL1
FWN FW
SL2
MMS(Mitigation Monitoring System)
BDMSBackup Deposition Monitoring System
LP
FC
UP MP
DC
JP RL
IB OB
CU
SL1
FWN FW
SL2
MMS(Mitigation Monitoring System)
BDMSBackup Deposition Monitoring System
Pt Injection
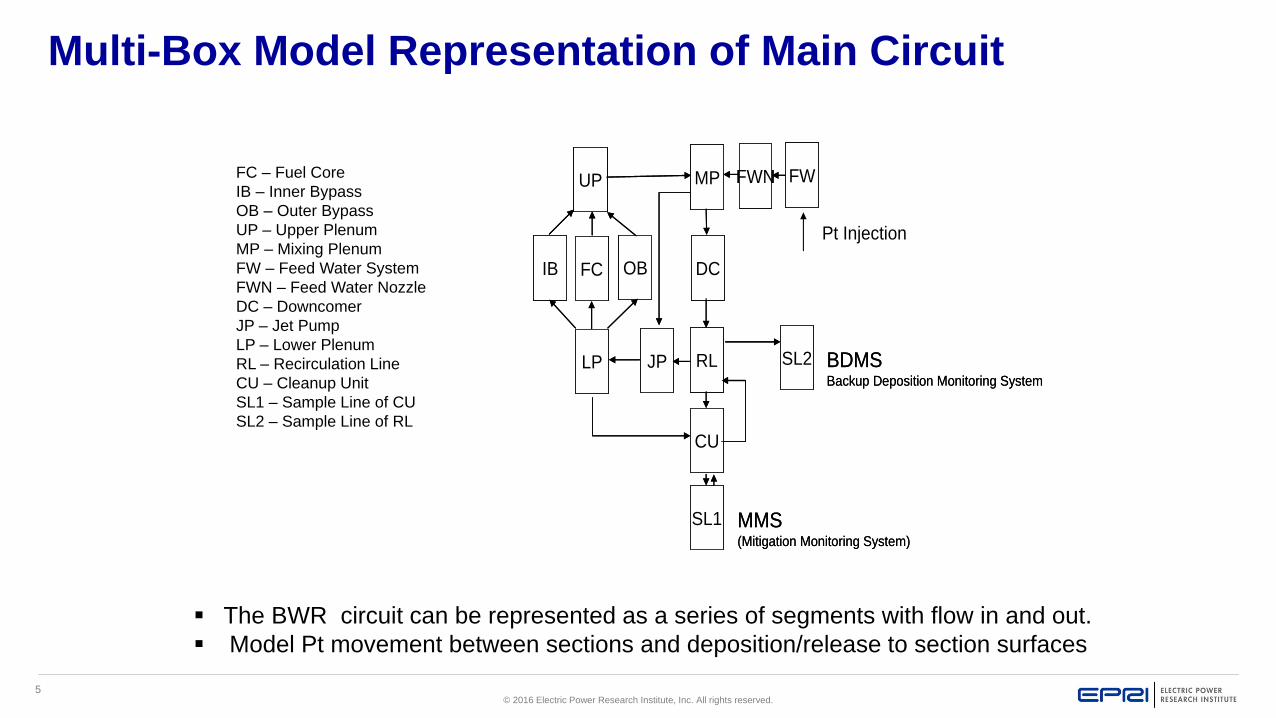
FC – Fuel Core
IB – Inner Bypass
OB – Outer Bypass
UP – Upper Plenum
MP – Mixing Plenum
FW – Feed Water System
FWN – Feed Water Nozzle
DC – Downcomer
JP – Jet Pump
LP – Lower Plenum
RL – Recirculation Line
CU – Cleanup Unit
SL1 – Sample Line of CU
SL2 – Sample Line of RL
The BWR circuit can be represented as a series of segments with flow in and out.
Model Pt movement between sections and deposition/release to section surfaces

6© 2016 Electric Power Research Institute, Inc. All rights reserved.
Basis of Model
Initial Assumptions:
– Pt in bulk coolant converts to 10nm sized particles rapidly
– All particles the same size
– Particle size such that inertial transport processes not important (mass transport treated as for molecular type species)
– Deposition rate proportional to concentration of Pt in coolant
– Release rate from surfaces proportional to Pt loading

7© 2016 Electric Power Research Institute, Inc. All rights reserved.
Initial Multi Box Model Equations
Pt Transport from one reactor section to another +
deposition, represented by the mass balance equation:
iii
i
ii
i
iii AJc
mc
m
dt
dcV
1
1
1
i – Section (e.g. MP, DC….), mi - Mass flow rate, i Water density, Vi - Section volume,
Ai – Section surface area. Ji is the Pt deposition flux to surfaces (gm-2s-1) given by
i
i
i
i
i skckJrd
ii
iii skck
dt
dsrd
si is the surface coverage, and are deposition and release constants.
Pt surface coverage si is then given by
i
dk
i
rk

8© 2016 Electric Power Research Institute, Inc. All rights reserved.
Multi Box Model Equations – Fuel Cannel
Fuel channel is split into 25 subsections, transport between sections given by
Deposition term in Ji enhanced by boiling
iii
i
ii
i
iiii AJc
)x(c)x(
mdt
dc)y(V
111 1
1
1
yi is the void fraction of the section, xi the flow quality and m the mass flow rate into
the fuel channel

9© 2016 Electric Power Research Institute, Inc. All rights reserved.
BWR Plant Data for Comparison
Initial focus on plants implementing OLNC with no previous noble metal chemical additions
Plant Initial HWC Initial OLNC
Cofrentes Mar-97 Apr-10
Fermi 2 Sep-97 Mar-11
Grand Gulf May-99 Nov-10
Leibstadt (KKL) Sep-08 Nov-08
River Bend Dec-01 May-10
Model inputs: surface areas, volumes, core/cleanup/feedwater flow rates, core voidage etc.

10© 2016 Electric Power Research Institute, Inc. All rights reserved.
BWR Plant Data for Comparison
Model compared with several different types of plant data
Coolant Pt measurements v Time (All plants)
Pt loadings on samples in MMS and Backup Deposition Monitor
Fuel clad Pt loadings (KKL)
Surface scrapes from:
– Dry tubes (Grand Gulf)
– N-9 nozzle thermal sleeve (KKM)
– Core Shroud O.D. (LaSalle 1)
– Downcomer Surveillance Capsules (Perry)
– Latch (NMP1)

11© 2016 Electric Power Research Institute, Inc. All rights reserved.
Modelling Results
Simple Pt particle deposition/release model does not work:- Predict surface coverage correctly then Pt coolant v time predictions incorrect
- Predict Pt coolant v time correctly, surface coverage incorrect.
Had to assume some Pt particles more firmly held than others (two types of Pt particle)
Pt(coolant) + S S-Pt ‘S-Pt
S – surface, S-Pt loosely held Pt, ‘S-Pt tightly held PtMaybe related to two different attachment sites, particle sizes,
growth of Ni/Fe oxide, attachment as particulate Pt(nm sized) or Pt on Fe/Ni particles in coolant

12© 2016 Electric Power Research Institute, Inc. All rights reserved.
Typical Model - Inputs
BWR section areas/volumes
Pt feed rate: 3g/h
Feedwater flow: 14.1x10⁶ lb/h
Feedwater line: 30m long, 0.3m diameter (no data)
Feedwater nozzle: 0.3m long, 0.025m diameter
Clean up flow: 1.5x10⁵lb/h
Cleanup Line: 100m long, 0.1m diameter
Sample line: length 65ft, diameter 1inch
Sample line flow rate: 0.022kgs-1
Full power core flow: 12.1x10³kgs-1
Core power, voidage and quality distributions needed (generic values used)

13© 2016 Electric Power Research Institute, Inc. All rights reserved.
Model Results – Coolant Pt
Coolant Data at Cofrentes, first OLNC
Decay rate slower than clean-up rate, Pt released slowly after Pt
injection stops
Injection Stops
14© 2016 Electric Power Research Institute, Inc. All rights reserved.
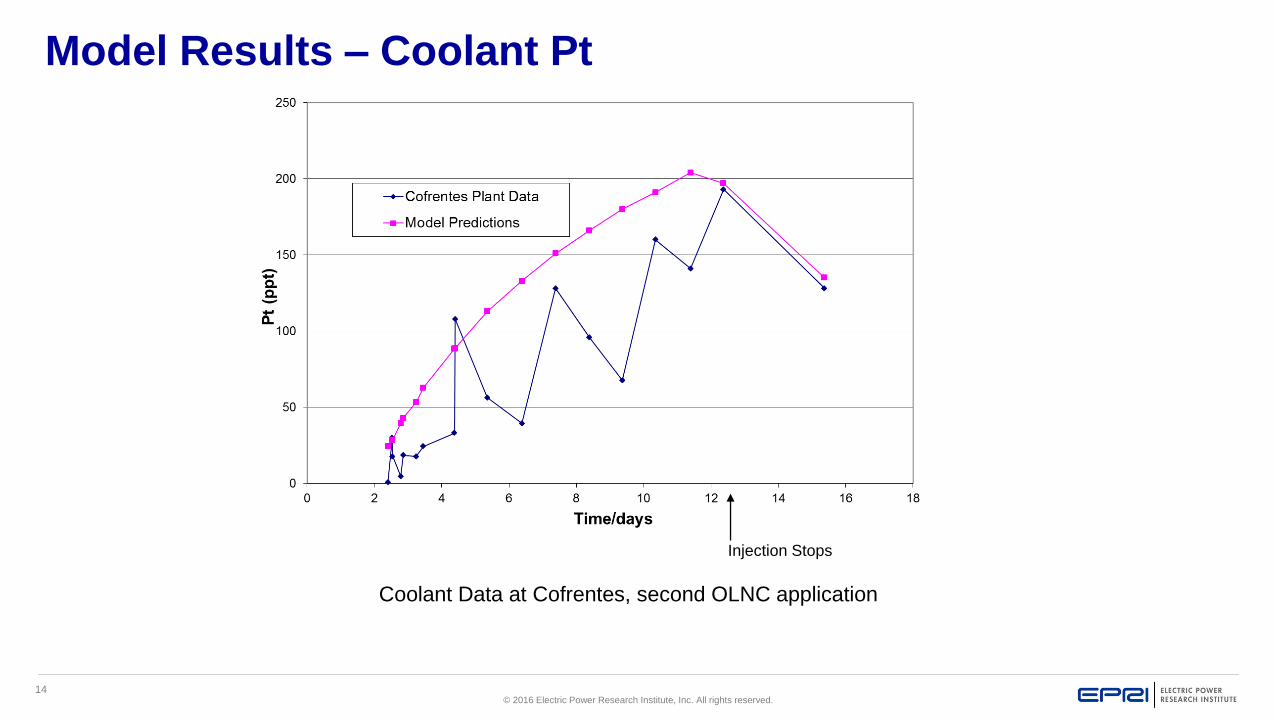
Model Results – Coolant Pt
Coolant Data at Cofrentes, second OLNC application
Injection Stops

15© 2016 Electric Power Research Institute, Inc. All rights reserved.
Model Results – Coolant Pt
KKL Coolant Data

16© 2016 Electric Power Research Institute, Inc. All rights reserved.
Model Results – MMS Coupon Samples
Cofrentes Steel MMS data
Sample 1 was 84 days exposure, Sample 2 405 days, Sample 3 551 days

17© 2016 Electric Power Research Institute, Inc. All rights reserved.
Model Results – MMS Coupon Samples
KKL Deposition Monitoring Data
Greater pickup on Backup Deposition Monitor, suggesting significant Pt loss
on cleanup and sample lines to MMS skid

18© 2016 Electric Power Research Institute, Inc. All rights reserved.
Model Results – Fuel Scrapes
KKL Fuel Clad Deposition Data
Currently model is a crude representation of the core, wouldn’t
expect a reasonable comparison.

19© 2016 Electric Power Research Institute, Inc. All rights reserved.
Model Predictions of Plant Behaviour
0.00E+00
5.00E-02
1.00E-01
1.50E-01
2.00E-01
2.50E-01
3.00E-01
3.50E-01
4.00E-01
Core Bypass Outer Bypass Upper
Plenum
Mixing
Plenum
Downcomer Recirculation Jet Pump Lower
Plenum
Reactor
Water Clean
Up
Sample Line
1 - RWCU
Location
Su
rface C
overa
ge o
f P
t m
g/c
m2
Relatively even distribution of Pt around ex-core circuit

20© 2016 Electric Power Research Institute, Inc. All rights reserved.
Summary of Pt Deposition Modelling
OLNC is being increasingly adopted by the BWR industry
Pt is only effective in protecting from SCC where it deposits
Developed Pt transportation deposition-release model
Accumulated significant amount of Pt plant data
Model fitted to OLNC data from Cofrentes, Grand Gulf and KKL
Model comparisons with plant data reasonable
Difficult to account for plant observations with simple deposition-release model, results suggest fraction of Pt held very firmly to surfaces (mechanism unclear)
Gradual increase in coolant Pt consequence of rapid uptake of injected Pt – model indicates a significant fraction of injected Pt deposits in the core
Model suggests on ex-core surfaces Pt relatively evenly distributed around the system
Further development of the model and comparisons with plant data planned

21© 2016 Electric Power Research Institute, Inc. All rights reserved.
Together…Shaping the Future of Electricity