plastics in the uk economy - wisconsin...
TRANSCRIPT

Plastics in the UK economya guide to polymer use and the opportunities for recycling

Waste Watch is a leading environmental organisation promotingsustainable resource management in the UK by campaigning forall areas of society to: reduce resource consumption, maximiseresource reuse, and increase the percentage of waste recycled.
The work of Waste Watch falls into six areas: research andpolicy, the Wasteline Information Service, education,communication campaigns, business services, andmembership. Waste Watch is a national charity establishedin 1987, supported by members, business, localGovernment, central Government‘s Department forEnvironment, Food and Rural Affairs (DEFRA) and fundingvia the Landfill Tax Credits Scheme and the NationalLottery. Waste Watch works with community organisations,local and national Government, businesses and the publicto raise awareness and effect change on waste.
This report is the result of a partnership between WasteWatch, Valuplast and Recoup. It is based upon initial datacollection and analysis carried out by Valuplast, andsubsequent detailed analysis and reporting by Recoup.Plastics in the UK economy was written by AndrewSimmons and Sarah Dandy of Recoup, with additionaldata and analysis provided by Brian Smith of Valuplast.The report has been edited by Claudia Kuss-Tenzer andCathy Crofts of Waste Watch.
The report is funded by Biffaward and together with acomplementary study providing information on the flowof plastic materials through the economy, forms part of theBiffaward Programme on Sustainable Resource Use.The material flows analysis was carried out by BowmanProcess Technology and is presented in a report entitledPlastics Mass Balance UK which is included as AppendixD in this report. Both reports, including additional analyses,are available at a dedicated website(www.plasticsintheuk.org.uk) or can be accessed from theWaste Watch website.
Biffaward Programme Objectives - The aim of this programme is to provideaccessible, well-researched information about the flowsof different resources through the UK economy basedeither singly, or on a combination of regions, materialstreams or industry sectors.
Background - Information about material resource flowsthrough the UK economy is of fundamental importance tothe cost-effective management of resource flows,especially at the stage when the resources become ‘waste’.In order to maximise the programme’s full potential, datawill be generated and classified in ways that are consistentboth with each other, and with the methodologies of theother generators of resource flow and waste managementdata. In addition to the projects having their own meansof dissemination to their own constituencies, their data
and information will be gathered together in a commonformat to facilitate policy making at corporate, regionaland national levels.
RecoupRecoup is the UK’s technical centre for post-consumerplastics recycling. Recoup’s work improves theopportunities to recycle plastics - developing and providingpractical information, guidance and specialist resources forlocal government, packaging supply-chain and wastemanagement professionals. Projects are funded bymembers, grants and donations. Recoup’s work helpsrecycling scheme planners, investors and operators in theUK to extend household plastics recycling facilities.Contact: [email protected]
ValuplastValuplast Ltd is the "not for profit" Plastic MaterialsOrganisation set up to represent the UK Plastics packagingindustry. Valuplast exists to facilitate the recovery andrecycling of all used plastic packaging in the mosteconomical and environmentally sensible way. It acts as acrucial link with Government on packaging wasteregulations and implementation.
Bowman Process TechnologyBowman Process Technology is a consulting companyspecialising in process innovation and analysis forenvironmental improvement. The company has appliedskills in waste management and minimisation,environmental improvement, fugitive emissions, recyclingand treatment/remediation in a number of sectors,including the chemical and manufacturing industries.
© Waste Watch & Recoup 2003
www.plasticsintheuk.org.ukWhereas every effort has been made to ensure that the information provided in thispublication is accurate, the partners give no condition, warranty, expressed or impliedabout the fitness of the report.
Spiral relief inpolyester resinby Claude Blin
Claude Blin /Sandretto PlasticsArt Museum
Abbreviations and acronyms
Executive summary 6
Introduction 11
Plastics in the UK economy 11
Project aims and objectives 13
Packaging sector 14
Household packaging 15
Analysis of plastics waste arisings 15
Legislation and voluntary agreements 16
Practicalities of recycling 17
Review of EIAs 18
Recommendations and priorities for action 20
Commercial and industrial packaging 21
Analysis of plastics waste arisings 21
Legislation and voluntary agreements 21
Practicalities of recycling 22
Review of EIAs 24
Recommendations and priorities for action 24
Automotive sector 26
Analysis of plastics waste arisings 26
Legislation and voluntary agreements 26
Practicalities of recycling 27
Review of EIAs 29
Recommendations and priorities for action 31
Electrical and electronics sector 32
Analysis of plastics waste arisings 32
Legislation and voluntary agreements 34
Practicalities of recycling 35
Review of EIAs 38
Recommendations and priorities for action 39
Building and construction sector 40
Analysis of plastics waste arisings 40
Legislation and voluntary agreements 42
Practicalities of recycling 42
Review of EIAs 44
Recommendations and priorities for action 45
Agricultural sector 46
Analysis of plastics waste arisings 46
Legislation and voluntary agreements 47
Practicalities of recycling 47
Review of EIAs 48
Recommendations and priorities for action 48
Contents
Medical sector 49
Analysis of plastics waste arisings 49
Legislation and voluntary agreements 49
Practicalities of recycling 49
Review of EIAs 50
Recommendations and priorities for action 50
Furniture and housewares sector 51
Analysis of plastics waste arisings 51
Legislation and voluntary agreements 51
Practicalities of recycling 51
Review of EIAs 51
Recommendations and priorities for action 51
Conclusions 52
Appendices 55
Appendix A - UK plastics consumption 56
Appendix B - Summary of identification, separation and recycling technologies 59
Appendix C - Recent developments in identification and separation technologies 62
Appendix D - Plastics mass balance UK 64
References 78
Acknowledgments 80
Tables
1 UK consumption of plastics by market sector 11
2 Plastics packaging household waste in the UK 15
3 Plastic packaging entering the commercial and industrial sector, 2001 21
4 Recyclate use in various applications 22
5 Returnable packaging systems 23
6 Recycling and recovery targets for ELV 26
7 Material breakdown of a typical vehicle 27
8 Electrical and electronic waste arisings and breakdown of quantities recycled, 2000 32
9 Equipment and polymer types targeted for recycling 33
10 WEEE draft directive recycling and recovery targets 34
11 Polymer types used in the building and construction sector 40
12 Quantity of potentially recoverable plastics in building and construction sector 41
13 Estimates of agricultural waste arisings (tonnes), 1998 46
14 Polymer types used in the furniture and housewares sector (tonnes) 51
Figures
1 UK plastics consumption (selected polymer types and sectors), 2000 7
2 Flow of plastics materials through the UK economy, 2000 12
3 Percentage of UK consumption of plastics by market sector and polymer type, 2000 13
4 Percentage of main polyethylene film grades from commercial and industrial waste, 2001 21
5 Current methods of processing end-of-life vehicles 28
6 Polymer types used in electrical and electronic equipment 33
7 Current methods of processing end-of-life electrical and electronic equipment 35
8 Constituents of plastics packaging waste in construction (%) 41
9 Plastics waste from construction and demolition 42
10 Waste management practices for silage wrap 47

ABS Acrylonitrite Butadiene Styrene
ACORD Automotive Consortium on Recyclingand Disposal
ACP Advisory Committee on Packaging
APC American Plastics Council
APME Association of Plastics Manufacturersin Europe
ASA Acrylonitrile Styrene Acrylate
BPF British Plastics Federation
BRE Building Research Establishment
CA site Civic amenity site
CARE Consortium for Automotive Recycling
CECET Centre for Energy Conservation &Environmental Technology
CFC Chlorofluorcarbon
C & I Commercial and industrial
CIRIA Construction Industry Research andInformation Association
CIWM Chartered Institution of WastesManagement
CN code Combined nomenclature code
DEFRA Department for the Environment, Foodand Rural Affairs
DTI Department of Trade and Industry
EA Environment Agency
EC European Commission
EfW Energy from Waste
EIA Environmental Impact Assessment
ELV End-of-life Vehicle
EMR European Metal Recycling
EPDM Ethylene Propylene Diene Monomer
EPFLOOR EuPC PVC Flooring Sector Group
EPPA European PVC Window Profile andRelated Building Products Association
EPS Expanded Polystyrene
HDPE High Density Polyethylene
HIPS High Impact Polystyrene
ICER Industry Council for ElectronicEquipment Recycling
IGD Institute of Grocery Distribution
LCA Life Cycle Assessment
L/LLDPE Low/Linear Low Density Polyethylene
MRF Materials Recycling Facility
MSW Municipal Solid Waste
MVDA Motor Vehicle Dismantlers Association
NHS National Health Service
PA Polyamide
PBB Polybrominated Biphenyls
PBDE Polybrominated Biphenylethers
PBT Polybutylene Terephthalate
PC Polycarbonate
PC/ABS PC and ABS blend
PE Polyethylene
PERN Packaging Export Recovery Note
PET Polyethylene Terephthalate
PIFA Packaging and Industrial FilmsAssociation
PMMA Polymethyl Methacrylate
PO Polyolefins
POM Polyoxymethylene (Acetal)
PP Polypropylene
PPS Polyphenylene Sulphide
PRN Packaging Recovery Note
PRoVE Plastic Reprocessing Validation Exercise
PS Polystyrene
PUR Polyurethane
PVC Polyvinyl Chloride
R&D Research and Development
RECOUP Recycling of Used Plastics Ltd
RoHS Restriction of HazardousSubstances Directive
SAN Styrene Acrylonitrile
SI Statutory Instrument
SIC Standard industrial classification
SME Small and medium enterprises
SMMT Society of Motor Manufacturers andTraders
TEPPFA The European Plastics Pipes andFittings Association
TNO Toegepast-NatuurwetenschappelijkOnderzoek (Netherlands Organisationfor Applied Scientific Research)
UPR Unsaturated Polyester Resin
WEEE Waste Electrical and ElectronicEquipment
WRAP Waste and Resources Action Programme
Abbreviations and acronyms

IntroductionPlastics use has grown substantially over the last 50years and plastics are today found in a wide range ofapplications, encompassing a wide variety of polymertypes. The intended life-span of plastics products variesfrom several months, for example many packaging items,to over 50 years for building/construction components. Inthe UK, almost 4.5 million tonnes of plastics productswere used in 2001 and it is anticipated that plasticsconsumption will grow by up to 4% annually. It isestimated that during 2000, between 3 and 3.5 milliontonnes of waste plastics required disposal.
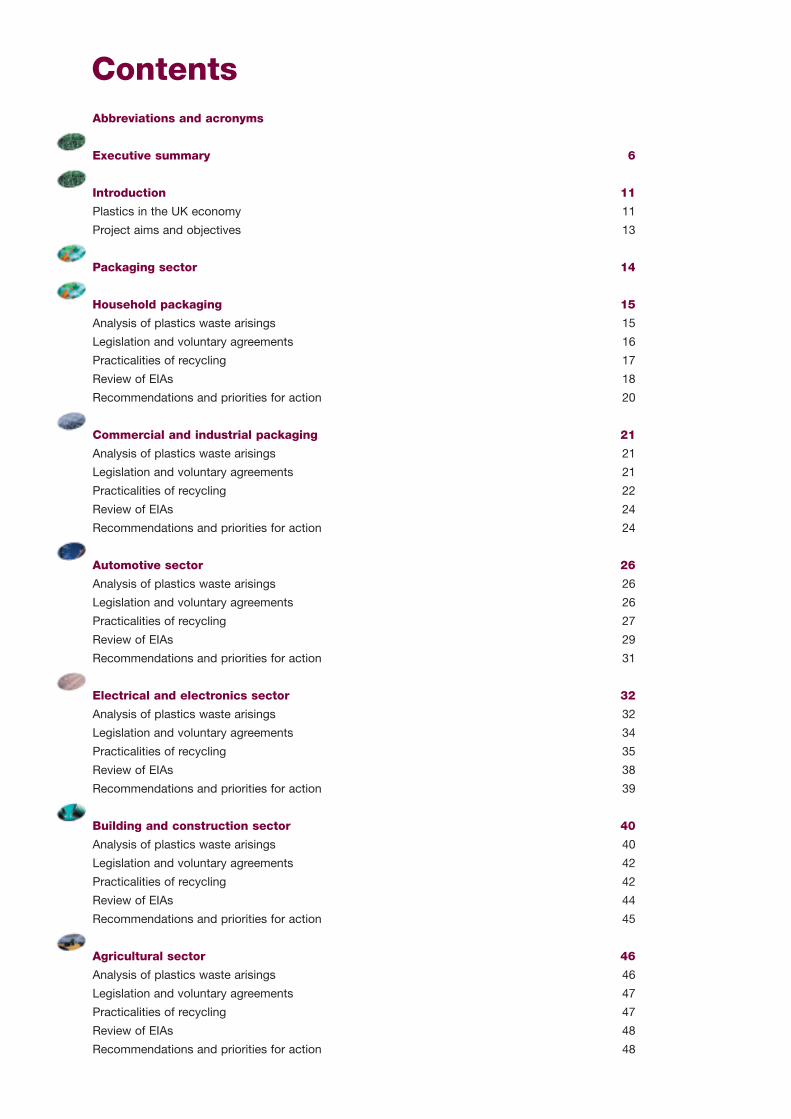
Figure 1 shows a breakdown of UK plastics consumptionby selected polymer types and sectors. Figure 2 (p.12)illustrates the flow of plastics materials through the UKeconomy. In 2000, 4.13 million tonnes of primary plasticsmaterials were consumed by the UK manufacturingsector. In addition, the import of plastic goods andcomponents exceeded exports by an estimated 320,000tonnes. A total of approximately 4.45 million tonnes ofplastic were consumed in the UK during 2000. The fullmaterial flows analysis, carried out by Bowman ProcessTechnology and presented in a report entitled PlasticsMass Balance UK, can be found in Appendix D.
This report is intended as an initial study and aims toidentify the opportunities for, and the barriers to,recycling of plastics waste in the UK. The reportconsiders the use of plastics, the key regulatory driversand the practicalities of recycling in the packaging,automotive, electrical/ electronic, building/construction,agricultural, medical and furniture/housewares sectors. Itsets out priorities for action within each sector andproposes a framework for further analysis.
The prioritisation of these recommendations has beenbased on their likely ability to increase the level ofsustainable plastics recycling. A number of factors wereused in considering priorities, including the impact on thequantity of material diverted from landfill; the availabilityof commercial technology and market capacity to enablerecycling and the economic viability of recycling.
Plastics in the packaging sectorPackaging represents the single largest sector of plasticsuse in the UK economy. An estimated 1.64 milliontonnes of plastics were used in packaging applicationsduring 2002. In this report, household andindustrial/commercial packaging are discussedseparately because material flows, technologicaldevelopment and the resulting opportunities for recyclingdiffer in each area.
In 2001, plastics packaging made up approximately 7%(1.428 million tonnes) of UK household waste arisings.Discounting the weight of contaminants such as foodand moisture, the quantity of potentially recoverableplastics packaging is estimated to be 1.2 million tonnes.A large percentage of these arisings are plastic bottles,which are easily identified and separated and have arelatively high weight with comparatively littlecontamination. Plastic bottle collection systems havebeen established by just over half of all local authoritiesand 4.1 million households are currently served by amulti-material kerbside collection scheme which includesplastic bottles. The UK’s current collection levels are lowcompared to that of other European states. However, thehigh consumption of plastic bottles in the UK combinedwith the potential for extending existing local authoritycollection systems to include plastics bottles at little orno additional cost, make this a prime target forincreasing plastics recycling in this sector.
In the commercial/industrial sector, an estimated690,000 tonnes of plastics packaging were used during2002. The majority of this comprises polyethylene (PE)films, used in pallet shrink wrap, heavy duty sacks andindustrial liners, of which approximately 266,000 tonnesare potentially recyclable. Limited information exists onthe remaining quantity of plastics packaging. In 2001,an estimated 195,000 tonnes of plastics packaging fromcommercial/industrial sources were recycled in the UK.A further 60,000 tonnes were exported for recycling.Approximately 90,000 tonnes were used in themanufacture of new film products. PE film representsthe single most common type of recyclable plasticspackaging from this sector, and PE recycling processesare well-established. Other recyclable plasticspackaging includes PE and polypropylene (PP) cratesand trays and expanded polystyrene (EPS) packaging.There has been significant growth in reusablepackaging, particularly in the retail sector, such as PPcrates used by supermarkets. Between 1992 and 2002,the use of returnable PP crates has risen from 8.5million to 35.8 million.
The primary legislative drivers in both sectors are theEC Directive on Packaging and Packaging Waste94/62/EC (the Packaging Directive), which has beenimplemented in the UK through the ProducerResponsibility Obligations (Packaging Waste)Regulations 1997 and the Packaging (EssentialRequirements) Regulations 1998. The former setstargets for the recovery and recycling of packagingwastes, including plastics, whereas the latter specifiesminimum design standards.
6 plastics in the UK economy
www.plasticsintheuk.org.uk 7
Plastics in the automotive sectorIn terms of volume, today’s cars contain a largerproportion of plastics than any other material. Due totheir light weight, however, plastics only account for anaverage of approximately 10% of the total weight of avehicle. In the UK, between 1.8 and 2 million carsreached the end of their lives and approximately 2.2million new cars were registered in 2000. Assuming anaverage life-span of 14 years and an average weight of1100 kg for a new vehicle, plastics waste arising fromvehicular sources can be expected to exceed 240,000tonnes in 2014.
Although vehicles are one of the most effectively recycledproducts in the UK, currently only small quantities ofwaste plastics from end-of-life vehicles (ELV), such as PPbattery cases and bumpers, are recycled. PP accountsfor 41% of plastics used in vehicles and its use is
expected to increase in the production of new vehicles.This is partially driven by cost considerations, but alsorepresents an attempt to reduce the number of differentpolymers used to produce individual parts in order tofacilitate recycling.
The separation of waste plastics from ELV can take placeat either the dismantling or shredding stage. The cost-effectiveness of ELV dismantling decreases as more partsare being recovered, which is a strong disincentive forcomplete dismantling. The greatest potential forincreasing recycling exists in generating polymer streamsfrom shredder residue and there has been considerabledevelopment in technologies to identify and separateplastics at this stage.
The ELV Directive 2000/53/EC is the main legislativedriver in the automotive sector. It aims to reduce the
Figure 1 - UK plastics consumption, 2000 (selected polymer types and sectors)
total UK consumption by polymer type total UK consumption by sector
packaging1640kt
transport/automotive
295kt
electrical/electronics
315kt
building/construction
930kt
agriculture/horticulture
275kt
medical85kt
furniture/housewares
295kt
ABS235kt
EPS57kt
HDPE544kt
LDPE1002kt
PET235kt
PP764kt
PS260kt
PVC777kt
UK manufacturing
Source - data supplied by Valuplast (2001)Note - Only the most commonly used polymer types have been included in this breakdown (PA, PMMA, POM, PUR, PC/ABS, UPR, Epoxy resin and phenolic are not included). Theanalysis also excludes the toys, leisure and fashion sectors. Discrepancies between the totals presented in this figure and totals listed in Table 1 are due to the exclusion of thesepolymer types and sectors.

waste from ELV and sets rising recovery and recyclingtargets. However, these targets are non-material specificand it is likely that they will be reached without significantincreases in plastics recycling from ELV. The UKgovernment is currently in discussion with industry on themost appropriate options for implementation. Aconsultation paper and draft regulations have beenpublished recently. In addition, a number of associationsentered into the voluntary cross-sector AutomotiveConsortium on Recycling and Disposal (ACORD)agreement in 1997. This agreement committed ACORDmembers to recovery rates of materials of 85% in 2002,rising to 95% in 2015. However, uncertainty over theimplementation of the ELV Directive has delayedinvestment in essential treatment facilities and it isunlikely that these targets will be achieved.
Plastics in the electrical andelectronics sectorPlastics are used in a wide variety of electrical andelectronic equipment due to their durability, light weight,resistance to corrosion and insulation properties. In 2000,plastics made up approximately 20% of the total weightof electrical and electronic equipment. In 1998, 915,000tonnes of post-consumer electrical and electronicequipment required disposal, of which 22% was plastics.However, the majority of this was sent to landfill.
The wide range of appliances and polymer types involvedmakes recovering plastics from waste electrical andelectronic equipment (WEEE) a challenging task. Differentstyrenics and PP account for approximately 70% ofplastics used in this sector. Large household appliances,IT equipment and brown goods make up over 90% of theweight of WEEE. Therefore these types of equipment andpolymers should be the prime target for efforts toincrease plastics recycling in this sector.
The most significant legislative driver in this sector isthe Waste Electrical and Electronic Equipment (WEEE)Directive proposed by the EC. Following the finalisationof the directive, member states will be expected toimplement it within 18 months, possibly by September2004. The directive aims to increase the re-use andrecycling of WEEE by setting recovery and recyclingtargets and by introducing producer responsibility fordisposal.
Plastics in the building andconstruction sectorThis sector is the second-largest consumer of plasticsafter the packaging sector. Approximately 800,000 tonnesof plastics are used annually in this sector. Compared toother materials, the percentage of plastics used is
relatively small. However, they form part of a wide rangeof applications, many of which have an intended life ofseveral decades. Common uses include pipes and ducts,insulation, floor and wall coverings, windows, linings andfitted furniture. Polyvinyl chloride (PVC) is by far the mostcommon plastic type used (60%). Other plastics usedinclude polyurethane (PU), expanded polystyrene (EPS),high-density polyethylene (HDPE), low-densitypolyethylene (LDPE) and polystyrene (PS).
It is estimated that 100,000 tonnes of PVC plussignificant quantities of HDPE are buried below groundand are unlikely to be removed for disposal. A further25,000 tonnes of PVC is contained within buildingstructures and will only be removed upon demolition. Itis estimated that a total of 575,000 tonnes of the plasticsused per year can potentially be recovered. In addition,plastics packaging makes up approximately 25% byweight of packaging waste arising at construction sites.PE sheet wrapping accounts for the largest proportion ofthis (11.6%) and it is estimated that over 17,000 tonnescould be recovered annually.
Mixed plastics recyclate at four different stages of preparation
Cou
rtes
y of
Dua
les
Sys
tem
Deu
tsch
land
AG
8 plastics in the UK economy

There are currently no significant legislative drivers relatingto plastics recycling in this sector, but the ProducerResponsibility Obligations (Packaging Waste) Regulations1997 discussed above also apply to packaging wastearisings from building and construction sites. A number ofsector associations have committed to recycle 50% ofrecoverable PVC arising from end-of-life products underthe Voluntary Commitment of the PVC Industry (‘Vinyl2010’). There is also growing emphasis on ‘sustainableconstruction’, which includes environmentally responsiblebuilding design and international standards such as ISO14001, to facilitate waste minimisation and recyclingduring the construction phase.
Plastics in the agricultural sectorThe use of plastics in the agricultural sector has grownconsiderably and plastics are common in products suchas packaging, permanent/semi-permanent buildings, cropcovers, irrigations systems, tools and equipment. Figuresfor 1998 indicate that approximately 93,000 tonnes ofwaste plastics arose during that year. Currently, nosignificant quantities of plastics are recovered.
Although there currently are no obligations to recyclematerials from these sources, the implementation of theEC Framework Directive on Waste will soon be extendedto include agricultural waste. This will introduce a wastemanagement licensing system, a legal duty of care and aregistration system for businesses transportingagricultural waste. Certain farm plastics, such as feedbags, fall under the provisions of the Packaging Directive,but silage films and crop covers are not classed aspackaging. In the early 1990s the film manufacturingindustry, recognising that many farmers had an end usedisposal problem, set up a national scheme to recover‘farm films’ for recycling. This voluntary agreement didnot succeed, however, because two overseas suppliersgained a competitive advantage through evading theassociated charge.
Recycling efforts have largely focused on films, but wastefilm arisings per enterprise are relatively low and the highlevels of contamination of silage films, mulch and cropcovers pose a challenge to recycling. There is currentlyone recycler of farm films in the UK and grant-subsidisedfilm collection schemes exist in Wales, Cumbria andScotland. However, schemes are not financially viableunless farmers are charged for the service or there issome form of subsidy.
Plastics in the medical sectorPlastics are used in the medical sector in a variety ofapplications, ranging from highly sophisticated items suchas prosthetics to more common objects like drip bottlesand instrument trays. The latter are often readilydisposable and will be used and discarded within one yearof purchase. In addition, plastics waste arises in electronicequipment, such as personal computers and medicalmonitoring equipment. Quantitative data on plastics usewithin this sector is limited. It is estimated that 95,000tonnes of polymer are used in the production of medicalapplications, with PS accounting for approximately 10,000tonnes. PVC is also commonly used.
There are no specific recycling requirements relating tothis sector and most medical products are excludedfrom the WEEE Directive. Any plastics recycling schemewill be required to comply with the Clinical WasteRegulations 1992.
Research suggests that over 50% of waste generated byhospitals can be classed as domestic waste, whichincludes recoverable plastics. Many NHS Trusts performsome form of material separation, but this is usuallyrestricted to glass, metal and paper. The inclusion ofplastics in separation schemes could significantlyincrease plastics recycling in this sector.
www.plasticsintheuk.org.uk 9
Plastics in the furniture andhousewares sectorA wide variety of household items are manufactured fromplastics. The largest quantities of plastics are used in theproduction of outdoor furniture and fittings, with over 70%of UK households owning some form of plastic gardenfurniture. More recently, demand for plastics has risen dueto the manufacture of containers for recyclables, wheeledbins, composters and water butts.
Data for the sector is limited, but suggests that PP and PSare most commonly used in furniture production, with PPand HDPE most commonly found in houseware items. Arange of garden product suppliers use recycled plasticsfrom polyolefins (PO) and PS and it is estimated that over20,000 tonnes of recycled plastics per annum are used inthese applications within the UK.
There are a number of social enterprise schemes acrossthe UK, which collect furniture for reuse or recycling.Opportunities to promote reuse and recycling exist inutilising and expanding this collection collectioninfrastructure to include plastic furniture. Currently there areno specific legislative drivers relating to the recycling ofplastic furniture and housewares waste.
The way forwardThe opportunities for, and challenges to, increasing therecycling of plastics vary considerably between sectorsand applications. Environmental impact assessments haveshown that the resources required in recycling systems,including collecting, transporting and processing wasteplastics into recyclate, are significantly lower than theresources required to produce virgin polymers. Thesubstitution of virgin polymer with recycled plastics willalso lead to greater resource savings than efficiencyimprovements in virgin polymer production alone.
The most significant opportunity to maximise therecyclability of waste plastics is through development ofseparation technology. Commercially viable systems for theseparation of plastic items such as bottles already exist.For other sectors, in particular WEEE and ELV, the greatestpotential lies in developing commercial systems for high-speed, high-quality separation of different polymer flakesarising from shredding operations.
Technology for mechanical recycling of plastics is well-established and it is likely that there will be continuedimprovements in the efficiency of these processes.Mechanically recycled materials can already be found inhighly specified applications such as food-grade packagingand automotive components. The main opportunity for
developing mechanical recycling lies in the processing ofmixed plastics into commercial products. Although viableprocesses do not appear to exist currently, the progress ofmany researchers and entrepreneurs in this relatively newarea is encouraging.
It is recognised that the development of end markets forrecyclates is one of the most important drivers forincreased plastics recycling. Demand for recycled plasticswill increase when there is a reliable supply of appropriatequality recyclates. These need to be priced competitively incomparison to virgin materials to enable manufacturers toimprove profitability by switching to recyclates. It isessential for recycled materials to be promoted on thesame basis as virgin materials – according to cost andfitness for purpose – and not primarily because of their‘green’ credentials. Recyclate suppliers also need toprovide an equivalent service, quality assurance andmarketing capacity to the virgin polymer industry.
Priorities for action
The most significant opportunities for increasingplastics recycling in the sectors considered in thisstudy are
• increase post-consumer plastic bottle recyclingthrough the inclusion of plastic bottles inintegrated multi-material kerbside collectionschemes
• maximise the recycling of plastics packaging fromthe commercial and industrial waste stream
• develop technologies for the efficient mechanicalrecycling of plastics from shredder residue
• develop a range of end markets for recoveredplastics and promote public sector procurement ofrecycled plastics products
• increase the cost of disposing of plastics waste,for example, through application of a higher landfillor disposal tax
• ensure that the environmental and economictrade-offs of recycling certain types or quantitiesof plastics are properly understood by policymakers
10 plastics in the UK economy

Plastics in the UK economyThe modern plastics industry can trace its origins backover a century and a half when, in 1862, AlexanderParkes unveiled Parkesine, the first man made plastic.
In 1891, Rayon was introduced, followed by Cellophanein 1900 and Bakelite in 1907. There are in excess oftwenty different polymer types in common usage today.These include polyvinyl chloride (PVC), polyethylene (PE),polyamide (PA), polystyrene (PS) and polypropylene (PP),which had been developed by the 1960s.
The term 'plastics' refers to a range of different polymericmaterials. These can be broken down into two distinctgroups: thermoplastics and thermosets. Thermoplasticssoften and melt on heating and may be mechanicallyrecycled into new products when the original product lifeis finished. Thermoplastics represent some 95% ofplastics use. Thermosets do not soften or melt on heatingonce moulded and, therefore, cannot be mechanicallyrecycled in the same way as thermoplastics. They maybe ground to a powder and used as filler. Alternatively,they may be feedstock recycled or used in energyrecovery processes. There are some developments inthermoset recycling, but these are considered beyond thescope of this report.
Plastics use has grown significantly in the last 50 years.Globally, consumption has risen from 5 million tonnes to
some 100 million tonnes. This growth is attributable tothe beneficial properties of plastics. They are relativelystrong, lightweight and cost-effective. They can beprecisely engineered to perform many different functions- as evidenced by the range of sectors and applicationswhere plastics are used. The plastics industry is a majorcontributor to the UK economy. Tables detailing theoverall use of plastics by polymer type are shown inappendix A.
The UK used approximately 4.5 million tonnes ofplastic products during 2000 and 4.68 million tonnesduring 2001. It is estimated that the plastics sectoraccounted for approximately 7.5 percent of the UKdemand for chemicals in 1998 (Biffaward Enviros 2002).A comprehensive analysis of the UK chemicals industryis presented in the ‘Sectorial Mass Balance Study forthe UK Chemicals Industry’.
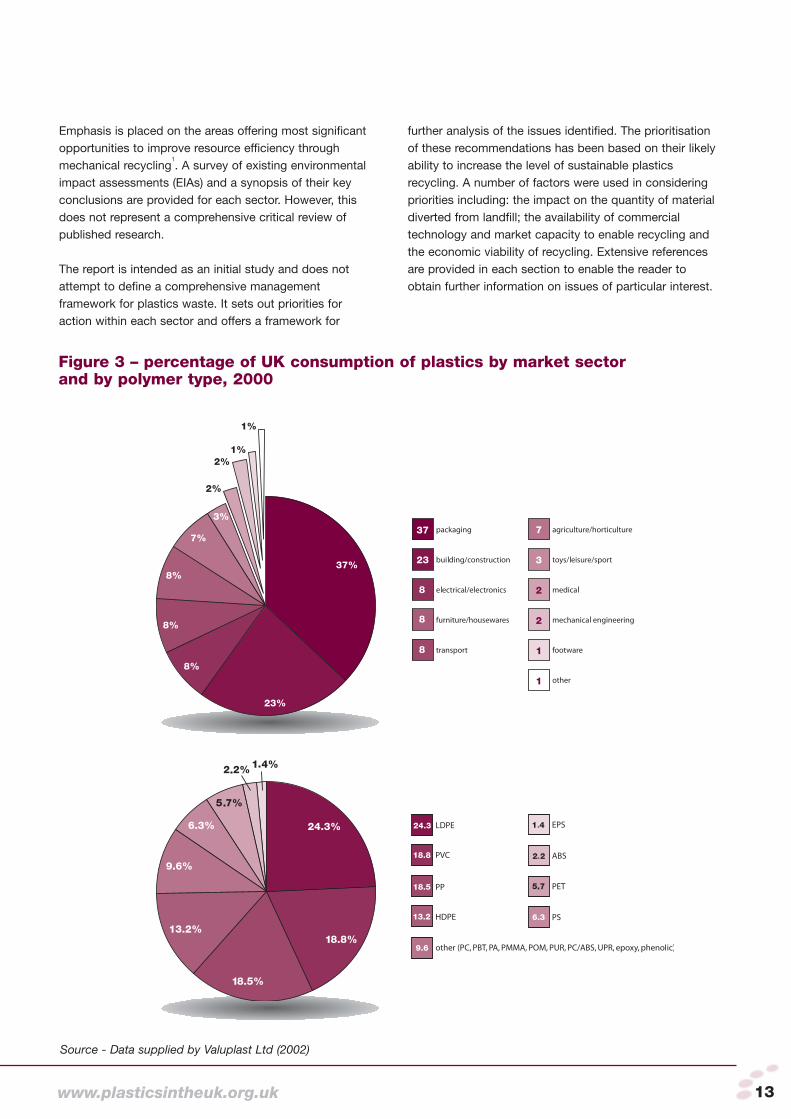
Table 1 shows the UK consumption of plastics by marketsector in 2000. Figure 3 illustrates the percentage of UKconsumption of plastics by individual market sectors andthe percentage of UK consumption by polymer type.
Polymers are used in a wide range of applications, someof the items sold become waste within a year, forexample, many packaging applications. Others, such asbuilding materials may have a functional life of over fiftyyears. It is estimated that during 2000, between 3 and 3.5
Table 1 – UK consumption of plastics by market sector, 2000
market sector UK manufactured net imports totalkt kt kt
packaging 1640 1640
building/construction 930 120 1050
electrical/electronics 315 40 355
transport 295 40 335
furniture/housewares 295 40 335
agriculture/horticulture 275 35 310
toys/leisure/sport 130 15 145
medical 85 10 95
mechanical engineering 85 10 95
footware 45 5 50
other 35 5 40
total 4130 320 4450
Source - data supplied by Valuplast Ltd (2002)Note - The DTI indicate that the import of plastics goods and components exceeded exports by £800 million. At a conversion rate of £2500 per tonne (BPF 2001), net importsamount to an equivalent of 320kt. This figure has been pro-rated over all market sectors except the packaging sector, where imports/exports have already been taken into account(Valuplast 2001).
www.plasticsintheuk.org.uk 11

million tonnes of post-use plastics products entered theUK waste stream and it is anticipated that plasticsconsumption will grow year on year by up to 4%.
The characteristically low weight of plastics is translatedinto resource savings throughout the product life cycle.Examples of this are the energy savings achieved duringthe transportation of goods or the continued light-weighting of vehicles through the use of plastics.
This highlights the importance of considering themanagement of plastics waste in the wider context ofproduct life-cycles. There is evidence of a shift in thinkingaway from 'end-of-pipe' solutions to waste towards anintegrated product policy approach. Such an approachrequires consideration of increasingly complex trade-offsbetween environmental impacts and benefits of particularproducts during their life-cycle. Evidence suggests thatthis life-cycle approach will favour continuing growthin plastic products. An important aspect to consider inthis context is the environmental impact of plasticsproducts at the end of their intended life and how tominimise these.
Project aims and objectivesThis report, together with a material flows analysis carriedout by Bowman Process Technology and presented in areport entitled Plastics mass balance UK (Appendix D),forms part of the Biffaward Programme on SustainableResource Use. Both reports, including additionalanalyses, are available on a dedicated website(www.plasticsintheuk.org.uk) or can be accessed fromthe Waste Watch website.
This report aims to identify the opportunities for, andbarriers to, the recycling of plastics in the UK. The reportconsiders the use of plastics, the current issues relatingto plastics waste management and key regulatory driverswithin the following sectors of the economy:
• packaging• automotive• electrical and electronics • building and construction • agricultural• medical• furniture and housewares
1 The recycling of process-scrap generated within production processes, which is frequently re-used in the manufacture of either the same orsecondary applications, is considered beyond the scope of this report. There is a growing interest in the potential of biodegradable polymersin certain applications. This is a complex area in itself and also beyond the scope of this report.
Figure 2 - flow of plastics materials through the UK economy, 2000
Source - Bowman Process Technology with data supplied by Valuplast (2002)
12 plastics in the UK economy
Emphasis is placed on the areas offering most significantopportunities to improve resource efficiency throughmechanical recycling
1. A survey of existing environmental
impact assessments (EIAs) and a synopsis of their keyconclusions are provided for each sector. However, thisdoes not represent a comprehensive critical review ofpublished research.
The report is intended as an initial study and does notattempt to define a comprehensive managementframework for plastics waste. It sets out priorities foraction within each sector and offers a framework for
further analysis of the issues identified. The prioritisationof these recommendations has been based on their likelyability to increase the level of sustainable plasticsrecycling. A number of factors were used in consideringpriorities including: the impact on the quantity of materialdiverted from landfill; the availability of commercialtechnology and market capacity to enable recycling andthe economic viability of recycling. Extensive referencesare provided in each section to enable the reader toobtain further information on issues of particular interest.
Figure 3 – percentage of UK consumption of plastics by market sectorand by polymer type, 2000
Source - Data supplied by Valuplast Ltd (2002)
www.plasticsintheuk.org.uk 13

Packaging represents the largest single sector of plasticsuse in the UK economy. It is estimated that 1.64 milliontonnes of plastics were used in packaging applicationsduring 2000 (Valuplast 2001). Plastics packagingtonnage is growing at 3% per annum.
Plastic packaging types are broadly divided into twocategories: rigids and flexibles. The term flexibles refersto film applications such as pallet stretch and shrink film,bubble film, sacks and liners. The term rigids refers toapplications such as drums, bottles, tubs, trays, cupsand foamed packaging.
Plastics packaging is also categorised according to itspurpose. Primary packaging is the unit sales packagingof a product, for example a plastic bottle. Secondary andtertiary packaging are terms describing the packaging required to distribute the packed product and ensure it reaches the point of retail without damage, for example pallets, stacking trays and pallet wrap.
Primary packaging typically has the shortest life-cycle ofthe plastics applications, with almost all used andrequiring disposal in less than one year. There is agrowing trend towards reuse of distribution packagingand there are considerable innovations in minimisingresource use in this area.
It is useful to consider plastic packaging use andarisings in two separate areas: commerce/industry andhouseholds. This is because the material flows,technology implications and the drivers for changediffer in each area.
PET bottles prior to sorting
Cou
rtes
y D
uale
s S
yste
m D
euts
chla
nd A
G
14 plastics in the UK economy

Table 2 – plastics packaging household waste in the UK
plastic item % of household waste quantity of household waste potentially recoverable plastic(weight) (plastics & residual contamination, (tonnes)
tonnes)
carrier bags 1.853
227,700 193,6004
refuse sacks 138,800 118,000
packaging film 1.77 356,700 303,200
other film 0.23 46,300 39,400
PET clear bottles 0.78 157,200 133,600
PET coloured bottles 0.16 32,200 27,400
HDPE natural bottles 0.71 143,100 121,600
HDPE coloured bottles 0.5 100,800 85,600
PVC clear bottles 0.08 16,100 13,700
PVC coloured bottles 0.02 4,000 3,400
other plastic packaging 1.71 344,600 292,900
other dense plastics 1.29 259,900 221,000
sub-total plastic packaging 7.07 1,428,700 1,214,400
sub-total non-packaging plastics 2.01 405,040 344,300
total plastics 9.09 1,833,700 1,558,700
Analysis of plastics waste arisings Household waste arisings have been analysed usingmarket supply data for plastics packaging and a reviewof local authority waste surveys.
The market data analysis suggests that 1.05 million tonnesof plastics were used in household plastic packagingapplications in 2002 (ACP 2001). Estimates by Valuplastsuggest the amount of potentially recoverable plastic isslightly higher at 1.1-1.175 million tonnes (Smith 2002).
Our analysis of household waste data suggests thatplastics make up 1.833 million tonnes of householdwaste, or approximately 7% of total household wastearisings. Table 2 below shows a breakdown of household waste, based on local authorities waste arisings studies(MEL 2002). Non-packaging plastics contents have been
included in the data below for easy comparison.2
It is estimated that plastics packaging accounts for 1.428million tonnes of household waste. The remainder is madeup of refuse sacks (0.145 million tonnes) and other non-packaging plastics (0.260 million tonnes). It is important tonote that these estimates includes contamination, forexample by food and moisture, paper labels and othermaterials such as aluminium caps, which are estimated toamount to up to 15%. This reduces the amount ofpotentially recoverable plastics packaging waste fromhousehold sources to approximately 1.214 million tonnes.
In addition to these arisings, there are quantities of PETbottles purchased and consumed outside the home.These are usually not disposed of via the domesticdustbin and will form part of public bin or street cleansingwaste arisings. It has not been possible to establish an
Source - MEL (2002) and RECOUP (2002)
2 We undertook two assessments: 'Top down', based on DEFRA national statistics of total household waste and 'bottom up', based onaverage amounts of plastics in household waste surveys (80.2kg/annum). The results were within 2% of each other, suggesting the data isrobust.3 We have extrapolated refuse sack and carrier bag weights from MEL Research 2002 and PIFA 2002 data.4 We have estimated material contamination of the plastic film at 15% by weight. This figure may be understated, based on PIFA dataindicating 146kt of carrier bags in total entering the wastestream. This would imply that waste arisings assessments of films may beoverstated by 56% due to material contamination. Applying this hypothesis would imply a lower overall level of plastics packaging in domesticwaste - approximately 945,000 tonnes. Such a notable disparity in the data warrants further investigation.
www.plasticsintheuk.org.uk 15

exact figure, but a comparison of PET arisings fromhousehold waste (161,000 tonnes) and market supply ofPET (261,000 tonnes) suggests that approximately100,000 tonnes are disposed of outside the home.
Legislation and voluntary agreementsRecycling and recovery targets for packagingPackaging is regulated by the EC Directive on Packagingand Packaging Waste 94/62/EC (the Packaging Directive).This sets targets for recycling and recovery of packagingmaterials, including plastics, and also requires thatspecified minimum standards of design be achieved.It requires that member states set up packaging recoverysystems which achieve the following 5 year targets, to bereached in 2001.
• 50–65% overall recovery of all packaging• 25–45% overall recycling of all packaging• 15% minimum recycling to be attained for each material
Two regulations implement Directive 94/62/EC in the UK:the Producer Responsibility Obligations (Packaging Waste)Regulations 1997 (SI 1997/648)/(SI 2002/813) and thePackaging (Essential Requirements) Regulations 1998 (SI1998/1165).
The Producer Responsibility Obligations (Packaging Waste)Regulations 1997 place a requirement on producers torecycle and recover specified amounts of packaging eachyear. The annual targets for 2002 and 2003 have been setat 19% for recycling and 59% for recovery of packagingcovered by the directive (DEFRA 2002). Businesses acrossthe packaging chain with an annual turnover of more than£2m, handling more than 50 tonnes of packaging, areobliged to comply. The regulations draw no distinctionbetween packaging recycled from household orcommercial/industrial sources.
The regulations are based on a tradable permit system.Under this system, businesses achieve compliance with theregulations by acquiring certificates of recycling andrecovery (either directly from recyclers or through service-providing 'compliance schemes'). These are known as'packaging recovery notes' (PRNs) or packaging exportrecovery note (PERNs). In theory, when actual recyclinglevels are below the target requirements, supply of PRNs willbe short and businesses will increase the prices they chargefor the PRNs to enable them to generate additional supplies.When there is more recycling activity than the statutorytargets require, the market will be oversupplied with PRNsand producers will reduce PRN purchase prices.
The second phase of the Packaging Directive, which iscurrently being completed by the EU, will set higher
targets for the next 5 years. It is expected that the plasticsrecycling target will increase to at least 20% and willinclude both mechanical and certain forms of chemicalrecycling in the acceptable processes.
The Packaging (Essential Requirements) Regulations 1998implement the single market provisions of the PackagingDirective. The Regulations cover the manufacture andcomposition of packaging, and the reusable/recoverablenature of packaging. The Regulations apply to packagingplaced on the market in the UK as packed or filledpackaging and require that
• packaging must be kept to a minimum subject to safety,hygiene and suitability for the packed product and forthe consumer
• noxious or hazardous substances in packaging must beminimised in emissions, ash or leachate fromincineration or landfill
• packaging must be reusable or recoverable through atleast one of the following: material recycling, incinerationwith energy recovery, composting or biodegradation
• heavy metal limits: packaging (and individual packagingcomponents) must not contain a combined total of morethan 100 parts per million of the following: lead,cadmium, mercury, hexavalent chromium
Responsibility for compliance lies with the legal entity thatplaces the packaging or packaging components on themarket. The Trading Standards Departments of localgovernment regulate the essential requirementsregulations.
There are no voluntary agreements on packaging. Somepackaging businesses have voluntarily invested ininitiatives to progress recycling through RECOUP or havebacked specific voluntary projects in the sector such assponsoring new collection programmes, or providingtraining on plastics recycling.
Household recycling targetsLocal government in England and Wales has a statutoryresponsibility to achieve specified recycling/compostingtargets. These targets are weight-based and non-materialspecific. On average, authorities must recycle or compost25% of household waste and recover value from 40%of municipal waste by 2005. These targets escalate to30% for recycling and 45% recovery by 2010 and willincrease further in 2015. Targets for English authoritieshave been established based on their previous recyclingperformance. The Scotland Executive and WelshAssemblies are currently progressing non-statutorytarget approaches.
16 plastics in the UK economy
Practicalities of recycling There is a well-established network of recyclers forplastics packaging, which are accredited by theEnvironment Agency (EA) or the Scottish EnvironmentalProtection Agency (SEPA). Accreditation enables thesebusinesses to issue packaging recovery notes (PRNs), asdescribed above. There were 92 accredited recyclers and30 accredited exporters of plastics packaging at the endof 2001.
In 2001, 203,149 tonnes of plastics packaging wererecycled in the UK and 66,813 tonnes were exportedfor recycling. Of this amount, it is estimated that alittle over 15,000 tonnes (5.5%) was from householdsources. This suggests a national plastics bottlerecycling rate of 3%.
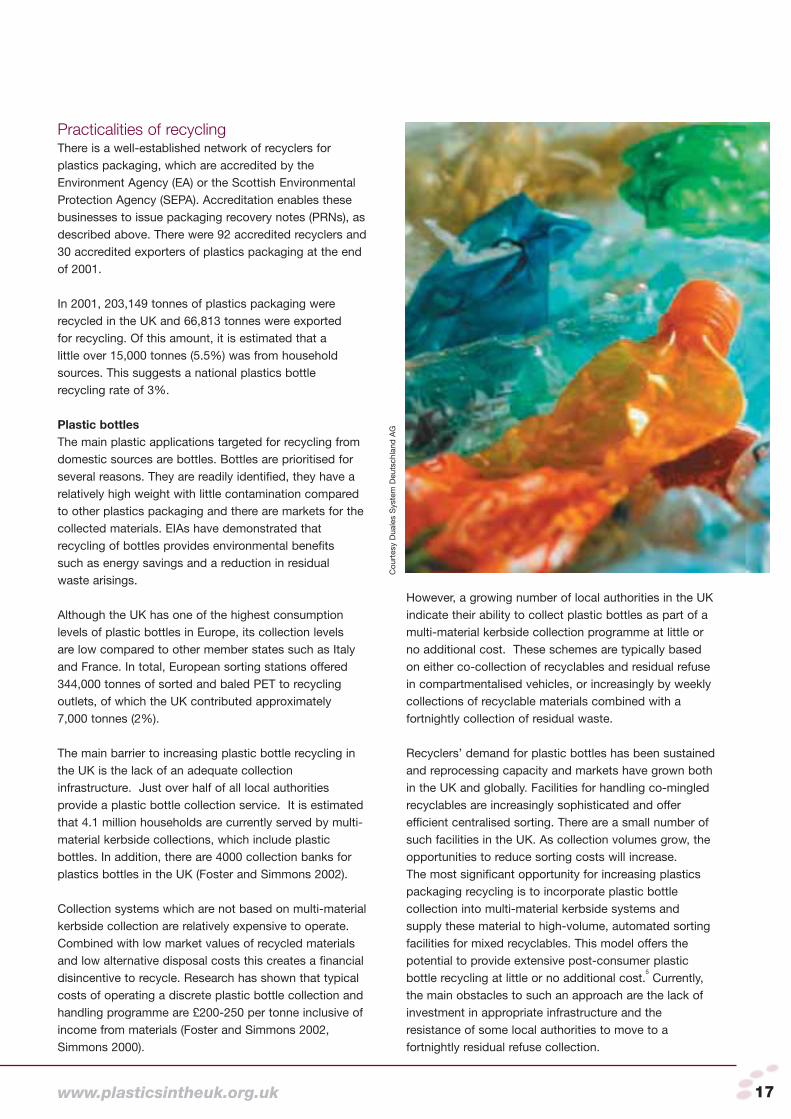
Plastic bottlesThe main plastic applications targeted for recycling fromdomestic sources are bottles. Bottles are prioritised forseveral reasons. They are readily identified, they have arelatively high weight with little contamination comparedto other plastics packaging and there are markets for thecollected materials. EIAs have demonstrated thatrecycling of bottles provides environmental benefitssuch as energy savings and a reduction in residualwaste arisings.
Although the UK has one of the highest consumptionlevels of plastic bottles in Europe, its collection levelsare low compared to other member states such as Italyand France. In total, European sorting stations offered344,000 tonnes of sorted and baled PET to recyclingoutlets, of which the UK contributed approximately7,000 tonnes (2%).
The main barrier to increasing plastic bottle recycling inthe UK is the lack of an adequate collectioninfrastructure. Just over half of all local authoritiesprovide a plastic bottle collection service. It is estimatedthat 4.1 million households are currently served by multi-material kerbside collections, which include plasticbottles. In addition, there are 4000 collection banks forplastics bottles in the UK (Foster and Simmons 2002).
Collection systems which are not based on multi-materialkerbside collection are relatively expensive to operate.Combined with low market values of recycled materialsand low alternative disposal costs this creates a financialdisincentive to recycle. Research has shown that typicalcosts of operating a discrete plastic bottle collection andhandling programme are £200-250 per tonne inclusive ofincome from materials (Foster and Simmons 2002,Simmons 2000).
However, a growing number of local authorities in the UKindicate their ability to collect plastic bottles as part of amulti-material kerbside collection programme at little orno additional cost. These schemes are typically basedon either co-collection of recyclables and residual refusein compartmentalised vehicles, or increasingly by weeklycollections of recyclable materials combined with afortnightly collection of residual waste.
Recyclers’ demand for plastic bottles has been sustainedand reprocessing capacity and markets have grown bothin the UK and globally. Facilities for handling co-mingledrecyclables are increasingly sophisticated and offerefficient centralised sorting. There are a small number ofsuch facilities in the UK. As collection volumes grow, theopportunities to reduce sorting costs will increase.The most significant opportunity for increasing plasticspackaging recycling is to incorporate plastic bottlecollection into multi-material kerbside systems andsupply these material to high-volume, automated sortingfacilities for mixed recyclables. This model offers thepotential to provide extensive post-consumer plasticbottle recycling at little or no additional cost.
5Currently,
the main obstacles to such an approach are the lack ofinvestment in appropriate infrastructure and theresistance of some local authorities to move to afortnightly residual refuse collection.
Cou
rtes
y D
uale
s S
yste
m D
euts
chla
nd A
G
www.plasticsintheuk.org.uk 17

Other household plasticsCurrently, only a limited number of recycling schemesexist for other post-consumer plastics packaging. Theseinclude carrier bag recycling programmes run by someretailers and projects to collect thermoformed pots andtubs. These schemes have generated modest tonnages(an estimated 200 tonnes per annum) and are lessfinancially viable than bottle collection schemes.
The EPS Recycling Group has undertaken initial work toevaluate recycling of expanded polystyrene (EPS) fromhousehold sources. Markets would exist for post-consumer EPS if collected to recyclers' specifications(Barnetson 2002b), but to date such schemes have notproved viable due to collection limitations. There havebeen efforts to establish mixed plastics collection andhandling systems in the UK, which would acceptpredominantly unsorted plastics from municipal waste.Development work continues but to date, the technologyhas not proved commercially viable.
The Association of Plastics Manufacturers in Europe(APME) commissioned a study (TNO 2000a) to undertakeinventories of specific plastics recycling schemes for therecycling of post-consumer and industrial packagingthroughout Europe.
6This report is a useful source of
further information on the types of scheme operatingthroughout Europe and their level of success.
Review of EIAsThere is a growing body of work that compares therelative environmental and economic impacts of differentplastic packaging waste management options. Themajority of this work considers municipal plastics wastemanagement and primarily focuses on the optimum levelof mechanical recycling. Most research measures energyuse as the primary indicator of environmental impact.
The environmental benefits of mechanical recycling ofplastic bottles and other monomer-separated plasticpackaging with low material contamination are welldemonstrated by a large number of studies.
7The main
benefits relate to the categories of 'primary energyconsumption' and 'greenhouse gas emissions'.
By far the highest level of energy use takes place duringthe initial production of the polymer. For example 90.67%(81.5MJ/kg) of the energy required to produce HDPE pipe
relates to the supply of virgin polymer whilst processenergy requirements represent only 7.93% (7.1MJ/kg) oftotal production energy requirements. The figures varydepending on the product manufactured: for HDPE plasticbottles process energy requirements increase to 19.53%of the total energy requirement (21.9MJ/kg). Resinproduction represents 90% of LDPE film productionenergy whilst process energy is 6% (Boustead 1996).
By contrast, the energy used in plastic packagingrecycling systems, from waste collection to productionof pellets or flakes intended to substitute virginpolymers, is significantly lower. For example, theproduction energy for bottle grade virgin PET is78.8MJ/kg (Boustead 2001); the energy required toproduce recycled PET flake ranges from only 8 to30MJ/kg (Matthews 1998). Even given the need for
5 RECOUP estimates that it would be possible to increase plastic bottle recycling levels to more than 200,000 tonnes per annum withminimal additional costs if this approach was adopted across the UK.6 Included are examples of PET and HDPE bottles, distribution/commercial films, crates, coffee cups, EPS industrial packaging and mixedplastics schemes. Schemes for the collection of agricultural film, PVC pipes, window profiles and vehicle bumpers were also covered.7 The specific conclusions of such studies vary depending on the system boundaries employed.
Spinnerette extruding PET fibres made from recyclate
Pen
nine
Fib
res
Ltd
.
18 plastics in the UK economy

further processing of the flake to achieve a virgin-equivalent specification, with a reduction of between 62and 90% (71 to 49MJ/kg), considerable energy savingscan be made through recycling.
The impact of transport and sorting of plastic packagingwaste is a relatively minor factor in the overallenvironmental impact of recycling systems (Wollny andSchmied 2000). Plastics recycling systems for municipalwaste are relatively new and it is likely that improvementsin the efficiency of collection, handling and reprocessingtechnology will further reduce environmental impacts.
A further important consideration in environmentalimpact assessments of recycling relates to how therecyclate is used in new applications. The greatestbenefits are demonstrated where recycled plasticssubstitute virgin polymer at a ratio of 1:1 and achieve anequivalent performance. For example, this is typically thecase in recycling of plastic bottles into new plasticbottles. Some studies have suggested that the use ofrecycled plastic packaging in other than their originalapplications (for example, fenceposts and palisades)results in a lower environmental benefit than feedstockrecycling or incineration with energy recovery of thesame material (Otto 1999). On this basis APMErecommend that 15% is the optimum level ofmechanical recycling, on the assumption that only 15%of plastic packaging can be recycled into products thatsubstitute virgin polymer (APME 1998).
Analysis of the use of recycled plastics is currently quitelimited. Further work is required before conclusions canbe made regarding the environmental gains from usingmechanically recycled plastics as replacements forconcrete, steel and wood. Such studies need to considerfactors relating to the whole product life-cycle. Forexample, the use of plastics to replace concrete productsis likely to result in significantly lighter products, whichwill have substantial benefits in reducing energyconsumption associated with the distribution andinstallation of such products. Similarly the substitution ofwood by plastics may lead not only to extended productlife but reduced maintenance requirements and use ofenvironmentally damaging chemical treatments.
study key findings
Boustead recycling of HDPE and PET(2001) bottles reduces raw material use
and solid waste generation
energy savings are only achievedunder specific logisticalcircumstances
kerbside collections are moreresource efficient than bringsystems
Centre for Energy mechanical recycling of plasticsConservation & has clear environmental benefitsEnvironmental compared to MSW incinerationTechnology(1997) feedstock recycling has
moderate advantages comparedto MSW incineration
a combination of mechanicaland feedstock recycling providesthe greatest environmental gain
Freising collection and treatment of (1999) plastics for recycling are marginal
factors in the overallenvironmental impact of therecycling system
efficient energy recovery andfeedstock recycling areenvironmentally comparable,but feedstock recycling ismore costly
mechanical recycling isenvironmentally preferable tofeedstock recycling
Holland & Wood the energy used to recycle(1996) plastic bottles is 8 times less
than is required to manufacturethe same type of virgin polymer
Matthews mechanical recycling of PET(1998) bottles is preferable to landfill
and notably better thanchemical recycling orenergy recovery
www.plasticsintheuk.org.uk 19

study key findings
Otto energy recovery and most(1999) recycling processes achieve a
significant environmental benefitcompared to landfill
mechanical recycling resultingin replacement of plasticproducts achieves greatestenvironmental gains
feedstock recycling where plasticsare used as a reducing agent orwhere thermolytic processesproduce petro-chemicalfeedstocks are environmentallypreferable to syngas production
mechanical recycling inapplications replacing wood orconcrete products showed littlebenefit over landfill within thesystem assumptions made
Russell recycling of PS vending cups(1996) results in reduced energy and
water consumption by 25%compared to disposal to landfill
Russell, O'Neill the more environmentally & Boustead efficient system for managing(1994) post-consumer HDPE is a
combination of mechanicalrecycling and energy recovery
TNO landfill is the least expensive(2000b) disposal system but has the
highest environmental impacts
increasing mechanical recyclingof MSW plastics over 15%generates little additional benefitsat significantly increased costs
increasing mechanical recyclingfrom 15% to 50% would increasecosts by a factor of three
Wollny and feedstock recycling is Schmied environmentally preferable to(2000) incineration of plastics waste
Recommendations and priorities for action
Recommendations and priorities for action for thehousehold packaging sector are listed in the sectionon commercial and industrial packaging.
20 plastics in the UK economy

Analysis of plastics waste arisingsThe Advisory Committee on Packaging (ACP) estimatesthat 690,000 tonnes of plastic packaging have enteredthe commercial and industrial sectors in 2002 (ACP2001). The majority of this will be polyethylene (PE) films.Of these films, 266,000 tonnes are particularly suitable forrecycling, as they arise in sufficient quantities and thereare existing markets for them. Figure 4 and table 3provides a breakdown of these types of film.
Figure 4 – percentage of mainpolyethylene film grades fromcommercial and industrial waste,2001
Source - Applied Market Information Ltd 2002 (PIFA 2002)
It has not been possible to ascertain a clear breakdown forthe remainder (approximately 430,000 tonnes). It has beensuggested that the ACP figure is likely to be understated,and further research is required to verify this data.
There has been a significant growth in the use ofreusable plastics packaging, especially in the retail
sector. For example, the use of reusable polypropylene(PP) crates by the major supermarkets has increasedfour-fold from 8.5 million in 1992 to an estimated 35.8million in 2002 (Twede 1999). The overall market forreturnable plastic packaging systems has doubled inthis period from 24.6 million to an estimated 47 millionunits. In addition, there is now a pool of over 500,000reusable plastic pallets in the UK and this figure isincreasing.
The standardisation of pallet sizes by the Institute ofGrocery Distribution (IGD) in 1997 has facilitated thisprogress. At a typical weight of 2.1kg per crate, it isestimated that almost 100,000 tonnes of PP is incirculation in reusable packaging systems. Crates andboxes are used in excess of 25 trips per year and havean intended life-span of 5 to 20 years. There are strongcommercial incentives that have contributed to thisdevelopment; the IGD reports that some retailers havegenerated annual savings of £10m by moving to suchreturnables systems.
Table 3 – plastic packagingentering the commercial andindustrial sector, 2001
packaging type Quantity kt
films and bags (PE, PVC, PP) 335 - 4558
EPS packaging 30
PP large containers 30
HDPE/HMPE drums 52
PS cups9
13
PP crates 45
HDPE crates 37
other 28 -14810
total 690
Source - Data supplied by RECOUP (2002)
Legislation and voluntary agreementsLegislation relating to this sector has been consideredunder in the previous section on household packaging.
8 RECOUP estimate based on PIFA and APME data9 Source: Save a Cup, personal communication10 Extrapolation of this category based on APC 2001 data. More detailed verification is recommended.
www.plasticsintheuk.org.uk 21
Practicalities of recycling There were 92 accredited plastic packaging reprocessorsand 30 exporters at the end of 2001, all of whichprocessed commercial and industrial plastics waste. It isestimated that 195,000 tonnes of plastic packagingwaste from commercial and industrial sources wasrecycled in the UK and a further 60,000 tonnes wereexported for recycling.
Data for the period from January to June 2002 indicatethis figure has grown further, with 124,719 tonnesaccepted by UK reprocessors in the period and a further60,880 tonnes exported. Assuming similar quantities forthe second half of 2002, plastics packaging recyclinglevels could be as high as 371,000 tonnes, of which over350,000 tonnes would have come from commercial andindustrial sources. This data highlights an unexpectedtrend and further research is required to establish wherethis material is being generated.
Of the commercial and industrial plastics packagingrecycled, the Packaging and Industrial Films Association(PIFA) report that 90kt of recyclate is used in themanufacture of new film products (PIFA 2002). TheWaste and Resources Action Programme (WRAP)highlight further uses for recyclate (Davidson 2002). Table4 below summarises the current UK markets for recyclateusing PIFA, WRAP and RECOUP data.
Table 4 – recyclate usein various applications
application recyclate use (kt)
polyethylene films 9011
damp proof membranes 15
pallets 2
PE lumber 20
pipes 8
fibres 3.5
EPS loose fill & insulation EPS lumber 4.500
other mouldings 35
total 17912
Source - PIFA (2002),WRAP (2002), RECOUP (2002)
Polyethylene films from commercial and industrialsources provide the main source for plastics recycling.Crates, trays and expanded polystyrene (EPS)packaging represent the majority of other plasticsrecycled from this sector.
The main challenges in the sector relate to the quantitiesof arisings, contamination, identification of materials,handling facilities and the culture of disposal. Barriers toand opportunities for recycling are considered in detail fordifferent polymer types below.
The most significant scope for recycling schemes existswhere there are relatively high volumes of single types ofmaterial that are readily identified and easily stored. Forthis reason, much of the current recycling of commercialand industrial packaging waste is related to films fromlarge distribution and retail centres, where the quantityand quality of arisings justify the development ofappropriate handling systems such as on-site baling.
There are significant opportunities to increase plasticspackaging recycling within the small and mediumenterprises (SME) sector. The implementation of industrialequivalents to domestic ‘kerbside’ or ‘bring centre’collection systems, servicing particularly industrial andcommercial estates, are likely to raise the quantities ofplastics waste diverted from these wastestreams.
13
Polyethylene films Polyethylene films represent the single most commontype of recyclable plastic packaging from the commercialand industrial sector. Film recycling had been well-established for many years prior to regulatory interventionand has grown progressively. The majority of suppliers ofwaste plastics film are major retailers and distributors,who often have on-site baling and storage facilities.Some businesses also use reverse logistics to deliver filmback to central facilities. Tesco, for example, operates arange of Recycling Service Units where film, trays andother packaging is returned for reuse or recycling.
The main types of films being recycled are listed in themarket analysis in Figure 4 above. The value of thematerial is determined by the type of film and its quality.For example, pallet hoods without labels are morevaluable than mixed shrink and stretch film with labelsor printing.
Crates and traysThere are a number of UK businesses reprocessingreturnable tray and crate systems in PP and PE.Table 5 shows the minimum quantities beingrecycled based on estimates from recyclers.It would be reasonable to expect that growth inthis tonnage will correlate closely with the growth inreturnable systems use within distribution networksnoted earlier.
22 plastics in the UK economy
Table 5 – returnablepackaging systems
returnable system recycled (tonnes/annum)
PP crates 3,000
tote boxes 5,000-10,000
retail distribution trays 5,000
bread baskets 2,000
total 15,000-20,000
Source - RECOUP personal communication with plasticsprocessors (2002)
Polypropylene (PP) buckets and pailsPP containers are used in a wide variety of packagingapplications and sectors, ranging from catering-sizedcontainers of condiments to paint buckets. Markets for PPrecycled from these packaging applications already exist.Unsurprisingly, there are considerable complications torecycling PP containers used to package paints. Althoughtechnically feasible, reprocessors would require additionaltreatment facilities for water contaminated with paint.
Opportunities for recycling of PP pails from the food anddry products industries are more readily identifiable,provided that logistical challenges, such as the collectionof sufficient quantities, can be overcome.
14The use of
compatible plastic handles on PP pails, rather than metalhandles, would significantly increase the potential forrecycling.
Expanded polystyrene (EPS) packagingOver 15% of EPS from non-domestic packaging wastewas recycled in the UK during 2001 (Barnetson, 2002a).The EPS Recycling Group has established a verysuccessful system of take-back schemes with a numberof electrical retailers and has extended this to the foodpackaging sector.
Retailers and suppliers such as Thorn Rentals, Granada,Epson and Dixons Group operate EPS recyclingprogrammes. These usually involve the supplier takingback the EPS packaging from the customer, compacting
the material at central depots and selling it on to arecycler. The recovery of EPS in this way carries greatfinancial incentives for suppliers. Collectively Panasonic,Sanyo, Sony and Honda saved more than £500,000 peryear in landfill and transport costs through recovery andrecycling of the used EPS (EPS Group 1997).
The recycled EPS is manufactured into a range ofproducts including replacement 'hardwood' lumber,simulated slate tiles, plant pots, videos, tape cassettesand loose fill packaging. There is a strong demand forEPS from UK recyclers (Barnetson 2002b) and there areopportunities to increase supply by encouraging foodretailers to return EPS packaging such as fish boxes.
Polystyrene (PS) vending cupsVending cups account for some 13,000 tonnes of plasticsuse and are classed as packaging. There is a nationalscheme for recycling vending cups - the Save a Cupprogramme. Currently this enables the recycling of 212million vending cups each year - 850 tonnes of rigid PS.This is recycled into products including desk tidies, papertrays, pencils, rulers and other similar office products.
Currently, the existing collection infrastructure and theeconomics of a single-stream operation limit the capacityof the scheme. Opportunities exist, however, to link theprogramme with multi-material recycling schemes.
Thermoformed traysThere has been some recycling of on-shelf trays, forexample polyvinyl chloride (PVC) trays fromsupermarkets, but it has not been possible to identify themarket supply or the tonnage recycled. The material isgenerally clean and readily recyclable. However, therange of polymers (e.g. PVC, PS and PP) used to makevisually similar trays presents a challenge in terms of theidentification of materials.
Plastic bottlesPlastic bottles found in commercial and industrial wastestem from either converting- and filling-lines waste orcustomer returns. Large filling and convertingcompanies in both the soft drinks and dairy industry
11 We have assumed that process losses from input baled plastics through to conversion to flake/pellet production are 10-15% for materialfrom these sources. This explains the difference between the recyclate use figure (output) and the PRN tonnes issued (input) figure. Theguidance of the Environment Agency allows up to 25% yield loss in these processes. 12 We have been unable to verify the breakdown of this figure. Based on process loss level assumptions of 10-15% and assuming the paretoprinciple applies, this appears plausible.13 Often businesses are unsure which types of plastic waste, whether and how plastics waste can be recycled. RECOUP is developing aguidance system to help waste management professionals identify the plastics types, using a series of simple inspections and tests. Thissystem will then identify potential recyclers and provide guidelines on maximising material value. 14 RECOUP is currently carrying out a project to establish case studies in this area.
www.plasticsintheuk.org.uk 23
have on-site baling facilities and sell polyethyleneterephthalate (PET) and high-density polyethylene(HDPE) bottles to recyclers. RECOUP research suggestsfilling-line plastic bottle recycling is a little over 3000tonnes per annum.
Flower pots and seed traysLBS Repak is an initiative that offers to recycle potsand trays from garden centres and horticulturalbusinesses into new pots and trays. Estimates suggestthat the quantity recycled does not exceed 500 tonnesper annum.
Review of EIAsThe findings of EIAs are consistent with those describedin the household plastic packaging section above.
including plastic bottles in multi-material kerbsidecollection systemsPriority should be given to demonstrating how local authoritiescan include plastic bottle collection in recycling schemes atlittle or no extra cost and to disseminating this information.Both the packaging industry and central Government shouldfocus on achieving this particular objective to reduce the UK'sdependence on landfill and increase recycling-basedeconomic development. The most appropriate approachesshould involve a major expansion of information provision forbenchmarking and planning purposes combined withtechnical support through outreach work targeting localgovernment and waste management contractors.
improving existing kerbside collection programmesNew development work should focus on demonstrating howto maximise collection performance within integratedkerbside collection systems. This includes the developmentof high-quality motivational tools and guidance to localoperators. There is evidence of the value of training recyclingcollection crews as ambassadors for the collectionprogramme, and this should be encouraged and structuredprogrammes developed.
developing incentives for innovation in mixed plasticsrecycling technology and marketsMore emphasis should be placed on developing mixedplastics recycling processes. A number of developmentshave increased the potential in this area: the progress madein process technology for post-consumer plastics over thelast 10 years; the increasing tax incentive to avoid disposalby landfill; and the additional economic incentives thatincreased recycling targets imply. As collection schemesdevelop, it will become progressively easier to extend therange of plastics collected if economically andenvironmentally viable recycling routes exist.
stimulating improved competitiveness of the UK-basedreprocessing industry The UK’s growing reliance on export markets for recycling isa concern that should be addressed by central Government.The extremely competitive nature of the UK’s compliancesystem has reduced profit margins and is a major barrier toinvestment in indigenous reprocessing capacity. A number ofEU studies
15considering ways to improve competitiveness
recommend the following steps:• standardisation to improve the market position of
Recommendations and priorities for action
15 The European Commission COM(1998) 463 final Brussels22.7.1998, The Competitiveness of the Recycling industries(available from European Commission website athttp://europa.eu.int/comm/dg03/directs/dg3c/recycling/recycling.htm)and The recycling industry in the EU: Impediments and prospects(A Report of the Environment Committee of the European Parliament),December 1996 (available at http://europa.eu.int/comm/dg03/directs/dg3c/recycling/recycling.htm)
The award-winning Remarkable Pencil made using plastic recycled fromESP vending cups
Cou
rtes
y of
Rem
arka
ble
24 plastics in the UK economy

secondary raw materials• enhancement of market transparency through the creation
of exchanges for recyclables and the use of eco-labellingschemes
• promotion of innovation through use of the Fifth EuropeanFramework Programme for Research and Development andby complementary policies on quality and training
• simple, and where necessary, harmonised regulation
The Department for the Environment, Food and Rural Affairs(DEFRA) and the Department of Trade and Industry (DTI) andother key stakeholders need to develop a sharedunderstanding of the competitive drivers in the UKreprocessing sector and potential threats to UK compliancewith the Producer Responsibility Obligations (PackagingWaste) Regulations 1997. From this, priorities for action inthe UK may become clearer.
improving the regulatory framework Representatives of the plastics recycling supply chain shouldwork with government and the relevant environmentalagencies to improve the policy framework for packagingrecycling. In particular, the monitoring protocols for accreditingand auditing plastics reprocessors need to be strengthened toensure continued confidence in the PRN system. In addition,the PRN system has been criticised for failing to create anattractive environment for long-term planning and investment,as PRN prices are driven by a short-term supply and demandbalance, which is unevenly phased. It is recommended thatreporting of compliance is required quarterly rather thanannually. This would reduce speculation and volatility in PRNpricing throughout each year and facilitate longer-terminvestment planning.
stimulating infrastructure investment The technologies to efficiently collect, handle andreprocess growing quantities of plastics, especially frompackaging sources, are available. One of the barriers tohigher levels of recycling is the lack of investment in thisnew technology, especially in post-consumer kerbsidecollections and associated downstream activities.government has a role to play in stimulating infrastructurechange by offering funds to accelerate this activity and atthe same time increasing the comparative cost of wastedisposal by significantly increasing landfill tax. improving data on commercial and industrial inputsand waste arisings
Although some work has been undertaken, there is limiteddata on waste arisings at a local/regional level in thecommercial and industrial sectors. A detailed mappingexercise should be undertaken to identify arisings of plasticpackaging waste in the commercial and industrial sectors.
developing practical guidance for waste producers andmanagers on maximising value from plastics wasteThe results of the mapping work referred to above shouldbe disseminated widely both to recycling businesses andto waste management contractors to stimulate theefficient development of new infrastructure and services,especially in the commercial and industrial sectors.
Practical guidance for waste producers, waste contractorsand facilities managers on maximising value from plasticswaste should be provided. This could be in the form ofpublications and educational materials. On-line, video andon-site training and technical support would enable theimplementation of best practice.
implementing demonstration projects Projects demonstrating best practice and functioning ascase studies should be developed in the following areas: • collection of EPS fish trays from retailers• implementation of trials of post-consumer EPS collection
from domestic sources• implementation of least - cost plastic packaging waste
management systems for fillers of plastic containers• multi-material office/facilities collections including vending
cups, plastic bottles and recyclables• business park and SME recycling systems for films,
containers and other recyclables
continuing stimulation of value added markets forpost-user plastics packaging There needs to be continued encouragement of supplychains to specify products containing recycled materials.This will be best achieved by a combination of thedissemination of the outcomes of successful case studiesand targeted market development work.
for the packaging sector
www.plasticsintheuk.org.uk 25
By volume, cars today contain a larger proportion ofplastics than any other materials. The specific propertiesof plastics, which include strength yet light weight,versatility and flexibility, have led to plastics being usedto a much greater extent in vehicle manufacture. Due totheir light weight, plastics account for an average of only9.3% (105kg) of the total weight of a vehicle (APME1999). By comparison, 20 years ago, there was anaverage of 70kg of plastics used per car. Different typesof polymers are used in over 1000 parts of variousshapes and sizes, ranging from dashboards and fueltanks to radiator grilles (APME 1999). The substitution ofmetals with plastics in vehicles can also lead tosignificant fuel savings. According to the British PlasticsFederation (BPF), 105kg of plastics, used as areplacement for metals, in a car weighing 1,000kg couldmake possible a fuel saving of up to 7.5%.
Analysis of plastics waste arisingsThe average age of an end-of-life vehicle (ELV) enteringthe UK waste stream is 14 years (APME 1999). Over theperiod between 1986 and 2000, registrations increasedfrom approximately 1.9 to 2.2 million per year. Assumingan average life-span of 14 years, approximately 1.9million vehicles have been scrapped during 2000.
16
In 2000, the average weight of vehicles scrapped wasapproximately 800 kg (Smith 2002), with plasticsaccounting for approximately 10% of the overall weight.
17
Safety improvements have contributed to the weight ofvehicles and it is estimated that the average weight ofnew vehicles today is 1100kg. Based on these figures,the weight of plastics waste from ELV is estimated as150,000 tonnes in 2000 and 244,000 tonnes in 2014.
18
Legislation and voluntary agreementsEnd-of-life Vehicles Directive (2000/53/EC)The End-of-life Vehicles (ELV) Directive (2000/53/EC)came into force in October 2000. The Directive aims toreduce the amount of waste from ELV and sets thefollowing targets for recycling and recovery:
Table 6 – recycling and recoverytargets for ELV
year recovery recycling(% of vehicle weight)
2006 85% 80%
2015 95% 85%
It should be noted that these targets do not specifywhich materials are to be recovered and recycled, butmay include metal, plastics, rubber and glass.
In addition, the directive
• requires EU member states to ensure that ELV can onlybe scrapped ('treated') by authorised dismantlers orshredders, who must meet tightened environmentaltreatment standards
• requires economic operators (this term includesproducers, dismantlers and shredders among others)to establish adequate systems for the collection of ELV
• states that last-owners must be able to return theirvehicles into these systems free of charge fromJanuary 2007
• requires producers (vehicle manufacturers or importers)to pay ‘all or a significant part’ of the costs of takebackand treatment from January 2007 at the latest
• sets rising re-use, recycling and recovery targets foreconomic operators
• restricts the use of heavy metals in new vehicles fromJuly 2003
Although member states were required to transpose thedirective into national law by 21st April 2002, none haveyet done so. This is due to the complexity of thedirective. The UK government is currently in discussionwith industry on the most appropriate implementationoptions and a consultation paper and draft regulationswere published recently.
16 Unfortunately, this number cannot be officially validated as not all companies involved in the process complete the official paperwork (Smith 2002).17 Weight varies significantly according to model. 18 The estimation provided from the SMMT/CARE group in 1999 was 112,500 tonnes, which is expected to increase to 195,000 tonnes by2012 (Robson 2002). The estimation calculated from the data supplied by ACORD (ACORD 2001) for 2000 is 192,000 tonnes.
26 plastics in the UK economy
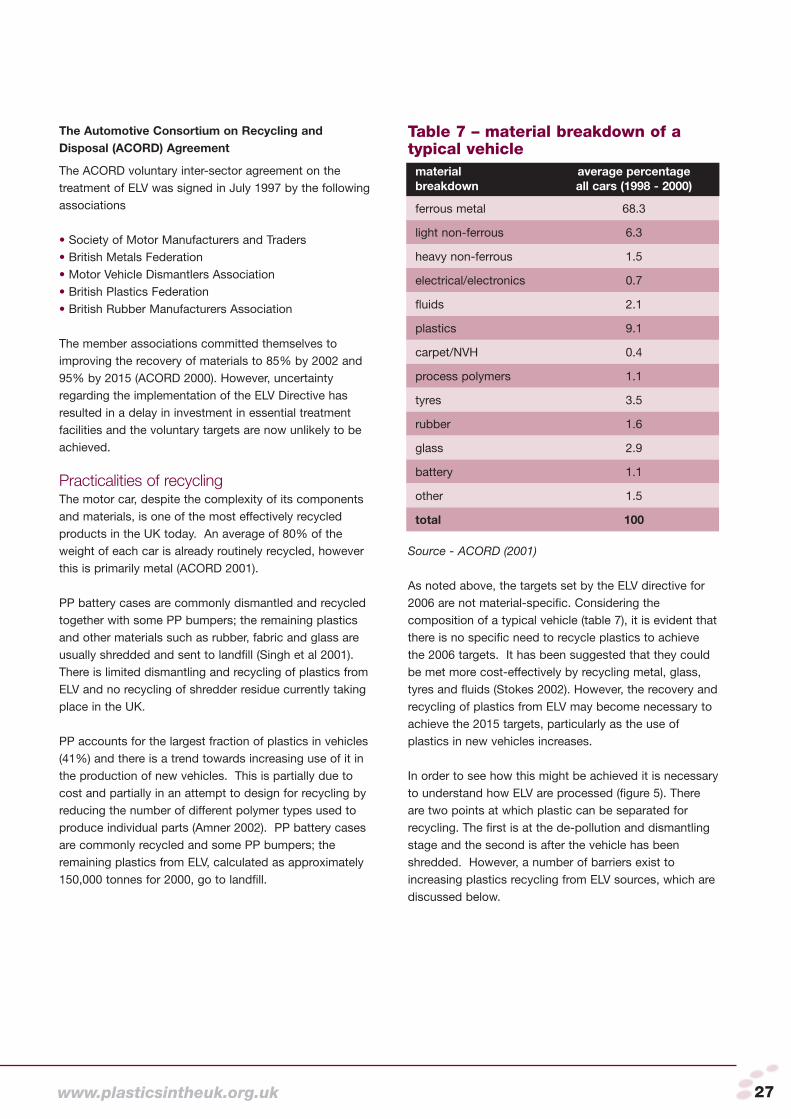
The Automotive Consortium on Recycling andDisposal (ACORD) Agreement
The ACORD voluntary inter-sector agreement on thetreatment of ELV was signed in July 1997 by the followingassociations
• Society of Motor Manufacturers and Traders • British Metals Federation • Motor Vehicle Dismantlers Association• British Plastics Federation • British Rubber Manufacturers Association
The member associations committed themselves toimproving the recovery of materials to 85% by 2002 and95% by 2015 (ACORD 2000). However, uncertaintyregarding the implementation of the ELV Directive hasresulted in a delay in investment in essential treatmentfacilities and the voluntary targets are now unlikely to beachieved.
Practicalities of recyclingThe motor car, despite the complexity of its componentsand materials, is one of the most effectively recycledproducts in the UK today. An average of 80% of theweight of each car is already routinely recycled, howeverthis is primarily metal (ACORD 2001).
PP battery cases are commonly dismantled and recycledtogether with some PP bumpers; the remaining plasticsand other materials such as rubber, fabric and glass areusually shredded and sent to landfill (Singh et al 2001).There is limited dismantling and recycling of plastics fromELV and no recycling of shredder residue currently takingplace in the UK.
PP accounts for the largest fraction of plastics in vehicles(41%) and there is a trend towards increasing use of it inthe production of new vehicles. This is partially due tocost and partially in an attempt to design for recycling byreducing the number of different polymer types used toproduce individual parts (Amner 2002). PP battery casesare commonly recycled and some PP bumpers; theremaining plastics from ELV, calculated as approximately150,000 tonnes for 2000, go to landfill.
Table 7 – material breakdown of atypical vehicle
material average percentagebreakdown all cars (1998 - 2000)
ferrous metal 68.3
light non-ferrous 6.3
heavy non-ferrous 1.5
electrical/electronics 0.7
fluids 2.1
plastics 9.1
carpet/NVH 0.4
process polymers 1.1
tyres 3.5
rubber 1.6
glass 2.9
battery 1.1
other 1.5
total 100
Source - ACORD (2001)
As noted above, the targets set by the ELV directive for2006 are not material-specific. Considering thecomposition of a typical vehicle (table 7), it is evident thatthere is no specific need to recycle plastics to achievethe 2006 targets. It has been suggested that they couldbe met more cost-effectively by recycling metal, glass,tyres and fluids (Stokes 2002). However, the recovery andrecycling of plastics from ELV may become necessary toachieve the 2015 targets, particularly as the use ofplastics in new vehicles increases.
In order to see how this might be achieved it is necessaryto understand how ELV are processed (figure 5). Thereare two points at which plastic can be separated forrecycling. The first is at the de-pollution and dismantlingstage and the second is after the vehicle has beenshredded. However, a number of barriers exist toincreasing plastics recycling from ELV sources, which arediscussed below.
www.plasticsintheuk.org.uk 27

Material identification and separationPlastics need to be identified and separated into singlepolymer types if they are to be reprocessed for use inadded-value applications. This is a challenging task dueto the range of polymers used in vehicles, the designcomplexity of some components and the high costsassociated with the dismantling process. In addition, it iscurrently difficult to extract single polymer streams fromshredder residue.
Reliance on visual markings alone can lead to materialcontamination, as not all components are marked andsome components may be marked incorrectly (Amner2002). There has been considerable development oftechnologies to identify and separate plastics, both at thedismantling stage and post shredding. These aredescribed in detail in appendix C.
Contamination can prevent recovered plastics from beingused in high-grade, high-value applications. Commoncontaminants include other polymer types, other materialssuch as oil, metal, glass and cardboard, dust, moisture, etc. The cost-effectiveness of dismantling of ELV is closely
linked to the time this activity requires. Studies havefound that manual dismantling of major componentsenables 60 to 80kg of recyclable plastics material to beseparated in the first hour. However, cost-effectivenessdecreases the more parts are being separated.
19This
forms a strong disincentive for the complete dismantlingof ELV and demonstrates the importance of designing tofacilitate dismantling.
Limited end marketsEstablished end markets exist for certain plasticcomponents from dismantled vehicles, for example PPfrom battery cases, some bumpers, PVC cable coverings,nylon from airbags. However, there are no commercial,high volume ‘macro solutions’ to plastics recovered fromthe automotive sector. There is a perception by sectionsof the user industry that recovered plastic is unsuitable fornew products where quality and performance is important(Enviros 2002), whereas in reality many high-qualityproducts can be manufactured from recycled materials.This perception has effectively acted as a barrier to theestablishment of end markets for recovered plastics. An associated barrier is that a reliable, high volume
19 For example, a study by Schäper (2001) estimated that is takes approximately 45 minutes to dismantle 50 parts weighing a total of62kg from an Audi TT Coupé. It takes a further 25 minutes to dismantle another 35 parts and only adds an extra 8kg to the total weight.Dismantling a 150 parts takes 140 minutes and brings the total weight of parts dismantled to 78kgs.
Figure 5 – current methods of processing end-of-life vehicles
28 plastics in the UK economy

source of material of a specified quality is generallyrequired before companies are prepared to invest inrecyclate for use in any significant range of applications.It may be difficult to achieve this given the currentinfrastructure for the processing of ELV.
It is important for recycled materials to be marketed onthe same basis as virgin materials, namely according tocost and fitness for purpose. Manufacturers will havemaximum incentive to use recyclates when they are themost economically advantageous option. Suppliers ofrecycled materials will need to compete on quality andservice, providing material quality and supply volumeassurance and technical support.
A growing number of car manufacturers, such as Ford,Audi and Vauxhall, are using recycled materials wherethese meet the required specifications and their cost iscomparable with virgin polymer. Ford, for example, haveused 30,000 tonnes of recycled plastic globally in 280different components across their vehicle range (Amner2002). Audi have used recycled PET bottles incomponents of the Audi A4 (Scheirs 1998), and Vauxhallhave used post-consumer PP in components for theAstra (Nixon 2002). Other major suppliers have examplesof similar developments. It is rare for parts to bemanufactured using 100% recycled plastic, it is morecommon to use 25 to 50% recycled plastic blended withvirgin. Recycled PET materials, for example, can be usedin webbing and carpets in automotive vehicles.
The potential for use of recycled plastics from othersectors in the production of new vehicle parts will beenhanced by the development of common qualitystandards, as these will help open up cross-sectoralmarkets for recyclate. The Plastic ReprocessingValidation Exercise (PRoVE) has pioneered thedevelopment of generic material specifications forrecycled plastics for automotive use, notably talc-filledPP (Amner 2002).
There is also the potential for a certain amount of ‘closed-loop’ recycling within the automotive sector (Amner 2002),whereby recyclate from automotive plastics waste is usedto manufacture new vehicle components. However, amajority of vehicles are now manufactured abroad andwould have to be exported for recycling.
Uncertainty over responsibility and financingUncertainty surrounding implementation of the ELVDirective has created a barrier to investment in andconstruction of recycling facilities and associatedinfrastructure.
The general consensus of experts consulted indicatesthat the most efficient overall strategy would be to
• dismantle large plastic parts and possibly polyurethane(PUR) seat foam for re-use or mechanical recycling
• separate specific polymer types from shredder residuefor mechanical recycling and either landfill theremaining material or use it for energy recovery
Design for sustainability is likely to play an important rolein the future through
• the use of simple rather than complex parts in terms ofthe materials used
• reducing the number of polymer types used in vehiclemanufacture
• the introduction of measures to facilitate theidentification and re-use of components and materials
• the introduction of measures to promote the use ofrecycled plastics in new products
When designing for sustainability the entire life-cycle ofthe vehicle needs to be taken into account, not just theend-of-life disposal/recovery. Studies have concludedthat the end-of-life phase of the car consumes only about1% of the total energy requirements of the life cycle(Coleman 2002). Whilst a decrease in the use of plasticsin vehicles may increase overall recycling rates, this isoff-set by the fuel savings achieved through the light-weight properties of plastics during the vehicles’ life.
Review of EIAs The following EIA/Life Cycle Assessment (LCA) reports,studying end-of-life vehicles, are currently available:
www.plasticsintheuk.org.uk 29

study key findings
Coleman T (2002), Life cycle assessment – disposal ofend-of-life vehicles, Environment Agency
To provide a life-cycle assessment for end-of-lifevehicles assessing best practice, environmentaloptions for disposal and examining strategies to meettargets for recovery. The main findings of the studywere that the stricter recycling and recovery targets inthe draft EC ELV Directive 2000/53/EC and theACORD plan have the potential to reduceenvironmental impacts associated with ELVprocessing and disposal in comparison with 1997practices. The greatest benefit arising from adoptionof the draft EC ELV directive or ACORD plan comesfrom avoidance of depletion of non-renewableresources.
Jenseit W, Stahl H, Woolny V, Wittlinger R (inpreparation) Eco-efficiency assessment of recoveryoptions for plastic parts from end-of-life vehicles,Association of Plastics Manufacturers in Europe(APME)
The report considered six different components of atypical car and assessed the recovery options for theplastic element of each. The existing driving force forthe recovery of ELV is the recovery of metals. Plasticsresulting from the shredding process are currently sentto landfill. Factors considered when assessingrecovery options for plastic included the availability ofend markets, the quality of plastics recovered and theeconomics of recovery. For example, mixed plasticsare only suitable for use in the production of lowquality products, whereas homogenous plastics aresuitable for use in the production of high qualityproducts. Additives also affect the potential to userecovered plastic. Dismantling time has a significanteffect on recovery, as it is important to gain thegreatest environmental benefit for the lowest cost.Recovery options considered in the report includeddismantling with mechanical recycling, feedstockrecycling and shredding with energy recovery. It wasconcluded that only limited recovery could beachieved efficiently through dismantling andmechanical recycling and that other recovery methodswould need to be used in conjunction with this. Thereport was due for publication by the end of 2002.
Sullivan J L (1998) Life Cycle Inventory of a GenericU.S. Family Sedan-Overview of Results U.S.Automotive Materials Partnership
The Life Cycle Inventory is designed to serve as abenchmark of comparison for environmentalperformance estimates of new and future vehicles.
Klöpffer W, Le Borgne, R., Feillard, P. (2001),‘End-of-Life of a Polypropylene Bumper Skin’,The International Journal of Life Cycle AssessmentVol. 6 (3), pp. 167-176.
To apply Life Cycle Assessment methodology tocompare various end-of-life scenarios (recycling versusincineration with or without energy recovery) with landfillas a reference for a polypropylene bumper skinThe findings of the study indicate that incinerationwith energy recovery and 90% recycling are the mostfavourable scenarios.
30 plastics in the UK economy

Recommendations and priorities for actionThe ELV Directive was expected to be transposed into UK law by April 2001. However, this has been delayed andgovernment is currently in discussion with industry to determine the most appropriate implementation options. There hasbeen reluctance on the part of producers and reprocessors to invest in collection and sorting infrastructure, andidentification and separation technologies whilst these deliberations are on-going. However, the followingrecommendations provide a focus for the future development work within this sector.
mapping likely profile of arisings of automotive plastics waste in the UKA more detailed understanding of the profile of plastics waste arisings, including location and quantity, will supportinfrastructure planning decisions and inform both technology and market development work. It is recommended that asurvey of current and potential sources of plastics from vehicles be undertaken to determine the quantities andgeographical spread of material available for sorting and reprocessing from dismantling and shredding operations. It maybe worthwhile to include plastics waste from electrical and electronic applications in the same survey, as largehousehold equipment is often shredded at the same facilities as ELV.
developing viable shredder residue recovery processesDevelopment work should focus on maximising the value of plastics in shredder residue. A large-scale programme thatlinks with, supports and builds on international work in shredder residue plastics recycling should also be developed.This should involve evaluating existing technology capable of separating specific polymers from shredder residue andtrialing samples of shredder residue from commercial operators to identify suitable technology for the UK and theconditions for viable implementation.
developing best practice guidance for dismantling plastic componentsBest practice guidance on the management of plastic components should be developed for dismantlers. This shouldinclude costed case studies of plastics recycling through dismantling activities. It should be noted that given the currenthigh costs of dismantling, projects relating to dismantling activities alone are unlikely to generate commercially viablesolutions in the absence of ongoing subsidies or economic instruments such as significant increases in disposal costs.
improving information exchangeProducers, dismantlers, shredder operators and reprocessors should be consulted and kept updated on developmentsand should be encouraged to work in partnership to introduce a suitable infrastructure for the collection and sorting ofplastics from ELV.
researching and developing end-markets for recycled plastics from ELVIt is vital to establish end-markets for plastics recovered from ELV, based primarily on the best supplies of plastics fromshredder residue. There is considerable potential to consider supplies of PP and other plastics where end-productsrequire low-value feedstock and input quality standards are tolerant of some contamination. There are developments inproducts/processes for the construction sector that may fit this profile and should be assessed further.
www.plasticsintheuk.org.uk 31

In the broadest sense, electrical and electronicequipment refers to any product that relies on batteriesand/or electricity for operation, as well as equipment thattransports electricity to the product, such as wire andcable. There is a wide range of products defined aselectrical and electronics equipment, such as mobilephones, household appliances, electric tools and ITequipment.
Plastics are used in electrical and electronic appliancesbecause they are durable, lightweight, cost-effective,corrosion-resistant and have excellent insulationproperties (APC 2000). In 1980, on average, plasticsmade up 15% by weight of all electrical and electronicequipment. By 2000, this had risen to over 20%(APME 2001).
Analysis of plastics waste arisingsThe Industry Council for Electronic Equipment Recycling(ICER) produced a UK Status Report on Waste fromElectrical and Electronic Equipment (ICER 2000).This report states that some 915,000 tonnes of post-consumer equipment was discarded during 1998, ofwhich 22% was found to be plastics. Table 8 belowprovides a breakdown of the waste arising and thetonnage entering recycling processes. ICER, supportedby Biffaward, has recently begun major new researchestablishing up-to-date facts and figures (ICER 2002).
The ICER study reported the following materialcomposition of the above categories of equipment, whichmade up over 95% by weight of waste electrical andelectronic equipment in 1998
• ferrous metals (47%)• plastics (22%)• glass (6%)• non-ferrous metals (4%)
The remaining 21% was made up of other materials,including cardboard, concrete, wood and alloys, as wellas complex sub-assemblies, such as circuit boards andmotors. This category also included hazardoussubstances.
Of these materials, metal is currently the only materialrecovered in large quantities from waste electrical andelectronic equipment. Although plastics make up at least20% of the waste stream, the majority of plastics wastearisings are sent to landfill (ICER 2000).
It is estimated that the electrical and electronics industryconsumed, in total, 355,000 tonnes of plastic materialduring 2000. This is based on an analysis undertakenby the BPF of UK consumption and adjusted forimport/export movements (Smith 2002). An estimated200,000 tonnes of plastics entered the wastestream
category waste arising waste recycled
tonnes % tonnes % %of total of total of totalwaste waste wastearising recycled arising
large household appliances 392,000 43 345,000 77 38
IT equipment 357,000 39 95,000 21 10
radio, TV, audio equipment 72,000 8 3,000 <1 <1
small household appliances 30,000 3 250 <1 <1
electrical and electronic tools 28,000 3 500 <1 <1
gas discharge lamps 12,000 1 100 <1 <1
toys 8,000 <1 0 0 0
monitoring and control equipment 8,000 <1 0 0 0
telecommunication equipment 8,000 <1 4,000 <1 <1
total 915,000 100 447,850 100 49
Source - ICER (2000)
Table 8 – electrical and electronic waste arisings and breakdown of quantitiesrecycled, 2000
32 plastics in the UK economy

during 1998. With a year-on-year market sector growth ofbetween 3 to 5%, post-consumer plastics are estimatedto be approximately 220,000 tonnes in 2000 (Smith 2002)and are expected to continue to rise.
The wide range of equipment and polymer types (figure6) used in electrical and electronic equipment makesrecovering plastics from this equipment a potentiallychallenging task.
Of these styrenes (ABS, ASA, SAN, PS, HIPS) and PPare the most common, accounting for approximately70% of plastics used in electrical and electronicequipment in Western Europe in 2000 (APME 2001).By weight, 90% of waste electrical and electronicequipment is made up of large household appliances,IT equipment and brown goods. These types ofequipment and polymers therefore hold the greatestpotential for recovery and recycling (table 9).
Table 9 – equipment and polymer types targeted for recycling
application main polymer types notestargeted for recycling
fridges / freezers styrenes • taken to Environment Agency licensed plants for the removal of Ozone Depleting Substances• large plastic parts such as shelving removed prior to shredding • remainder of plastic shredded
other large polyolefins (PO) • refurbished for reuse or taken to a dismantler/ household shredder operatorappliances
IT equipment and styrenes • commonly shredded together with end-of-life vehicles, brown goods producing a PP rich shredder residue
• refurbished for reuse or taken to a dismantler/shredder operator
Source - Data supplied by RECOUP (2002)
Figure 6 – polymer types used in electrical and electronic equipment
Source - APME (2001)
www.plasticsintheuk.org.uk 33
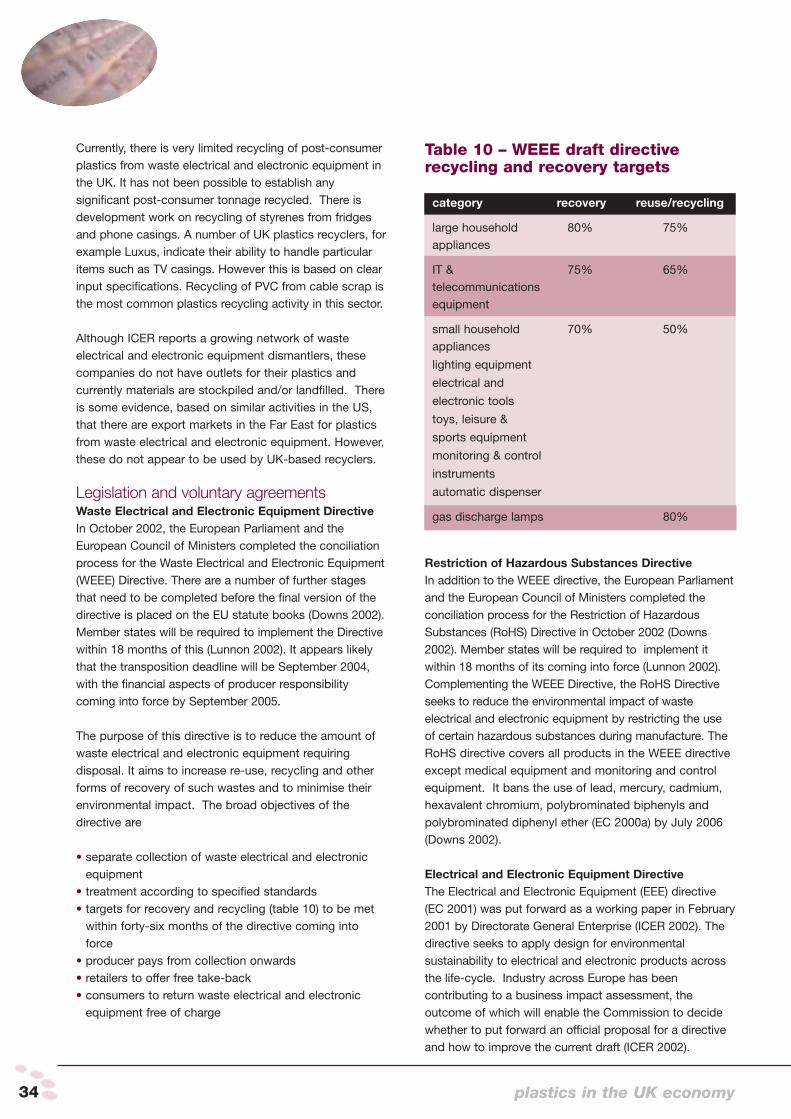
Currently, there is very limited recycling of post-consumerplastics from waste electrical and electronic equipment inthe UK. It has not been possible to establish anysignificant post-consumer tonnage recycled. There isdevelopment work on recycling of styrenes from fridgesand phone casings. A number of UK plastics recyclers, forexample Luxus, indicate their ability to handle particularitems such as TV casings. However this is based on clearinput specifications. Recycling of PVC from cable scrap isthe most common plastics recycling activity in this sector.
Although ICER reports a growing network of wasteelectrical and electronic equipment dismantlers, thesecompanies do not have outlets for their plastics andcurrently materials are stockpiled and/or landfilled. Thereis some evidence, based on similar activities in the US,that there are export markets in the Far East for plasticsfrom waste electrical and electronic equipment. However,these do not appear to be used by UK-based recyclers.
Legislation and voluntary agreementsWaste Electrical and Electronic Equipment DirectiveIn October 2002, the European Parliament and theEuropean Council of Ministers completed the conciliationprocess for the Waste Electrical and Electronic Equipment(WEEE) Directive. There are a number of further stagesthat need to be completed before the final version of thedirective is placed on the EU statute books (Downs 2002).Member states will be required to implement the Directivewithin 18 months of this (Lunnon 2002). It appears likelythat the transposition deadline will be September 2004,with the financial aspects of producer responsibilitycoming into force by September 2005.
The purpose of this directive is to reduce the amount ofwaste electrical and electronic equipment requiringdisposal. It aims to increase re-use, recycling and otherforms of recovery of such wastes and to minimise theirenvironmental impact. The broad objectives of thedirective are
• separate collection of waste electrical and electronicequipment
• treatment according to specified standards• targets for recovery and recycling (table 10) to be met
within forty-six months of the directive coming intoforce
• producer pays from collection onwards• retailers to offer free take-back• consumers to return waste electrical and electronic
equipment free of charge
Table 10 – WEEE draft directiverecycling and recovery targets
category recovery reuse/recycling
large household 80% 75%appliances
IT & 75% 65%telecommunicationsequipment
small household 70% 50%appliances
lighting equipment
electrical and
electronic tools
toys, leisure &
sports equipment
monitoring & control
instruments
automatic dispenser
gas discharge lamps 80%
Restriction of Hazardous Substances DirectiveIn addition to the WEEE directive, the European Parliamentand the European Council of Ministers completed theconciliation process for the Restriction of HazardousSubstances (RoHS) Directive in October 2002 (Downs2002). Member states will be required to implement itwithin 18 months of its coming into force (Lunnon 2002).Complementing the WEEE Directive, the RoHS Directiveseeks to reduce the environmental impact of wasteelectrical and electronic equipment by restricting the useof certain hazardous substances during manufacture. TheRoHS directive covers all products in the WEEE directiveexcept medical equipment and monitoring and controlequipment. It bans the use of lead, mercury, cadmium,hexavalent chromium, polybrominated biphenyls andpolybrominated diphenyl ether (EC 2000a) by July 2006(Downs 2002).
Electrical and Electronic Equipment Directive The Electrical and Electronic Equipment (EEE) directive(EC 2001) was put forward as a working paper in February2001 by Directorate General Enterprise (ICER 2002). Thedirective seeks to apply design for environmentalsustainability to electrical and electronic products acrossthe life-cycle. Industry across Europe has beencontributing to a business impact assessment, theoutcome of which will enable the Commission to decidewhether to put forward an official proposal for a directiveand how to improve the current draft (ICER 2002).
34 plastics in the UK economy

Environmental Protection (Controls onOzone-Depleting Substances) Regulations 2002(SI 2002 No. 528)The regulations provide controls for the use of ozone-depleting substances in the following areas
• production and use • trade• emission
The regulations requires end-of-life equipment containingozone depleting substances, such as fridges andfreezers, to be treated at Environment Agency licensedplants for the safe removal and disposal of the ozonedepleting substances.
Practicalities of recyclingIn order to meet the targets set by the WEEE Directive ithas been suggested that in excess of 50% of theplastics content of waste electrical and electronicequipment will need to be mechanically recycled(Burstall 2002).
22Potentially, this means recycling over
100,000 tonnes of plastics.
The reuse of electrical and electronic equipment shouldreceive high priority, as a large quantity is suitable forrefurbishment and redistribution. A recent report by DARPEnvironmental Ltd (2002a), investigates the re-marketingof white goods.
23A guide to the re-use of computers,
which includes a directory of refurbishers, is availablefrom the DTI (DTI 2000). With regards to recycling, thereare two points at which plastics can be separated. Thefirst is during the dismantling process and the second isafter equipment has been shredded (figure 7).
A number of barriers have been identified, which need tobe overcome to increase the recycling of plastics fromwaste electrical and electronic equipment.
Material identification and separationPlastics need to be identified and separated into singlepolymer types if they are to be reprocessed for use inhigh added-value applications. This is a challenging taskdue to the many different types of plastic used in wasteelectrical and electronic applications, the complexity ofsome equipment and the high costs associated with thedismantling process.
22 The calculation is based on taking the average recycling targets in the WEEE directive and assessing the amounts of ferrous, non-ferrousand other materials and their achievable yields. The finding is that to achieve the overall recycling target, at least 50% of all plastic and allglass needs to be recycled (Burstall 2002).23 The report is available for download from the DARP website at www.darpenvironmental.com.
Figure 7 – current methods of processing end-of-life electrical andelectronic equipment
www.plasticsintheuk.org.uk 35

Contamination can prevent recovered plastics from beingused in high added-value applications. Commoncontaminants include other polymer types, othermaterials such as metal, glass, cardboard, dust, moistureand so on. Adequate collection arrangements anddesign for recycling will help reduce contamination.
However, businesses providing technologies andoperational facilities to separate polymers to marketstandards have the potential to address this barrier. Therehas been considerable development of technologies toidentify and separate plastics both at the dismantling stageand post shredding (see Appendix C). A study undertakenby MBA Polymers and the APC found that identifyingplastics on a whole part basis using benchtop orautomated spectroscopic units and manual or automatedsorting is less cost-effective than plastic flake sorting(Arola et al 1999). The greatest opportunity therefore lies inthe automated sorting of shredder residue.
Use of hazardous substancesFlame retardants are used in waste electrical andelectronic applications to meet fire safety regulations(APME 2000). Some brominated flame-retardants formdioxins and furans when subjected to heat during therecycling process. Of particular concern arepolybrominated diphenylethers (PBDEs) andpolybrominated biphenyls (PBBs) (ICER 2000).Flame-retardants also affect flow properties ofrecovered plastics making them more difficult toreprocess (Enviros 2002). The overall proportion offlame-retardant plastics contained in electrical andelectronic equipment, however, does not exceed 12%of overall plastics (APME 2000). The WEEE directivewill require flame-retarded plastics to be separatedduring dismantling (Lunnon 2002). Some technologiesallow brominated flame-retardants to be separatedusing an automated sorting process after shredding(Biddle 2002).
Other substances found in older equipment includecadmium and CFCs, found in plastic foam inside oldfridges. There is a legal requirement (SI 2002 No. 528) toremove ozone-depleting substances prior to disposal andspecialised recovery plants are now in operation in theUK (EA 2002).
As previously stated, the RoHS directive will prohibitthe use of certain hazardous substances by July 2006.While this will eliminate the problem of having to managethese substances in the future, it adds to the currentchallenge of developing end-markets for material fromolder equipment.
Limited end marketsCurrently there are limited commercial markets forplastics recovered from waste electrical and electronicequipment. ICER (2000) claims that ‘one of the keys toimproving the cost/value balance lies in finding marketsfor recycled plastics.’ There is a general perception byspecifiers and manufacturers that recovered plastics areof low-grade and low value (Enviros 2002). Thismisconception has acted as a barrier to theestablishment of end markets for recovered plastics.
It is important for recycled materials to be marketed onthe same basis as virgin materials, namely according tocost and fitness for purpose. Manufacturers will havemaximum incentive to use recyclates when they are themost economically advantageous option. Suppliers ofrecycled materials will need to compete on quality andservice, providing material quality and supply volumeassurance and technical support. Detailed materialperformance certification could be provided to assuremanufacturers of the quality of recyclate.
Mixed plastics can be recycled and used to produce low-value products, such as wood and concrete substitutes;they are not currently suitable for high-value or closedloop applications. There is, however, an opportunity forfurther development and diversification of applicationsproduced using mixed plastics.
Plastics containing substances banned under the RoHSdirective cannot be used to produce components for usein new electrical and electronic equipment to be put on
36 plastics in the UK economy

the market after July 2006. This means that alternativeend-markets will need to be found.
As the WEEE directive will require flame-retardant plasticsto be separated out during dismantling, in theory shredderresidue should not contain these substances. Plasticscontaining these substances could be used in low-valueapplications not associated with electrical and electronicequipment, but more research is needed in this area.
A further barrier to the establishment of end-markets isthat a reliable, high-volume source of material of aspecified quality is generally required before companiesare prepared to invest in it for use in applications. Giventhe wide variety of equipment and polymer types foundin waste electrical and electronic equipment, this mayprove challenging.
There is a growing number of routes for collection ofwaste electrical and electronic equipment, involving bothspecialist refurbishment companies and recyclers. Toachieve the targets set by the WEEE directive, there willneed to be an increase in consumer collections of WEEEincluding plastics. However, the primary drivers for newcollection systems are not targeted specifically atplastics waste.
The plastics recycling sector does not need to replicateexisting supply infrastructure. Existing commercialrecyclers are looking for outlets for the plastics theycurrently generate as a by-product of their operations.This offers dedicated plastics recyclers or specialist
technology providers the potential to readily sourcecommercially viable volumes of recyclable plastics.Recyclers could enhance their income through charging agate fee for plastics from waste electrical and electronicequipment. If this fee is lower than prevailing alternativedisposal costs, this will create an incentive to divertplastics waste from the waste stream.
In addition, virgin engineering thermoplastics commonlyused in electrical equipment are often high-value,specialised polymers. Plastics recovered from wasteelectrical and electronic equipment, therefore, have thepotential to attract relatively high market values ifreprocessed to the required standards (Enviros 2002).This could act as an incentive for the investment inreprocessing facilities and the marketing of recycledplastics.
Unclear responsibility and financingUncertainty surrounding implementation of the WEEEDirective has created a barrier to investment in recyclingfacilities and associated infrastructure.
As in the automotive sector, the general consensus ofexperts indicates that the most efficient overall strategywould be to dismantle large plastic parts for re-use ormechanical recycling, separate specific polymer typesfrom shredder residue for mechanical recycling andeither landfill the remaining material, or use it for energyrecovery.
Design for sustainability is likely to play an important rolein the future, through:
• simplification of the material composition of parts• reducing the number of polymer types used in vehicle
manufacture• minimising the use of hazardous substances• the introduction of measures to facilitate the
identification and re-use of components and materials• the introduction of measures to promote the use of
recycled plastics in new products
Active disassembly using “smart materials” could alsogreatly increase the potential for recycling of wasteelectrical and electronic equipment. Automaticdisassembly is achieved through the incorporation ofsmart material devices into a host application. A numberof consumer electronic products from Sony, Nokia andMotorola are currently being disassembled using thistechnique (Jones et al 2002).
www.plasticsintheuk.org.uk 37
Review of EIAs The following EIA and LCA reports assessing waste electrical and electronic equipment are available:
study key findings
PriceWaterhouseCoopers (2002), Environmental LifeCycle Assessment and Financial Life Cycle Analysis ofthe WEEE directive and its implications for the UK, DTI
The study aimed to provide updated estimates of theexpected environmental and financial costs andbenefits to the UK of the collection, pre-treatment,recycling and recovery of a range of electrical andelectronic products based on the latest version of theWEEE directive for all environmental indicators, theintroduction of the WEEE directive has a positive effectfor most products, due mainly to an increase inrefurbishment and recycling of materials. The analysisshows that the current situation is only cost-effectivefor personal computers and that the introduction of theWEEE directive worsens the situation by increasingcosts. It should be noted, however, that despite anoverall negative figure, profitable activities take placewithin the disposal chain (e.g. shredding, refurbishing,and recycling).
Mayne 2002, (in preparation) Eco-efficiency of routesfor selected WEEE products containing plastics, TNOReport R2001/454, Association of PlasticsManufacturers in Europe (APME)
To provide an assessment of routes for selected WEEEproducts containing plastics.The report considered three typical WEEE products:one large (fridge), one medium (TV) and one small(mobile phone). The existing driving force for therecovery of each product was examined. Althoughfridges are collected in order to remove CFCs, TVs toremove cathode-ray tubes and mobile phones torecover precious metals, plastics are generally sent tolandfill. Recovery options considered in the reportincluded dismantling with mechanical recycling,feedstock recycling and shredding with energyrecovery. It was concluded that only limited recoverycould be achieved efficiently through dismantling andmechanical recycling and that other recovery methodswould need to be used in conjunction with this.
38 plastics in the UK economy

Recommendations and priorities for action
Similar to the situation in the automotive sector, investment activities in plastics recycling are currently discouraged by theuncertainty over the implementation of the forthcoming legislation. The clarification of statutory responsibilities arising fromthe WEEE directive will enable producers and reprocessors to identify the most appropriate investment and infrastructuredevelopment opportunities. The following recommendations identify the priorities for action within this sector.
mapping available supplies of WEEE plasticsThis could be achieved by conducting a survey of current and potential sources of plastics from WEEE to determinethe quantities and geographical spread of material available for sorting and reprocessing by dismantlers and shredderoperators. This information will provide key data required to identify where secondary plastics handling processes maybe viable. As previously mentioned, surveys of automotive and large waste electrical and electronic equipment couldbe combined as these are often shredded in the same facilities.
evaluating dismantling practices of WEEE plasticsIndividual specialist refurbishers and dismantlers of waste electrical and electronic equipment are unlikely to have thethroughput of material required to make it economically feasible to invest in the identification and sorting equipmentrequired to separate plastics efficiently. A potential model is that such businesses supply dismantled plasticscomponents to specialist plastics reclamation plants for identification and reprocessing. The feasibility of such a modelshould be evaluated.
evaluating the infrastructure for shredder residue plastics Many experts in the recycling of waste electrical and electronic equipment agree that as technology develops,separating plastics after shredding will be the preferred option. The separation performance and cost effectiveness ofexisting technologies capable of separating specific polymers from shredder residue should be evaluated. This workshould be undertaken in partnership with one or more of the larger shredder operators, as they are most likely to havea sufficient throughput of plastics material to make the process economically feasible. EMR is already researching theseparation of plastics from shredder residue (Robson 2002) and US-based MBA Polymers are undertaking large trialson materials from the UK (Biddle 2002).
stimulating capital investment in appropriate technologies Grants or other economic instruments can be used to bring forward early commercial investment in appropriate plasticsrecycling technologies from this sector. The extent of requirements for this approach should be considered following theevaluation and mapping work identified earlier.
developing end markets for WEEE-sourced plasticsIt is vital to establish viable end markets for plastics recovered from waste electrical and electronic equipment toachieve statutory targets. This should prioritise dismantled styrenics, PP, sorted shredder residue and markets forplastics containing hazardous substances
designing for recyclingThere needs to be increased engagement of the electrical and electronic equipment supply chain in designing forrecycling and the use of recycled materials. These considerations should be incorporated within a wider 'IntegratedProduct Policy' approach.
Examples of such action could include• development of a low-cost training package on how products can be designed to be more readily recyclable, for
example through material selection, marking and ease of dismantling
• development of generic standards for recycled material acceptable to major customers in the sector
The development of many electrical and electronic products is at an international level. Major changes in practices inthe supply chain will require European or international agreements and be based on cost-led arguments, rather than anappeal to 'green sensibilities'.
finding common solutionsWider supply chain collaboration and communication between producers, refurbishers, dismantlers, shredderoperators and reprocessors is required to stimulate common solutions across the supply chain.
Greater cross-sectoral communication, for example dissemination of case studies of effective supply chain solutions,and a stakeholder dialogue process may be of value in aligning understanding and expectations. The most appropriateway to take this forward initially might be through a project forum where responsibilities, development needs andfinancial parameters can be discussed.
www.plasticsintheuk.org.uk 39

The building and construction sector is the secondlargest plastics user after the packaging sector and is animportant growing market for plastics (APME 1998a).Compared to other materials used in the building andconstruction industry, the percentage of plastics used inthis sector is relatively small (less than 1% by weight).However, they form part of a wide variety of applications.Approximately, 0.8 million tonnes of plastics are used peryear, much of which does not enter the waste stream formany decades.
PVC is by far the most common plastic used in thebuilding and construction sector, accounting forapproximately 60% of all plastics used. Other plasticsused include PU, EPS, HDPE, LDPE and PS (APME1998a). Common uses include pipes and ducts,insulation, floor and wall coverings, windows, profiles,lining and fitted furniture (APME 1998a).
A large proportion of plastics used in the constructionindustry has an intended life of many decades. Over thepast 25 years there has been a trend towards increaseduse of plastics in the building industry and in WesternEurope it is predicted that plastics use will increase toalmost 8 million tonnes by 2010 (APME 1998b). Giventhis increased use of plastics, it is likely that largequantities of plastic waste will arise during futuredemolitions.
During 2000, approximately 800,000 tonnes of plasticswere used within the building and construction sector
(Smith 2002). A wide range of component products andtotal systems were produced from a number of differentpolymers. The majority of bulky items were bothmanufactured and sold within the UK to maintainoperational efficiency. In the case of the smaller items,much of these were manufactured in the UK anddistributed on a European or worldwide basis. Asuperficial examination supports the view that importsand exports are largely in balance (Smith 2002).
Analysis of plastics waste arisings Structural productsWith a share of approximately 60% of plastics used inthe construction sector, PVC is by far the mostcommonly used material and accounted for 500,000tonnes during 2000 (Smith 2002). HDPE is the secondmost commonly used material (13%) and accounts for afurther 105,000 tonnes (Smith 2002). An overallbreakdown of materials used, including the remaining27%, is provided below (table 11).
Table 11 – polymer types used in thebuilding and construction sector
polymer quantity usetype (tonnes)
PVC 500, 000 rainwater systemsnon-pressure drainage systems window profiles doors and door framescladdings/soffits/bargeboardskirtings/architravestelecom/service ducting
HDPE 105,000 waterproof membranespressure system for gas/water supplyconduitsnon-pressure drainage
PUR 45,000 insulation
PP 35,000 small-bore pipes/components
EPS 24,000 wall insulation
ABS 21,000 pipes/sheeting
PC 14,000 sheeting/glazing
PMMA 14,000 shower trays/sanitary ware
PA 13,000 ancillaries
UPR 29,000 sanitary ware/cladding/roof tiles
total 800,000
Source - Smith (2002)
40 plastics in the UK economy

The vast majority of these construction products have anintended life of many decades. For example, over 60%of PVC applications have a lifetime in excess of 40 years(Cousins 2002). It is estimated that 100,000 tonnes ofPVC plus a significant tonnage of HDPE is buried belowground and, in the normal course of events, is unlikely tobe removed for disposal, as the cost of this would faroutweigh any perceived benefit. Table 12 shows thetonnage of plastic that is not recoverable/potentiallyrecoverable from the building and construction sector.A further 25,000 tonnes of PVC is contained withinbuilding structures and unlikely to be removed unless theproperty is demolished (Smith 2002).
Other plastics components include external items, suchas rainwater pipes and cladding, and items such assanitary ware. Currently no statistics for these items exist.Assuming that less than 10% of this total tonnage islikely to be removed, for example in kitchen or bathroomreplacement, no more than around 50,000 tonnes ofmaterial will enter the waste stream per year.
Table 12 - quantity of potentiallyrecoverable plastics in building andconstruction sector
material quantity(tonnes)
material not recoverable24
225,000
material potentially recoverable 575,000
total material used 800,000
Source - Smith (2002)
Non-structural productsA further 250,000 tonnes of plastics materials are usedper year by the construction industry to produce:
• floor, wall and ceiling coverings• blinds and shutters
These products are largely made from PVC and have alimited lifespan.
PackagingPackaging plays an important role in protecting andidentifying products. Most products used on constructionsites are placed on, wrapped in, or held together bypackaging. Plastics make up approximately 25% by
weight of packaging waste on construction sites (figure8), with the remainder being mainly timber, paper andcardboard (Anderson et al 2002).
Packaging waste arisings change during the constructionprocess, with the greatest percentage of plasticspackaging volume being produced when a project isclose to 80% completion (Anderson et al 2002). PE sheetwrapping makes up over 11% of plastics packagingwaste from construction sites, and it is estimated that17,168 tonnes are available for collection per year(Anderson et al 2002)
24 The majority of this 225,000 tonnes comprises of PVC and PE pipes buried in the ground. It must at this time be assumed that theenvironmental cost of removing these products, far exceeds any environmental gain.
Figure 8 - constituents of plasticpackaging waste in construction (%)
Source - Anderson et al (2002)
www.plasticsintheuk.org.uk 41

Legislation and voluntary agreementsThere is currently no legislation directly relating to therecycling of plastics from the building and constructionsector. However, the Producer Responsibility Obligation(Packaging Waste) Regulations 1997, discussed above,will apply to packaging waste arising from this sector.
Vinyl 2010 – The Voluntary Commitment of thePVC IndustryThe Voluntary Commitment of the PVC Industry, signed inMarch 2000, has been developed to address commentsreceived during extensive public and politicalconsultation. As a result, an updated version called Vinyl2010 – the Voluntary Commitment of the PVC Industrywas signed in October 2001 (Vinyl 2010).
With respect to end-of-life products, four sectorassociations have committed to mechanically recycleat least 50% of collectable waste by 2005 (2008 forflooring)
• plastics pipes and fitting sector, represented by TheEuropean Plastics Pipes and Fittings Association(TEPPFA)
• window frame sector, represented by European PVCWindow Profile and Related Building ProductsAssociation (EPPA)
• flooring sector, represented by EuPC PVC FlooringSector Group (EPFLOOR)
• roofing membranes sector, represented by EuropeanSingle Ply Waterproofing Association (ESWA)
Practicalities of recyclingThe majority of plastics waste from the UK building andconstruction sector is currently landfilled and only verylittle is recycled.
25However, the imposition of the landfill
tax in the UK means that landfilling of construction wasteis rapidly ceasing to be a commercially viable option(Douglas et al 2000).
To determine strategies for the recycling of plastic fromthe building and construction sector it is necessary tounderstand the types of waste generated and the stageat which they are generated (figure 9).
As can be seen there are four distinct sources of wastegenerated by the building and construction sector -packaging, off-cuts and unused or damaged material,parts that have been replaced and whole buildingcomponents. These sources of waste arise at differentphases of construction and demolition, as shown below.
Culture of waste disposalThere is little evidence of businesses attempting torecover plastic materials during either construction ordemolition. The complex nature of many constructionprojects, often involving a wide variety ofsubcontractors, responsibilities and changing locations,presents logistical and cultural challenges. Arguablythere is a culture of disposal where waste is simply'skipped' and moved off site. Without demonstratingpractical, financially viable systems of operation thisapproach will be difficult to change. Many smallerconstruction firms are unaware of their environmentalresponsibilities; according to research commissioned bythe Environment Agency, 74% of smaller construction
25 Figures for Western Europe show that during 1995 less than 5% of plastic waste from the building and construction sector wasmechanically recycled.
Figure 9 – plastics waste from construction and demolition
42 plastics in the UK economy

businesses surveyed did not believe that they carried outactivities that could harm the environment (EdieNewsroom 2002).
Material identification and separationPlastics need to be identified and separated into singlepolymer types if they are to be reprocessed for use inhigh-grade, high-value applications. In theory, this shouldnot be a significant barrier to recycling plastics waste atthe construction phase, as the construction managershould know exactly what materials are brought onto asite and should therefore be able to manage waste flowswith some confidence (Symonds 1999). Identifying andseparating plastics from demolition waste is likely toprove more challenging. The BPF are planning toundertake an analysis of demolition waste in the nearfuture (Davis 2002).
ContaminationContamination can prevent recovered plastics frombeing used in high-grade, high-value applications.Common contaminants include other polymer typesand other materials such as metal, glass, cardboard,dust and moisture. Waste materials from newconstruction are usually clean and relativelyuncontaminated, whereas demolition wastes tends tobe contaminated and mixed with other materials(Douglas et al 2000).
Lack of guidance and collection infrastructureLimited guidance relating to the recovery and disposalof plastics from the building and construction sector,coupled with the lack of adequate collectioninfrastructure, creates a major barrier to recycling.Some guidance is available, for example the WasteMinimisation and Recycling Consortium - Design Manual(1998) published by the Construction Industry Researchand Information Association (CIRIA). The contentsconcentrate on three key aspects: waste minimisationthrough the reduction of resource consumption,reduction of waste generation at construction anddemolition sites and improvement of materialsreclamation.
End marketsThe construction sector represents an opportunity for thedevelopment of end markets for recycled products.There is a range of products containing recycled plasticssuitable for the construction and related industries such
as HDPE drainage pipe, window profiles, acousticshielding, pathway systems, hollow core floor slabs,geomembranes and insulation materials. In addition thereis a range of composite products that are underdevelopment that combine recycled plastics with glassfibre, concrete or wood.
26
There is also the potential for closed-loop recycling withinthe building and construction sector. Closed-looprecycling for PVC is already operated in the Netherlands,where discarded PVC pipes are separated out andshredded to a granulate form. The granulate is heat-treated and used for the production of non-pressuresewerage pipe (APME 2000).
In the UK, the Building Research Establishment (BRE),supported by WRAP, is currently undertaking a projectaimed at increasing markets for recycled constructionproducts, particularly through assistance with certificationand product approvals to allow products to be promotedas fit for purpose (BRE 2002).
If end markets are to be developed further, reprocessorsneed to be able to guarantee a reliable and adequatesupply of material. Ensuring appropriate collectioninfrastructure is in place would help ensure that this canbe achieved.
In certain cases there are standards, other thanperformance, that limit the use of recycled materials suchas the requirement to use virgin polymer. These are apotential barrier to recyclate use in some applications inthis sector.
Value of recovered materialThe most viable materials for recovery areunused/damaged PVC and PVC off-cuts from theconstruction phase and polyethylene sheet wrapping. Ifhandled correctly, these materials are relatively easy toseparate and keep clean, thereby increasing potentialmarket value. Special clauses can be inserted in tendersand contracts requiring contractors to recycle specificmaterials during construction. Specifying requirementsfor recycling at this stage removes the potential foradded costs later on.
The BPF are currently running a number of small trials ondemolition/refurbishment work with old PVC windows,but at present the value of the recovered material is less
26 Examples of many of these products can be found on the RECOUP website (www.RECOUP.org) in the "End Products" section, or on theeco-construction website (www.ecoconstruction.org), which contains guidance on issues such as planning, selecting or specifying materialsand case studies.
www.plasticsintheuk.org.uk 43

study key findings
DEFRA (2002) Life Cycle Assessment of PolyvinylChloride and Alternatives: Summary Report forConsultation
This study aims to inform policy development regardingthe manufacture, use and end-of-life management ofPVC. The report considered a selection of applicationsand alternative materials. It was found that in the caseof collation trays the PVC tray system generallyperforms marginally better and for flooring it is thelinoleum system that exhibits the marginal generalperformance advantage. In the case of rainwater pipesand window profiles, the differences are morepronounced however, with the PVC pipe systemperforming better than the aluminium pipe system andwood profile system performing better than the PVCprofile system.
EC (2000a) Environmental Issues of PVC28
EC (2000b), Mechanical Recycling of PVC Wastes
EC (2000c), Chemical Recycling of Plastics Waste (PVCand Other Resins)
EC (2000d) The Influence of PVC on the Quantity andHazardousness of Flue Gas Cleaning Residues fromIncineration
EC (2000e) The Behaviour of PVC in Landfill
than the cost of recycling it. However, steps are beingtaken to address this (Jervis 2002).
Design for environmental sustainabilityThere is growing emphasis on ‘sustainable construction’.Sustainable building design and international standardssuch as ISO 14001 to facilitate waste minimisation,recycling and increased use of environmentallysustainable products will play an important part inimproving recycling of plastics and other waste from thebuilding and construction sector.
A strategy to increase plastics waste recycling within thebuilding and construction sector should include thefollowing steps
Design phase• design for selected demolition and use of recycled
materials• specification based on performance only
Construction phase• encourage implementation of a well designed and
managed waste minimisation systems• target PVC off-cuts/unused or damaged material for
mechanical recycling• target polyethylene sheet wrapping for mechanical
recycling
Demolition phase• selective demolition
- separation and disposal of hazardous materials- separation of specific building components such as
PVC window frames for reuse/recycling
Review of EIAs To date it does not appear that any EIAs or LCAs have been undertaken with respects to plastics waste from the buildingand construction sector. However, both DEFRA and the European Commission (EC) have produced a number of relevantstudies on PVC, the main polymer used in the construction sector
27
44 plastics in the UK economy

Recommendations and priorities for action
developing and distributing best practice guidelines Development of best practice guidance is required to identify the best on-site management options for major plasticitems to enable recycling. This could be in the form of case studies with supporting economic arguments. Guidanceon waste minimisation and recycling in construction is available, but there appears to be a lack of informationrelating specifically to plastics waste.
developing end-markets for recycled plasticsin the construction sector Focused work is required to stimulate and commercialise new uses of recycled plastics, particularly recycled pipesand profiles, in this sector. In addition, there are opportunities for the use of recycled plastics in compositeproducts where plastic has not been a traditional material of choice.
developing design for selective demolition It is recommended that further research be undertaken to assess the following: • types of plastic component (e.g. PVC window frames) that can be easily dismantled and separated for recycling
during demolition• quantity of material likely to be available for collection and recycling from the demolition sector• reprocessing facilities for plastics from demolition and their potential specialist requirements
27 A large number of studies dealing with issues relating to PVC are available, only the most recent are listed here.28 This is a draft green paper on the environmental issues of PVC based upon the below studies. This is available from the European Union
Window profiles from recycled PVC
Deu
tsch
e G
esel
lsch
aft
für
Kun
stst
off-
Rec
yclin
g m
bH
www.plasticsintheuk.org.uk 45

There are approximately 250,000 agricultural enterprisesin the UK. The use of plastics has grown in theagricultural sector and covers a range of applications.Plastics are used in products such as packaging,permanent/semi-permanent buildings, crop covers,irrigation systems and tools and equipment. Littlematerial is currently recycled or recovered. A significanttonnage is either buried or burned after use.
Analysis of plastics waste arisingsUK agricultural enterprises generate the following plasticswaste arisings (Table 13)
Legislation and voluntary agreementsAlthough there currently are no obligations to recyclematerials from these sources, the government intends toextend existing waste management controls to includewaste from agriculture in the implementation of the ECFramework Directive on Waste. This will introduce awaste management licensing system, a legal duty of careand a registration system for businesses transportingwaste. Waste disposal on farms will no longer bepossible without a waste management licence orexemption. Since the costs associated with applying forand holding a licence are very high, the only viable option
agricultural waste arisings (tonnes)
England Wales Scotland Northern Ireland total
packaging
agrochemical 1720 30 276 374 2400
fertiliser bags 8748 984 1654 815 12200
seed bags 840 15 134 12 1000
animal feed bags 6419 1283 2019 1680 11400
animal health 444 105 124 76 750
oil containers 501 47 84 38 669
miscellaneous 2063 331 1166 240 3800
total packaging 20734 2794 5457 3235 32219
non-packaging plasticsfilms
silage plastics 12425 5016 5029 2530 25000
greenhouse/tunnel film 242 5 6 5 500
mulch/crop cover 3738 30 657 76 4500
total film 16405 5051 5692 2611 30000
other
silage wrap cores 703 339 327 138 1506
other horticulture 5617 114 143 127 6000
bale twine/net wrap 7934 821 1683 662 11100
tree guards 6694 532 4492 182 11900
total other 20948 1806 6645 1109 30508
total plastics 58087 9651 17794 6955 92727
29 In some cases the quantity of plastics reported in this section will also have been reflected in other sections of this report - e.g. packaging.Information is included to reflect the discrete nature of waste arisings from this stream and the relatively good data available.
Table 13 – estimates of agricultural waste arisings (tonnes), 199829
Source - Marcus Hodges Environment Ltd (2001)
46 plastics in the UK economy

for many wastestreams will be to transfer the waste to acontractor for disposal, or recovery at a licensed facility(Environment Agency 2001).
Certain farm plastics, such as feed bags, fall under theprovisions of Packaging Directive. Silage films and cropcovers are not classed as packaging.
In the early 1990s, the film manufacturing industry,recognising that many farmers had an end use disposalproblem, set up a national scheme to recover ‘farm films’for recycling. This voluntary scheme was financed by a£100/t levy on each tonne of agricultural film sold tocover the incremental cost of collecting and reprocessingthis material. This voluntary agreement collapsedbecause two overseas suppliers gained a competitiveadvantage through evading this charge.
Practicalities of recyclingEfforts to recycle plastics from this sector havepredominantly focused on films. However, the quantity ofwaste film produced per enterprise is relatively low andheavy contamination with residual soil or silage is likely inthe case of silage plastics films, mulch and crop covers.Each tonne of silage plastics collected typically has aproportion of 57% contamination by weight (Davies2002). Crop covers can have even higher levels of soilcontamination.
Research by the ADAS consultancy group indicates thefollowing waste management practices for silage wrap(Davies 2002)
Figure 10 - waste managementpractices for silage wrap
Source - Davies (2002)
There is currently one recycler of farm films in the UK,British Polyethylene Industries (BPI) and three grant-subsidised schemes collecting farm films exist in Wales,Cumbria and Scotland. Schemes are not financially viableunless farmers are charged for the service or there issome other form of subsidy.
Pesticide container recovery schemes currently operatein Belgium, France, Germany and the Netherlands.These are financed by producer levies. However, it shouldbe noted that in all cases, except the Netherlands, thecollected containers are incinerated with energy recoveryrather than recycled. The Crop Protection Association(formerly called British Agrochemicals Association) hasundertaken some work in this area and is activelyinvolved in the issue of container management in the UK;they also represent the UK industry in discussions atEuropean level.
www.plasticsintheuk.org.uk 47

Review of EIAsThe Environment Agency co-ordinated a LCA study,using their WISARD analysis tool, into options formanaging waste silage plastic. This indicated thatrecycling silage film at the BPI plant is environmentallypreferable to both landfill and incineration with energyrecovery. The study also concluded that theenvironmental benefits of recycling could be increasedsignificantly if the level of contamination of the plastic isreduced at source and if the distance to the reprocessingfacility is decreased. These factors would also reduce thefinancial cost (Marcus Hodges Environment Ltd 2001).
Recommendations andpriorities for action
clarifying and strengthening of producerresponsibilityA voluntary approach has proved unworkable inthe past and it is therefore likely that Governmentwill need to apply producer responsibilityprinciples to the sector to achieve a move awayfrom landfill. The Government has recently set upan agricultural waste stakeholder group whichshould provide an appropriate forum for thisdiscussion.
developing collection infrastructure Developing cost-effective waste collectionarrangements is crucial for the facilitation ofrecycling. This should be supported by researchand development work to determine optimumlogistics arrangements.
developing best practice guidance The development of a code of practice andguidance on managing farm wastes, backed bypractical 'best practice' evidence, would enablefarming enterprises to identify alternativemanagement options for plastics waste.
promoting a change in attitudestowards waste disposal A key to achieving higher recycling rates ofagricultural plastics waste is a change in theattitudes to waste disposal such as a reduction ofthe proportion of plastics waste being burnt orburied. This cultural change could be achieved inpart through communication of issues andexpectations to all stakeholders and in partthrough effective enforcement of new wastemanagement requirements.
developing end-markets for mixed andcontaminated plastics such as agricultural filmsIt is recommended that work is undertaken intodeveloping end-markets for mixed andcontaminated plastics such as agricultural films.Some progress has already been made in thisarea, for example Plasmega is operating aresearch and development facility capable ofproducing low-grade products for the constructionindustry.
48 plastics in the UK economy
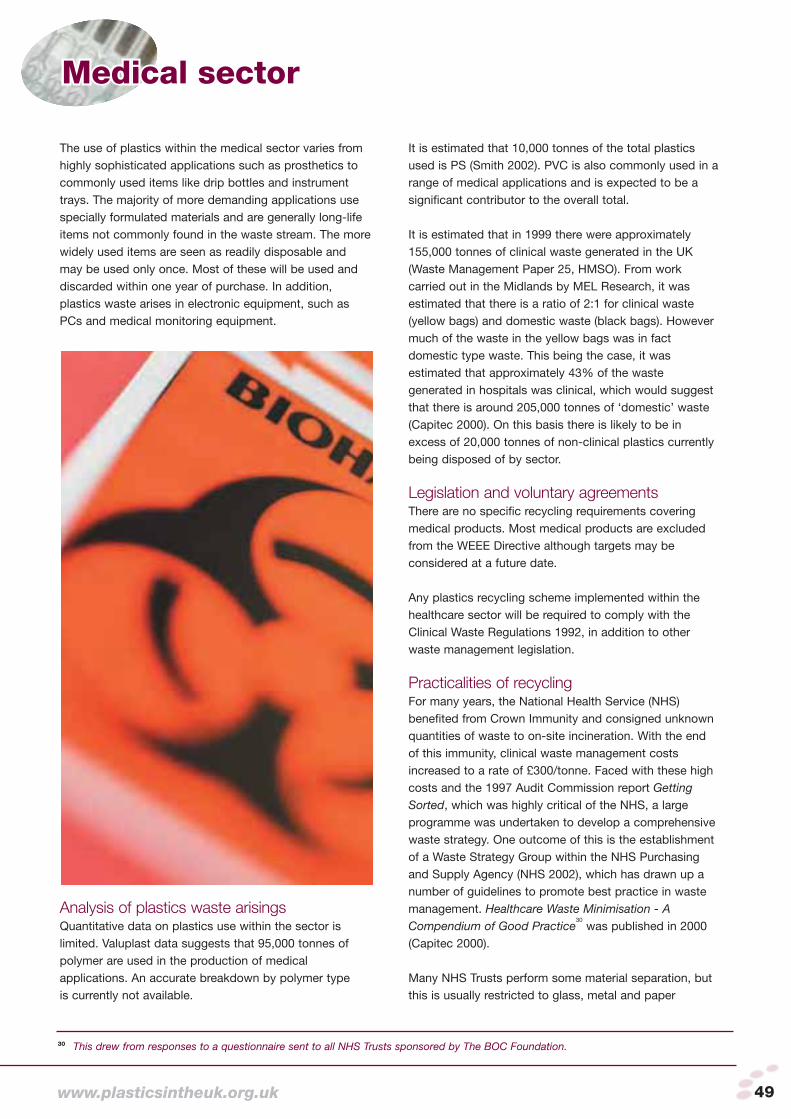
The use of plastics within the medical sector varies fromhighly sophisticated applications such as prosthetics tocommonly used items like drip bottles and instrumenttrays. The majority of more demanding applications usespecially formulated materials and are generally long-lifeitems not commonly found in the waste stream. The morewidely used items are seen as readily disposable andmay be used only once. Most of these will be used anddiscarded within one year of purchase. In addition,plastics waste arises in electronic equipment, such asPCs and medical monitoring equipment.
Analysis of plastics waste arisingsQuantitative data on plastics use within the sector islimited. Valuplast data suggests that 95,000 tonnes ofpolymer are used in the production of medicalapplications. An accurate breakdown by polymer typeis currently not available.
It is estimated that 10,000 tonnes of the total plasticsused is PS (Smith 2002). PVC is also commonly used in arange of medical applications and is expected to be asignificant contributor to the overall total.
It is estimated that in 1999 there were approximately155,000 tonnes of clinical waste generated in the UK(Waste Management Paper 25, HMSO). From workcarried out in the Midlands by MEL Research, it wasestimated that there is a ratio of 2:1 for clinical waste(yellow bags) and domestic waste (black bags). Howevermuch of the waste in the yellow bags was in factdomestic type waste. This being the case, it wasestimated that approximately 43% of the wastegenerated in hospitals was clinical, which would suggestthat there is around 205,000 tonnes of ‘domestic’ waste(Capitec 2000). On this basis there is likely to be inexcess of 20,000 tonnes of non-clinical plastics currentlybeing disposed of by sector.
Legislation and voluntary agreementsThere are no specific recycling requirements coveringmedical products. Most medical products are excludedfrom the WEEE Directive although targets may beconsidered at a future date.
Any plastics recycling scheme implemented within thehealthcare sector will be required to comply with theClinical Waste Regulations 1992, in addition to otherwaste management legislation.
Practicalities of recyclingFor many years, the National Health Service (NHS)benefited from Crown Immunity and consigned unknownquantities of waste to on-site incineration. With the endof this immunity, clinical waste management costsincreased to a rate of £300/tonne. Faced with these highcosts and the 1997 Audit Commission report GettingSorted, which was highly critical of the NHS, a largeprogramme was undertaken to develop a comprehensivewaste strategy. One outcome of this is the establishmentof a Waste Strategy Group within the NHS Purchasingand Supply Agency (NHS 2002), which has drawn up anumber of guidelines to promote best practice in wastemanagement. Healthcare Waste Minimisation - ACompendium of Good Practice
30was published in 2000
(Capitec 2000).
Many NHS Trusts perform some material separation, butthis is usually restricted to glass, metal and paper
30 This drew from responses to a questionnaire sent to all NHS Trusts sponsored by The BOC Foundation.
www.plasticsintheuk.org.uk 49
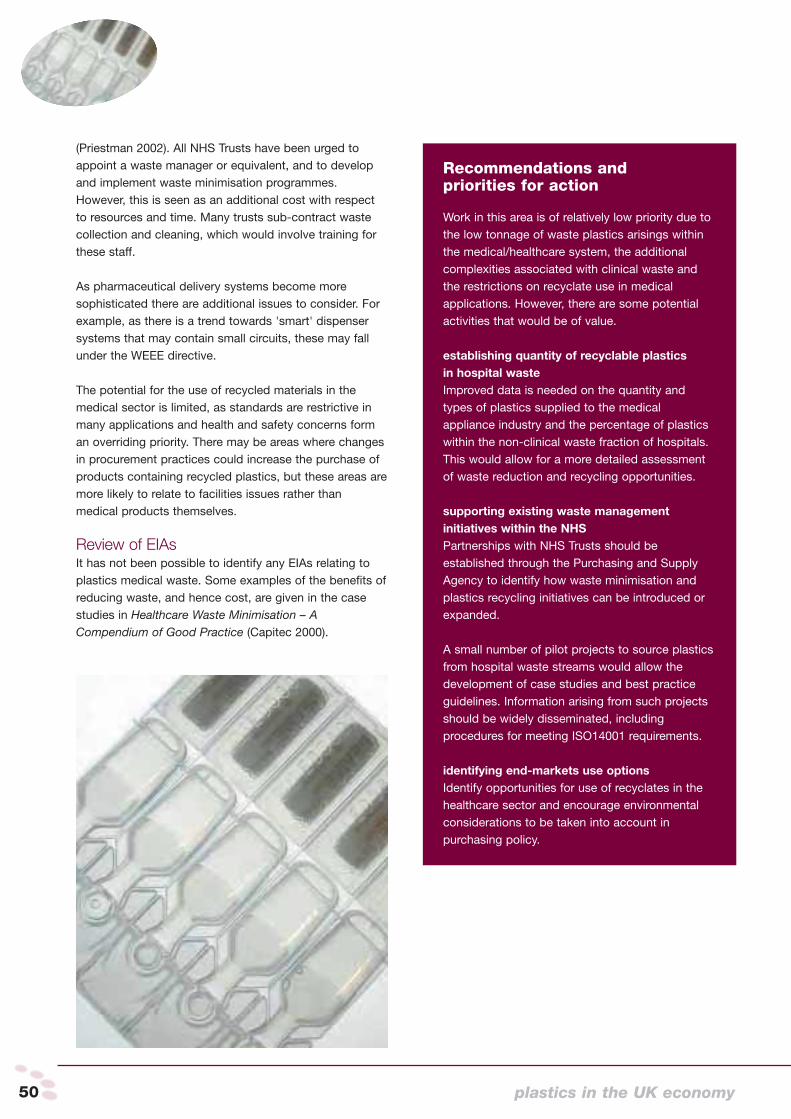
(Priestman 2002). All NHS Trusts have been urged toappoint a waste manager or equivalent, and to developand implement waste minimisation programmes.However, this is seen as an additional cost with respectto resources and time. Many trusts sub-contract wastecollection and cleaning, which would involve training forthese staff.
As pharmaceutical delivery systems become moresophisticated there are additional issues to consider. Forexample, as there is a trend towards 'smart' dispensersystems that may contain small circuits, these may fallunder the WEEE directive.
The potential for the use of recycled materials in themedical sector is limited, as standards are restrictive inmany applications and health and safety concerns forman overriding priority. There may be areas where changesin procurement practices could increase the purchase ofproducts containing recycled plastics, but these areas aremore likely to relate to facilities issues rather thanmedical products themselves.
Review of EIAsIt has not been possible to identify any EIAs relating toplastics medical waste. Some examples of the benefits ofreducing waste, and hence cost, are given in the casestudies in Healthcare Waste Minimisation – ACompendium of Good Practice (Capitec 2000).
Recommendations andpriorities for action
Work in this area is of relatively low priority due tothe low tonnage of waste plastics arisings withinthe medical/healthcare system, the additionalcomplexities associated with clinical waste andthe restrictions on recyclate use in medicalapplications. However, there are some potentialactivities that would be of value.
establishing quantity of recyclable plasticsin hospital waste Improved data is needed on the quantity andtypes of plastics supplied to the medicalappliance industry and the percentage of plasticswithin the non-clinical waste fraction of hospitals.This would allow for a more detailed assessmentof waste reduction and recycling opportunities.
supporting existing waste managementinitiatives within the NHS Partnerships with NHS Trusts should beestablished through the Purchasing and SupplyAgency to identify how waste minimisation andplastics recycling initiatives can be introduced orexpanded.
A small number of pilot projects to source plasticsfrom hospital waste streams would allow thedevelopment of case studies and best practiceguidelines. Information arising from such projectsshould be widely disseminated, includingprocedures for meeting ISO14001 requirements.
identifying end-markets use options Identify opportunities for use of recyclates in thehealthcare sector and encourage environmentalconsiderations to be taken into account inpurchasing policy.
50 plastics in the UK economy

Many everyday household items are manufactured frompolymers as they are durable whilst being lightweight andoffering a variety of colour and design options. Within themarket place for furniture there was a world-widedemand for over 750,000 tonnes of virgin PP alone in2000 (TNO Sofres 2002). Within the UK, the largest sectordemand is for garden furniture with over 70% of UKhouseholds owning some form of plastic garden furniture.
More recently, items such as containers for recyclablesare being produced and there is an increased demand forwheeled bins, composters and water butts, whereplastics are preferred to other materials.
Analysis of plastics waste arisingsData on plastics waste arisings in this sector are limited.Table 14 indicates the amounts of polymer used in withtotals including UK manufacture plus imports (Smith2002).
Table 14 – polymer types used in thefurniture and housewares sector(tonnes)
Source - Smith (2002)
Legislation and voluntary agreementsThere currently are no specific regulatory provisionsrelating to the handling of plastic furniture andhousewares waste.
Practicalities of recyclingA proportion of recycled material is already used in thissector, where high levels of fillers and pigments arerequired to provide stability against UV light degradation.New opportunities for other items such as decking,benches and other garden products are starting to beexploited. There are a range of suppliers of suchproducts using recycled plastics from polyolefins and PSand it is estimated that over 20,000 tonnes of recycledplastics per annum are used in these applications withinthe UK (RECOUP 2002).
There are a number of social enterprise schemes acrossthe UK, which collect furniture for re-use or recycling.Although the majority of this furniture is non-plastic, thereis an existing infrastructure for collection. This mayprovide opportunities to promote re-use of certain plastic
items, although opportunities are probably modest. It isrecognised that the volumes available and the complexityof requirements make a recycling solution unlikely ifplastic furniture is not appropriate for re-use. Individualsites would have to dismantle and granulate materials,and larger items would require cutting prior togranulation.
A number of wheeled bin suppliers now offer wheeled binrecycling schemes. In the UK, Plastic Omnium UrbanSystems offer a refurbishment and recycling service andalso supply a wheeled bin range that is manufacturedusing post-consumer recycled plastics.
In the longer term, facilities may be provided at civicamenity sites to enable recycling of large plastic itemssuch as furniture. However, currently the lack of drivers,the complexity and the low potential quantities arisingmake this a low priority wastestream for recycling.
Review of EIAsThere does not appear to be any information available onthe recycling of furniture and housewares, although thereare interesting LCAs comparing the use of recycledplastic lumber with treated timbers. These indicate thebenefits of using recycled plastics lumber due to the longlife, low maintenance and reduction in environmentaldamage associated with the use of wood-treatmentchemicals (Nosker 2001).
Recommendations andpriorities for action
encouraging use of recyclate Due to the low quantities of recyclable plasticsarising in this sector, main environmental gainscan be made through stimulating the use ofrecyclate in the production of furniture andhousewares, rather than actively pursuingrecycling programmes.
establishing available quantities of recyclableplasticsIn order to make a more detailed assessment ofthe opportunities for recycling in this sector, itwould be valuable to obtain more data on thematerial breakdown to identify viable quantities ofplastics for recycling.
PP PS HDPE ABS/PE totalPVC
furniture 38,000 7,000 n/a n/a 295,000
housewares 61,000 n/a 22,000 n/a >83,000
www.plasticsintheuk.org.uk 51

This report provides an initial analysis of theopportunities to reduce landfilling of plastics andstimulate plastics recycling in the UK. The reportdescribes the use of plastics in different sectors of theeconomy, the current issues relating to plastics wastemanagement and key regulatory drivers within eachsector. The analysis has identified data gaps, whichneed addressing in future work.
The research shows that both the opportunities for, andthe challenges to, increasing the recycling of plastics varyconsiderably between sectors and applications.
There are many opportunities to increase the recycling ofplastic packaging from domestic sources, primarilythrough plastic bottle collection. In this sector, the mainbarrier to increased recycling is the lack of an adequatecollection infrastructure. However, systems based onintegrated, multi-material kerbside collections are likely togenerate good quality materials for the reprocessingsector at little or no additional cost to landfill-baseddisposal. The need for capital investment and alegislative framework that encourages all local authoritiescurrently form the main barriers to achieving this.Recycling of plastic packaging from the commercial andindustrial sectors is already well established and aroundhalf of this material is currently recycled. However, thereare likely to be diminishing returns in this sectorespecially with an expected increase in returnables-based distribution systems. In this sector the main barrierarises from the lack of an adequate collectioninfrastructure.
In automotive and electronic applications the challengesrelate to the cost-effective separation of plastics types insignificant quantities, and to the difficulty of handlingengineering thermoplastics and thermosets containing arange of additives. Future statutory requirements relatingto the recycling of plastics from waste electronic andelectrical equipment and end-of-life vehicle sources arecurrently unclear. In the case of the ELV directive, it canbe argued that there is no requirement to recycle plasticsfrom ELV scrap as the directive includes no material-specific recycling targets and compliance could beachieved through recycling ELV materials other thanplastics. In the case of the WEEE directive, it is morelikely that plastics will have to be recycled, although thetargets are also non-material specific. Even if around halfof waste electronic and electrical equipment plasticswere recycled under the terms of the WEEE directive, thismight only amount to around 100,000 tonnes. Thepotential environmental impacts of such recycling and thecost involved remain unclear.
In the medical, furniture and housewares sectors thereare a range of challenges which, considering the relativelylow quantities of waste plastics generated by thesesectors, suggest that efforts focussed on other sectorswill produce the greatest return for society in theforeseeable future.
Overall, as shown in various environmental impactassessments, the resources required in recyclingsystems, including collecting, transporting andprocessing waste plastics into recyclate, are typicallysignificantly lower than the resources required to producevirgin polymers. The substitution of virgin polymer withrecycled plastics will also lead to greater resourcesavings than efficiency improvements in virgin polymerproduction alone.
The collection and processing infrastructure forwaste plasticsThe issues relating to collection and handling greatlydepend on whether the primary aim of the collection is therecovery of plastics waste as opposed to other materials.The collection infrastructure for plastic packagingrecycling can to some extent be designed specifically tomaximise the value of the plastics, for example bypreventing contamination. The infrastructure for sourcingplastics from ELV, on the other hand, is driven primarily bythe most efficient methods for metals recycling.
From waste to art: a 140 metre long light wall by artists Bär + Knellcreated from plastics packaging waste
Cou
rtes
y of
Deu
tsch
e G
esel
lsch
aft
für
Kun
stst
off-
Rec
yclin
g m
bH
52 plastics in the UK economy

The packaging sector is the only sector where collectioninfrastructure is the specific limiting factor. In the caseof ELV and, to some extent, WEEE the collectionsystems are in place and the barrier to recycling relatesprimarily to the separation of the recyclate and themarketing of derived products.
The most significant opportunity to maximise therecyclability of waste plastics is through the developmentof separation technology. Commercially viable systemsfor the separation of 'large' plastic items such as bottlesalready exist. For other sectors, in particular WEEE andELV, the greatest potential lies in developing commercialsystems for high-speed, high-quality separation ofdifferent polymer flakes arising from shreddingoperations.
Plastics reprocessing technologyThe technology for mechanical recycling of plastics iswell-established and it is likely that there will becontinued development in the efficiency of traditionalmechanical recycling processes. Mechanically recycledmaterials can already be found in highly specifiedapplications such as food-grade packaging andautomotive components. The main opportunity for developing mechanicalrecycling lies in the processing of mixed plastics intocommercial products. Although viable processes do not
appear to exist currently, the progress of manyresearchers and entrepreneurs in this relatively new areais encouraging. Examples of this include Plasmega andPlascrete, who have developed products for theconstruction industry, which replace concrete andaggregate. Feedstock recycling technologies are beingdeveloped with improved economic efficiency.
The commercial viability of plastics reprocessing willincrease not only as a result of continuing R&Dinvestment, but also as disposal costs increase. Plasticsreprocessing does not have to be profitable per se; itmust simply be a better option than the least expensivealternative disposal route. Higher landfill charges andincinerator gate fees, resulting from tax escalators andhigher environmental compliance costs, will increase thevalue of avoiding final disposal.
The same is true for feedstock recycling processes.Although beyond the scope of this report, it should benoted that feedstock recycling is technically feasible. Themain barriers to its development relate to processeconomics and supply volumes. The comparative cost offeedstock recycling is likely to continue to fall as the costof landfill and incineration increase, making it morecommercially viable in the future.
End markets for recyclateA review of end market market development issues isbeyond the scope of this report. However, it is importantto recognise the importance of stimulating the growth ofvalue-added secondary markets for plastics recyclate.Demand for recycled plastics will increase when there isa reliable supply of quality recyclates. These need to bepriced competitively in comparison to virgin materials toenable manufacturers to improve profitability by switchingto recyclates.
It is essential to distinguish between end markets thathave real commercial potential and those that offeronly marginal opportunities for increased recyclate use.If recyclate use is to enter mainstream manufacturing, itis essential for recycled materials to be promoted onthe same basis as virgin materials – according to costand fitness for purpose – and not primarily because oftheir ‘green’ credentials. Manufacturers and specifierswill have maximum incentive to use recyclates whenthey are the most economically advantageous option.This competitive advantage of the use of recyclatemust be highlighted. Robust case studies and theanalysis of supply/value chains and future trends willbe extremely valuable to support the business casefor recyclate use.
www.plasticsintheuk.org.uk 53

54 plastics in the UK economy
This requires a crucial shift in thinking: suppliers need toconsider recycled polymers as alternative materials withdefined properties rather than inferior versions of virginpolymer. Recyclate suppliers need to mirror the service,quality assurance and marketing capacity of the virginpolymer industry. This should be a key thrust of futuremarket development activities
31and could be achieved
through supporting targeted market research, training,standards development and specific product/materialmarketing campaigns. Organisations such as WRAP areideally placed to carry out this work.
The term ‘recycled’ now has such broad connotations thatit fails to represent accurately its potential benefit tocustomers. Suppliers therefore need to consider stating thebenefits of recycled materials in a precise manner, forexample in terms of the reduction in resources used. Thestatement ‘this product is made from plastic material whichuses 50% less energy and reduces emissions by 30%’demonstrates a more specific and tangible advantage than‘contains recycled plastics’. The packaging industry has formany years generated increasingly sophisticated life-cyclemodels and eco-profiles to evaluate and justify the use ofparticular virgin materials. The extension of thismethodology to recycled materials is essential to thesuccessful increase in recyclate use.
The way forwardSufficient progress has been made in the last ten yearsto demonstrate the potential for further development inplastics recycling. The greatest challenges relate notto technology or markets, but to deciding priorities forrecycling on economic and environmental grounds.A 'targets-based' approach is a fairly blunt mechanismto drive environmental efficiency; however, it probablyrepresents a necessary starting point.
It is recommended that stakeholders embrace a moresophisticated analysis of the relative environmentalimpacts of products throughout their whole life-cycles.This will provide the foundation for more mature andconstructive dialogue between government, producersand consumers of all products, not only plastics. Suchan approach will assist both plastics producers and theircustomers to assess and minimise the environmentalimpacts of products and will result in more sustainableresource use by society as a whole.
Priorities for action
The following recommendations and priorities foraction highlight the most significant short-termopportunities for increasing of plastics recycling inthe sectors considered in this study
• increase post-consumer plastic bottle recyclingthrough the inclusion of plastics bottles inintegrated multi-material kerbside collectionschemes
• maximise the recycling of plastics packagingfrom the commercial and industrial waste stream
• develop technologies for the efficient mechanicalrecycling of plastics from shredder residue
• develop a range of end-markets for recoveredplastics and promote public sector procurementof recycled plastics products
• increase the cost of disposing of plastics waste,potentially through increasing thelandfill/disposal tax
• ensure that the environmental and economictrade-offs of recycling certain types or quantitiesof plastics are properly understood by policymakers
31 It should be noted that many virgin materials suppliers are also engaged in recyclate production.

Appendices

UK plastics consumptionTotal UK plastics consumption by polymer typeThe British Plastics Federation and the Packaging and Industrial Films Association have for a number of years compiledand updated data on the usage by the UK manufacturing industry of all thermoplastic and thermoset material by polymertype. A digest of this information for 2000 is shown below.
material UK industry manufacture (kt)
thermoplastics
PVC 777
PP 764
PS 260
EPS 57
HDPE 544
LDPE 1002
ABS 89
PC 38
PBT 9
PET 235
PA 46
PMMA 40
POM 16
PUR 55
PC/ABS 4
sub total 3936
thermosets
UPR 80
EPOXY 33
PHENOLIC 81
sub total 194
total 4130
Source - Valuplast from British Plastics Federation & PIFA (2001)
Appendix A
56 plastics in the UK economy
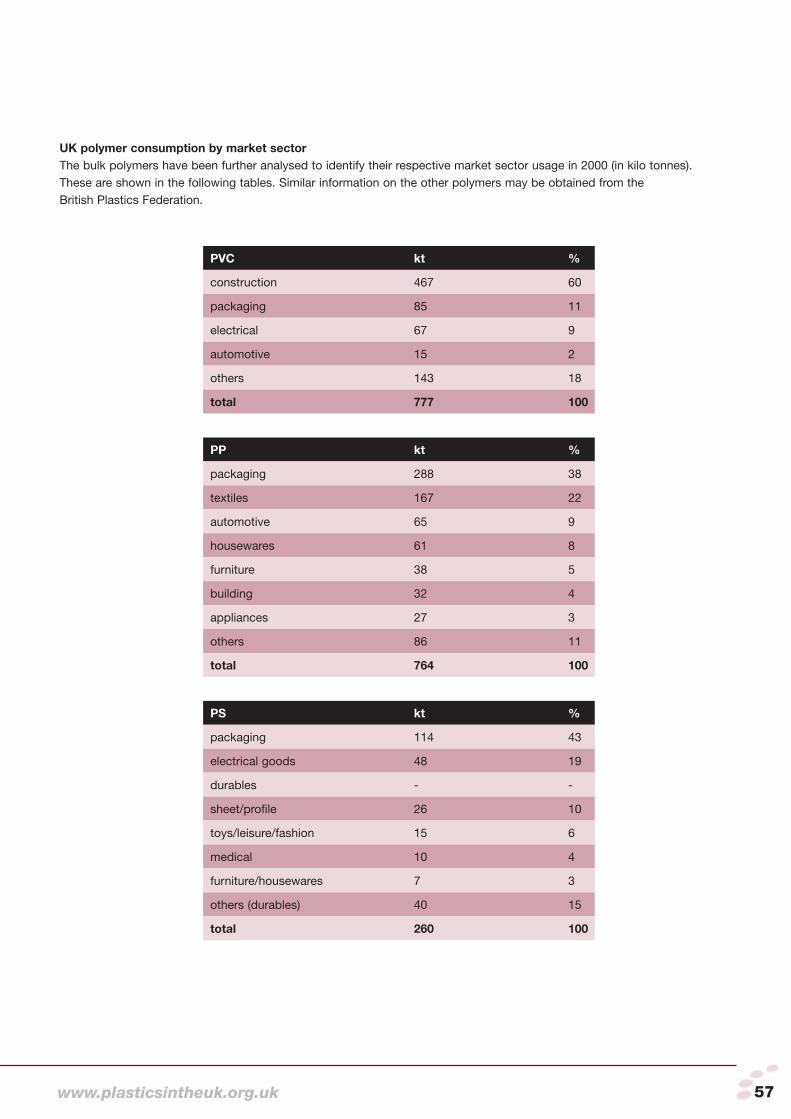
UK polymer consumption by market sectorThe bulk polymers have been further analysed to identify their respective market sector usage in 2000 (in kilo tonnes).These are shown in the following tables. Similar information on the other polymers may be obtained from theBritish Plastics Federation.
PVC kt %
construction 467 60
packaging 85 11
electrical 67 9
automotive 15 2
others 143 18
total 777 100
PP kt %
packaging 288 38
textiles 167 22
automotive 65 9
housewares 61 8
furniture 38 5
building 32 4
appliances 27 3
others 86 11
total 764 100
PS kt %
packaging 114 43
electrical goods 48 19
durables - -
sheet/profile 26 10
toys/leisure/fashion 15 6
medical 10 4
furniture/housewares 7 3
others (durables) 40 15
total 260 100
www.plasticsintheuk.org.uk 57

EPS kt %
packaging 31 54
building 22 38
others 4 7
total 57 100
HDPE kt %
packaging 315 58
construction 98 18
housewares 22 4
automotive 11 2
others 98 18
total 544 100
LDPE kt %
packaging 707 71
agriculture/building 122 12
electrical 32 3
others 141 14
total 1002 100
PET kt %
blow-moulded 217 92.5
engineering 2 0.5
others 16 7.0
total 235 100
ABS kt %
electrical 73 31
automotive 33 14
extrusions 21 9
pipes 19 8
tools/DIY 16 7
packaging 7 3
others 66 28
total 235 100
Source - RECOUP (2002)
58 plastics in the UK economy
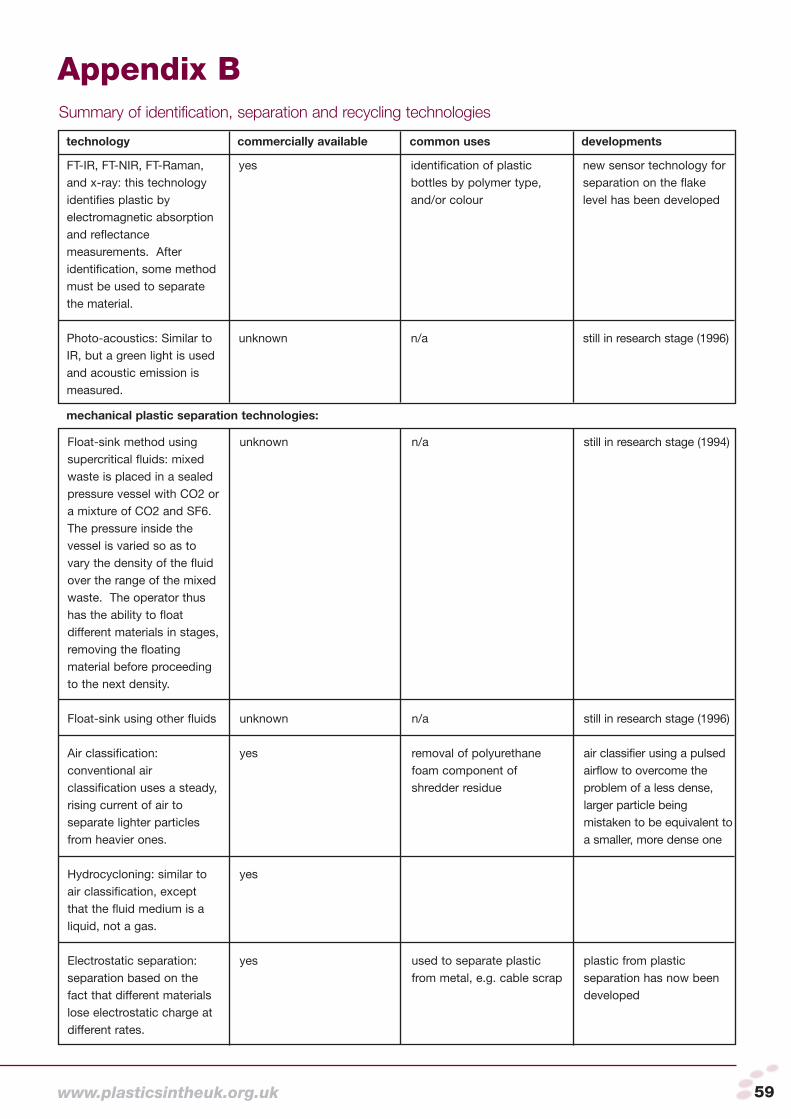
Appendix BSummary of identification, separation and recycling technologies
technology commercially available common uses developments
mechanical plastic separation technologies:
FT-IR, FT-NIR, FT-Raman,and x-ray: this technologyidentifies plastic byelectromagnetic absorptionand reflectancemeasurements. Afteridentification, some methodmust be used to separatethe material.
yes identification of plasticbottles by polymer type,and/or colour
new sensor technology forseparation on the flakelevel has been developed
Photo-acoustics: Similar toIR, but a green light is usedand acoustic emission ismeasured.
unknown n/a still in research stage (1996)
Float-sink method usingsupercritical fluids: mixedwaste is placed in a sealedpressure vessel with CO2 ora mixture of CO2 and SF6.The pressure inside thevessel is varied so as tovary the density of the fluidover the range of the mixedwaste. The operator thushas the ability to floatdifferent materials in stages,removing the floatingmaterial before proceedingto the next density.
unknown n/a still in research stage (1994)
Float-sink using other fluids unknown n/a still in research stage (1996)
Air classification:conventional airclassification uses a steady,rising current of air toseparate lighter particlesfrom heavier ones.
yes removal of polyurethanefoam component ofshredder residue
air classifier using a pulsedairflow to overcome theproblem of a less dense,larger particle beingmistaken to be equivalent toa smaller, more dense one
Hydrocycloning: similar toair classification, exceptthat the fluid medium is aliquid, not a gas.
yes
Electrostatic separation:separation based on thefact that different materialslose electrostatic charge atdifferent rates.
yes used to separate plasticfrom metal, e.g. cable scrap
plastic from plasticseparation has now beendeveloped
www.plasticsintheuk.org.uk 59

Identification, separation and recycling technologies
technology commercially available common uses developments
Magnetic separation:ferrous metals may beseparated via a simplemagnet mounted over amoving conveyor belt.Non-ferrous metals areseparated by rapidlyspinning magnetic pulleys.
yes used to separate bothferrous and non-ferrousmetals from the lightfraction of shredder residue
Paint/soating removal:water-based process
yes paint/coating removal
Selective solvent extraction:SR is first sifted through ascreen and then treatedusing acetone, xylene andethylene dichloride.
unknown separation of specificpolymers from shredderresidue.
still in research stage (1996)
Melt temperatures:separation of polymersbased on melt temperature.
unknown n/a still in research stage (1996)
Dielectric characteristics:separation of polymersbased on dielectriccharacteristics.
unknown n/a still in research stage (1996)
Separation in an oxygen-free vacuum oven: materialis placed in a sealedseparation device. Nitrogenis used to drive any oxygenfrom the system and avacuum is applied. Thedevice heats the contents,separating copper andplastic.
yes cable scrap
Pyrolysis: mixed plastics aredecomposed into energysources or monomers byultrahigh temperature in theabsence of oxygen.
yes
Glycolysis: a process thatbreaks down PET intoshort-chain oligomers
yes
chemical recycling processes:
60 plastics in the UK economy
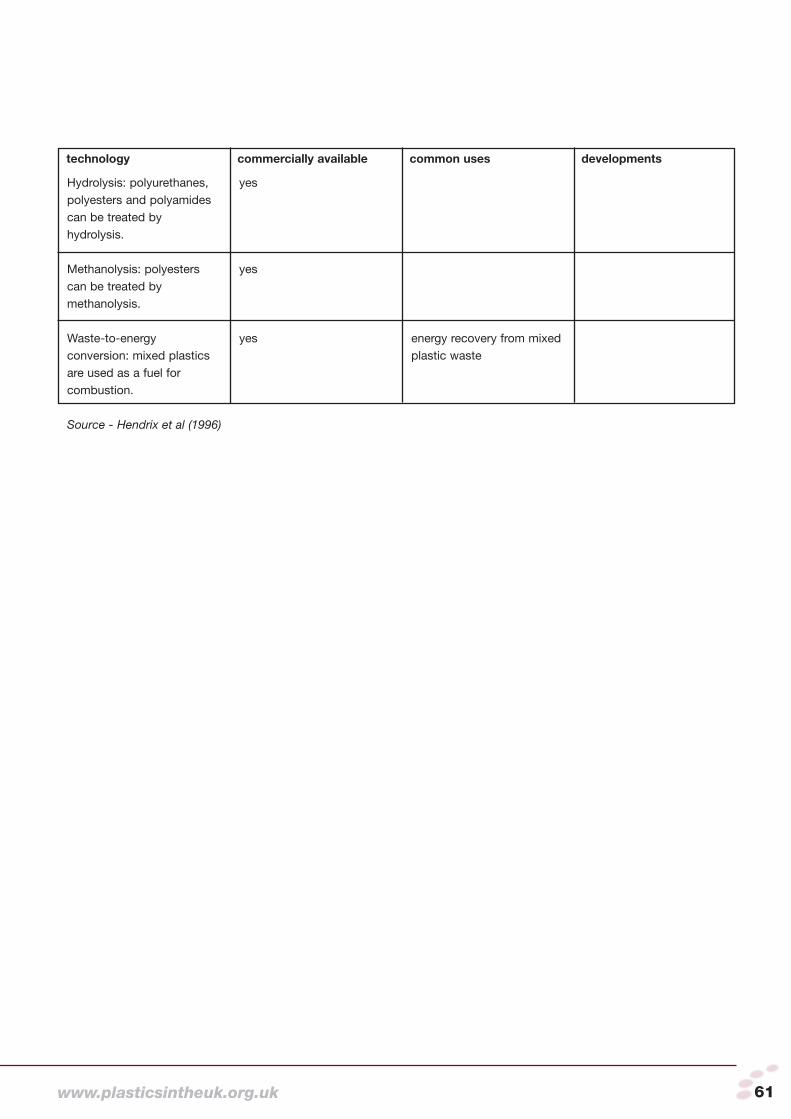
Identification, separation and recycling technologies
technology commercially available common uses developments
Hydrolysis: polyurethanes,polyesters and polyamidescan be treated byhydrolysis.
yes
Methanolysis: polyesterscan be treated bymethanolysis.
yes
Waste-to-energyconversion: mixed plasticsare used as a fuel forcombustion.
yes energy recovery from mixedplastic waste
Source - Hendrix et al (1996)
www.plasticsintheuk.org.uk 61

Recent developments in identification andseparation technologies
Plastics in the automotive sectorVirtually all of the material in today’s vehicles can berecycled; the challenge facing engineers is making thisrecycling process cost-effective. Different types of plastic-from-plastic and plastic-from-metal separation technologiesexist that allow economically feasible recycling (Hendrix et al1996, appendix B). It is probable that a combination oftechnologies would be required to successfully identify,separate and recycle plastics from ELV.
Two systems developed on behalf of Ford have beendesigned to identify plastics from vehicles at the dismantlingstage; these are the Tribopen and Polyana(http://www.walkersystems.de). The Tribopen works bymeasuring the tribo-electric (static) charge generated whenits head is rubbed briefly against the plastic part to besorted. It is a portable, handheld device that is used toseparate two predefined materials. The Polyana identifiespolymers using FT-IR spectroscopy and can be used to sortall types of plastic, irrespective of the materials colour, solong as the plastics are on its database. The system can alsoidentify whether the material is pure, a blend of two plastics,or plastic containing fillers. Similar technologies are beingdeveloped in other countries.
Technologies specifically designed to separate plastics fromshredder residue have been developed, or are beingresearched by -
• GALLOO PLASTICS, (GALLOO METALS subsidiary),Belgium-French shredder operator
• SALYP, Belgium• The University of Delft, The Netherlands• MBA Polymers, USA• The University of Brighton, UK
Emphasis has been placed on the extraction ofpolypropylene, as this comprises the largest fraction ofautomotive and WEEE plastics, often shredded in thesame facilities.
GALLOO PLASTICS is operating a 10,000 tonnes perannum (tpa) capacity plant in northern France, with adoubling of capacity under construction. The investment wassupported by the French Environment Agency (Picot 2002).There must be a critical mass in respect of the amount ofrecovered plastics for the process to be economically viable.At most only 20% of the material going through theseparation process is recovered, but as the processoperating costs are low, the fact that a large quantity ofshredder residue has to go through the process is not
critical (Picot 2002). The commercial feasibility is, however,dependent upon the market price of the recoveredpolypropylene and the cost of alternative disposal, such aslandfill.
SALYP has reached an agreement with the Chinesegovernment to build a facility to separate mixed plasticsfrom shredders that process auto bodies, appliances andelectronics in China. The China ELV Centre will recyclepost-consumer computers in Beijing as a demonstrationproject, with the aim of introducing a network of regionaland local ELV Centres. After an evaluation period,automotive bodies, white goods and the residue from othershredded objects will be processed at the centre (RTOnline News 2002).
The University of Delft in the Netherlands has developed awet jigging technology, enabling the separation of plasticsfrom shredder residue. The system has the advantage thatthe plastics are not contaminated by salt, which is used inother density systems. A pilot plant has been constructedcapable of processing 400 kg/hour (Dabekaussen 2002).
MBA Polymers specialise in the separation of specificpolymer types and grades (e.g. injection and extrusiongrades) from shredded mixed plastic produced by theelectrical and electronics sector (Biddle 2002). It is possiblethis technology could also be used to separate shreddedplastics from ELV.
Research at the University of Brighton demonstrated thatpolyolefins could be separated from shredder residue by afloat-sink process. It was also shown that polypropylenerecovered manually from shredder residue can bereprocessed into viable products with good mechanicalproperties. This has not yet, however, been achieved atindustrial levels (Singh et al 2001).
Plastics in the electrical and electronic sectorDifferent types of plastic-from-plastic and plastic-from-metalseparation technologies exist that may lead to economicallyfeasible recycling (Hendrix et al 1996, appendix B). It isprobable that a combination of technologies would berequired to successfully identify, separate and recycleplastics from WEEE.
The two identification systems, Tribopen and Polyana,developed by Ford to aid in the identification of plasticsat the dismantling stage, are also useable in the contextof WEEE.DARP Environmental, funded by the DTI’s Smart Awardscheme, is developing a series of processes that they claimwill be able to turn WEEE into marketable materials. On theirwebsite (http://www.darp3.co.uk) they state that they will be
Appendix C
62 plastics in the UK economy

able to demonstrate a full-scale commercial plant that willrecycle all waste electrical goods in 2004 (DARPEnvironmental Ltd 2002b).
As in the automotive sector, emphasis has been placed onthe extraction of polypropylene, as this comprises thelargest fraction of WEEE, often shredded in the samefacilities. The technologies designed to sort plastics fromshredder residue mentioned in the above section areapplicable to WEEE plastics.
Plastics in the building and construction sectorMechanical recycling is common in the UK, but a technologyhas also been developed specifically for the recycling ofPVC. Known as Vinyloop the process is equivalent tomechanical recycling so far as current legislation isconcerned and deserves mention here due to the prevalenceof PVC in the construction industry.
The Vinyloop process allows the regeneration of the PVCcompound contained in composite structures that isimpossible to recuperate using traditional methods. From atechnological point of view, the process allows compositescontaining levels of PVC as low as a couple of percent tobe processed, however, in the current state ofdevelopment, an annual average PVC content of 85% isrecommended.
Materials that can be treated by the Vinyloop process fallinto the following five major categories: cables, automobiles,flooring, tarpaulins and rigid products.
The process includes 6 main steps
• pre-treatment of the PVC residues • selective dissolution in a mixture of solvents • separation of the insoluble residues • precipitation of the regenerated PVC compound • drying and conditioning • recovery and recycling of the solvent for reuse
A compound of precipitated PVC is produced, that in manycases can be re-used in its original application. The onlyindustrial plant currently in operation is located in Ferrara inthe north of Italy. The plants nominal annual capacity is10,000 tonnes of raw material of an 85% extractablecompound weight, which represents 8,500 tonnes ofregenerated PVC compound (http://www.vinyloop.com).
The UK PVC industry, under the remit of the BPF VinylsGroup, is investigating the viability of establishing arecycling facility for PVC-rich waste that is either heavilycontaminated or of widely varying quality. The facility isexpected to include the Vinyloop recycling process.The National Centre for Business and Sustainability iscontributing to this work by carrying out a project toidentify the amounts and sources of waste available inthe UK for recycling through the Vinyloop process(http://www.thencbs.co.uk/index_environmental.html).
www.plasticsintheuk.org.uk 63

IntroductionThis report forms part of the Biffaward Programme onSustainable Resource Use and aims to map the movementof plastic materials through the UK economy. Data for thisreport was collected by Valuplast Ltd. The project wasmanaged by Waste Watch.
This report seeks to quantify the mass flows of plasticmaterials between the various industrial and consumptionsectors. Where possible the composition of flows is retainedto provide information on the different polymer types findingtheir way to final disposal and crossing between sectors.
It is beyond the scope of this present work to assess massbalance data for other process flows such as emissions orenergy consumption.
Embodied plastics are not always identified by type so theinput to industry sectors is sometimes used to provideestimates. Where this is the case, appropriate notes areprovided.
Composition is a term used throughout this document torefer to the breakdown of the total plastic flows identifiedinto individual plastic types. Material quantities are stated ineither metric tonnes (t) or thousands of metric tonnes (kt). Allinformation applies to the year 2000.
MethodologyPlastics are found in a wide variety of products whether as aprinciple component, in the form of packaging or both. Everysector in the economy includes in its flows a significantproportion of plastic materials. It can therefore be difficult totrace the quantities and composition in detail.
The most readily available data for plastic refers to the finaldisposal of plastics waste. A large proportion of this ispackaging waste in the domestic stream, but also includesdurable household goods containing plastics.
The packaging wastestream shows the lowest degree ofaccumulation in any sector and products can be expected topass through the supply chain rapidly. It is assumedtherefore that there is no accumulation of plastic packagingin any sector. This assumption cannot be made for other
plastic products. However, accumulation figures can only beestablished when the following information is available:• detailed stock information at the start and end of a period
under consideration• quantities and compositions of plastic materials entering
and leaving the sector• product life-cycle data
The movement of plastics through the economy has additionalflows associated with energy-use in conversion andmanufacture, the use of additives for specific products andvarious other process flows. However, this study is concernedwith the main plastic component of products and a moredetailed analysis is not possible due to limited data availability.
The approach to the problem involved the following stages:
• decide on a flow structure that is representative of theplastic flows through the UK economy
• identify points in the structure where data is available andreview the structure as necessary
• assign the collated quantity and composition data tostreams
• derive information regarding individual sectors
Streams are symbolised by lines that represent movement ofmaterial through the economy and are largely associatedwith distribution, import, export or other transport. Nodes arethe focus of stream movements and can be related toindustrial and consumption centres, disposal methods, etc.Unless otherwise stated the data used was obtained fromPost Use Recycling of Plastics (Valuplast Ltd 2002)(Reference [1]). Source points in the document are notedbelow.
Model StructureA generic structure was prepared but it was found necessaryto adapt this for some of the sectors analysed particularlywhere more detailed data was available. The structureprovides a model for the flow of plastics through the UKeconomy with an allowance for import and export of primarymaterials, products and components.
Appendix D
Plastics mass balance UKA report produced by Bowman Process Technology
1 The term composition is used throughout this document to refer to the breakdown of the total flows of plastics categorised by individualtypes of plastics.
2 For example antioxidants, compatibilisers, plasticisers, fillers etc.
64 plastics in the UK economy

There is limited information available for the consumptionof primary plastics by all UK sectors, which is representedin Figure 2.
The data shows that 4,130,000t of plastics were consumedby the UK economy in 2000. After deducting the import andexport of products and components containing plastics,there is a net import of 320,000t of plastic. This results in4,450,000t of plastics being used by what may be
considered a UK consumption sector. When specificapplications are considered streams on the structure arenumbered for reference purposes wherever there is dataavailability. The structures are presented below for eachsector that was sufficiently defined by the data.
In order to identify streams uniquely, the sector/type of use is identified by a prefix followed by the stream numberindicated on the flow diagrams. For example stream 5 in thepackaging structure is referred to as P-05, stream 2 in theconstruction structure would be C-02 etc.The sector prefixes are as follows:
Table 1 - sector stream prefixes
type of use/sector prefix
agricultural A
building and construction C
electrical and electronics E
vehicles parts/accessories MC
packaging P
Figure 2 - structure for plastic consumption by all sectors
Figure 1 - generic mass balance structure
www.plasticsintheuk.org.uk 65

Plastics in the packaging sectorThe structure has been modified to show the relationshipsbetween the converters, packer/fillers and thewholesale/retail sections of the economy.
Figure 3 shows the quantities of primary plastic materialsand their general use and current disposal routes. Thestructure has been expanded in Figure 4 to show therelationships during the consumption stage greater detail.
Data available on the composition of streams vary widely. In
some cases only the quantity of material can be provided, inothers a breakdown of the overall quantity of individual polymer types has been from the data and in anothercategory it has been possible to estimate composition fromknowledge of the material and industries involved. Thisapplies to all sectors and details of estimations ofcomposition made that were not explicitly provided inPlastics in the UK economy (Reference [1]) are listed in theAppendix. Table 3 shows the stream references for plasticpackaging together with the mass flow and whether or notcomposition data is known.
Figure 3 - structure of plastic packaging sector - primary plastics
66 plastics in the UK economy

Figure 4 - structure of plastics packaging from converters through to consumption
www.plasticsintheuk.org.uk 67
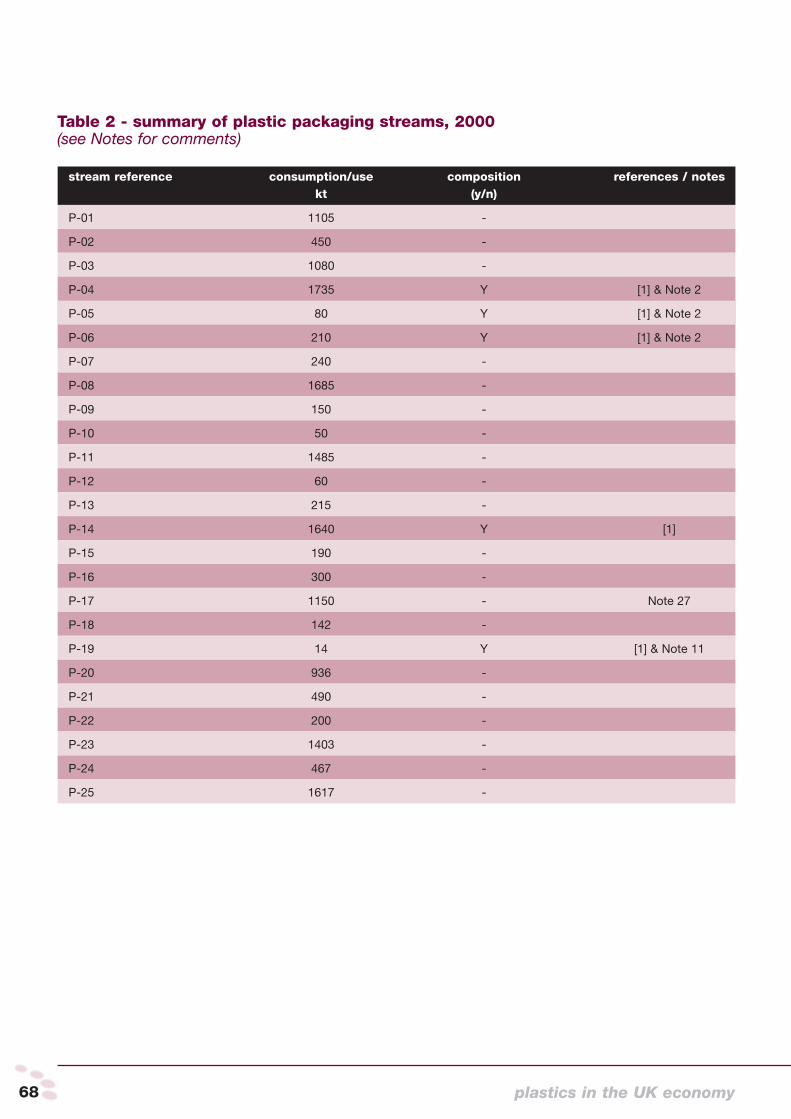
Table 2 - summary of plastic packaging streams, 2000(see Notes for comments)
stream reference consumption/use composition references / noteskt (y/n)
P-01 1105 -
P-02 450 -
P-03 1080 -
P-04 1735 Y [1] & Note 2
P-05 80 Y [1] & Note 2
P-06 210 Y [1] & Note 2
P-07 240 -
P-08 1685 -
P-09 150 -
P-10 50 -
P-11 1485 -
P-12 60 -
P-13 215 -
P-14 1640 Y [1]
P-15 190 -
P-16 300 -
P-17 1150 - Note 27
P-18 142 -
P-19 14 Y [1] & Note 11
P-20 936 -
P-21 490 -
P-22 200 -
P-23 1403 -
P-24 467 -
P-25 1617 -
68 plastics in the UK economy

Figure 5 - structure of plastics packaging from converters through to consumption
Streams P-22 to P-25 include packaging and non-packaging plastics materials and comprise the plastic waste fromhouseholds in the UK. Figure 5 shows this with a breakdown of the packaging content.
www.plasticsintheuk.org.uk 69
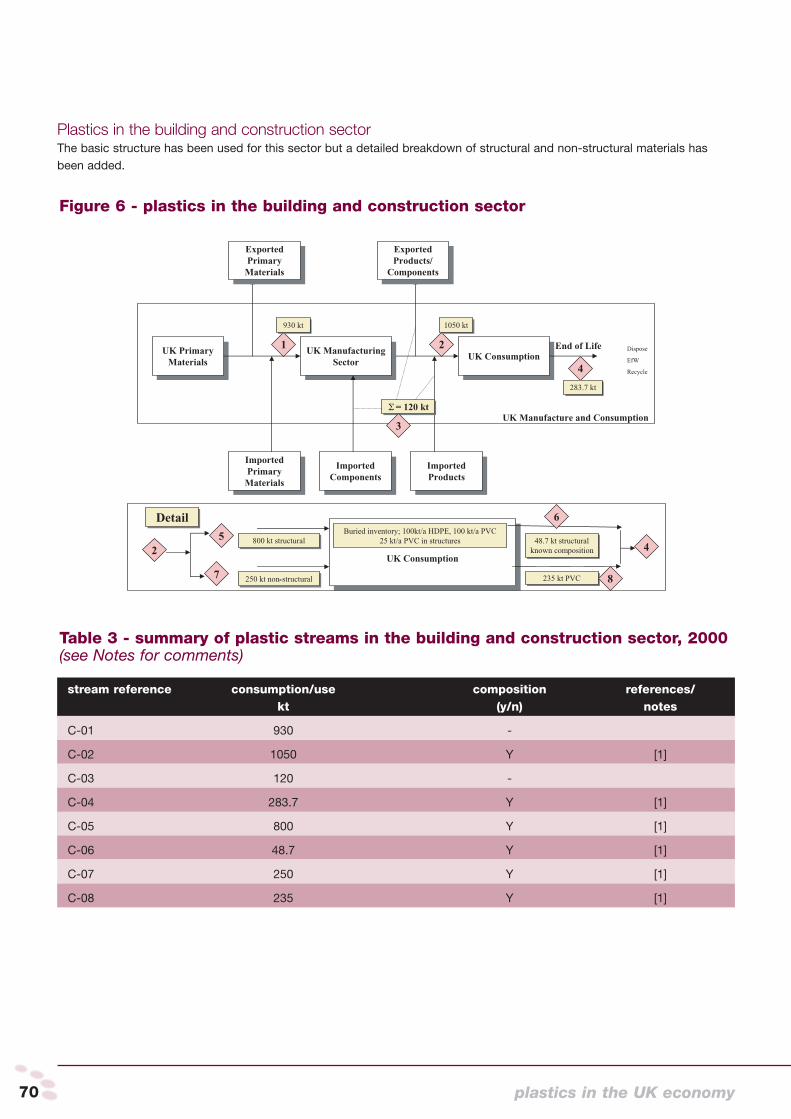
Plastics in the building and construction sectorThe basic structure has been used for this sector but a detailed breakdown of structural and non-structural materials hasbeen added.
stream reference consumption/use composition references/kt (y/n) notes
C-01 930 -
C-02 1050 Y [1]
C-03 120 -
C-04 283.7 Y [1]
C-05 800 Y [1]
C-06 48.7 Y [1]
C-07 250 Y [1]
C-08 235 Y [1]
Figure 6 - plastics in the building and construction sector
Table 3 - summary of plastic streams in the building and construction sector, 2000(see Notes for comments)
70 plastics in the UK economy
Plastics in the electrical and electronics sectorThe basic structure has been used for this sector. Composition data are not available.
stream reference consumption/use composition references/kt (y/n) notes
E-01 315 -
E-02 355 -
E-03 40 -
E-04 200 -
Figure 7 - plastics in the electrical and electronics sector
Table 4 - summary of plastic streams relating to electrical/electronic sector, 2000(see Notes for comments)
www.plasticsintheuk.org.uk 71

Plastics in the automotive sector Information is available for new vehicle registrations and average vehicle life. The plastics content of the average car is alsoknown and can be used to provide some composition information, particularly at for ELV.
stream reference consumption/use composition references/kt (y/n) notes
MC-01 295 -
MC-02 335 Y [1]
MC-03 40 -
MC-04 150 Y [1]
Figure 8 - plastics in the automotive sector
Table 5 - summary of plastic streams in the automotive sector, 2000(see Notes for comments)
72 plastics in the UK economy

Plastics in the agricultural sectorThe agricultural use of plastics is illustrated in Figure 9. It is notable that the waste arisings identified are significantly lowerthan sector consumption. Further research will be needed to identify the disposal routes of materials unaccounted for.
stream reference consumption/use composition references/kt (y/n) notes
A-01 275 -
A-02 310 -
A-03 35 -
A-04 92.7 Y [1] & Note 26
Figure 9 - plastics in the electrical and electronics sector
Table 6 - summary of plastic streams relating to electrical/electronic sector, 2000(see Notes for comments)
www.plasticsintheuk.org.uk 73
Sector, material and product codes Industrial sector codes were obtained from the UK StandardIndustrial Classification of Economic Activities UK (NationalStatistics Office) (Reference [4]). The source and destinationsector for each stream was identified and the appropriatecodes applied. This facilitates the inclusion of the data inthe UK Mass Balance database.
Material and product codes were obtained from the IntrastatClassification Nomenclature 2001 (HM Customs and Excise)(Reference [5]).
Having assigned codes to the range of plastic typesconsidered, to the industrial sectors and to productconsumption sectors, the data for each stream identified inthe balance structure is assigned. By sketching an envelopeover any section of the flow diagram the flows in and out ofthe envelope will be available by considering all streams thatcross the envelope boundary. Certain selections may not beaccessible to analysis, because information is not alwaysavailable. However, the figures in Section 3 can be used toreadily determine where information is available.
A number of problems were encountered in relating productcodes and industrial sectors. This is due to the highlydiverse uses for plastics and their inclusion in many differentassemblies. A good example of this is the building andconstruction sector. An SIC code can be selected thatcovers the manufacture of builders' ware of plastics (within25.23). The CN codes for these materials do notconveniently sit within a grouping that is sufficiently preciseto exclude many non-builders ware products. Suchanomalies will need to be resolved.
Two materials were found not to have specific codes. Thesewere polybutylene terephthalate (PBT) and polyphenylenesulphide (PPS). PBT is chemically related to PET and thecode for PET is 3907 60 (including 3907 60 20 and 3907 6080). There are no assigned codes until 3907 91 for other(unsaturated) polyesters. Series of codes under 3907 70 and3907 80 are presumed to be available. It is suggested that3907 70 be assigned as a CN code for PBT. PPS is moredifficult because there is no clearly related compound listed.Code assignment for PPS needs to be resolved and theassignment for PBT confirmed.
Data availability Plastics in the UK economy has established figures for theusage and disposal of plastic materials for a variety of pointsthroughout the UK economy. The collection and collation ofsuch data is a difficult task not least because the shortage ofreadily available data sources. The document can provide apositive contribution in identifying data gaps andappropriately channelling resources. It is hoped that thegraphic approach used in this document will assist with theidentification of these areas.
This report is based on data provided by earlier stages of theproject. The effort required to obtain such data provides isindicative of the costs necessary to repeat the exercise.Regular collection and collation will be important if the massbalance approach is to endure. The extension andautomation of the process would also be a significantadvance. It is recommended that methods of achieving thisbe investigated.
References [1] Waste Watch & Recoup, Plastics in the UK economy, 2003
[2] BPF Statistics Handbook, Analysis of the Bulk Polymers
Market, 2000
[3] BPF Statistics Handbook, Analysis of the Technical Polymers
Market, 2000
[4] National Statistics Office (Methods and Quality), UK Standard
Industrial Classification of Economic Activities UK SIC(92),
1992
[5] HM Customs and Excise, Intrastat Classification Nomenclature,
2001
[6] Linstead, C and P Ekins, Mass Balance UK - Mapping UK
resource and Material Flows, Royal Society for Nature
Conservation, 2001
74 plastics in the UK economy
Notes
1. Production of primary plastic materials in the UKNo overall or specific production figures have beeninserted. There is some data but it is not available for allpolymers and the UK polymer industry is currentlyundergoing considerable change.
2. ConvertersThe manufacture of plastic packaging goods - 1735ktwere used (of both UK and Import origin). 80kt wererecycled. Consequently the 'used' figure is 1655kt.Composition of waste/recycled streams are assumed thesame as input material. The composition is based on aknowledge of the quantities of bulk polymers used in thesector (References [1] & [2])
3. Packaging plastics (not embodied) to all UK sectorsTotal flux in to 'All Sectors' is interpreted to be import ofplastic packaging materials and is Stream P-07 + P-13.Export is P-06 + P-09 + P-12 , i.e. net +35kt Import.Produced/Extracted is the UK manufacture of packagingmaterials (1655kt).50kt is lost from packer fillers and it is assumed that only50% of this is suitable for recycling. The other 50% goesto final disposal.Final disposal is therefore 50% of P-10 plus P-20 and allof P-16 (i.e. 25+994+300 = 1319kte).Recycled is therefore 50% of P-10 plus all of P-15, P-18and P-19 (i.e. 25+190+142+14=371kt). Note that EfW ofplastic packaging is considered to be recycling.
4. Packaging plastics (not embodied) to themanufacture of plastic packaging goods1655kt of packaging produced in UK, and leaves as totalflux out. % Composition is as supplied material.
5. UK consumption of embodied plasticsConsumption by UK industry of all polymers is availableby polymer. This gives the balance from (Import - Export+ Production). Import and export figures by polymer typeare not normally available.Only net import/export balances are available so no datafor composition or quantity of plastics for imports andexports is available.
6. All embodied plastics to UK manufacturingSimilarly only net import/export data available forembodied plastics to all manufacturing sectors. We donot know if material is embodied or not when it entersthe sector as an import as only net import information isavailable.
7. Not embodied packaging plastics and UKmanufacturingLooks at packaging plastic (not-embodied) enteringpacker/fillers (= all manufacturing) and is stream P-08.50kt is a waste stream of which 50% is recycled and50% is to disposal. Net quantity is embodied in variouspackaged products. Composition is not known.
8. Embodied packaging plastics and UK manufacturingFlux out of the manufacturing sector is taken to be thesum of P-09 (exported packaging, with packagedmaterials) and P-11 the packaging associated withpackaged goods passed on to the retail/wholesale sector.
9. Embodied packaging plastics and UK wholesaleand retailTotal plastic packaging into retail/wholesale. Total flux inis that received from UK packer/fillers (P-11 at 1485kt)and that imported (P-13 at 215kt). Total flux out is P-12and P-14.
10. Packaging plastics and UK householdsTotal flux in is stream P-17. Final disposal is stream P-20.Recycled is the sum of streams P-18 and P-19.
11. Packaging plastics and UK households - bottlesThe quantity of the different polymer bottles that arepresent in household waste have been estimated. [This isbased on the assumption that the composition of therecycled bottles stream is the same as the consumption.stream]. These are embodied plastics i.e. in bottles andother goods as product.The amount of bottle recycling is equal to the sum of thebottles recycled (stream P-19; Recoup information butreferenced from[1]) and the bottles recycled through EfW(within stream P-22). The plastic material to EfW was200kte and bottles represent 319/1617 of the totalstream (assumes no bottle removal from thosecollections that are destined for EfW; 71% assumption/agreement would not be valid if the material wasdepleted of packaging content). Therefore bottles were39.46kt to EfW in 2000. Total bottle recycling was thisplus 14kt, i.e. 53.46kt.Container recycling is only through EfW. There are 287ktof containers in 1617kt of waste. Therefore 287/1617times 200kt are sent to EfW = 35.5kt.For sacks and bags recycling, we assume very low levelsof film recycling to allow estimation of the quantities.Again pro rata the quantities in domestic waste toestimate the sacks and bags that enter EfW. That is177/1617 times 200 are sent to EfW = 22kt in 2000.
www.plasticsintheuk.org.uk 75

12. All primary polymers for the manufacture of builders'ware of plastics930kt of plastic primary materials were used in 2000 tosupply this sector. We enter a figure in the embodiedcolumn if we assume that no supplied material to thesector is wasted or recycled.
13. Specific primary polymers for the manufacture ofbuilders' ware of plasticsWe have no information on the composition of primaryplastic supplied to this sector.
14. Builders' ware of plastic produced in thismanufacturing sector930kt of builders' ware of plastic manufactured.
15. Builders' ware of plastic to all consuming sectorsOnly the balance of import/export is known (120kt,stream C-03). But stream C-02 is defined in volume andcomposition.No builders' ware produced or extracted in consumptionsectors. Disposal is defined by stream C-04. In additionthere is a buried inventory of 100kt/a of HDPE, 100kt/a ofPVC and 25kt/a of PVC "embodied" in structures.
16. Builders' ware of plastic to all consuming sectors -plastic type compositionData is available on the composition of plastic enteringthe consumption sectors for builders' ware of plastics andon the disposal tonnes and composition (Reference [1]).
17. All plastics used in the manufacture of electrical andoptical equipment315kt of primary plastic materials were used by this UKmanufacturing sector in 2000. The composition isunknown.
18. Specific plastics used in the manufacture of electricaland optical equipmentThere is no composition data for this sector. Thebreakdown available expresses the quantities byappliance type not by material content.
19. Electrical equipment supplied to all sectors355kt of plastics are estimated to be components of theelectrical/electronic equipment supplied to consumers inthe UK in 2000. There was disposal of 915kt of wasteelectrical and electronic goods in 2000. 22% of this wereplastics, i.e. 200kt.
20. Electrical equipment supplied to householdsThere is no data that we can use to estimate thehousehold consumption or disposal figure independentof the total.
21. All plastics to the manufacture of parts andaccessories for motor vehicles and their engines295kt of primary plastic material was supplied to the UKmotor car parts and accessories sector in 2000. Thecomposition is unknown. Low wastage rates areassumed - estimating that 295kt of plastic was embodiedinto car parts and accessories.
22. Specific plastics to the manufacture of parts andaccessories for motor vehicles and their enginesComposition of plastic materials supplied to/used in theUK motor vehicles parts sector are not available.
23. All plastics embodied in motor vehicle consumptionby all sectorsThe plastic content of this category of vehicle andassociated components entering service in 2000 was335kt. The end of life content was 150kt. Indicates anaccumulation in stock. The plastic type breakdown isalso available. Although the quantity of vehiclecomponents recycled and disposed of are not known itcan be assumed that recycling of plastic content is low.Therefore it is estimated that 150kt of plastic content invehicles from this sector were disposed of in 2000.
24. Specific plastics embodied in motor vehicleconsumption by all sectorsComposition data is available for the plastic content ofvehicles. The above is applied for each plastic resin inthe sector. Current plastic content is assumed to apply toall ELV.
25. All plastics consumed in the agricultural/horticultural sector310kt of plastic product content was supplied to the UKagricultural and horticultural sector in 2000. 92.7kt isrecognised at end of life for these materials in 2000.Recycling is assumed to be very low allowing an estimateof 92.7kt disposal to be made. The sector requiresadditional analysis and tracing to identify the fate of thebalances - in part assumed to be embodied in variousplant and equipment and at other sector establishments.
76 plastics in the UK economy
26. All plastics consumed in the agricultural/horticultural sectorSome assumptions have been made about thecomposition of material disposed of by this sector andbased on the table presented on page 30 of the Post UsePlastics Recycling - Best Practice Guide. It is assumedthat 90% of the material is in the form of variouspolyethylenes, 5% is PVC and 5% polypropylene.Flux in by plastic type cannot be specified. It is assumedthat recycled quantities are small and can be ignored
27. Domestic plastics wasteThe quantity of plastic packaging in domestic waste hasbeen derived from a two sources.1,208kt was calculated from Local Authority data(obtained from reference [1] and scaled up to UK widefigures from information per household p.13)1,105kt from the plastics packaging section in Reference[1] - originating from considerations by the Valuplast DataGroup.
The packaging plastic data for the domestic stream foreach plastic material has been adjusted pro rata to agreein total terms with the 1,105kt figure. The figures were inreasonable agreement in any case but the lower figurewas chosen because research has shown thatinformation from waste analysis overestimates quantitiesslightly due to contamination of the measured material byother wastes.
www.plasticsintheuk.org.uk 77
References
www.plasticsintheuk.org.uk 79
ReferencesACORD (2000) ACORD Interim Report: Motor Show 2000
ACORD (2001) ACORD 2001 Report
ACP (2001) Report of the Task Force of the Advisory Committee on Packaging, DEFRA
APC (2000) Plastics from Residential Electronics Recycling
Amner, Prof. (2002) Sector expert comment from Ford
Anderson M, Conroy A & Tsiokou C (2002) Construction Site Packaging Wastes: A Market Position Report, BRE
APME (1998) Weighing up the Environmental Balance, APME/PWMI
APME (1998a) Plastics: A Material of Choice in Building and Construction: Plastics Consumption and Recovery in Western Europe 1995
APME (1998b) Press release: Plastics use in building and construction to rise to 8 million tonnes by year 2010
APME (1999) Plastics: A Material of Choice for the Automotive Industry
APME (2000) APME’s Position on the Proposal for a Directive on Waste Electrical and Electronic Equipment
APME (2000) Building and Construction Communique: PVC Recycling – Closing the Loop
APME (2001) Plastics: A Material of Innovation for the Electrical and Electronic Industry
Arola D F, Allen L E, Biddle M B & Fisher M M (1999) Plastics Recovery from Electrical and Electronic Durable Goods: An Applied
Technology and Economic Case Study, APC
Barnetson A (2002) Personal communication
Barnetson A (2002) Presentation to RECOUP Plastics Recycling Conference, March 2001
Biddle M (2002) Sector expert comment from MBA Polymers
Biott J (2002) Sector expert comment from DEFRA
Boustead I (1996) Eco-Profiles for the European Plastics Industry Report 9 - Polymer Conversion, APME
Boustead I (2001) Recycling PET & HDPE, Petcore & APME
BRE (2002) Factsheet: Certification of Recycled Construction Products
Burstall M (2002) Sector expert comment from BPF Recycling Council
CAPITEC (2000) Healthcare Waste Minimisation - A Compendium of Good Practice, Crown copyright
CECET (1997) Evaluation of the Texaco Gasification Process for Treatment of Mixed Plastic Household Waste
CIRIA (1998) Waste Minimisation and Recycling in Construction – Design Manual
Coleman T (2002) Life Cycle Assessment – Disposal of End-Of-Life Vehicles, The Environment Agency
Cousins K (2002) Polymers in Building and Construction, Rapra Technology Ltd
Dabekaussen R (2002) Sector expert response from Auto Recycling Nederland
DARP Environmental Ltd (2002a) WEEE Remarket: An Investigation into the Remarketing White Goods Parts
DARP Environmental Ltd (2002b) Recycling Technology
Davidson Dennis Consulting (1999) "On Farm" Pesticide Contamination – Possible Solutions, British Agrochemicals Association
Davidson P (2002) Personal communication
Davies K (2002) ADAS presentation at RECOUP 'Recycled Plastics' conference
Davis P (2002) Steering Committee Review Meeting 15th October 2002, BPF representative
DEFRA (2002) Press Release: Packaging Waste Recycling Targets to Remain Unchanged Pending Review
DEFRA (2001) UK Comments on the European Commission’s Green Paper: Environmental Issues of PVC
DEFRA (2002) Life Cycle Assessment of Polyvinyl Chloride and Alternatives: Summary Report for Consultation
DTI (2000) Unwanted Computer Equipment: A Guide to Re-use
Douglas I, Garvin S, Lawson N, McGrath C, Manning D & Vetterlein J (2000) Recycling Construction and Demolition Waste – a United
Kingdom Perspective, BRE and University of Manchester
Downs M (2002) WEEE and RoHS Directives – Outcome of the Conciliation Process, DTI
EDIE Newsroom (2002) Construction firms need to clean up their act, EDIE weekly summaries 18/10/2002
End-of-life Vehicle Directive (ELV) (2000/53/EC)
EA (2002) Guidance on the Recovery and Disposal of Ozone Depleting Substances in Fridges
Enviros (2002) Potential Markets for Waste Electronic and Electrical Equipment (WEEE), London ReMade
EPS Group (1997) White Magic - EPS Recycling in Action, BPF
EC (2000a) Environmental Issues of PVC
EC (2000a) Proposal for a Directive of the European Parliament and of the Council on the Restriction of the Use of Certain Hazardous
Substances in Electrical and Electronic Equipment (RoHS)
EC (2000b) Mechanical Recycling of PVC Wastes
EC (2000b) Proposal for a Directive of the European Parliament and of the Council on Waste Electrical and Electronic Equipment (WEEE)
EC (2000c) Chemical Recycling of Plastics Waste (PVC and Other Resins)
EC (2000d) The Influence of PVC on the Quantity and Hazardousness of Flue Gas Cleaning Residues from Incineration
EC (2000e) The Behaviour of PVC in Landfill
EC (2001) Working Paper for a Directive of the European Parliament and of the Council on the Impact on the Environment of Electrical and
Electronic Equipment
EC COM 463 final (1998) The Competitiveness of the Recycling Industries
European Parliament Environment Committee (1996) The Recycling Industry in the EU: Impediments and Prospects
Foster S & Simmons A (2002) Survey 2002 - Providing a Comprehensive Overview of Plastic Bottle Recycling in the UK, RECOUP

80 plastics in the UK economy
Freising (1999) Thermische Verwertung Heizwertreicher Abfälle in der Müllverbrennungsanlage Borsigstrasse in Hamburg, Fraunhofer
Institute Hamburg
Hendrix J, Massey K A, Whitham E, Bras B and Russell M D (1996) Technologies for the identification, separation and recycling of
automatic plastics
Holland J, Wood A (1996) A Comparative Study of the Energy Required in Recycling Post-Consumer Plastic Bottles and Virgin Polymer
Production, Reprise
Incpen (2001) Towards Greener Households - Products Packaging and Energy
ICER (2000) UK Status Report on Waste from Electrical and Electronic Equipment
ICER (2002) ICER Update Autumn 2002
Jenseit W, Stahl H, Wolny V and Wittlinger R, (in preparation) Eco-efficiency Assessment of Recovery Options for Plastic Parts from End-
of-life Vehicles, APME
Jervis P (2002) Sector expert comment from BPF
Jones N, Harrison D, Billett E and Chiodo J (2002) Active automotive disassembly using smart materials, Recycling International,
Vol. March 2002, No.2, pp. 48-49
Le Borgne R, Feillard P(2001) ‘End-of-Life of a Polypropylene Bumper Skin’, The International Journal of Life Cycle Assessment, Vol. 6 (3),
pp. 167-176.
Leisure and Outside Furniture Association (2002) Personal correspondence
Lunnon A. (2002) Sector expert comment from DTI
Marcus Hodges Environment Ltd (2001) Towards Sustainable Agricultural Waste Management, EA
Matthews V (1998) Life Cycle Assessment - LCA and the PET Bottle
Mayne N (2002) Sector expert response from APME
McKinley S (2002) Written Evidence to House of Lords Select Committee into Packaging and Packaging Waste, HL Paper 166
M.E.L Research (2002) UK Average for Wheeled Bin Authorities
NHS Estates (2002) (www.nhsestates.gov.uk/sustainable-development)
Nixon C, Linpac (2002) presentation at RECOUP Conference, Durham
Nosker T (2001) Personal correspondence
Otto B (1999) Recycling and Recovery of Plastics from Packaging in Domestic Waste: LCA-type Analysis of Different Strategies Summary
Report, TUV-Verlag GmbH
Perchard D (2002) Written Evidence to House of Lords Select Committee into Packaging and Packaging Waste, HL Paper 166
Picot P (2002) Sector expert comment from IXAS Conseil
PIFA (2002) Annual Review 2001
PricewaterhouseCoopers (2002) Environmental Life Cycle Assessment and Financial Life Cycle Analysis of the WEEE Directive and its
Implications for the UK, DTI
Priestman T, Peterborough NHS Trust (2002) Personal communication
R T Online (2002) China to Recycle Shredder Residue
Robson S (2002) Sector expert comment from BPF Automotive Recycling Council
Russell D (1996) Recycling Polystyrene and its Environmental Benefits, BPF
Russell D, O'Neill J and Boustead (1994) Is HDE Recycling the Best Deal for the Environment, DOW Europe
Sale J (2002) BPI presentation at RECOUP 'Recycled Plastics' conference
Schäper S (2001) Experiences of an Automotive OEM in Plastics Recycling / Unattended Side-Effects of the EU End-of-Life Vehicle
Directive, Identiplast
Scheirs J (1998) Polymer Recycling: Science, Technology and Applications, John Wiley & Sons
Simmons A (2000) Affordable Plastic Bottle Recycling, RECOUP
Singh M M, Williams K S, Hooper R and Harder M K (2001) Proving the Principle – Recovery of Plastics from Shredded ELV, Engineering
for Profit from Waste, VI International Conference, December 2001
Smith B (2002) 3rd draft plastics recycling report (unpublished), Valuplast
SI 2002 No. 528 The Environmental Protection (Controls on Ozone-Depleting Substances) Regulations 2002
Stokes P (2002) Sector expert comment from CARE Group
Sullivan J L (1998) Life Cycle Inventory of a Generic U.S. Family Sedan – Overview of Results, USCAR / AMP Project, U.S. Automotive
Materials Partnership
Symonds (1999) Construction and Demolition Waste Management Practices and their Economic Impacts, EC
TNO (2000b) Assessing the eco-efficiency of plastic packaging waste recovery, APME
TNO Report R2001/454 (in preparation) Eco-efficiency of Routes for Selected WEEE Products Containing Plastics, APME
TNO (2000a) Best Practices for the Mechanical Recycling of Post-user Plastics, APME
Twede D (1999) Reusable / Returnable plastics: Trends in Great Britain, Michigan State University
Vinyl 2010 (2002) Contributing to Sustainable Development
Wollny V and Schmied M (2000) Assessment of Plastic Recovery Options, Öko-Institut e.v.
Acknowledgments

82 plastics in the UK economy
Professor John Amner, Ford and BPF Automotive Recycling Council
Malcolm Anderson, BRE
Andrew Barnetson, EPS Recycling Group
Mike Biddle, MBA Polymers
James Biott, DEFRA
Mark Burstall, BPF Recycling Council
Paul Creary, DTI
Raf Dabekaussen, Auto Recycling Nederland
Paul Davidson, WRAP
Peter Davis, BPF
Mark Downs, DTI
David Eggleston, Linpac
Kelvin France, Cleanaway
Dr Richard Hooper, University of Brighton
Paul Jervis, BPF
Andrew Lunnon, DTI
Pauline MacDougal, Save-a-Cup Recycling
Neil Mayne, APME
Patrick Peuch, BP Amoco
Jim Pugh, PIFA
Sue Robson, PRoVE Project and BPF Automotive Recycling Council
Andrew Simmons, RECOUP Ltd
Clare Snow, ICER
Peter Stokes, CARE Chairman
Nick Takel, Bowman Process Technology
Ivan Vanherpe, SALYP
Tony Weatherhead, Ford/CARE
Vivien Williams, Dixons
Louise Wolfenden, Environment Agency
Waste Watch would also like to thank the following for their assistance with the study:
Biffaward, for providing the main project funding through the Landfill Tax Credits Scheme; RPC Containers, Linpac Plastics,BP Chemicals and the Plastics, Packaging and Industrial Films Association (PIFA), for providing third party funding; membersof the project Steering Group, for advice and support; and the local authorities participating in the project by providing data.The Steering Group consisted of representatives from the following organisations: Association of Polymer Manufacturers inEurope (APME), BP Chemicals, British Plastics Federation (BPF), Department of Trade and Industry (DTI), EnvironmentAgency, Linpac Plastics, PIFA, Recoup, Valuplast and Waste and Resources Action Programme (WRAP).
Waste Watch would like to thank the following for their photographic contributions to this report: Sandretto Plastics ArtMuseum, Duales System Deutschland AG, Deutsche Gesellschaft für Kunststoff-Recycling mbH, BPI Agri.
Cover image: Sculpture made from polymethylmethacrylate by Eugenio DeganiCourtesy of the artist/Sandretto Plastics Art Museum
Acknowledgments

© Waste Watch & Recoup, 2003Design: Banjo Design & Print Limited

Waste Watch96 Tooley StreetLondon SE1 2TH020 7089 2100
www.wastewatch.org.uk