plantweb performance advisor product data sheet ... - … · plantweb performance advisor product...
TRANSCRIPT

Plantweb Performance Advisor Product Data SheetJune 2017
Plantweb™ Performance Advisor
Real-time equipment performance health feedback integrates with process automation so you can run your plant with confidence
■ Achieve and maintain optimum equipment performance
■ Track key performance indicators in real-time against target operation
■ Quantify thermodynamic efficiency losses
■ Prioritize and plan maintenance activities
■ Determine the root cause of production ineficiencies
IntroductionThe performance of all critical equipment will deteriorate over time, resulting in lost efficiency, increased energy usage, and reduced throughput. Identification of the deviation from equipment design, combined with early detection, is vital to your plant’s profitability. Knowing the health and performance of your mechanical equipment allows you to be proactive with your operational and maintenance planning instead of reacting to unexpected events.
Plantweb™ Performance Advisor helps you to run your process more efficiently, track operating performance against targets, schedule maintenance activities, and determine the root cause of production asset inefficiencies. When your maintenance and operations staff are alerted to degrading asset performance, critical production decisions can be made to mitigate outages and improve your bottom line.
2www.emerson.com/PlantwebPerformanceAdvisor
Plantweb Performance Advisor Product Data SheetJune 2017
Product Description
Plantweb™ Advisor Suite
Plantweb™ Performance Advisor is part of the Plantweb™ suite of integrated applications that monitor the health, performance and energy intensity for a site’s key production assets. The Plantweb™ Advisor Suite includes the following applications:
■ Performance Advisor – 1st principle thermodynamic modeling comparing actual performance against design expectations
■ Health Advisor – Patented, statistical approach to calculating asset health using equipment sensors as well as process data
■ Energy Advisor – Energy monitoring, consumption modelling, unit/area/site roll-up and tracking, and alerting for overconsumption events
These solutions monitor the mechanical integrity of the assets and flag efficiency deviations that, if not acted upon, often result in an unplanned shutdown.
Real-Time Equipment Performance Monitoring
The real-time information available from Plantweb™ Performance Advisor helps you pinpoint opportunities for performance improvement that would otherwise go unnoticed. Differentiating features add value and knowledge to equipment operation.
■ Ability to apply KPI calculations retrospectively to view historical machinery performance
■ Data connectivity to any historian or DCS regardless of vendor; gather data from multiple sources
■ Intuitive graphical presentation clearly displays current operating point compared to design criteria in both time based, and operating envelope plots
■ Facilitates integration of protection, prediction, and performance information for a complete condition and performance monitoring solution
Flexible Data Connectivity
Plantweb™ Performance Advisor receives measurement input data from existing field instrumentation, web-based data (such as weather information), and user data from manually-entered values. Data can be collected from any manufacturer’s DCS or data historian using standard protocols. This flexibility means that plants with multiple sources of input data and information systems can unify their performance calculations in a single, centralized location.
BenefitsPlantweb™ Performance Advisor calculates thermodynamic- based equipment performance using industry-standard ASME PTC performance calculation techniques to facilitate KPIs and metrics that can be compared to design/baseline to determine “deviation from design” diagnostics for your critical machinery, including turbines, compressors, boilers, pumps and other production assets.
Specific key performance indicators combined with clear graphical operating plots show exactly where the equipment is currently operating versus expected or design condition.
Combining performance data with machinery condition, protection and prediction diagnostics helps your reliability program shift from reactive to proactive operation.
Performance Advisor provides calculated information for common non-exhaustive key equipment types, such as:
■ Compressors – Multi-stage, centrifugal and axial
■ Compressors – Multi-stage, reciprocating
■ Gas Turbines – Mechanical drive, generating
■ Steam Turbines – Mechanical drive, generating
■ Boilers
■ Fired Heaters / Furnaces
■ HRSGs
■ Condensers – Air cooled, water cooled
■ Pumps
■ Cooling Towers
Benefits for the Entire Facility
Operations: Receive real-time feedback of equipment performance to influence control changes and help meet operational production targets.
Maintenance: Experts access in-depth diagnostics to understand degradation trends and status by correlating condition and performance data.
Process Engineers: Identify potential instrument problems, pinpoint degradation sources, and evaluate the effectiveness of cost improvement actions.
Management: Understands financial impact of performance deviations and how it impacts plant operation.
3www.emerson.com/PlantwebPerformanceAdvisor
Plantweb Performance Advisor Product Data SheetJune 2017
Equipment efficiency changes are often tracked down to tenths of a percent, so good input measurements are essential. Plant data can be error-prone. When data is bad, Performance Advisor can be setup to estimate from last good value, a calculated value, or a default value, ensuring the accuracy of the calculations and delivering reliable results. Suspect data is highlighted to the user within the GUI.
Analog Input Filtering
Noisy data from on-line systems often creates issues, particularly for 1st principle, heat-and-material balance models. Plantweb™ Performance Advisor data integrity is ensured through built-in analog input filtering and validation techniques. Analog signals may have a small degree of customizable smoothing applied inside Plantweb™ Performance Advisor to improve performance analysis, particularly when noisy data is present.
A reported “poor” or “suspect” status of any input or substituted value is made visible through the graphic interface, delivering an early warning mechanism for problematic data connectivity or measurement issues. The same techniques can be applied to key results to ensure sensible data is propagated to other systems as required.
Common View of the Truth
Home-grown spreadsheet applications are often used for equipment performance calculations, but most companies find they are cumbersome, hard to maintain, do not usually operate in real-time and have limited users. Plantweb™ Performance Advisor is based on OSIsoft PI, the leading process historian in the continuous industries, with over 10,000 installations and hundreds of thousands of users.
■ Compared to do-it-yourself spreadsheets, Plantweb™ Performance Advisor provides overwhelming benefits.
■ Full-function database and graphics engine which can be completely customized if desired
■ Ability to scale up to hundreds of assets and users
■ Modular structure for easy configuration and expansion
■ Pre-engineered ASME PTC performance calculations for many equipment types
■ Easy comparison to reference operation at “standard conditions”
■ Calculation of the economic impact of degradation
■ Easy data cleaning and validation techniques
■ Able to retrospectively apply performance calculations to historical data
■ Model data smoothing to help understand underlying performance trends
■ Easy-to-use detailed graphical interface and historian capabilities that interface with multiple external data sources
■ Consistent modelling approach for similar units on a site- wide and organization-wide basis
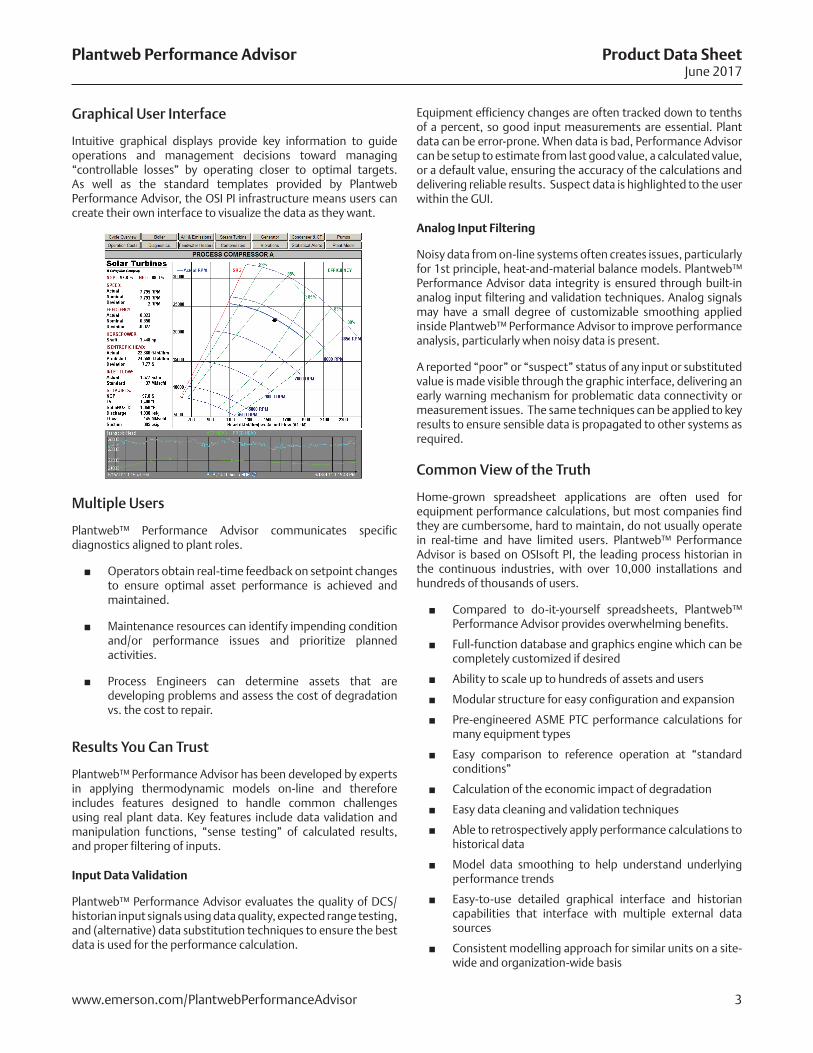
Graphical User Interface
Intuitive graphical displays provide key information to guide operations and management decisions toward managing “controllable losses” by operating closer to optimal targets. As well as the standard templates provided by Plantweb Performance Advisor, the OSI PI infrastructure means users can create their own interface to visualize the data as they want.
Multiple Users
Plantweb™ Performance Advisor communicates specific diagnostics aligned to plant roles.
■ Operators obtain real-time feedback on setpoint changes to ensure optimal asset performance is achieved and maintained.
■ Maintenance resources can identify impending condition and/or performance issues and prioritize planned activities.
■ Process Engineers can determine assets that are developing problems and assess the cost of degradation vs. the cost to repair.
Results You Can Trust
Plantweb™ Performance Advisor has been developed by experts in applying thermodynamic models on-line and therefore includes features designed to handle common challenges using real plant data. Key features include data validation and manipulation functions, “sense testing” of calculated results, and proper filtering of inputs.
Input Data Validation
Plantweb™ Performance Advisor evaluates the quality of DCS/ historian input signals using data quality, expected range testing, and (alternative) data substitution techniques to ensure the best data is used for the performance calculation.
4www.emerson.com/PlantwebPerformanceAdvisor
Plantweb Performance Advisor Product Data SheetJune 2017
■ Flow (measured inside any recycle loops)
■ Temperature – Inlet / Suction
■ Temperature – Exit / Discharge
■ Pressure – Inlet / Suction
■ Pressure – Exit / Discharge
■ Shaft Speed (On Variable Speed Machines)
■ Inlet Gas – Composition
■ Inlet Gas – Density (or Inlet Compressibility)
■ Inlet Gas – Specific Heat (or Ratio of Specific Heats)
Optional Data If Available
■ Exit Gas – Specific Heat
■ Exit Gas – Density (or Compressibility)
■ Shaft Power
■ Shaft Torque
■ Reference Condition – Power
■ Reference Condition – Head
■ Reference Condition – Volume
■ Reference Condition – Density
■ Reference Condition – Speed
* At various operational speeds
** Optional
■ Polytropic Efficiency – Actual
■ Polytropic Efficiency – Design
■ Polytropic Efficiency – Deviation
■ Polytropic Head – Actual
■ Polytropic Head – Design
■ Polytropic Head – Deviation
■ Flow – Volumetric Flow Actual
■ Flow – Mass Flow
■ Shaft Power Consumption (if not measured)
■ Deviation Cost (Lost Throughput and/or Additional Power)
Additional Outputs (data dependent)
■ Efficiency and Head – Adiabatic and Isothermal
■ Power – Design
■ Power – Deviation
■ Compressor Gas Velocities – Inlet and Exit
■ Flow – Mass Design and Deviation
■ Suction Stagnation Conditions
■ Discharge Stagnation Conditions
■ Temperature – Theoretical Rise and Ratio
■ Temperature – Actual Rise and Ratio
■ Pressure – Rise and Ratio
■ Corrected & Normalized – Volume Flow, Head and Power
■ Machine Work Coefficients & Machine Mach Number
NOTE: A turbo-compressor is a turbine module + compressor module
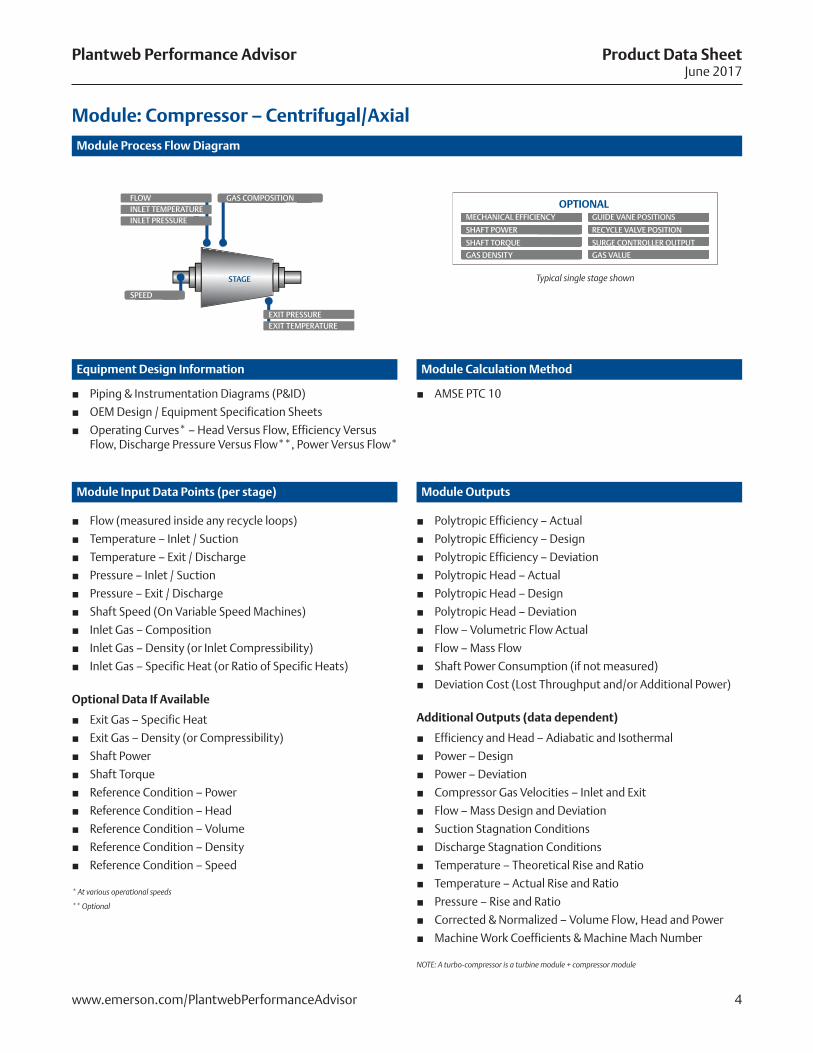
Module: Compressor – Centrifugal/Axial
Module Process Flow Diagram
Equipment Design Information
Module Input Data Points (per stage) Module Outputs
Module Calculation Method
■ AMSE PTC 10 ■ Piping & Instrumentation Diagrams (P&ID)
■ OEM Design / Equipment Specification Sheets
■ Operating Curves* – Head Versus Flow, Efficiency Versus Flow, Discharge Pressure Versus Flow**, Power Versus Flow*
FLOW GAS COMPOSITIONOPTIONAL
Typical single stage shown
MECHANICAL EFFICIENCY GUIDE VANE POSITIONS
SHAFT POWER RECYCLE VALVE POSITION
SHAFT TORQUE SURGE CONTROLLER OUTPUT
GAS DENSITY GAS VALUE
INLET TEMPERATURE
EXIT PRESSURE
INLET PRESSURE
EXIT TEMPERATURE
SPEED
STAGE
5www.emerson.com/PlantwebPerformanceAdvisor
Plantweb Performance Advisor Product Data SheetJune 2017
■ Temperature – Inlet / Suction
■ Temperature – Exit / Discharge
■ Pressure* – Inlet / Suction
■ Pressure* – Exit / Discharge
■ Shaft Speed
■ Inlet Gas – Composition
■ Inlet Gas – Density (or Inlet Compressibility)
■ Inlet Gas – Specific Heat (or Ratio of Specific Heats)
■ Shaft Power
Optional Data If Available
■ Gas Flowrate
■ Discharge Gas – Density
■ Discharge Gas – Specific Heat
■ Temperature – Cooling Jacket Coolant Inlet
■ Temperature – Cooling Jacket Coolant Exit
■ Capacity Control Operation
■ Rod Drop Measurement
* Pressure typically measured at suction/discharge dampener/bottles/drums
■ Swept Volume
■ Clearance – Volume and Percent (Crank End, Head End)
■ Volumetric Efficiency – Actual
■ Volumetric Efficiency – Design
■ Volumetric Efficiency – Deviation
■ Adiabatic Efficiency – Actual
■ Adiabatic Efficiency – Design
■ Adiabatic Efficiency – Deviation
■ Adiabatic Head – Actual
■ Power – Design
■ Power – Deviation from Design Power
■ Flow – Actual Volumetric and Mass
■ Specific Power – per Mass Flow
■ Flow – Design, and Deviation from Design Mass Flow
■ Deviation Cost (Lost Throughput and/or Additional Power)
Additional Outputs (Data dependent)
■ Compressor Gas Velocities – Inlet and Exit
■ Shaft Efficiency
■ Cylinder Suction Internal Conditions
■ Cylinder Discharge Internal Conditions
■ Temperature – Theoretical Rise and Ratio (with and
■ without cooling duty)
■ Temperature – Actual Rise and Ratio
■ Pressure – Rise and Ratio
■ Rod-loads (Head and Crank End)
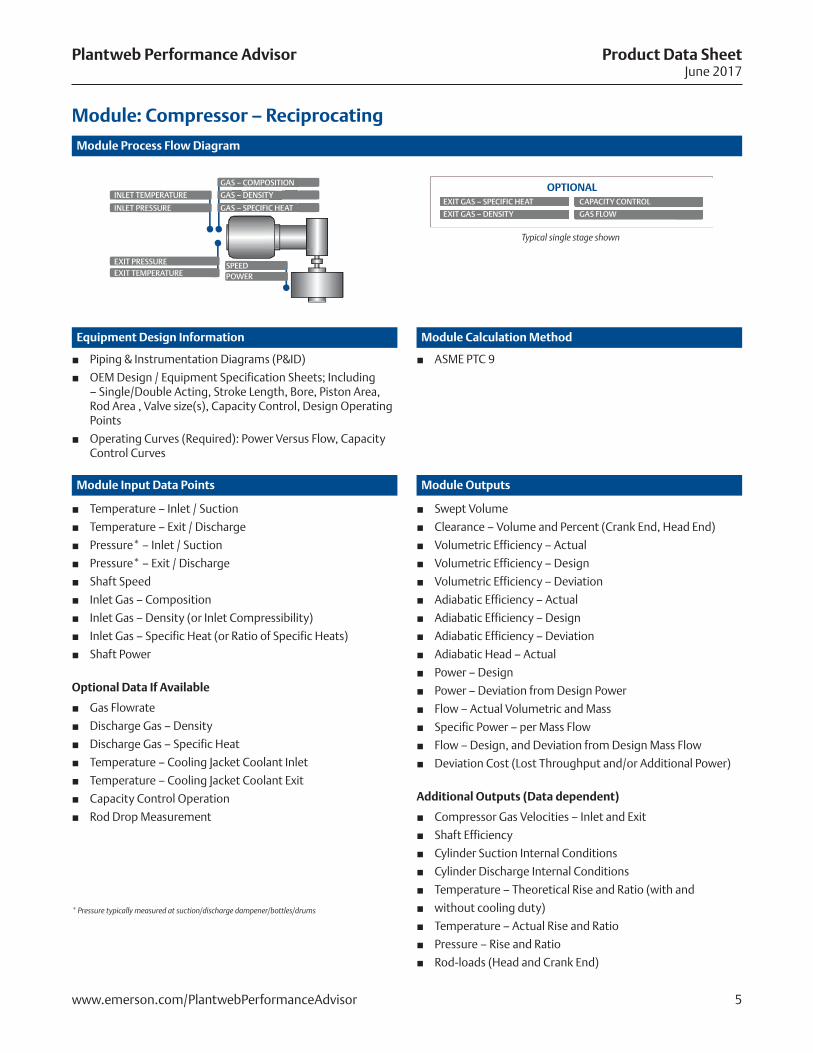
Module Process Flow Diagram
Equipment Design Information
Module Input Data Points Module Outputs
Module Calculation Method
Module: Compressor – Reciprocating
■ ASME PTC 9 ■ Piping & Instrumentation Diagrams (P&ID)
■ OEM Design / Equipment Specification Sheets; Including – Single/Double Acting, Stroke Length, Bore, Piston Area, Rod Area , Valve size(s), Capacity Control, Design Operating Points
■ Operating Curves (Required): Power Versus Flow, Capacity Control Curves
INLET TEMPERATURE
GAS – COMPOSITION
GAS – DENSITY
SPEED
GAS – SPECIFIC HEAT
POWER
EXIT PRESSURE
INLET PRESSURE
EXIT TEMPERATURE
OPTIONAL
Typical single stage shown
EXIT GAS – SPECIFIC HEAT CAPACITY CONTROL
EXIT GAS – DENSITY GAS FLOW
6www.emerson.com/PlantwebPerformanceAdvisor
Plantweb Performance Advisor Product Data SheetJune 2017
■ Flow – Fuel
■ Flow – Fogging / Evaporative Cooling (where present)
■ Flow – Steam Injection (where appropriate)
■ Temperature – Ambient
■ Temperature – Air Inlet
■ Temperature –Exhaust Profile
■ Temperature – Power Turbine Exhaust (as appropriate)
■ Pressure – Ambient
■ Pressure – Compressor Exit
■ Pressure Drop – Inlet Filter(s)
■ Humidity – Ambient
■ Shaft Speed(s)
■ Shaft Power / Torque (MW, MVAR, etc)
■ Fuel Composition
Optional Inputs If Available
■ Flow – Inlet Air and Gas Exhaust
■ Temperature – Fuel
■ Temperature – Tmax or TIT or Turbine First Blade
■ Temperature – Compressor Exit(s)
■ IGV Position(s)
■ Operating Hours / Number Trips / Number Starts
■ Wash Activity / Inlet Heating Activity
■ Stack O2
■ Emissions Analyses (e.g. NOx / SOx / COx)
■ Thermal Efficiency – Actual
■ Thermal Efficiency – Design (Baseline)
■ Thermal Efficiency – Deviation
■ Thermal Efficiency – Corrected
■ Heat Rate – Actual
■ Heat Rate – Design (Baseline)
■ Heat Rate – Deviation
■ Heat Rate – Corrected
■ Power Output – Actual
■ Power Output – Design (Baseline)
■ Power Output – Deviation
■ Power Output – Corrected
■ Deviation Cost (Increased Fuel and/or Reduced Power)
Additional Available Outputs
■ Compressor Efficiency – Polytropic
■ Compressor Temperature Ratio
■ Compressor Pressure Ratio
■ Temperature – Exhaust Spread
■ Temperature Profile – Exhaust Deviation
■ Operating Capacity (% Load, Remaining Power)
■ Correction Factors
■ Full Load Equivalent Power/HeatrateNOTE: A turbo-compressor is a turbine module + compressor module
Module Process Flow Diagram
Equipment Design Information
Module Inputs Module Outputs
Module Calculation Method
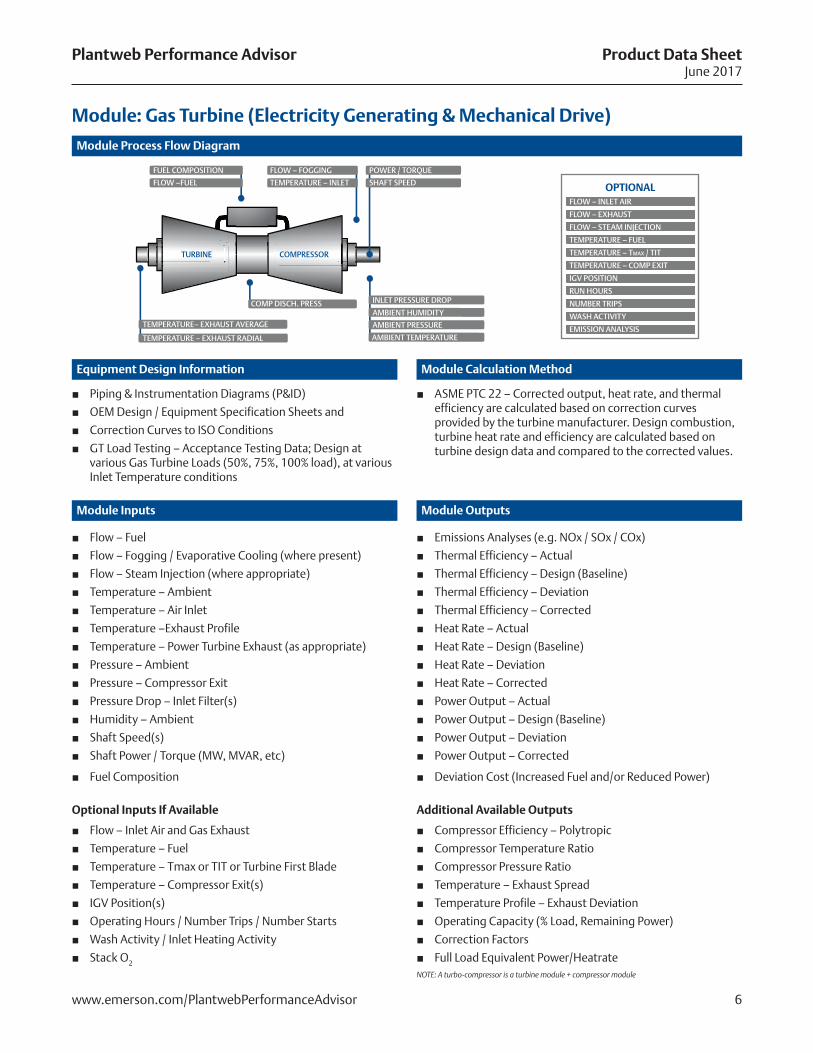
Module: Gas Turbine (Electricity Generating & Mechanical Drive)
■ Piping & Instrumentation Diagrams (P&ID)
■ OEM Design / Equipment Specification Sheets and
■ Correction Curves to ISO Conditions
■ GT Load Testing – Acceptance Testing Data; Design at various Gas Turbine Loads (50%, 75%, 100% load), at various Inlet Temperature conditions
■ ASME PTC 22 – Corrected output, heat rate, and thermal efficiency are calculated based on correction curves provided by the turbine manufacturer. Design combustion, turbine heat rate and efficiency are calculated based on turbine design data and compared to the corrected values.
FUEL COMPOSITION
TEMPERATURE– EXHAUST AVERAGE
TEMPERATURE – EXHAUST RADIAL
COMP DISCH. PRESS INLET PRESSURE DROP
AMBIENT HUMIDITY
AMBIENT PRESSURE
AMBIENT TEMPERATURE
FLOW – FOGGING POWER / TORQUE
FLOW –FUEL TEMPERATURE – INLET SHAFT SPEED OPTIONALFLOW – INLET AIR
FLOW – EXHAUST
FLOW – STEAM INJECTION
TEMPERATURE – FUEL
TEMPERATURE – TMAX / TIT
TEMPERATURE – COMP EXIT
IGV POSITION
RUN HOURS
NUMBER TRIPS
WASH ACTIVITY
EMISSION ANALYSIS
TURBINE COMPRESSOR
7www.emerson.com/PlantwebPerformanceAdvisor
Plantweb Performance Advisor Product Data SheetJune 2017
■ Flow(s) – Stage Inlet
■ Temperature(s) – Stage Inlet
■ Temperature(s) – Stage Exhaust
■ Pressure(s) – Stage Inlet
■ Pressure(s) – Stage Exhaust
■ Turbine Power (MW, Torque, or similar)
Optional Inputs If Available
■ Speed
■ Flow(s) – Extraction
■ Steam Flow(s) – Admission
■ Steam Temperature(s) – Admission
■ Steam Pressure(s) – Admission
■ Feedwater heater flow/temperature(s) for extraction estimation
Module Process Flow Diagram
Equipment Design Information
Module Inputs Module Outputs
Module Calculation Method
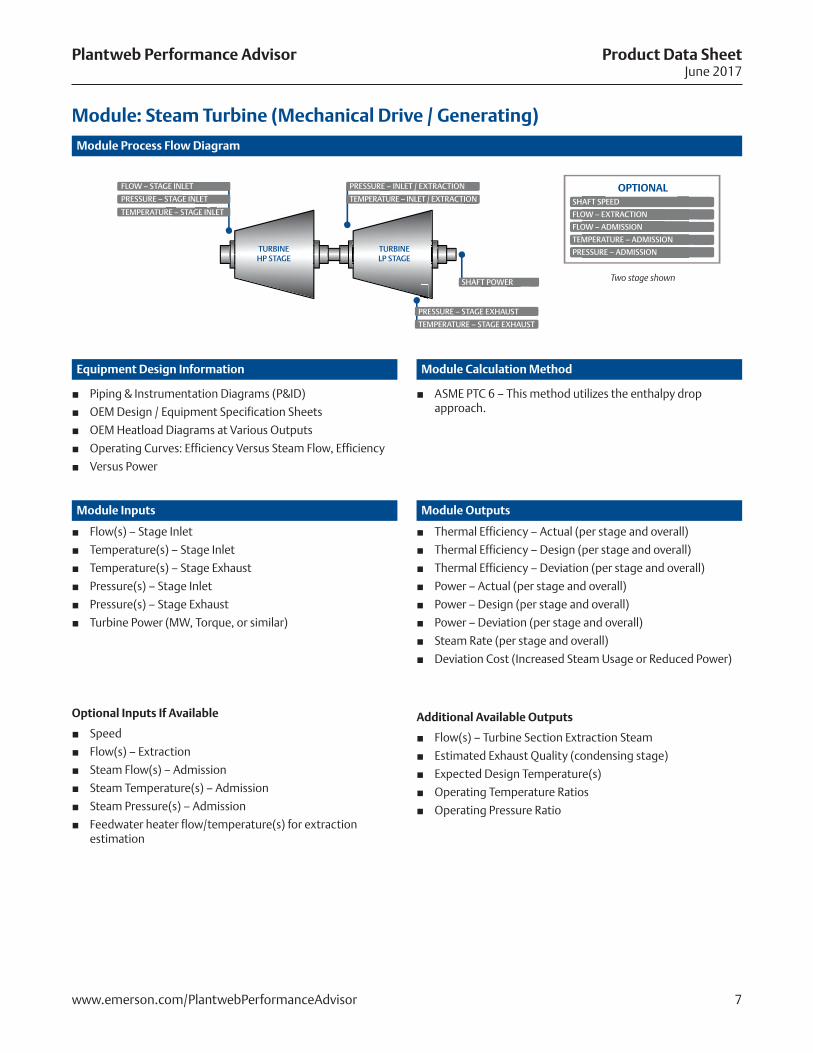
Module: Steam Turbine (Mechanical Drive / Generating)
■ Thermal Efficiency – Actual (per stage and overall)
■ Thermal Efficiency – Design (per stage and overall)
■ Thermal Efficiency – Deviation (per stage and overall)
■ Power – Actual (per stage and overall)
■ Power – Design (per stage and overall)
■ Power – Deviation (per stage and overall)
■ Steam Rate (per stage and overall)
■ Deviation Cost (Increased Steam Usage or Reduced Power)
Additional Available Outputs
■ Flow(s) – Turbine Section Extraction Steam
■ Estimated Exhaust Quality (condensing stage)
■ Expected Design Temperature(s)
■ Operating Temperature Ratios
■ Operating Pressure Ratio
■ ASME PTC 6 – This method utilizes the enthalpy drop approach.
■ Piping & Instrumentation Diagrams (P&ID)
■ OEM Design / Equipment Specification Sheets
■ OEM Heatload Diagrams at Various Outputs
■ Operating Curves: Efficiency Versus Steam Flow, Efficiency
■ Versus Power
FLOW – STAGE INLET
SHAFT POWER
PRESSURE – STAGE EXHAUST
TEMPERATURE – STAGE EXHAUST
PRESSURE – INLET / EXTRACTION
TURBINEHP STAGE
TURBINELP STAGE
TEMPERATURE – INLET / EXTRACTIONPRESSURE – STAGE INLET
TEMPERATURE – STAGE INLETSHAFT SPEED
FLOW – EXTRACTION
FLOW – ADMISSION
TEMPERATURE – ADMISSION
PRESSURE – ADMISSION
Two stage shown
OPTIONAL
8www.emerson.com/PlantwebPerformanceAdvisor
Plantweb Performance Advisor Product Data SheetJune 2017
Module Process Flow Diagram
Equipment Design Information
Module Inputs Module Outputs
Module Calculation Method
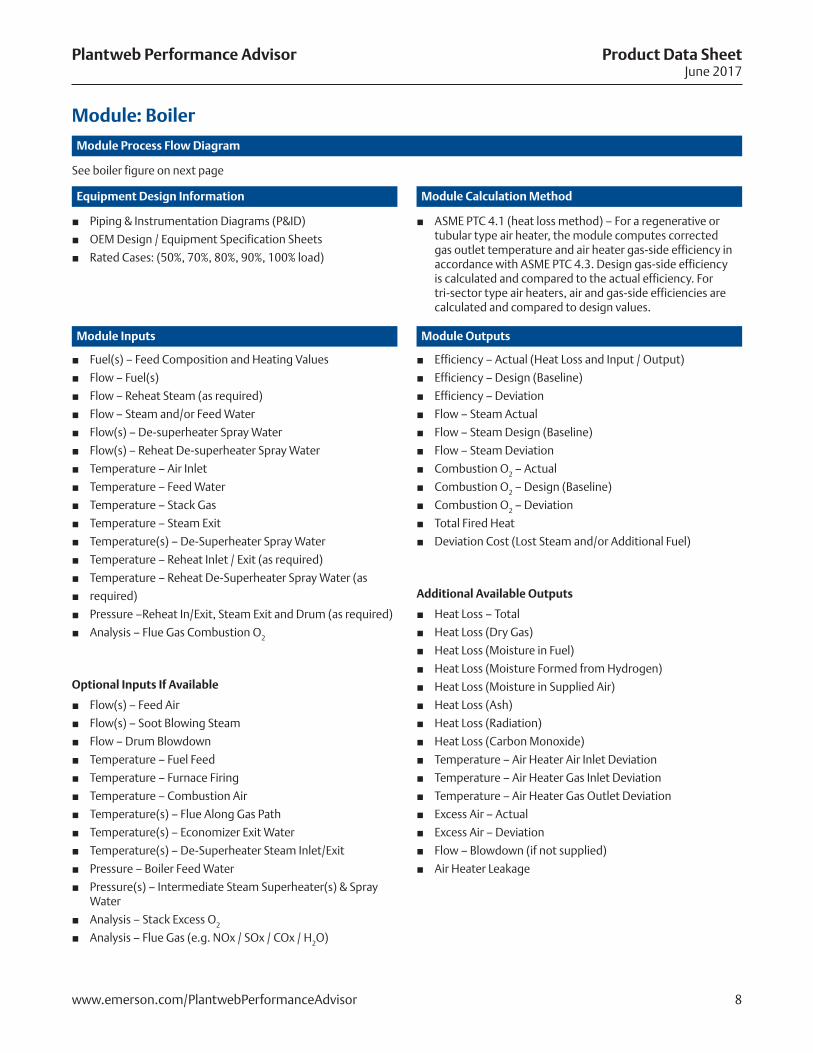
Module: Boiler
See boiler figure on next page
■ Piping & Instrumentation Diagrams (P&ID)
■ OEM Design / Equipment Specification Sheets
■ Rated Cases: (50%, 70%, 80%, 90%, 100% load)
■ ASME PTC 4.1 (heat loss method) – For a regenerative or tubular type air heater, the module computes corrected gas outlet temperature and air heater gas-side efficiency in accordance with ASME PTC 4.3. Design gas-side efficiency is calculated and compared to the actual efficiency. For tri-sector type air heaters, air and gas-side efficiencies are calculated and compared to design values.
■ Fuel(s) – Feed Composition and Heating Values
■ Flow – Fuel(s)
■ Flow – Reheat Steam (as required)
■ Flow – Steam and/or Feed Water
■ Flow(s) – De-superheater Spray Water
■ Flow(s) – Reheat De-superheater Spray Water
■ Temperature – Air Inlet
■ Temperature – Feed Water
■ Temperature – Stack Gas
■ Temperature – Steam Exit
■ Temperature(s) – De-Superheater Spray Water
■ Temperature – Reheat Inlet / Exit (as required)
■ Temperature – Reheat De-Superheater Spray Water (as
■ required)
■ Pressure –Reheat In/Exit, Steam Exit and Drum (as required)
■ Analysis – Flue Gas Combustion O2
Optional Inputs If Available
■ Flow(s) – Feed Air
■ Flow(s) – Soot Blowing Steam
■ Flow – Drum Blowdown
■ Temperature – Fuel Feed
■ Temperature – Furnace Firing
■ Temperature – Combustion Air
■ Temperature(s) – Flue Along Gas Path
■ Temperature(s) – Economizer Exit Water
■ Temperature(s) – De-Superheater Steam Inlet/Exit
■ Pressure – Boiler Feed Water
■ Pressure(s) – Intermediate Steam Superheater(s) & Spray Water
■ Analysis – Stack Excess O2
■ Analysis – Flue Gas (e.g. NOx / SOx / COx / H2O)
■ Efficiency – Actual (Heat Loss and Input / Output)
■ Efficiency – Design (Baseline)
■ Efficiency – Deviation
■ Flow – Steam Actual
■ Flow – Steam Design (Baseline)
■ Flow – Steam Deviation
■ Combustion O2 – Actual
■ Combustion O2 – Design (Baseline)
■ Combustion O2 – Deviation
■ Total Fired Heat
■ Deviation Cost (Lost Steam and/or Additional Fuel)
Additional Available Outputs
■ Heat Loss – Total
■ Heat Loss (Dry Gas)
■ Heat Loss (Moisture in Fuel)
■ Heat Loss (Moisture Formed from Hydrogen)
■ Heat Loss (Moisture in Supplied Air)
■ Heat Loss (Ash)
■ Heat Loss (Radiation)
■ Heat Loss (Carbon Monoxide)
■ Temperature – Air Heater Air Inlet Deviation
■ Temperature – Air Heater Gas Inlet Deviation
■ Temperature – Air Heater Gas Outlet Deviation
■ Excess Air – Actual
■ Excess Air – Deviation
■ Flow – Blowdown (if not supplied)
■ Air Heater Leakage
9www.emerson.com/PlantwebPerformanceAdvisor
Plantweb Performance Advisor Product Data SheetJune 2017
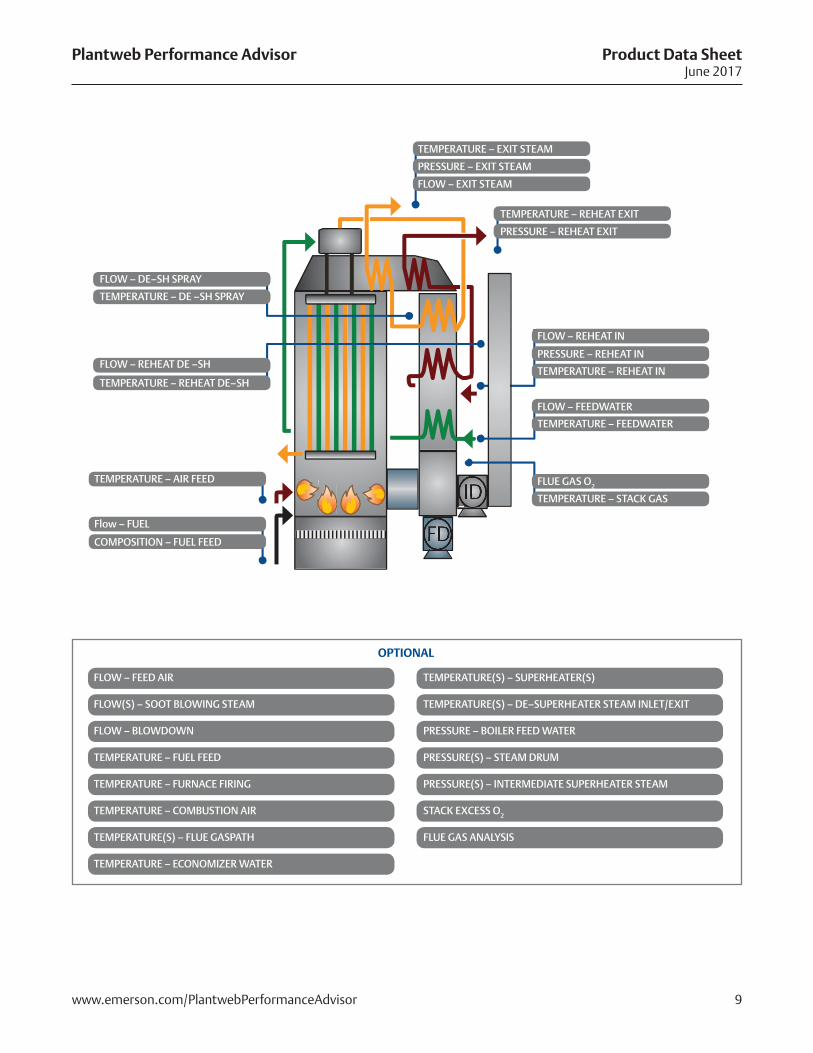
FLOW – DE–SH SPRAY
FLOW – REHEAT DE –SH
Flow – FUEL
TEMPERATURE – DE –SH SPRAY
FLOW – REHEAT IN
TEMPERATURE – REHEAT EXIT
PRESSURE – REHEAT IN
FLOW – FEEDWATER
FLUE GAS O2
PRESSURE – REHEAT EXIT
TEMPERATURE – EXIT STEAM
PRESSURE – EXIT STEAM
FLOW – EXIT STEAM
TEMPERATURE – REHEAT IN
TEMPERATURE – FEEDWATER
TEMPERATURE – STACK GAS
TEMPERATURE – REHEAT DE–SH
TEMPERATURE – AIR FEED
OPTIONAL
FLOW – FEED AIR TEMPERATURE(S) – SUPERHEATER(S)
FLOW(S) – SOOT BLOWING STEAM TEMPERATURE(S) – DE–SUPERHEATER STEAM INLET/EXIT
FLOW – BLOWDOWN PRESSURE – BOILER FEED WATER
TEMPERATURE – FUEL FEED PRESSURE(S) – STEAM DRUM
TEMPERATURE – FURNACE FIRING PRESSURE(S) – INTERMEDIATE SUPERHEATER STEAM
TEMPERATURE – COMBUSTION AIR STACK EXCESS O2
TEMPERATURE(S) – FLUE GASPATH FLUE GAS ANALYSIS
TEMPERATURE – ECONOMIZER WATER
COMPOSITION – FUEL FEED
10www.emerson.com/PlantwebPerformanceAdvisor
Plantweb Performance Advisor Product Data SheetJune 2017
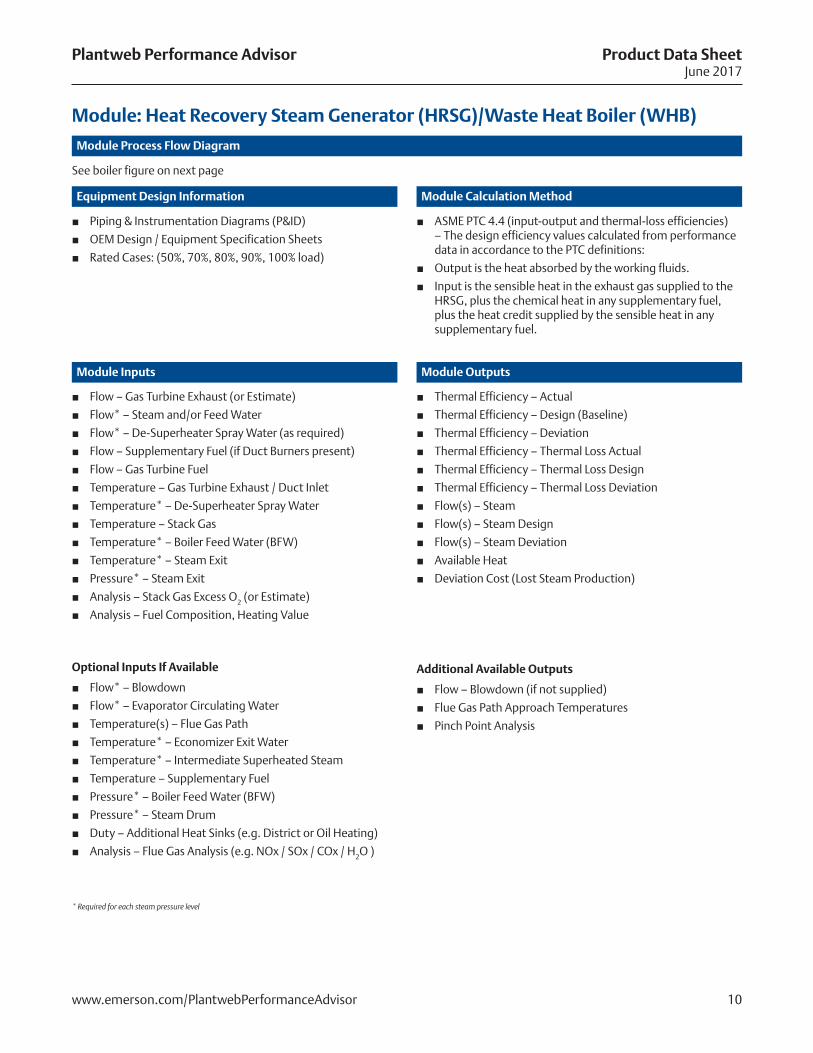
■ ASME PTC 4.4 (input-output and thermal-loss efficiencies) – The design efficiency values calculated from performance data in accordance to the PTC definitions:
■ Output is the heat absorbed by the working fluids.
■ Input is the sensible heat in the exhaust gas supplied to the HRSG, plus the chemical heat in any supplementary fuel, plus the heat credit supplied by the sensible heat in any supplementary fuel.
Module Process Flow Diagram
Equipment Design Information
Module Inputs Module Outputs
Module Calculation Method
Module: Heat Recovery Steam Generator (HRSG)/Waste Heat Boiler (WHB)
See boiler figure on next page
■ Piping & Instrumentation Diagrams (P&ID)
■ OEM Design / Equipment Specification Sheets
■ Rated Cases: (50%, 70%, 80%, 90%, 100% load)
■ Flow – Gas Turbine Exhaust (or Estimate)
■ Flow* – Steam and/or Feed Water
■ Flow* – De-Superheater Spray Water (as required)
■ Flow – Supplementary Fuel (if Duct Burners present)
■ Flow – Gas Turbine Fuel
■ Temperature – Gas Turbine Exhaust / Duct Inlet
■ Temperature* – De-Superheater Spray Water
■ Temperature – Stack Gas
■ Temperature* – Boiler Feed Water (BFW)
■ Temperature* – Steam Exit
■ Pressure* – Steam Exit
■ Analysis – Stack Gas Excess O2 (or Estimate)
■ Analysis – Fuel Composition, Heating Value
Optional Inputs If Available
■ Flow* – Blowdown
■ Flow* – Evaporator Circulating Water
■ Temperature(s) – Flue Gas Path
■ Temperature* – Economizer Exit Water
■ Temperature* – Intermediate Superheated Steam
■ Temperature – Supplementary Fuel
■ Pressure* – Boiler Feed Water (BFW)
■ Pressure* – Steam Drum
■ Duty – Additional Heat Sinks (e.g. District or Oil Heating)
■ Analysis – Flue Gas Analysis (e.g. NOx / SOx / COx / H2O )
* Required for each steam pressure level
■ Thermal Efficiency – Actual
■ Thermal Efficiency – Design (Baseline)
■ Thermal Efficiency – Deviation
■ Thermal Efficiency – Thermal Loss Actual
■ Thermal Efficiency – Thermal Loss Design
■ Thermal Efficiency – Thermal Loss Deviation
■ Flow(s) – Steam
■ Flow(s) – Steam Design
■ Flow(s) – Steam Deviation
■ Available Heat
■ Deviation Cost (Lost Steam Production)
Additional Available Outputs
■ Flow – Blowdown (if not supplied)
■ Flue Gas Path Approach Temperatures
■ Pinch Point Analysis
11www.emerson.com/PlantwebPerformanceAdvisor
Plantweb Performance Advisor Product Data SheetJune 2017
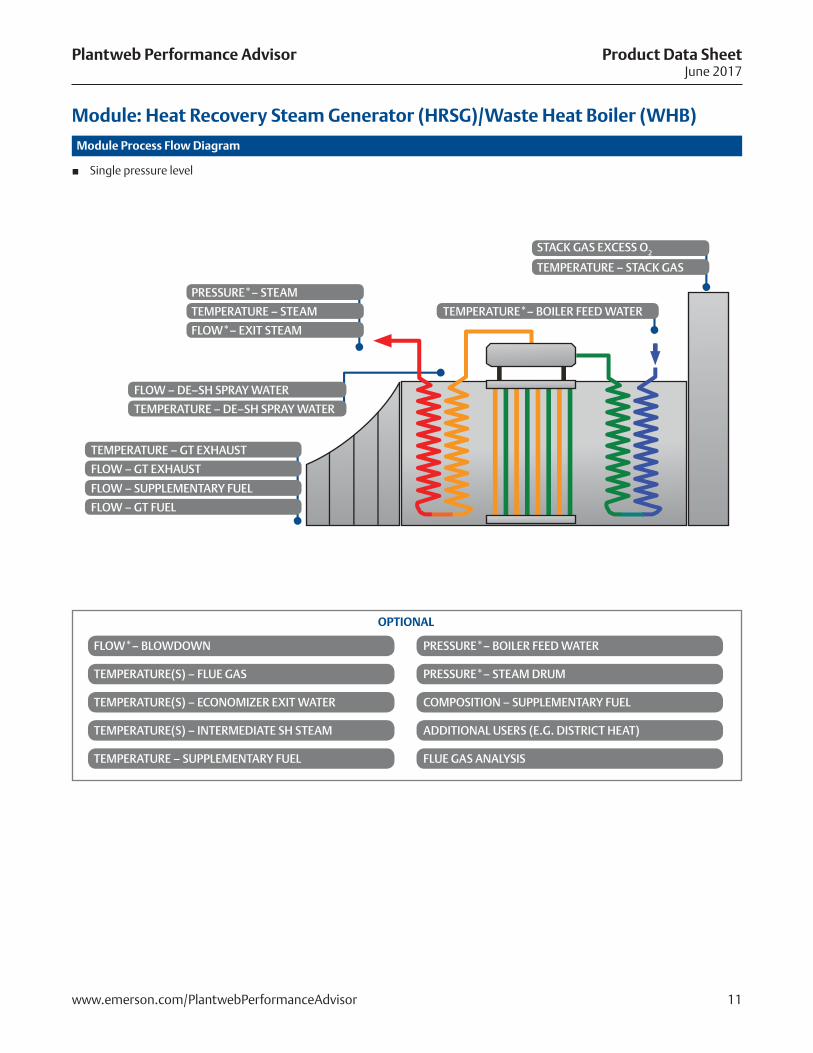
Module Process Flow Diagram
Module: Heat Recovery Steam Generator (HRSG)/Waste Heat Boiler (WHB)
■ Single pressure level
OPTIONAL
FLOW*– BLOWDOWN PRESSURE*– BOILER FEED WATER
TEMPERATURE(S) – FLUE GAS PRESSURE*– STEAM DRUM
TEMPERATURE(S) – ECONOMIZER EXIT WATER COMPOSITION – SUPPLEMENTARY FUEL
TEMPERATURE(S) – INTERMEDIATE SH STEAM ADDITIONAL USERS (E.G. DISTRICT HEAT)
TEMPERATURE – SUPPLEMENTARY FUEL FLUE GAS ANALYSIS
PRESSURE*– STEAM
TEMPERATURE – STEAM TEMPERATURE*– BOILER FEED WATER
STACK GAS EXCESS O2
TEMPERATURE – STACK GAS
FLOW – DE–SH SPRAY WATER
TEMPERATURE – DE–SH SPRAY WATER
TEMPERATURE – GT EXHAUST
FLOW – GT EXHAUST
FLOW – SUPPLEMENTARY FUEL
FLOW – GT FUEL
FLOW*– EXIT STEAM
12www.emerson.com/PlantwebPerformanceAdvisor
Plantweb Performance Advisor Product Data SheetJune 2017
Module Process Flow Diagram
Equipment Design Information
Module Inputs Module Outputs
Module Calculation Method
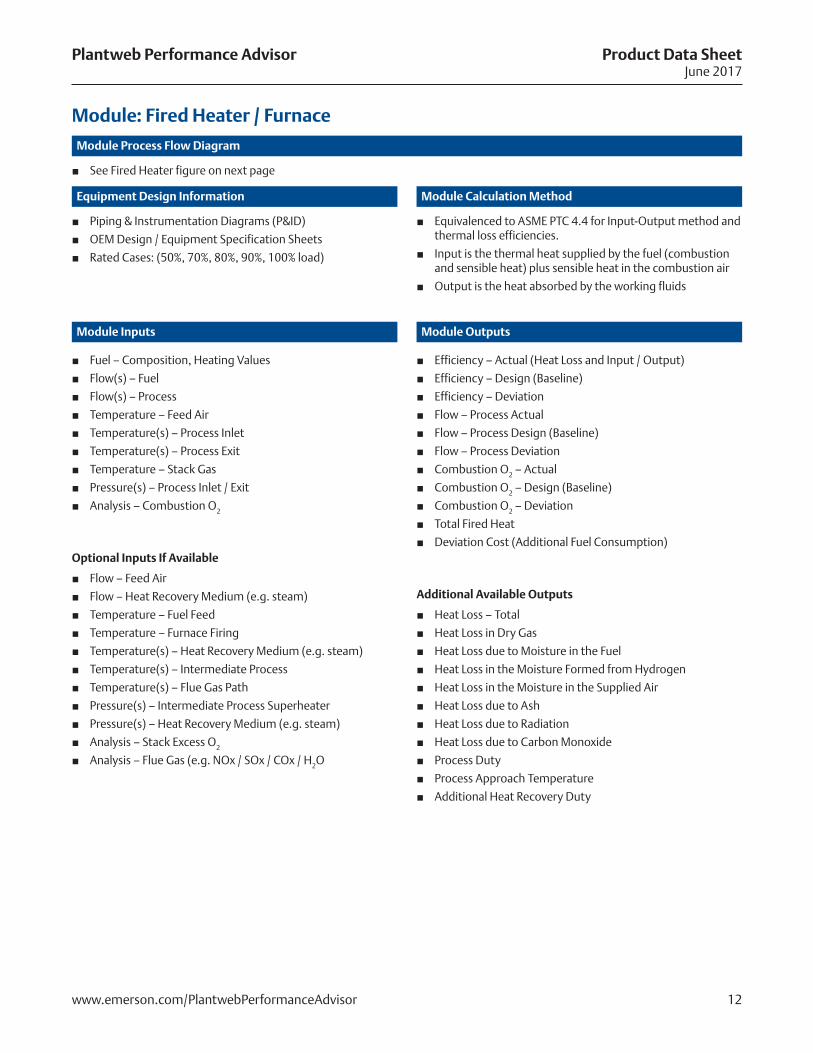
Module: Fired Heater / Furnace
■ See Fired Heater figure on next page
■ Piping & Instrumentation Diagrams (P&ID)
■ OEM Design / Equipment Specification Sheets
■ Rated Cases: (50%, 70%, 80%, 90%, 100% load)
■ Equivalenced to ASME PTC 4.4 for Input-Output method and thermal loss efficiencies.
■ Input is the thermal heat supplied by the fuel (combustion and sensible heat) plus sensible heat in the combustion air
■ Output is the heat absorbed by the working fluids
■ Fuel – Composition, Heating Values
■ Flow(s) – Fuel
■ Flow(s) – Process
■ Temperature – Feed Air
■ Temperature(s) – Process Inlet
■ Temperature(s) – Process Exit
■ Temperature – Stack Gas
■ Pressure(s) – Process Inlet / Exit
■ Analysis – Combustion O2
Optional Inputs If Available
■ Flow – Feed Air
■ Flow – Heat Recovery Medium (e.g. steam)
■ Temperature – Fuel Feed
■ Temperature – Furnace Firing
■ Temperature(s) – Heat Recovery Medium (e.g. steam)
■ Temperature(s) – Intermediate Process
■ Temperature(s) – Flue Gas Path
■ Pressure(s) – Intermediate Process Superheater
■ Pressure(s) – Heat Recovery Medium (e.g. steam)
■ Analysis – Stack Excess O2
■ Analysis – Flue Gas (e.g. NOx / SOx / COx / H2O
■ Efficiency – Actual (Heat Loss and Input / Output)
■ Efficiency – Design (Baseline)
■ Efficiency – Deviation
■ Flow – Process Actual
■ Flow – Process Design (Baseline)
■ Flow – Process Deviation
■ Combustion O2 – Actual
■ Combustion O2 – Design (Baseline)
■ Combustion O2 – Deviation
■ Total Fired Heat
■ Deviation Cost (Additional Fuel Consumption)
Additional Available Outputs
■ Heat Loss – Total
■ Heat Loss in Dry Gas
■ Heat Loss due to Moisture in the Fuel
■ Heat Loss in the Moisture Formed from Hydrogen
■ Heat Loss in the Moisture in the Supplied Air
■ Heat Loss due to Ash
■ Heat Loss due to Radiation
■ Heat Loss due to Carbon Monoxide
■ Process Duty
■ Process Approach Temperature
■ Additional Heat Recovery Duty
13www.emerson.com/PlantwebPerformanceAdvisor
Plantweb Performance Advisor Product Data SheetJune 2017
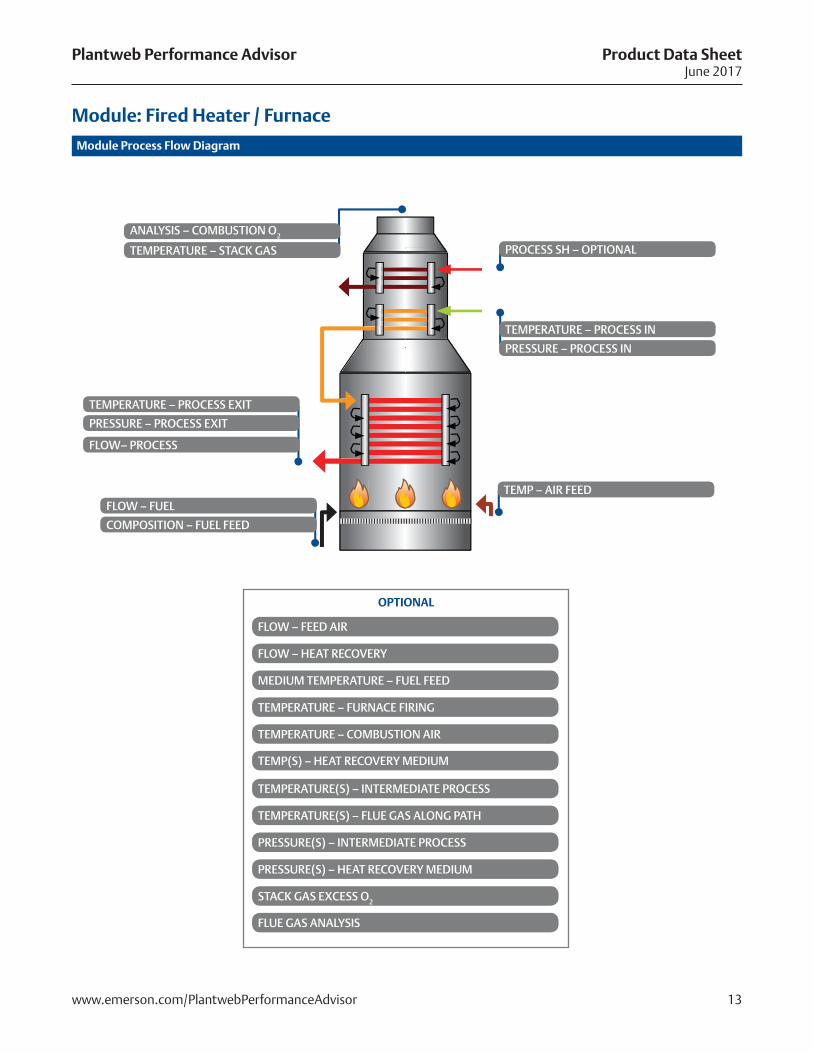
Module Process Flow Diagram
Module: Fired Heater / Furnace
ANALYSIS – COMBUSTION O2
TEMPERATURE – STACK GAS
TEMPERATURE – PROCESS EXIT
PRESSURE – PROCESS EXIT
FLOW– PROCESS
TEMPERATURE – PROCESS IN
PRESSURE – PROCESS IN
FLOW – FUEL
COMPOSITION – FUEL FEED
PROCESS SH – OPTIONAL
TEMP – AIR FEED
OPTIONAL
FLOW – FEED AIR
FLOW – HEAT RECOVERY
MEDIUM TEMPERATURE – FUEL FEED
TEMPERATURE – FURNACE FIRING
TEMPERATURE – COMBUSTION AIR
TEMP(S) – HEAT RECOVERY MEDIUM
TEMPERATURE(S) – INTERMEDIATE PROCESS
TEMPERATURE(S) – FLUE GAS ALONG PATH
PRESSURE(S) – INTERMEDIATE PROCESS
PRESSURE(S) – HEAT RECOVERY MEDIUM
STACK GAS EXCESS O2
FLUE GAS ANALYSIS
14www.emerson.com/PlantwebPerformanceAdvisor
Plantweb Performance Advisor Product Data SheetJune 2017
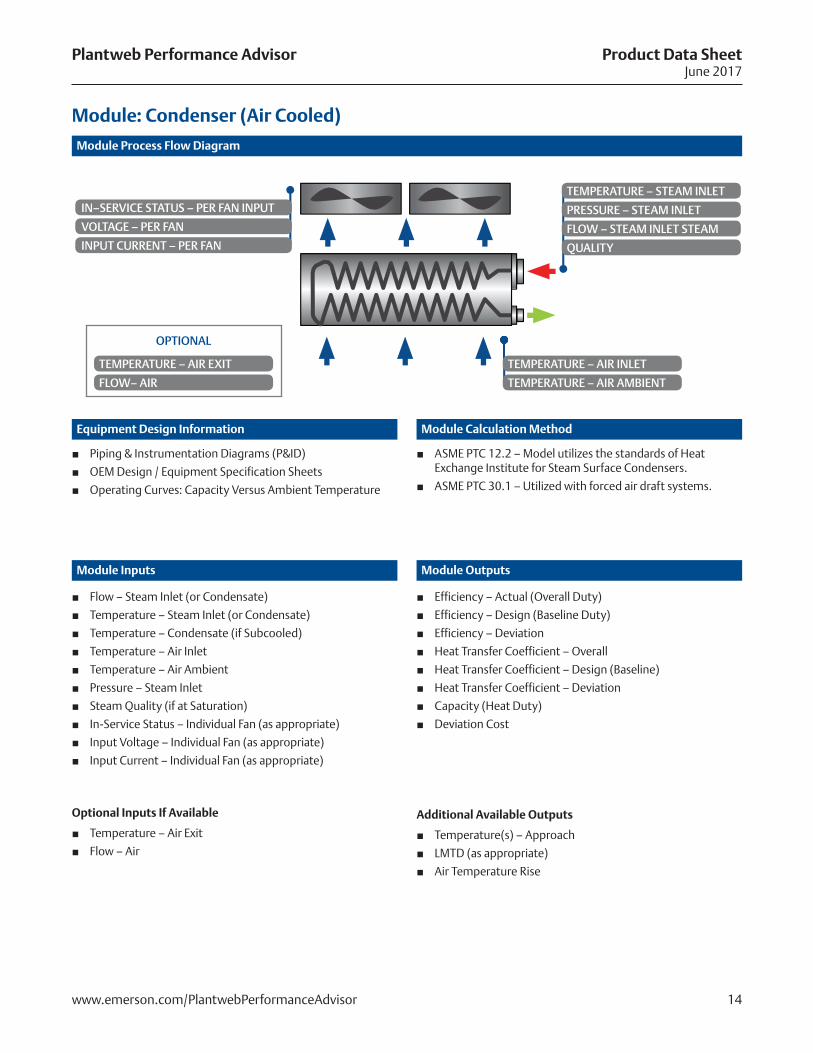
■ Flow – Steam Inlet (or Condensate)
■ Temperature – Steam Inlet (or Condensate)
■ Temperature – Condensate (if Subcooled)
■ Temperature – Air Inlet
■ Temperature – Air Ambient
■ Pressure – Steam Inlet
■ Steam Quality (if at Saturation)
■ In-Service Status – Individual Fan (as appropriate)
■ Input Voltage – Individual Fan (as appropriate)
■ Input Current – Individual Fan (as appropriate)
Optional Inputs If Available
■ Temperature – Air Exit
■ Flow – Air
Module Process Flow Diagram
Equipment Design Information
Module Inputs Module Outputs
Module Calculation Method
Module: Condenser (Air Cooled)
■ Efficiency – Actual (Overall Duty)
■ Efficiency – Design (Baseline Duty)
■ Efficiency – Deviation
■ Heat Transfer Coefficient – Overall
■ Heat Transfer Coefficient – Design (Baseline)
■ Heat Transfer Coefficient – Deviation
■ Capacity (Heat Duty)
■ Deviation Cost
Additional Available Outputs
■ Temperature(s) – Approach
■ LMTD (as appropriate)
■ Air Temperature Rise
■ ASME PTC 12.2 – Model utilizes the standards of Heat Exchange Institute for Steam Surface Condensers.
■ ASME PTC 30.1 – Utilized with forced air draft systems.
■ Piping & Instrumentation Diagrams (P&ID)
■ OEM Design / Equipment Specification Sheets
■ Operating Curves: Capacity Versus Ambient Temperature
IN–SERVICE STATUS – PER FAN INPUT
VOLTAGE – PER FAN
INPUT CURRENT – PER FAN
TEMPERATURE – STEAM INLET
PRESSURE – STEAM INLET
TEMPERATURE – AIR INLET
TEMPERATURE – AIR AMBIENT
TEMPERATURE – AIR EXIT
FLOW– AIR
FLOW – STEAM INLET STEAM
QUALITY
OPTIONAL
15www.emerson.com/PlantwebPerformanceAdvisor
Plantweb Performance Advisor Product Data SheetJune 2017
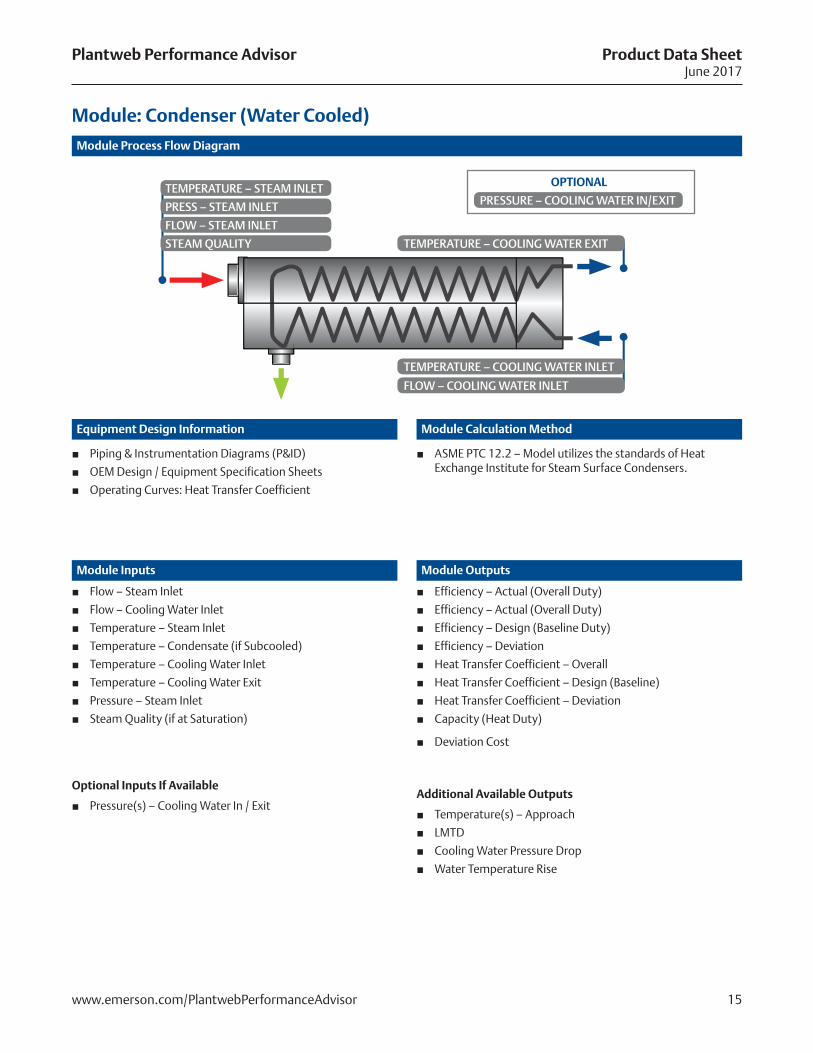
■ Flow – Steam Inlet
■ Flow – Cooling Water Inlet
■ Temperature – Steam Inlet
■ Temperature – Condensate (if Subcooled)
■ Temperature – Cooling Water Inlet
■ Temperature – Cooling Water Exit
■ Pressure – Steam Inlet
■ Steam Quality (if at Saturation)
Optional Inputs If Available
■ Pressure(s) – Cooling Water In / Exit
Module Process Flow Diagram
Equipment Design Information
Module Inputs Module Outputs
Module Calculation Method
Module: Condenser (Water Cooled)
■ Efficiency – Actual (Overall Duty)
■ Efficiency – Actual (Overall Duty)
■ Efficiency – Design (Baseline Duty)
■ Efficiency – Deviation
■ Heat Transfer Coefficient – Overall
■ Heat Transfer Coefficient – Design (Baseline)
■ Heat Transfer Coefficient – Deviation
■ Capacity (Heat Duty)
■ Deviation Cost
Additional Available Outputs
■ Temperature(s) – Approach
■ LMTD
■ Cooling Water Pressure Drop
■ Water Temperature Rise
■ ASME PTC 12.2 – Model utilizes the standards of Heat Exchange Institute for Steam Surface Condensers.
■ Piping & Instrumentation Diagrams (P&ID)
■ OEM Design / Equipment Specification Sheets
■ Operating Curves: Heat Transfer Coefficient
TEMPERATURE – STEAM INLET
PRESS – STEAM INLET
FLOW – STEAM INLET
STEAM QUALITY TEMPERATURE – COOLING WATER EXIT
PRESSURE – COOLING WATER IN/EXIT
TEMPERATURE – COOLING WATER INLET
FLOW – COOLING WATER INLET
OPTIONAL
16www.emerson.com/PlantwebPerformanceAdvisor
Plantweb Performance Advisor Product Data SheetJune 2017
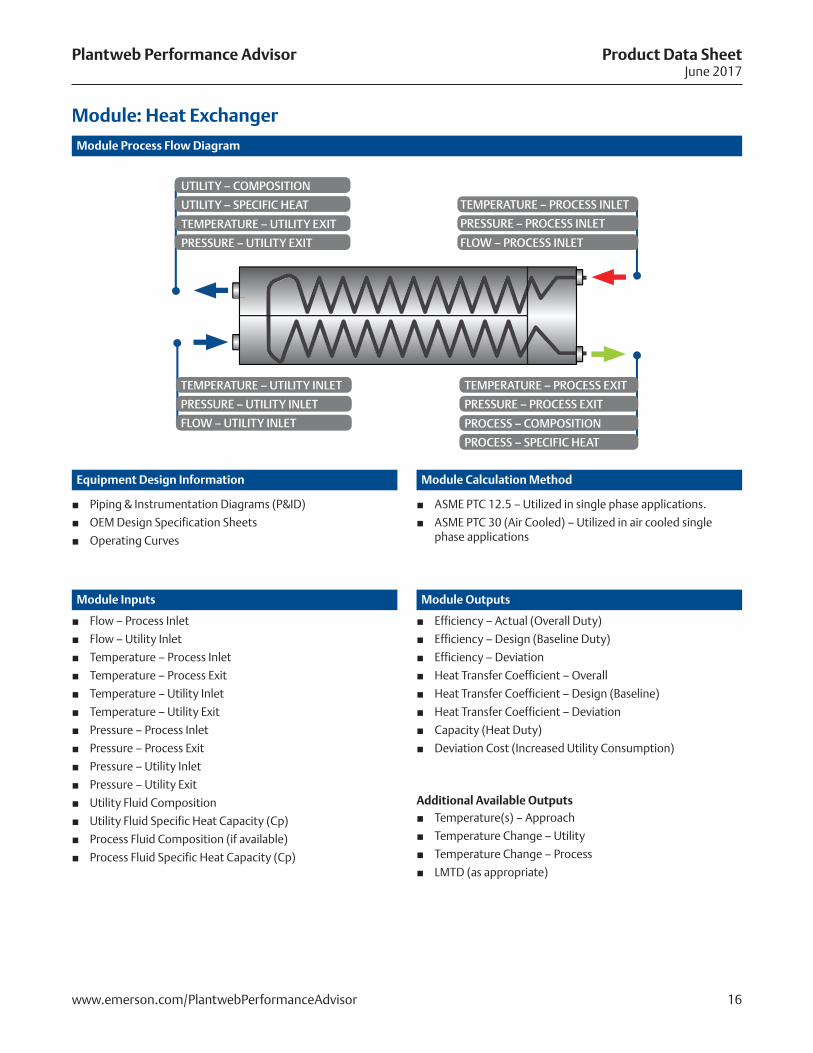
■ Flow – Process Inlet
■ Flow – Utility Inlet
■ Temperature – Process Inlet
■ Temperature – Process Exit
■ Temperature – Utility Inlet
■ Temperature – Utility Exit
■ Pressure – Process Inlet
■ Pressure – Process Exit
■ Pressure – Utility Inlet
■ Pressure – Utility Exit
■ Utility Fluid Composition
■ Utility Fluid Specific Heat Capacity (Cp)
■ Process Fluid Composition (if available)
■ Process Fluid Specific Heat Capacity (Cp)
Module Process Flow Diagram
Equipment Design Information
Module Inputs Module Outputs
Module Calculation Method
Module: Heat Exchanger
■ Efficiency – Actual (Overall Duty)
■ Efficiency – Design (Baseline Duty)
■ Efficiency – Deviation
■ Heat Transfer Coefficient – Overall
■ Heat Transfer Coefficient – Design (Baseline)
■ Heat Transfer Coefficient – Deviation
■ Capacity (Heat Duty)
■ Deviation Cost (Increased Utility Consumption)
Additional Available Outputs ■ Temperature(s) – Approach
■ Temperature Change – Utility
■ Temperature Change – Process
■ LMTD (as appropriate)
■ ASME PTC 12.5 – Utilized in single phase applications.
■ ASME PTC 30 (Air Cooled) – Utilized in air cooled single phase applications
■ Piping & Instrumentation Diagrams (P&ID)
■ OEM Design Specification Sheets
■ Operating Curves
TEMPERATURE – UTILITY INLET
PRESSURE – UTILITY INLET
FLOW – UTILITY INLET
TEMPERATURE – PROCESS INLET
PRESSURE – PROCESS INLET
FLOW – PROCESS INLET
TEMPERATURE – PROCESS EXIT
PRESSURE – PROCESS EXIT
PROCESS – COMPOSITION
PROCESS – SPECIFIC HEAT
UTILITY – COMPOSITION
UTILITY – SPECIFIC HEAT
TEMPERATURE – UTILITY EXIT
PRESSURE – UTILITY EXIT
17www.emerson.com/PlantwebPerformanceAdvisor
Plantweb Performance Advisor Product Data SheetJune 2017
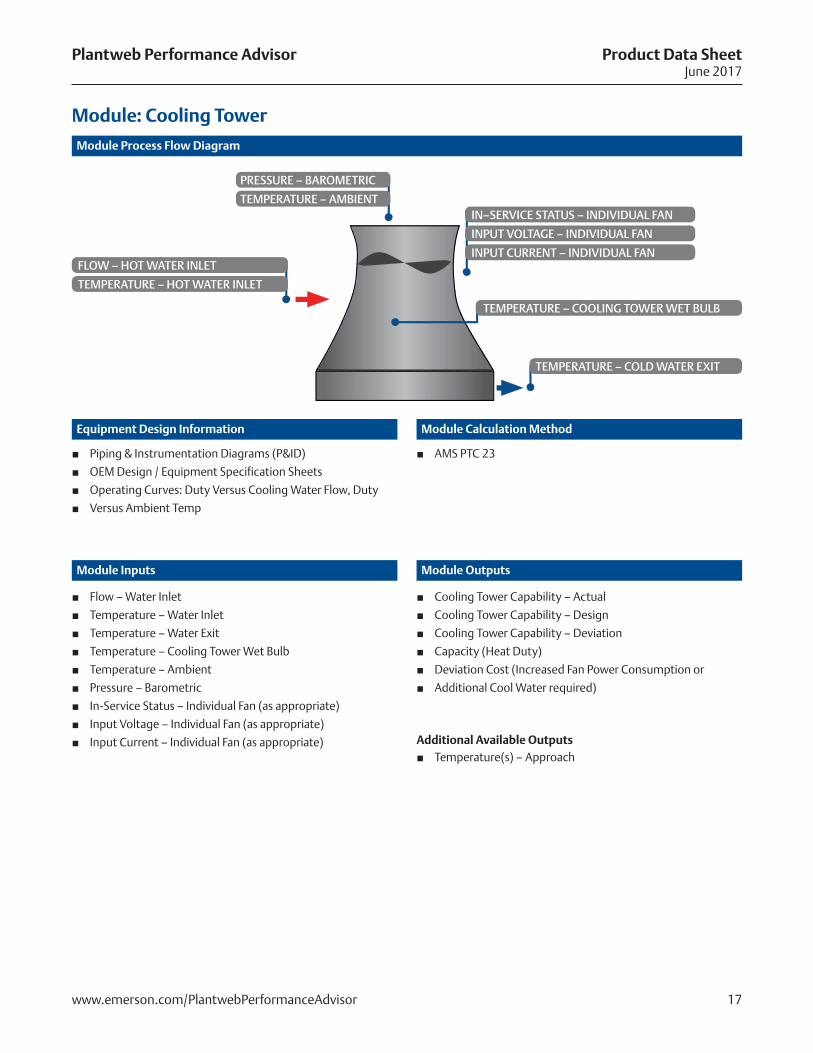
■ Flow – Water Inlet
■ Temperature – Water Inlet
■ Temperature – Water Exit
■ Temperature – Cooling Tower Wet Bulb
■ Temperature – Ambient
■ Pressure – Barometric
■ In-Service Status – Individual Fan (as appropriate)
■ Input Voltage – Individual Fan (as appropriate)
■ Input Current – Individual Fan (as appropriate)
Module Process Flow Diagram
Equipment Design Information
Module Inputs Module Outputs
Module Calculation Method
Module: Cooling Tower
■ Cooling Tower Capability – Actual
■ Cooling Tower Capability – Design
■ Cooling Tower Capability – Deviation
■ Capacity (Heat Duty)
■ Deviation Cost (Increased Fan Power Consumption or
■ Additional Cool Water required)
Additional Available Outputs ■ Temperature(s) – Approach
■ AMS PTC 23 ■ Piping & Instrumentation Diagrams (P&ID)
■ OEM Design / Equipment Specification Sheets
■ Operating Curves: Duty Versus Cooling Water Flow, Duty
■ Versus Ambient Temp
IN–SERVICE STATUS – INDIVIDUAL FAN
FLOW – HOT WATER INLET
INPUT VOLTAGE – INDIVIDUAL FAN
TEMPERATURE – HOT WATER INLET
PRESSURE – BAROMETRIC
TEMPERATURE – AMBIENT
INPUT CURRENT – INDIVIDUAL FAN
TEMPERATURE – COOLING TOWER WET BULB
TEMPERATURE – COLD WATER EXIT
18www.emerson.com/PlantwebPerformanceAdvisor
Plantweb Performance Advisor Product Data SheetJune 2017
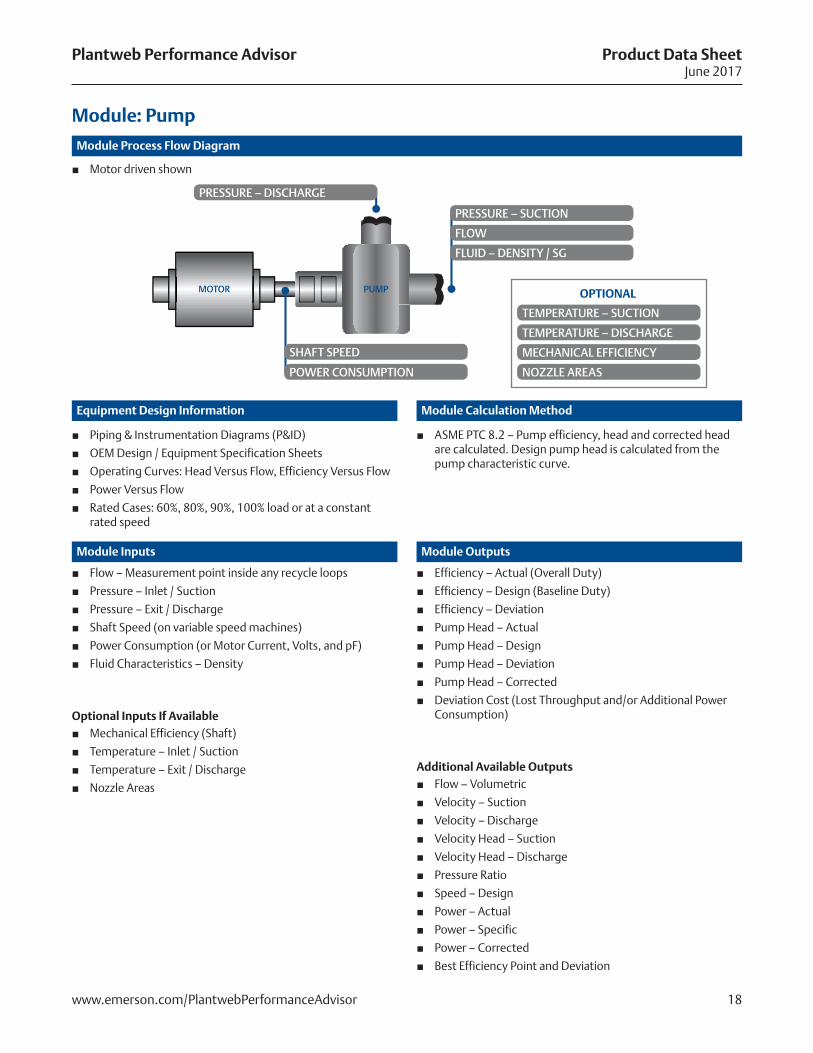
■ Flow – Measurement point inside any recycle loops
■ Pressure – Inlet / Suction
■ Pressure – Exit / Discharge
■ Shaft Speed (on variable speed machines)
■ Power Consumption (or Motor Current, Volts, and pF)
■ Fluid Characteristics – Density
Optional Inputs If Available ■ Mechanical Efficiency (Shaft)
■ Temperature – Inlet / Suction
■ Temperature – Exit / Discharge
■ Nozzle Areas
Module Process Flow Diagram
Equipment Design Information
Module Inputs Module Outputs
Module Calculation Method
Module: Pump
■ Efficiency – Actual (Overall Duty)
■ Efficiency – Design (Baseline Duty)
■ Efficiency – Deviation
■ Pump Head – Actual
■ Pump Head – Design
■ Pump Head – Deviation
■ Pump Head – Corrected
■ Deviation Cost (Lost Throughput and/or Additional Power Consumption)
Additional Available Outputs ■ Flow – Volumetric
■ Velocity – Suction
■ Velocity – Discharge
■ Velocity Head – Suction
■ Velocity Head – Discharge
■ Pressure Ratio
■ Speed – Design
■ Power – Actual
■ Power – Specific
■ Power – Corrected
■ Best Efficiency Point and Deviation
■ ASME PTC 8.2 – Pump efficiency, head and corrected head are calculated. Design pump head is calculated from the pump characteristic curve.
■ Piping & Instrumentation Diagrams (P&ID)
■ OEM Design / Equipment Specification Sheets
■ Operating Curves: Head Versus Flow, Efficiency Versus Flow
■ Power Versus Flow
■ Rated Cases: 60%, 80%, 90%, 100% load or at a constant rated speed
■ Motor driven shown
PRESSURE – DISCHARGE
SHAFT SPEED
POWER CONSUMPTION
PRESSURE – SUCTION
PUMPMOTOR
FLUID – DENSITY / SG
FLOW
TEMPERATURE – SUCTION
MECHANICAL EFFICIENCY
TEMPERATURE – DISCHARGE
NOZZLE AREAS
OPTIONAL
19www.emerson.com/PlantwebPerformanceAdvisor
Plantweb Performance Advisor Product Data SheetJune 2017
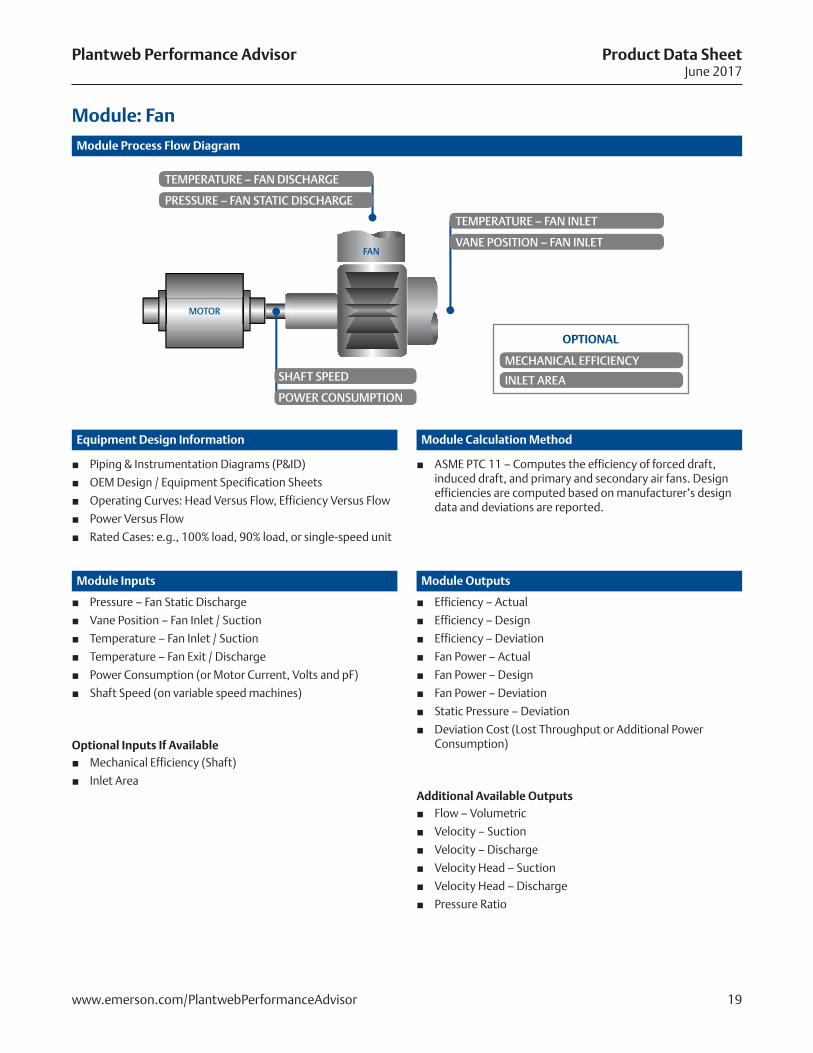
■ Pressure – Fan Static Discharge
■ Vane Position – Fan Inlet / Suction
■ Temperature – Fan Inlet / Suction
■ Temperature – Fan Exit / Discharge
■ Power Consumption (or Motor Current, Volts and pF)
■ Shaft Speed (on variable speed machines)
Optional Inputs If Available ■ Mechanical Efficiency (Shaft)
■ Inlet Area
Module Process Flow Diagram
Equipment Design Information
Module Inputs Module Outputs
Module Calculation Method
Module: Fan
■ Efficiency – Actual
■ Efficiency – Design
■ Efficiency – Deviation
■ Fan Power – Actual
■ Fan Power – Design
■ Fan Power – Deviation
■ Static Pressure – Deviation
■ Deviation Cost (Lost Throughput or Additional Power Consumption)
Additional Available Outputs ■ Flow – Volumetric
■ Velocity – Suction
■ Velocity – Discharge
■ Velocity Head – Suction
■ Velocity Head – Discharge
■ Pressure Ratio
■ ASME PTC 11 – Computes the efficiency of forced draft, induced draft, and primary and secondary air fans. Design efficiencies are computed based on manufacturer’s design data and deviations are reported.
■ Piping & Instrumentation Diagrams (P&ID)
■ OEM Design / Equipment Specification Sheets
■ Operating Curves: Head Versus Flow, Efficiency Versus Flow
■ Power Versus Flow
■ Rated Cases: e.g., 100% load, 90% load, or single-speed unit
MECHANICAL EFFICIENCY SHAFT SPEED
POWER CONSUMPTION
TEMPERATURE – FAN DISCHARGE
TEMPERATURE – FAN INLET
PRESSURE – FAN STATIC DISCHARGE
VANE POSITION – FAN INLET
INLET AREA
OPTIONAL
MOTOR
FAN
20www.emerson.com/PlantwebPerformanceAdvisor
Plantweb Performance Advisor Product Data SheetJune 2017
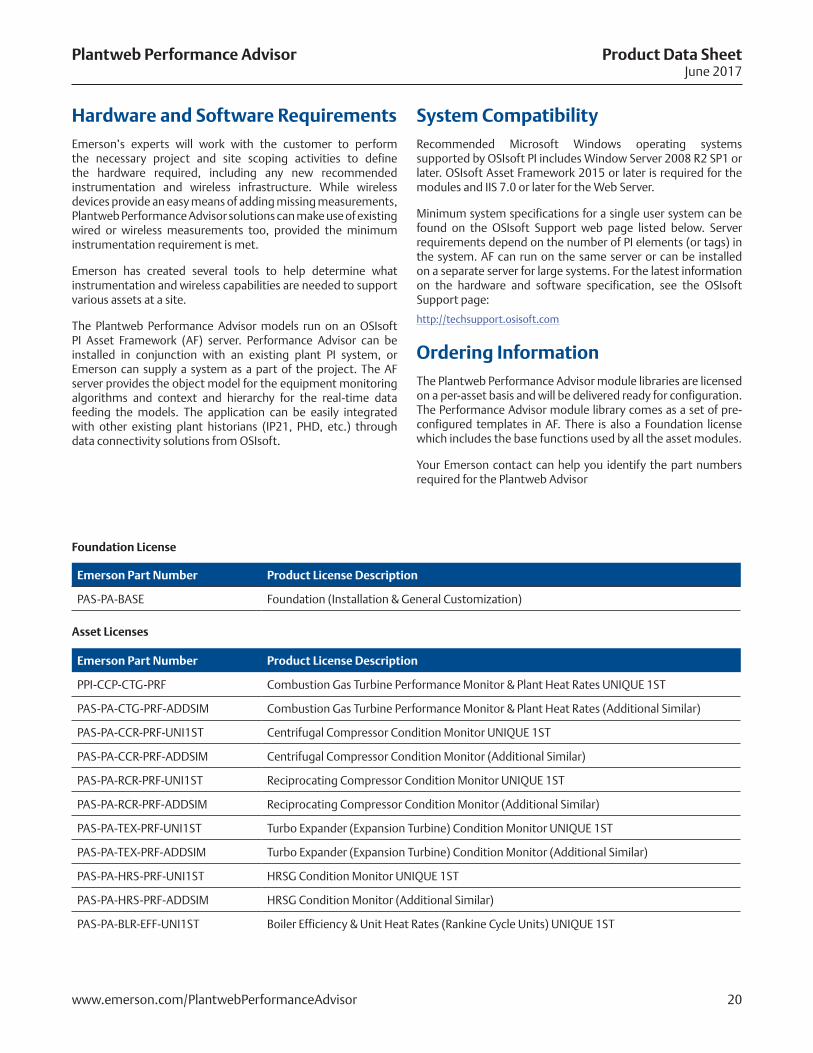
Hardware and Software RequirementsEmerson’s experts will work with the customer to perform the necessary project and site scoping activities to define the hardware required, including any new recommended instrumentation and wireless infrastructure. While wireless devices provide an easy means of adding missing measurements, Plantweb Performance Advisor solutions can make use of existing wired or wireless measurements too, provided the minimum instrumentation requirement is met.
Emerson has created several tools to help determine what instrumentation and wireless capabilities are needed to support various assets at a site.
The Plantweb Performance Advisor models run on an OSIsoft PI Asset Framework (AF) server. Performance Advisor can be installed in conjunction with an existing plant PI system, or Emerson can supply a system as a part of the project. The AF server provides the object model for the equipment monitoring algorithms and context and hierarchy for the real-time data feeding the models. The application can be easily integrated with other existing plant historians (IP21, PHD, etc.) through data connectivity solutions from OSIsoft.
System CompatibilityRecommended Microsoft Windows operating systems supported by OSIsoft PI includes Window Server 2008 R2 SP1 or later. OSIsoft Asset Framework 2015 or later is required for the modules and IIS 7.0 or later for the Web Server.
Minimum system specifications for a single user system can be found on the OSIsoft Support web page listed below. Server requirements depend on the number of PI elements (or tags) in the system. AF can run on the same server or can be installed on a separate server for large systems. For the latest information on the hardware and software specification, see the OSIsoft Support page:
http://techsupport.osisoft.com
Ordering InformationThe Plantweb Performance Advisor module libraries are licensed on a per-asset basis and will be delivered ready for configuration. The Performance Advisor module library comes as a set of pre-configured templates in AF. There is also a Foundation license which includes the base functions used by all the asset modules.
Your Emerson contact can help you identify the part numbers required for the Plantweb Advisor
Emerson Part Number Product License Description
PPI-CCP-CTG-PRF Combustion Gas Turbine Performance Monitor & Plant Heat Rates UNIQUE 1ST
PAS-PA-CTG-PRF-ADDSIM Combustion Gas Turbine Performance Monitor & Plant Heat Rates (Additional Similar)
PAS-PA-CCR-PRF-UNI1ST Centrifugal Compressor Condition Monitor UNIQUE 1ST
PAS-PA-CCR-PRF-ADDSIM Centrifugal Compressor Condition Monitor (Additional Similar)
PAS-PA-RCR-PRF-UNI1ST Reciprocating Compressor Condition Monitor UNIQUE 1ST
PAS-PA-RCR-PRF-ADDSIM Reciprocating Compressor Condition Monitor (Additional Similar)
PAS-PA-TEX-PRF-UNI1ST Turbo Expander (Expansion Turbine) Condition Monitor UNIQUE 1ST
PAS-PA-TEX-PRF-ADDSIM Turbo Expander (Expansion Turbine) Condition Monitor (Additional Similar)
PAS-PA-HRS-PRF-UNI1ST HRSG Condition Monitor UNIQUE 1ST
PAS-PA-HRS-PRF-ADDSIM HRSG Condition Monitor (Additional Similar)
PAS-PA-BLR-EFF-UNI1ST Boiler Efficiency & Unit Heat Rates (Rankine Cycle Units) UNIQUE 1ST
Emerson Part Number Product License Description
PAS-PA-BASE Foundation (Installation & General Customization)
Foundation License
Asset Licenses
21www.emerson.com/PlantwebPerformanceAdvisor
Plantweb Performance Advisor Product Data SheetJune 2017
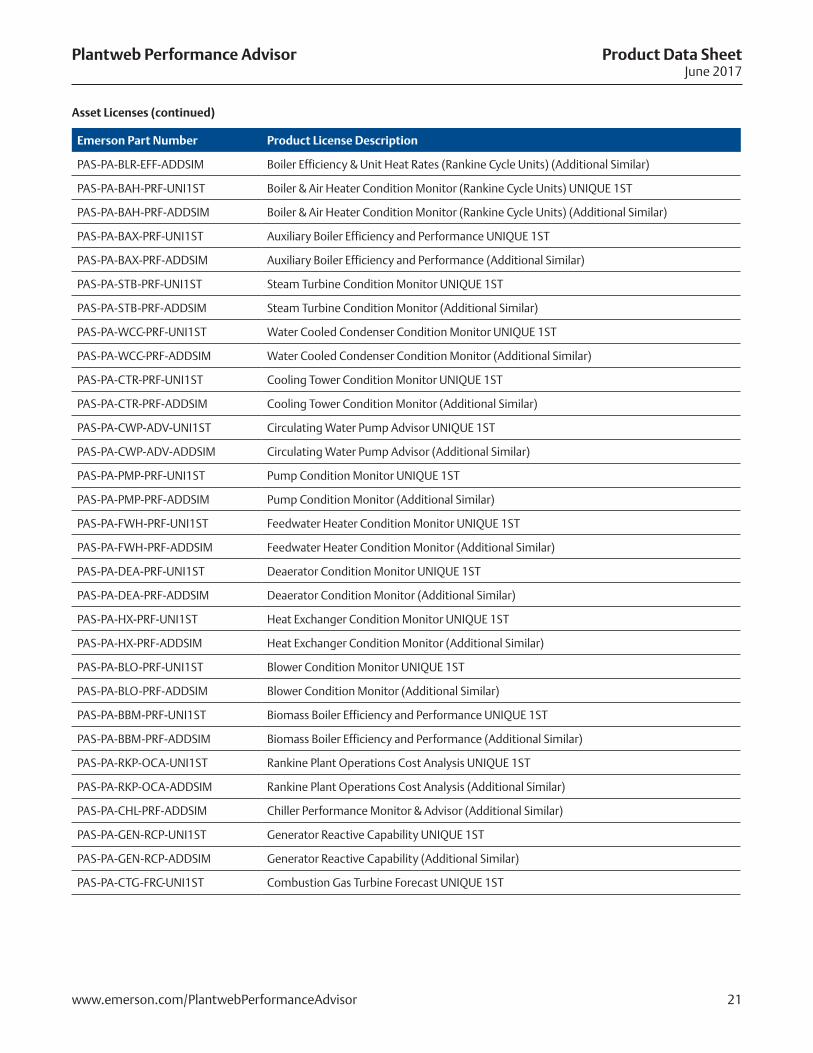
Emerson Part Number Product License Description
PAS-PA-BLR-EFF-ADDSIM Boiler Efficiency & Unit Heat Rates (Rankine Cycle Units) (Additional Similar)
PAS-PA-BAH-PRF-UNI1ST Boiler & Air Heater Condition Monitor (Rankine Cycle Units) UNIQUE 1ST
PAS-PA-BAH-PRF-ADDSIM Boiler & Air Heater Condition Monitor (Rankine Cycle Units) (Additional Similar)
PAS-PA-BAX-PRF-UNI1ST Auxiliary Boiler Efficiency and Performance UNIQUE 1ST
PAS-PA-BAX-PRF-ADDSIM Auxiliary Boiler Efficiency and Performance (Additional Similar)
PAS-PA-STB-PRF-UNI1ST Steam Turbine Condition Monitor UNIQUE 1ST
PAS-PA-STB-PRF-ADDSIM Steam Turbine Condition Monitor (Additional Similar)
PAS-PA-WCC-PRF-UNI1ST Water Cooled Condenser Condition Monitor UNIQUE 1ST
PAS-PA-WCC-PRF-ADDSIM Water Cooled Condenser Condition Monitor (Additional Similar)
PAS-PA-CTR-PRF-UNI1ST Cooling Tower Condition Monitor UNIQUE 1ST
PAS-PA-CTR-PRF-ADDSIM Cooling Tower Condition Monitor (Additional Similar)
PAS-PA-CWP-ADV-UNI1ST Circulating Water Pump Advisor UNIQUE 1ST
PAS-PA-CWP-ADV-ADDSIM Circulating Water Pump Advisor (Additional Similar)
PAS-PA-PMP-PRF-UNI1ST Pump Condition Monitor UNIQUE 1ST
PAS-PA-PMP-PRF-ADDSIM Pump Condition Monitor (Additional Similar)
PAS-PA-FWH-PRF-UNI1ST Feedwater Heater Condition Monitor UNIQUE 1ST
PAS-PA-FWH-PRF-ADDSIM Feedwater Heater Condition Monitor (Additional Similar)
PAS-PA-DEA-PRF-UNI1ST Deaerator Condition Monitor UNIQUE 1ST
PAS-PA-DEA-PRF-ADDSIM Deaerator Condition Monitor (Additional Similar)
PAS-PA-HX-PRF-UNI1ST Heat Exchanger Condition Monitor UNIQUE 1ST
PAS-PA-HX-PRF-ADDSIM Heat Exchanger Condition Monitor (Additional Similar)
PAS-PA-BLO-PRF-UNI1ST Blower Condition Monitor UNIQUE 1ST
PAS-PA-BLO-PRF-ADDSIM Blower Condition Monitor (Additional Similar)
PAS-PA-BBM-PRF-UNI1ST Biomass Boiler Efficiency and Performance UNIQUE 1ST
PAS-PA-BBM-PRF-ADDSIM Biomass Boiler Efficiency and Performance (Additional Similar)
PAS-PA-RKP-OCA-UNI1ST Rankine Plant Operations Cost Analysis UNIQUE 1ST
PAS-PA-RKP-OCA-ADDSIM Rankine Plant Operations Cost Analysis (Additional Similar)
PAS-PA-CHL-PRF-ADDSIM Chiller Performance Monitor & Advisor (Additional Similar)
PAS-PA-GEN-RCP-UNI1ST Generator Reactive Capability UNIQUE 1ST
PAS-PA-GEN-RCP-ADDSIM Generator Reactive Capability (Additional Similar)
PAS-PA-CTG-FRC-UNI1ST Combustion Gas Turbine Forecast UNIQUE 1ST
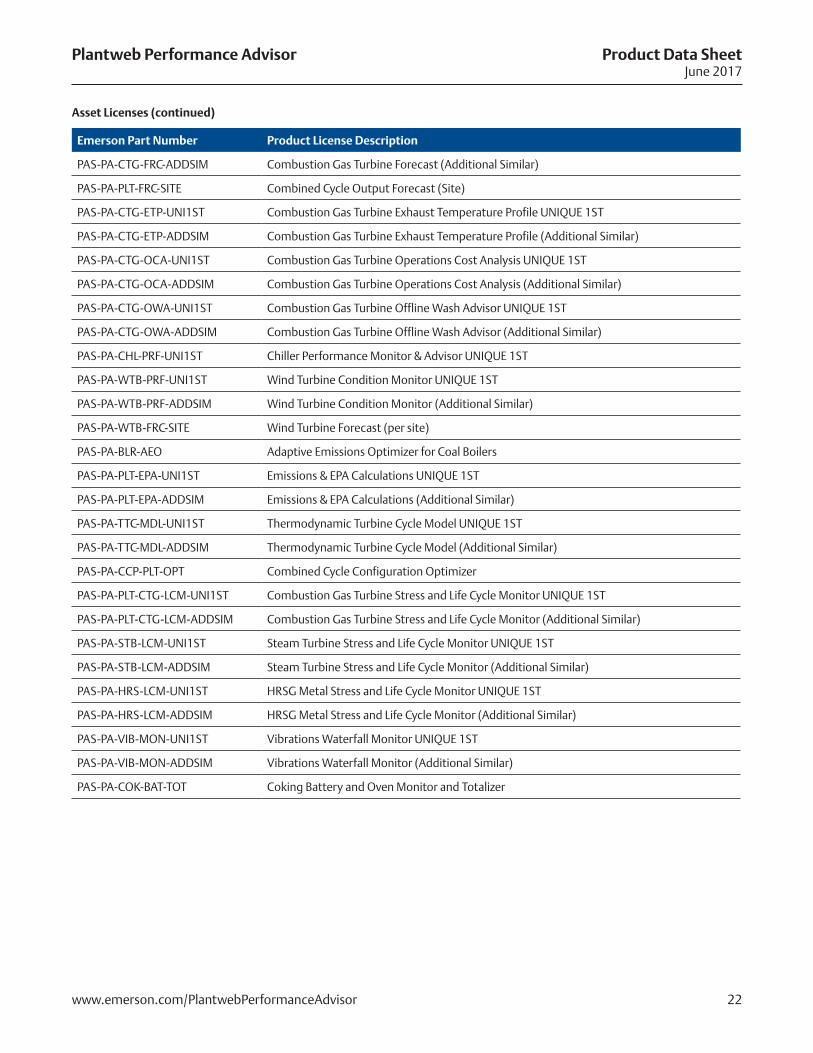
Asset Licenses (continued)
22www.emerson.com/PlantwebPerformanceAdvisor
Plantweb Performance Advisor Product Data SheetJune 2017
Emerson Part Number Product License Description
PAS-PA-CTG-FRC-ADDSIM Combustion Gas Turbine Forecast (Additional Similar)
PAS-PA-PLT-FRC-SITE Combined Cycle Output Forecast (Site)
PAS-PA-CTG-ETP-UNI1ST Combustion Gas Turbine Exhaust Temperature Profile UNIQUE 1ST
PAS-PA-CTG-ETP-ADDSIM Combustion Gas Turbine Exhaust Temperature Profile (Additional Similar)
PAS-PA-CTG-OCA-UNI1ST Combustion Gas Turbine Operations Cost Analysis UNIQUE 1ST
PAS-PA-CTG-OCA-ADDSIM Combustion Gas Turbine Operations Cost Analysis (Additional Similar)
PAS-PA-CTG-OWA-UNI1ST Combustion Gas Turbine Offline Wash Advisor UNIQUE 1ST
PAS-PA-CTG-OWA-ADDSIM Combustion Gas Turbine Offline Wash Advisor (Additional Similar)
PAS-PA-CHL-PRF-UNI1ST Chiller Performance Monitor & Advisor UNIQUE 1ST
PAS-PA-WTB-PRF-UNI1ST Wind Turbine Condition Monitor UNIQUE 1ST
PAS-PA-WTB-PRF-ADDSIM Wind Turbine Condition Monitor (Additional Similar)
PAS-PA-WTB-FRC-SITE Wind Turbine Forecast (per site)
PAS-PA-BLR-AEO Adaptive Emissions Optimizer for Coal Boilers
PAS-PA-PLT-EPA-UNI1ST Emissions & EPA Calculations UNIQUE 1ST
PAS-PA-PLT-EPA-ADDSIM Emissions & EPA Calculations (Additional Similar)
PAS-PA-TTC-MDL-UNI1ST Thermodynamic Turbine Cycle Model UNIQUE 1ST
PAS-PA-TTC-MDL-ADDSIM Thermodynamic Turbine Cycle Model (Additional Similar)
PAS-PA-CCP-PLT-OPT Combined Cycle Configuration Optimizer
PAS-PA-PLT-CTG-LCM-UNI1ST Combustion Gas Turbine Stress and Life Cycle Monitor UNIQUE 1ST
PAS-PA-PLT-CTG-LCM-ADDSIM Combustion Gas Turbine Stress and Life Cycle Monitor (Additional Similar)
PAS-PA-STB-LCM-UNI1ST Steam Turbine Stress and Life Cycle Monitor UNIQUE 1ST
PAS-PA-STB-LCM-ADDSIM Steam Turbine Stress and Life Cycle Monitor (Additional Similar)
PAS-PA-HRS-LCM-UNI1ST HRSG Metal Stress and Life Cycle Monitor UNIQUE 1ST
PAS-PA-HRS-LCM-ADDSIM HRSG Metal Stress and Life Cycle Monitor (Additional Similar)
PAS-PA-VIB-MON-UNI1ST Vibrations Waterfall Monitor UNIQUE 1ST
PAS-PA-VIB-MON-ADDSIM Vibrations Waterfall Monitor (Additional Similar)
PAS-PA-COK-BAT-TOT Coking Battery and Oven Monitor and Totalizer
Asset Licenses (continued)
23www.emerson.com/PlantwebPerformanceAdvisor
Plantweb Performance Advisor Product Data SheetJune 2017
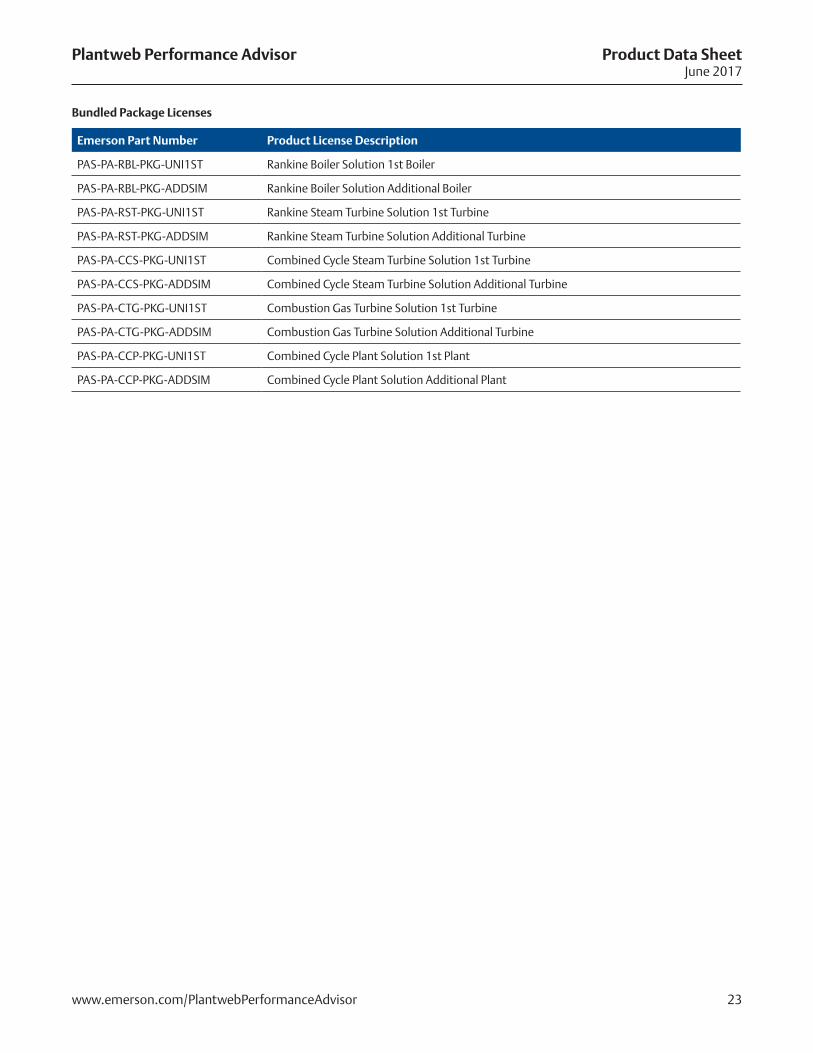
Emerson Part Number Product License Description
PAS-PA-RBL-PKG-UNI1ST Rankine Boiler Solution 1st Boiler
PAS-PA-RBL-PKG-ADDSIM Rankine Boiler Solution Additional Boiler
PAS-PA-RST-PKG-UNI1ST Rankine Steam Turbine Solution 1st Turbine
PAS-PA-RST-PKG-ADDSIM Rankine Steam Turbine Solution Additional Turbine
PAS-PA-CCS-PKG-UNI1ST Combined Cycle Steam Turbine Solution 1st Turbine
PAS-PA-CCS-PKG-ADDSIM Combined Cycle Steam Turbine Solution Additional Turbine
PAS-PA-CTG-PKG-UNI1ST Combustion Gas Turbine Solution 1st Turbine
PAS-PA-CTG-PKG-ADDSIM Combustion Gas Turbine Solution Additional Turbine
PAS-PA-CCP-PKG-UNI1ST Combined Cycle Plant Solution 1st Plant
PAS-PA-CCP-PKG-ADDSIM Combined Cycle Plant Solution Additional Plant
Bundled Package Licenses
Plantweb Performance Advisor Product Data SheetJune 2017
©2017 Emerson. All rights reserved.
The Emerson logo is a trademark and service mark of Emerson Electric Co. is a mark of one of the Emerson Automation Solutions family of business units. All other marks are property of their respective owners.
The contents of this publication are presented for information purposes only, and while effort has been made to ensure their accuracy, they are not to be construed as warranties or guarantees, express or implied, regarding the products or services describe herein or their use or applicability. All sales are governed by our terms and conditions, which are available on request. We reserve the right to modify or improve the designs or specifications of our products an any time without notice.
Emerson Automation Solutions
Asia Pacific: 65.6777.8211Europe, Middle East: 41.41.768.6111North America, Latin America:T 1 (800) 833-8314 or1 (512) 832-3774www.Emerson.com
Related ProductsPlantweb™Advisor Suite: Uses predictive intelligence to improve the availability and performance of key production assets, including mechanical equipment, electrical systems, process equipment, instruments, and valves. This integrated family of diagnostic software applications enables users to detect plant equipment problems before they occur and provides the information to help make informed decisions.
■ Plantweb™ Health Advisor: A cost-effective, statistically-based solution to monitor essential assets – those that have repeated failures or assets in important service areas where a failure can cause significant financial impact such as production loss, environmental or safety incidents.
■ Plantweb™ Energy Advisor: A real-time Energy Management Information System (EMIS) that automates the process of mapping and managing energy consumption across a site, as it is being consumed. Real-time alerts, dashboards and emails notify decision-makers when energy consumption is above expected so that actions may be taken to drive down energy costs.
Plantweb Insight: Web-based application package used for real-time monitoring of key industrial assets. Part of Emerson’s Plantweb digital ecosystem, Plantweb Insight uses strategic interpretation and analytics to transform raw data into actionable information designed to improve operational areas such as health, safety, reliability, and energy usage
AMS ARES: Emerson’s ARES Platform collects asset data from field-based wired and wireless sensors and delivers information on only the most critical situations, enabling you to make well informed decisions to maintain availability. The ARES Platform utilizes modern communication tools to deliver alerts to both traditional desktop PCs and laptops as well as the tablets and smart phones available outside the office or plant. Remote accessibility to smart alerts in a secure environment means operators and maintenance personnel alike are on top of the performance of critical production assets always.
AMS Intelligent Device Manager: helps avoid unnecessary costs from unplanned shutdowns and inefficient practices, with a universal window into the health of intelligent field devices. Based on real-time condition data from intelligent field devices, plant staff can respond fast and take informed decisions on device maintenance.
AMS Machinery Health Manager: Designed for rotating equipment specialists, Machinery Health Manager diagnoses and communicates the health of mechanical and rotating machinery using data from several maintenance technologies. The result is a comprehensive view of each monitored machine and a more accurate diagnosis when developing problems are discovered.