plant secondary metabolites - psau.edu.sa · these compounds are involved in defense against...
TRANSCRIPT


Plant Secondary Metabolites
M E T H O D S I N M O L E C U L A R B I O L O G Y T M
John M. Walker, SERIES EDITOR
393. Plant Secondary Metabolites by Harinder P.S. Makkar, P. Siddhuraju, and Klaus Becker, 2007
392. Molecular Motors: Methods and Protocols,edited by Ann O. Sperry, 2007
391. Methicillin-Resistant: Staphylococcus aureus(MRSA) Protocols, edited by Yinduo Ji, 2007
390. Protein Targeting Protocols, Second Edition,edited by Mark van der Giezen, 2007
389. Pichia Protocols, Second Edition, edited by James M. Cregg, 2007
388. Baculovirus and Insect Cell Expression Protocols, Second Edition, edited by David W. Murhammer, 2007
387. Serial Analysis of Gene Expression (SAGE):Digital Gene Expression Profi ling, edited by Kare Lehmann Nielsen, 2007
386. Peptide Characterization and Application Protocols, edited by Gregg B. Fields, 2007
385. Microchip-Based Assay Systems: Methods and Applications, edited by Pierre N. Floriana, 2007
384. Capillary Electrophoresis: Methods and Protocols, edited by Philippe Schmitt-Kopplin, 2007
383. Cancer Genomics and Proteomics: Methods and Protocols, edited by Paul B. Fisher, 2007
382. Microarrays, Second Edition: Volume 2, Applications and Data Analysis, edited by Jang B. Rampal, 2007
381. Microarrays, Second Edition: Volume 1, Synthesis Methods, edited by Jang B. Rampal, 2007
380. Immunological Tolerance: Methods and Protocols, edited by Paul J. Fairchild, 2007
379. Glycovirology Protocols, edited by Richard J. Sugrue, 2007
378. Monoclonal Antibodies: Methods and Protocols, edited by Maher Albitar, 2007
377. Microarray Data Analysis: Methods and Applications, edited by Michael J. Korenberg, 2007
376. Linkage Disequilibrium and Association Mapping: Analysis and Application, edited by Andrew R. Collins, 2007
375. In Vitro Transcription and Translation Protocols: Second Edition, edited by Guido Grandi, 2007
374. Quantum Dots: Methods and Protocols, edited by Charles Z. Hotz and Marcel Bruchez, 2007
373. Pyrosequencing® Protocols, edited by Sharon Marsh, 2007
372. Mitochondrial Genomics and Proteomics Protocols, edited by Dario Leister and Johannes Herrmann, 2007
371. Biological Aging: Methods and Protocols,edited by Trygve O. Tollefsbol, 2007
370. Adhesion Protein Protocols, Second Edition,edited by Amanda S. Coutts, 2007
369. Electron Microscopy: Methods and Protocols, Second Edition, edited by John Kuo, 2007
368. Cryopreservation and Freeze-Drying Protocols, Second Edition, edited by John G. Day and Glyn Stacey, 2007
367. Mass Spectrometry Data Analysis in Proteomics, edited by Rune Matthiesen, 2007
366. Cardiac Gene Expression: Methods and Protocols, edited by Jun Zhang and Gregg Rokosh, 2007
365. Protein Phosphatase Protocols: edited by Greg Moorhead, 2007
364. Macromolecular Crystallography Protocols:Volume 2, Structure Determination, edited by Sylvie Doublié, 2007
363. Macromolecular Crystallography Protocols:Volume 1, Preparation and Crystallization of Macromolecules, edited by Sylvie Doublié, 2007
362. Circadian Rhythms: Methods and Protocols,edited by Ezio Rosato, 2007
361. Target Discovery and Validation Reviews and Protocols: Emerging Molecular Targets and Treatment Options, Volume 2, edited by Mouldy Sioud, 2007
360. Target Discovery and Validation Reviews and Protocols: Emerging Strategies for Targets and Biomarker Discovery, Volume 1, edited by Mouldy Sioud, 2007
359. Quantitative Proteomics by Mass Spectrometry, edited by Salvatore Sechi, 2007
358. Metabolomics: Methods and Protocols, edited by Wolfram Weckwerth, 2007
357. Cardiovascular Proteomics: Methods and Protocols, edited by Fernando Vivanco, 2006
356. High-Content Screening: A Powerful Approach to Systems Cell Biology and Drug Discovery,edited by D. Lansing Taylor, Jeffrey Haskins, and Ken Guiliano, and 2007
355. Plant Proteomics: Methods and Protocols,edited by Hervé Thiellement, Michel Zivy, Catherine Damerval, and Valerie Mechin, 2006
354. Plant–Pathogen Interactions: Methods and Protocols, edited by Pamela C. Ronald, 2006
353. Protocols for Nucleic Acid Analysis by Nonradioactive Probes, Second Edition, edited by Elena Hilario and John Mackay, 2006
352. Protein Engineering Protocols, edited by Katja M. Arndt and Kristian M. Müller, 2006
351. C. elegans: Methods and Applications, edited by Kevin Strange, 2006
350. Protein Folding Protocols, edited by Yawen Bai and Ruth Nussinov, 2007

M E T H O D S I N M O L E C U L A R B I O L O G Y T M
Plant Secondary Metabolites
By
Harinder P.S. MakkarP. Siddhuraju
Klaus BeckerInstitute for Animal Production in the Tropics and Subtropics,
University of Hohenheim, Stuttgart, Germany
© 2007 Humana Press Inc., a division of Springer Science+Business Media, LLC999 Riverview Drive, Suite 208Totowa, New Jersey 07512
www.humanapress.com
All rights reserved. No part of this book may be reproduced, stored in a retrieval system, or transmitted in any form or by any means, electronic, mechanical, photocopying, microfi lming, recording, or otherwise without written permission from the Publisher. Methods in Molecular BiologyTM is a trademark of The Humana Press Inc.
All papers, comments, opinions, conclusions, or recommendations are those of the author(s), and do not necessarily refl ect the views of the publisher.
This publication is printed on acid-free paper. ∞ANSI Z39.48-1984 (American Standards Institute)
Permanence of Paper for Printed Library Materials.
For additional copies, pricing for bulk purchases, and/or information about other Humana titles, contact Humana at the above address or at any of the following numbers: Tel.: 973-256-1699; Fax: 973-256-8341; E-mail: [email protected]; or visit our Website: www.humanapress.com
Photocopy Authorization Policy:Authorization to photocopy items for internal or personal use, or the internal or personal use of specifi c clients, is granted by Humana Press Inc., provided that the base fee of US $30.00 per copy is paid directly to the Copyright Clearance Center at 222 Rosewood Drive, Danvers, MA 01923. For those organizations that have been granted a photocopy license from the CCC, a separate system of payment has been arranged and is acceptable to Humana Press Inc. The fee code for users of the Transactional Reporting Service is: [1-58829-072-7/07 $30.00].
10 9 8 7 6 5 4 3 2 1
Library of Congress Control Number: 2006939956
ISBN-10: 1-58829-993-7 e-ISBN-10: 1-59745-425-7ISBN-13: 978-1-58829-993-2 e-ISBN-13: 978-1-59745-425-4ISSN: 1064-3745
Preface
v
Plant secondary metabolites are a diverse group of molecules that are involved in the adaptation of plants to their environment but are not part of the primary biochemical pathways of cell growth and reproduction. In general, the terms plant secondary compounds, phytochemicals, antinutritional factors,and plant xenobiotics have been used in the literature to refer to this group of compounds. There are well over 24,000 structures, including many compounds that have antinutritional and toxic effects on mammals. This number does not include the oligomeric polyphenolic compounds (proanthocyanidins and hydrolyzable tannins) that are just now being more accurately described and will increase the number by several thousand. Some major plant secondary metabolites or phytochemicals that occur in plants include protease inhibitors, lectins, alkaloids, nonprotein amino acids, cyanogenic glycosides, saponins, and tannins. These compounds are involved in defense against herbivores and pathogens, regulation of symbiosis, control of seed germination, and chemical inhibition of competing plant species (allelopathy), and therefore are an integral part of the interactions of species in plant and animal communities and the adaptation of plants to their environment.
Much of the research on plant secondary metabolites has concentrated on their toxic and antinutritional effects on livestock. Toxic plant secondary metabolites are present in plants at low concentrations (generally less than 2% of the dry matter) and have negative physiological effects when absorbed, such as neurological problems, reproductive failure, goiter, gangrene, and death. Examples are alkaloids, cyanogenic glycosides, toxic amino acids, saponins, and many others. Nontoxic phytochemicals lower digestibility of nutrients and affect palatability. Higher concentrations (>2% of dry matter) of these compounds are required for eliciting negative effects, and the primary site of activity is in the digestive tract or the sensory organs associated with feeding behavior. These plant secondary metabolites include tannins, protease, and amylase inhibitors. Compounds that have a structural role in the plant (e.g., lignin, biogenic silica, and cutin) lower the extent of microbial digestion of cell wall polysaccharides.
This division between groups of plant secondary metabolites is not exclusive. For instance, hydrolyzable tannins are potentially toxic to ruminants. The major lesions are hemorrhagic gastroenteritis, necrosis of the liver, and kidney damage with proximal tubular necrosis. Excessive and fast consumption of oaks and
other tree species that contain more than 5% hydrolyzable tannins results in high mortality and morbidity in cattle and sheep.
In addition, plant secondary metabolites are also associated with improved nutritive value and may have benefi cial effects on animal health. Proanthocy-anidins, more commonly called condensed tannins in the animal nutrition literature [present in forage legumes such as sainfoin (Onobrychis viciaefolia), bird’s-foot trefoil (Lotus corniculatus), and Lotus pedunculatus], are associated with improved protein digestion and metabolism in ruminants and in protecting ruminants against legume bloat. Tannins may also protect ruminants against helminthiasis. Growing interest in the potential health-promoting effects of plant secondary metabolites in human foods has prompted research on their potential to prevent or treat cancer, circulatory disease, and viral infection. The mechanisms by which these substances have benefi cial effects on health may also be related to their toxic effects, and the difference between toxicity and benefi cial effects may be dose- and structure-dependent. However, mechanisms of toxicity and health-promoting effects of most of the plant secondary metabo-lites in human and animal diets are not well established.
Interest in plant secondary metabolites has risen dramatically in recent years among plant molecular biologists and plant breeders because of their diverse effects, which, in addition to those mentioned above, include antioxidant, anti-viral, antibacterial, and anticancer effects. To name few recent developments, molecular biologists have made genetic modifi cations in proanthocyanidin bio-synthesis in forage plants with the aim of eliminating bloat, improving the effi ciency of conversion of plant protein into animal protein (increase rumen undegradable protein and thus increase protein availability postruminally), reduce greenhouse gases, and reduce gastrointestinal parasites; and plant breed-ers have developed and commercialized rapeseeds (canola) with low levels of glucosinolates and erucic acid, and cottonseed with low gossypol. Genetically modifi ed rice, which expressed insecticidal cowpea trypsin inhibitor, has also been produced. The emerging molecular genetic approaches have tremen-dous potential to unravel the regulatory genes that control plant secondary metabolite biosynthesis. This information, together with increased knowledge of the enzymes specifi c for the pathway, could facilitate the genetic engineering of plants.
Most of the plant resources, especially in the tropical regions, are rich in plant secondary metabolites, and the lack of information on the appropriate methods for their determination has been the main bottleneck in better under-standing the enzymes and biochemical pathways in their synthesis, the genes responsible for controlling major biochemical processes, and the physiological signifi cance of plant secondary metabolites, and in exploiting the benefi cial effects of these phytochemicals.
vi Preface

A number of methods are available in the literature for quantifi cation of plant secondary metabolites. This manual does not present all the available methods; rather, based on our over-a-decade experience on quantifi cation of plant secondary metabolites, it contains the methods for analysis of some important plant secondary metabolites that have worked well in our hands and that can be conducted in laboratories equipped with basic facilities. The methods have been written in a recipe-like format designed for direct practical use in the laboratory. The chemical nature of plant secondary metabolites, their known physiological effects, and their mechanism of action are also briefl y presented. This work has originated as a result of numerous requests, especially from scientists from developing countries, for appropriate methods to quantify plant secondary metabolites.
It is hoped that the reliable assays presented in this manual will contribute to the safe and effi cient use of locally available feed resources, and better equip the researchers to meet the unprecedented challenge presented by the huge demand for feed, which is driven by the increasing demand for animal protein in developing countries. This manual will also enable better understanding of plant–animal interactions, which is of importance not only for animal agricul-ture but also for games. The methodologies given in the manual could also be used for determination of plant secondary metabolites in human food and in studying the implications of their consumption on human health and welfare. The manual will also further the interests of molecular geneticists in genetically engineering the plants for introduction of value-added nutraceuticals and food and forage quality traits.
Harinder P.S. MakkarP. SiddhurajuKlaus Becker
Preface vii

Acknowledgments
We are thankful to Herrmann Baumgartner for his assistance in simplifying and adapting assays described in this manual from the original methods. Partial support to P. Siddhuraju from the Alexander von Humboldt Foundation and to Harinder P.S. Makkar from the German Science Foundation for writing this manual is also gratefully acknowledged.
ix

Contents
Preface ..............................................................................................................v
Acknowledgments ............................................................................................ ix
1 Trypsin Inhibitor .....................................................................................1
2 Chymotrypsin Inhibitor ...........................................................................7
3 α-Amylase Inhibitor .......................................................................................11
4 Phytohemagglutin/Lectin ...............................................................................15
5 Phytic Acid ...........................................................................................23
6 Oxalic Acid ..........................................................................................29
7 Nitrate and Nitrite ................................................................................33
8 L-Mimosine (β-(3-Hydroxy-4-Pyridone-1-yl)- L-Alanine) ...........................41
9 Canavanine .................................................................................................... 47
10 L-DOPA (L-3,4-Dihydroxyphenylalanine) .................................................... 51
11 Glucosinolates ............................................................................................... 55
12 Cyanogenic Glucosides/Cyanogens .............................................................61
13 Tannins ........................................................................................................... 67
14 Gossypol ........................................................................................................ 83
15 Chlorogenic Acid .......................................................................................... 89
16 Saponins ......................................................................................................... 93
17 Phorbol Esters .............................................................................................. 101
18 Alkaloids ....................................................................................................... 107
Appendix ...................................................................................................................113
Index ............................................................................................................. 123
xi
1
From: Methods in Molecular Biology, vol. 393: Plant Secondary MetabolitesBy: H.P.S. Makkar, P. Siddhuraju and K. Becker © Humana Press Inc., Totowa, NJ
1
Trypsin Inhibitor
Key Words: Trypsin inhibitor; pancreas; pancreatic hyperplasia; benzyl-DL-arginine-para-nitroanilide; trypsin inhibitor determination; expression of activity; feedback mechanism; inactivation; fermentation; germination; heat treatment.
1. Introduction1.1. Nature, Mechanism of Action, and Biological Effects
Among the many factors that have been implicated as having an adverse effect on the nutritional value of proteins is a class of proteins, known as pro-tease inhibitors, that has the ability to inhibit the proteolytic activity of proteases of diverse origin. The protease inhibitors that have been isolated from soybeans and other legumes fall biochemically into two main categories: (1) those that have a molecular weight of 20,000 to 25,000 Da with relatively few disulfi de bonds and a specifi city directed primarily toward trypsin (Kunitz inhibitor), and (2) those that have a molecular weight of only 6000 to 10,000 Da with a high proportion of cystine residues and are capable of inhibiting chymotrypsin as well as trypsin at independent binding sites (Bowman-Birk inhibitor).
Trypsin inhibitors induce pancreatic hypertrophy/hyperplasia. Concomitant with this increase in the size of the pancreas is an increase in the secretion of digestive enzymes, including trypsin, chymotrypsin, and elastase. This led to the hypothesis that the growth depression caused by the trypsin inhibitors is the consequence of an endogenous loss of amino acids in the form of enzymes being secreted by hyperactive pancreases. Pancreatic secretion is controlled by a negative feedback mechanism whereby enzyme secretion is inversely related to the level of trypsin present in the small intestine. Thus, when the level of trypsin in the gut is depressed, as would be the case when it combines with the

2 Plant Secondary Metabolites
inhibitor, the pancreas as a result of higher secretion of cholecystokinin (a pancreas stimulating hormone), responds in a compensatory fashion by producing more enzymes (Fig. 1). Apart from this, the inhibitor interferes in the digestion of protein in the intestinal tract, decreasing the availability of amino acids for production purposes.
Protease inhibitors can be inactivated by heat treatment. Moist heating has been found to be more effective than dry heating. Fermentation and germination are also known to decrease the inhibitors’ capability to produce adverse effects. Monitoring the level of these inhibitors present in both unprocessed and processed food and feed sources is necessary to prevent their adverse effects.
1.2. Present in
Psophocarpus tetragonolobus, Erythrina caffra, Glycine max, Phaseolus lunatus, Arachis hypogaea, Macrotyloma axillare, Vigna unguiculata, Sola-num tuberosum, Triticum aestivum, Hordeum vulgare, Cucumus sativus, Cucurbita pepo, Cucurbita maxima, rice bran, corn, black gram, chick pea, mung bean, pigeon pea, Prosopis julifl ora, Entada polystachia, E. scandens, Leucaena leucocephala, Gliricidia sepium, Bauhinia purpurea, Canavalia ensiformis, Lens culinaris, Pentaclethra macrophylla, Lupinus albus, Lupinus angustifolius, Lupinus mutablis, Phaseolus vulgaris, Vicia faba, Vigna aconiti-folia, Vigna subterranea, Vigna umbellata, Ricinus communis, Mucuna pru-riens. This inhibitor is also present in some unconventional seeds, for example
Fig. 1. Mechanism of action of protease inhibitors. Dark gray oval, E, trypsin inhibitor; light gray rectangle, I, inhibitor.

1. Trypsin Inhibitor 3
nontoxic Jatropha curcas and Moringa oleifera, having the potential for addi-tion to animal diets. Some cereals and nuts also contain this inhibitor.
1.3. Principle of Assay
Two widely used methods are presented here for quantifi cation of trypsin inhibitor activity. In both methods the inhibitor activity is measured indirectly by inhibiting the activity of trypsin. A synthetic substrate, benzyl-dl-arginine-para-nitroanilide (BAPNA) is subjected to hydrolysis by trypsin to produce yellow-colored p-nitroanilide. The degree of inhibition by the plant extract of the yellow-color production, a measure of trypsin inhibitor activity, is measured at 410 nm using a spectrophotometer. In the fi rst method (1), the results are expressed in terms of trypsin units inhibited, and the trypsin unit is an arbitrary unit representing an increase of 0.01 absorbance under the conditions of the assay; and in the second method (2,3) trypsin inhibitor activity is expressed as milligrams of pure trypsin inhibited.
2. MaterialsThe materials are the same for both methods:
1. Tris-buffer (0.05M, pH 8.2) containing 0.02M CaCl2. Dissolve 6.05 g Tris (hydroxymethylamino methane) and 2.94 g CaCl2.2H2O in 900 mL of water. Adjust the pH to 8.2, and make the volume up to 1 L with distilled water.
2. Substrate solution. Dissolve 40 mg of BAPNA hydrochloride in 1 mL of dimethyl sulfoxide and dilute to 100 mL with the Tris-buffer prewarmed to 37°C. Prepare the BAPNA solution daily and keep at 37°C while in use. Sometimes BAPNA falls out of the solution without any apparent reasons. To avoid this, dissolve BAPNA in dimethyl sulfoxide, which can be kept in a refrigerator for a week, and this solution can be diluted with the Tris-buffer before conducting the assay.
3. Trypsin solution. Dissolve 20 mg of accurately weighed trypsin (2× crystallized, salt free) in 1 L of 0.001M HCl. This solution can be stored in a refrigerator for 2 to 3 weeks without appreciable loss in activity.
4. 0.01M NaOH solution. Take 400 mg of NaOH, dissolve in 900 mL of distilled water, and dilute to 1 L with distilled water.
5. 0.001M HCl. Dilute 0.09 mL of concentrated hydrochloric acid [37% weight per volume (w/v)] to 1 L with distilled water.
3. Methods3.1. Preparation of Extract
The procedure for preparation of the extract is the same for both methods.Grind the sample, preferably using a ball mill, to pass through a sieve of 40
mesh. To 1 g of the sample add 50 mL of 0.01M NaOH and keep on a magnetic stirrer at low setting for 3 h at room temperature. The extraction can be hastened

4 Plant Secondary Metabolites
by using a homogenizer (Ultra-Turrax, [IKA Werke GmbH and Co. KG, Staufen, Germany], at 20,000 rpm) for 2 min at 0°C. The pH of the suspension is usually 9.5 to 9.8 (if pH is below 8.4, extraction should be repeated with a stronger NaOH solution so that pH of the suspension is between 8.4 and 10.0; seeNote 1). This suspension should be diluted to the point where 1 mL of the diluted suspension produces trypsin inhibition of 40% to 60% (see Note 2).
If the sample contains more than 5% fat, it should be freeze-dried and extracted with 50 mL of petroleum ether [boiling point (bp) 40–60°C] at room temperature until fat free; the residue should be allowed to air-dry before addition of 50 mL of 0.01M NaOH to 1 g of the sample.
3.2. Determination of Inhibitor [Method 1; Based on (1)]
1. Pipette aliquots (0, 0.6, 1.0, 1.4, and 1.8 mL) of the diluted suspension into dupli-cate sets of test tubes and make the volume up to 2.0 mL with distilled water.
2. Add 2 mL of trypsin solution to each test tube, and place the tubes in a water bath at 37°C.
3. To each tube, add 5 mL of the BAPNA solution previously warmed to 37°C, and exactly 10 min later terminate the reaction by adding 1 mL of 30% acetic acid.
4. After thorough mixing, centrifuge the content of each tube and measure the absorbance of the supernatant at 410 nm against a reagent blank.
5. Prepare the reagent blank by adding 1 mL of 30% acetic acid to a test tube containing trypsin and water (2 mL each) and then add 5 mL of the BAPNA solution.
6. A sample blank may be prepared by adding 5 mL of the BAPNA solution to 2 mL of the sample extract, incubating the mixture at 37°C for 10 min and then adding 1 mL of 30% acetic acid and 2 mL of the trypsin solution.
3.2.1. Expression of Activity
One trypsin unit (TU) is arbitrarily defi ned as an increase of 0.01 absorbance units at 410 nm per 10 mL of the reaction mixture under the conditions used here. Trypsin inhibitor activity is expressed in terms of trypsin-inhibiting units (TIUs).
3.2.2. Calculation
1. Plot TIU/mL versus volume of extracts (mL) taken for analysis (see Note 3). 2. TIU/g sample = extrapolated value × dilution factor [the factor by which the
original plant extract (1 g in 50 mL) was diluted so as to obtain an inhibition between 40% and 60% by 1 mL of the diluted extract].
3. When the plot of TIU/mL of extracts versus volume of extracts taken for the analysis does not give a linear correlation, calculate the TIU/mL by averaging values obtained for each volume of extracts. TIU/g sample = averaged value ×dilution factor.
1. Trypsin Inhibitor 5
3.3. Determination of Inhibitor [Method 2; Based on (2,3)]
1. Pipette the following solutions in a series of 10 mL tubes:
a. Reagent blank: 2 mL of deionized or distilled water b. Standard (40 μg trypsin): 2.0 mL trypsin solution and 2.0 mL distilled water c. Sample blank(s): 1.0 mL diluted sample extract and 1.0 mL distilled water d. Sample(s): 1.0 mL diluted sample extract, 1.0 mL distilled water, and 2.0 mL
trypsin solution
2. After mixing and preheating to 37°C for 10 min, pipette 5.0 mL of BAPNA solution (prewarmed to 37°C) into each tube and mix.
3. After exactly 10 min incubation at 37°C, add 1.0 mL of acetic acid (30%) to each tube to stop the reaction. Then add the trypsin solution (2.0 mL) to the reagent blank (a) and sample blank (c) tubes.
4. After centrifugation (at 3000 g for 10 min at room temperature), measure the absorbance of the clear solution at 410 nm. The color is stable for several hours.
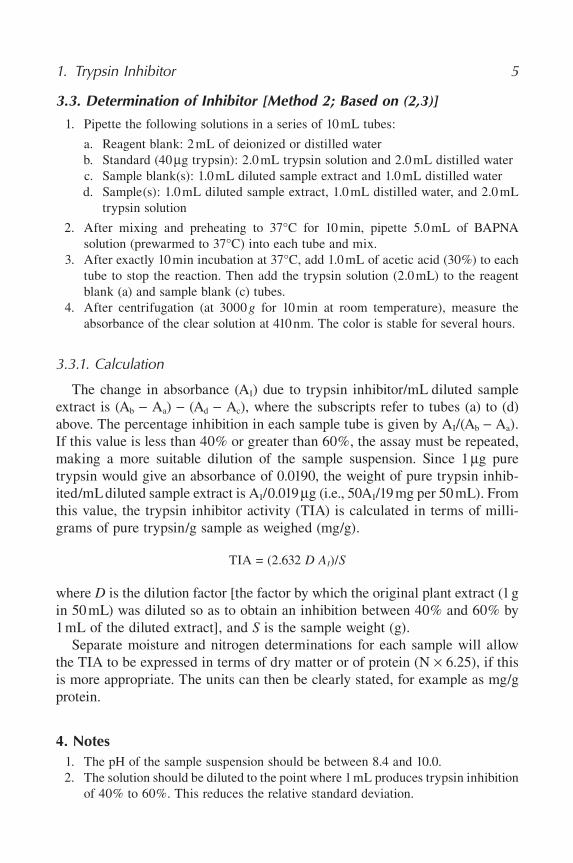
3.3.1. Calculation
The change in absorbance (AI) due to trypsin inhibitor/mL diluted sample extract is (Ab − Aa) − (Ad − Ac), where the subscripts refer to tubes (a) to (d) above. The percentage inhibition in each sample tube is given by AI/(Ab − Aa). If this value is less than 40% or greater than 60%, the assay must be repeated, making a more suitable dilution of the sample suspension. Since 1 μg pure trypsin would give an absorbance of 0.0190, the weight of pure trypsin inhib-ited/mL diluted sample extract is AI/0.019 μg (i.e., 50AI/19 mg per 50 mL). From this value, the trypsin inhibitor activity (TIA) is calculated in terms of milli-grams of pure trypsin/g sample as weighed (mg/g).
TIA = (2.632 D AI)/S
where D is the dilution factor [the factor by which the original plant extract (1 g in 50 mL) was diluted so as to obtain an inhibition between 40% and 60% by 1 mL of the diluted extract], and S is the sample weight (g).
Separate moisture and nitrogen determinations for each sample will allow the TIA to be expressed in terms of dry matter or of protein (N × 6.25), if this is more appropriate. The units can then be clearly stated, for example as mg/g protein.
4. Notes 1. The pH of the sample suspension should be between 8.4 and 10.0. 2. The solution should be diluted to the point where 1 mL produces trypsin inhibition
of 40% to 60%. This reduces the relative standard deviation.
6 Plant Secondary Metabolites
3. TIU is the difference between the 0 mL extract reading and the reading for each volume of extract (mL) taken minus the blank reading. TIU/mL is TIU/mL of extract taken and not TIU/mL of the assay volume (10 mL).
References 1. Kakade, M. L., Rackis, J. J., McGhee, J. E., and Puski, G. (1974) Determination
of trypsin inhibitor activity of soy products: a collaborative analysis of an improved procedure. Cereal Chem. 51, 376–382.
2. Kakade, M. L., Simons, N., and Liener, I. E. (1969) An evaluation of natural vs synthetic substrates for measuring the antitryptic activity of soybean samples. Cereal Chem. 46, 518–526.
3. Smith, C., Megen, W. V., Twaalfhoven, L., and Hitchcock, C. (1980) The determination of trypsin inhibitor levels in foodstuffs. J. Sci. Food Agric. 31,341–350.
7
From: Methods in Molecular Biology, vol. 393: Plant Secondary MetabolitesBy: H.P.S. Makkar, P. Siddhuraju and K. Becker © Humana Press Inc., Totowa, NJ
2
Chymotrypsin Inhibitor
Key Words: Casein; chymotrypsin inhibitor; casein; chymotrypsin determination; chymo-trypsin unit; protein degradability; amino acid; peptide availability.
1. IntroductionSimilar to the trypsin inhibitor, the chymotrypsin inhibitor also decreases
protein degradability in the intestine, resulting in lower availability of amino acids and peptides for production purposes. This adversely affects growth and other productive responses. This inhibitor is also heat labile.
1.1. Present in
Erythrina caffra, Glycine max, Phaseolus lunatus, Arachis hypogaea, Mac-rotyloma axillare, Vigna unguiculata, Solanum tuberosum, black gram, chick pea, pigeon pea, Phaseolus vulgaris, Psophocarpus tetragonolobus, Vicia faba, Vigna subterranea, Vigna umbellata.
1.2. Principle of Assay
The method described here is based on the spectrophotometric determination of the breakdown products of casein at 280 nm produced by a given concentra-tion of chymotrypsin, in the presence and absence of the inhibitor. It is based on the method of Kakade et al. (1).
2. Materials 1. Borate buffer, 0.1M, pH 7.6. Stock solution A: 0.2M solution of boric acid (12.4 g
in 1 L of distilled water). Stock solution B: 0.05M solution of borax (19.05 g in 1 L of distilled water; 0.2M in terms of sodium borate). 50 mL of solution A +2 mL

8 Plant Secondary Metabolites
of solution B and dilute to a total of 200 mL with distilled water. Check pH, which should be 7.6.
2. Casein solution. Suspend 1 g of casein in 80 mL of 0.1M the borate buffer, pH 7.6, and completely dissolved by heating on a steam bath for 15 min. Cool this solution, adjust the pH to 7.6 and make the volume up to 100 mL by the borate buffer.
3. Chymotrypsin stock (40mg/mL). Dissolve 4 mg chymotrypsin in 100 mL of 0.001M HCl containing 0.08M CaCl2.2H2O.
4. Trichloroacetic acid (TCA) reagent. Take 18 g of TCA and 18.0 g of anhydrous sodium acetate, add 20 mL of glacial acetic acid, and make the volume up to 1000 mL with distilled water.
5. HCl (0.001M) containing 0.08M CaCl2.2H2O. Dilute 0.09 mL concentrated HCl [37% weight/volume (w/v)] to approximately 900 mL distilled water. To it add 11.76 g CaCl2.2H2O and make the volume up to 1 L with distilled water.
6. NaOH (1M). Dissolve 4 g NaOH in 100 mL distilled water.
3. Methods3.1. Preparation of Extract
Take 1 g of defatted (by using petroleum ether) and ground sample (ground preferably using a ball mill) and suspend in 10 mL of distilled water (seeNote 1). Adjust its pH to 7.6 using 1M sodium hydroxide solution. After shaking for 1 h on a magnetic stirrer, centrifuge (3000 g, 10 min) the suspension.
3.2. Preparation of Calibration Curve
1. Pipette the stock solution of chymotrypsin (0.2 to 1.0 mL) into a triplicate set of tubes (one set for each level of enzyme) and make the volume up to 1.0 mL with 0.001M HCl containing 0.08M Ca2+.
2. Add 1 mL of 0.1M borate buffer (pH 7.6) to each tube, and transfer the tubes to a water bath at 37°C. To one of the triplicate tubes add 6 mL of the TCA reagent (this tube serves as a blank for the other two). Then to the other two tubes in each set add 2 mL of the casein solution prewarmed to 37°C.
3. Allow the tubes to remain at 37°C for exactly 10 min, and then stop the reaction by adding 6 mL of the TCA to the tubes.
4. After allowing it to stand at room temperature for at least 30 min, fi lter the suspension, and measure the absorbance of the fi ltrate at 275 nm against the appropriate blank.
5. One chymotrypsin unit (CU) is arbitrarily defi ned as an increase of 0.01 absorb-ance unit at 275 nm in 10 min per 10 mL of the reaction mixture under the condi-tions described here.
3.3. Determination of Inhibitor
1. Take the sample extract (0.25, 0.5, 0.75 mL) into a triplicate set of test tubes (one set for each level of the extract), bring the volume to 1.0 mL with the borate buffer,
2. Chymotrypsin Inhibitor 9
and add 1 mL of the stock chymotrypsin. Transfer these tubes to a water bath adjusted at 37°C.
2. To one of the triplicate tubes add 6 mL of the TCA reagent (this tube serves as a blank for the other two). Then to each tube add 2 mL of the casein solution (prewarmed to 37°C). After exactly 10 min, stop the reaction by adding 6 mL of the TCA to the other two tubes.
3. After allowing it to stand at room temperature for at least 30 min, fi lter the suspension and measure the absorbance of the fi ltrate at 275 nm against the appropriate blank.
4. The chymotrypsin inhibitor activity is defi ned as the number of chymotrypsin units inhibited (CUI), and the results can be expressed as CUI per milligram of protein or per gram of the sample. For expressing CUI per milligram of protein, the protein content of the extract can be determined using the method of Lowry et al. (2). True chymotrypsin inhibitor activity may be obtained by taking different volumes of the sample extract and then extrapolating to zero volume of the inhibi-tor (sample) solution.
4. Note 1. The 0.1M borate buffer (pH 7.6) can also be used for the extraction of chymo-
trypsin inhibitor from the samples.
References 1. Kakade, M. L., Swenson, D. H., and Liener, I. E. (1970) Note on the determination
of chymotrypsin and chymotrypsin inhibitor activity using casein. Anal. Biochem.33, 255–258.
2. Lowry, O. H., Rosebrough, N. J., Farr, A. L., and Randall, R. J. (1951) Protein measurement with the Folin phenol reagent. J. Biol. Chem. 193, 265–275.
11
From: Methods in Molecular Biology, vol. 393: Plant Secondary MetabolitesBy: H.P.S. Makkar, P. Siddhuraju and K. Becker © Humana Press Inc., Totowa, NJ
3
a-Amylase Inhibitor
Key Words: α-Amylase inhibitor; Phaseolus vulgaris; starch; sorghum; dinitrosalicylic acid; maltose; hyperglycemia; hyperinsulinemia; α-amylase inhibitor activity.
1. Introduction1.1. Nature, Mechanism of Action, and Biological Actions
α-Amylase inhibitors are heat-labile proteins that are active against salivary, pancreatic, bacterial, or insect α-amylases. Two thirds of the albumin fractions of wheat are composed of multiple protein components capable of inhibiting α-amylases of diverse origin. Three major groups of α-amylase have been characterized, based on molecular weight: 60,000, 24,000, and 12,500 Da. The inhibitor forms a complex with amylase. The complex formation can inactivate the amylase and in turn cause reduction in starch digestion. The fact that the wheat amylase inhibitors are highly effective toward insect amylases suggests that they are part of a defense mechanism of the seed against insect attack, and as far as animal nutrition is concerned, they decrease the availability of starch. On the other hand, in human subjects it was also demonstrated that the wheat amylase inhibitors could reduce hyperglycemia and hyperinsulinemia in dia-betic patients. The purifi ed inhibitors extracted from the beans are a glycopro-tein (10% carbohydrate) with a molecular weight of 40,000 to 50,000 Da, 1 mol of which reacts with pancreatic amylase to form a 1 : 1 complex. The detection of starch in the feces of rats fed diets containing raw beans with high antiamy-lase activity suggests that this factor may be active in vivo. Extracts from Leoti sorghum grain have been reported to be active against salivary and pancreatic amylases, implying that they inhibit dietary starch digestion in the gastrointes-tinal tract. Administration of amylase inhibitors to chickens depressed growth

12 Plant Secondary Metabolites
and caused pancreatic hypertrophy. To offer potentially available starch in the animal diet to increase the productivity of monogastric animals, screening of amylase inhibitor (specifi c and nonspecifi c) in the potential diet constituents could be one of the parameters of feed quality evaluation.
1.2. Present in
Lens culinaris, Psophocarpus tetragonolobus, Cicer arietinum, Vigna aco-nitifolia, Phaseolus vulgaris, wheat, oats, sorghum, rye, barley, mango seeds, and potatoes.
1.3. Principle of Assay
α-Amylase hydrolyses α-1,4 linkages of starch molecules in a random manner. The reducing sugars (mainly maltose) produced by the action of α-amylase react with dinitrosalicylic acid and reduce it to a brown/orange-red–colored product, nitroaminosalicylic acid. The starch hydrolyzed product concentration under a specifi ed level of α-amylase enzyme, with and without inhibitor, is used to express the α-amylase inhibitor activity (1).
2. Materials 1. Starch solution. Take 1 g of potato amylopectin or soluble starch and dissolve in
100 mL of 0.02M phosphate buffer (pH 7.0). 2. Dinitrosalicylic acid reagent. It can be prepared in two ways: (a) To 300 mL of
4.5% carbonate free NaOH, add 880 mL of 1% dinitrosalicylic acid and 255 g of Rochelle salt (potassium sodium tartarate, KNaC4H4O6.4H2O), mix until dissolved and keep in tightly stoppered brown bottle (2). (b) Dissolve at room temperature 1 g of 3,5-dinitrosalicylic acid in 20 mL of 2N NaOH, add 50 mL of distilled water followed by 30 g of Rochelle salt and make the volume up to 100 mL with distilled water. Protect this solution from CO2 and store at 4°C (3).
3. α-Amylase enzyme solution. Dissolve 6 mg of α-amylase in 200 mL of 0.2M phosphate buffer (pH 7.0) containing 0.006M NaCl. From this stock solution take 10 mL and dilute to 100 mL with the same buffer solution. The fi nal concentration of enzyme in the solution is 30 μg/mL.
4. Maltose standard solution. Dissolve 50 mg of maltose in 50 mL of distilled water and store at 4°C.
5. NaOH (4.5%). Weigh 4.5 g NaOH, dissolve in approximately 80 mL distilled water, and make the fi nal volume up to 100 mL with distilled water.
6. NaOH (2N). Weigh 8 g NaOH, dissolve in approximately 80 mL distilled water, and make the fi nal volume up to 100 mL with distilled water.
7. Phosphate buffer (0.2M, pH 7.0). Take 39 mL of 0.2M monobasic sodium phosphate solution and mix with 61 mL of 0.2M dibasic sodium phosphate solution and dilute to a total volume of 200 mL.

3. a-Amylase Inhibitor 13
8. Phosphate buffer (0.02M, pH 7.0). Take 10 mL of the above phosphate buffer (0.2M) and dilute it to 100 mL with distilled water.
3. Method3.1. Preparation of Maltose Calibration Curve
Pipette aliquots of 0.1 to 1.0 mL of maltose (100–1000 μg) solution into test tubes and make up the volume to 1 mL with suitable addition of distilled water. To each tube, add 2.0 mL of the dinitrosalicylic acid reagent. Cover the tubes with marbles, keep the tubes in a boiling water bath for 10 min, cool the tubes, and add 10 mL of distilled water to each tube. The orange-red color formed is measured at 540 nm against a reagent blank using a spectrophoto-meter and a calibration curve is developed (2).
3.2. Determination of a-Amylase Enzyme Activity
1. Preincubate all the reagents for 15 min at 37°C in a water bath. 2. Pipette 0.5 mL of 1% starch solution, add to it 0.25 mL of the phosphate buffer
(0.2M, pH 7.0) and 0.25 mL of α-amylase enzyme solution. 3. Similarly, prepare a second set of test tubes (blank) by using the phosphate buffer
in place of the enzyme solution. Prepare the third set of test tubes containing 0.5 mL of starch solution, 2 mL of dinitrosalicylic acid reagent, 0.25 mL of the phosphate buffer, and 0.25 mL of α-amylase enzyme solution; this set is called the zero time control.
4. Incubate all the tubes at 37°C for 3 min. At the end of the incubation, add 2 mL of dinitrosalicylic acid reagent to the fi rst and second set of tubes to stop the reaction and transfer all the tubes to a boiling water bath for 10 min.
5. After cooling under cold water, add 10 mL of distilled water, mix thoroughly, and take absorbance at 540 nm against the blank. Liberated reducing sugars are expressed as maltose equivalent using the calibration curve (3).
6. One unit of enzyme activity is defi ned as that amount which liberates 1 μmol of reducing groups (calculated as maltose)/min from soluble starch at 37°C, pH 7.0, and under the specifi ed experimental condition.
3.3. Preparation of Extract and Quantifi cation of a-Amylase Inhibitor Activity
1. Take 1 g of ground sample (ground preferably using a ball mill) and extract with 10 mL of distilled water for 12 h at 4°C using a magnetic stirrer.
2. Centrifuge the suspension at 5000 g for 20 min. Collect the supernatant in a test tube (see Note 1). From this supernatant, take an aliquot of 0.25 mL and incubate with 0.25 mL of the enzyme solution for 15 min at 37°C. To this mixture, add 0.5 mL of 1% starch solution (prewarmed at 37°C; see Note 2).

14 Plant Secondary Metabolites
3. The assay is conducted as described above. The sample blank should be prepared with the addition of 0.25 mL enzyme solution at the end of 3 min incubation after adding the dinitrosalicylic acid reagent.
4. One unit of α-amylase activity inhibited is defi ned as one α-amylase inhibitory unit (AIU) (1).
4. Notes 1. Samples containing a high amount of phenolic constituents, may provide nonspe-
cifi c α-amylase inhibitor activity similarly to that of a specifi c one. The relative reduction of such components (using insoluble polyvinylpyrrolidone) in the samples before extraction may reduce nonspecifi c interference.
2. Before starting the assay, preincubation of all the reagents at 37°C is necessary.
References 1. Deshpande, S. S., Sathe, S. K., Salunkhe, D. K., and Cornforth, D. P. (1982)
Effects of dehulling on phytic acid, polyphenols, and enzyme inhibitors of dry beans (Phaseolus vulgaris L.). J. Food Sci. 47, 1846–1850.
2. Sumner, J. B. (1924) The estimation of sugar in diabetic urine, using dinitrosali-cylic acid. J. Biol. Chem. 62, 287–290.
3. Bernfeld, P. (1955). Amylases, α and β, in Methods in Enzymology, vol. 1 (Colowick, S. and Kaplan, N. O., eds.), Academic Press, New York, pp. 149–158.
15
From: Methods in Molecular Biology, vol. 393: Plant Secondary MetabolitesBy: H.P.S. Makkar, P. Siddhuraju and K. Becker © Humana Press Inc., Totowa, NJ
4
Phytohemagglutin/Lectin
Key Words: Lectin; phytohemagglutin; hemagglutination; agglutination; human blood erythrocytes; cattle blood erythrocytes; intestinal epithelium; hyperplasia; polyamines; cell membranes; insulin; hemagglutinating unit; Con A; protein catabolism; fat; glycogen; lectin inactivation; trypsinized erythrocyte suspension.
1. Introduction1.1. Nature, Mechanism of Action, and Biological Effects
Lectins are proteins in nature with molecular weight ranging from 60,000 to 100,000 Da. Many lectins contain covalently bound sugar moieties and are glycoprotein in nature. These are also called phytohemagglutins because they agglutinate red blood cells.
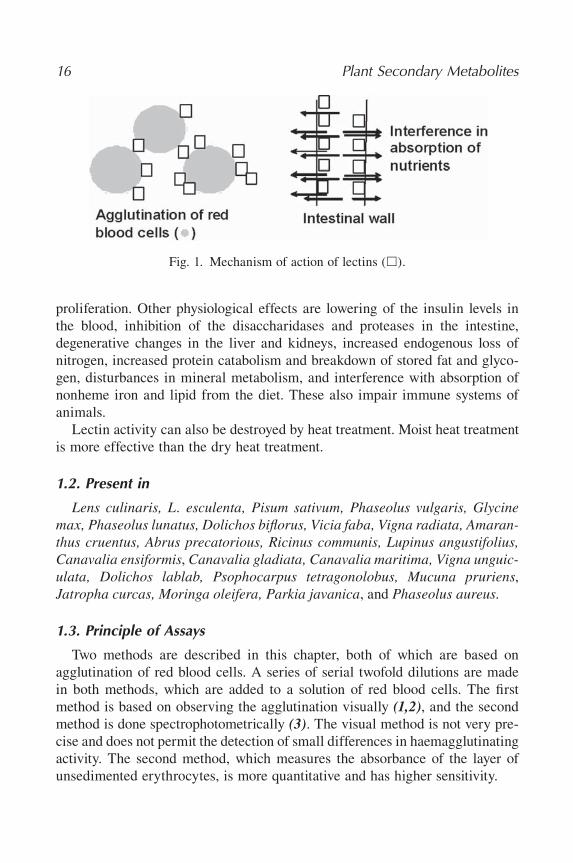
Lectins are widely distributed in the plant kingdom and have the unique property of binding to carbohydrate-containing molecules, with a high degree of specifi city toward the sugar component. One obvious manifestation of this property is their ability to agglutinate the red blood cells from various species of animals, which is because of the interaction of multiple binding sites on the lectin molecule with specifi c glycoconjugate receptors on the surface of the cell membrane (Fig. 1). Lectins inhibit growth of the animals. About 60% of the lectin survives intestinal transit and becomes bound to the intestinal epithelium (Fig. 1), where it causes disruption of the brush border and atrophy of the microvilli, and reduces the viability of the epithelial cells. As a consequence of the interaction of lectin with the epithelial surface of the proximal small intes-tine, there is an increase in the weight of the small intestine. This is because of the hyperplasia of the crypt cells, an effect that is believed to involve the accumulation of polyamines, mostly spermidine, a known stimulant of cellular
16 Plant Secondary Metabolites
proliferation. Other physiological effects are lowering of the insulin levels in the blood, inhibition of the disaccharidases and proteases in the intestine, degenerative changes in the liver and kidneys, increased endogenous loss of nitrogen, increased protein catabolism and breakdown of stored fat and glyco-gen, disturbances in mineral metabolism, and interference with absorption of nonheme iron and lipid from the diet. These also impair immune systems of animals.
Lectin activity can also be destroyed by heat treatment. Moist heat treatment is more effective than the dry heat treatment.
1.2. Present in
Lens culinaris, L. esculenta, Pisum sativum, Phaseolus vulgaris, Glycine max, Phaseolus lunatus, Dolichos bifl orus, Vicia faba, Vigna radiata, Amaran-thus cruentus, Abrus precatorious, Ricinus communis, Lupinus angustifolius, Canavalia ensiformis, Canavalia gladiata, Canavalia maritima, Vigna unguic-ulata, Dolichos lablab, Psophocarpus tetragonolobus, Mucuna pruriens,Jatropha curcas, Moringa oleifera, Parkia javanica, and Phaseolus aureus.
1.3. Principle of Assays
Two methods are described in this chapter, both of which are based on agglutination of red blood cells. A series of serial twofold dilutions are made in both methods, which are added to a solution of red blood cells. The fi rst method is based on observing the agglutination visually (1,2), and the second method is done spectrophotometrically (3). The visual method is not very pre-cise and does not permit the detection of small differences in haemagglutinating activity. The second method, which measures the absorbance of the layer of unsedimented erythrocytes, is more quantitative and has higher sensitivity.
Fig. 1. Mechanism of action of lectins (�).
4. Phytohemagglutin/Lectin 17
2. Materials2.1. Visual Method
1. Phosphate-buffered saline (PBS) (pH 7.2). Dissolve 8.2 g NaCl, 0.136 g KH2PO4,0.224 g KCl, and 1.14 g Na2HPO4 in 1 L of distilled water (composition is 140 mM NaCl, 3 mM KH2PO4, 8 mM KCl, and 1 mM Na2HPO4).
2. Cattle blood erythrocyte suspension (1%). Collect the blood into a fl ask contain-ing ethylenediaminetetraacetic acid (EDTA)-sodium salt (a pinch), store in a refrigerator (4° to 6°C) and use within 7 days. Centrifuge the blood at 1500 g for 5 min, discard the supernatant, and wash the erythrocytes three to four times with the PBS in the ratio of 1 : 5 [volume per volume (v/v)]. Add washed erythrocytes (4 mL) to 95 mL of the PBS. To this, add 10 mg of crystalline trypsin dissolved in 1 mL of the PBS and keep it for 90 min at 37°C. After repeated washing (three to four times) with the PBS, prepare 1% erythrocytes suspension using the PBS for the assay (see Note 1).
2.2. Spectrophotometric Method
1. Saline. Dissolve 0.9 g NaCl in 100 mL distilled water. 2. Phosphate-buffered saline (PBS). Same as in the visual method. 3. Alsever’s solution. Dissolve 2.05 g of glucose, 0.8 g of sodium citrate, and 0.42 g
of NaCl in 100 mL of distilled water and bring to pH 6.1 by adding solid citric acid.
4. Anticoagulant. Dissolve 8 g of sodium citrate in 54 mL of 37% formaldehyde and 100 mL saline.
5. Trypsin (1%). Dissolve 10 mg of crystalline trypsin in 1 mL of the PBS. 6. Stock blood suspension. Take rabbit/cattle/human blood and to it add an equal
volume of Alsever’s solution containing 1/30 volume of the anticoagulant. This suspension can be stored for 2 weeks at 4°C.
7. Concanavalin A (ConA) (for example, from Sigma, St. Louis, MO). 0.01% solution of the ConA in saline is freshly prepared prior to each run.
3. Methods3.1. Visual Method
3.1.1. Preparation of Extract
Weigh 1.0 g of the defatted sample, add 20 mL of the PBS, and stir the suspension using a magnetic stirrer for 16 h at approximately 1° to 4°C (seeNote 2). Centrifuge the contents at 4000 g for 20 min and collect the supernatant (the contents can also be fi ltered through Whatman No. 540 fi lter paper and fi ltrate used for the assay).
18 Plant Secondary Metabolites
3.1.2. Determination of Lectin
1. Prepare a twofold serial dilution of the sample with the PBS in the wells of a microtiter plate and mix with equal volume of 1% erythrocyte suspensions (fi nal volume 0.1 mL) (see Note 2).
2. Examine the sedimentation of 1% erythrocyte suspensions after 2 h incubation at room temperature.
3. A positive pattern, indicating agglutination, is a uniform effacement of the bottom of the well by erythrocytes, and a negative pattern, indicating no agglutination, is a circular clump of erythrocytes surrounded by a concentric clear zone (seeNote 3).
4. Also examine the contents of the wells microscopically at 2 and 20 h for aggluti-nation, by resuspending the contents of each well with a Pasteur pipette and transferring a drop to a glass microscope slide and covering with a glass coverslip. The formation of erythrocyte aggregates of at least four or fi ve cells that are not disturbed by gentle movement is considered as evidence of agglutination.
5. Hemagglutination activity is defi ned as the inverse of the amount of material per milliliter in the last dilution giving positive agglutination (4) (see Note 4).
3.2. Spectrophotometric Method
3.2.1. Preparation of Standard Trypsinized Erythrocyte Suspension
Trypsinized erythrocytes should be prepared on the day of the assay. Erythrocytes are collected from the stock blood suspension by centrifugation at room temperature in a clinical centrifuge (1500 g, 5 min). These are washed three to four times with saline (approximately 5 mL of saline for each milliliter of packed erythrocytes). The packed erythrocytes are added to the PBS (about 4 mL of cells per 100 mL of the PBS) to give a suspension with an absorbance of 2 at 620 nm. To 10 mL of this suspension is added 1 mL of 1% trypsin solution, and the mixture is incubated at 37°C for 1 h. The trypsinized erythro-cytes are then washed four to fi ve times with saline, as above, to remove the last traces of trypsin and are fi nally suspended in suffi cient saline to give a standard erythrocyte suspension with an absorbance of 1 at 620 nm (1.2 to 1.5 mL packed cells/100 mL). About 80 mL of standard erythrocyte suspension is obtained from 5 mL of the stock blood suspension (see Note 5).
3.2.2. Preparation of Extract
Weigh 1.0 g of the defatted sample, add 10 mL of the PBS, and stir the suspension using a magnetic stirrer for 16 h at approximately 1° to 4°C. Centri-fuge the contents at 4000 g for 20 min and collect the supernatant (the contents can also be fi ltered through Whatman No. 540 fi lter paper and fi ltrate used for the assay).
4. Phytohemagglutin/Lectin 19
3.2.3. Determination of Hemagglutination Activity
1. Prepare a twofold serial dilution of the starting solution (supernatant) in a fi nal volume of 1 mL of the PBS in disposable plastic cuvettes.
2. To each cuvette, add 1 mL of the standard erythrocytes suspension and mix the contents of each cuvette. Place the cuvettes in a rack that holds them in an exactly vertical position.
3. After 2.5 h at room temperature, the cuvettes are read in a spectrophotometer at 620 nm, due care being taken not to agitate the contents. Each experiment should include a set of two to four control cuvettes, containing 1 mL of the PBS and 1 mL of standard blood suspension.
3.2.4. Calculation of Hemagglutinating Activity
Hemagglutinating activity is expressed in arbitrary units. The number of units equals the dilution number, which causes a decrease of 50% in the absorbance of the erythrocyte suspension in 2.5 h under the condition described above. This dilution number (x) is calculated from the readings of the two cuvettes that have absorbance nearest to half of the absorbance of the control (E50), one of the readings (EA) being lower and the other (EB) being higher than E50. The following equation is then used (5):
Log x = Log A + Log 2 (E50 − EA)/(EB − EA)
whereA = dilution number of tube A (nearest tube having an absorbance less than
E50)EA = absorbance of tube AEB = absorbance of tube B (nearest tube having an absorbance greater than
E50).The specifi c hemagglutinating activity of the material tested, HU/mg protein,
is calculated from the value of x and from the protein concentration in the start-ing solution (see Note 6).
EXAMPLE
The soybean extract (SBE): 1 g defatted soybean sample is extracted by using 10 mL of saline. Protein content of the extract is determined by Lowry’s method (6) is 0.12 mg protein/mL).
A twofold serial dilution is made and EA, EB, and A are 0.23, 0.28, and 16, respectively. E50 equals 0.25; absorbance of 1 mL each of PBS; and the eryth-rocyte suspension = 0.50.
20 Plant Secondary Metabolites
Log x = Log 16 + Log 2 (0.250 − 0.230)/(0.280 − 0.230)= 1.2040 + (0.301 × 0.4)= 1.2040 + 0.1204= 1.3241
The antilog of both sides gives x = 21.Hemagglutinating activity of SBE = 21 units/mL.Specifi c hemagglutinating activity of the SBE, HU/mg protein = (21/0.12) =
175.The specifi c hemagglutinating activity of any seed sample extracts may also
be compared with a standard, for example ConA or purifi ed soybean lectin, soyin.
4. Notes 1. Human blood erythrocytes (A, B, and O group) can also be used (1–3%
erythrocyte suspension) for the phytohemagglutinating assay. 2. Ultra-Turrax (IKA Werke GmbH and Co. KG, Staufen, Germany), (20,000 rpm)
for 5 min (2 × 2.5 min) under ice-cold water bath conditions can also be used for the extraction. Extraction of sample, preparation of blood erythrocytes, and two-fold dilution can also be done using normal saline solution (0.9% NaCl), pH 7.2 instead of the PBS.
3. The limit of experimental accuracy for this technique is ±1 dilution. 4. The results can also be expressed using a standard lectin, concanavalin A (ConA),
with the assay performed under the specifi ed experimental conditions simultane-ously with the sample extract.
5. The method is highly reproducible (within ±5%) when the assay is done with the same preparation of standard erythrocyte suspension. With different pre-parations of erythrocytes, the variation can be higher. It is therefore advisable to include in each assay a standard ConA with known specifi c activity, for comparison.
6. The protein content of the test sample can be estimated from N content (N × 6.25) or by the Lowry et al. (6) method.
References 1. Gordon, J. A., and Marquardt, M. D. (1974) Factors affecting hemagglutination
by concanavalin A and soybean agglutinin. Biochim. Biophys. Acta 332,136–144.
2. Marquardt, M. D., and Gordon, J. A. (1974) Haemagglutinins in commercial preparations of monsaccharides. Nature 252, 175–176.
3. Liener, I. E. (1955) Photometric determination of the hemagglutinating activity of soyin and crude soybean extracts. Arch. Biochem. Biophys. 54,223–231.

4. Phytohemagglutin/Lectin 21
4. Grant, G., More, L. J., McKenzie, N. H., Stewart, J. C., and Pusztai, A. (1983) A survey of the nutritional and haemagglutination properties of legume seeds generally available in the UK. Br. J. Nutr. 50, 207–214.
5. Lis, H., and Sharon, N. (1972) Soy bean (Glycine max) agglutinin. Methods Enzymol. 28, 360–365.
6. Lowry, O. H., Rosebrough, N. J., Farr, A. L., and Randall, R. J. (1951) Protein measurement with the Folin phenol reagent. J. Biol Chem. 193, 265–275.
23
From: Methods in Molecular Biology, vol. 393: Plant Secondary MetabolitesBy: H.P.S. Makkar, P. Siddhuraju and K. Becker © Humana Press Inc., Totowa, NJ
5
Phytic Acid
Key Words: Phytic acid; myoinositol; Wade reagent; metal ions chelater; Amberlite AG1-X8 anion exchange resin; antioxidant; legumes; cereals; phytate precipitation.
1. Introduction1.1. Nature, Mechanism of Action, and Biological Effects
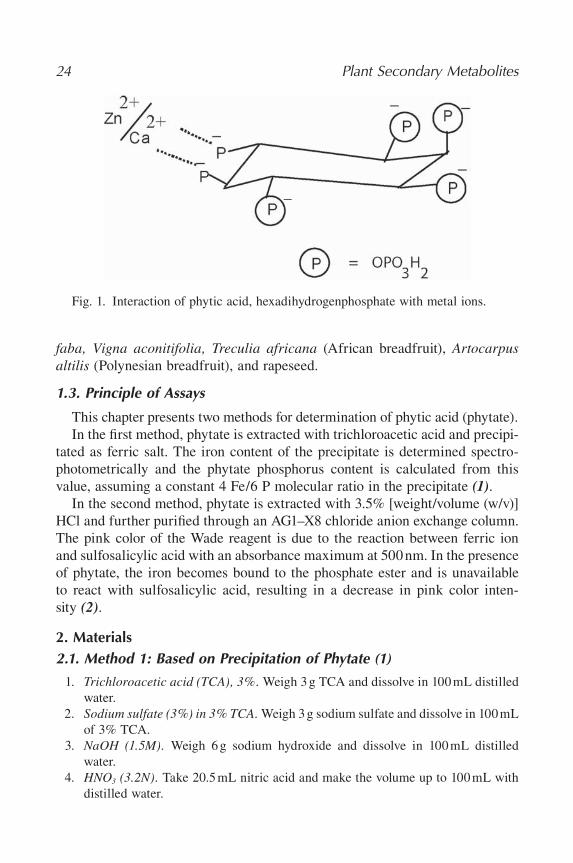
Phytic acid, a cyclic compound (1,2,3,4,5,6-hexakis dihydrogen phosphate myoinositol) is a common storage form of phosphorus in seeds and is also considered as an antinutritional factor. Phytic acid, as a result of possessing negative charge at a wide range of pH values, has strong affi nity to bind metal ions such as with calcium, zinc, and iron (Fig. 1). This leads to interference in the absorption of these minerals from small intestine and adversely affects various metabolic processes. In addition, phytic acid is also known to complex with proteins and starch, resulting in reduced digestibility of these nutrients. The phosphorus in phytic acid is not nutritionally available to monogastric animals. Nonetheless, non-antinutritive concentration of phytic acid in dietary sources is recently considered to be a potential antioxidant. Reduction in iron-induced oxidative injury and reversal in initiation of colorectal tumorigenesis have also been observed. Phytic acid has recently been suggested to have a protective role in carcinogenesis.
1.2. Present in
Glycine max, Cicer arietinum, Vigna mungo, Vigna radiata, Entada scan-dens, Cajanus cajan, Lablab purpureus, Lens culinaris, Phaseolus lunatus, Phaseolus vulgaris, Moringa oleifera, Jatropha curcas, Entada scandens, Ses-bania sesban, Sesbania bispinosa, Triticum vulgare, Mucuna pruriens, Vicia
24 Plant Secondary Metabolites
faba, Vigna aconitifolia, Treculia africana (African breadfruit), Artocarpus altilis (Polynesian breadfruit), and rapeseed.
1.3. Principle of Assays
This chapter presents two methods for determination of phytic acid (phytate).In the fi rst method, phytate is extracted with trichloroacetic acid and precipi-
tated as ferric salt. The iron content of the precipitate is determined spectro-photometrically and the phytate phosphorus content is calculated from this value, assuming a constant 4 Fe/6 P molecular ratio in the precipitate (1).
In the second method, phytate is extracted with 3.5% [weight/volume (w/v)] HCl and further purifi ed through an AG1–X8 chloride anion exchange column. The pink color of the Wade reagent is due to the reaction between ferric ion and sulfosalicylic acid with an absorbance maximum at 500 nm. In the presence of phytate, the iron becomes bound to the phosphate ester and is unavailable to react with sulfosalicylic acid, resulting in a decrease in pink color inten-sity (2).
2. Materials2.1. Method 1: Based on Precipitation of Phytate (1)
1. Trichloroacetic acid (TCA), 3%. Weigh 3 g TCA and dissolve in 100 mL distilled water.
2. Sodium sulfate (3%) in 3% TCA. Weigh 3 g sodium sulfate and dissolve in 100 mL of 3% TCA.
3. NaOH (1.5M). Weigh 6 g sodium hydroxide and dissolve in 100 mL distilled water.
4. HNO3 (3.2N). Take 20.5 mL nitric acid and make the volume up to 100 mL with distilled water.
Fig. 1. Interaction of phytic acid, hexadihydrogenphosphate with metal ions.

5. Phytic Acid 25
5. FeCl3 solution. Dissolve 583 mg FeCl3 in 100 mL of 3% TCA. 6. Potassium thiocyanate (KSCN), 1.5M. Dissolve 29.15 g of potassium thiocyanate
in 200 mL distilled water. 7. Stock standard Fe(NO3)3 solution. Weigh 433 mg Fe(NO3)3 and dissolve in 100 mL
of distilled water in a volumetric fl ask.
2.2. Method 2: Based on Reaction with Wade’s Reagent (2)
1. HCl (3.5% w/v). Take 50 mL of concentrated HCl (37% w/v) and dilute to 529 mL with distilled water.
2. NaCl (0.7M). Dissolve 40.91 g NaCl in 1 L of distilled water. 3. NaCl (0.1M). Take 100 mL of 0.7 M NaCl solution and add to it 600 mL of distilled
water. 4. Wade reagent. Take 30 mg of FeCl3.6H2O and 300 mg of sulfosalicylic acid in a
100-mL volumetric fl ask, dissolve in approximately 70 mL distilled water, and make the volume up to 100 mL with distilled water.
5. Amberlite AG1–X8 (200–400 mesh) anion-exchange resin. Take 0.5 g of resin (commercially available; Bio-Rad Laboratories, Richmond, CA) and fi ll in a 0.75 cm × 25 cm column plugged with a small quantity of glass wool.
3. Methods3.1. Method 1
1. Weigh a fi nely ground (40 mesh, ground preferably using a ball mill) sample estimated to contain 5 to 30 mg phytate-P into a 125-mL Erlenmeyer fl ask. Generally, the amount weighed for cereals and legumes is 500 to 700 mg.
2. Extract phytate in 50 mL of 3% TCA by shaking on a magnetic stirrer for 30 min or with occasional swirling by hand for 45 min.
3. Centrifuge the suspension (3000 g, 10 min) and transfer a 10-mL aliquot of the supernatant to a 40-mL conical centrifuge tube.
4. Add rapidly 4 mL of FeCl3 solution to the aliquot in the centrifuge tubes. Heat the contents in a boiling water bath for 45 min. If the supernatant is not clear after 30 min, add one or two drops of 3% sodium sulfate in 3% TCA and continue heating.
5. Centrifuge (3000 g, 10–15 min) and carefully decant the clear supernatant. Wash the precipitate twice by dispersing it well in 20 to 25 mL 3% TCA. Heat it in boiling water for 5 to 10 min and then centrifuge (3000 g, 10 min). Repeat the washing of the precipitate with distilled water.
6. Disperse the precipitate in a few milliliters of water and add 3 mL of 1.5N NaOH with mixing. Bring volume to approximately 30 mL with distilled water and heat in boiling water for 30 min.
7. Filter hot (quantitatively) through a moderately retentive paper (Whatman No. 2). Wash the precipitate with 60 to 70 mL of hot distilled water and discard the fi ltrate.
26 Plant Secondary Metabolites
8. Transfer and dissolve the precipitate that is on the fi lter paper into the 100 mL volumetric fl ask containing 40 mL of hot 3.2N HNO3. Wash paper with several portions of distilled water and collect the washings in the same fl ask.
9. Cool fl ask and contents to room temperature and bring the volume to 100 mL with distilled water.
10. Transfer a 5-mL aliquot to another 100-mL volumetric fl ask and dilute to approxi-mately 70 mL with distilled water.
11. Add 20 mL of 1.5M KSCN and bring the volume to 100 mL with distilled water, and read the color immediately (within 1 min) at 480 nm using a spectrophotometer.
12. Run a reagent blank with each set of samples.
3.1.1. Preparation of Fe(NO3)3 Calibration Curve
Take 2.5 mL of the stock Fe(NO3)3 solution and make the volume up to 250 mL in a volumetric fl ask. Pipette 2.5-, 5-, 10-, 15- and 20-mL aliquots of this working standard into a series of 100-mL volumetric fl asks and dilute them to approximately 70 mL with distilled water. Then proceed from step 11 in Section 3.1.
3.1.2. Calculation
Determine the micrograms of iron present in the test from the calibration curve, and calculate the phytate P as per the following equation:
Phytate P mg/100 g sample = [Fe (μg) × 15]/Weight of sample in g
Correct the values obtained for dry matter of the sample.
3.2. Method 2
1. Extract 5 g of plant materials (40 mesh, ground preferably using a ball mill) with 100 mL of 3.5% HCl for 1 h at room temperature using a magnetic stirrer. Centrifuge the contents at 3000 g for 10 min at room temperature and collect the supernatant.
2. Dilute an aliquot, between 1 mL and 5 mL of the supernatant (depending on the level of phytate) to 25 mL with distilled water (see Note 1). Pass 10 mL of the diluted sample extract through an AG1 X8 chloride anion exchange (200–400 mesh) column (0.5 g) (see Note 2).
3. Inorganic phosphorus and other interfering compounds are eluted with 15 mL of 0.1M NaCl, and subsequently the phytate is eluted with 15 mL of 0.7M NaCl (3).
4. Take 3 mL of the above-eluted sample in a separate test tube and add 1 mL of the Wade reagent. Vortex and then centrifuge the mixture at 3000 g for 10 min. Measure the absorbance value at 500 nm against a reagent blank.
5. Phytic Acid 27
3.2.1. Preparation of Calibration Curve
Sodium phytate (for example, from Sigma, St. Louis, MO) is used as a standard since it is soluble in water and does not require conversion to free phytic acid. Prepare a series of standard solutions containing 5 to 40 μg/mL phytic acid in distilled water (see Note 3). Pipette 3 mL of the standard solution into 15-mL conical centrifuge tubes. The blank tube contains 3 mL of distilled water. To each tube add 1 mL of the Wade reagent. Mix the solution on a vortex mixture for 5 s. The mixture is centrifuged at 3000 g for 10 min and the absorbance of the supernatant is read at 500 nm by using water to zero the spectrophotometer (2).
4. Notes 1. If samples contain less than 1% phytic acid, a dilution of 5 : 25 in distilled water
is recommended, whereas a 1 : 25 dilution is enough for samples containing 1% or more phytic acid.
2. If the interference substances are negligible either in the parent extracts or in the diluted extracts, the purifi cation of phytic acid through a 200- to 400-mesh AG1 X8 anion exchange column is not necessary and the direct assay of phytic acid can be conducted.
3. One hundred grams of sodium phytate equals 59.9 g of phytic acid.
References 1. Wheeler, E. L., and Ferrel, R. E. (1971) A method for phytic acid determination
in wheat and wheat fractions. Cereal Chem. 48, 312–320. 2. Vaintraub, I. A., and Lapteva, N. A. (1988) Colorimetric determination of
phytate in unpurifi ed extracts of seeds and the products of their processing. Anal. Biochem. 175, 227–230.
3. Latta, M., and Eskin, M. (1980) A simple and rapid colorimetric method for phytate determination. J. Agric. Food Chem. 28, 1313–1315.

29
From: Methods in Molecular Biology, vol. 393: Plant Secondary MetabolitesBy: H.P.S. Makkar, P. Siddhuraju and K. Becker © Humana Press Inc., Totowa, NJ
6
Oxalic Acid
Key Words: Oxalic acid; oxalate; metal chelator; kidney stones; hyperoxaluria; potassium permanganate; washing liquid; tungstophosphoric acid reagent; oxylate precipitation; titration; permanganate solution.
1. Introduction1.1. Nature, Mechanism of Action, and Biological Effects
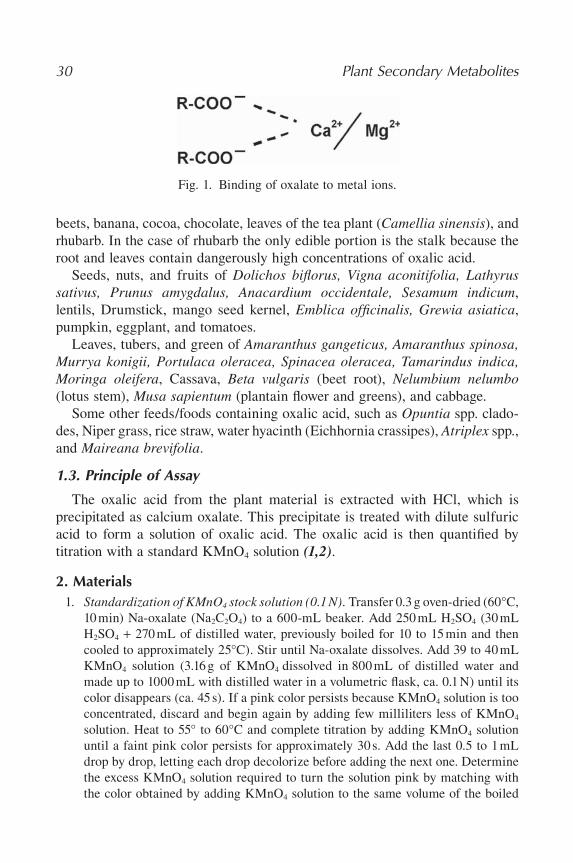
Oxalate is a common constituent of many plant species. Some crop plants accumulate high levels of this dicarboxylic acid anion (oxalate). Depending on the species, oxalate accumulates primarily as soluble oxalate, insoluble calcium oxalate, or a combination of these two forms. Oxalate, because of possessing negative charges, has high affi nity for minerals, such as calcium, magnesium, and zinc. Through ionic interaction it binds to these metal ions (Fig. 1) and affects their availability and metabolism (Fig. 1). The high capacity of soluble oxalate to bind to calcium in blood serum can lead to acute intoxication in humans and cattle if ingested in high doses. On the other hand, a high oxa-late uptake from the diet is also thought to play a role in hyperoxaluria, which can lead to the formation of calcium oxalate in kidneys (commonly called kidney stones). High levels of oxalate in the blood have also been reported to be associated with arthritis. Furthermore, metal ions like cadmium-incorporated calcium oxalate crystals are also responsible for the heavy metal mediated health risks.
1.2. Present in
Foods that contain signifi cant concentrations of oxalic acid, such as buck-wheat, star fruit (carambola), black pepper, parsley, poppy seed, spinach, chard,
30 Plant Secondary Metabolites
beets, banana, cocoa, chocolate, leaves of the tea plant (Camellia sinensis), and rhubarb. In the case of rhubarb the only edible portion is the stalk because the root and leaves contain dangerously high concentrations of oxalic acid.
Seeds, nuts, and fruits of Dolichos bifl orus, Vigna aconitifolia, Lathyrus sativus, Prunus amygdalus, Anacardium occidentale, Sesamum indicum,lentils, Drumstick, mango seed kernel, Emblica offi cinalis, Grewia asiatica,pumpkin, eggplant, and tomatoes.
Leaves, tubers, and green of Amaranthus gangeticus, Amaranthus spinosa, Murrya konigii, Portulaca oleracea, Spinacea oleracea, Tamarindus indica, Moringa oleifera, Cassava, Beta vulgaris (beet root), Nelumbium nelumbo(lotus stem), Musa sapientum (plantain fl ower and greens), and cabbage.
Some other feeds/foods containing oxalic acid, such as Opuntia spp. clado-des, Niper grass, rice straw, water hyacinth (Eichhornia crassipes), Atriplex spp.,and Maireana brevifolia.
1.3. Principle of Assay
The oxalic acid from the plant material is extracted with HCl, which is precipitated as calcium oxalate. This precipitate is treated with dilute sulfuric acid to form a solution of oxalic acid. The oxalic acid is then quantifi ed by titration with a standard KMnO4 solution (1,2).
2. Materials 1. Standardization of KMnO4 stock solution (0.1N). Transfer 0.3 g oven-dried (60°C,
10 min) Na-oxalate (Na2C2O4) to a 600-mL beaker. Add 250 mL H2SO4 (30 mL H2SO4 + 270 mL of distilled water, previously boiled for 10 to 15 min and then cooled to approximately 25°C). Stir until Na-oxalate dissolves. Add 39 to 40 mL KMnO4 solution (3.16 g of KMnO4 dissolved in 800 mL of distilled water and made up to 1000 mL with distilled water in a volumetric fl ask, ca. 0.1 N) until its color disappears (ca. 45 s). If a pink color persists because KMnO4 solution is too concentrated, discard and begin again by adding few milliliters less of KMnO4
solution. Heat to 55° to 60°C and complete titration by adding KMnO4 solution until a faint pink color persists for approximately 30 s. Add the last 0.5 to 1 mL drop by drop, letting each drop decolorize before adding the next one. Determine the excess KMnO4 solution required to turn the solution pink by matching with the color obtained by adding KMnO4 solution to the same volume of the boiled
Fig. 1. Binding of oxalate to metal ions.

6. Oxalic Acid 31
and cooled dilute H2SO4 at 55° to 60°C. The correction is usually 0.03 to 0.05 mL. From the net volume (i.e., by subtracting this correction volume from the volume of KMnO4 required for complete titration):
Normality = gram Na2C2O4 weighed × 1000/mL KMnO4 × 66.99
2. Calcium-containing acetate buffer, pH 4.5. Solution A: dissolve 2.5 g of anhydrous CaCl2 in 50 mL of 50% acetic acid. Solution B: dissolve 33 g sodium acetate.3H2O in 50 mL distilled water. Mix both solutions, check pH, and, if necessary, adjust the pH to 4.5.
3. Washing liquid. Dilute 12.5 mL of concentrated acetic acid (100%) to 250 mL with distilled water. Prepare a saturated solution of Ca-oxalate by adding the salt (5–6 g) until no salt remains in the bottom of the beaker. Cool to 4°C and store in a refrigerator. Only fi lter just before use and keep cold while using.
4. Tungstophosphoric acid reagent. Dissolve 2.5 g sodium tungstate (Na2WO4 · 2H2O)in a mixture of 4 mL H3PO4 (70% w/v) and 50 mL distilled water and dilute to 100 mL with distilled water.
5. HCl (3 N). Dilute 62.5 mL concentrated HCl (37% w/v) to 187.5 mL with distilled water.
6. Potassium permanganate solution (0.01 N). Dilute 1 : 10 the 0.1 N solution of potassium permanganate solution.
3. Method3.1. Preparation of Extract
Add 1 g of sample in 10 mL of 3 N HCl. Ultra-Turrax, (IKA Werke GmbH and Co. KG, Staufen, Germany), (20,000 rpm) for 2 min and wash turrax-probe into the sample by using 4 to 5 mL of 3 N HCl. Centrifuge the contents for 5 min at 3000g at 4°C. Collect the supernatant in a 25-mL volumetric fl ask. Repeat the extraction procedure using approximately 8 mL of 3 N HCl and collect the super-natant in the same fl ask and make the volume up to 25 mL with 3 N HCl.
3.2. Determination of Oxalate
1. Pipette 10 mL fi ltrate into 40-mL capacity plastic centrifuge tubes, and add 15 mL distilled water and 5 mL of the tungstophosphoric acid reagent. Mix thoroughly, let stand for 5 h, centrifuge at 3000g for 5 min, and collect the supernatant.
2. Take 20 mL of the supernatant into a 50-mL conical centrifuge tube (for blank, take 20 mL of 3 N HCl) and add NH4OH (12.5% w/v; ≈4.2 mL) drop by drop to adjust to pH 4.0 to 4.5. Add 5 mL of the calcium containing acetate buffer solution, stir with a glass rod, and store overnight at room temperature.
3. Centrifuge at 3000g for 15 min to obtain a compact pellet. Decant the supernatant with one smooth continuous inversion of the centrifuge tube. Hold the tube upside down and let remaining supernatant drip completely onto clean fi lter paper. Do not disturb Ca-oxalate precipitate.
32 Plant Secondary Metabolites
4. Wash precipitate by completely breaking it into fi ne suspension with a fi ne jet stream of 20 mL of the fi ltered cold wash liquid. Repeat centrifugation and decanting steps, taking care that precipitate is drained completely.
5. Add 5 mL of H2SO4 (1 mL concentrated sulfuric acid + 9 mL distilled water; prepared as above) to the precipitate.
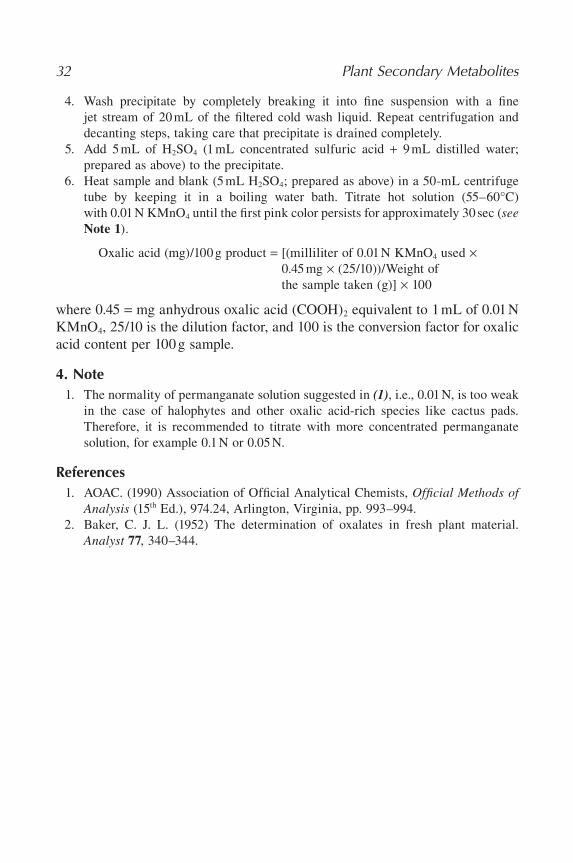
6. Heat sample and blank (5 mL H2SO4; prepared as above) in a 50-mL centrifuge tube by keeping it in a boiling water bath. Titrate hot solution (55–60°C) with 0.01 N KMnO4 until the fi rst pink color persists for approximately 30 sec (seeNote 1).
Oxalic acid (mg)/100 g product = [(milliliter of 0.01 N KMnO4 used ×0.45 mg × (25/10))/Weight of the sample taken (g)] × 100
where 0.45 = mg anhydrous oxalic acid (COOH)2 equivalent to 1 mL of 0.01 N KMnO4, 25/10 is the dilution factor, and 100 is the conversion factor for oxalic acid content per 100 g sample.
4. Note 1. The normality of permanganate solution suggested in (1), i.e., 0.01 N, is too weak
in the case of halophytes and other oxalic acid-rich species like cactus pads. Therefore, it is recommended to titrate with more concentrated permanganate solution, for example 0.1 N or 0.05 N.
References 1. AOAC. (1990) Association of Offi cial Analytical Chemists, Offi cial Methods of
Analysis (15th Ed.), 974.24, Arlington, Virginia, pp. 993–994. 2. Baker, C. J. L. (1952) The determination of oxalates in fresh plant material.
Analyst 77, 340–344.
33
From: Methods in Molecular Biology, vol. 393: Plant Secondary MetabolitesBy: H.P.S. Makkar, P. Siddhuraju and K. Becker © Humana Press Inc., Totowa, NJ
7
Nitrate and Nitrite
Key Words: Nitrate; nitrite; methemoglobin; blood pressure; asphyxia; spinach; spongy cadmium column; zinc metal; sodium nitrate; sodium nitrite; ammonia buffer solution; Jones reductor.
1. Introduction1.1. Nature, Mechanism of Action, and Biological Effects
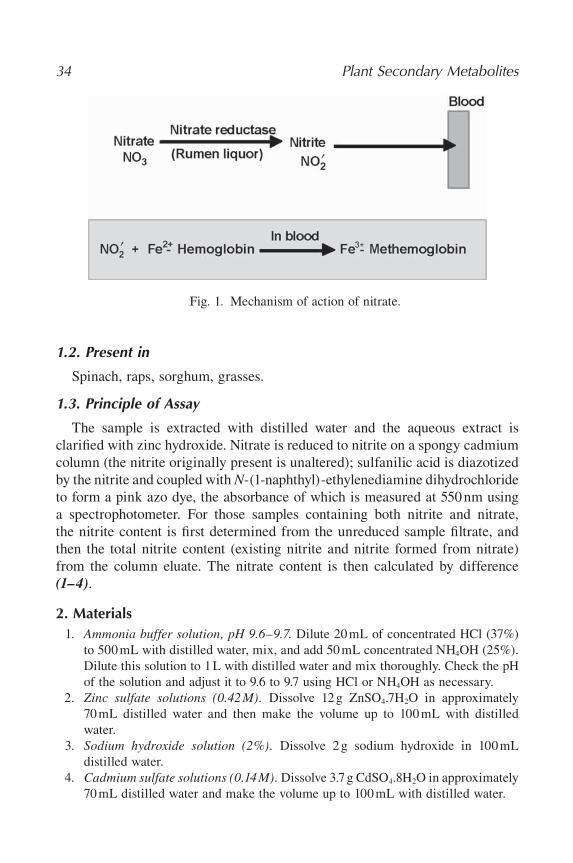
Occasionally forages accumulate nitrates in quantities that are toxic to some farm animals. Under certain environmental conditions, some plants may accumulate high concentrations of nitrates. The factors that can infl uence the accumulation of nitrates in the plants are drought, shade, use of herbicides, and application of nitrogenous fertilizers. Nitrates are not very toxic, but they are readily converted by bacteria in the alimentary tract into nitrites, which are much more toxic. In cattle and sheep this conversion takes place in the rumen and in horses in the cecum. Nitrites pass easily from the gastrointestinal tract into the blood, where they combine with hemoglobin in the red blood cells to form methemoglobin, a compound that is incapable of taking up and transport-ing oxygen (Fig. 1). Consequently the clinical signs of nitrite poisoning are those associated with oxygen defi ciency and include general weakness and a fall in blood pressure. Death may follow from asphyxia. Young animals and babies are particularly at risk because the small volume of blood that they contain requires only a small amount of nitrite to convert all the hemoglobin to methemoglobin. Pregnant animals that are affected, but do not die, may abort later.
34 Plant Secondary Metabolites
1.2. Present in
Spinach, raps, sorghum, grasses.
1.3. Principle of Assay
The sample is extracted with distilled water and the aqueous extract is clarifi ed with zinc hydroxide. Nitrate is reduced to nitrite on a spongy cadmium column (the nitrite originally present is unaltered); sulfanilic acid is diazotized by the nitrite and coupled with N-(1-naphthyl)-ethylenediamine dihydrochloride to form a pink azo dye, the absorbance of which is measured at 550 nm using a spectrophotometer. For those samples containing both nitrite and nitrate, the nitrite content is fi rst determined from the unreduced sample fi ltrate, and then the total nitrite content (existing nitrite and nitrite formed from nitrate) from the column eluate. The nitrate content is then calculated by difference (1–4).
2. Materials 1. Ammonia buffer solution, pH 9.6–9.7. Dilute 20 mL of concentrated HCl (37%)
to 500 mL with distilled water, mix, and add 50 mL concentrated NH4OH (25%). Dilute this solution to 1 L with distilled water and mix thoroughly. Check the pH of the solution and adjust it to 9.6 to 9.7 using HCl or NH4OH as necessary.
2. Zinc sulfate solutions (0.42M). Dissolve 12 g ZnSO4.7H2O in approximately 70 mL distilled water and then make the volume up to 100 mL with distilled water.
3. Sodium hydroxide solution (2%). Dissolve 2 g sodium hydroxide in 100 mL distilled water.
4. Cadmium sulfate solutions (0.14M). Dissolve 3.7 g CdSO4.8H2O in approximately 70 mL distilled water and make the volume up to 100 mL with distilled water.
Fig. 1. Mechanism of action of nitrate.
7. Nitrate and Nitrite 35
5. Zinc metal (about 10cm sticks)—Fisher Scientifi c (Scwerte, Germany), Cata-logue No. Z-13, or equivalent.
6. Sulfanilic acid solution, 1% in 30% acetic acid. Dissolve 10 g of sulfanilic acid in 700 mL of distilled water, then add 300 mL of acetic acid (100%) and mix thoroughly (do not add acetic acid until the sulfanilic acid has dissolved completely). Store at room temperature.
7. N-(1-naphthyl)-ethylenediamine dihydrochloride (Marshall`s reagent), 0.1% in 60% acetic acid. Weigh 100 mg N-(1-naphthyl)-ethylenediamine dihydrochloride and dissolve in 100 mL of 60% acetic acid. Store in a refrigerator. It is stable for 1 week.
8. Color reagent. Mix equal volumes of the sulfanilic acid and Marshall’s reagent solutions just before use.
9. Sodium nitrate standard solutions. I. Stock solution, 1 mg/mL: Dissolve 500 mg of NaNO3 in approximately 300 mL distilled water in a 500-mL volumetric fl ask. Add to it 50 mL of the NH4Cl buffer and make the volume up to 500 mL with distilled water. The solution is stable at 4°C for 1 to 2 weeks. II. Working solution, 10mg/mL: Transfer 1 mL of stock solution to a 100-mL volumetric fl ask, make the volume to 100 mL with distilled water and mix thoroughly. Prepare the solution every day.
10. Sodium nitrite standard solutions. I. Stock solution, 500mg/mL: Dissolve 250 mg NaNO2 in approximately 300 mL distilled water in a 500-mL volumetric fl ask. Add 100 mL of the ammonia buffer and make the volume up to 500 mL with distilled water. Mix thoroughly and store it at 4°C (stable for 1 week). II. Working solution, 5mg/mL: Transfer 1 mL stock solution to a 100-mL volumetric fl ask, make the volume up to 100 mL with distilled water, and mix the solution thor-oughly. The solution should be prepared fresh every day.
3. Method3.1. Preparation of Standard Curve for Sodium Nitrite
1. Add 0.0, 1.0, 2.0, 4.0, 6.0, and 10 mL of NaNO2 working solution to separate 50-mL volumetric fl asks. Add 9.0 mL of the ammonia buffer and 5 mL of 60% acetic acid solution to each fl ask and immediately proceed to step 2 (see Note 1).
2. Add 10 mL of the color reagent, make the volume up to 50 mL with distilled water, mix thoroughly, and let it stand for 25 min in the dark.
3. Set the spectrophotometer at 550 nm and measure absorbance of the above solutions against the blank (0 standard solution).
4. Prepare a calibration curve by plotting absorbance against micrograms of NaNO2
(range: 5 to 50 μg). 5. The absorbance range should extend from 0 to 0.6 approximately.
3.2. Preparation of Modifi ed Jones Reductor
1. Place three to fi ve zinc (Zn) sticks in each of the two 800-mL beakers containing 500 mL CdSO4 solution.
36 Plant Secondary Metabolites
2. Remove Zn sticks every 2 to 3 h [or as soon as a thick layer of cadmium (Cd) forms] and scrape off the spongy metallic Cd by rubbing sticks against each other (important: Cd must be kept covered with aqueous solution at all times).
3. After 6 to 8 h, wash deposits with two 500-mL portions of distilled water. 4. Transfer Cd with distilled water to a high-speed blender and blend for 2 to 3 s. 5. Retain 8 to 40 mesh particles and repeat blending to increase yield of particles. 6. Wash particles with 0.1 N HCl, stir occasionally with a glass rod, and leave it
overnight in acid. 7. Stir once to degas and decant. Then wash with two 500-mL portions of distilled
water. 8. Fill the modifi ed Jones reductor in a chromatographic column (glass tube of
approximately 300 mm in length and 10 mm in internal diameter) plugged with a glass wool and fi xed with a stopcock.
9. Add Cd to a depth of 8 to 10 cm and drain occasionally during fi lling but do not allow liquid level to fall below top of Cd bed. During fi lling, Cd bed should always be dipped in distilled water.
10. Eliminate bubbles in Cd bed by tapping sides of column and wash Cd column with 25 mL of the ammonia buffer and drain to top of Cd bed (see Note 2).
3.3. Testing Effi ciency of Cadmium Column
1. Mix 6 mL NaNO3 working solution (10 μg/mL) and 5 mL of the ammonia buffer and pour on the Cd column.
2. Adjust fl ow rate to 3 to 5 mL/min. After column is emptied, wash with 15 mL of distilled water.
3. Collect the eluate in a 50-mL volumetric fl ask and wash the column with additional approximately 10 mL of distilled water and again collect the eluate in the same 50-mL volumetric fl ask. Add to the fl ask 5.0 mL of 60% acetic acid.
4. Add 10 mL of the color reagent, make the volume up to 50 mL with distilled water, and mix well. Keep the solution in the dark for 25 min.
5. Prepare a blank in the same manner by taking 6 mL of distilled water through steps 1 and 4 (see Note 3).
6. Read the absorbance in the spectrophotometer at 550 nm. The NaNO2 concentra-tion, as determined from the standard curve, should be about 48.7 μg/mL if 100% conversion occurs.
7. If there is less than 90% conversion, recondition the column by passing 25 mL of 0.1 N HCl followed by two 25-mL portions of distilled water and 25 mL of the ammonia buffer and repeat steps 1–6. Check effi ciency of each column once a week.
3.4. Preparation of Extract
1. Weigh a 10-g sample (ground if dry, and cut into small pieces if fresh) and blend with 70 mL of distilled water and 12 mL of 2% NaOH solution in a blender until smooth slurry is formed (generally takes about 5 min) (see Note 4).
7. Nitrate and Nitrite 37
2. Transfer the slurry into a 200-mL volumetric fl ask, and rinse blender with 30 to 50 mL of distilled water. Then mix the suspension well by swirling. Take out one or two drops of suspension from the fl ask and check the pH with pH paper. If the pH is between 8 and 10, heat the contents in a water bath (50–60°C) until the temperature of the suspension reaches close to 50°C. If the pH is less than 8, add additional amounts of 2% NaOH solution until the pH rises to 8 to 10, and then heat as above.
3. Occasionally swirl the contents while heating. Maintain the temperature at about 50°C for an additional 10 min, mixing occasionally.
4. Add 10 mL of ZnSO4 solution and mix by swirling. If no white precipitate of Zn(OH)2 becomes visible after the addition of ZnSO4 solution, add 2 to 5 mL of 2% NaOH solution and keep mixing to avoid excessive addition of 2% NaOH solution.
5. Cool to room temperature in a water bath and dilute to volume 200 mL with distilled water and mix thoroughly.
6. Filter the content through fi lter paper (Whatman No. 1), discarding the fi rst 20 mL fi ltrate, into a 250-mL glass-stoppered fl ask. Re-fi lter if the extract is not clear.
3.5. Determination of Nitrite
1. Transfer a 10-mL aliquot of the above fi ltrate to a 50-mL volumetric fl ask. Add 9.0 mL of the ammonia buffer and 5.0 mL of 60% acetic acid.
2. Add 10 mL of the color reagent and make the volume up to 50 mL with distilled water.
3. Mix thoroughly and place in the dark for 25 min.
3.6. Determination of Nitrate Plus Nitrite
1. Mix a second 10-mL aliquot of fi ltrate with 5 mL of the ammonium buffer and pass through the modifi ed Jones Reductor (see Note 5).
2. Wash the column with about 15 mL of distilled water. 3. Collect the eluate in a 50-mL volumetric fl ask and wash the column with
additional approximately 10 mL of distilled water and again collect the eluate in the same 50-mL volumetric fl ask. Add to the fl ask 5.0 mL of 60% acetic acid.
4. Add 10 mL of the color reagent and make the volume up to 50 mL with distilled water. Then mix well and leave it in the dark for 25 min.
3.7. Preparation of Reagent Blank
Carry 70 mL of distilled water through steps 2 to 7 described in Section 3.4.
3.8. Calculations
1. After color development, read the absorbance of unreduced blank and unreduced sample fi ltrates against the blank (0 standard solution; step 3 in Section 3.1.). This corresponds to the presence of nitrite in the sample.
38 Plant Secondary Metabolites
2. Read the absorbance of reduced blank and reduced sample eluates against the same blank (0 standard solution; step 3 in Section 3.1.). This corresponds to the presence of nitrate plus nitrite in the sample.
3. Subtract the blank values from the corresponding sample values. 4. Determine the concentration of nitrite in each case from the standard curve. 5. Calculate the concentration of nitrite in the unreduced and reduced sample
fi ltrates. 6. The difference between the two values is a measure of the nitrate concentration,
equivalent to nitrite. 7. Finally, calculate the concentrations of nitrite and nitrate in the original sample.
Example
Absorbances: Reagent blank, unreduced NO2 a Reagent blank, reduced NO2/NO3 b Sample, unreduced NO2 c Sample, reduced NO2/NO3 d
I. NaNO2 determinations:Absorbance (due to NaNO2) = A (sample NO2) − A (blank NO2) = c − a = xFrom standard curve, absorbance x = mμgSince this is from a 10-mL aliquot from a total of 200 mL, nitrite in
200 mL = (200/10) m = 20 mμg.Since the original sample wt. was 10 g, the NaNO2 concentration is
20 mμg/10 g = 2 mμg/g = 2 m ppm.
II. NaNO3 determination:Absorbance (due to NaNO3/NaNO2) = A (sample NO3/NO2) − A (blank
NO3/NO2)= d − b= y
From standard curve, absorbance y = nμgSince this is from a 10-mL aliquot, from a total of 200 mL, total NaNO2
(from NaNO3 plus NaNO2 present in the sample) = (200/10) × n = 20 nμg.Since the original sample was 10 g, total NaNO2 is 20 nμg/10 g = 2 nμg/g or
2n ppm.NaNO2 from NaNO3 in the sample = 2 n − 2 m = 2 (n − m) ppm.The conversion factor from NaNO2 [molecular weight (MW) 69] to NaNO3
(MW 85) is 1.23.Therefore, NaNO3 level in the sample is 2.46 (n − m) ppm.

7. Nitrate and Nitrite 39
4. Notes 1. Since nitrite is unstable in acidic solutions the color reagent should be added
immediately after adding the 60% acetic acid solution. 2. When the column is drained, the liquid level should be just at top of the Cd bed
(±2 mm). 3. If high blank is obtained for NO3 on Cd column, follow the following washing
schedule to remove absorbed residual NO3 from Cd column:
Pass 50 mL of 1 N NaOH through Cd column. Wash column with distilled water until the pH of the effl uent is close to neutral pH (pH 7–8). Then pass 25 mL of 0.1 N HCl and again wash column with distilled water. Finally, wash column with 25 mL of the ammonia buffer. This should be done each day and the columns be kept ready for later use. Omit the above steps if columns are new, i.e., being used for the fi rst time.
4. If the results are beyond the range of the standard curve, then dilutions must be made to the sample extract. Do not dilute the fi nal reaction mixture after color development has occurred. Appropriate dilutions must also be made to the sample blanks. Conversely, if the absorbance is low on using 10 mL of the sample extract, higher volumes can be taken for the color development, and absorbance should be recorded against appropriate blanks.
5. Recondition the column after each analysis and store the Cd under the ammonia buffer between analyses.
References 1. Sen, N. P., and Donaldson, B. J. (1978) Improved colorimetric method for
determining nitrate and nitrite in foods. J. Assoc. Offi c. Anal. Chem. 61,1389–1394.
2. Sen, N. P., Lee, Y. C., and McPherson, M. (1979) Comparison of two extraction procedures for recovering nitrite from cured meat products. J. Assoc. Offi c. Anal. Chem. 62, 1186–1188.
3. Sen, N. P., and McPherson, M. (1978) Interference by ascorbic acid in the determination of nitrite by the separate color reagent addition technique. J. Food Safety, 1, 247–255.
4. Hamilton, J. E. (1976) Collaborative study of the colorimetric determination of nitrate and nitrite in cheese. J. Assoc. Offi c. Anal. Chem. 59, 284–288.

41
From: Methods in Molecular Biology, vol. 393: Plant Secondary MetabolitesBy: H.P.S. Makkar, P. Siddhuraju and K. Becker © Humana Press Inc., Totowa, NJ
8
L-Mimosine (b-(3-Hydroxy-4-Pyridone-1-yl)-L-Alanine)
Key Words: Mimosine; Leucaena leucocephala; 3-hydroxy-4-(1H)-pyridone; 2,3-dihydroxypyridine; hair loss; goiter; Synergistes jonesii; ferric chloride; activated charcoal; p-nitroaniline; sodium nitrite; pyridoxalphosphate.
1. Introduction1.1. Nature, Mechanism of Action, and Biological Effects
l-mimosine is a nonprotein amino acid. Despite the consideration of Leucaena leucocephala as a promising alternate source of protein for fodder, the presence of mimosine to the extent of 2% to 10% dry matter in the leaf and 2% to 5% dry matter in the seed has limited its use as a livestock feed since mimosine and its degradation products 3-hydroxy-4-(1H)-pyridone (3,4-DHP) and 2,3-dihydroxypyridine (2,3-DHP) have been known to be toxic to many species (Fig. 1). Ingestion of mimosine results in hair loss, goiter, reproductive disorders, epithelial damage, reduced feed intake, and ultimately death in both nonruminants and ruminants. Outbreaks of human alopecia have also been reported in some areas. Certain segments of the human population are known to consume portions of the leucaena in their diet, and a loss of hair has been frequently observed among those individuals who eat the leaves, pods, and seeds in the form of a soup. Resistance to mimosine toxicity in ruminants of certain geographical areas has been attributed to the capability of their rumen microorganisms to restrictively metabolize mimosine and DHP. From the rumen of goats in Hawaii resistant to mimosine toxicity, a microorganism (Synergistes jonesii), capable of metabolizing mimosine and DHP to innocuous products has been successfully transferred to the rumen of cattle in Australia that were

42 Plant Secondary Metabolites
Fig. 1. Degradation of mimosine.
Fig. 2. Mode of action of mimosine.
susceptible to mimosine toxicity (Fig. 1). This gave these cattle the capability to utilize effectively the mimosine-containing forage.
Mimosine is considered to bind minerals and pyridoxalphosphate, required for activities of various enzymes (Fig. 2). This binding decreases activity of enzymes such as tyrosine decarboxylase, tyrosinase, and ribonucleotide
8. L-Mimosine (b-(3-Hydroxy-4-Pyridone-1-yl)-L-Alanine) 43
reductase, leading to various metabolic disorders, including inhibition of con-version of methionine to cystine, which is an important component of wool/hair. Mimosine also has general antimitotic activity. It inhibits the proliferation of various animal cell in tissue culture and arrests cell division in cultured human cells.
1.2. Present in
Leucaena leucocephala and Mimosa pudica.
1.3. Principle of Assays
Two assays are presented in this chapter. In the fi rst method, mimosine reacts quantitatively with ferric chloride, producing an intense violet-colored compound in slightly acid solution. The color produced is measured at 535 nm using a spectrophotometer (1). The second assay is based on the reaction between mimosine and p-nitroaniline to produce an intense yellow-colored azodye, which has a sharp absorption maximum at 400 nm (2). This method is more sensitive and specifi c for mimosine.
2. Materials2.1. Method 1: Based on Ferric Chloride
1. Mimosine solution (0.1%) in 0.1 N HCl. Weigh exactly 10 mg of mimosine (for example, from Sigma, St. Louis, MO) and dissolve in 10 mL of 0.1 N HCl.
2. Ferric chloride (0.5%) in 0.1N HCl. Take 500 mg of ferric chloride in a 100-mL volumetric fl ask and make the volume up to 100 mL with 0.1 N HCl.
3. Activated charcoal (activated carbon). 4. 0.1N HCl. Take 1.1 mL of 37% (w/v) HCl and dilute it to 100 mL distilled
water.
2.2. Method 2: Based on p-Nitroaniline
1. A stock solution of mimosine (5 mM) in 0.05 M HCl. Step I: Take 2.08 mL concentrated HCl in a 500-mL volumetric fl ask and make the volume up to 500 mL with distilled water to obtain 0.05 M HCl. Step II: Weigh 99.1 mg of pure mimosine and transfer it into a 100-mL volumetric fl ask and make the volume up to 100 mL with 0.05 M HCl.
2. Working mimosine solution. The stock solution (5 mM) is suitably diluted with distilled water to get a working standard of 50 μM solution of mimosine. (Take 1 mL of stock solution and make the volume up to 100 mL with distilled water.) Both stock and working solutions are stored in frozen conditions.
3. p-Nitroaniline solution (0.05%). Dissolve 50 mg p-nitroaniline in 5 mL of methanol and dilute it to 100 mL with 0.033 M H3PO4.
4. Sodium nitrite solution (0.1%). Weigh 100 mg sodium nitrite and dissolve in 100 mL distilled water.
44 Plant Secondary Metabolites
5. Diazotized p-nitroaniline reagent. Prepare it 1 to 2 min prior to the assay by mixing equal volumes of the p-nitroaniline solution (0.05%) and sodium nitrite solution (0.1%).
6. Sodium phosphate buffer (0.25 M, pH 7). Prepare 0.25 M monobasic sodium phosphate (NaH2PO4), solution 1 (dissolve 34.75 g in 1000 mL distilled water) and dibasic sodium phosphate (Na2HPO4.7H2O), and solution 2 (dissolve 67.06 g in 1000 mL distilled water). Take 39 mL of solution 1 and 61 mL of solution 2, and dilute it to 200 mL with distilled water.
7. Na2CO3 solution (5%). Dissolve 5 g sodium carbonate in 100 mL distilled water. 8. HCl (0.2M). Take 8.3 mL of 37% (w/v) HCl and make the volume up to 500 mL
with distilled water. 9. HCl (0.05M). Take 2.08 mL of 37% (w/v) HCl and make the volume up to 500 mL
with distilled water. 10. H3PO4 (0.033 M). Take 0.92 mL of concentrated phosphoric acid (18.1 M) and
make the volume up to 500 mL with distilled water.
3. Methods3.1. Method 1: Based on Ferric Chloride
3.1.1. Preparation of Extract
Weigh 1.25 g of dried leucaena leaf meal sample in a 250-mL beaker and digest with 100 mL of 0.1 N HCl at 80° to 90°C for approximately 1 h with fre-quent stirring (see Note 1). Allow the digest to cool and transfer the entire material including the solids to a 250-mL volumetric fl ask. After thorough shak-ing, allow the fl ask to stand until most of the solids get settled on the bottom.
3.1.2. Clarifi cation of Extract
Transfer 10 mL of the above supernatant liquid into a 150-mL beaker con-taining 30 mg activated carbon. Add distilled water to bring the volume to about 25 mL. Cover the beaker with a watch glass and boil the liquid for 15 min on a hot plate. Allow the material to cool and fi lter the solution with suction through a fritted-glass crucible capable of retaining the carbon. Collect the fi ltrate in a test tube placed inside the suction fl ask. Transfer the fi ltrate into a 50-mL capacity volumetric fl ask. Wash the beaker and the material on the crucible with 15 to 20 mL of 0.1 N HCl, split in three to four portions, and collect the fi ltrate in the test tube. Combine all the fi ltrates in a 50-mL volumetric fl ask and make up the fi nal volume to 50 mL by using 0.1 N HCl.
3.1.3. Determination of Mimosine
Take 2 to 5 mL of the fi ltrate (depending on the amount of mimosine present) into a 100-mL volumetric fl ask (see Note 2). To it add 10 mL of 0.1 N HCl and 4 mL of 0.5% ferric chloride in 0.1 N HCl. Make the volume of the solution up to 100 mL with distilled water. The pH of the solution should be between
8. L-Mimosine (b-(3-Hydroxy-4-Pyridone-1-yl)-L-Alanine) 45
1.5 and 2.5. Read the color intensity of the reaction mixture at 535 nm using a spectrophotometer. The quantity of mimosine is estimated from a curve prepared by the following procedure.
3.1.4. Preparation of Calibration Curve
Dissolve exactly 0.100 g of pure mimosine (for example, from Sigma, St. Louis, MO) in 100 mL of 0.1 N HCl in a volumetric fl ask. Take 0- (blank), 1-, 2-, 3-, 4-, and 5-mL aliquots of this solution in 100-mL volumetric fl asks. To this, add 10 mL of 0.1 N HCl and 4 mL of 0.5% ferric chloride solution and then make the volume up to 100 mL with distilled water. Measure the intensity of the violet color at 535 nm using a spectrophotometer. Calculate the level of mimosine in the sample using the linear curve (from 10 to 50 μg mimosine in the reaction mixture), and express the results as g/100 g dry matter.
3.2. Method 2: Based on p-Nitroaniline
3.2.1. Preparation of Calibration Curve
Suitable volumes of mimosine working standard are placed in test tubes to get a range of mimosine concentrations from 1.25 to 50 nmol, in a volume of 3.5 mL of distilled water. To this, add 1 mL of sodium phosphate buffer (0.25 M, pH 7.0) to maintain neutral pH. Then add 0.5 mL of the diazotized p-nitroaniline reagent to each tube, mix well, and incubate at room temperature for 15 min for development of color. Measure absorbance at 400 nm using a spectrophotometer.
3.2.2. Preparation of Extract
1. Take fresh leaves of L. leucocephala (2 g), immerse in 20 mL of boiling water, and continue boiling for 3 to 5 min (see Note 3).
2. After cooling, add an equal volume of 0.2 M HCl and extract mimosine by homog-enization (Ultra-Turrax (IKA Werke GmbH and Co. KG, Staufen, Germany), 20,000 rpm for 5 min on ice), followed by centrifugation at 4000 g for 25 min. Adjust the supernatant volume to 40 mL.
3. To perform the decolorization process, boil 10 mL of this extract with 10 to 20 mg of activated charcoal for 15 min.
4. After cooling, fi lter the solution through Whatman No. 42 fi lter paper and make the volume up to 10 mL with distilled water. Instead of fi ltration, centrifugation at 4000 g for 20 min may also be used.
3.2.3. Separation by Paper Chromatography and Estimation of Mimosine
Aliquots, 10 to 50 μL of suitably diluted mimosine standards containing 2 to 50 nmol of mimosine, are applied onto Whatman No. 1 fi lter paper (seeNote 4). Similarly, suitable aliquots of the plant extracts are also spotted on the paper. The paper is developed overnight with a solvent mixture of n-butanol/

46 Plant Secondary Metabolites
acetic acid/water (4 : 1 : 2, v/v) by the ascending method. Before starting to develop the spotted chromatographic paper, the chromatographic chamber must be saturated with the same solvent for about 3 to 5 h. After the solvent front reaches 1 cm below the top edge of the paper, it is taken out carefully and dried at 80°C. The dried paper is sprayed with the diazotized p-nitroaniline reagent and dried at room temperature. Subsequently, Na2CO3 solution (5%) is sprayed to enhance the color of spots. The yellow spots are marked and the paper con-taining these spots is cut into squares of 20 × 20 mm (see Note 5). These are placed in test tubes containing 3 mL of water and the test tubes are vortexed for 3 to 5 min. The pH of the solution is carefully brought to neutral pH by the addition of 0.2 M HCl (tested with pH paper), made up to 3.5 mL, and color is developed by the addition of 1 mL of the sodium phosphate buffer followed by 0.5 mL of the diazotized p-nitroaniline reagent. The contents are mixed well, and the absorbance at 400 nm is measured against blanks prepared in the same manner with paper of the same size as for the test samples, cut from blank por-tions. A calibration curve is drawn for concentration vs. absorbance at 400 nm for mimosine. Concentration of mimosine in the plant samples is determined from these plots. The results are expressed on percent dry matter basis.
4. Notes 1. Leaf and seed [both fresh (1–3 g) and dried (0.2–0.5 g)] sample can be placed in
the boiling water for 1 to 5 min, and after cooling, an equal volume of 0.2 N HCl should be added. The mimosine can be extracted by homogenization (Ultra-Turrax, IKA Werke GmbH and Co. KG, Staufen, Germany) at 20,000 rpm for 5 min at approximately 0°C), followed by centrifugation at 3000 g for 20 min. This could prevent the formation of 3-hydroxy-4-(1H)-pyridone (3,4-dihydroxypyridine).
2. Proper dilution of sample extracts and decolorization with activated carbon could avoid or minimize the interference in the assay by pigments, and by 3,4-dihydro-xypyridine since 3,4-dihydroxypyridine also complexes with ferric chloride.
3. Too long boiling of sample with water should be avoided. 4. The pigments, phenolics, and mimosine precursors may interfere in the method.
Therefore, it is advised to develop the color after separation of mimosine by paper chromatography.
5. The location of mimosine spot from the sample on the developed chromatographic paper must be carefully authenticated with standard mimosine.
References 1. Matsumoto, H., and Sherman, G. D. (1951) A rapid colorimetric method for the
determination of mimosine. Arch. Biochem. Biophys. 33, 195–200. 2. Lalitha, K., Vargheese, C. M., and Balasubramanian, N. (1993) Spectrophotomet-
ric determination of mimosine and 3-hydroxy-4-(1H)-pyridone—the toxic prin-ciples of Leucaena leucocephala. Anal. Biochem. 213, 57–62.

47
From: Methods in Molecular Biology, vol. 393: Plant Secondary MetabolitesBy: H.P.S. Makkar, P. Siddhuraju and K. Becker © Humana Press Inc., Totowa, NJ
9
Canavanine
Key Words: Canavanine; 2-amino-4-(guanidinooxy) butanoic acid; antimetabolite; argi-nine antagonist; autoimmune disease; lupus erythematosus; pentacyanoaminoferate; potassium persulfate; Canavalia spp.; Sesbania spp.
1. Introduction1.1. Nature, Mechanism of Action, and Biological Effects
Canavanine [2-amino-4-(guanidinooxy) butanoic acid] occurs in over 350 species of the papilionoideae, a subfamily of the Leguminosae. It is an analogue of arginine (Fig. 1). The highest concentration of canavanine (13% dry weight) has been reported in Dioclea megacarpa and it occurs up to 5% in seeds ofCanavalia ensiformis. L-canavanine exhibits potent antimetabolic properties in organisms ranging from viruses and prokaryotes to whole animals. Canavanine acts primarily as an arginine antagonist and gets incorporated into the cell nucleus and other proteins and interferes with deoxyribonucleic acid and ribo-nucleic acid formation. In monkeys it causes hematological and serological abnormalities. These abnormalities are similar to those seen in human systemic lupus erythematosus, an autoimmune disease that adversely affects the kidney and skin. Canavanine affects the charged surface of membrane of autoimmune β cells, and it has been suggested that such alterations may be associated with abnormal autoimmune response.
1.2. Present in
Canavalia spp., Medicago sativa, Sesbania spp., and Dioclea megacarpa.

48 Plant Secondary Metabolites
1.3. Principle of Assay
The guanidoxy group, –O · NH · C(:NH) · NH2, in canavanine reacts with trisodium pentacyanoammonioferrate in aqueous solution at pH 7.0 and forms a magenta-colored chromophore. The color formed is measured at 520 to 530 nm (1).
2. Materials 1. Potassium phosphate buffer (0.2 M, pH 7.0). Take 50 mL of 0.2 M KH2PO4
(27.20 g/L) and 29.1 mL of 0.2 M NaOH and dilute to 100 mL. Check pH and adjust to pH 7, if needed.
2. Potassium persulfate (1%). Weigh 1 g of potassium persulfate and dissolve in 100 mL distilled water.
3. Preparation of pentacyanoaminoferate (PCAF). Dissolve 10 g of sodium nitro-prusside in 55 mL of concentrated ammonia solution (25% or 32% w/v). Keep this solution in the dark at 0°C for 24 h and fi lter a yellow-green precipitate con-taining a mixture of sodium pentacyanoaminoferate (II) and (III). Add ethanol to the fi ltrate until no precipitates are obtained. Filter it and combine this precipi-tate with the fi rst precipitate. Wash the pooled precipitate with absolute ethanol until all ammonia is eliminated. Dry the precipitate over H2SO4 (a desiccator containing the acid) and then store in the dark over CaCl2 (a desiccator containing dry CaCl2).
4. Photoactivated pentacyanoaminoferate solution (1%). Take 1 g of PCAF in a volumetric fl ask, add 50 mL of distilled water to dissolve it, and make up the volume to 100 mL with distilled water. Transfer the solution to a separate 200-mL capacity beaker and illuminate the whole solution under a light source (60 W table lamp) for 1 h. Finally, transfer the photoactivated PCAF solution into an amber-colored screw-capped bottle. Store this solution in the dark condition. The PCAF solution should be prepared every day.
5. HCl (0.1 M). Take an aliquot of 1.1 mL HCl (w/v) and make the volume up to 100 mL with distilled water.
6. NaOH (0.2 M). Weigh 8 g sodium hydroxide, dissolve in approximately 500 mL distilled water, and then make the volume up to 1 L with distilled water.
7. Canavanine solution. Dissolve 1 mg of canavanine in 1 mL of 0.2 M potassium phosphate buffer, pH 7.
Fig. 1. Structure of canavanine.

9. Canavanine 49
3. Method3.1. Preparation of Extract
The preparation of extract is based on Cacho et al. (2). Take 5 g of fi nely ground plant sample, de-fat in a Soxhlet extractor with hexane for 5 h, and after drying in air add 25 mL of 0.1 M HCl. Stir the mixture using a magnetic stirrer for 6 h at room temperature and centrifuge at 4000 g for 20 min. Save the super-natant and once again repeat the extraction using 20 mL of 0.1 M HCl. Combine both the supernatants, adjust the pH to 7.0 with 0.2 M NaOH solution and dilute to a fi nal volume of 100 mL using 0.2 M phosphate buffer, pH 7.0.
3.2. Preparation of Calibration Curve
1. Take 1 mL of canavanine solution (5–80 μg of canavanine in 0.2 M potassium phosphate buffer of pH 7.0 in a 10-mL volumetric fl ask).
2. To this solution, add 6.5 mL of the pH 7.0 phosphate buffer, 1 mL of 1% potassium persulfate and 0.5 mL of 1% aqueous PCAF. Make the volume up to 10 mL with distilled water. Mix the solution thoroughly and after 15 min read the absorbance at 520 to 530 nm against reagent blank (the phosphate buffer in place of cana-vanine solution).
3.3. Determination of Canavanine
Take 1 mL of the plant extract in a 10-mL volumetric fl ask instead of 1 mL of canavanine solution and follow the procedure given in Section 3.2.Determine the concentration of canavanine in the sample using the calibration curve and express the results as grams of canavanine/100 g dry matter.
References 1. Rosenthal, G. A. (1977) Preparation and colorimetric analysis of L-canavanine.
Anal. Biochem. 77, 147–151. 2. Cacho, J., Garcia, M. A., and Ferrando, I. (1989) Selective spectrophotometric
determination of canavanine. Analyst 114, 965–968.
51
From: Methods in Molecular Biology, vol. 393: Plant Secondary MetabolitesBy: H.P.S. Makkar, P. Siddhuraju and K. Becker © Humana Press Inc., Totowa, NJ
10
L-DOPA (L-3,4-Dihydroxyphenylalanine)
Key Words: l-DOPA; 3,4-dihydroxyphenylalanine; favisum; hemolytic anemia; glutathione content; protein digestibility; semiquinone; Parkinson’s disease; Mucuna spp.; Vicia faba;HPLC; C18 nucleosil 120 column.
1. Introduction1.1. Nature, Mechanism of Action, and Biological Effects
The nonprotein amino acid, 3,4-dihydroxyphenylalanine (l-DOPA) (Fig. 1)is present in high concentrations (about 3–6%) in Mucuna spp. The in vitro addition of l-DOPA to the red blood cells from individuals defi cient in glucose 6-phosphate dehydrogenase decrease the glutathione content in red blood cells and this ultimately induces the favisum (hemolytic anemia; breakup of red blood cells). The inclusion of l-DOPA in fi sh feed has been reported to signifi -cantly reduce the growth performance. l-DOPA is susceptible to oxidation, giving a semiquinone that complexes with proteins. This decreases protein digestibility. On the other hand, it has been used for the treatment of Parkinson’s disease because of its being a precursor of dopamine, a neurotransmitter.
1.2. Present in
Mucuna spp. and Vicia faba.
1.3. Principle of Assay
The DOPA is extracted from the sample in acidic condition and separated on a reverse-phase C18 nucleosil 120 column using a high-performance liquid chromatography (HPLC). The absorbance is measured at 282 nm and the peak area is converted into concentration using a standard DOPA solution (1).
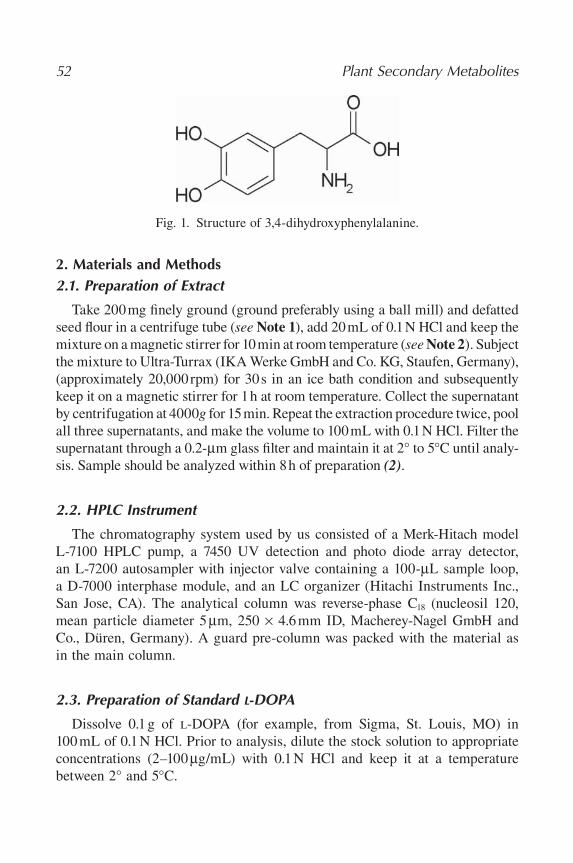
52 Plant Secondary Metabolites
2. Materials and Methods2.1. Preparation of Extract
Take 200 mg fi nely ground (ground preferably using a ball mill) and defatted seed fl our in a centrifuge tube (see Note 1), add 20 mL of 0.1 N HCl and keep the mixture on a magnetic stirrer for 10 min at room temperature (see Note 2). Subject the mixture to Ultra-Turrax (IKA Werke GmbH and Co. KG, Staufen, Germany), (approximately 20,000 rpm) for 30 s in an ice bath condition and subsequently keep it on a magnetic stirrer for 1 h at room temperature. Collect the supernatant by centrifugation at 4000g for 15 min. Repeat the extraction procedure twice, pool all three supernatants, and make the volume to 100 mL with 0.1 N HCl. Filter the supernatant through a 0.2-μm glass fi lter and maintain it at 2° to 5°C until analy-sis. Sample should be analyzed within 8 h of preparation (2).
2.2. HPLC Instrument
The chromatography system used by us consisted of a Merk-Hitach model L-7100 HPLC pump, a 7450 UV detection and photo diode array detector, an L-7200 autosampler with injector valve containing a 100-μL sample loop, a D-7000 interphase module, and an LC organizer (Hitachi Instruments Inc., San Jose, CA). The analytical column was reverse-phase C18 (nucleosil 120, mean particle diameter 5 μm, 250 × 4.6 mm ID, Macherey-Nagel GmbH and Co., Düren, Germany). A guard pre-column was packed with the material as in the main column.
2.3. Preparation of Standard L-DOPA
Dissolve 0.1 g of l-DOPA (for example, from Sigma, St. Louis, MO) in 100 mL of 0.1 N HCl. Prior to analysis, dilute the stock solution to appropriate concentrations (2–100 μg/mL) with 0.1 N HCl and keep it at a temperature between 2° and 5°C.
Fig. 1. Structure of 3,4-dihydroxyphenylalanine.

10. L-DOPA (L-3,4-Dihydroxyphenylalanine) 53
2.4. Chromatographic Conditions
2.4.1. Solvents, Gradient System, and Separation of L-DOPA
Solvent A: Water, methanol, and o-phosphoric acid in the ratio of 975.5 : 19.5 : 1 (v/v/v).
Solvent B: 70% methanol.These solvents are stable at 22°C for 1 week. All the aqueous solutions
are passed through a 0.2-μm glass fi lter. Eluents are degassed in an ultrasonic bath.
The following gradient system is used for the elution of l-DOPA: start with 100% of solvent A and 0% of solvent B for 12 min, in the next 5 min increase solvent B from 0% to 100% and decrease Solvent A from 100% to 0%, in the next 5 min increase solvent A to 100% and decrease solvent B to 0%, and then for the next 15 min wash the column with solvent A to bring the column to the starting condition (solvent A 100% and solvent B 0%).
Separation is performed at room temperature with a fl ow rate of 1.2 mL/min. Absorbance is monitored at 282 nm and peak areas are determined. The peak area is converted to the DOPA amount using a calibration curve prepared by injecting 100 μL (the same amount as the sample extract) of the DOPA solution (2–100 μg/mL in 0.1 N HCl). Results are expressed as g/100 g on a dry matter basis (2).
3. Notes 1. Raw samples should be stored under a dry, dark, and low temperature
condition. 2. During the acid extraction, ascorbic acid (50–100 mg/L) can be used to inhibit
the polyphenoloxidase mediated oxidation of l-DOPA.
References 1. Siddhuraju, P., and Becker, K. (2001) Rapid reversed–phase high perfor-
mance liquid chromatographic method for the quantifi cation of l-DOPA (L-3,4-dihydroxyphenylalanine), non-methylated and methylated tetrahydro-isoquinoline compounds from Mucuna beans. Food Chem. 72, 389–394.
2. Siddhuraju, P., Becker, K., and Makkar, H. P. S. (2000). Studies on the nutritional composition and antinutritional factors of three different germplasm seed materials of an under–utilized tropical legume, Mucuna pruriens var. utilis.J. Agric. Food Chem. 48, 6048–6060.
55
From: Methods in Molecular Biology, vol. 393: Plant Secondary MetabolitesBy: H.P.S. Makkar, P. Siddhuraju and K. Becker © Humana Press Inc., Totowa, NJ
11
Glucosinolates
Key Words: Glucosinolates; pyridine acetate buffer; goiter; lead and barium acetate; myrosinase; ferricyanide reduction; anticarcinogenic; antioxidants; rapeseed; isothiocyanates; thiocyanates; nitriles; glucose; DEAE-Sephadex A-25.
1. Introduction1.1. Nature, Mechanism of Action, and Biological Effects
Glucosinolates, a group of plant thioglucosides, occur naturally in many plant species. These consist of a β-thioglucose moiety, a sulfonated oxime moiety, and a variable side chain derived from an amino acid. More than 120 different side chains have been described, although glucosinolates are often divided into three groups according to the nature of their side chain: aliphatic, aromatic, and indolyl. The difference between the glucosinolates with regard to chemical properties and biological activity and the hydrolyzed products formed are largely determined by the side-chain structure.
Glucosinolates impair the nutritional quality of rapeseed and rapeseed meal and restrict its use as high-quality protein animal feed. Glucosinolates are always accompanied in plant tissues by the thioglucosidase enzyme, myrosinase (thioglucoside glucohydrolase), which catalyzes the cleavage of the thiogluco-side bond of glucosinolates. In the intact plant, enzyme and substrate occur in separate compartments, presumably as an adaptive measure to avoid autotoxic-ity. But following cell disruption, enzyme and substrate come into contact. The resulting hydrolysis involves cleavage of the thioglucoside bond and yields free glucose and an aglucone intermediate, which undergoes spontaneous degrada-tion to one of a number of toxic metabolites (isothiocyanates, thiocyanates, and nitriles). These released compounds are responsible for the characteristic biting
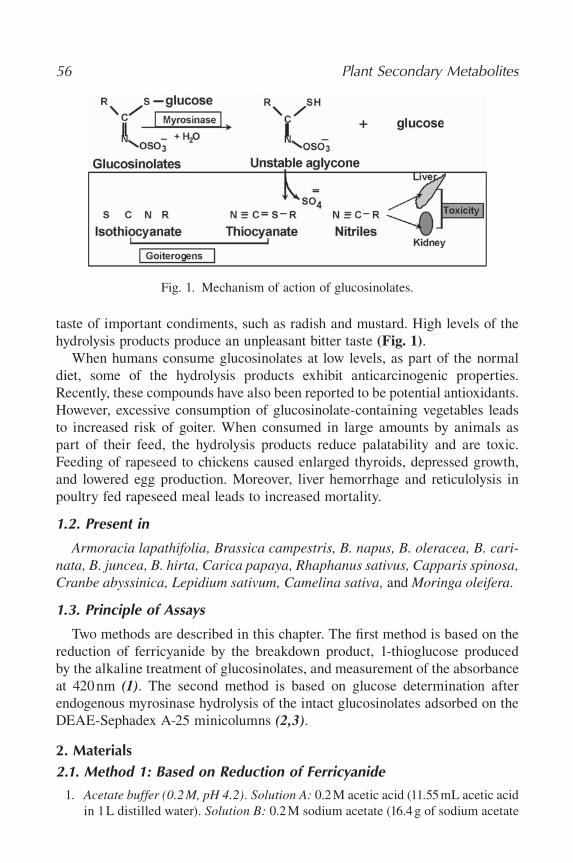
56 Plant Secondary Metabolites
Fig. 1. Mechanism of action of glucosinolates.
taste of important condiments, such as radish and mustard. High levels of the hydrolysis products produce an unpleasant bitter taste (Fig. 1).
When humans consume glucosinolates at low levels, as part of the normal diet, some of the hydrolysis products exhibit anticarcinogenic properties. Recently, these compounds have also been reported to be potential antioxidants. However, excessive consumption of glucosinolate-containing vegetables leads to increased risk of goiter. When consumed in large amounts by animals as part of their feed, the hydrolysis products reduce palatability and are toxic. Feeding of rapeseed to chickens caused enlarged thyroids, depressed growth, and lowered egg production. Moreover, liver hemorrhage and reticulolysis in poultry fed rapeseed meal leads to increased mortality.
1.2. Present in
Armoracia lapathifolia, Brassica campestris, B. napus, B. oleracea, B. cari-nata, B. juncea, B. hirta, Carica papaya, Rhaphanus sativus, Capparis spinosa, Cranbe abyssinica, Lepidium sativum, Camelina sativa, and Moringa oleifera.
1.3. Principle of Assays
Two methods are described in this chapter. The fi rst method is based on the reduction of ferricyanide by the breakdown product, 1-thioglucose produced by the alkaline treatment of glucosinolates, and measurement of the absorbance at 420 nm (1). The second method is based on glucose determination after endogenous myrosinase hydrolysis of the intact glucosinolates adsorbed on the DEAE-Sephadex A-25 minicolumns (2,3).
2. Materials2.1. Method 1: Based on Reduction of Ferricyanide
1. Acetate buffer (0.2 M, pH 4.2). Solution A: 0.2 M acetic acid (11.55 mL acetic acid in 1 L distilled water). Solution B: 0.2 M sodium acetate (16.4 g of sodium acetate
11. Glucosinolates 57
in 1 L distilled water). Take 36.8 mL of solution A and 13.2 mL of solution B, and dilute to a total volume of 100 mL with distilled water. Check pH and adjust if necessary.
2. Lead and barium acetate (0.5 M). Dissolve 189.5 g lead acetate 3H2O in 600 mL distilled water and to this solution add 127.7 g barium acetate, dissolve, and make the total volume up to 1 L.
3. Na2SO4 saturated solution (>1.4 M). Dissolve 10.65 g anhydrous Na2SO4 in 50 mL distilled water.
4. 2 M NaOH. Dissolve 80 g in 800 mL H2O and make the volume up to 1 L with distilled water.
5. Concentrated HCl (37%, w/v). 6. Sodium phosphate buffer 0.2 M, pH 7.0. Solution A: 0.2 M monobasic sodium
phosphate (27.8 g monobasic sodium phosphate in 1 L distilled water). Solution B: 0.2 M dibasic sodium phosphate (53.65 g of Na2HPO4·7H2O or 71.7 g of Na2HPO4·12H2O in 1 L distilled water). Take 39 mL of solution A, 61.0 mL of solution B, and dilute to a total volume of 200 mL with distilled water.
7. Potassium ferricyanide (K3Fe(CN)6), 2 mM. Dissolve 658 mg potassium ferricya-nide in 1 L phosphate buffer (0.2 M, pH 7).
2.2. Method 2: Based on Hydrolysis to Glucose
1. Pyridine acetate buffer (0.5 M, pH 5.0). Take 40 mL pyridine and to it add 30 mL glacial acetic acid, and make the volume up to 1 L with distilled water.
2. Pyridine acetate buffer (0.02 M, pH 5.0). Take 40 mL of the above buffer and dilute to 1 L with distilled water.
3. Myrosinase (thioglucosidase, EC 3.2.3.1., for example T-4528 from Sigma, St. Louis, MO). Dissolve 2.5 mg of the enzyme in 1 mL of the pyridine acetate buffer (0.02 M, pH 5). Use 250 μL of this solution for each determination.
4. Glucose kit No. 510-A (for example from Sigma, St. Louis, MO). 5. Methanol (70% v/v). Take 70 mL of methanol in a 100 mL volumetric fl ask and
make the volume up to 100 mL with distilled water. 6. DEAE-Sephadex A-25 ( for example from Pharmacia, Hounslow, Middlesex,
England) suspension. Prepare a suspension of DEAE-Sephadex A-25 by fi rst stirring the dry gel with an excess of 0.5 M the pyridine acetate buffer. Filter the suspension, wash it with 0.02 M pyridine acetate buffer, and fi nally suspend it in the 0.02 M pyridine acetate buffer, the volume of which was twice that of the settled gel.
3. Methods3.1. Method 1: Based on Reduction of Ferricyanide
3.1.1. Preparation of Extract
Take 500 mg ground sample in a glass test tube and pipette 7.5 mL of near-boiling acetate buffer (0.2 M, pH 4.2). Keep the mixture in a boiling water bath for 15 min. After cooling (5 min), mix it with 1.5 mL of the barium and lead
58 Plant Secondary Metabolites
acetate solution and vortex thoroughly. Add to it about 0.4 g of insoluble polyvinylpolypyrrolidone, stir, and incubate the mixture at room temperature for 15 min (see Note 1). Then add 1.5 mL of sodium sulfate solution while stirring. Vortex it and centrifuge the content for 10 min at 4000 g and collect supernatant. For a blank run the above procedure, without the sample.
3.1.2. Determination of Glucosinolates
1. Mix 0.9 mL of the clear supernatants (test and blank separately) with 0.9 mL of 2 M of NaOH, incubate it for 30 min at room temperature, and then add 0.138 mL of concentrated HCl (37%) to neutralize the solution.
2. Centrifuge the resulting mixture (4000 g for 10 min). Take 0.5 mL of the super-natant and mix with an equal volume (0.5 mL) of potassium ferricyanide (2 mM) prepared in phosphate buffer (pH 7, 0.2 M).
3. Vortex the mixture, centrifuge at 4000 g for 3 min, and measure the absorbance of the supernatant at 420 nm within 15 s against the blank. Convert the absorbance to the concentration using the following calibration curve.
3.1.3. Preparation of Calibration Curve
Sinigrin (for example, from Fluka Chemical Co., Taufkirchen, Germany) must be hydrolyzed with 2 M NaOH and continued in the same manner as the sample. Dissolve 5 mg sinigrin in 1 mL distilled water. Take 500 μL of the sini-grin-stock solution and to it add 500 μL of 2 M NaOH. After mixing, incubate the solution for 30 min at room temperature. Then add 77 μL of concentrated HCl (37%). The fi nal concentration of sinigrin monohydrate is 2.3364 mg/mL. From this, take 0 to 500 μL and add the phosphate buffer to reach the fi nal volume of 500 μL. Add 500 μL of potassium ferricyanide in each tube, mix thoroughly, and centrifuge at 4000 g for 3 min. Collect the supernatant and measure the absorbance at 420 nm against the phosphate buffer pH 7.0.
3.2. Method 2: Based on Hydrolysis to Glucose
3.2.1. Preparation of Extract
Take 200 mg of ground seed sample (ground preferably using a ball mill; seeNote 2) into a clean and dry test tube. After preheating the tube (2 min) in a water bath or heating block, set at 75° to 76°C, add approximately 3 mL of 70% v/v methanol (preheated to boiling point). Stir the suspension continuously for 10 min. Centrifuge it at 4000 g for 10 min and carefully decant the supernatant. Repeat the extraction and centrifugation steps twice, heating for 5 min each time. Then combine the three supernatants and remove the methanol by rotary evapo-ration at approximately 40°C to give a volume of about 1 mL. Adjust the volume of this solution to exactly 10 mL with distilled water, mix well, and freeze the solution (−18°C) until analysis. This solution is designated as solution A.

11. Glucosinolates 59
3.2.2. Preparation of DEAE-Sephadex A-25 Minicolumns
Warm the end of a Pasteur pipette (short-form) in a fl ame and insert a 2-μLmicrocap pipette such that it protrudes approximately 1 cm. Hold the Pasteur pipette horizontal and introduce a drop of molten paraffi n wax into the gap between the two pipettes, allowing the wax to fi ll the gap. Firmly plug the bottom of the Pasteur pipette with fi ne glass wool and wash with distilled water. Add a suspension of DEAE-Sephadex A-25 (1 mL) and allow the column to drain. After washing with distilled water the column is ready for use. With practice it is simple to produce columns with reproducible fl ow rates and performance and at very low cost.
3.2.3. Enzymatic Hydrolysis of Glucosinolates
For each determination, prepare a Sephadex minicolumn as described above. The fl ow through the column ceases when the water or solution reaches the surface of the gel. Add solution A (4 mL) to the Sephadex minicolumn, taking care not to disturb the gel bed. Allow the column to drain and wash it with distilled water (2 × 0.5 mL), followed by the addition of 0.02 M pyridine acetate buffer (2 × 0.5 mL), allowing each addition to drain completely. Discard all effl uents. Wipe the column tip clean, place a clean, dry vial beneath the column, add 0.25 mL of the myrosinase (thioglucosidase) solution to the surface of the gel, and collect the effl uent. After 2 to 15 h at room temperature (25°C), elute the liberated glucose by adding 0.5 mL distilled water and allowing the column to drain fully before adding a further aliquot of water (0.5 mL). Collect the effl uent (fi nal volume 1.25 mL) (designated as solution B). If necessary, solution B may be kept frozen (−18°C) until required for glucose assay (3).
3.2.4. Determination of Glucose
The glucose kit No. 510 A is used in accordance with the manufacturer’s instructions. In the event of low absorbance resulting from an aliquot of solution B, a higher volume of the test solution should be used. A linear response is obtained up to approximately 1.2 mg/mL of glucose, and above this concentra-tion there is a marked deviation from linearity. If glucose value higher than 1.0 mg/mL is obtained, dilute solution B and repeat the assay.
3.2.5. Calculation
Glucosinolates in seed (μ mol/g) = [glucose in solution B (mg/mL) × 1.25 × 10 × 1000]/(M × V × 180) = [(glucose in solution B (mg/mL) × 69.4]/M × V

60 Plant Secondary Metabolites
where M is the weight of the seed sample (g); V is the volume of solution A applied to the Sephadex-minicolumn (mL) and 10 mL is the total volume of solution A; 1.25 mL is the total volume of solution B; and 180 is the relative molecular mass of glucose.
4. Notes 1. During the extraction, the phenolics that interfere in the assay could be removed
by adsorption with polyvinylpolypyrrolidone. 2. The ground seed sample product should be thoroughly mixed and it should be
fi ne enough to pass through a standard 40-mesh sieve.
References 1. Jezek, J., Haggett, B. G. D., Atkinson, A., and Rawson, D. M. (1999) Deter-
mination of glucosinolates using their alkaline degradation and reaction with ferricyanide. J. Agric. Food Chem. 47, 4669–4674.
2. Heaney, R. K., Spinks, E. A., and Fenwick, G. R. (1988) Improved method for the determination of the total glucosinolate content of rapeseed by determination of enzymatically released glucose. Analyst 113, 1515–1518.
3. Makkar, H. P. S., and Becker, K. (1997) Nutrients and antiquality factors in dif-ferent morphological parts of the Moringa oleifera tree. J. Agric. Sci. (Cambridge)128, 311–322.
61
From: Methods in Molecular Biology, vol. 393: Plant Secondary MetabolitesBy: H.P.S. Makkar, P. Siddhuraju and K. Becker © Humana Press Inc., Totowa, NJ
12
Cyanogenic Glucosides/Cyanogens
Key Words: Cyanogenic glucoside; cyanogens; cyanide; β-glucosidase; linamarin; ATP production; nitrosamine; cassava leaves; drying; soaking; fermentation; Phaseolus lunatus seeds; sodium picrate; potassium cyanide; toxicity; goiter.
1. Introduction1.1. Nature, Mechanism of Action, and Biological Effects
Cyanide (hydrogen cyanide, HCN) in trace amounts is widespread in the plant kingdom and occurs mainly in the form of cyanogenic glucosides (also called as cyanogens). Cyanogens are glycosides of sugar and cyanide-containing aglycon. These generally taste bitter. Relatively high concentrations are found in certain grasses, pulses, root crops, and fruit kernels. Some cassava varieties are capable of producing over 1 g HCN/kg of fresh tissue. The poison-ing generally occurs due to consumption of new and young plants that contain higher amounts compared to the mature ones. Toxicity problems are highly variable and depend on the rate and amount of cyanogenic glucoside consumed, the presence of the β-glucosidase, and detoxifi cation of cyanide. Poisoning and death may occur when an uninitiated animal rapidly consumes a plant with moderate to high levels of cyanogenic glucoside. Chronic problems such as goiter may be caused by long-term consumption of lower levels.
Intact cyanogenic glucosides are not toxic. The liberated cyanide upon enzy-matic or acid hydrolysis is toxic. The lethal dose of HCN taken by mouth in humans has been estimated to be between 0.5 and 3.5 mg/kg body weight. A relatively large dose of HCN will cause death within a few minutes. The toxicity symptoms of ingested HCN are peripheral numbness and light-headedness fol-lowed by mental confusion and stupor, cyanosis, twitching, and convulsion with
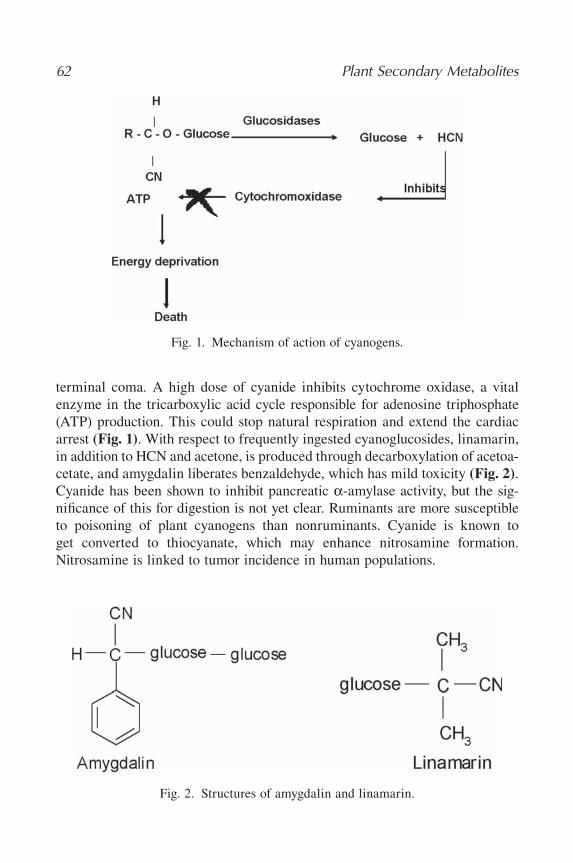
62 Plant Secondary Metabolites
Fig. 1. Mechanism of action of cyanogens.
Fig. 2. Structures of amygdalin and linamarin.
terminal coma. A high dose of cyanide inhibits cytochrome oxidase, a vital enzyme in the tricarboxylic acid cycle responsible for adenosine triphosphate (ATP) production. This could stop natural respiration and extend the cardiac arrest (Fig. 1). With respect to frequently ingested cyanoglucosides, linamarin, in addition to HCN and acetone, is produced through decarboxylation of acetoa-cetate, and amygdalin liberates benzaldehyde, which has mild toxicity (Fig. 2).Cyanide has been shown to inhibit pancreatic α-amylase activity, but the sig-nifi cance of this for digestion is not yet clear. Ruminants are more susceptible to poisoning of plant cyanogens than nonruminants. Cyanide is known to get converted to thiocyanate, which may enhance nitrosamine formation. Nitrosamine is linked to tumor incidence in human populations.
12. Cyanogenic Glucosides/Cyanogens 63
Detoxifi cation of small amounts of cyanide occurs mainly in the liver and to some extent in the kidney and thyroid in monogastrics. The enzyme rhodanase, present in animal tissues, detoxifi es cyanide by conjugation with sulfur to form thiocyanate. This thiocyanate may cause goiter.
Cyanogens can be removed by drying; for example, hay-making removes cyanogens by volatizing the cyanide released. Soaking and fermentation of cassava and discarding the water containing cyanide makes the cassava safe for human or livestock consumption.
1.2. Present in
Linseed, bitter cassava, sweet potato, yam, maize, sorghum vulgare, bamboo (tip of immature shoots), sugarcane, lima bean, Phaseolus lunatus, kernel of almond, lemon, lime, apple, pear, cherry, apricot, prune, plum, white clover, rubber cake, kosum cake, and bamboo leaves.
1.3. Principle of Assays
Two methods are presented in this chapter. In the fi rst method, hydrocyanic acid (HCN), evolved from the sample, reduces sodium picrate to a red-colored compound, in proportion to its amount evolved. The color intensity is measured at 510 nm (1–3). The second method is based on reaction of the evolved hydrocyanic acid with potassium hydroxide to form potassium cyanide, which then reacts with sodium picrate, forming a red-colored compound. The color intensity is measured at 520 nm (4).
2. Materials2.1. Method 1: Based on Reduction of Picrate
1. Sodium phosphate buffer (0.2 M, pH 5 and pH 8). Stock solution A: 0.2 M NaHPO4 (27.8 g in 1 L distilled water). Stock solution B: 0.2 M Na2HPO4·2H2O(35.6 g in 1 L distilled water).
Take 93 mL of solution A, mix with 6 mL of solution B, adjust the pH to 5, and make the volume up to 200 mL with distilled water. Take 5.3 mL of solution A, mix with 94.7 mL of solution B, adjust the pH to 8, and make the volume up to 200 mL distilled water.
2. Sodium carbonate (2.5%). Dissolve 2.5 g Na2CO3 in approximately 80 mL distilled water and make the volume up to 100 mL with distilled water.
3. Picric acid (1.4%) in 2.5% Na2CO3. Dissolve 1.4 g moist picric acid in 100 mL of 2.5% Na2CO3. After mixing the solution, prepare 1 : 500 dilutions with distilled water and check the absorbance value at 385 nm (absorbance should be at least 1.0). Note: 1% dry picric acid in 2.5% Na2CO3 after dilution (1 : 500) gives an absorbance of 0.999.

64 Plant Secondary Metabolites
4. Picrate paper. Dip a sheet of Whatman fi lter paper in the picric acid solution. Allow the paper to air dry and cut it into 3 cm × 1 cm strips. Paper can be stored for at least 4 weeks at 4°C in a screw-capped bottle.
2.2. Method 2: Based on Formation of Potassium Cyanide and Reaction with Picrate
1. Potassium hydroxide (2%). Dissolve 2 g KOH in 100 mL distilled water. 2. Alkaline picrate solution. Dissolve 50 g of sodium carbonate and 5 g of picric acid
in 1 L of distilled water brought nearer to boiling point to obtain dissolution.
3. Methods3.1. Method 1: Based on Reduction of Picrate
3.1.1. Preparation of Extract
Weigh 20 to 100 mg of the ground powder or leaf sample into a fl at-bottomed screw-capped glass bottle/vial and transfer 1 mL of phosphate buffer (0.2 M, pH 8.0). Insert a picrate paper attached with circular rubber cap and place in a proper position (on the neck of the bottle/vial) so that it just hangs on the empty space above the liquid phase. Close bottle/vial immediately with a screw cap. After incubation for 16 to 24 h at 30°C, take out the picrate paper carefully and immerse in a glass tube containing 5.0 mL distilled water and stir gently for 30 min at room temperature. Take out the colorless fi lter paper, and place the tube in a boiling water bath for 5 min. Centrifuge the solution at 4000 g for 5 min and measure absorbance at 510 nm against the reagent blank.
3.1.2. Preparation of Calibration Curve
Dissolve 241 mg of KCN in 1 L distilled water. This solution is equivalent to 100 μg of HCN/mL. From this solution, take aliquots of 0.1, 0.2, 0.3, 0.4, 0.5, 0.6, 0.7, 0.8, 0.9, and 1.0 mL in a screw-capped glass bottle/vial separately and add 0.9, 0.8, 0.7, 0.6, 0.5, 0.4, 0.3, 0.2, 0.1, and 0.0 mL of distilled water, respec-tively. Then add 4 mL distilled water in each tube, immerse the picrate paper strip, and stir gently for 30 min. Take out the colorless fi lter paper and place the tube in a boiling water bath for 5 min. Centrifuge the solution at 4000 g for 5 min and measure absorbance at 510 nm against the reagent blank. Use this calibration curve for determination of HCN concentration of the sample. The results can be expressed as milligrams of HCN/100 g of sample.
3.2. Method 2: Based on Formation of Potassium Cyanide and Reaction with Picrate
3.2.1. Extraction and Quantifi cation of Total Cyanide
1. Take 4 g of air-dried seed fl our/leaf sample in an 800-mL long-necked Kjeldhal fl ask and add 125 mL of distilled water and 2.5 mL of chloroform.
12. Cyanogenic Glucosides/Cyanogens 65
2. Pass the steam through this suspension to distill the HCN, which is trapped into a 50-mL test tube containing 5 mL of 2% KOH. Keep the delivery end of the condenser below the surface of the KOH solution. Collect approximately 20 mL of distillate and stop the distillation. Make up the volume to 50 mL with distilled water.
3. Pipette a 5-mL aliquot of the well-mixed distillate into a test tube. To this, add 5 mL of the alkaline picrate solution. Mix the contents of the tubes and heat in a boiling water bath for 5 min for color development.
4. Measure the color intensity at 520 nm against the reagent blank. 5. Prepare the blank with 5 mL of distilled water and 5 mL of the alkaline picrate
solution. 6. Prepare a standard curve by using potassium cyanide (241 mg of KCN in 1 L
distilled water, which gives 100 μg of HCN/mL) in the range of 10 to 100 μgequivalent of HCN.
7. Calculate the total cyanide content of the sample from the calibration curve and express the results as milligrams per 100 g seed fl our/leaf sample on a dry matter basis.
References 1. Bradbury, M. G., Egan, S. V., and Bradbury, J. H. (1999) Picrate paper kits for
determination of total cyanogens in cassava roots and all forms of cyanogens in cassava products. J. Sci. Food Agric. 79, 593–601.
2. Egan, S. V., Yeoh, H. H., and Bradbury, J. H. (1998) Simple picrate paper kit for determination of the cyanogenic potential of cassava fl our. J. Sic. Food Agric. 76,39–48.
3. Haque, M., and Bradbury, J. H. (2002) Total cyanide determination of plants and foods using the picrate and acid hydrolysis methods. Food Chem. 77, 107–114.
4. Jackson, M. L. (1967) Soil Chemical Analysis, Asia Publishing House, New Delhi, India, p. 337.

67
From: Methods in Molecular Biology, vol. 393: Plant Secondary MetabolitesBy: H.P.S. Makkar, P. Siddhuraju and K. Becker © Humana Press Inc., Totowa, NJ
13
Tannins
Key Words: Hydrolyzable tannins; condensed tannins; proanthocyanidins; polyvinylpoly-pyrrolidone; Folin-Ciocalteu reagent; butanol-HCl reagent; gallic acid; tannic acid; polyethylene glycol; 14C-labeled polyethylene glycol; ferric reagent; protein precipitation assay; biological activity of tannins; in vitro rumen fermentation buffer.
1. Introduction1.1. Nature, Mechanism of Action, and Biological Effects
Tannins are polyphenolic compounds that are broadly categorized into two major groups: (1) hydrolyzable tannins, consisting of a central core of carbohy-drate to which phenolic carboxylic acids are bound by ester linkage (Fig. 1);and (2) condensed tannins, or proanthocyanidins, consisting of oligomers of two or more fl avan-3-ols, such as catechin, epicatechin, or the corresponding gallocatechin (Fig. 2). Tannins have a very high affi nity for proteins and form protein-tannin complexes. The ingestion of a plant containing condensed tannins decreases nutrient utilization, protein being affected to a great extent, and decreases feed intake. On the other hand, hydrolyzable tannins are potentially toxic to animals. Consumption of feeds containing high levels of hydrolyzable tannins cause liver and kidney toxicity and lead to death of animals. Oak and yellow wood poisonings are attributed to hydrolyzable tannins (1).
The tannin assays are generally categorized into two groups: chemical methods and protein precipitation methods. Other methods that do not fall under these categories are the gravimetric assays, a tannin bioassay, and 14C-labeled polyethylene glycol binding assay (2).
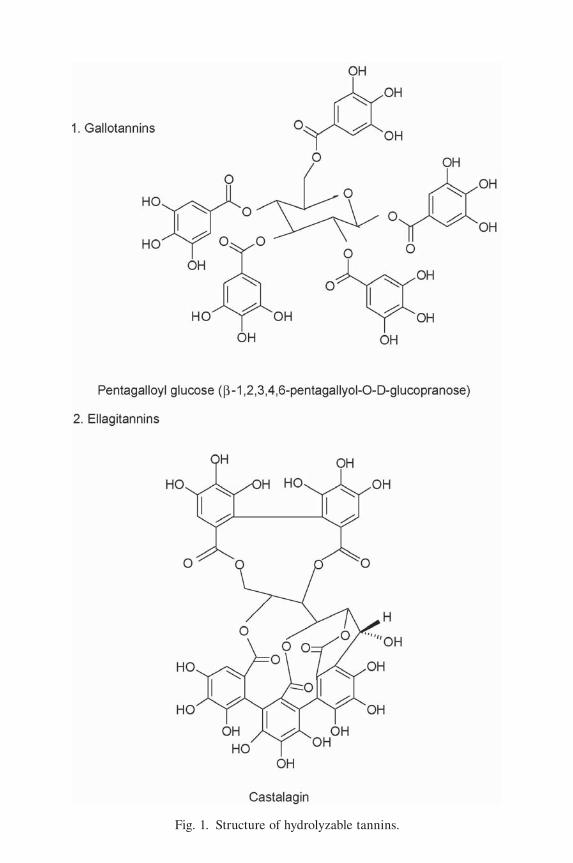
Fig. 1. Structure of hydrolyzable tannins.

13. Tannins 69
Fig. 2. Structure of hydrolyzable tannins.
70 Plant Secondary Metabolites
1.2. Chemical Assays
The most commonly used procedures in the category of chemical assays are described in the following subsections.
1.2.1. Total Phenol and Total Tannin Assays
These assays are based on the oxidation-reduction principle and use the Folin-Ciocalteu or Folin-Denis reagents. Another method using the ferric chloride reagent is based on the metal-complexing property of phenolics (3).The Folin-Ciocalteu method is used widely for total phenols because of its high sensitivity and reproducibility. However, the presence of reducing agents interferes in the assay. Nontannin phenolics cannot be distinguished from tannins with both the oxidation-reduction and metal-complexing methods. Tannins are distinguished from nontannins by using a solid matrix, polyvinyl-polypyrrolidone (PVPP). A portion of the plant extract is treated with PVPP. This method assumes that the phenolics that bind to proteins are the same as those that bind to PVPP. Total phenols are measured in a plant extract using the Folin-Ciocalteu method before and after treatment with PVPP. Polyvinyl-polypyrrolidone has a high affi nity for tannins and its removal using centrifuga-tion, following the PVPP treatment, removes tannins from the extract. The difference between total phenol values before and after the PVPP treatment is a measure of tannins (4).
1.2.2. Vanillin Assay and Butanol-HCl Methods for Condensed Tannins
Vanillin assay is based on the metal-complexing properties of tannins (5,6),and the butanol-HCl assay with and without addition of iron on the oxidative depolymerization of tannins (7). The vanillin assay has been widely used for measuring condensed tannins in sorghum and other beans. This assay is not very specifi c since it measures fl avan-3-ols and dihydrochalcones, which are nontannin, in addition to condensed tannins. In addition, in this method mono-meric fl avans give higher color yield as compared to condensed tannins, and proanthocyanidins based on 5-deoxyfl avanols, such as profi stinidin in quebra-cho tannin, do not react; the presence of acetone interferes in this assay, and reproducibility of this method is not good (8). The acidic butanol method is simple and more specifi c compared to the vanillin assay. This method yields pink-colored anthocyanidins on oxidative cleavage of the interfl avan bonds of condensed tannins in the presence of mineral acids in alcoholic solutions at about 95°C. This method was later modifi ed by inclusion of iron in the butanol-HCl reagent. The addition of iron was considered to enhance the sensitivity and reproducibility of the assay (7).

13. Tannins 71
1.2.3. Hydrolyzable Tannin Assays
The approach used for the determination of hydrolyzable tannins is based on their conversion to a common unit and the determination of the common units by spectrophotometric or high-performance liquid chromatography (HPLC) methods. These methods are useful for simple hydrolyzable tannins but may provide limited information for complex oligomeric hydrolyzable tannins. The rhodanine method (9) determines gallotannins as gallic acid equivalent. In this method, gallotannins are hydrolyzed under anaerobic and acidic conditions to gallic acid, which is reacted with rhodanine to give pink chromophore (mea-sured at 520 nm). The specifi city and sensitivity of the assays could be increased by measuring gallic acid by the HPLC method (2). Recently, Hagerman’s group (10) modifi ed the potassium iodate method to include a fi rst step in which all of the hydrolyzable tannins are converted to a single chemical species, methyl gallate. The advantage of this method is that the effect due to the difference in reactivity of the parent compounds is thus eliminated, and results from various laboratories can be compared directly since they are measured in terms of methyl gallate, which is commercially available.
1.3. Protein Precipitation Assays
The methods for quantifi cation of tannins based on their property of com-plexing with proteins (protein precipitation assays) are considered to provide better information on the biological value of feeds and fodders containing tan-nins. In these methods, protein-tannin complexes are prepared. The protein in these complexes is measured using the ninhydrin assay of amino acids released by alkaline hydrolysis of the complex (11,12), which represents protein precipi-tation capacity; and when phenolics in the complex are determined by the ferric chloride method (3) the protein precipitable phenolics are measured. The method based on binding of 125I-labeled bovine serum albumin (13) for determination of the protein precipitation capacity of tannins is accurate and sensitive. Recently, this method has been simplifi ed (14). However, it requires special equipment and some degree of expertise.
In another method (15), the tannin-protein complexes are formed on a chromatography paper and reacted with the protein bovine serum albumin (BSA). Unbound BSA is washed off, and the protein in the tannin-protein complex is stained with Ponceau S, a dye specifi c for proteins. Protein-bound dye is eluted and the absorbance of the eluate is measured at 525 nm. The absorbance is converted to protein by using a calibration curve. This method is about 20 times more sensitive than the other methods (11,12). The protein bound to tannins can also be measured using amido black dye, which can be eluted and measured or can be measured using an image analyser (16). Another
72 Plant Secondary Metabolites
advantage of these methods (14–16) is that acetone containing plant extracts can be used, whereas the presence of acetone interferes in other protein precipitation assays (3,11–13). The preparation of plant extract in aqueous acetone (generally 70%) is desirable because the solubility of tannins and phenolics is higher in aqueous acetone solution, and acetone prevents oxidation of phenols.
Another protein precipitation method that is insensitive to acetone is the radial diffusion assay (17). The tannin-protein complex is formed in the gel containing BSA, which appears as a ring. The diameter of the ring is a measure of protein precipitation/binding capacity of tannins.
1.4. Gravimetric Methods
The spectrophotometric methods determine tannins relative to one or another standard, namely tannic acid, gallic acid, catechin, quebracho tannins, leuko-anthocyanins, etc. The gravimetric method (18) based on the precipitation of phenolics by ytterbium acetate measures total phenolics and not tannins. This method is not specifi c for phenolics. It precipitates other moieties in addition to phenolics. In addition, the precipitation is not complete at low phenolic concen-tration, and some phenolics, for example, rutin, is not precipitated (19), leading to underestimation of phenolics. Another gravimetric method (4) is based on weighing the tannin extract before and after removal of the tannin by treatment with PVPP to bind tannin and removal of the PVPP-tannin complexes by cen-trifugation. Gravimetric methods have generally lower sensitivities than colori-metric methods and are time-consuming. The gravimetric method (4) also suffers from these disadvantages. So it should be used when the dry matter digestibility of tannin-rich feeds needs to be corrected for the presence of tan-nins. For other routine applications the principle of the gravimetric method is used in conjunction with a spectrophotometric method. Total phenols are deter-mined spectrophotometrically using the Folin-Ciocalteu reagent in the extract before and after the PVPP treatment. The difference in these phenolic values is a measure of tannins. This difference (tannins) when expressed as tannic acid equivalent is quite close to the tannin levels determined gravimetrically in leaves from various trees and browses; each gram of tannins (by mass) had a reducing power equivalent to 0.76 to 1.25 g tannic acid (4).
1.5. Tannin Bioassay
All available protein precipitation assays measure tannins under conditions different from those of the rumen, and therefore the results obtained have limited applicability for predicting the nutritive value of tannin-containing feedstuffs. Polyethylene glycol and polyvinylpyrrolidone bind to tannins and make them inert (20). This property has been exploited together with the in
13. Tannins 73
vitro gas method to quantify the effects of tannins on rumen fermentation. Incubation of polyethylene glycol 6000 along with a tannin-containing feedstuff in the in vitro system increases gas production. The percentage increase in gas production, for example at 24 h of incubation, represents the effects of tannins. The higher the percentage increase in gas production, the greater is the effect (20).
1.6. 14C-Labeled Polyethylene Glycol Binding Assay
Polyethylene glycols (PEGs) of molecular weights 4000 or 6000 have a very high affi nity for both hydrolyzable and condensed tannins over a wide range of pH (20). In this method the feed samples are kept in contact with PEG spiked with 14C-labeled PEG, and the radioactivity bound to feed sample is a measure of tannins; the higher the activity, the higher the tannins. The method is report-edly useful since there is no need to extract tannins, and it is considered to be a measure of both bound and extractable tannins (21,22). The formation of soluble tannin-PEG complexes, which is not recovered in the feed sample, can underestimate the tannin values. There is a need to study the extent of formation of soluble versus precipitable PEG-tannin complexes under the conditions of the assay (and to study the nutritional signifi cance of these soluble complexes); to standardize the assay for parameters such as optimum particle size of the sample, temperature, and treatment time; and to investigate the extent of non-specifi c binding of 14C-PEG. Additionally, correlations should be established between the PEG-binding assay and protein precipitation assays or the tannin bioassay using the in vitro gas method or the increase in the nitrogen degrad-ability of feeds on addition of PEG. Inclusion of in vivo parameters such as intake, nitrogen balance, and degradability, production parameters (growth, wool production, etc.) for these feeds in the correlation studies, would reveal the usefulness of the in vitro methods in predicting nutritional and physiological effects of feeding tannin-containing diets to ruminants.
An increase in nitrogen degradability of a feed when incubated in an in vitro rumen fermentation system in the presence of PEG is also a measure of tannin activity, and this increase in nitrogen degradability has also been found to pre-dict the effects of tannins in ruminants (23,24).
1.7. Near-Infrared–Based Method
Tannins in legume forages were quantifi ed using near-infrared refl ectance spectroscopy. The wavelength, 2.150 μm, was identifi ed for prediction of con-densed tannins (25). This method may be applicable to the determination of tannins in large sample sets of homogeneous feeds such as forage legumes.
Among the above methods, only three methods are presented here:

74 Plant Secondary Metabolites
1. Total phenolic and tannin assays 2. Condensed tannin assay 3. Biological activity of tannins
For other methods, see A Laboratory Manual on Tannin Assays (Makkar, 2003).
2. Materials2.1. Measurement of Total Phenolics and Tannins Using the Folin-Ciocalteu Method, Based on Makkar et al. (4)
1. Folin-Ciocalteu reagent (1 N). Dilute commercially available Folin-Ciocalteu reagent (2 N) with an equal volume of distilled water. Transfer it into a brown bottle and store in a refrigerator (4°C). It must be golden-yellow. Do not use it if it turns olive green or green.
2. Sodium carbonate (20%). Weigh 40 g sodium carbonate.10 H2O, dissolve it in about 150 mL distilled water, and make the volume up to 200 mL with distilled water.
3. Insoluble polyvinylpyrrolidone (polyvinylpolypyrrolidone, PVPP). This is commercially available from Sigma, St. Louis, MO (P 6755).
4. Standard tannic acid solution (0.1 mg/mL). Dissolve 25 mg tannic acid obtained from Merck in 25 mL distilled water and then dilute 1 : 10 in distilled water (always use a freshly prepared solution).
2.2. Measurement of Condensed Tannins (Proanthocyanidins, Based on Porter et al. (7)
1. Butanol-HCl reagent (butanol-HCl 95 : 5 v/v). Mix 950 mL n-butanol with 50 mL concentrated HCl (37% w/v).
2. Ferric reagent (2% ferric ammonium sulfate in 2 N HCl). To prepare 2 N HCl, take 16.6 mL of concentrated HCl and make the volume up to 100 mL with distilled water. Dissolve 2.0 g ferric ammonium sulfate in 100 mL of 2 N HCl. This reagent should be stored in a dark-brown bottle.
2.3. Determination of Biological Activity of Tannins, Based on Makkar et al. (20)
1. Bicarbonate buffer solution: Dissolve 35 g sodium bicarbonate (NaHCO3) and 4 g ammonium carbonate (NH4HCO3) in approximately 500 mL distilled water and then make the volume up to 1 L with distilled water.
2. Macromineral solution: Dissolve 6.2 g potassium dihydrogen phosphate (KH2PO4), 5.7 g disodium hydrogen phosphate (Na2HPO4), and 0.6 g magnesium sulfate (MgSO4·7H2O) in approximately 500 mL distilled water and then make the volume up to 1 L with distilled water.
3. Micromineral solution: Dissolve 10 g manganese chloride (MnCl2·4H2O), 13.2 g calcium chloride (CaCl2·2H2O), 1 g cobalt chloride (CoCl2·6H2O), 8 g ferric
13. Tannins 75
chloride (FeCl3·6H2O) in approximately 50 mL distilled water and then make the volume up to 100 mL with distilled water.
4. Resazurin: Dissolve 0.1 g resazurin in 100 mL distilled water. 5. Reducing solution: Dissolve 996 mg sodium sulfi de (Na2S·9H2O) in 94 mL
distilled water and then add 6 mL of 1 N sodium hydroxide solution (dissolve 4 g sodium hydroxide in 100 mL distilled water for 1 N sodium hydroxide).
3. Methods3.1. Measurement of Total Phenolics and Tannins Using Folin-Ciocalteu Method, Based on Makkar et al. (4)
3.1.1. Extraction of Phenolics (Simple Phenolics and Tannins)
Dried and fi nely ground (ground preferably using a ball mill) plant sample (leaves, seeds, root, stem, etc.) is placed in a glass beaker of approximately 25-mL capacity (see Note 1); 10 mL of aqueous acetone (70%) is added and the beaker is suspended in an ultrasonic water bath and subjected to ultrasonic treatment at 300 W for 20 min at room temperature (see Notes 2 and 3). The content of the beaker is then transferred to centrifuge tubes and centrifuged for 10 min at approximately 3000 g at 4°C (if refrigerated centrifuge is not available, cool the contents by keeping the centrifuge tube on ice and then centrifuge at 3000 g using an ordinary clinical centrifuge). Collect the supernatant and keep it on ice (see Notes 4 and 5).
3.1.2. Preparation of Calibration Curve
Take 0.0, 10, 20, 30, 40, 50, 60, 70, 80, 90, and 100 μL of standard tannic acid solution in 5-mL glass test tubes separately. Then add an adequate quantity of distilled water for respective test tubes to bring the volume to 500 μL. To this solution, add 250 μL of the Folin-Ciocalteu reagent (1 N) and 1.25 mL of the sodium carbonate solution (fi nal volume will be 2.0 mL; tannic acid concentration will be 0.0 to 10 μg). Vortex the contents and incubate at room temperature under dark condition. After 40 min read absorbance at 725 nm against the reagent blank.
3.1.3. Analysis of Total Phenols
Take suitable aliquots of the above sample extract in test tubes and make the volume to 500 μL with distilled water. Add to it 250 μL of the Folin-Ciocalteu reagent (1 N) and then 1.25 mL of the sodium carbonate solution. Vortex the tubes and record absorbance at 725 nm after incubation for 40 min under dark conditions. Calculate the amount of total phenols as tannic acid equivalent from the above calibration curve. Express the results as total phenolics as grams per 100 g on a dry matter basis.
76 Plant Secondary Metabolites
3.1.4. Determination of Total Tannins
Weigh 100 mg PVPP in a 100 × 12 mm test tube. Add 1.0 mL distilled water and then 1.0 mL of the sample extract (100 mg PVPP is suffi cient to bind 2 mg of total phenols; if total phenolic content of feed is more than 10% on a dry matter basis, dilute the extract). Vortex and keep the tube at 4°C for 15 min, vortex it again, and centrifuge at 3000 g for 10 min. Collect the supernatant. This supernatant has only simple phenolics other than tannins (the tannins get bound to PVPP). Measure the phenolic content of the supernatant as mentioned above and express the content of nontannin phenolics on a dry matter basis. From the above results, the tannin content of the sample can be calculated as follows:
Total phenolics (%) − Nontannin phenolics (%) = Tannin (%)
The results can be expressed as tannic acid equivalent on a dry matter basis.
3.2. Measurement of Condensed Tannins (Proanthocyanidins), Based on Porter et al. (7)
3.2.1. Determination of Condensed Tannins
In a 100 mm × 12 mm glass test tube, take a suitable aliquot (0.1 to 0.5 mL) of the sample extract (for preparation of the extract see Section 3.1.1; also seeNote 6) and dilute it with 70% aqueous acetone to 0.5 mL (the aliquot volume depends on the amount of condensed tannins in the extract). To the tubes add 3.0 mL of the butanol-HCl reagent and 0.1 mL of the ferric reagent. Vortex the tubes and cover the mouth of each tube with a glass marble and transfer the tubes in a heating block adjusted at 97° to 100°C or in a boiling water bath for 60 min. After cooling the tubes, record absorbance at 550 nm. Subtract absorbance of a suitable blank, which is usually the unheated mixture. If the extract has fl avan-3,4-diols or fl avan 4-ol, a pink color develops without heating. If this happens, use one heated blank for each sample, composed of 0.5 mL extract, 3 mL n-butanol (no HCl), and 0.1 mL ferric reagent. Condensed tannins (% in dry matter) as leukocyanidin equivalent is calculated by the following formula:
(Absorbance at 550 nm × 78.26 × Dilution factor)/(% Dry matter)
This formula takes the effective E1%,1cm,550nm of leukocyanidin to be 460. The dilution factor is equal to 1 if 0.5 mL of the sample extract is taken before addition of 3 mL of the butanol-HCl reagent and the extract was made from a 200-mg sample in 10 mL 70% aqueous acetone (the dilution factor would be 5 if, for example, 0.1 mL of the sample extract is taken and to it is added 0.4 mL of 70% aqueous acetone before the addition of 3 mL of the butanol-HCl
13. Tannins 77
reagent; the amount of sample extract depends on the amount of condensed tannins in the extract; if by taking 0.5 mL of the sample extract the absorbance is greater than 0.6, take the lower amount of the sample extract and dilute to 0.5 mL with 70% aqueous acetone). See Note 7.
3.3. Determination of Biological Activity of Tannins, Based on Makkar et al. (20)
3.3.1. Sample Preparation
Dried leaves should be passed through a 1-mm sieve.
3.3.2. Weighing of Samples and Preparation of Syringes
Tare a specially made scoop (approximately 4 cm in length and 1 cm in depth/radius; a standard sodium hydroxide–containing plastic container can be cut horizontally in half to form the scoop) on an analytical balance. Weigh a 500-mg feed sample (passed through a 1-mm sieve) in the scoop and then insert a 5-mL-capacity pipette or a glass rod into the narrow end of the scoop and transfer the sample from the scoop into 100-mL calibrated glass syringes. Weigh 1 g tannin-complexing agent, polyethylene glycol, PEG (molecular weight 4000 or 6000) on the scoop and transfer it also into syringes similar to those for the feed samples. The feedstuffs with and without the tannin-complexing agent are incubated at least in triplicate.
3.3.3. Preparation of In Vitro Rumen Fermentation Buffer Solution
Collect the rumen fl uid and particulate matter before the morning feed from two cattle fed on a roughage diet, homogenize, strain, and fi lter through four layers of cheese cloth. Keep all glassware at approximately 39°C and fl ush these with carbon dioxide before use. Carbon dioxide is heavier than air and hence it remains in the glassware for a reasonable period, provided the container is not inverted upside down. The strained rumen fl uid is kept at 39°C under carbon dioxide and should be prepared just before the start of the incubation. As the amount of feed taken is 500 mg, the composition of the medium is based on Tilley and Terry (26). Menke et al. (27) reduced the rumen buffer volume per syringe by half as they used 200 mg of the substrate because of the limited volume of the syringes and the inconvenience of emptying the syringes. Here, besides recording the gas volume, the fermented material is taken for various analyses and hence the amount of substrate taken is 500 mg. There is an inher-ent error associated with gravimetric determination of the fermented residue, which is large if 200 mg feed is taken in place of 500 mg.
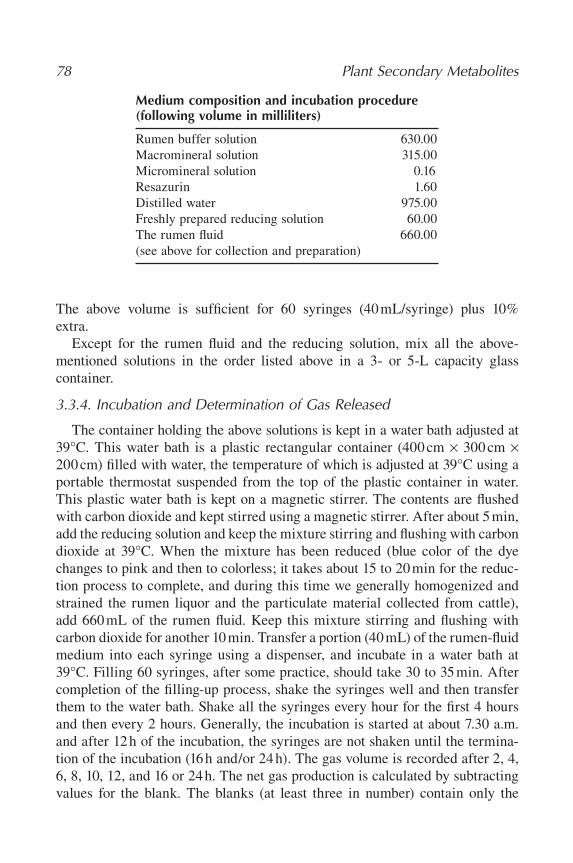
78 Plant Secondary Metabolites
Medium composition and incubation procedure (following volume in milliliters)
Rumen buffer solution 630.00Macromineral solution 315.00Micromineral solution 0.16Resazurin 1.60Distilled water 975.00Freshly prepared reducing solution 60.00The rumen fl uid 660.00(see above for collection and preparation)
The above volume is suffi cient for 60 syringes (40 mL/syringe) plus 10% extra.
Except for the rumen fl uid and the reducing solution, mix all the above-mentioned solutions in the order listed above in a 3- or 5-L capacity glass container.
3.3.4. Incubation and Determination of Gas Released
The container holding the above solutions is kept in a water bath adjusted at 39°C. This water bath is a plastic rectangular container (400 cm × 300 cm ×200 cm) fi lled with water, the temperature of which is adjusted at 39°C using a portable thermostat suspended from the top of the plastic container in water. This plastic water bath is kept on a magnetic stirrer. The contents are fl ushed with carbon dioxide and kept stirred using a magnetic stirrer. After about 5 min, add the reducing solution and keep the mixture stirring and fl ushing with carbon dioxide at 39°C. When the mixture has been reduced (blue color of the dye changes to pink and then to colorless; it takes about 15 to 20 min for the reduc-tion process to complete, and during this time we generally homogenized and strained the rumen liquor and the particulate material collected from cattle), add 660 mL of the rumen fl uid. Keep this mixture stirring and fl ushing with carbon dioxide for another 10 min. Transfer a portion (40 mL) of the rumen-fl uid medium into each syringe using a dispenser, and incubate in a water bath at 39°C. Filling 60 syringes, after some practice, should take 30 to 35 min. After completion of the fi lling-up process, shake the syringes well and then transfer them to the water bath. Shake all the syringes every hour for the fi rst 4 hours and then every 2 hours. Generally, the incubation is started at about 7.30 a.m. and after 12 h of the incubation, the syringes are not shaken until the termina-tion of the incubation (16 h and/or 24 h). The gas volume is recorded after 2, 4, 6, 8, 10, 12, and 16 or 24 h. The net gas production is calculated by subtracting values for the blank. The blanks (at least three in number) contain only the

13. Tannins 79
rumen-fl uid medium and no feed material. The addition of PEG to blanks does not affect the gas production from blanks, suggesting that it is inert.
3.3.5. Determination of Biological Activity of Tannins
The difference between the net volume of gas produced from syringes with and without PEG, generally at 16 h and 24 h, is measured, which is a measure of tannin effect. The PEG binds tannins and inactivates them. The higher the percent increase in gas (without PEG being 100%) on addition of PEG, the higher the biological activity of tannins with regard to rumen microbes (20).
4. Notes 1. Pigments and fat can be removed from the dried leaf sample by extracting with
diethyl ether containing 1% acetic acid before extracting phenolics. 2. A fi rst extraction with 50% aqueous methanol followed by a second extraction
with 70% aqueous acetone can also be used for extraction of phenolics. 3. A very long period of phenolic extraction and extraction at high temperature may
lead to inactivation of phenolics. 4. Freshly prepared extract should be used for phenolic and tannin analysis. 5. Tubes/containers containing the extract should be kept under cold conditions
until the analysis is complete. 6. The presence of pigments may interfere with this method. The pigments can
be removed by extracting the dried leaves with petroleum ether containing 1% acetic acid. Ascorbic acid (generally added to prevent oxidation of phenolics) does not interfere in the condensed tannin assay and can be added while prepara-tion of the plant extract (ascorbic acid interferes in the phenolic assay by Folin-Ciocalteu method).
7. Vanillin-HCl (5,6) is also used for determination of condensed tannins but this method is not specifi c (8,28). It measures condensed tannins as well as simple fl avonoids. This method also has several other disadvantages.
References 1. McSweeney, C.S., Makkar, H.P.S., and Reed, J.D. (2003) Modifi cation of rumen
fermentation to reduce adverse effects of phytochemicals. In: Proceedings of the Sixth International Symposium on the Nutrition of Herbivores, Mannetje, L.’t, Ramirez-Aviles, L., Sandoval-Castro, C., and Ku-Vera, J.C., (eds.), Merida, Mexico, 19–24 October, pp. 239–270.
2. Makkar, H.P.S. (2003) Quantifi cation of Tannins in Tree and Shrub Foliage, Makkar, H.P.S., (ed.), Kluwer Academic Press, New York, p. 102.
3. Hagerman, A.E., and Butler, L.G. (1978) Protein precipitation method for the quantitative determination of tannins. J. Agric. Food Chem. 26, 809–812.
4. Makkar, H.P.S., Blummel, M., Borowy, N.K., and Becker, K. (1993) Gravimetric determination of tannins and their correlations with chemical and protein pre-cipitation methods. J. Sci. Food Agric. 61, 161–165.

80 Plant Secondary Metabolites
5. Broadhurst, R.B., and Jones, W.T. (1978) Analysis of condensed tannins using acidifi ed vanillin. J. Sci. Food Agric. 29, 788–794.
6. Price, M.L., Van Scoyoc, S., and Butler, L.G. (1978) A critical evaluation of the vanillin reaction as an assay for tannin in sorghum grain. J. Agric. Food Chem. 26, 1214–1218.
7. Porter, L.J., Hrstich, L.N., and Chan, B.G. (1986) The conversion of procyanidin and prodelphinidins to cyaniding and delphinidin. Phytochemistry 25, 223–230.
8. Makkar, H.P.S., and Becker, K. (1993) Vanillin-HCl method for condensed tannins: effect of organic solvents used for extraction of tannins. J. Chem. Ecol.19, 613–621.
9. Inoue, K.H., and Hagerman, A.E. (1988) Determination of gallotannins with rhodanine. Anal. Biochem. 169, 363–369.
10. Hartzfeld, P.W., Forkner, R., Hunter, M.D., and Hagerman, A.E. (2002) Deter-mination of hydrolyzable tannins (gallotannins and ellagitannins) after reaction with potassium iodate. J. Agric. Food Chem. 50, 1785–1790.
11. Makkar, H.P.S., Dawra, R.K., and Singh, B. (1987) Protein precipitation assay for quantitation of tannins: Determination of protein in tannin-protein complex. Anal. Biochem. 166, 435–439.
12. Makkar, H.P.S., Dawra, R.K., and Singh, B. (1988) Determination of both tannin and protein in a tannin-protein complex. J. Agric. Food Chem. 36, 523–525.
13. Hagerman, A.E., and Butler, L.G. (1980) Determination of protein in tannin-protein precipitates. J. Agric. Food Chem. 28, 944–947.
14. Henson, G.L., Niemeyer, L., Ansong, G., Forkner, R., Makkar, H.P.S., and Hagerman, A.E. (2004) Modifi ed method for determining protein binding capacity of plant polyphenolics using radiolabeled protein. Phytochemical Anal.15, 159–163.
15. Dawra, R.K., Makkar, H.P.S., and Singh, B. (1988) Protein binding capacity of microquantities of tannins. Anal. Biochem. 170, 50–53.
16. Hoffmann, E.M., Muetzel S., and Becker, K. (2002) A modifi ed dot-blot method of protein determination applied in the tannin-protein precipitation assay to facilitate the evaluation of tannin activity in animal feeds. Br. J. Nutr. 87,421–426.
17. Hagerman, A.E. (1987) Radial diffusion method for determining tannin in plant extracts. J. Chem. Ecol. 13, 437–449.
18. Reed, J.D., Horvath, P.J., Allen, M.S., and Van Soest, P.J. (1985) Gravimetric determination of soluble phenolics including tannins from leaves by precipitation with trivalent ytterbium. J. Sci. Food Agric. 36, 255–261.
19. Lowry, J.B., and Sumpter, E.A. (1990). Problems with ytterbium precipitation as a method for determination of plant phenolics. J. Sci. Food Agric. 52,287–288.
20. Makkar, H.P.S., Blümmel, M., and Becker, K. (1995) Formation of complexes between polyvinyl pyrrolidone and polythylene glycol with tannins and their implications in gas production and true digestibility in in vitro techniques. Br. J. Nutr. 73, 897–913.
13. Tannins 81
21. Silanikove, N., Perevolotsky, A., and Provenza, F.D. (2001) Use of tannin-binding chemicals to assay for tannins and their negative postingestive effects in ruminants. Anim. Feed Sci. Technol. 91, 69–81.
22. Mlambo, V., and Makkar, H.P.S. (2005) Calibration and validation of the 14C-labelled polyethylene glycol-binding assay for tannins in tropical browse. Anim. Feed Sci. Technol. 122, 29–40.
23. Getachew, G., Makkar, H.P.S., and Becker, K. (2000) Effect of polyethylene glycol on in vitro degradability of nitrogen and microbial protein synthesis from tannin-rich browse and herbaceous legumes. Br. J. Nutr. 84, 73–83.
24. Jones, R.J., Meyer, J.H.F., Bechaz, M., and Stoltz, M.A. (2000) An approach to screening potential pasture species for condensed tannin activity. Anim. Feed Sci. Technol. 85, 269–277.
25. Goodchild, A.V., El Haramein, F.J., Makkar, H.P.S., El Monein, A.A., and Williams, P.C. (1997) 18th International Conference on Near-Infrared Spectros-copy, September 15–19, Haus der Technik, Essen, Germany.
26. Tilley, J.M., and Terry, R.A. (1963) A two-stage technique for the in vitro digestion of forage crops. J. Br. Grasslands Soc. 18, 104–111.
27. Menke, K.H., Raab, L., Salewski, A., Steingass, H., Fritz, D., and Schneider, W. (1979) The estimation of the digestibility and metabolizable content of animal feedstuffs from the gas production when they are incubated with rumen liquor in vitro. J. Agric. Sci. (Cambridge) 93, 217–222.
28. Makkar, H.P.S., and Becker, K. (1994) Some problems in the determination of tannins and possible solutions. Acta Horticultura 381, 782–788.

83
From: Methods in Molecular Biology, vol. 393: Plant Secondary MetabolitesBy: H.P.S. Makkar, P. Siddhuraju and K. Becker © Humana Press Inc., Totowa, NJ
14
Gossypol
Key Words: Gossypol; free gossypol; cottonseed; antioxidant; constipation; depressed appetite; aniline; Gossypium spp.; thiourea.
1. Introduction1.1. Nature and Biological Effects
Gossypol is a polyphenolic aldehyde (Fig. 1) that is an antioxidant and polymerization inhibitor. It is toxic to monogastric animals; pigs and rabbits are the most sensitive, whereas poultry are relatively more tolerant. The general symptoms of gossypol toxicity are constipation, depressed appetite, loss of weight, and death, which usually results from circulatory failure. Although acute toxicity is low, ingestion of small amounts over a prolonged period can be lethal. It is important to distinguish between free (soluble in 70–30 v/v aqueous acetone) and bound gossypol since only the former is considered to be physiologically active.
1.2. Present in
Gossypium spp.
1.3. Principle of Assays
This chapter describes methods for determination of total and free gossypol. Total gossypol includes gossypol and gossypol derivatives, both free and bound. These react with 3-amino-1-propanol in dimethylformamide solution to form a diaminopropanol complex, which then reacts with aniline, giving dianilino-gossypol. Gossypol analogues and gossypol derivatives having an available aldehyde moiety are measured by the method (1). This method is applicable to
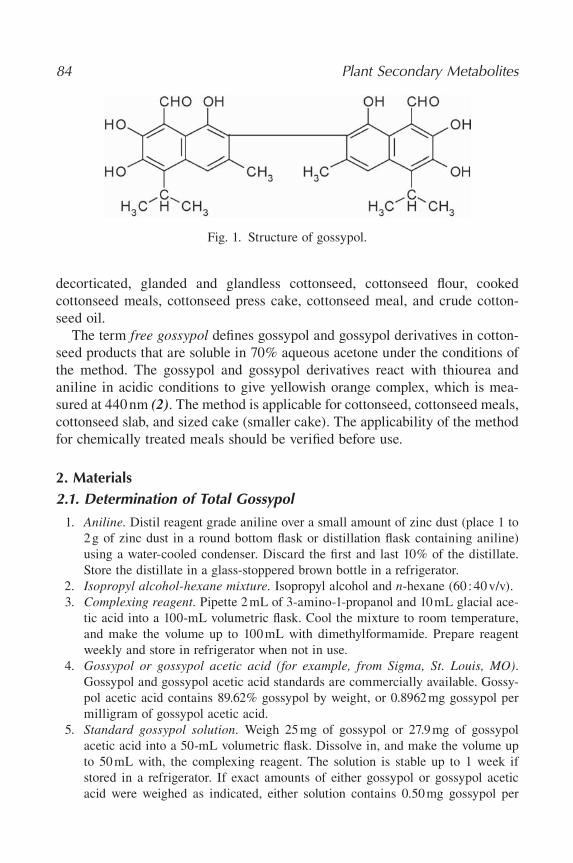
84 Plant Secondary Metabolites
decorticated, glanded and glandless cottonseed, cottonseed fl our, cooked cottonseed meals, cottonseed press cake, cottonseed meal, and crude cotton-seed oil.
The term free gossypol defi nes gossypol and gossypol derivatives in cotton-seed products that are soluble in 70% aqueous acetone under the conditions of the method. The gossypol and gossypol derivatives react with thiourea and aniline in acidic conditions to give yellowish orange complex, which is mea-sured at 440 nm (2). The method is applicable for cottonseed, cottonseed meals, cottonseed slab, and sized cake (smaller cake). The applicability of the method for chemically treated meals should be verifi ed before use.
2. Materials2.1. Determination of Total Gossypol
1. Aniline. Distil reagent grade aniline over a small amount of zinc dust (place 1 to 2 g of zinc dust in a round bottom fl ask or distillation fl ask containing aniline) using a water-cooled condenser. Discard the fi rst and last 10% of the distillate. Store the distillate in a glass-stoppered brown bottle in a refrigerator.
2. Isopropyl alcohol-hexane mixture. Isopropyl alcohol and n-hexane (60 : 40 v/v). 3. Complexing reagent. Pipette 2 mL of 3-amino-1-propanol and 10 mL glacial ace-
tic acid into a 100-mL volumetric fl ask. Cool the mixture to room temperature, and make the volume up to 100 mL with dimethylformamide. Prepare reagent weekly and store in refrigerator when not in use.
4. Gossypol or gossypol acetic acid (for example, from Sigma, St. Louis, MO).Gossypol and gossypol acetic acid standards are commercially available. Gossy-pol acetic acid contains 89.62% gossypol by weight, or 0.8962 mg gossypol per milligram of gossypol acetic acid.
5. Standard gossypol solution. Weigh 25 mg of gossypol or 27.9 mg of gossypol acetic acid into a 50-mL volumetric fl ask. Dissolve in, and make the volume up to 50 mL with, the complexing reagent. The solution is stable up to 1 week if stored in a refrigerator. If exact amounts of either gossypol or gossypol acetic acid were weighed as indicated, either solution contains 0.50 mg gossypol per
Fig. 1. Structure of gossypol.
14. Gossypol 85
milliliter. Multiply the milligrams of gossypol acetic acid by 0.8962 to obtain milligrams of gossypol.
2.2. Determination of Free Gossypol
1. Aqueous acetone (70%). Mix 700 mL acetone and 300 mL of distilled water. 2. Aqueous isopropyl alcohol (80%). Mix 800 mL isopropyl alcohol and 200 mL
of distilled water. 3. Thiourea solution. Dissolve 10 g of reagent grade thiourea in approximately
60 mL distilled water and dilute to 100 mL with distilled water. 4. Hydrochloric acid (1.2N). Dilute 106 mL of concentrated hydrochloric acid
(37% w/v) to 1 L with distilled water. 5. Aniline. Distill reagent grated aniline as described above. 6. Standard gossypol solution. Weigh accurately 25 mg of gossypol or 27.9 mg of
primary standard gossypol acetic acid into a 250-mL volumetric fl ask. Transfer approximately 100 mL of 70% acetone to the fl ask. Add 1.0 mL glacial acetic acid and 75 mL distilled water and dilute to 250 mL with 70% acetone. Mix these solutions well. Pipette 50 mL of the above solution into a 200-mL volumetric fl ask, add 100 mL 70% acetone and 60 mL distilled water, dilute to 200 mL with 70% acetone, and mix well. This standard gossypol solution contains 0.025 mg of gossypol per milliliter. It is stable for 24 h when protected from the light.
3. Methods3.1. Determination of Total Gossypol
3.1.1. Preparation of Sample
De-hull about 50 g sample (seeds) and grind in a Wiley mill using a 2-mm sieve. Avoid overheating of the sample.
3.1.2. Determination of Total Gossypol
1. Weigh 1 or 2 g of de-hulled sample (or meal) and transfer to a 50-mL volumetric fl ask (see Note 1). Add 10 mL of the complexing reagent along the walls of the fl ask and take down the sample adhering to neck of fl ask. A rapid delivery pipette may be used.
2. Prepare reagent blank containing 10 mL of the complexing reagent in a 50-mL volumetric fl ask. Heat sample and blank in a water bath (95–100°C) for 30 min. Cool them to room temperature and make the volume up to 50 mL with the isopropyl alcohol-hexane mixture and mix well (see Note 2).
3. Filter sample extract through a medium retention paper. Discard fi rst 5 mL of the fi ltrate and collect the rest.
4. Pipette duplicate aliquots of the fi ltrate (2 mL each) into 25-mL volumetric fl asks. Also pipette duplicate aliquots (2 mL) of the reagent blank into 25-mL volumetric fl asks.

86 Plant Secondary Metabolites
5. Dilute one set of the sample and blank aliquots to 25 mL with the isopropyl alcohol-hexane mixture, and reserve as reference solutions for absorbance measurement.
6. Add 2 mL aniline to the other set of the sample and reagent blank aliquots and heat in a water bath (95–100°C) for 30 min. Cool to room temperature, make the volume up to 25 mL with the isopropyl alcohol-hexane mixture, and mix well. Allow to stand for 1 h at room temperature after dilution (see Note 3).
7. Using a spectrophotometer measure absorbance at 440 nm of the reagent blank reacted with aniline against the blank aliquot without aniline (absorbance A).
8. Determine absorbance of the sample aliquot reacted with aniline against the sample aliquot without aniline (absorbance B). Subtract the absorbance of the reagent blank (A) from that of sample aliquot (B) to obtain the corrected absorbance. From the corrected absorbance of the sample, determine gossypol content using the calibration curve.
3.1.3. Preparation of Calibration Curve
1. Pipette in duplicate 1-, 2-, 3-, 4-, 6-, 8-, and 10-mL aliquots of the standard gossypol solution in 50-mL volumetric fl asks. Add the complexing reagent to make the volume up to 10 mL. Use 10 mL of the complexing reagent as a blank.
2. Heat fl asks in a water bath (95–100°C) for 30 min, cool to room temperature, make the volume up to 50 mL with the isopropyl alcohol-hexane solution, and mix well.
3. Pipette duplicate 2-mL aliquots of each standard and the reagent blank into 25-mL volumetric fl asks.
4. Dilute one set of the standard aliquots and reagent blank to 25 mL with the isopropyl alcohol-hexane solution and reserve as reference solutions for absor-bance measurements.
5. Add 2 mL aniline to the other set of the standard aliquots and the blank, heat in water bath (95–100°C) for 30 min, cool to room temperature, dilute to make volume 25 mL with the isopropyl alcohol-hexane solution, and mix well. Allow to stand for 1 h at room temperature before determining absorbance (see Note 3).
6. Using a spectrophotometer measure absorbance at 440 nm of the reagent blank reacted with aniline against the blank aliquot without aniline (absorbance Ac).
7. Determine absorbance of the sample aliquot reacted with aniline against the sam-ple aliquot without aniline (absorbance Bc). Subtract the absorbance of the reagent blank (Ac) from that of sample aliquot (Bc) to obtain corrected absorbance.
8. Draw a calibration curve using different concentrations of gossypol taken and their absorbances recorded.
3.2. Determination of Free Gossypol
3.2.1. Preparation of Extract and Determination of Free Gossypol
1. De-hull 50 g of the sample and remove the seed kernel from the hulls and lint. Grind the kernel in a Wiley mill to pass through a 2-mm screen. Do not preheat cottonseed and avoid heating during grinding.

14. Gossypol 87
2. Weigh (1–2 g) of the ground sample into a 250-mL Erlenmeyer fl ask and place fi ve or six glass beads on the bottom of the fl ask.
3. Add 50 mL of 70% aqueous acetone, stopper the fl ask with a leak proof glass stopper or polyethylene stopper, and shake vigorously on a mechanical shaker for 1 h.
4. Filter through a medium retentive fi lter paper (for example, Whatman No. 2). Discard the fi rst 5 mL of fi ltrate, and collect the rest of the fi ltrate in a small fl ask. Place a watch glass over the funnel to reduce evaporation during fi ltration.
5. Pipette appropriate duplicate aliquots of the fi ltrate (2–10 mL) into 25-mL volumetric fl asks.
6. To one sample aliquot, designated as solution A, add two drops of 10% aqueous thiourea, one drop of 1.2 N HCl, and make the volume up to 25 mL with 80% aqueous isopropyl alcohol.
7. To the other sample aliquot, designated as solution B, add two drops of 10% aqueous thiourea, one drop of 1.2 N HCl, and 2 mL of redistilled aniline. A rapid delivery pipette may be used for dispensing aniline.
8. Prepare a reagent blank containing a volume of 70% aqueous acetone solution, equal to that of the sample aliquot, and add two drops of 10% aqueous thiourea (do not add any 1.2 N HCl), and 2 mL of aniline.
9. Heat the sample aliquot (at serial number 7) and the reagent blank (at serial number 8) in a boiling water bath (100°C) for 30 min.
10. Remove the solutions from the bath, add 10 mL of 80% aqueous isopropyl alcohol, and cool to room temperature in a water bath. Make the volume up to 20 mL with 80% aqueous isopropyl alcohol.
11. Determine the absorbance of sample aliquot A (at serial number 6) at 440 nm using the aqueous isopropyl alcohol to set the instrument at 0 absorbance (seeNote 3).
12. With the instrument set at 0 absorbance with the aqueous isopropyl alcohol, determine the absorbance of the reagent blank (at serial numbers 8 and 9). If the reagent blank exceeds 0.022 absorbance, the analysis must be repeated using freshly distilled aniline.
13. Determine the absorbance of sample aliquot B (at serial numbers 7 and 9) at 440 nm using the reagent blank (at serial numbers 8 and 9) to set the instrument at 0 absorbance.
14. Calculate the corrected absorbance of the sample aliquot as follows: Corrected absorbance = [Absorbance solution B − Absorbance solution A].
15. From the corrected absorbance of the sample aliquot (at serial number 14), determine the gossypol content in the sample aliquot by reference to a calibration graph prepared using the following procedure.
3.2.2. Preparation of Calibration Curve
1. Pipette in duplicate 1-, 2-, 3-, 4-, 5-, 7-, 8-, and 10-mL aliquots of the standard gossypol solution (0.025 mg/mL) into 25-mL volumetric fl asks.

88 Plant Secondary Metabolites
2. To one set of aliquots, designated as A, add two drops of 10% aqueous thiourea, one drop of 1.2 N HCl, and make the volume up to 25 mL with the aqueous isopropyl alcohol.
3. Determine the absorbance as outlined in Section 3.2.1. 4. To the other set of standard gossypol aliquots, designated as B, add two drops of
10% aqueous thiourea, two drops of 1.2 N HCl, and 2 mL of redistilled aniline. Prepare a reagent blank containing 10 mL of aqueous acetone, two drops of 10% aqueous thiourea, and 2 mL of aniline (do not add any 1.2 N HCl to the reagent blank).
5. Heat the standards and the reagent blank in a boiling water bath (100°C) for 30 min, cool to room temperature, and make the volume up to 25 mL with the aqueous isopropyl alcohol.
6. Determine the absorbance as directed in Section 3.2.1. at serial numbers 12 and 13.
7. Calculate the corrected absorbance for each standard gossypol aliquot as follows: Corrected absorbance = [Absorbance solution B − Absorbance solution A].
8. Plot this corrected absorbance of each gossypol standard against the correspond-ing milligrams of gossypol in the 25 mL volume, to obtain the calibration graph.
4. Notes 1. This method may not be applicable to feeds containing whole, unprocessed
cottonseed. Components such as minerals, protein, oil, and polysaccharides in the feed interfere with this method and may give false-positive results.
2. Extracts of sample treated with the complexing reagent are exceptionally stable, and if necessary, can be stored under refrigeration for several days before conducting the aniline spectrophotometer reaction.
3. After the aniline reaction, a slight increase in absorbance is observed up to 1 h, and the color is stable for 1 to 5 h. The absorption maxima of the gossypol-aniline reaction product should be at 440 nm. However, depending on the wavelength accuracy of the spectrophotometer and the band isolated, the maxima may be in the range of 440 to 450 nm. All absorbance measurements should be taken at the actual maxima for the spectrophotometer used.
References 1. AOCS (1985). Determination of total gossypol. Offi cial Method Ba. 8–78. Offi cial
and Tentative Methods of Analysis. 3rd ed. American Oil Chemists Society, Chicago.
2. AOCS (1985). Determination of free gossypol. Offi cial Method Ba. 7–58. Offi cial and Tentative Methods of Analysis. 3rd ed. American Oil Chemists Society, Chicago.
89
From: Methods in Molecular Biology, vol. 393: Plant Secondary MetabolitesBy: H.P.S. Makkar, P. Siddhuraju and K. Becker © Humana Press Inc., Totowa, NJ
15
Chlorogenic Acid
Key Words: Chlorogenic acid; antioxidant; carcinogenic inhibitor; sunfl ower; titanium reagent.
1. Introduction1.1. Nature and Biological Effects
Chlorogenic acid is a phenolic compound (Fig. 1). It is an antioxidant and a carcinogenic inhibitor; however, its presence in oilseeds and grains poses nutritional problems. Chlorogenic acid found in the range of 2 to 4 g/100 g of defatted sunfl ower meal is a matter of concern. Inclusion of high levels of sunfl ower and rapeseed meal in animal diets decreases the hydrolytic enzymes and interferes with the utilization of various nutrients including protein, amino acids, and minerals. Breeding for a low-chlorogenic-acid–containing sunfl ower and developing the technology to remove chlorogenic acid from the defatted meal are major areas of sunfl ower research today.
1.2. Present in
Coffee beans, sunfl ower seeds, and rapeseed.
1.3. Principle of Assay
Chlorogenic acid is extracted with alcohol. Alcohol is removed using vacuum drying, and the dried material is dissolved in acetone. It is reacted with titanium ion to form a colored complex, which is measured at 450 nm (1)(see Note 1).

90 Plant Secondary Metabolites
Fig. 1. Structure of chlorogenic acid.
2. Materials 1. Titanium reagent. Weigh 20 g titanium chloride (TiCl4) and dissolve in approxi-
mately 85 mL of concentrated HCl (37% w/v), and make the volume up to 100 mL with the concentrated HCl.
2. HCl (2.5 N). Take 100 mL concentrated HCl (37% w/v) and make the volume up to 360 mL with distilled water.
3. Methods3.1. Determination of Chlorogenic Acid
Refl ux twice a known quantity of defatted sunfl ower meal in 80% aqueous ethanol (adjusted to pH 4.0 with 2.5 N HCl) for 30 min (125 mL to 1 g meal). Filter and collect 250 mL of the extract. Then remove 0.5 mL of the extract and dry in a vacuum oven at 50°C (can take 2 h). It can be dried by fl ushing with nitrogen gas, which takes 10 to 15 min. Dissolve the dried extract in 9.5 mL of acetone and to this add 0.5 mL of the titanium reagent. After incubating for 5 min at room temperature, mix the solution thoroughly and read the color intensity at 450 nm against the reagent blank (acetone plus titanium reagent; 9.5 and 0.5 mL, respectively). Prepare a calibration curve and determine chlorogenic acid content in the sample using the calibration curve. Express chlorogenic acid content as grams per 100 g sample.
3.2. Calibration Curve
Prepare a series of standard solutions of chlorogenic acid (0–200 μg/mL) in 10 mL of acetone in 15-mL screw-top glass tubes. Add to each tube 0.5 mL of the titanium reagent and thoroughly mix the solution using a vortex mixture. A colored complex between the chlorogenic acid and titanium is formed imme-diately. Measure the absorbance at 450 nm in a spectrophotometer against an equivalent blank.
15. Chlorogenic Acid 91
4. Note 1. The titanium chloride method can be followed for other phenolic compounds
too. But the wavelength of maximum absorbance differs. Total phenols can be measured at 410 nm, and catechol and catechin at 430 nm.
Reference 1. Eskin, M. M. A., Hochn, E., and Frenkel, C. (1978) A simple and rapid
quantitative method for total phenols. J. Agric. Food Chem. 26, 973–975.

93
From: Methods in Molecular Biology, vol. 393: Plant Secondary MetabolitesBy: H.P.S. Makkar, P. Siddhuraju and K. Becker © Humana Press Inc., Totowa, NJ
16
Saponins
Key Words: Steroidal saponins; triterpenoid saponins; sapogenins; hemolytic activity; foaming; hypocholesterolemic effects; medicagenic acid; sapogenin; diosgenin; vanillin-perchloric acid reagent; TLC plate; fenugreek; Quillaja; Yucca.
1. Introduction1.1. Nature, Mechanism of Action, and Biological Effects
Saponins comprise a large family of structurally related compounds contain-ing a steroid or triterpenoid aglycone (sapogenin) linked to one or more oligo-saccharide moieties by glycosidic linkage (Fig. 1). The carbohydrate moiety consists of pentoses, hexoses, or uronic acids. The presence of both polar (sugar) and nonpolar (steroid or triterpene) groups provides saponins with strong surface-active properties that then are responsible for many of its adverse and benefi cial effects. The primary biological effect of saponins is the interactions with cellular and membrane components. For example, saponins hemolyze red blood cells by nonspecifi c interactions with membrane proteins, phospholipids, and cholesterol of erythrocytes.
Saponins are characterized by their hemolytic activity and foaming pro-perties and are responsible for imparting a bitter taste and astringency to plant materials containing high concentrations of saponins. Nonetheless, saponins are reported to affect the permeability of the small intestinal mucosal cells and thus have effect on active nutrient transport. Saponins have also been shown to inhibit various digestive enzymes, including trypsin and chymotrypsin, and are also known to inhibit protein degradation by forming saponin-protein complexes. On the other hand, positive nutritional effects of specifi c saponins such as hypocholesterolemic effects and improvement of growth in various
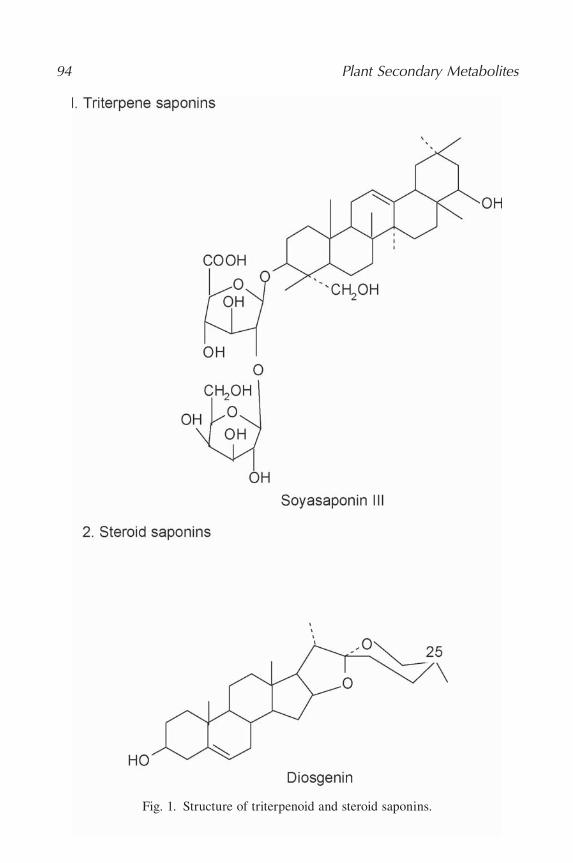
94 Plant Secondary Metabolites
Fig. 1. Structure of triterpenoid and steroid saponins.
16. Saponins 95
animal species have also been reported. Medicago sativa (Alfalfa, Lucerne) contains many saponins. Medicagenic acid is unique to alfalfa. Alfalfa saponins may lower growth rate in chicks and egg production of hens when included in poultry diets above 5%.
The cardiac glycosides are also saponins. Digitalin is the cardiac glycoside in Digitalis species and other Serophulariaceae. The closely related cardiac glycoside, strophanthin, is found in the Apocynaceae. Livestock poisoning caused by strophanthin has occurred in Kenya when sheep and cattle consumed leaves of Acokanthera longifl ora and Acokanthera schimperi. Death is caused by heart failure. Extracts of these plants are used as arrow poisons.
1.2. Present in
Glycine max, Medicago sativa, M. lupulina, M. media, Chenopodium quinoa, Glycyrrhiza glabra, Phaseolus vulgaris, Vigna angularis, Asparagus offi cinalis, dried pea, mung bean, runner bean, butter bean, kidney bean, haricot bean, fi eld bean, broad pea, lentil, yellow split pea, chickpea, sunfl ower, sugar beat, spinach, oats, yam, fenugreek, gilla bean, moth bean, Amaranthus caudatus, Thea sinensis, Quillaja saponaria, Yucca mohavensis, Y. schidigera, Aloe barbadensis, Lathyrus hirsutus, Smilax aristolochiifolia, Saponaria offi cinalis, S. sapindus, Aesculus hippcastum (horse chestnut), Chenapodium ambrosioides, C. quinoa, Sesbania sesban, S. bispinosa, Trigonella monspeli-aca, Zizyphus jujuba, Treculia africana (African breadfruit), Artocarpus altilis (Polynesian breadfruit), Lotus corniculatus.
1.3. Principle of Assays
This chapter presents four methods: determination of total steroidal saponins, based on Baccou et al. (1); determination of total saponins, based on Hiai et al. (2); determination of saponins based on hemolytic activity, based on Francis et al. (3); and qualitative evaluation of saponins, based on Burbano et al. (4).
The method for quantifi cation of total steroidal saponins is based on the reaction of steroidal saponins with anisaldehyde and ethyl acetate in acidic medium to give a colored complex, the absorbance of which is measured at 430 nm (1).
In the method for determination of total saponins, steroidal sapogenins with or without double bond at C-5, triterpenoid sapogenins, and sterol and bile acids that have an OH group at their C-3 position react with vanillin in acidic medium to give chromogens with the absorbance maxima at 455 to 460 nm or 460 to 480 nm or at 544 nm, depending on the nature of the saponins (2). The chromogen formed is not dependent on the nature of sugar moieties.
96 Plant Secondary Metabolites
In the third method based on hemolytic properties, saponins in a hemolytic unit are determined visually by twofold serial dilution of the plant extract (3–5).The qualitative evaluation of saponins is based on separation of saponins on the thin-layer chromatography (TLC) plate and location of saponin spots by their violet blue color produced by spraying the vanillin–perchloric acid or sulfuric acid reagent. The principle that saponins have hemolytic activity is also used for detecting hemolytic saponins. The developed TLC plates are sprayed with 6% cattle erythrocyte solution. The clear zones against the red blood erythrocyte area indicate the presence of saponins.
2. Materials2.1. Determination of Total Steroidal Saponins
1. Reagent A: Add 0.5 mL of anisaldehyde to 99.5 mL of ethyl acetate and mix thoroughly.
2. Reagent B: 50 mL of concentrated sulfuric acid (95–98% w/w) plus 50 mL of ethyl acetate.
3. Standard saponin solution: Weigh 10 mg of diosgenin and dissolve it in 100 mL of ethyl acetate (0.1 mg/mL).
2.2. Determination of Total Saponins
1. Vanillin reagent (8%): Dissolve 800 mg of vanillin in 10 mL of 99.5% ethanol (analytical grade).
2. 72% (v/v) sulfuric acid: To 28 mL of distilled water, add 72 mL of sulfuric acid (analytical grade, 95%, w/w).
3. Standard saponin solution: Weigh 10 mg of diosgenin, dissolve in 16 mL of methanol, and add 4 mL of distilled water. The fi nal concentration of diosgenin in the solution is 0.5 mg/mL of 80% aqueous methanol. Mix thoroughly and start pipetting immediately.
2.3. Determination of Saponins Based on Hemolytic Property
1. Phosphate buffer saline, PBS (pH 7.2): Dissolve 8.2 g NaCl, 0.136 g KH2PO4,0.224 g KCl, and 1.14 g Na2HPO4 in 1 L of distilled water (composition is 140 mM NaCl, 3 mM KH2PO4, 8 mM KCl, and 1 mM Na2HPO4).
2. Preparation of 3% suspension of red blood cells in phosphate-buffered saline (PBS): Take blood from cattle into heparinized tubes containing beads. The beads can be removed soon after taking the blood. Centrifuge the blood at 1500 g for 5 min and wash the packed erythrocyte cells three times with the PBS (pH 7.0) by centrifugation and subsequent removal of supernatants. The remaining layer of packed erythrocyte cells is diluted to 3% with the PBS.

16. Saponins 97
2.4. Qualitative Evaluation of Saponins
1. Vanillin-perchloric acid reagent: Prepare 1% vanillin in ethanol (w/v) and 2% perchloric acid in ethanol (v/v) in a separate bottle. Combine equal volumes of vanilline and perchloric acid reagents.
2. Sulfuric acid reagent: Prepare freshly a mixture of ethyl acetate/ethanol/concentrated H2SO4 (10 : 10 : 18; v/v/v). Acid should be added drop by drop to the mixture kept on an ice-bath.
3. Phosphate buffer saline, PBS (pH 7.2): Dissolve 8.2 g NaCl, 0.136 g KH2PO4,0.224 g KCl, and 1.14 g Na2HPO4 in 1 L of distilled water (composition is 140 mM NaCl, 3 mM KH2PO4, 8 mM KCl, and 1 mM Na2HPO4).
4. Preparation of 6% suspension of red blood cells in PBS: Take blood from cattle into heparinized tubes containing beads. The beads can be removed soon after taking the blood. Centrifuge the blood at 1500 g for 5 min and wash the packed erythrocyte cells three times with the PBS (pH 7.0) by centrifugation and subsequent removal of supernatants. The remaining layer of packed erythrocyte cells is diluted to 6% with the PBS. This erythrocyte solution for spraying on the plates should be prepared freshly.
3. Methods3.1. Determination of Total Steroidal Saponins
3.1.1. Preparation of Extract
Take 10 g of defatted sample (fi nely ground, preferably using a ball mill) in a 250-mL fl ask and add 100 mL of 50% aqueous methanol. Keep it on a magnetic stirrer overnight at room temperature. Centrifuge the contents at 3000 g for 10 min and collect the supernatant. Repeat extraction with the same solvent by stirring on a magnetic stirrer for overnight. After centrifugation combine the fi rst supernatant with the second one. If any particles are fl oating on the surface of the solvent, the fi ltration through Whatman fi lter paper is necessary. Evaporate methanol from the solution under vacuum at approxi-mately 42°C by using a rotary-evaporator. Then centrifuge the aqueous phase at 3000 g for 10 min to remove the water insoluble materials. Transfer the aqueous phase into a separating funnel and extract with equal volume of chloroform (three times) to remove pigments. Finally extract concentrated saponins in the aqueous solution with equal volume of n-butanol (two times). Evaporate the solvent n-butanol under vacuum at a temperature not higher than 45°C or by nitrogen fl ushing. Dissolve the dried fraction containing saponins in 5 to 10 mL of distilled water and transfer the solution into a separate preweighed container. Freeze-dry the fraction and calculate the percent recovery of saponins (see Notes 1 to 3).
98 Plant Secondary Metabolites
3.1.2. Preparation of Calibration Curve
1. Place 0, 20, 40, 60, 80, and 100 μl of the diosgenin standard solution (0, 2, 4, 6, 8, and 10 μg) in test tubes and make up the volume to 2 mL with ethyl acetate.
2. Add 1 mL of reagent A and 1 mL of reagent B. 3. After stirring, place the test tubes at room temperature for 30 min. 4. Measure absorbance at 430 nm against the reagent blank (0 μl of the diosgenin
standard solution).
3.1.3. Determination of Saponins
1. Dissolve a known amount of extracted (freeze-dried) crude saponins in 80% aqueous methanol.
2. Take its suitable aliquots (corresponding to a sapogenin content of between 0 and 40 μg) in test tubes. Place the tubes in a boiling water bath or in a hot air bath at 100°C in order to remove alcohol (fl ushing with nitrogen gas could also be done).
3. After cooling, add 2 mL of ethyl acetate and carry out the determination as for diosgenin described in Section 3.1.2.
3.2. Determination of Total Saponins
3.2.1. Preparation of Calibration Curve
1. Place 0, 50, 100, 150, 200, and 250 μl of the diosgenin standard solution (0, 25, 50, 75, 100, and 125 μg) in test tubes and make the volume up to 0.25 mL with 80% aqueous methanol.
2. Add 0.25 mL of the vanillin reagent, and then 2.5 mL of 72% (v/v) sulfuric acid slowly on the inner side of the wall.
3. Mix the solution well and transfer the tubes to a water bath adjusted at 60°C. 4. After 10 min, cool the tubes in ice-cold water for 3 to 4 min, and measure
absorbance at 544 nm against the reagent blank (0 μl of the diosgenin standard solution).
3.2.2. Quantitation of Total Saponins
Dissolve a known amount of extracted freeze-dried saponin residue (seeSection 3.1.1.) in 80% aqueous methanol. From this, take an aliquot of 0.25 mL and carry out the determination as for the standard saponin.
3.3. Determination of Saponins Based on Hemolytic Property
1. Place 50 μL of the red blood cells suspension (3%) in separate wells of a microtiter plate.
2. Dissolve 10 to 20 mg of the freeze-dried saponin-enriched fraction (see Section3.1.1.) in 1 mL of the PBS. Prepare a series of twofold diluted solution with the PBS.
16. Saponins 99
3. Add a 50-μL aliquot of these twofold diluted solutions of saponins with the PBS to each well and incubate the mixture at room temperature for 2 h.
4. At the end of the incubation, visually determine which hemolyzed erythrocyte well is just before the well completely containing the nonhemolytic erythrocytes. A clear concentric circle around the red blood cells is indicative of a nonhemolytic well, and the spread of red color in the well and absence of a clear zone around red blood cells shows hemolysis.
5. The hemolytic activity is expressed as the inverse of the minimum amount of saponin extract/mL assay medium in the highest dilution that started producing the hemolysis. The results can also be expressed as compared to the hemolytic activity of a commercial standard triterpenoid saponin mixture from Quillaja bark, run simultaneously with the test sample. Any other commercially available hemolytic saponin can also be used as a reference.
3.4. Qualitative Evaluation of Saponins
1. Prepare developing solvent mixture of chloroform/methanol/water (65 : 35 : 10, v/v/v). Pour about 120 mL of this solvent mixture into a chromatographic tank and saturate the tank for overnight.
2. Dissolve 5 mg of the freeze-dried crude saponin residue (see Section 3.1.1.) in 1 mL of 50% aqueous methanol. From this stock, take 5 μl and load on each lane, 2 to 2.5 cm above from the bottom of plate, on a TLC plate (20 cm × 20 cm, Silica gel 60; Merck catalogue No. 1.05721).
3. After completely drying the spots, insert the TLC plate in the chromatographic tank containing the developing solvent mixture and place in the proper position.
4. When the developing solvent reaches approximately 1 cm below the top of the TLC plate (could take 3 to 4 h), remove the plate carefully and allow it to air-dry in room temperature.
5. Then spray the spraying reagent (the vanillin-perchloric acid reagent or sulfuric acid reagent) and heat at 100°C for 5 min. Saponins as violet or blue spots are located visually on the plates.
6. For evaluating the hemolytic nature of saponins, develop another set of the TLC plates in the same manner. Soon after air-drying the developed plates, spray uniformly the 6% blood erythrocytes on the surface of the plate. After 2 to 3 min, the location of white spot on a red background indicates a hemolytic activity of the separated saponins.
7. The results can be interpreted in terms of how many and which saponin spots out of the total spots located visually using the vanillin-perchloric acid reagent or sulfuric acid reagent produce hemolytic activities.
4. Notes 1. For leaf samples, after extraction of saponins in 80% aqueous methanol, the
pigment can be removal by using chloroform. Pigment removal is not necessary for the grain samples.

100 Plant Secondary Metabolites
2. Without the purifi cation step, 80% aqueous methanol extract of sample may be directly used for the estimation of total saponins. However, many moieties present in the extract could interfere in the assay, giving an overestimate of the saponin values.
3. To get more purifi ed and specifi c targeted saponins, the acetone precipitation of saponins from the n-butanol fraction may be carried out.
References 1. Baccou, J. C., Lambert, F., and Sauvaire, Y. (1977) Spectrophotometric method
for the determination of total steroidal sapogenin. Analyst 102, 458–465. 2. Hiai, S., Oura, H., and Nakajima, T. (1976) Color reaction of some sapogenins
and saponins with vanillin and sulphuric acid. Planta Medica 29, 116–122. 3. Francis, G., Kerem, Z., Makkar, H. P. S., and Becker, K. (2002) The biological
action of saponins in animal systems: a review. Br. J. Nutr. 88, 587–605. 4. Burbano, C., Muzquiz, M., Ayet, G., Cuadrado, C., and Pedrosa, M. M. (1999)
Evaluation of antinutritional factors of selected varieties of Phaseolus vulgaris.J. Sci. Food Agric. 79, 1468–1472.
5. Siddhuraju, P., Becker, K., and Makkar, H. P. S. (2002) Chemical composition, protein fractionation, essential amino acid potential and antimetabolic constitu-ents of an unconventional legume, Gila bean (Entada phaseoloides Merrill) seed kernel. J. Sci. Food Agric. 82, 192–202.

101
From: Methods in Molecular Biology, vol. 393: Plant Secondary MetabolitesBy: H.P.S. Makkar, P. Siddhuraju and K. Becker © Humana Press Inc., Totowa, NJ
17
Phorbol Esters
Key Words: Phorbol esters; Jatropha curcas seed kernels; Euphorbiaceae; carcinogenic; mutagenic; giddiness; phorbol-12-myristate 13-acetate; HPLC; O-phosphoric acid; acetonitrile; tetrahydrofuran.
1. Introduction1.1. Nature and Biological Effects
The term phorbol is loosely used to describe a family of naturally occurring compounds referred to as tiglian diterpenes. These are widely distributed in the plant species of the families Euphorbiaceae and Thymelaeaceae. This chapter describes a method for determination of phorbol esters in physic nut (Jatropha curcas), which belongs to Euphorbiaceae family.
Poisoning in humans by accidental ingestion of jatropha seeds has been reported. Symptoms are giddiness, vomiting, and diarrhea. Toxicity to sheep, goats, calves, chicks, and fi sh by consumption of jatropha seed or seed meal has been observed (1,2). Phorbol esters are carcinogenic, mutagenic, and tumor promotors (3). They are also highly irritant (4). The ester groups of these compounds are recognized as being essential for their undesirable activities.
1.2. Principle of Assay
Phorbol esters are extracted from defatted seed kernels in methanol or dichlo-romethane. An aliquot of this extract is loaded on a high-performance liquid chromatography (HPLC) reverse-phase C18 LiChrospher 100 (Merck, Darm-stadt, Germany), end-capped 5 μm column. The separation is done using a gradient elution with solvents comprising diluted o-phosphoric acid, acetoni-trile, and tetrahydrofuran. The absorbance is recorded at 280 nm. The method
102 Plant Secondary Metabolites
presented here is based on Adolf et al. (4) and Makkar et al. (5), except that the gradient has been changed to reduce the analysis time. The results are expressed as equivalent to a standard, phorbol-12-myristate 13–acetate (5–7).
2. Materials2.1. HPLC Instrument
The Merck Hitachi L-7100 HPLC pump, L-7450 photodiode array detector, L-7200 autosampler, D-7000 interphase module, and an LC organizer are used. The analytical column is reverse-phase C18 (LiChrospher 100, end-capped 5 μm) 250 × 4 mm I.D. (Lichrocart; Merck catalogue No. 1.50838), protected with a guard column containing the material as in the main column.
2.2. Solvent Systems
1. Solvent A: Add 1.75 mL of o-phosphoric acid (85%) in 1 L of distilled water. 2. Solvent B: Acetonitrile 3. Solvent C: Tetrahydrofuran
Before use, fi lter Solvent A. Solvents B and C could be used without fi ltration if these are of HPLC gradient grade. Degas all the solvents by ultrasonication and application of vacuum.
3. Methods3.1. Preparation of Extract
Any of the following two methods could be used.
3.1.1. Method I
1. Take 2 g of ground seed kernels/defatted seed kernel meal in a 50-mL capacity plastic centrifuge tube and add 15 mL of methanol (100%). Sonicate the content at 240 W for 3 min under ice-cold conditions.
2. Centrifuge the content at 3000 g for 8 min at room temperature. 3. Collect the supernatant in a 150-mL capacity round-bottomed fl ask. Repeat the
methanol extraction of the residue twice and collect the supernatants in the same round-bottomed fl ask.
4. Remove methanol from the supernatant using a rotary evaporator at a temperature not exceeding 40°C. Soon after removal of the solvent, pipette approximately 2 mL methanol into the fl ask containing the dry residue. Transfer this fl ask in a sonication bath for 3 to 4 min. Pipette out the dissolved material in a 10-mL graduated tube. Again pipette approximately 2 mL methanol into the fl ask, soni-cate, and transfer the dissolved material in the same 10-mL graduated tube. Repeat

17. Phorbol Esters 103
this step once more. Remove the methanol by fl ushing with nitrogen atmosphere and adjust the volume to 2 mL with methanol and vortex thoroughly.
5. Centrifuge at 17,000 g for 10 min at room temperature (some pellets can be seen in the centrifuge tube), pass the supernatant through a 0.2-μm Tefl on or nylon fi lter, and transfer the fi ltrate into a HPLC vial. Inject 10 to 40 μL (depending on the concentration of phorbol esters) to the HPLC column.
3.1.2. Method II
1. Take 3 to 5 g of seed kernel/defatted seed kernel in a pestle and mortar and grind with a small amount of acid washed sand (about 200 mg).
2. Add 20 mL of dichloromethane and grind the mixture again for 5 min with the mortar. Allow the material to settle and fi lter the liquid phase using a fi lter paper.
3. Transfer about 20 mL of dichloromethane to the pestle and grind the mixture again for about 5 min using the mortar. Allow the material to settle and fi lter the liquid phase. Repeat this extraction procedure three more times. Pool the fi ltrate from all fi ve extractions.
4. Transfer the residue containing sand plus kernels in the pestle and the fi lter paper in a beaker. Add 50 mL of dichloromethane and subject it to ultrasonic waves (105 W for 3 min). Filter the suspension and pool the fi ltrate with the pooled fi ltrates from the previous fi ve extractions.
5. Remove the solvent of the pooled fi ltrate under vacuum at a temperature not more exceeding 40°C. Dissolve the dried residue in 5 mL of tetrahydrofuran, pass it through a 0.2 μm Tefl on or nylon fi lter, and inject a volume of 10 to 20 μL(depending on the concentration of phorbol esters) into the HPLC.
3.2. Quantitative Determination of Phorbol Esters by HPLC
3.2.1. The Gradient System and the Procedure
Start with 40% of solvent A and 60% of solvent B, then decrease solvent A to 25% and increase solvent B to 75% in the next 20 min, then decrease solvent A to 0% and increase solvent B to 100% in the next 8 min, and maintain solvent B at 100% for the next 2 min. Then wash the column with solvent C by increas-ing it to 100% in the next 3 min and maintaining it for the next 1 min. Adjust the column to the starting conditions (40% solvent A and 60% solvent B) in the next 2 min, and maintain these conditions for the next 2 min before injecting another sample.
Separation is performed at room temperature (22°C) at a fl ow rate of 1.3 mL/min. Phorbol esters peaks (four) appear between 26.5 and 29.5 min (Fig. 1). The four peaks are integrated at 280 nm, and the results are expressed as equivalent to phorbol-12-myristate 13-acetate (from Sigma, St. Louis, MO), which appears at 31.5 min.

104 Plant Secondary Metabolites
References 1. Makkar, H. P. S., and Becker, K. (1998) Jatropha curcas toxicity: identifi cation
of toxic principle(s), in Toxic Plants and Other Natural Toxicants, Garland, T., and Barr, A.C., eds., CAB International, New York, pp. 554–558.
2. Makkar, H. P. S., and Becker, K. (1999) Nutritional studies on rats and fi sh (carp Cyprinus carpio) fed diets containing unheated and heated Jatropha curcas meal of a non-toxic provenance. Plant Foods Human Nutr.53, 183–192.
3. Hirota, M., Suttajit, M., Suguri, H., et al. (1988) A new tumor promoter from the seed oil of Jatropha curcas L., an intramolecular diester of 12-desoxy-16-hydroxyphorbol. Cancer Res. 48, 5800–5804.
4. Adolf, W., Opferkuch, H. J., and Hecker, E. (1984) Irritant phorbol derivatives from four Jatropha species. Phytochemistry 23, 129–132.
5. Makkar, H. P. S., Becker, K., Sporer, F., and Wink, M. (1997) Studies on nutritive potential and toxic constituents of different provenances of Jatropha curcas. J. Agric. Food Chem. 45, 3152–3157.
0,12
0,10
0,08
0,06
0,04
0,02
0,00 24 ,
59
25 ,
31 25 ,
73
26 ,
09
26 ,
43
27 ,
4437
, 75
26 ,
88
28 ,
2328
, 56
29 ,
03
29 ,
7430
, 03
25 26 27 28 29 30
Retention Time (min)
Abs
orba
nce
(AU
)
Fig. 1. A typical chromatogram showing four phorbol ester peaks at 26.88, 27.75, 28.56, and 29.03 min.

17. Phorbol Esters 105
6. Makkar, H. P. S., Becker, K., and Schmook, B. (1998) Edible provenances of Jatropha curcas from Quintana Roo state of Mexico and effect of roasting on antinutrient and toxic factors in seeds. Plant Foods Hum. Nutr. 52, 31–36.
7. Makkar, H. P. S., Aderibigbe, A. O., and Becker, K. (1998) Comparative evalua-tion of non-toxic and toxic varieties of Jatropha curcas for chemical composition, digestibility, protein degradability and toxic factors. Food Chem. 62, 207–215.
107
From: Methods in Molecular Biology, vol. 393: Plant Secondary MetabolitesBy: H. P.S. Makkar, P. Siddhuraju and K. Becker © Humana Press Inc., Totowa, NJ
18
Alkaloids
Key Words: Alkaloids; strychnine; solanine; tryptamine alkaloids; potato; Lupinus spp.; Dragendorff reagent; Marquis reagent; p-dimethylamino benzaldehyde reagent; potassium permanganate reagent; bitter taste; Silica gel-G60; TLC plate; ammonium hydroxide; chloroform.
1. Introduction1.1. Nature and Biological Effects
Alkaloids are a diverse group of organic bases containing secondary, tertiary, or cyclic amines. Some 5500 alkaloids are known, comprising the largest single class of secondary plant substances. There is no one defi nition of the term alkaloid, which is completely satisfactory, but alkaloids generally include “those basic substances which contain one or more nitrogen atoms, usually in combina-tion as part of a cyclic system.” (1) Chemically, alkaloids are a very heteroge-neous group, ranging from simple compounds like coniine, the major alkaloid of hemlock, Conium maculatum, to the pentacyclic structure of strychnine, the toxin of the Strychnos bark. Many alkaloids are terpenoid in nature, and some (e.g., solanine, the steroidal alkaloid of the potato, Solanum tuberosum) steroi-dal. Others are mainly aromatic compounds (e.g., colchicine).
Alkaloids are often toxic to humans, and many have dramatic physiological and neurological activities. Some plants rich in alkaloids are Phalaris species, Datura stramonium, or rye grass (Lolium perenne L.), and infected by endo-phytic fungus (Acremonium lolii). Phalaris species contain tryptamine alka-loids and cause a staggering gate and death. D. stramonium contains tropane alkaloids such as hyoscyamine, the consumption of which causes paralysis and rapid heart beat, leading to death. A simple but by no means infallible test for
108 Plant Secondary Metabolites
alkaloids in fresh leaf or fruit material is the bitter taste they often impart. The alkaloid quinine, for example, is one of the bitterest substances known and is signifi cantly bitter at a molar concentration of 1 × 10⁻⁵.
In general, the angiosperm families are particularly rich in these bases, but it should be borne in mind that alkaloid distribution is very uneven and many families lack them altogether. Alkaloids are generally absent or infrequent in the gymnosperms, ferns, mosses, and lower plants.
1.2. Present in
Ricinus communis, Sphenostylis stenocarpa, Pentaclethra macrophylla, Lupinus albus, L. angustifolius, L. luteus, L. mutabilis, L. polyphyllus, Coffea arabica, Camellia sinensis, Theobroma cacao, and Lycopersicon esculentum.
1.3. Preliminary Detection
Alkaloids cannot be identifi ed or quantifi ed by a single method because these are highly heterogeneous chemically and there are so many of them. In general, it is diffi cult to identify an alkaloid from a new plant source without knowing approximately what type of alkaloid is likely to be found there. Also, because of the wide range of solubility and other properties of alkaloids, any general screening procedure for alkaloids in plants may fail to detect particular compounds.
2. Materials2.1. Alkaloid Spray Reagents
2.1.1. The Dragendorff Reagent
Two stock solutions are prepared: (2) 0.6 g bismuth subnitrate in 2 mL concentrated HCl (37% w/v) and 10 mL distilled water, and (1) 6 g potassium iodide in 10 mL distilled water. These stock solutions are mixed together with 7 mL HCl (37% w/v) and 15 mL distilled water and diluted to 400 mL with distilled water.
2.1.2. Iodoplatinate Reagent
For spraying papers, the iodoplatinate reagent is prepared by mixing 10 mL of 5% platinum chloride and 240 mL of 2% potassium iodide, and diluting to 500 mL with distilled water. For spraying plates, this reagent is prepared by mixing 10 mL of 5% platinum chloride, 5 mL concentrated HCl, and 240 mL 2% potassium iodide.
18. Alkaloids 109
2.1.3. Marquis Reagent
Marquis reagent can only be applied to the thin-layer chromatography (TLC) plates and it consists of 1 mL of formaldehyde (40%) in 10 mL concentrated sulfuric acid.
2.1.4. p-Dimethylaminobenzaldehyde Reagent
One gram of p-dimethylaminobenzaldehyde is dissolved in 100 mL of ethanol and to it 10 mL of concentrated HCl is added.
2.1.5. Potassium Permanganate Reagent
Dissolve 1 g potassium permanganate in approximately 70 mL distilled water and make up the volume to 100 mL with distilled water. It is also used for detection of some alkaloids.
3. Methods3.1. General Procedure for Alkaloid Detection
Isolation and analysis of alkaloids generally rely on the differences in solubility of the free-base form and the acid form. The free base is usually soluble in hydrophobic solvents.
Take 4 g of the sample and to it add 40 mL of 10% acetic acid in ethanol or methanol. Keep the mixture for 4 h under dark conditions on a shaking bath at room temperature, and fi lter or centrifuge the contents. Concentrate the extract to one quarter of the original volume and precipitate alkaloid by drop-by-drop addition of concentrate ammonium hydroxide. Collect the precipitate by cen-trifugation (3000 g, 10 min), wash with 1% NH4OH, followed by centrifugation, and dissolve it in a few drops of ethanol or chloroform. If no precipitate occurs on addition of ammonium hydroxide, extract alkaloids using chloroform by following the procedure described below.
Extract three times with chloroform, 40 mL each time. Reduce the volume using a vacuum rotary evaporator at 35°C to about 2 to 4 mL. Use this for application on the TLC plates (silica gel G). Even if precipitates form on addition of the ammonium hydroxide, the remaining supernatant should also be extracted with chloroform to see the presence of alkaloids that do not get precipitated with ammonium hydroxide.
Apply an aliquot (5 to 10 μl) on the silica gel plates and develop these in methanol/concentrated ammonium hydroxide (200 : 3, v/v). Tanks should be equilibrated for at least 1 h with the methanol-ammonium hydroxide solution before inserting the TLC plates. Also place a sheet of fi lter paper on the sides of the wall to facilitate evaporation and equilibration. After two runs, the solvent
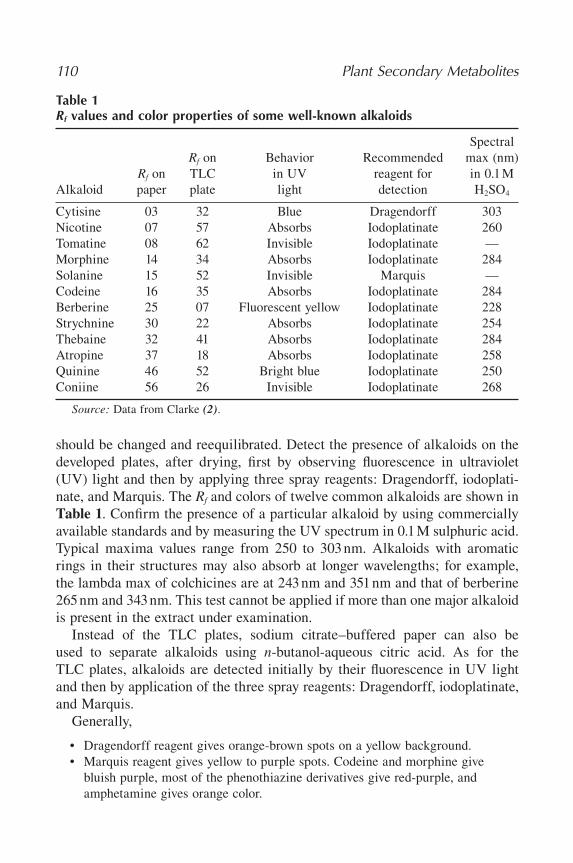
110 Plant Secondary Metabolites
Table 1Rf values and color properties of some well-known alkaloids
SpectralRf on Behavior Recommended max (nm)
Rf on TLC in UV reagent for in 0.1 MAlkaloid paper plate light detection H2SO4
Cytisine 03 32 Blue Dragendorff 303Nicotine 07 57 Absorbs Iodoplatinate 260Tomatine 08 62 Invisible Iodoplatinate —Morphine 14 34 Absorbs Iodoplatinate 284Solanine 15 52 Invisible Marquis —Codeine 16 35 Absorbs Iodoplatinate 284Berberine 25 07 Fluorescent yellow Iodoplatinate 228Strychnine 30 22 Absorbs Iodoplatinate 254Thebaine 32 41 Absorbs Iodoplatinate 284Atropine 37 18 Absorbs Iodoplatinate 258Quinine 46 52 Bright blue Iodoplatinate 250Coniine 56 26 Invisible Iodoplatinate 268
Source: Data from Clarke (2).
should be changed and reequilibrated. Detect the presence of alkaloids on the developed plates, after drying, fi rst by observing fl uorescence in ultraviolet (UV) light and then by applying three spray reagents: Dragendorff, iodoplati-nate, and Marquis. The Rf and colors of twelve common alkaloids are shown in Table 1. Confi rm the presence of a particular alkaloid by using commercially available standards and by measuring the UV spectrum in 0.1 M sulphuric acid. Typical maxima values range from 250 to 303 nm. Alkaloids with aromatic rings in their structures may also absorb at longer wavelengths; for example, the lambda max of colchicines are at 243 nm and 351 nm and that of berberine 265 nm and 343 nm. This test cannot be applied if more than one major alkaloid is present in the extract under examination.
Instead of the TLC plates, sodium citrate–buffered paper can also be used to separate alkaloids using n-butanol-aqueous citric acid. As for the TLC plates, alkaloids are detected initially by their fl uorescence in UV light and then by application of the three spray reagents: Dragendorff, iodoplatinate, and Marquis.
Generally,
• Dragendorff reagent gives orange-brown spots on a yellow background. • Marquis reagent gives yellow to purple spots. Codeine and morphine give
bluish purple, most of the phenothiazine derivatives give red-purple, and amphetamine gives orange color.
18. Alkaloids 111
• Iodoplatinate reagent produces a violet color (or dark blue-black spots), except for cinchonidine and dihydrocinchonidine, which give a grey-blue color.
• p-Dimethylaminobenzaldehyde reagent gives a blue color with the ergot alkaloids, and a bright yellow with compounds containing a primary aromatic amino group.
Solvent on paper is previously buffered with 5% sodium dihydrogen citrate/n-BuOH in aqueous citric acid (870 mL/4.8 g citric acid in 130 mL H2O); solvent on silica gel is MeOH : NH4OH (200 : 3, v/v).
References 1. Harborne, J. B. (1991) Phytochemical methods, Chapman and Hall, London,
UK. 2. Clarke, E. G. C. (1970) The forensic chemistry of alkaloids, in The Alkaloids
Vol. XII, Manske, H. F. ed., Academic Press, New York, pp. 514–590.

113
From: Methods in Molecular Biology, vol. 393: Plant Secondary MetabolitesBy: H. P.S. Makkar, P. Siddhuraju and K. Becker © Humana Press Inc., Totowa, NJ
Appendix
I. Boiling Points of Certain Common SolventsThe following boiling points are correct to the nearest degree centigrade (°C)
Acetone 56 Chloroform 62Acetic acid 118 Ether 34Amyl alcohol 130 Ethyl alcohol 78Benzene 80 Hexane 68Butyl alcohol 118 Methyl alcohol 65Caprylic alcohol 180 Toluene 111Carbon disulphide 46 Water 100Xylene 138–144
II. Constants of Acids and Bases: Commercial Concentrated Reagent
Per cent Molecular Specifi c bySubstance Formula weight gravity weight Molarity Normality
Acetic acid CH3COOH 60.1 1.05 99.5 17.4 17.6Ammonium NH4OH 35.0 0.89 28.0 14.8 15.1 hydroxideHydrochloric HCl 36.5 1.18 36.0 11.6 11.7 acidNitric acid HNO3 63.0 1.42 71.0 16.0 15.6Perchloric HClO4 100.5 1.67 70.0 11.6 9.2 acidPhosphoric H3PO4 80.0 1.70 85.0 18.1 45.0 acidSulfuric acid H2SO4 98.1 1.84 96.0 18.0 35.9

114 Plant Secondary Metabolites
IV. Preparation of Common BuffersThe accuracy of the following tables is within ±0.05 pH at 23°C. The molar-
ity of the buffer described is between 0.05 M and 0.1 M.(Source: (1955) Methods in Enzymology, vol. I, Colowick, S.P. and Kaplan,
N.O., eds., Academic Press, New York, pp. 138–146.)
1. Acetate buffer pH 3.6–5.6Stock solutions
A: 0.2 M solution of acetic acid (11.55 mL in 1 L distilled water) B: 0.2 M solution of sodium acetate (16.4 g of C2H2Na or 27.2 g of C2H3O2Na.3H2O
in 1 L distilled water)
x mL of A plus y mL of B, dilute to a total of 100 mL with distilled water.
III. Equivalent Weights of Some Common Chemicals
Molecular Fraction EquivalentName Formula weight (MW) of MW weight
Hydrochloric acid HCl 36.46 1.0 36.46Sulfuric acid H2SO4 98.00 0.5 49.00Oxalic acid (COOH)2 2H2O 126.05 0.5 63.03Sodium hydroxide NaOH 40.00 1.0 40.00Potassium hydroxide KOH 56.10 1.0 56.10Sodium carbonate Na2CO3 106.00 0.5 53.00Borax Na2B4O7 381.44 0.5 190.72Potassium KMnO4 158.00 0.2 31.60 permanganatePotassium K2Cr2O7 294.20 0.17 49.03 dichromateFerrous ammonium FeSO4 (NH4)2 392.10 1.0 392.10 sulfate SO4.6H2OFerrous sulfate FeSO4.7H2O 278.00 1.0 278.00Sodium oxalate (COONa)2 134.00 0.5 67.00Ammonium oxalate (COONH4)2.H2O 144.08 0.5 72.04Iodine I2 253.80 0.5 126.90Hypo (sodium Na2S2O3.5H2O 248.20 1.0 248.20 thiosulphate)

Appendix 115
2. Glycine–HCl buffer pH 2.2–3.6Stock solutions
A: 0.2 M glycine (15.01 g in 1 L distilled water) B: 0.2 M HCl
25 mL of A plus x mL of B, dilute to a total of 100 mL with distilled water.
x pH
22.0 2.2 16.2 2.4 12.1 2.6 8.4 2.8 5.7 3.0 1.1 3.2 1.2 3.4 2.5 3.6
x y pH
46.3 3.7 3.6 44.0 6.0 3.8 41.0 9.0 4.0 36.8 13.2 4.2 30.5 19.5 4.4 25.5 24.5 4.6 20.0 30.0 4.8 14.8 35.2 5.0 10.5 39.2 5.2 8.8 41.2 5.4 4.8 45.2 5.6
3. Sodium phosphate buffer pH 5.7–8.0Stock solutions
A: 0.2 M solution of monobasic sodium phosphate, NaH2PO4 (27.8 g in 1 L distilled water)
B: 0.2 M solution of dibasic sodium phosphate (53.65 g of Na2HPO4.7H2O or 71.7 g of Na2HPO4.12H2O in 1 L distilled water)
x mL of A plus y mL of B, dilute to a total of 200 mL with distilled water.

116 Plant Secondary Metabolites
4. Potassium phosphate buffer 5.8–8.0Stock solutions
50 mL of 0.1 M KH2PO4 (13.60 g/L distilled water) plus y mL of 0.1 M NaOH (4 g/L distilled water), dilute to a total of 100 mL with distilled water.
y pH y pH y pH
3.6 5.8 16.4 6.6 39.1 7.4 4.6 5.9 19.3 6.7 40.9 7.5 5.6 6.0 22.4 6.8 42.4 7.6 6.8 6.1 25.9 6.9 43.5 7.7 8.1 6.2 29.1 7.0 44.5 7.8 9.7 6.3 32.1 7.1 45.3 7.9 11.6 6.4 34.7 7.2 46.1 8.013.9 6.5 37.0 7.3
5. Citrate buffer pH 3.0–6.2Stock solutions
A: 0.1 M solution of citric acid (21.01 g in 1 L distilled water) B: 0.1 M solution of sodium citrate (29.41 g C6H5O7Na2.2H2O in 1 L distilled water)
X mL of A plus y mL of B, dilute to a total of 100 mL with distilled water.
x y pH x y pH
93.5 6.5 5.7 45.0 55.0 6.9 92.0 8.0 5.8 39.0 61.0 7.0 90.0 10.0 5.9 33.0 67.0 7.1 87.7 12.3 6.0 28.0 72.0 7.2 85.0 15.0 6.1 23.0 77.0 7.3 81.5 18.5 6.2 19.0 81.0 7.4 77.5 22.5 6.3 16.0 84.0 7.5 73.5 26.5 6.4 13.0 87.0 7.6 68.5 31.5 6.5 10.5 89.5 7.7 62.5 37.5 6.6 8.5 91.5 7.8 56.5 43.5 6.7 7.0 93.0 7.9 51.0 49.0 6.8 5.3 94.7 8.0
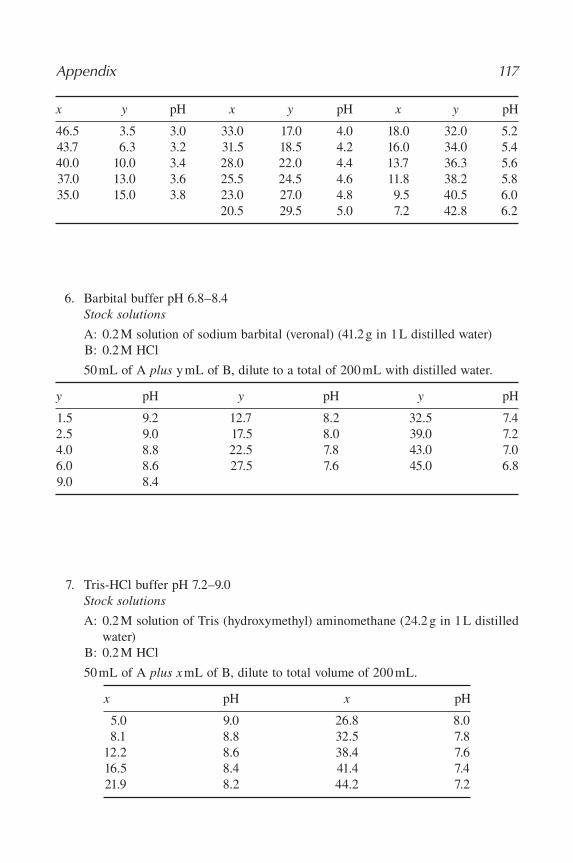
Appendix 117
6. Barbital buffer pH 6.8–8.4Stock solutions
A: 0.2 M solution of sodium barbital (veronal) (41.2 g in 1 L distilled water) B: 0.2 M HCl
50 mL of A plus y mL of B, dilute to a total of 200 mL with distilled water.
y pH y pH y pH
1.5 9.2 12.7 8.2 32.5 7.4 2.5 9.0 17.5 8.0 39.0 7.2 4.0 8.8 22.5 7.8 43.0 7.0 6.0 8.6 27.5 7.6 45.0 6.8 9.0 8.4
7. Tris-HCl buffer pH 7.2–9.0Stock solutions
A: 0.2 M solution of Tris (hydroxymethyl) aminomethane (24.2 g in 1 L distilled water)
B: 0.2 M HCl
50 mL of A plus x mL of B, dilute to total volume of 200 mL.
x pH x pH
5.0 9.0 26.8 8.0 8.1 8.8 32.5 7.8 12.2 8.6 38.4 7.6 16.5 8.4 41.4 7.4 21.9 8.2 44.2 7.2
x y pH x y pH x y pH
46.5 3.5 3.0 33.0 17.0 4.0 18.0 32.0 5.2 43.7 6.3 3.2 31.5 18.5 4.2 16.0 34.0 5.4 40.0 10.0 3.4 28.0 22.0 4.4 13.7 36.3 5.6 37.0 13.0 3.6 25.5 24.5 4.6 11.8 38.2 5.8 35.0 15.0 3.8 23.0 27.0 4.8 9.5 40.5 6.0 20.5 29.5 5.0 7.2 42.8 6.2

118 Plant Secondary Metabolites
8. Boric acid-borax buffer pH 7.6–9.2Stock solutions
A: 0.2 M solution of boric acid (12.4 g in 1 L) B: 0.05 M solution of borax (19.05 g in 1 L; 0.2 M in terms of sodium borate)
50 mL of A plus x mL of B, diluted to a total of 200 mL.
x pH x pH
2.0 7.6 22.5 8.7 3.1 7.8 30.0 8.8 4.9 8.0 42.5 8.9 7.3 8.2 59.0 9.0 11.5 8.4 83.0 9.1 17.5 8.6 115.0 9.2
9. Sorensen’s phosphate buffer pH 4.9–8.0Stock solutions
A: Sodium phosphate dibasic, Na2HPO4.2H2O (11.86 g in 1 L distilled water) B: Potassium phosphate monobasic, KH2PO4 (9.08 g in 1 L distilled water)
The desired pH can be obtained by adding enough solution B to solution A given below to make a total volume of 100 mL.
A pH A pH
0.6 4.9 72.6 7.2 2.3 5.3 77.7 7.3 4.9 5.6 81.8 7.4 12.1 6.0 85.2 7.5 26.4 6.4 88.5 7.6 49.2 6.8 93.6 7.8 61.2 7.0 96.9 8.0 67.0 7.1
10. Carbonate-bicarbonate buffer pH 9.2–10.7Stock solutions
A: 0.2 M solution of anhydrous sodium carbonate (21.2 g in 1 L distilled water) B: 0.2 M solution of sodium bicarbonate (16.8 g in 1 L distilled water)
x mL of A plus y mL of B, dilute to a total volume of 200 mL with distilled water.

Appendix 119
11. Glycine-NaOH buffer 8.6–10.6Stock solutions
A: 0.2 M solution of glycine (15.01 g in 1 L distilled water) B: 0.2 M NaOH (8 g in 1 L distilled water)
50 mL of A plus x mL of B, dilute to total of 200 mL with distilled water.
x pH x pH
4.0 8.6 22.4 9.60 6.0 8.8 27.2 9.80 8.8 9.0 32.0 10.012.0 9.2 38.6 10.4 16.8 9.4 45.5 10.6
x y pH x y pH
4.0 46.0 9.2 27.5 22.5 10.0 7.5 42.5 9.3 30.0 20.0 10.1 9.5 40.5 9.4 33.0 17.0 10.2 13.0 37.0 9.5 35.5 14.5 10.3 16.0 34.0 9.6 38.5 11.5 10.4 19.5 30.5 9.7 40.5 9.5 10.522.0 28.0 9.8 42.5 7.5 10.6 25.0 25.0 9.9 45.0 5.0 10.7
V. Method of Expressing Concentration of a SolutionFollowing are some of the common ways of expressing the concentration of
solutions:
1. Molarity (M) The molarity of a solution is the number of moles of the solute dissolved per liter
of the solution. A solution that contains one mole (1 g molecular weight) of the solute in one litre of the solution is called a molar solution. Molarity of a solution can be calculated as follows:
Molarity = Weight of a solute in g/L of solution
Molecular wweight of solute
It may be noted that in case of molar solutions, the combined total volume of the solute and solvent is 1 L. Thus for preparing 0.1 M NaOH, one has to proceed as follows:

120 Plant Secondary Metabolites
Mol. wt. of NaOH = 40
Required molarity of solution = 0.1 M
Therefore, amount (in grams) of NaOH per liter of solution= Molecular weight of NaOH × molarity= 40 × 0.1 = 4 g
Thus, weigh 4 g of NaOH, dissolve it in a small volume of solvent (water), and make the fi nal volume up to 1 L with the solvent.
Sometimes it is desirable to know the number of moles of a substance in a reaction mixture. This can be calculated using a simple relationship:
1 M solution = 1 mole of the substance/L of solution= 1 mmol/mL of solution= 1 μmol/μL of solution
1 mM solution = 1 mmol/L of solution= 1 μmol/mL of solution
2. Molality (M) A solution that contains 1 mole of the solute dissolved in 1 kg of the solvent is
called a molal solution. Hence,
Molality = Weight of a solute in g/kg of solvent
Molecular wweight of solute
It is important to remember that in a molal solution, the amount of solvent is 1000 g. Thus in the case of aqueous solution, 1 molal solution is obtained by dissolving 1 mole of the solute in 1 L of water (since specifi c gravity = 1). For example, for preparing 1 M Na2CO3 solution, dissolve 106 g of Na2CO3 (molecular weight of Na2CO3 = 106) in 1 kg of water (or 1 L of water).
3. Normality (N) The normality of a solution is the number of gram equivalents of the solute per
liter of the solution. A solution having 1 g equivalent of the solute per liter of solution is called a 1 N solution. Therefore,
Normality = Amount of a substance in g/L of solution
Equivallent weight of substance
For preparing 0.1 N Na2CO3 solution (equivalent weight of Na2CO3 = 53), dissolve 5.3 g Na2CO3 in a fi nal volume of 1 L of solution.
4. Parts per million (ppm) This is generally employed for those solutions in which a substance is present in
a very small quantity. It represents grams of a solute per million grams of solution or grams of a solute per million mL of the solution.

Appendix 121
ppm = Mass of the component
Total mass of the solution106×
orppm =
g or mL of solute or substance
g or mL of solution10× 66
Thus, 1 ppm of solution of NaCl in water represents
1 ppm = 1 mg NaCl/L of solution (or)= 1 μg NaCl/mL of solution
5. Equivalent weight Equivalent weight of a substance is the number of grams of the substance required
to react with, replace, or furnish one mole of H2O+ or OH−. The equivalent weight of an acid is the weight that contains one atomic weight of acidic hydrogen, that is, the hydrogen that reacts during neutralization of acid with base.
For example, the equivalent weight of H2SO4 is 49. Since H2SO4 contains two replaceable hydrogens, equivalent weight is molecular weight /2, 98/2 = 49.
6. Mass concentration Substance concentration is expressed in terms of weight per unit volume rather
than moles per unit volume. The unit of volume is L, so all concentrations should be expressed with L (g/L, mg/, μg/L, etc.). The term percent (%) is also quite commonly used. However, to avoid any ambiguity it is necessary to properly defi ne the basis of % solution as illustrated by the following example. A 5% solution of acetic acid could mean:
5 g of acetic acid per 100 g of solution (w/w) 5 g of acetic acid per 100 mL of solution w/v) 5 mL of acetic acid per 100 mL of solution (v/v)
Thus, 1% (w/v) solution of casein would imply 1 g of casein dissolved in solvent to give a fi nal volume of 100 mL of the solution.
7. pH pH is a value taken to represent the acidity or alkalinity of an aqueous solution.
It is defi ned as logarithm of the reciprocal of the hydrogen ion concentration of the solution.
pH = log 1
H+[ ]
VI. International Systems of Units ConversionA. Temperature
Temperature in °F = (Temperature in °C × 1.8) + 32
Temperature in °C = (Temperature in °F − 32) × 5/9
Temperature in K = (Temperature in °F + 459.67) × 5/9
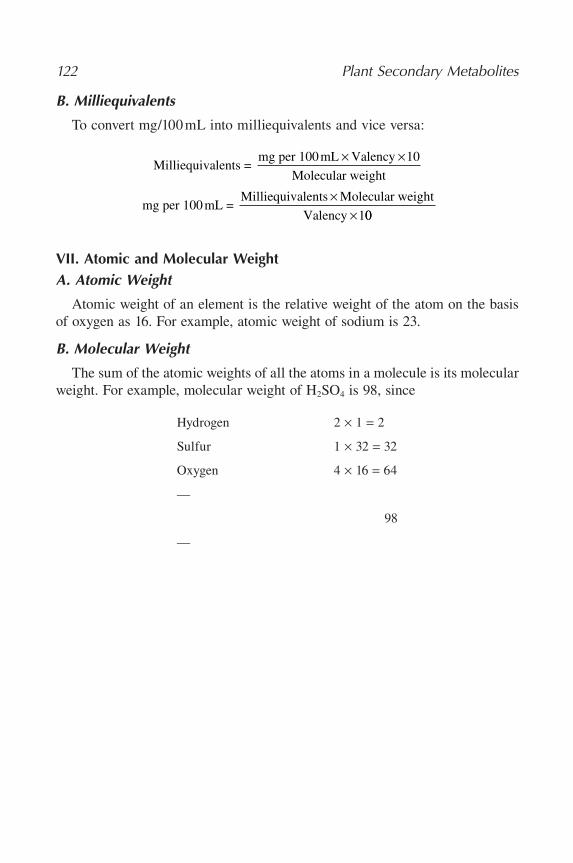
122 Plant Secondary Metabolites
B. Milliequivalents
To convert mg/100 mL into milliequivalents and vice versa:
Milliequivalents = mg per 100mL Valency 10
Molecular weight
× ×
mg per 100mL = Milliequivalents Molecular weight
Valency 1
×× 00
VII. Atomic and Molecular WeightA. Atomic Weight
Atomic weight of an element is the relative weight of the atom on the basis of oxygen as 16. For example, atomic weight of sodium is 23.
B. Molecular Weight
The sum of the atomic weights of all the atoms in a molecule is its molecular weight. For example, molecular weight of H2SO4 is 98, since
Hydrogen 2 × 1 = 2
Sulfur 1 × 32 = 32
Oxygen 4 × 16 = 64
—
98
—
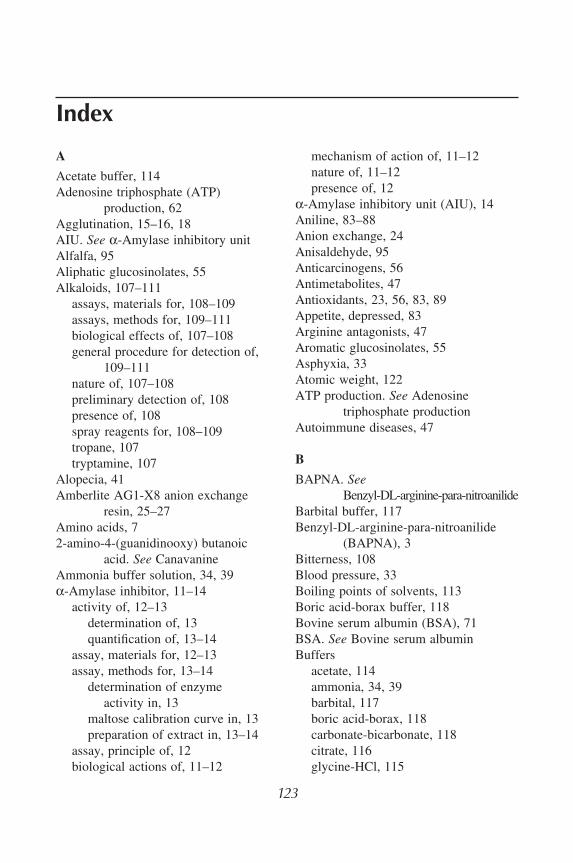
A
Acetate buffer, 114Adenosine triphosphate (ATP)
production, 62Agglutination, 15–16, 18AIU. See α-Amylase inhibitory unitAlfalfa, 95Aliphatic glucosinolates, 55Alkaloids, 107–111
assays, materials for, 108–109assays, methods for, 109–111biological effects of, 107–108general procedure for detection of,
109–111nature of, 107–108preliminary detection of, 108presence of, 108spray reagents for, 108–109tropane, 107tryptamine, 107
Alopecia, 41Amberlite AG1-X8 anion exchange
resin, 25–27Amino acids, 72-amino-4-(guanidinooxy) butanoic
acid. See CanavanineAmmonia buffer solution, 34, 39α-Amylase inhibitor, 11–14
activity of, 12–13determination of, 13quantifi cation of, 13–14
assay, materials for, 12–13assay, methods for, 13–14
determination of enzyme activity in, 13
maltose calibration curve in, 13preparation of extract in, 13–14
assay, principle of, 12biological actions of, 11–12
123
mechanism of action of, 11–12nature of, 11–12presence of, 12
α-Amylase inhibitory unit (AIU), 14Aniline, 83–88Anion exchange, 24Anisaldehyde, 95Anticarcinogens, 56Antimetabolites, 47Antioxidants, 23, 56, 83, 89Appetite, depressed, 83Arginine antagonists, 47Aromatic glucosinolates, 55Asphyxia, 33Atomic weight, 122ATP production. See Adenosine
triphosphate productionAutoimmune diseases, 47
B
BAPNA. SeeBenzyl-DL-arginine-para-nitroanilide
Barbital buffer, 117Benzyl-DL-arginine-para-nitroanilide
(BAPNA), 3Bitterness, 108Blood pressure, 33Boiling points of solvents, 113Boric acid-borax buffer, 118Bovine serum albumin (BSA), 71BSA. See Bovine serum albuminBuffers
acetate, 114ammonia, 34, 39barbital, 117boric acid-borax, 118carbonate-bicarbonate, 118citrate, 116glycine-HCl, 115
Index

124 Index
glycine-NaOH, 119potassium phosphate, 116preparation of, 114–119pyridine acetate, 57, 59sodium phosphate, 63, 115Sorensen’s phosphate, 118tris-HCl, 117in vitro rumen fermentation, 77–78
Butanol-HCl assay, 70Butanol-HCl reagent, 76
C
Cadmium column, 36Calibration curves
for α-Amylase inhibitor, 13for canavanine, 49for chlorogenic acid, 90for chymotrypsin inhibitor, 8for cyanogenic glucosides, 64for glucosinolates, 58for gossypol, 86, 87–88for maltose, 13for L-Mimosine, 45for phytic acid, 26–27for saponins, 98for tannins, 75
Canavalia ensiformis, 47Canavanine, 47–49
assay, materials for, 48assay, method for, 49
determination in, 49preparation of calibration
curve in, 49preparation of extract in, 49
assay, principle of, 48biological effects of, 47mechanism of action of, 47nature of, 47
Carbonate-bicarbonate buffer, 118Carcinogenic inhibitor, 89Carcinogens, 101Cardiac glycosides, 95Casein, 7–9Cassava, 61, 63
Catechin, 72Cattle blood erythrocytes, 17Cell membrane, 15Cereals, 25Chemical assays, 67, 70–71Chlorogenic acid, 89–91
assay, materials for, 90assay, method for, 90–91
calibration curve in, 90determination in, 90
assay, principle of, 89biological effects of, 89nature of, 89presence of, 89
Chymotrypsin, 93Chymotrypsin inhibitor, 7–9
assay, materials for, 7–8assay, methods for, 8–9
calibration curve in, 8determination of inhibitor in, 8–9preparation of extract in, 8
assay, principle of, 7introduction to, 7presence of, 7
Chymotrypsin units inhibited (CUI), 9Citrate buffer, 116C-labeled polyethylene glycol binding
assay, 67, 73Commercial concentrated reagents, 113ConA. See Concanavalin AConcanavalin A (ConA), 17, 20Concentration of solution, 119–121Condensed tannins, 67, 73, 74, 76–77Coniine, 107Constants of acids and bases, 113Constipation, 83Conversions, 121–122Cottonseed, 84, 86, 88CUI. See Chymotrypsin units inhibitedCyanide. See Hydrogen cyanideCyanogenic glucosides, 61–65
assays, materials for, 63–64assays, methods of, 64–65
extraction in, 64–65
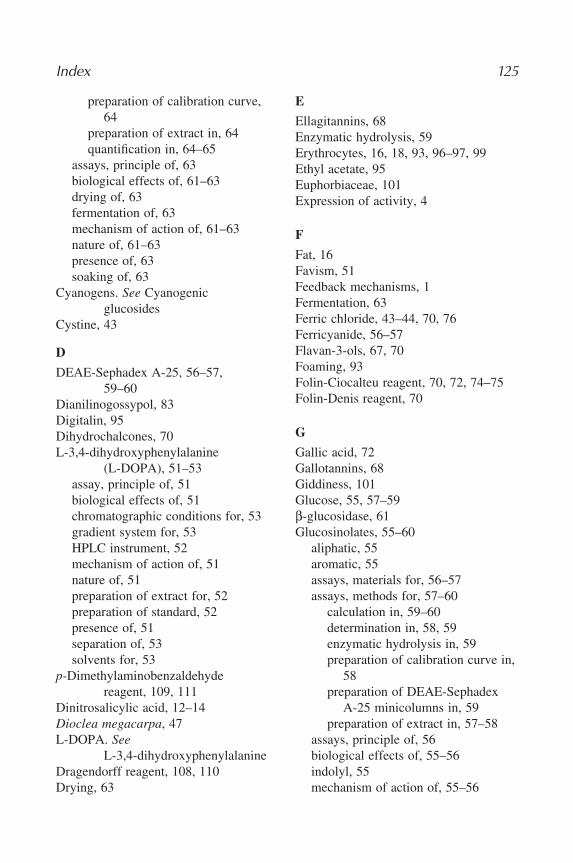
Index 125
preparation of calibration curve, 64
preparation of extract in, 64quantifi cation in, 64–65
assays, principle of, 63biological effects of, 61–63drying of, 63fermentation of, 63mechanism of action of, 61–63nature of, 61–63presence of, 63soaking of, 63
Cyanogens. See Cyanogenic glucosides
Cystine, 43
D
DEAE-Sephadex A-25, 56–57, 59–60
Dianilinogossypol, 83Digitalin, 95Dihydrochalcones, 70L-3,4-dihydroxyphenylalanine
(L-DOPA), 51–53assay, principle of, 51biological effects of, 51chromatographic conditions for, 53gradient system for, 53HPLC instrument, 52mechanism of action of, 51nature of, 51preparation of extract for, 52preparation of standard, 52presence of, 51separation of, 53solvents for, 53
p-Dimethylaminobenzaldehydereagent, 109, 111
Dinitrosalicylic acid, 12–14Dioclea megacarpa, 47L-DOPA. See
L-3,4-dihydroxyphenylalanineDragendorff reagent, 108, 110Drying, 63
E
Ellagitannins, 68Enzymatic hydrolysis, 59Erythrocytes, 16, 18, 93, 96–97, 99Ethyl acetate, 95Euphorbiaceae, 101Expression of activity, 4
F
Fat, 16Favism, 51Feedback mechanisms, 1Fermentation, 63Ferric chloride, 43–44, 70, 76Ferricyanide, 56–57Flavan-3-ols, 67, 70Foaming, 93Folin-Ciocalteu reagent, 70, 72, 74–75Folin-Denis reagent, 70
G
Gallic acid, 72Gallotannins, 68Giddiness, 101Glucose, 55, 57–59β-glucosidase, 61Glucosinolates, 55–60
aliphatic, 55aromatic, 55assays, materials for, 56–57assays, methods for, 57–60
calculation in, 59–60determination in, 58, 59enzymatic hydrolysis in, 59preparation of calibration curve in,
58preparation of DEAE-Sephadex
A-25 minicolumns in, 59preparation of extract in, 57–58
assays, principle of, 56biological effects of, 55–56indolyl, 55mechanism of action of, 55–56

126 Index
nature of, 55–56presence of, 56
Glutathione content, 51Glycine-HCl buffer, 115Glycine-NaOH buffer, 119Glycogen, 16Goiter, 41, 56, 61, 63Gossypium spp., 83Gossypol, 83–88
assays, materials for, 84–85free gossypol, 85total gossypol, 84–85
assays, methods for, 85–86determination in, 85–87preparation of calibration
curve in, 86, 87–88preparation of extract in, 86–87preparation of sample in, 85
assays, principle of, 83–84biological effects of, 83bound, 83free, 83–88nature of, 83presence of, 83
Gravimetric assays, 67, 72
H
Hair loss, 41HCN. See Hydrogen cyanideHeat treatment, 2, 16Hemagglutination, 16, 18–19Hemolytic activity, 93, 96, 98–99High-performance liquid
chromatography (HPLC), 51–52, 71, 101–102
HPLC. See High-performance liquid chromatography
Human blood erythrocytes, 20Hydrogen cyanide (HCN), 61–65Hydrolyzable tannins, 67, 71Hyperglycemia, 11Hyperinsulinemia, 11Hyperoxaluria, 29Hyperplasia, 15
Hypocholesterolemic effects, 93
I
In vitro rumen fermentation, 73, 77–78Indolyl glucosinolates, 55Inhibitor, determination of
chymotrypsin, 8–9trypsin, 4–5
Insulin, 16Intestinal epithelium, 15Iodoplatinate reagent, 108, 110–111Isothiocyanates, 55
J
Jatropha curcas, 101
K
Kidney stones, 29KSCN. See Potassium thiocyanate
L
A Laboratory Manual on Tannin Assays (Makkar), 74
Lead and varium acetate, 57Lectin, 15–20
assay, materials forspectrophotometric method in,
17–18visual method in, 17
assay, method ofpreparation of extract in, 17–18spectrophotometric, 18–20visual, 17–18
assays, principle of, 16–17biological effects of, 15–16determination of, 18hemagglutination activity of
calculation of, 19determination of, 19
mechanism of action of, 15–16nature of, 15–16presence of, 16
Legumes, 25, 73
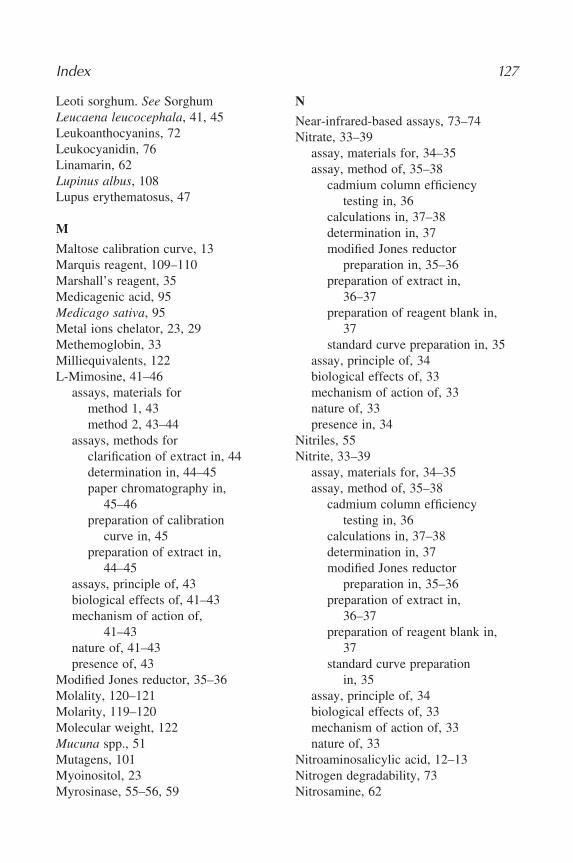
Index 127
Leoti sorghum. See SorghumLeucaena leucocephala, 41, 45Leukoanthocyanins, 72Leukocyanidin, 76Linamarin, 62Lupinus albus, 108Lupus erythematosus, 47
M
Maltose calibration curve, 13Marquis reagent, 109–110Marshall’s reagent, 35Medicagenic acid, 95Medicago sativa, 95Metal ions chelator, 23, 29Methemoglobin, 33Milliequivalents, 122L-Mimosine, 41–46
assays, materials formethod 1, 43method 2, 43–44
assays, methods forclarifi cation of extract in, 44determination in, 44–45paper chromatography in,
45–46preparation of calibration
curve in, 45preparation of extract in,
44–45assays, principle of, 43biological effects of, 41–43mechanism of action of,
41–43nature of, 41–43presence of, 43
Modifi ed Jones reductor, 35–36Molality, 120–121Molarity, 119–120Molecular weight, 122Mucuna spp., 51Mutagens, 101Myoinositol, 23Myrosinase, 55–56, 59
N
Near-infrared-based assays, 73–74Nitrate, 33–39
assay, materials for, 34–35assay, method of, 35–38
cadmium column effi ciency testing in, 36
calculations in, 37–38determination in, 37modifi ed Jones reductor
preparation in, 35–36preparation of extract in,
36–37preparation of reagent blank in,
37standard curve preparation in, 35
assay, principle of, 34biological effects of, 33mechanism of action of, 33nature of, 33presence in, 34
Nitriles, 55Nitrite, 33–39
assay, materials for, 34–35assay, method of, 35–38
cadmium column effi ciency testing in, 36
calculations in, 37–38determination in, 37modifi ed Jones reductor
preparation in, 35–36preparation of extract in,
36–37preparation of reagent blank in,
37standard curve preparation
in, 35assay, principle of, 34biological effects of, 33mechanism of action of, 33nature of, 33
Nitroaminosalicylic acid, 12–13Nitrogen degradability, 73Nitrosamine, 62
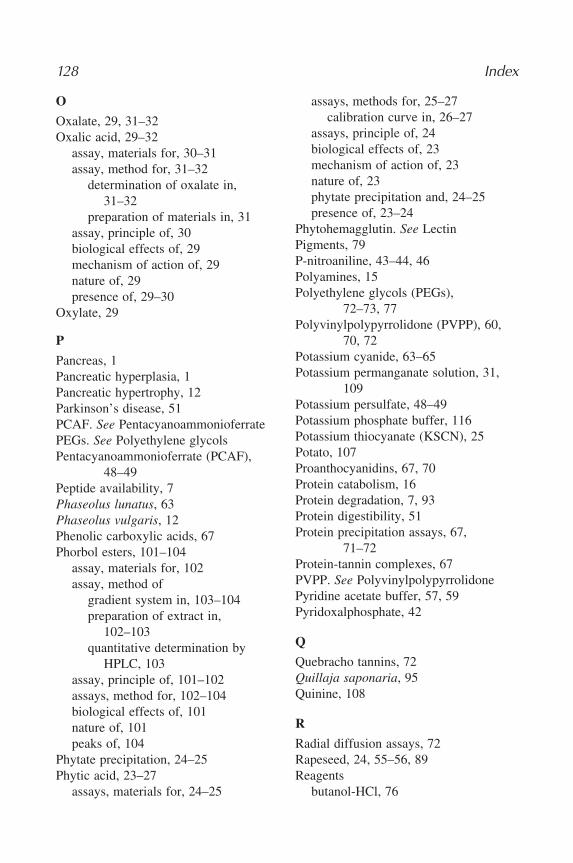
128 Index
O
Oxalate, 29, 31–32Oxalic acid, 29–32
assay, materials for, 30–31assay, method for, 31–32
determination of oxalate in, 31–32
preparation of materials in, 31assay, principle of, 30biological effects of, 29mechanism of action of, 29nature of, 29presence of, 29–30
Oxylate, 29
P
Pancreas, 1Pancreatic hyperplasia, 1Pancreatic hypertrophy, 12Parkinson’s disease, 51PCAF. See PentacyanoammonioferratePEGs. See Polyethylene glycolsPentacyanoammonioferrate (PCAF),
48–49Peptide availability, 7Phaseolus lunatus, 63Phaseolus vulgaris, 12Phenolic carboxylic acids, 67Phorbol esters, 101–104
assay, materials for, 102assay, method of
gradient system in, 103–104preparation of extract in,
102–103quantitative determination by
HPLC, 103assay, principle of, 101–102assays, method for, 102–104biological effects of, 101nature of, 101peaks of, 104
Phytate precipitation, 24–25Phytic acid, 23–27
assays, materials for, 24–25
assays, methods for, 25–27calibration curve in, 26–27
assays, principle of, 24biological effects of, 23mechanism of action of, 23nature of, 23phytate precipitation and, 24–25presence of, 23–24
Phytohemagglutin. See LectinPigments, 79P-nitroaniline, 43–44, 46Polyamines, 15Polyethylene glycols (PEGs),
72–73, 77Polyvinylpolypyrrolidone (PVPP), 60,
70, 72Potassium cyanide, 63–65Potassium permanganate solution, 31,
109Potassium persulfate, 48–49Potassium phosphate buffer, 116Potassium thiocyanate (KSCN), 25Potato, 107Proanthocyanidins, 67, 70Protein catabolism, 16Protein degradation, 7, 93Protein digestibility, 51Protein precipitation assays, 67,
71–72Protein-tannin complexes, 67PVPP. See PolyvinylpolypyrrolidonePyridine acetate buffer, 57, 59Pyridoxalphosphate, 42
Q
Quebracho tannins, 72Quillaja saponaria, 95Quinine, 108
R
Radial diffusion assays, 72Rapeseed, 24, 55–56, 89Reagents
butanol-HCl, 76
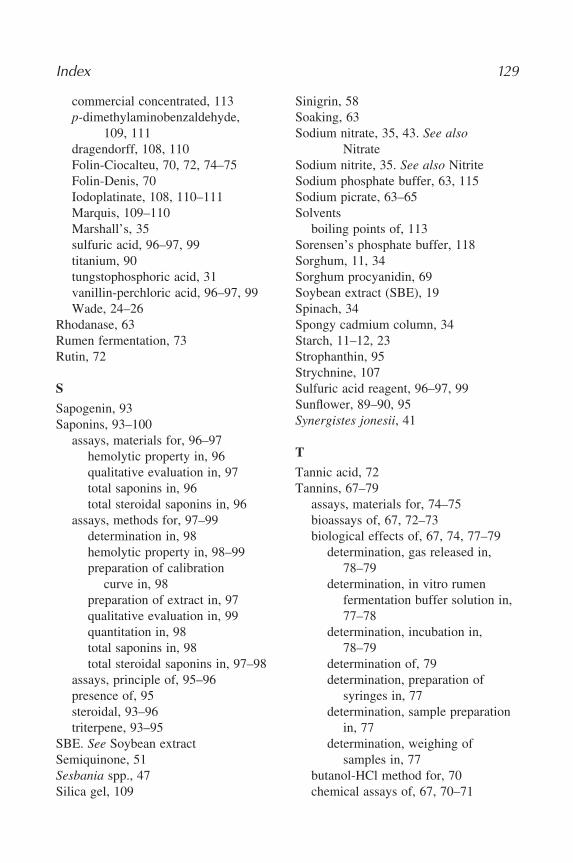
Index 129
commercial concentrated, 113p-dimethylaminobenzaldehyde,
109, 111dragendorff, 108, 110Folin-Ciocalteu, 70, 72, 74–75Folin-Denis, 70Iodoplatinate, 108, 110–111Marquis, 109–110Marshall’s, 35sulfuric acid, 96–97, 99titanium, 90tungstophosphoric acid, 31vanillin-perchloric acid, 96–97, 99Wade, 24–26
Rhodanase, 63Rumen fermentation, 73Rutin, 72
S
Sapogenin, 93Saponins, 93–100
assays, materials for, 96–97hemolytic property in, 96qualitative evaluation in, 97total saponins in, 96total steroidal saponins in, 96
assays, methods for, 97–99determination in, 98hemolytic property in, 98–99preparation of calibration
curve in, 98preparation of extract in, 97qualitative evaluation in, 99quantitation in, 98total saponins in, 98total steroidal saponins in, 97–98
assays, principle of, 95–96presence of, 95steroidal, 93–96triterpene, 93–95
SBE. See Soybean extractSemiquinone, 51Sesbania spp., 47Silica gel, 109
Sinigrin, 58Soaking, 63Sodium nitrate, 35, 43. See also
NitrateSodium nitrite, 35. See also NitriteSodium phosphate buffer, 63, 115Sodium picrate, 63–65Solvents
boiling points of, 113Sorensen’s phosphate buffer, 118Sorghum, 11, 34Sorghum procyanidin, 69Soybean extract (SBE), 19Spinach, 34Spongy cadmium column, 34Starch, 11–12, 23Strophanthin, 95Strychnine, 107Sulfuric acid reagent, 96–97, 99Sunfl ower, 89–90, 95Synergistes jonesii, 41
T
Tannic acid, 72Tannins, 67–79
assays, materials for, 74–75bioassays of, 67, 72–73biological effects of, 67, 74, 77–79
determination, gas released in, 78–79
determination, in vitro rumen fermentation buffer solution in, 77–78
determination, incubation in, 78–79
determination of, 79determination, preparation of
syringes in, 77determination, sample preparation
in, 77determination, weighing of
samples in, 77butanol-HCl method for, 70chemical assays of, 67, 70–71
130 Index
C-labeled polyethylene glycol binding assay of, 67, 73
condensed, 67, 73–74, 76–77determination of, 76
gravimetric assays of, 67, 72hydrolyzable, 67
assays for, 71mechanism of action of, 67nature of, 67near-infrared-based assay of, 73–74protein precipitation assays of, 67,
71–72quebracho, 72radial diffusion assay of, 72total assays of, 70, 74total phenol assays for, 70, 74–76
analysis of phenols in, 75determination in, 76extraction of phenolics in, 75preparation of calibration curve in,
75vanillin assay for, 70
TCA. See Trichloroacetic acidTemperature, 121Thin-layer chromatography (TLC), 96,
99, 110Thiocyanates, 55, 62–63Thiourea, 84–85, 87–88Thymelaeaceae, 101Titanium chloride, 91Titanium reagent, 90TIUs. See Trypsin-inhibiting unitsTLC. See Thin-layer chromatographyTotal phenol assays, 70, 74–76Toxicity, 61Trichloroacetic acid (TCA), 24Tris-HCl buffer, 117Tropane alkaloids, 107Trypsin, 93
Trypsin inhibitor, 1–6assay, materials for, 3assay, methods for, 3–6
determination of inhibitor in, 4–5expression of activity in, 4preparation of extract in, 3–4
assay, principle of, 3biological effects of, 1–2mechanism of action of, 1–2nature of, 1–2presence of, 2–3
Trypsin unit (TU), 4Trypsin-inhibiting units (TIUs),
4, 63Trypsinized erythrocyte suspension, 18Tryptamine alkaloids, 107TU. See Trypsin unitTungstophosphoric acid reagent, 31
U
Units conversion, 121–122
V
Vanillin assay, 70Vanillin-HCl, 79Vanillin-perchloric acid reagent,
96–97, 99
W
Wade reagent, 24–26Washing liquid, 31Weights
atomic, 122equivalent, 114molecular, 122
Y
Yucca mohavensis, 95