plano urban forest ecosystem analysis - i-tree · 8 | p a g e results i. tree characteristics of...
TRANSCRIPT
Plano Urban Forest
August 2014
Ecosystem Analysis
Table of Contents
Summary ...................................................................................................................................................... 4
Preface ......................................................................................................................................................... 5
Introduction ................................................................................................................................................. 6
Methods....................................................................................................................................................... 6
Results.......................................................................................................................................................... 8
I. Tree Characteristics of the Urban Forest ................................................................................................. 8
II. Urban Forest Cover and Leaf Area ........................................................................................................ 10
III. Air Pollution Removal by Urban Trees ................................................................................................. 11
IV. Carbon Storage and Sequestration ...................................................................................................... 12
V. Oxygen Production ................................................................................................................................ 13
VI. Trees and Building Energy Use ............................................................................................................. 14
VII. Annual Rainfall Interception ................................................................................................................ 15
VIII. Structural and Functional Values ....................................................................................................... 16
IX. Potential Pest Impacts .......................................................................................................................... 17
Discussion .................................................................................................................................................. 18
Appendix I. i-Tree Eco Model and Field Measurements ........................................................................... 22
Appendix II. Relative Tree Effects .............................................................................................................. 24
Appendix III. Comparison of Urban Forests .............................................................................................. 25
Appendix IV. General Recommendations for Air Quality Improvement ................................................... 26
Appendix V. Invasive Species of the Urban Forest .................................................................................... 27
Appendix VI. Potential risk of pests ........................................................................................................... 28
References ................................................................................................................................................. 30
4 | P a g e
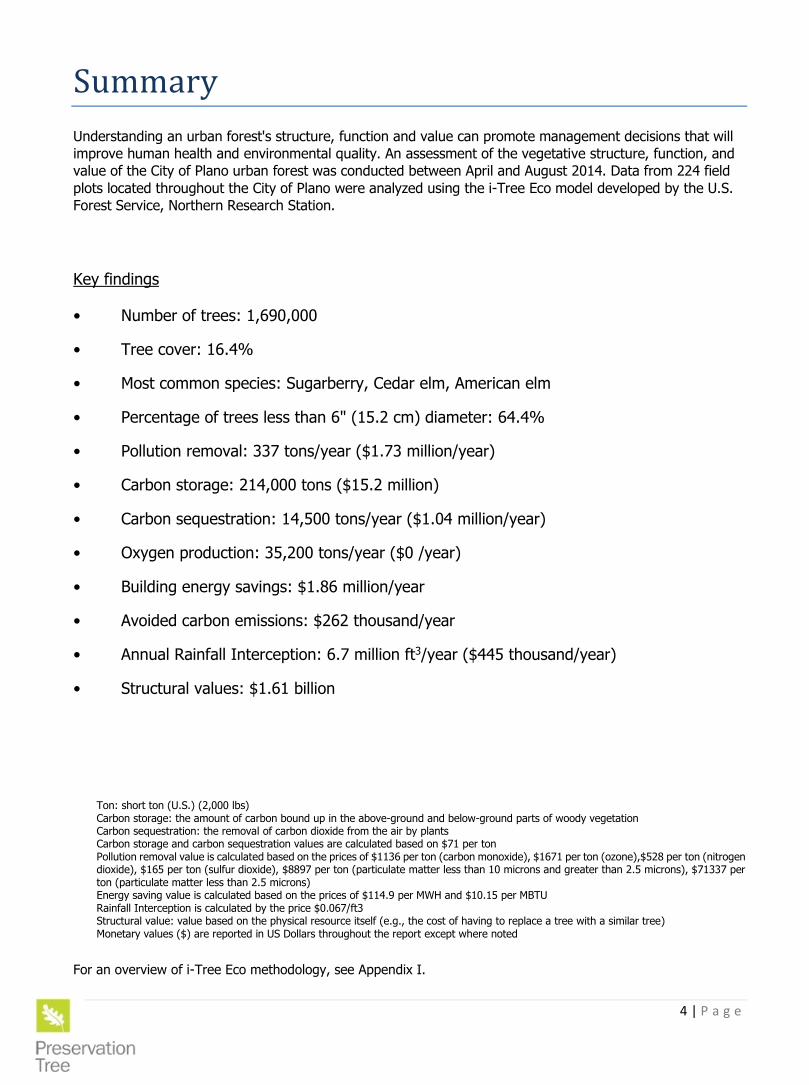
Summary
Understanding an urban forest's structure, function and value can promote management decisions that will
improve human health and environmental quality. An assessment of the vegetative structure, function, and
value of the City of Plano urban forest was conducted between April and August 2014. Data from 224 field
plots located throughout the City of Plano were analyzed using the i-Tree Eco model developed by the U.S.
Forest Service, Northern Research Station.
Key findings
• Number of trees: 1,690,000
• Tree cover: 16.4%
• Most common species: Sugarberry, Cedar elm, American elm
• Percentage of trees less than 6" (15.2 cm) diameter: 64.4%
• Pollution removal: 337 tons/year ($1.73 million/year)
• Carbon storage: 214,000 tons ($15.2 million)
• Carbon sequestration: 14,500 tons/year ($1.04 million/year)
• Oxygen production: 35,200 tons/year ($0 /year)
• Building energy savings: $1.86 million/year
• Avoided carbon emissions: $262 thousand/year
• Annual Rainfall Interception: 6.7 million ft3/year ($445 thousand/year)
• Structural values: $1.61 billion
Ton: short ton (U.S.) (2,000 lbs) Carbon storage: the amount of carbon bound up in the above-ground and below-ground parts of woody vegetation Carbon sequestration: the removal of carbon dioxide from the air by plants Carbon storage and carbon sequestration values are calculated based on $71 per ton Pollution removal value is calculated based on the prices of $1136 per ton (carbon monoxide), $1671 per ton (ozone),$528 per ton (nitrogen dioxide), $165 per ton (sulfur dioxide), $8897 per ton (particulate matter less than 10 microns and greater than 2.5 microns), $71337 per ton (particulate matter less than 2.5 microns) Energy saving value is calculated based on the prices of $114.9 per MWH and $10.15 per MBTU Rainfall Interception is calculated by the price $0.067/ft3 Structural value: value based on the physical resource itself (e.g., the cost of having to replace a tree with a similar tree) Monetary values ($) are reported in US Dollars throughout the report except where noted
For an overview of i-Tree Eco methodology, see Appendix I.
5 | P a g e
Preface
The City of Plano Parks and Recreation Department (PARD) began in 1968. At this time the city population was approximately 17,000 and there were a total of 111 acres across 6 parks being managed. Today, the population is over 270,000 and the city’s Parks and Recreation Department manages more than 4,000 acres across 83 public parks. This tremendous growth over the last four decades is a testament to the community’s desirability and culture. However, maintaining the quality of public resources the city’s residents expect requires not only a continued investment, but more importantly responsible planning. In order to keep up with developmental pressures throughout the city, the PARD has planted approximately 20,000 trees in the last twenty years, as well as investing in a full time permanent Urban Forester staff position, and revising its city development code to enhance tree protection. Plano has received the National Arbor Day’s Tree City USA Award consecutively for the last 25 years, while also being the recipient of the Growth Award eight times. While any one of these accomplishments alone may not seem significant, collectively they represent the culture of care that the community of Plano has come to represent and its willingness to invest in the future health of the natural environment and ultimately, the quality of life for Plano residents. In the spring of 2014, the Plano PARD, in conjunction with Preservation Tree Services, a Dallas based commercial urban forestry management and tree care company, began the effort to further promote the importance of its urban forest by designing and conducting an urban forest ecosystem assessment to better understand the structure and function of this important resource. Results of this investigation will be used to develop the city’s Urban Forestry Master Plan, which is critical for planning for the city’s continued growth over the next decade and beyond. Plano is now one of only five cities in Texas to complete this study and just one of 773 in the nation and 827 in the world (as of January 2012). The analysis identifies the size of Plano's urban forest, the types of tree species most prevalent in the forest and shows the value of this tremendous community asset. The Plano ECO Study would not have been possible without the support and assistance of the following individuals: Amy Fortenberry, Director Parks and Recreation City of Plano Robin Reeves, Chief Park Planner, City of Plano Angela Kralik, City Urban forester Micah Pace, Urban Forestry Specialist, Preservation Tree Nelson Ventura, Plant Health Technician, Preservation Tree (Data Collection) Michael Darr, City of Plano Parks and Recreation (Data Collection) Ann Fuller, City of Plano Parks and Recreation (Data Collection) Richard Leon, Dallas Regional Urban Forester Texas A&M Forest Service (Data Collection) Nick Viau and Richard Thurau, Plan-it Geo (GIS) David Ho, Student Intern (Data Entry) Al Zelaya and the iTree Team (Technical Assistance)
For Questions on the Plano Urban Forest Ecosystem Study Please Contact:
Micah Pace Urban Forestry Specialist, Preservation Tree Services [email protected] 214.662.6086
Angela Kralik City of Plano Urban Forester [email protected] 972.941.5419
6 | P a g e
Introduction
The area of interest (AOI) for this study was the City of Plano, Texas. The AOI has an area of 71.6 mi2 or 46,030 acres in size. Located in northern Texas in Collin County, within the blackland prairie ecoregion at
33°01′11″N 96°41′57″W, the City of Plano began to be settled in the early 1840’s. With the completion of the Houston Central Texas Railway, the population began to grow and Plano was officially incorporated in 1873. Over the next one hundred years the city population continued to grow. In the 1980’s, as more and more national corporations, such as Frito-Lay, PepsiCo, HP, and JC Penny, began to call Plano home, the city’s population grew along with the availability of jobs. Subsequently, the city’s infrastructure also grew increasing the need to invest in, and care for, the community’s tree resource. With the creation of the city’s Urban Forester position in 2003, Plano began to proactively promote tree planting and maintenance as well as public education. With a current population of more than 270,000 people, the environmental and social benefits the community forest provides has never been more important for Plano. Fortunately, the past decade has given rise to an increase in both the knowledge of the ecosystem services and social benefits of urban forests as well as the availability of quantitative tools, such as iTree, for the measurement and communication of these benefits. There have been four (4) other iTree Eco studies completed in Texas. In 2005, the Houston Regional UFORE study was completed, and in 2009 and 2012 the Cities of Arlington and Mesquite completed their Eco projects, while El Paso completed one in 2013. There have also been an estimated 827 international and 773 national Eco projects (as of Jan. 2012). The city of Plano’s recognition of the multitude of benefits urban forests provide and their goal of developing an Urban Forestry Master Plan prompted the development of this resource assessment in order to quantify, and explicitly demonstrate to city officials and the general public alike, the specific services and values attached to Plano’s urban forest. The completion of this study highlights the value Plano’s city leaders have placed on their trees and will enable them to continue promoting and enhancing their urban forestry program.
Methods
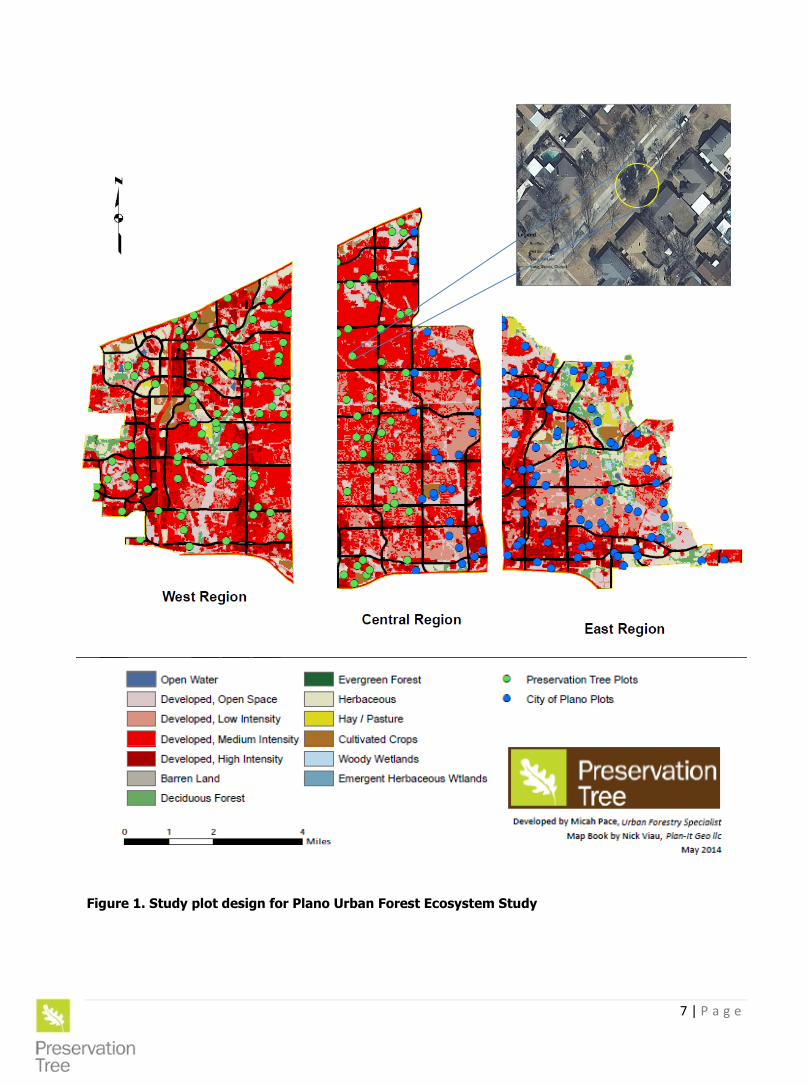
Study design and field data collection protocol were developed by the U.S. Forest Service, Northeast Research Station (Appendix I). Using geographical information system (GIS) technology and ArcMap 10.x software, 225 0.1 acre circular plots were created and randomly established within the AOI on both public and private property, representing 4.9% of the total AOI. Study plots were also stratified by land use categories using 2010 National Land Classification Database (NLCD) imagery. There were a total of thirteen land use classes identified within Plano. For logistical planning and operational purposes, the study area was ultimately divided into thirds, in which city staff and volunteers collected data on 100 plots within the eastern and central thirds, while Preservation Tree collected data on 125 plots in the western and central thirds, respectively (Figure 1). Study plots were located in the field using three map books containing all plots within each respective third. Where plots or portions of plots fell on private property, permission to access private properties for plot measurement was obtained prior to data collection. Plot and tree level data were recorded on paper forms and archived following data entry. In addition, study plots were designed as permanent measurement locations through the use of global positioning system (GPS) units by recording exact plot center locations, the reference point for all measurements. Plot centers can easily be relocated for future measurements using either recorded latitude and longitude values or by triangulating their positions by using the distance and direction of two reference points for each plot center. In addition, a minimum of two (2) photos were taken of plot center for each plot. See Appendix I for an overview of i-Tree Eco methodology or visit http://itreetools.org/eco/resources/UFORE%20Methods.pdf.
7 | P a g e
Figure 1. Study plot design for Plano Urban Forest Ecosystem Study

8 | P a g e
Results
I. Tree Characteristics of the Urban Forest
The urban forest of the City of Plano has an estimated 1,690,000 trees with a tree cover of 16.4
percent. The three most common species are sugarberry (Celtis laevigata) (15.5 percent), cedar elm (Ulmus crassifolia) (12.2 percent), and American elm (9.8 percent). Trees that have diameters less than 6-inches
(15.2 cm) constitute 64.4 percent of the population.
Figure 2. Tree species composition in the City of Plano
Figure 3. Percent of tree population by diameter class (DBH=stem diameter at 4.5 feet)
9 | P a g e
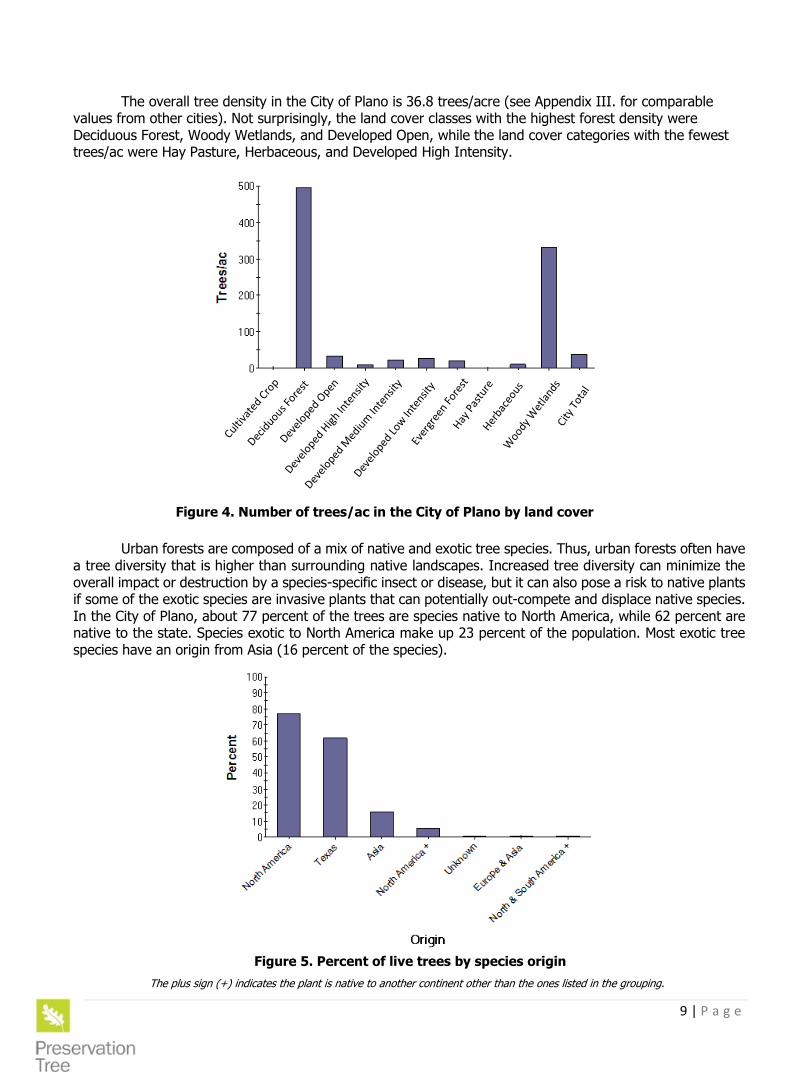
The overall tree density in the City of Plano is 36.8 trees/acre (see Appendix III. for comparable values from other cities). Not surprisingly, the land cover classes with the highest forest density were Deciduous Forest, Woody Wetlands, and Developed Open, while the land cover categories with the fewest trees/ac were Hay Pasture, Herbaceous, and Developed High Intensity.
Figure 4. Number of trees/ac in the City of Plano by land cover
Urban forests are composed of a mix of native and exotic tree species. Thus, urban forests often have a tree diversity that is higher than surrounding native landscapes. Increased tree diversity can minimize the overall impact or destruction by a species-specific insect or disease, but it can also pose a risk to native plants if some of the exotic species are invasive plants that can potentially out-compete and displace native species. In the City of Plano, about 77 percent of the trees are species native to North America, while 62 percent are native to the state. Species exotic to North America make up 23 percent of the population. Most exotic tree species have an origin from Asia (16 percent of the species).
Figure 5. Percent of live trees by species origin
The plus sign (+) indicates the plant is native to another continent other than the ones listed in the grouping.
10 | P a g e
Invasive plant species are often characterized by their vigor, ability to adapt, reproductive capacity, and general lack of natural enemies. These abilities enable them to displace native plants and make them a threat to natural areas [1]. Two of the 60 tree species sampled in the City of Plano are identified as invasive on the state invasive species list [2]. These invasive species comprise 1.0 percent of the tree population and thus may only have a minimal level of impact. These two invasive species are Chinese pistache (Pistacia chinensis) (0.8 percent of population), and tree of heaven (Ailanthus altissima) (0.1 percent) (see Appendix V. for details of invasive species).
II. Urban Forest Cover and Leaf Area
Table 1. Most important tree species in the City of Plano
Species Name Percent Population
Percent Leaf Area IV
Cedar elm 12.2 17.2 29.4
Sugarberry 15.5 12.6 28.1
Live oak 6.1 11.8 17.8
American elm 9.8 5.1 14.9
Shumard oak 3.7 10.7 14.4
Crepe myrtle 8.5 3.4 11.9
Green ash 5.8 3.1 8.9
Baldcypress 1.5 5.8 7.3
Common persimmon 5.8 1.3 7.1
Callery pear 'bradford' 1.9 3.8 5.7
(Importance values (IV) are calculated as the sum of relative leaf area and relative composition.)
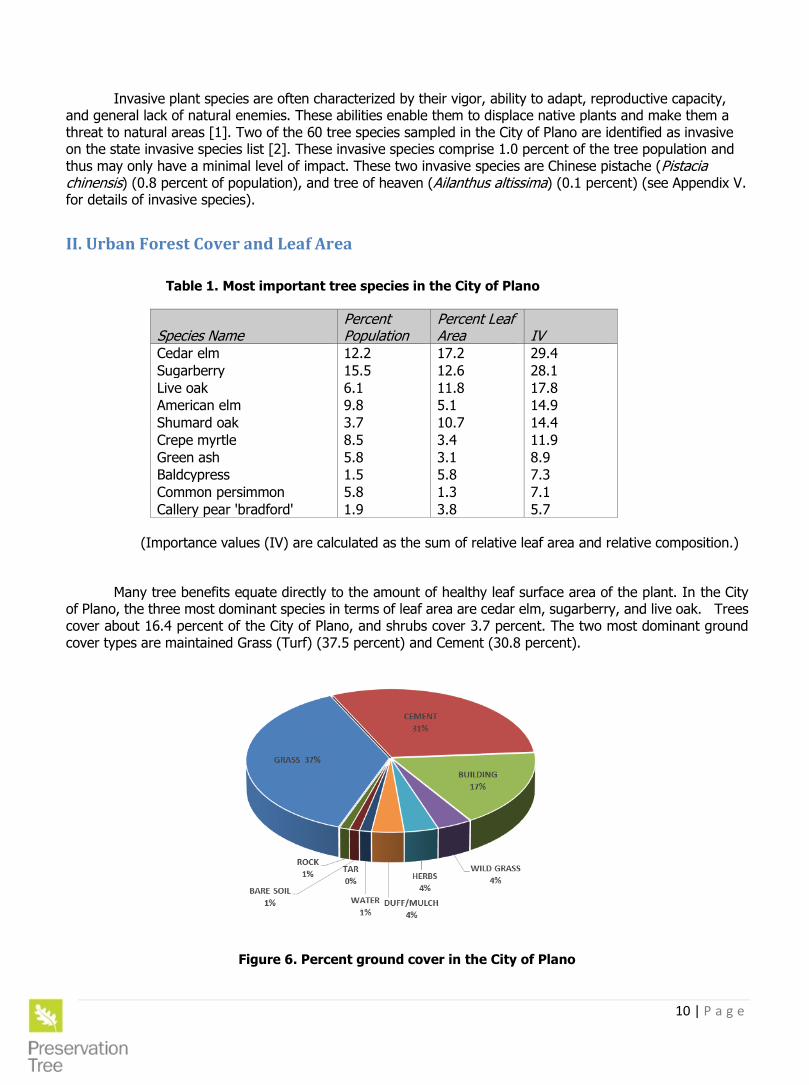
Many tree benefits equate directly to the amount of healthy leaf surface area of the plant. In the City
of Plano, the three most dominant species in terms of leaf area are cedar elm, sugarberry, and live oak. Trees cover about 16.4 percent of the City of Plano, and shrubs cover 3.7 percent. The two most dominant ground cover types are maintained Grass (Turf) (37.5 percent) and Cement (30.8 percent).
Figure 6. Percent ground cover in the City of Plano
11 | P a g e
III. Air Pollution Removal by Urban Trees
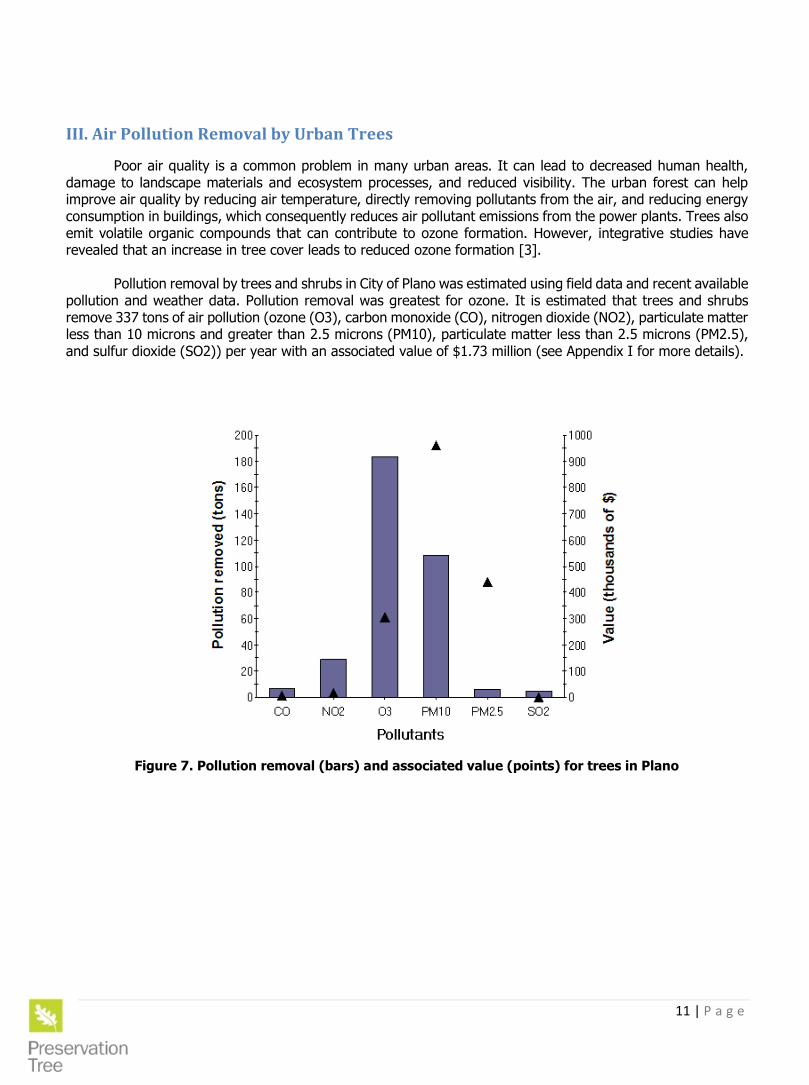
Poor air quality is a common problem in many urban areas. It can lead to decreased human health, damage to landscape materials and ecosystem processes, and reduced visibility. The urban forest can help improve air quality by reducing air temperature, directly removing pollutants from the air, and reducing energy consumption in buildings, which consequently reduces air pollutant emissions from the power plants. Trees also emit volatile organic compounds that can contribute to ozone formation. However, integrative studies have revealed that an increase in tree cover leads to reduced ozone formation [3]. Pollution removal by trees and shrubs in City of Plano was estimated using field data and recent available pollution and weather data. Pollution removal was greatest for ozone. It is estimated that trees and shrubs remove 337 tons of air pollution (ozone (O3), carbon monoxide (CO), nitrogen dioxide (NO2), particulate matter less than 10 microns and greater than 2.5 microns (PM10), particulate matter less than 2.5 microns (PM2.5), and sulfur dioxide (SO2)) per year with an associated value of $1.73 million (see Appendix I for more details).
Figure 7. Pollution removal (bars) and associated value (points) for trees in Plano
12 | P a g e
IV. Carbon Storage and Sequestration
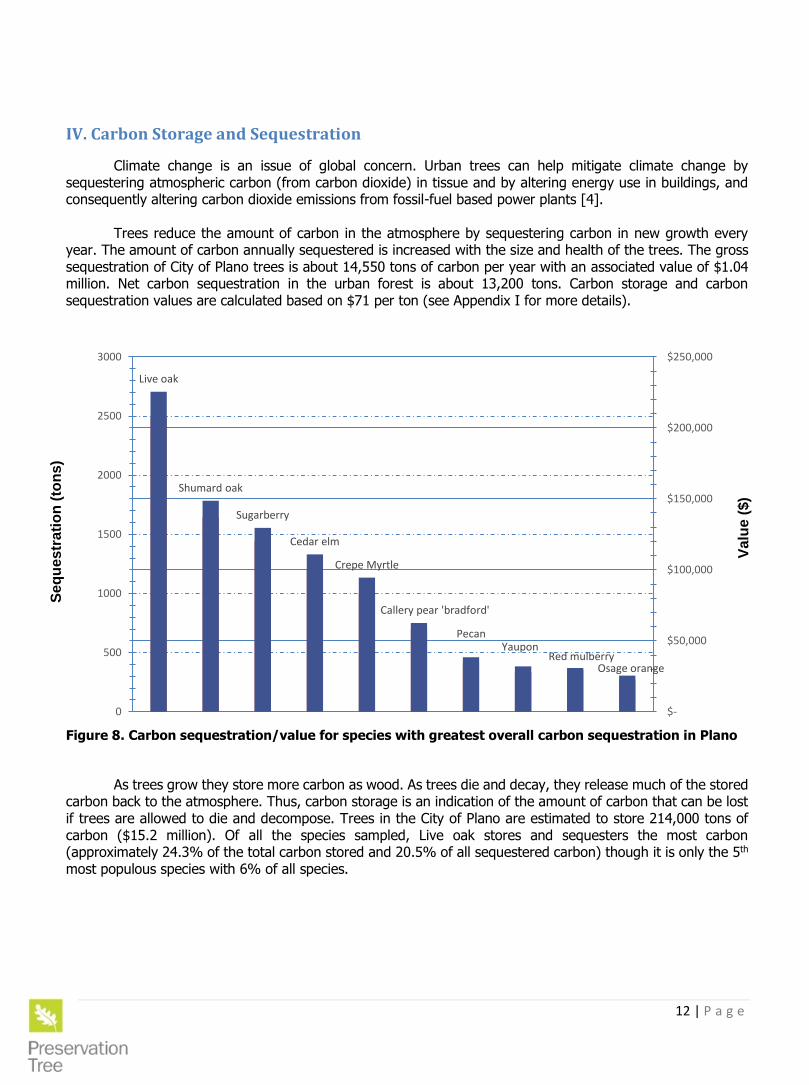
Climate change is an issue of global concern. Urban trees can help mitigate climate change by sequestering atmospheric carbon (from carbon dioxide) in tissue and by altering energy use in buildings, and consequently altering carbon dioxide emissions from fossil-fuel based power plants [4]. Trees reduce the amount of carbon in the atmosphere by sequestering carbon in new growth every year. The amount of carbon annually sequestered is increased with the size and health of the trees. The gross sequestration of City of Plano trees is about 14,550 tons of carbon per year with an associated value of $1.04 million. Net carbon sequestration in the urban forest is about 13,200 tons. Carbon storage and carbon sequestration values are calculated based on $71 per ton (see Appendix I for more details).
Figure 8. Carbon sequestration/value for species with greatest overall carbon sequestration in Plano
As trees grow they store more carbon as wood. As trees die and decay, they release much of the stored
carbon back to the atmosphere. Thus, carbon storage is an indication of the amount of carbon that can be lost if trees are allowed to die and decompose. Trees in the City of Plano are estimated to store 214,000 tons of carbon ($15.2 million). Of all the species sampled, Live oak stores and sequesters the most carbon (approximately 24.3% of the total carbon stored and 20.5% of all sequestered carbon) though it is only the 5th most populous species with 6% of all species.
Live oak
Shumard oak
Sugarberry
Cedar elm
Crepe Myrtle
Callery pear 'bradford'
PecanYaupon
Red mulberryOsage orange
0
500
1000
1500
2000
2500
3000
$-
$50,000
$100,000
$150,000
$200,000
$250,000
Se
qu
es
tra
tio
n (
ton
s)
Va
lue
($)
13 | P a g e
V. Oxygen Production
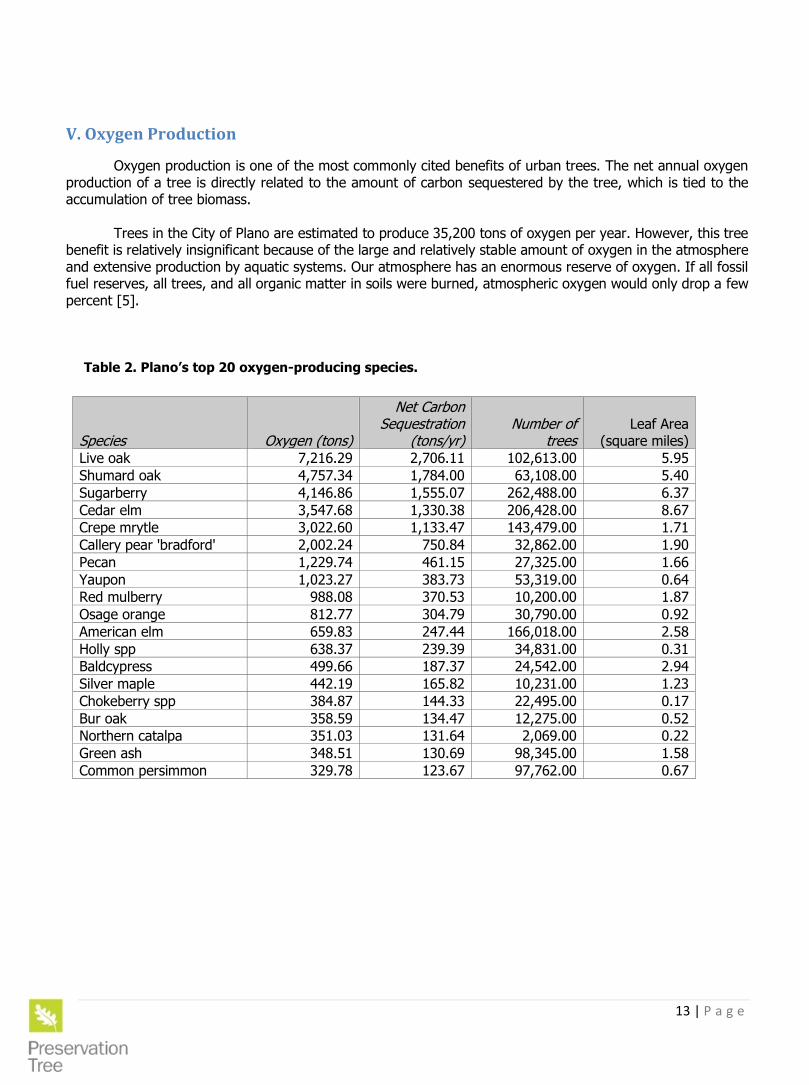
Oxygen production is one of the most commonly cited benefits of urban trees. The net annual oxygen production of a tree is directly related to the amount of carbon sequestered by the tree, which is tied to the accumulation of tree biomass. Trees in the City of Plano are estimated to produce 35,200 tons of oxygen per year. However, this tree benefit is relatively insignificant because of the large and relatively stable amount of oxygen in the atmosphere and extensive production by aquatic systems. Our atmosphere has an enormous reserve of oxygen. If all fossil fuel reserves, all trees, and all organic matter in soils were burned, atmospheric oxygen would only drop a few percent [5].
Table 2. Plano’s top 20 oxygen-producing species.
Species Oxygen (tons)
Net Carbon Sequestration
(tons/yr) Number of
trees Leaf Area
(square miles)
Live oak 7,216.29 2,706.11 102,613.00 5.95
Shumard oak 4,757.34 1,784.00 63,108.00 5.40
Sugarberry 4,146.86 1,555.07 262,488.00 6.37
Cedar elm 3,547.68 1,330.38 206,428.00 8.67
Crepe mrytle 3,022.60 1,133.47 143,479.00 1.71
Callery pear 'bradford' 2,002.24 750.84 32,862.00 1.90
Pecan 1,229.74 461.15 27,325.00 1.66
Yaupon 1,023.27 383.73 53,319.00 0.64
Red mulberry 988.08 370.53 10,200.00 1.87
Osage orange 812.77 304.79 30,790.00 0.92
American elm 659.83 247.44 166,018.00 2.58
Holly spp 638.37 239.39 34,831.00 0.31
Baldcypress 499.66 187.37 24,542.00 2.94
Silver maple 442.19 165.82 10,231.00 1.23
Chokeberry spp 384.87 144.33 22,495.00 0.17
Bur oak 358.59 134.47 12,275.00 0.52
Northern catalpa 351.03 131.64 2,069.00 0.22
Green ash 348.51 130.69 98,345.00 1.58
Common persimmon 329.78 123.67 97,762.00 0.67
14 | P a g e
VI. Trees and Building Energy Use
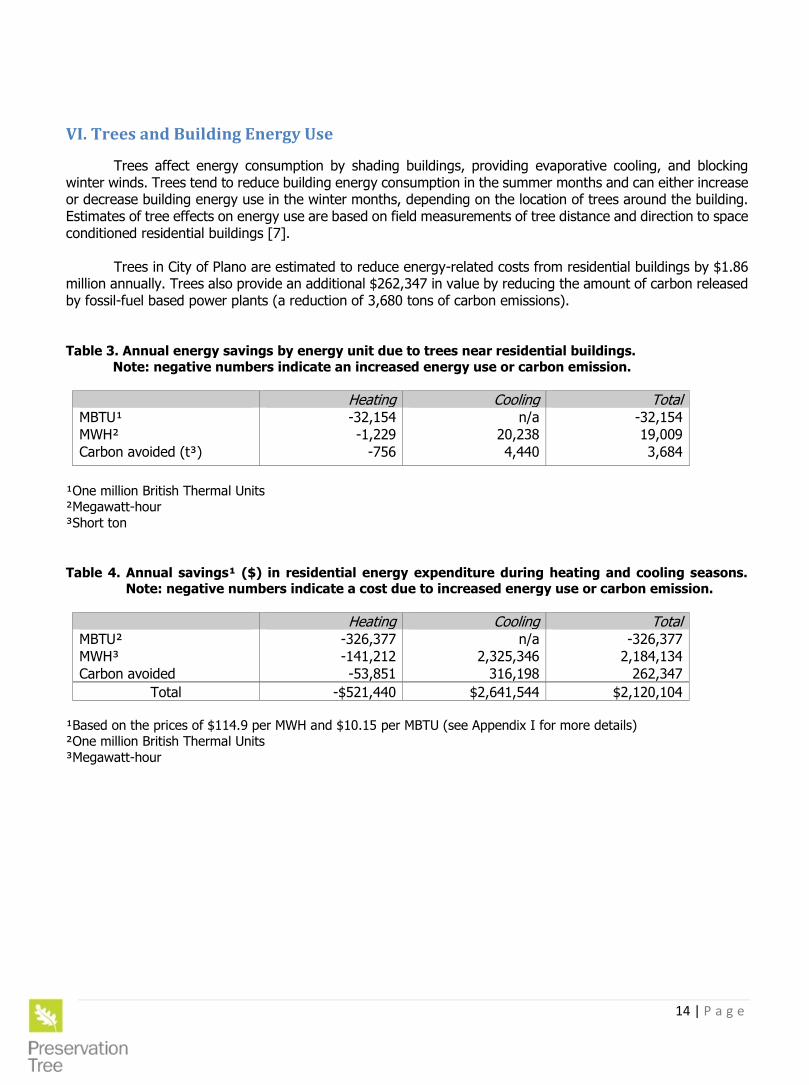
Trees affect energy consumption by shading buildings, providing evaporative cooling, and blocking winter winds. Trees tend to reduce building energy consumption in the summer months and can either increase or decrease building energy use in the winter months, depending on the location of trees around the building. Estimates of tree effects on energy use are based on field measurements of tree distance and direction to space conditioned residential buildings [7]. Trees in City of Plano are estimated to reduce energy-related costs from residential buildings by $1.86 million annually. Trees also provide an additional $262,347 in value by reducing the amount of carbon released by fossil-fuel based power plants (a reduction of 3,680 tons of carbon emissions). Table 3. Annual energy savings by energy unit due to trees near residential buildings.
Note: negative numbers indicate an increased energy use or carbon emission.
Heating Cooling Total MBTU¹ -32,154 n/a -32,154
MWH² -1,229 20,238 19,009
Carbon avoided (t³) -756 4,440 3,684
¹One million British Thermal Units ²Megawatt-hour
³Short ton
Table 4. Annual savings¹ ($) in residential energy expenditure during heating and cooling seasons.
Note: negative numbers indicate a cost due to increased energy use or carbon emission.
Heating Cooling Total MBTU² -326,377 n/a -326,377
MWH³ -141,212 2,325,346 2,184,134
Carbon avoided -53,851 316,198 262,347
Total -$521,440 $2,641,544 $2,120,104
¹Based on the prices of $114.9 per MWH and $10.15 per MBTU (see Appendix I for more details) ²One million British Thermal Units
³Megawatt-hour
15 | P a g e
VII. Annual Rainfall Interception
The Federal Clean Water Act regulates municipal stormwater discharge that enters public water sources. Municipal governments are required to outline and submit Best Management Practices for avoiding and reducing pollutant discharge. Fortunately, municipal trees aid in reducing stormwater runoff by intercepting and storing rainfall on their leaves and branches. Reducing the volume of runoff during a storm event helps to minimize both soil erosion potential and peak flow levels. More specifically, healthy urban trees play an important role in stormwater management in three key ways:
1. Reducing the overall volume of water entering the storm system by leaf and branch absorption. 2. Increased soil health and structure due to the process of root growth and decomposition, thus
increasing water infiltration rates that ultimately reduce overland water flow. 3. Reduction of rainfall velocity and the soil impact rate of raindrops through tree canopy interception
which reduces soil erosion potential and surface transport rates of water.
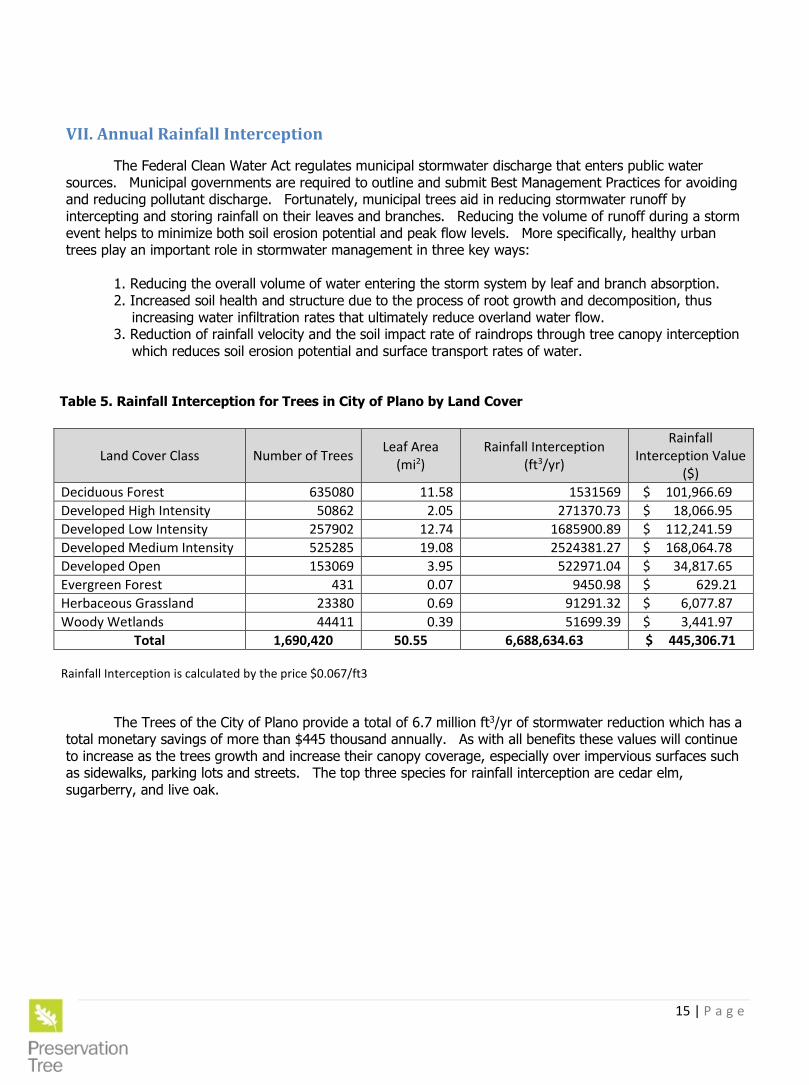
Table 5. Rainfall Interception for Trees in City of Plano by Land Cover
Land Cover Class Number of Trees Leaf Area
(mi2) Rainfall Interception
(ft3/yr)
Rainfall Interception Value
($)
Deciduous Forest 635080 11.58 1531569 $ 101,966.69
Developed High Intensity 50862 2.05 271370.73 $ 18,066.95
Developed Low Intensity 257902 12.74 1685900.89 $ 112,241.59
Developed Medium Intensity 525285 19.08 2524381.27 $ 168,064.78
Developed Open 153069 3.95 522971.04 $ 34,817.65
Evergreen Forest 431 0.07 9450.98 $ 629.21
Herbaceous Grassland 23380 0.69 91291.32 $ 6,077.87
Woody Wetlands 44411 0.39 51699.39 $ 3,441.97
Total 1,690,420 50.55 6,688,634.63 $ 445,306.71
Rainfall Interception is calculated by the price $0.067/ft3
The Trees of the City of Plano provide a total of 6.7 million ft3/yr of stormwater reduction which has a total monetary savings of more than $445 thousand annually. As with all benefits these values will continue to increase as the trees growth and increase their canopy coverage, especially over impervious surfaces such as sidewalks, parking lots and streets. The top three species for rainfall interception are cedar elm, sugarberry, and live oak.
16 | P a g e
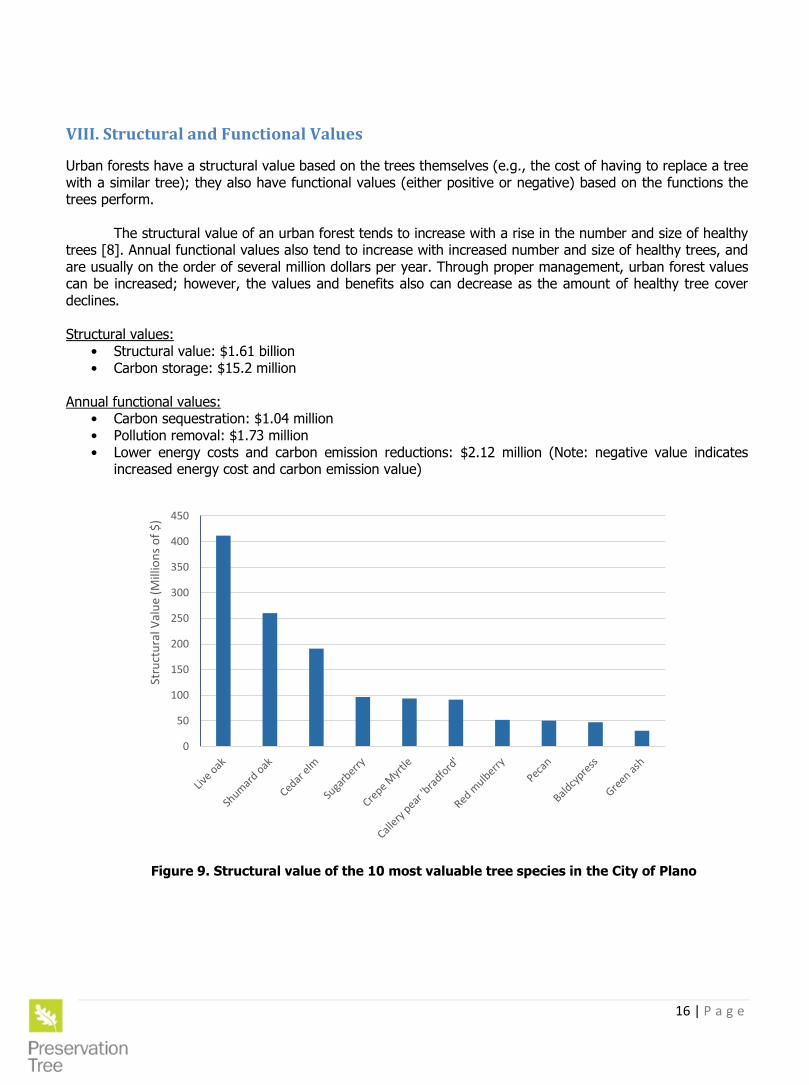
VIII. Structural and Functional Values
Urban forests have a structural value based on the trees themselves (e.g., the cost of having to replace a tree with a similar tree); they also have functional values (either positive or negative) based on the functions the trees perform. The structural value of an urban forest tends to increase with a rise in the number and size of healthy trees [8]. Annual functional values also tend to increase with increased number and size of healthy trees, and are usually on the order of several million dollars per year. Through proper management, urban forest values can be increased; however, the values and benefits also can decrease as the amount of healthy tree cover declines. Structural values: • Structural value: $1.61 billion • Carbon storage: $15.2 million Annual functional values: • Carbon sequestration: $1.04 million • Pollution removal: $1.73 million • Lower energy costs and carbon emission reductions: $2.12 million (Note: negative value indicates
increased energy cost and carbon emission value)
Figure 9. Structural value of the 10 most valuable tree species in the City of Plano
0
50
100
150
200
250
300
350
400
450
Stru
ctu
ral V
alu
e (M
illio
ns
of
$)
17 | P a g e
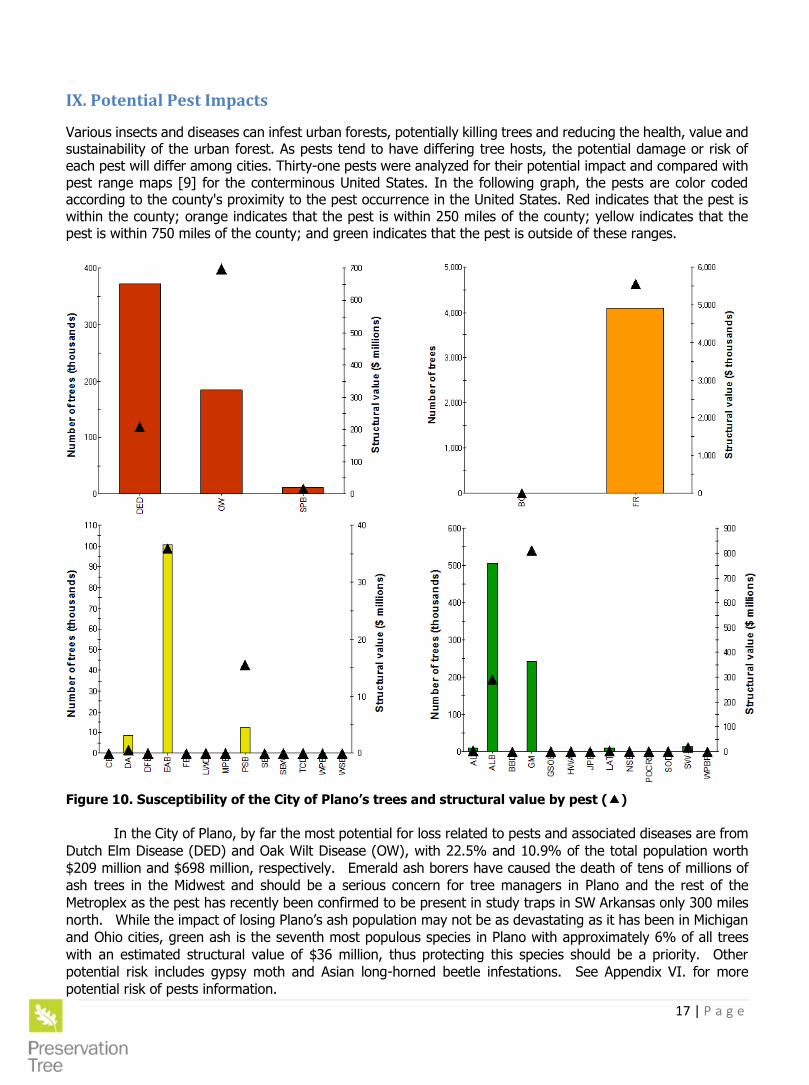
IX. Potential Pest Impacts
Various insects and diseases can infest urban forests, potentially killing trees and reducing the health, value and sustainability of the urban forest. As pests tend to have differing tree hosts, the potential damage or risk of each pest will differ among cities. Thirty-one pests were analyzed for their potential impact and compared with pest range maps [9] for the conterminous United States. In the following graph, the pests are color coded according to the county's proximity to the pest occurrence in the United States. Red indicates that the pest is within the county; orange indicates that the pest is within 250 miles of the county; yellow indicates that the pest is within 750 miles of the county; and green indicates that the pest is outside of these ranges.
Figure 10. Susceptibility of the City of Plano’s trees and structural value by pest ( )
In the City of Plano, by far the most potential for loss related to pests and associated diseases are from
Dutch Elm Disease (DED) and Oak Wilt Disease (OW), with 22.5% and 10.9% of the total population worth
$209 million and $698 million, respectively. Emerald ash borers have caused the death of tens of millions of
ash trees in the Midwest and should be a serious concern for tree managers in Plano and the rest of the
Metroplex as the pest has recently been confirmed to be present in study traps in SW Arkansas only 300 miles
north. While the impact of losing Plano’s ash population may not be as devastating as it has been in Michigan
and Ohio cities, green ash is the seventh most populous species in Plano with approximately 6% of all trees
with an estimated structural value of $36 million, thus protecting this species should be a priority. Other
potential risk includes gypsy moth and Asian long-horned beetle infestations. See Appendix VI. for more
potential risk of pests information.
18 | P a g e
Discussion
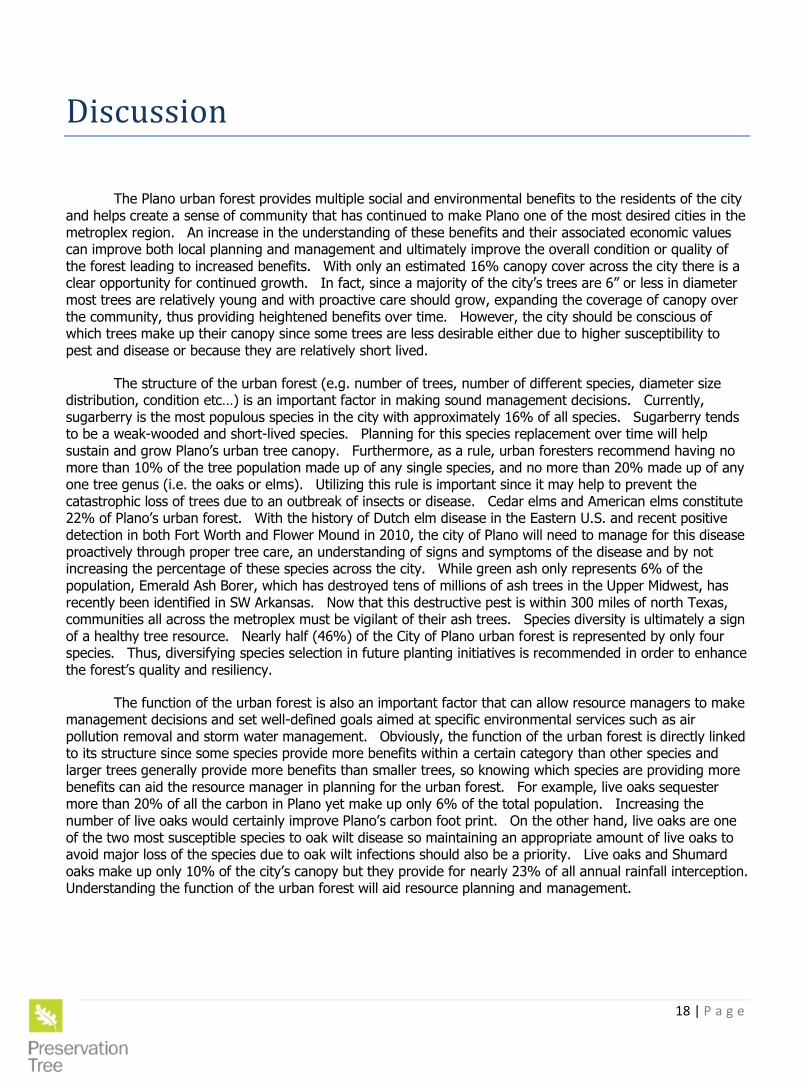
The Plano urban forest provides multiple social and environmental benefits to the residents of the city and helps create a sense of community that has continued to make Plano one of the most desired cities in the metroplex region. An increase in the understanding of these benefits and their associated economic values can improve both local planning and management and ultimately improve the overall condition or quality of the forest leading to increased benefits. With only an estimated 16% canopy cover across the city there is a clear opportunity for continued growth. In fact, since a majority of the city’s trees are 6” or less in diameter most trees are relatively young and with proactive care should grow, expanding the coverage of canopy over the community, thus providing heightened benefits over time. However, the city should be conscious of which trees make up their canopy since some trees are less desirable either due to higher susceptibility to pest and disease or because they are relatively short lived.
The structure of the urban forest (e.g. number of trees, number of different species, diameter size distribution, condition etc…) is an important factor in making sound management decisions. Currently, sugarberry is the most populous species in the city with approximately 16% of all species. Sugarberry tends to be a weak-wooded and short-lived species. Planning for this species replacement over time will help sustain and grow Plano’s urban tree canopy. Furthermore, as a rule, urban foresters recommend having no more than 10% of the tree population made up of any single species, and no more than 20% made up of any one tree genus (i.e. the oaks or elms). Utilizing this rule is important since it may help to prevent the catastrophic loss of trees due to an outbreak of insects or disease. Cedar elms and American elms constitute 22% of Plano’s urban forest. With the history of Dutch elm disease in the Eastern U.S. and recent positive detection in both Fort Worth and Flower Mound in 2010, the city of Plano will need to manage for this disease proactively through proper tree care, an understanding of signs and symptoms of the disease and by not increasing the percentage of these species across the city. While green ash only represents 6% of the population, Emerald Ash Borer, which has destroyed tens of millions of ash trees in the Upper Midwest, has recently been identified in SW Arkansas. Now that this destructive pest is within 300 miles of north Texas, communities all across the metroplex must be vigilant of their ash trees. Species diversity is ultimately a sign of a healthy tree resource. Nearly half (46%) of the City of Plano urban forest is represented by only four species. Thus, diversifying species selection in future planting initiatives is recommended in order to enhance the forest’s quality and resiliency.
The function of the urban forest is also an important factor that can allow resource managers to make management decisions and set well-defined goals aimed at specific environmental services such as air pollution removal and storm water management. Obviously, the function of the urban forest is directly linked to its structure since some species provide more benefits within a certain category than other species and larger trees generally provide more benefits than smaller trees, so knowing which species are providing more benefits can aid the resource manager in planning for the urban forest. For example, live oaks sequester more than 20% of all the carbon in Plano yet make up only 6% of the total population. Increasing the number of live oaks would certainly improve Plano’s carbon foot print. On the other hand, live oaks are one of the two most susceptible species to oak wilt disease so maintaining an appropriate amount of live oaks to avoid major loss of the species due to oak wilt infections should also be a priority. Live oaks and Shumard oaks make up only 10% of the city’s canopy but they provide for nearly 23% of all annual rainfall interception. Understanding the function of the urban forest will aid resource planning and management.
19 | P a g e
With the city’s recent upgrade to the asset management system, Cartegraph, Plano’s current tree
inventory can also be enhanced to allow for more effective management of all city owned trees. Utilizing the new asset management system to track professional tree care, tree plantings, and removals is a powerful tool that increases management success and cost effectiveness. Overall the new system can help facilitate management decisions that may improve the health and condition of the trees as well as to reduce risk in the event of tree loss/failure during storm events. It is recommended that the city of Plano develop an Urban Forest Management Plan that outlines goals and the tasks necessary to reach them. Establishing measureable goals and defined responsibilities will allow the urban forestry program to establish work priorities, monitor progress and develop appropriate budgets annually.
Plano represents only the fifth community in the state to complete an iTree Eco study and only the third in the DFW Metroplex. So, how does the urban forest of Plano compare to other Texas communities? While a direct comparison to other communities is interesting on an empirical basis it is important to recognize the many physical (e.g. types of infrastructure, level/extent of development etc…), social (e.g. political support for program etc…), and natural (e.g. species availability and growth rates, climate etc…) attributes that control the level and quality of any community’s urban forest. Furthermore, the year each study is completed does impact the results to a small degree since regression equations that provide leaf area estimates and benefit values, as well as other local inputs such as energy costs, are sometimes adjusted with the release of new iTree software versions.
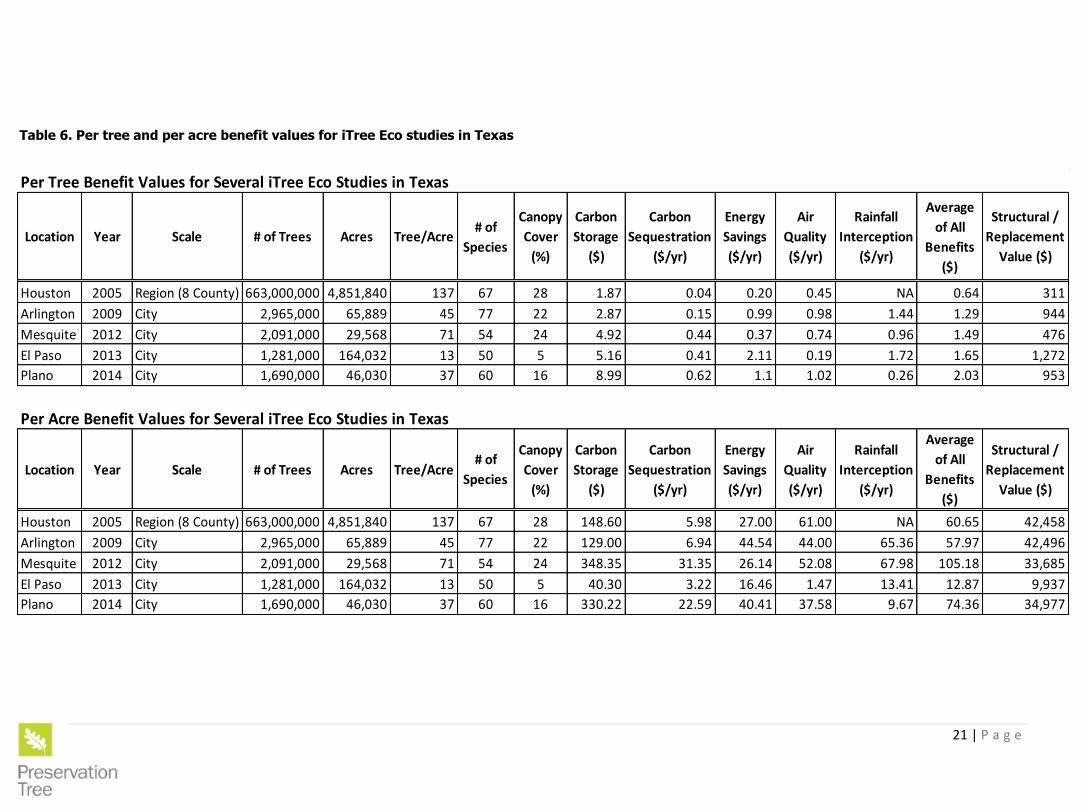
Converting benefit results to per tree and per acre values allows for the best comparison. Plano has a relatively low average tree density with 37 trees per acre (tpa). For comparison, the cities of Mesquite, Arlington, and El Paso had tree densities of 71, 45, and 13 tpa, respectively, while the Houston region measured 137 tpa. Of the four city-scale studies, Arlington has the highest species diversity with 77 species recorded, then the City of Plano with 60 species. Plano’s 16% canopy coverage is lower than the other two DFW communities that have completed similar studies. In fact, a 16-county regional iCanopy analyis for north Texas found the region to have approximately 23% coverage. With 64% of the urban forest less than 6” in diameter this relatively low coverage is not surprisingly. Plano also has a very young urban forest. Young trees are typically smaller. The goal should be to invest in professional care for the city’s young trees so that they can reach maturity and increase the amount of benefits they provide. Proactive tree care on young trees is also much more cost effective in long-run. In terms of average benefits values, Plano has relatively higher amounts of benefits on a per tree basis then the other communities, perhaps related to its realtively smaller tree poplation. On a per acre basis, Plano’s urban forest provides higher than average environmental benefits. Finally, the structural value, otherwise known as the replacement value, of Plano’s urban forest was also higher than the average for all the Texas studies and higher than both the other two DFW communities’ (Arlington and Mesquite) structural values. See Appendix III. for a comparison of Plano’s urban forest with other North American cities.
It is clear that Plano’s urban forest is an increasingly valuable community resource. However, to best support the appreciation of its value, explicit, professional care must be a priority. A commitment to invest in Plano’s urban forest will contintue to increase this important assett’s positive affect for both residents and visitors alike. With the recent increase in both commercial and housing markets, the focus of tree protection and management has never been more important. Working with city planners and developers to incorporate trees in new and creative ways will help to protect existing trees, as well as, add new canopy cover into the future. One way to do this is to revisit the city’s tree protection ordinance. Specifically, canopy coverage goals and/or recommendations designed for specific land-use such as parkinglots, industurial, and commerical areas should be addressed, especially since 31% of the city’s ground cover is cement. Establishing these land-use specific canopy coverage goals is a more effective strategy to help Plano increase the benefits its trees provide. Not all land-use types are capapble of sustaining the same level of canopy cover and thus establishing unrealistic goals will often lead to failure and waste of important funding. On the other hand, the establishment of appropiate canopy goals within the areas of lowest canopy coverage yet, the highest
20 | P a g e
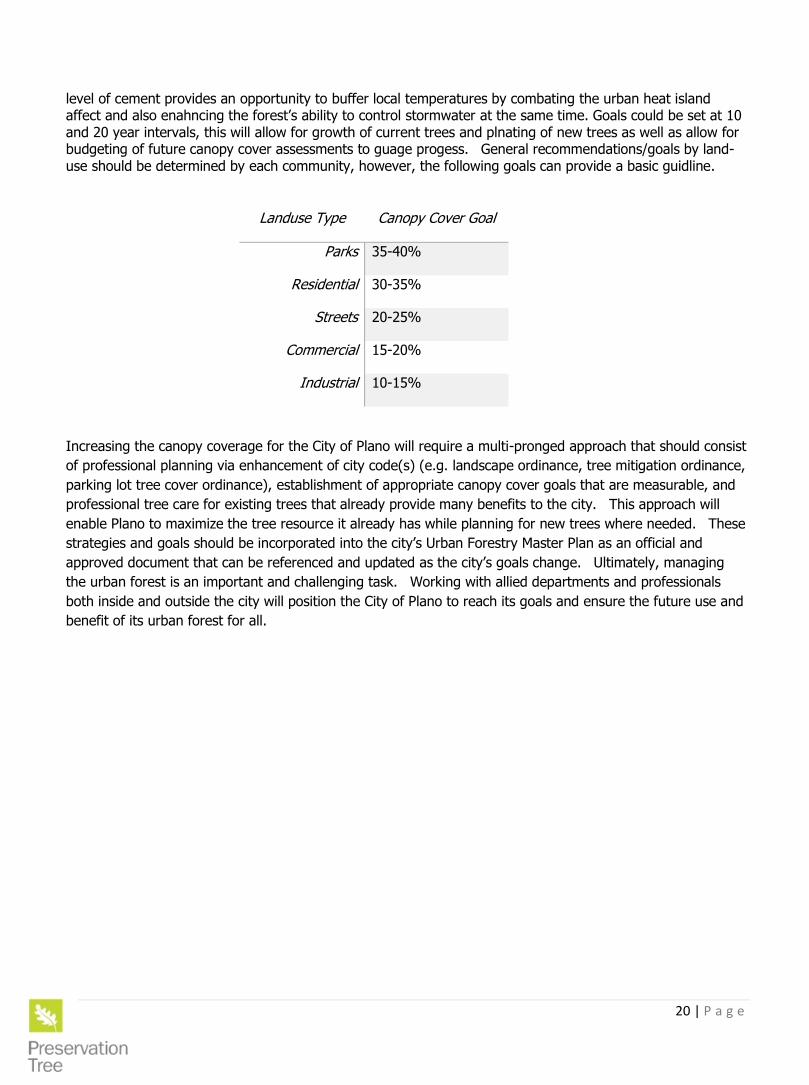
level of cement provides an opportunity to buffer local temperatures by combating the urban heat island affect and also enahncing the forest’s ability to control stormwater at the same time. Goals could be set at 10 and 20 year intervals, this will allow for growth of current trees and plnating of new trees as well as allow for budgeting of future canopy cover assessments to guage progess. General recommendations/goals by land-use should be determined by each community, however, the following goals can provide a basic guidline.
Increasing the canopy coverage for the City of Plano will require a multi-pronged approach that should consist
of professional planning via enhancement of city code(s) (e.g. landscape ordinance, tree mitigation ordinance,
parking lot tree cover ordinance), establishment of appropriate canopy cover goals that are measurable, and
professional tree care for existing trees that already provide many benefits to the city. This approach will
enable Plano to maximize the tree resource it already has while planning for new trees where needed. These
strategies and goals should be incorporated into the city’s Urban Forestry Master Plan as an official and
approved document that can be referenced and updated as the city’s goals change. Ultimately, managing
the urban forest is an important and challenging task. Working with allied departments and professionals
both inside and outside the city will position the City of Plano to reach its goals and ensure the future use and
benefit of its urban forest for all.
Landuse Type Canopy Cover Goal
Parks 35-40%
Residential 30-35%
Streets 20-25%
Commercial 15-20%
Industrial 10-15%
21 | P a g e
Table 6. Per tree and per acre benefit values for iTree Eco studies in Texas
Per Tree Benefit Values for Several iTree Eco Studies in Texas
Location Year Scale # of Trees Acres Tree/Acre# of
Species
Canopy
Cover
(%)
Carbon
Storage
($)
Carbon
Sequestration
($/yr)
Energy
Savings
($/yr)
Air
Quality
($/yr)
Rainfall
Interception
($/yr)
Average
of All
Benefits
($)
Structural /
Replacement
Value ($)
Houston 2005 Region (8 County) 663,000,000 4,851,840 137 67 28 1.87 0.04 0.20 0.45 NA 0.64 311
Arlington 2009 City 2,965,000 65,889 45 77 22 2.87 0.15 0.99 0.98 1.44 1.29 944
Mesquite 2012 City 2,091,000 29,568 71 54 24 4.92 0.44 0.37 0.74 0.96 1.49 476
El Paso 2013 City 1,281,000 164,032 13 50 5 5.16 0.41 2.11 0.19 1.72 1.65 1,272
Plano 2014 City 1,690,000 46,030 37 60 16 8.99 0.62 1.1 1.02 0.26 2.03 953
Per Acre Benefit Values for Several iTree Eco Studies in Texas
Location Year Scale # of Trees Acres Tree/Acre# of
Species
Canopy
Cover
(%)
Carbon
Storage
($)
Carbon
Sequestration
($/yr)
Energy
Savings
($/yr)
Air
Quality
($/yr)
Rainfall
Interception
($/yr)
Average
of All
Benefits
($)
Structural /
Replacement
Value ($)
Houston 2005 Region (8 County) 663,000,000 4,851,840 137 67 28 148.60 5.98 27.00 61.00 NA 60.65 42,458
Arlington 2009 City 2,965,000 65,889 45 77 22 129.00 6.94 44.54 44.00 65.36 57.97 42,496
Mesquite 2012 City 2,091,000 29,568 71 54 24 348.35 31.35 26.14 52.08 67.98 105.18 33,685
El Paso 2013 City 1,281,000 164,032 13 50 5 40.30 3.22 16.46 1.47 13.41 12.87 9,937
Plano 2014 City 1,690,000 46,030 37 60 16 330.22 22.59 40.41 37.58 9.67 74.36 34,977
22 | P a g e
Appendix I. i-Tree Eco Model and Field Measurements
i-Tree Eco is designed to use standardized field data from randomly located plots and local hourly air
pollution and meteorological data to quantify urban forest structure and its numerous effects [10], including:
Urban forest structure (e.g., species composition, tree health, leaf area, etc.). Amount of pollution removed hourly by the urban forest, and its associated percent air quality
improvement throughout a year. Pollution removal is calculated for ozone, sulfur dioxide, nitrogen dioxide, carbon monoxide and particulate matter (<2.5 microns and <10 microns).
Total carbon stored and net carbon annually sequestered by the urban forest. Effects of trees on building energy use and consequent effects on carbon dioxide emissions from
power plants. Structural value of the forest, as well as the value for air pollution removal and carbon storage and
sequestration.
Potential impact of dangerous pests and diseases, such as Asian longhorned beetle, emerald ash borer, gypsy moth, oak wilt, and Dutch elm disease.
In the field, 225 0.10 acre circular plots (radius = 37.2 feet) were randomly distributed throughout
the study area and stratified by land cover categories. All field data are collected during the leaf-on season
to properly assess tree canopies. Within each plot, typical data collection (actual data collection may vary
depending upon the user) includes land use, ground and tree cover, individual tree attributes of species,
stem diameter, height, crown width, crown canopy missing and dieback, and distance and direction to
residential buildings [44, 6].
Invasive species were identified using an invasive species list [2] for the state in which the urban
forest is located. These lists are not exhaustive and they cover invasive species of varying degrees of
invasiveness and distribution. In instances where a state did not have an invasive species list, a list was
created based on the lists of the adjacent states. Tree species that are identified as invasive by the state
invasive species list are cross-referenced with native range data. This helps eliminate species that are on the
state invasive species list, but are native to the study area.
To calculate current carbon storage, biomass for each tree was calculated using equations from the
literature and measured tree data. Open-grown, maintained trees tend to have less biomass than predicted
by forest-derived biomass equations [45]. To adjust for this difference, biomass results for open-grown urban
trees were multiplied by 0.8. No adjustment was made for trees found in natural stand conditions. Tree dry-
weight biomass was converted to stored carbon by multiplying by 0.5.
To estimate the gross amount of carbon sequestered annually, average diameter growth from the
appropriate genera and diameter class and tree condition was added to the existing tree diameter (year x)
to estimate tree diameter and carbon storage in year x+1.
The amount of oxygen produced is estimated from carbon sequestration based on atomic weights:
net O2 release (kg/yr) = net C sequestration (kg/yr) × 32/12. To estimate the net carbon sequestration rate,
the amount of carbon sequestered as a result of tree growth is reduced by the amount lost resulting from
tree mortality. Thus, net carbon sequestration and net annual oxygen production of the urban forest account
for decomposition [46].
Air pollution removal estimates are derived from calculated hourly tree-canopy resistances for ozone,
and sulfur and nitrogen dioxides based on a hybrid of big-leaf and multi-layer canopy deposition models [47,
48]. As the removal of carbon monoxide and particulate matter by vegetation is not directly related to
transpiration, removal rates (deposition velocities) for these pollutants were based on average measured
values from the literature [49, 50] that were adjusted depending on leaf phenology and leaf area. Removal
23 | P a g e
estimates of particulate matter less than 10 microns incorporated a 50 percent resuspension rate of particles
back to the atmosphere [51]. Recent updates (2011) to air quality modeling are based on improved leaf area
index simulations, weather and pollution processing and interpolation, and updated pollutant monetary values
[52, 53, and 54].
Air pollution removal value was calculated based on local incidence of adverse health effects and
national median externality costs. The number of adverse health effects and associated economic value is
calculated for ozone, sulfur dioxide, nitrogen dioxide, and particulate matter <2.5 microns using the U.S.
Environmental Protection Agency's Environmental Benefits Mapping and Analysis Program (BenMAP). The
model uses a damage-function approach that is based on the local change in pollution concentration and
population [5].
National median externality costs were used to calculate the value of carbon monoxide removal. As
particulate matter <10 microns is inclusive of particulate matter <2.5 microns, the pollution removal value
for particulate matter <10 microns utilizes both local incidence values from particulate matter <2.5 microns
and national median externality costs from particulate matter <10 microns to estimate the air pollution
removal values. Thus the value for particulate matter <10 microns = ((PM10 (mt/yr)-PM2.5 (mt/yr))*median
externality)+PM2.5 ($/yr).
If appropriate field data were collected, seasonal effects of trees on residential building energy use
were calculated based on procedures described in the literature [9] using distance and direction of trees from
residential structures, tree height and tree condition data.
Structural values were based on valuation procedures of the Council of Tree and Landscape
Appraisers, which uses tree species, diameter, condition, and location information [55].
Potential pest risk was based on pest range maps and the known pest host species that are likely to
experience mortality. Pest range maps from the Forest Health Technology Enterprise Team (FHTET) [12]
were used to determine the proximity of each pest to the county in which the urban forest is located. For the
county, it was established whether the insect/disease occurs within the county, is within 250 miles of the
county edge, is between 250 and 750 miles away, or is greater than 750 miles away. FHTET did not have
pest range maps for Dutch elm disease and chestnut blight. The range of these pests was based on known
occurrence and the host range, respectively [12].
24 | P a g e
Appendix II. Relative Tree Effects
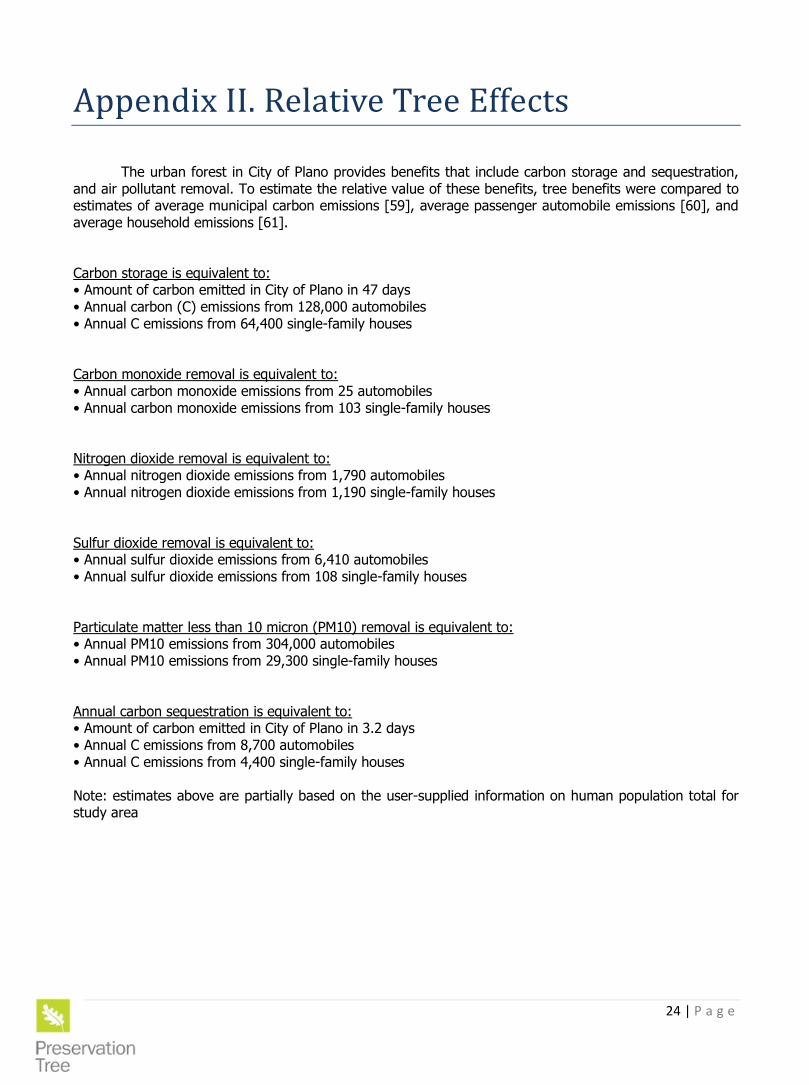
The urban forest in City of Plano provides benefits that include carbon storage and sequestration,
and air pollutant removal. To estimate the relative value of these benefits, tree benefits were compared to estimates of average municipal carbon emissions [59], average passenger automobile emissions [60], and average household emissions [61]. Carbon storage is equivalent to: • Amount of carbon emitted in City of Plano in 47 days • Annual carbon (C) emissions from 128,000 automobiles • Annual C emissions from 64,400 single-family houses Carbon monoxide removal is equivalent to: • Annual carbon monoxide emissions from 25 automobiles • Annual carbon monoxide emissions from 103 single-family houses Nitrogen dioxide removal is equivalent to: • Annual nitrogen dioxide emissions from 1,790 automobiles • Annual nitrogen dioxide emissions from 1,190 single-family houses Sulfur dioxide removal is equivalent to: • Annual sulfur dioxide emissions from 6,410 automobiles • Annual sulfur dioxide emissions from 108 single-family houses Particulate matter less than 10 micron (PM10) removal is equivalent to: • Annual PM10 emissions from 304,000 automobiles • Annual PM10 emissions from 29,300 single-family houses Annual carbon sequestration is equivalent to: • Amount of carbon emitted in City of Plano in 3.2 days • Annual C emissions from 8,700 automobiles • Annual C emissions from 4,400 single-family houses Note: estimates above are partially based on the user-supplied information on human population total for study area
25 | P a g e
Appendix III. Comparison of Urban Forests
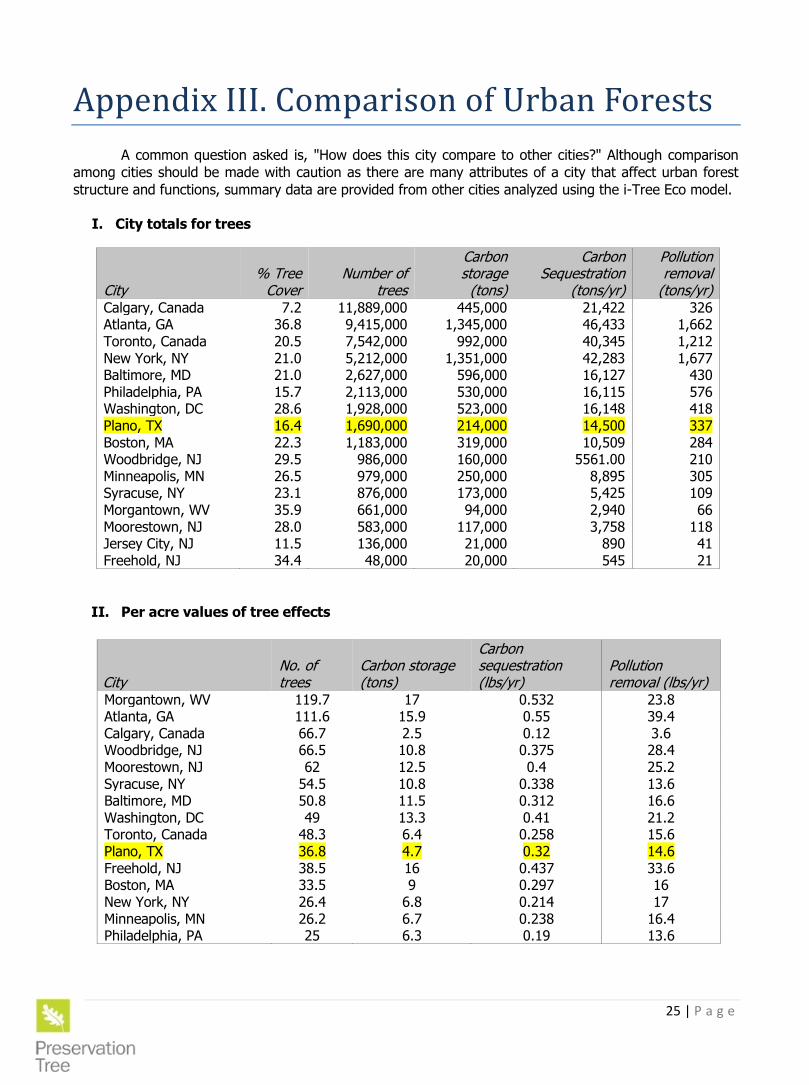
A common question asked is, "How does this city compare to other cities?" Although comparison
among cities should be made with caution as there are many attributes of a city that affect urban forest
structure and functions, summary data are provided from other cities analyzed using the i-Tree Eco model.
I. City totals for trees
II. Per acre values of tree effects
City No. of trees
Carbon storage (tons)
Carbon sequestration (lbs/yr)
Pollution removal (lbs/yr)
Morgantown, WV 119.7 17 0.532 23.8 Atlanta, GA 111.6 15.9 0.55 39.4 Calgary, Canada 66.7 2.5 0.12 3.6 Woodbridge, NJ 66.5 10.8 0.375 28.4 Moorestown, NJ 62 12.5 0.4 25.2 Syracuse, NY 54.5 10.8 0.338 13.6 Baltimore, MD 50.8 11.5 0.312 16.6 Washington, DC 49 13.3 0.41 21.2 Toronto, Canada 48.3 6.4 0.258 15.6 Plano, TX 36.8 4.7 0.32 14.6 Freehold, NJ 38.5 16 0.437 33.6 Boston, MA 33.5 9 0.297 16 New York, NY 26.4 6.8 0.214 17 Minneapolis, MN 26.2 6.7 0.238 16.4 Philadelphia, PA 25 6.3 0.19 13.6
City % Tree
Cover Number of
trees
Carbon storage
(tons)
Carbon Sequestration
(tons/yr)
Pollution removal
(tons/yr) Calgary, Canada 7.2 11,889,000 445,000 21,422 326 Atlanta, GA 36.8 9,415,000 1,345,000 46,433 1,662 Toronto, Canada 20.5 7,542,000 992,000 40,345 1,212 New York, NY 21.0 5,212,000 1,351,000 42,283 1,677 Baltimore, MD 21.0 2,627,000 596,000 16,127 430 Philadelphia, PA 15.7 2,113,000 530,000 16,115 576 Washington, DC 28.6 1,928,000 523,000 16,148 418 Plano, TX 16.4 1,690,000 214,000 14,500 337 Boston, MA 22.3 1,183,000 319,000 10,509 284 Woodbridge, NJ 29.5 986,000 160,000 5561.00 210 Minneapolis, MN 26.5 979,000 250,000 8,895 305 Syracuse, NY 23.1 876,000 173,000 5,425 109 Morgantown, WV 35.9 661,000 94,000 2,940 66 Moorestown, NJ 28.0 583,000 117,000 3,758 118 Jersey City, NJ 11.5 136,000 21,000 890 41 Freehold, NJ 34.4 48,000 20,000 545 21
26 | P a g e
Appendix IV. General Recommendations for Air Quality Improvement
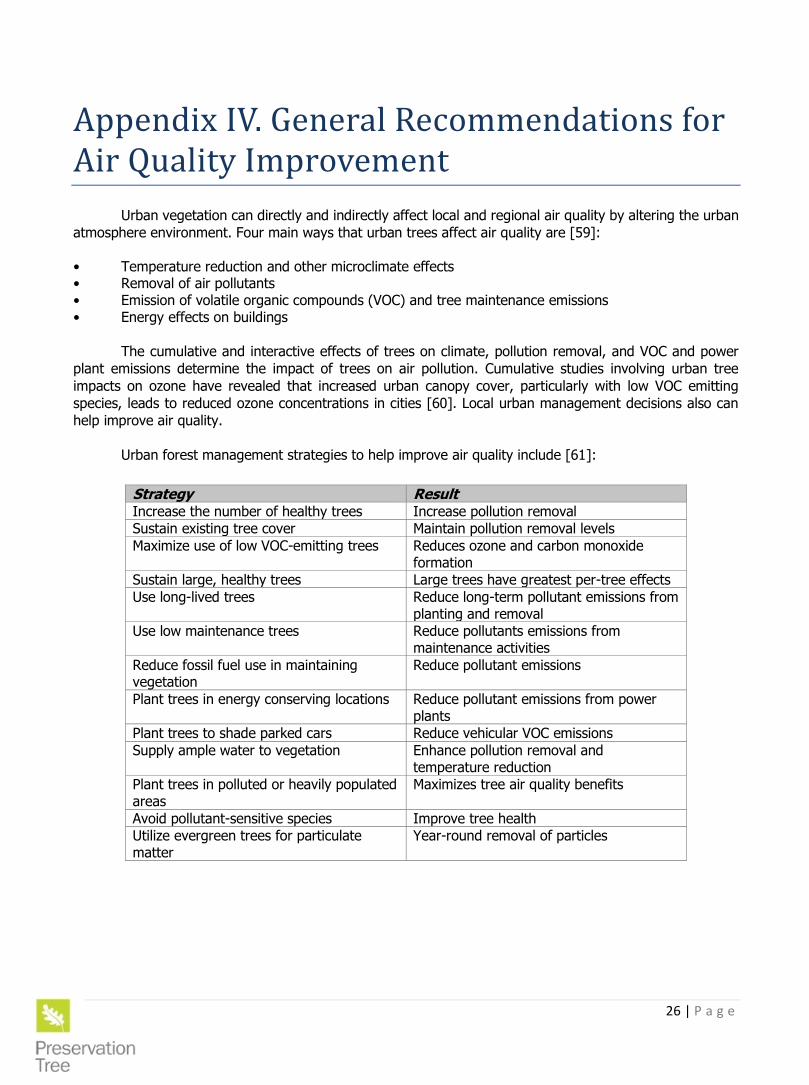
Urban vegetation can directly and indirectly affect local and regional air quality by altering the urban
atmosphere environment. Four main ways that urban trees affect air quality are [59]:
• Temperature reduction and other microclimate effects • Removal of air pollutants • Emission of volatile organic compounds (VOC) and tree maintenance emissions • Energy effects on buildings
The cumulative and interactive effects of trees on climate, pollution removal, and VOC and power
plant emissions determine the impact of trees on air pollution. Cumulative studies involving urban tree
impacts on ozone have revealed that increased urban canopy cover, particularly with low VOC emitting
species, leads to reduced ozone concentrations in cities [60]. Local urban management decisions also can
help improve air quality.
Urban forest management strategies to help improve air quality include [61]:
Strategy Result
Increase the number of healthy trees Increase pollution removal
Sustain existing tree cover Maintain pollution removal levels
Maximize use of low VOC-emitting trees Reduces ozone and carbon monoxide formation
Sustain large, healthy trees Large trees have greatest per-tree effects
Use long-lived trees Reduce long-term pollutant emissions from planting and removal
Use low maintenance trees Reduce pollutants emissions from maintenance activities
Reduce fossil fuel use in maintaining vegetation
Reduce pollutant emissions
Plant trees in energy conserving locations Reduce pollutant emissions from power plants
Plant trees to shade parked cars Reduce vehicular VOC emissions
Supply ample water to vegetation Enhance pollution removal and temperature reduction
Plant trees in polluted or heavily populated areas
Maximizes tree air quality benefits
Avoid pollutant-sensitive species Improve tree health
Utilize evergreen trees for particulate matter
Year-round removal of particles
27 | P a g e
Appendix V. Invasive Species of the Urban Forest
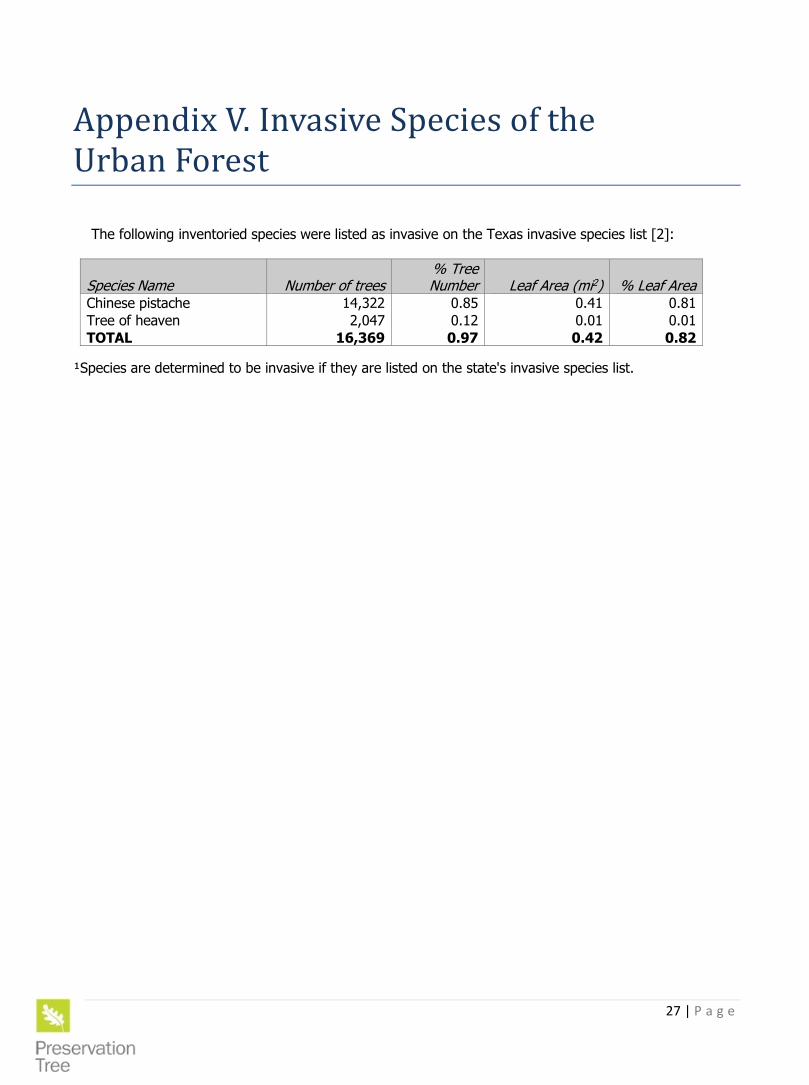
The following inventoried species were listed as invasive on the Texas invasive species list [2]:
Species Name Number of trees % Tree Number Leaf Area (mi2) % Leaf Area
Chinese pistache 14,322 0.85 0.41 0.81
Tree of heaven 2,047 0.12 0.01 0.01
TOTAL 16,369 0.97 0.42 0.82
¹Species are determined to be invasive if they are listed on the state's invasive species list.
28 | P a g e
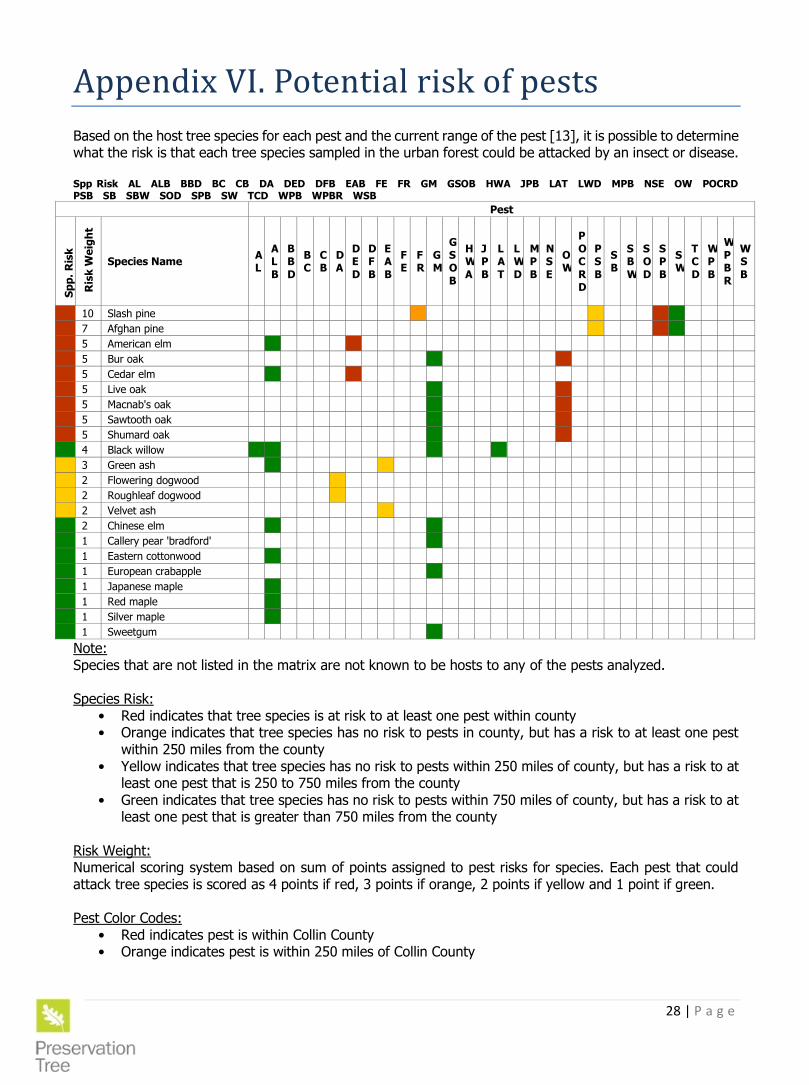
Appendix VI. Potential risk of pests
Based on the host tree species for each pest and the current range of the pest [13], it is possible to determine what the risk is that each tree species sampled in the urban forest could be attacked by an insect or disease. Spp Risk AL ALB BBD BC CB DA DED DFB EAB FE FR GM GSOB HWA JPB LAT LWD MPB NSE OW POCRD PSB SB SBW SOD SPB SW TCD WPB WPBR WSB
Pest
Sp
p.
Ris
k
R
isk W
eig
ht
Species Name AL
ALB
BBD
BC
CB
DA
DED
DFB
EAB
FE
FR
GM
GSOB
HWA
JPB
LAT
LWD
MPB
NSE
OW
POCRD
PSB
SB
SBW
SOD
SPB
SW
TCD
WPB
WPBR
WSB
10 Slash pine
7 Afghan pine
5 American elm
5 Bur oak
5 Cedar elm
5 Live oak
5 Macnab's oak
5 Sawtooth oak
5 Shumard oak
4 Black willow
3 Green ash
2 Flowering dogwood
2 Roughleaf dogwood
2 Velvet ash
2 Chinese elm
1 Callery pear 'bradford'
1 Eastern cottonwood
1 European crabapple
1 Japanese maple
1 Red maple
1 Silver maple
1 Sweetgum
Note: Species that are not listed in the matrix are not known to be hosts to any of the pests analyzed. Species Risk: • Red indicates that tree species is at risk to at least one pest within county • Orange indicates that tree species has no risk to pests in county, but has a risk to at least one pest
within 250 miles from the county • Yellow indicates that tree species has no risk to pests within 250 miles of county, but has a risk to at
least one pest that is 250 to 750 miles from the county • Green indicates that tree species has no risk to pests within 750 miles of county, but has a risk to at
least one pest that is greater than 750 miles from the county Risk Weight: Numerical scoring system based on sum of points assigned to pest risks for species. Each pest that could attack tree species is scored as 4 points if red, 3 points if orange, 2 points if yellow and 1 point if green. Pest Color Codes: • Red indicates pest is within Collin County • Orange indicates pest is within 250 miles of Collin County
29 | P a g e
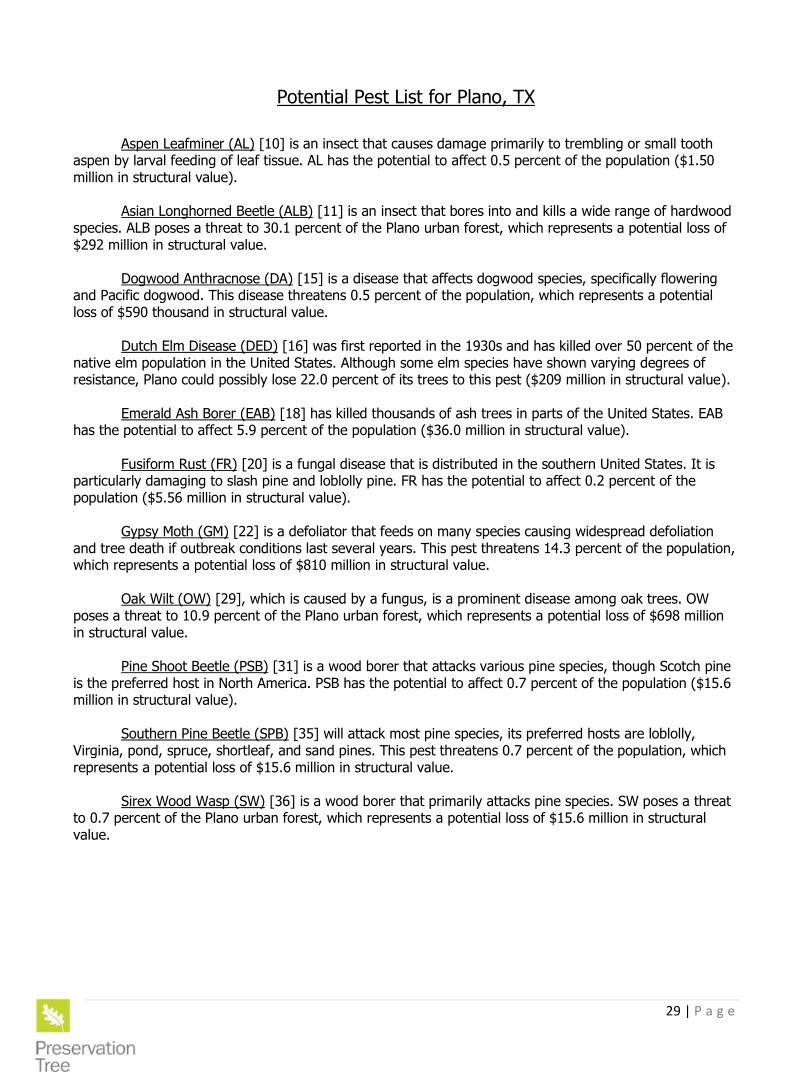
Potential Pest List for Plano, TX
Aspen Leafminer (AL) [10] is an insect that causes damage primarily to trembling or small tooth
aspen by larval feeding of leaf tissue. AL has the potential to affect 0.5 percent of the population ($1.50 million in structural value). Asian Longhorned Beetle (ALB) [11] is an insect that bores into and kills a wide range of hardwood species. ALB poses a threat to 30.1 percent of the Plano urban forest, which represents a potential loss of $292 million in structural value. Dogwood Anthracnose (DA) [15] is a disease that affects dogwood species, specifically flowering and Pacific dogwood. This disease threatens 0.5 percent of the population, which represents a potential loss of $590 thousand in structural value. Dutch Elm Disease (DED) [16] was first reported in the 1930s and has killed over 50 percent of the native elm population in the United States. Although some elm species have shown varying degrees of resistance, Plano could possibly lose 22.0 percent of its trees to this pest ($209 million in structural value). Emerald Ash Borer (EAB) [18] has killed thousands of ash trees in parts of the United States. EAB has the potential to affect 5.9 percent of the population ($36.0 million in structural value). Fusiform Rust (FR) [20] is a fungal disease that is distributed in the southern United States. It is particularly damaging to slash pine and loblolly pine. FR has the potential to affect 0.2 percent of the population ($5.56 million in structural value). Gypsy Moth (GM) [22] is a defoliator that feeds on many species causing widespread defoliation and tree death if outbreak conditions last several years. This pest threatens 14.3 percent of the population, which represents a potential loss of $810 million in structural value. Oak Wilt (OW) [29], which is caused by a fungus, is a prominent disease among oak trees. OW poses a threat to 10.9 percent of the Plano urban forest, which represents a potential loss of $698 million in structural value. Pine Shoot Beetle (PSB) [31] is a wood borer that attacks various pine species, though Scotch pine is the preferred host in North America. PSB has the potential to affect 0.7 percent of the population ($15.6 million in structural value). Southern Pine Beetle (SPB) [35] will attack most pine species, its preferred hosts are loblolly, Virginia, pond, spruce, shortleaf, and sand pines. This pest threatens 0.7 percent of the population, which represents a potential loss of $15.6 million in structural value.
Sirex Wood Wasp (SW) [36] is a wood borer that primarily attacks pine species. SW poses a threat to 0.7 percent of the Plano urban forest, which represents a potential loss of $15.6 million in structural value.
30 | P a g e
References
1. U.S. Department of Agriculture. National Invasive Species Information Center. 2011. http://www.invasivespeciesinfo.gov/plants/main.shtml 2. TX: Watershed Protection Development Review. City of Austin. Central Texas Invasive Plants. Volunteer Field Guide. < http://www.ci.austin.tx.us/growgreen/downloads/invasiveplants.pdf >
3. Nowak, D.J. and J.F. Dwyer. 2007. Understanding the benefits and costs of urban forest ecosystems. In: Kuser, J. (ed.) Urban and Community Forestry in the Northeast. New York: Springer. Pp. 25-46. 4. Abdollahi, K.K.; Z.H. Ning; and A. Appeaning (eds). 2000. Global climate change and the urban forest. Baton Rouge, LA: GCRCC and Franklin Press. 77p. 5. Broecker, W.S. 1970. Man's oxygen reserve. Science 168: 1537-1538. 6. Hirabayashi, S. 2012. i-Tree Eco Precipitation Interception Model Descriptions, http://www.itreetools.org/eco/resources/iTree_Eco_Precipitation_Interception_Model_Descriptions_V1_2.pdf 7. McPherson, E.G. and J. R. Simpson 1999. Carbon dioxide reduction through urban forestry: guidelines for professional and volunteer tree planters. Gen. Tech. Rep. PSW-171. Albany, CA: U.S. Department of Agriculture, Forest Service, Pacific Southwest Research station 237 p. http://wcufre.ucdavis.edu/products/cufr_43.pdf 8. Nowak, D.J.; Crane, D.E.; Dwyer, J.F. 2002. Compensatory value of urban trees in the United States. Journal of Arboriculture. 28(4): 194 - 199. 9. Insect/disease proximity to study area was completed using the U.S. Forest Service's Forest Health Technology Enterprise Team (FHTET) database. Data includes distribution of pest by county FIPs code for 2004-2009. FHTET range maps are available at www.foresthealth.info for 2006-2010. 10. Kruse, James; Ambourn, Angie; Zogas, Ken 2007. Aspen Leaf Miner. Forest Health Protection leaflet. R10-PR-14. United States Department of Agriculture, Forest Service, Alaska Region. Can be accessed through: http://www.fs.fed.us/r10/spf/fhp/leaflets/aspen_leaf_miner.pdf 11. Northeastern Area State and Private Forestry. 2005. Asian Longhorned Beetle. Newtown Square, PA: U.S. Department of Agriculture, Northeastern Area State and Private Forestry. http://www.na.fs.fed.us/spfo/alb/ 12. Houston, David R.; O'Brien, James T. 1983. Beech Bark Disease. Forest Insect & Disease Leaflet 75. United States Department of Agriculture, Forest Service. 8 p. Can be accessed through: http://www.fs.fed.us/r6/nr/fid/fidls/fidl-75.pdf 13. Ostry, M.E.; Mielke, M.E.; Anderson, R.L. 1996. How to Identify Butternut Canker and Manage Butternut Trees. United States Department of Agriculture, Forest Service, North Central Forest Experiment Station. Can be accessed through: http://www.na.fs.fed.us/spfo/pubs/howtos/ht_but/ht_but.htm 14. Diller, Jesse D. 1965. Chestnut Blight. Forest Pest Leaflet 94. United States Department of Agriculture, Forest Service. 7 p. Can be accessed through: http://www.fs.fed.us/r6/nr/fid/fidls/fidl-94.pdf
31 | P a g e
15. Mielke, Manfred E.; Daughtrey, Margery L. How to Identify and Control Dogwood Anthracnose. NA-GR- United States Department of Agriculture, Forest Service, Northeastern Area. Can be accessed through: http://na.fs.fed.us/spfo/pubs/howtos/ht_dogwd/ht_dog.htm 16. Northeastern Area State and Private Forestry. 1998. HOW to identify and manage Dutch Elm Disease. NA-PR-07-98. Newtown Square, PA: U.S. Department of Agriculture, Forest Service, Northeastern Area State and Private Forestry. http://www.na.fs.fed.us/spfo/pubs/howtos/ht_ded/ht_ded.htm 17. Schmitz, Richard F.; Gibson, Kenneth E. 1996. Douglas-fir Beetle. Forest Insect & Disease Leaflet 5. R1-96-87. United States Department of Agriculture, Forest Service. 8 p. Can be accessed through: http://www.fs.fed.us/r6/nr/fid/fidls/fidl-5.pdf 18. Northeastern Area State and Private Forestry. 2005. Forest health protection emerald ash borer home. Newtown Square, PA: U.S. Department of Agriculture, Forest Service, Northeastern Area State and Private Forestry. http://www.na.fs.fed.us/spfo/eab/index.html 19. Ferrell, George T. 1986. Fir Engraver. Forest Insect & Disease Leaflet 13. United States Department of Agriculture, Forest Service. 8 p. Can be accessed through: http://www.fs.fed.us/r6/nr/fid/fidls/fidl-13.pdf 20. Phelps, W.R.; Czabator, F.L. 1978. Fusiform Rust of Southern Pines. Forest Insect & Disease Leaflet 26. United States Department of Agriculture, Forest Service. 7 p. Can be accessed through: http://www.fs.fed.us/r6/nr/fid/fidls/fidl-26.pdf 21. Northeastern Area State and Private Forestry. 2005. Gypsy moth digest. Newtown Square, PA: U.S. Department of Agriculture, Forest Service, Northeastern Area State and Private Forestry. http://na.fs.fed.us/fhp/gm 22. Society of American Foresters. Gold Spotted Oak Borer Hitches Ride in Firewood, Kills California Oaks. Forestry Source. October 2011 Vol. 16, No.10. 23. USDA Forest Service. 2005. Hemlock Woolly Adelgid. Pest Alert. NA-PR-09-05. United States Department of Agriculture, Forest Service, Northern Area State and Private Forestry. Can be accessed through: http://na.fs.fed.us/spfo/pubs/pest_al/hemlock/hwa05.htm 24. Smith, Sheri L.; Borys, Robert R.; Shea, Patrick J. 2009. Jeffrey Pine Beetle. Forest Insect & Disease Leaflet 11. United States Department of Agriculture, Forest Service. 8 p. Can be accessed through: http://www.fs.fed.us/r6/nr/fid/fidls/fidl-11.pdf 25. Ciesla, William M.; Kruse, James J. 2009. Large Aspen Tortrix. Forest Insect & Disease Leaflet 139. United States Department of Agriculture, Forest Service. 8 p. Can be accessed through: http://www.fs.fed.us/r6/nr/fid/fidls/fidl-139.pdf 26. Laurel Wilt. United States Department of Agriculture, Forest Service, Forest Health Protection, Southern Region. Can be accessed through: http://www.fs.fed.us/r8/foresthealth/laurelwilt/ 27. Gibson, Ken; Kegley, Sandy; Bentz, Barbara. 2009. Mountain Pine Beetle. Forest Insect & Disease Leaflet 2. United States Department of Agriculture, Forest Service. 12 p. Can be accessed through: http://www.fs.fed.us/r6/nr/fid/fidls/fidl-2.pdf 28. Burnside, R.E. et al. 2011. Northern Spruce Engraver. Forest Insect & Disease Leaflet 180. United States Department of Agriculture, Forest Service. 12 p. 29. Rexrode, Charles O.; Brown, H. Daniel 1983. Oak Wilt. Forest Insect & Disease Leaflet 29. United States Department of Agriculture, Forest Service. 6 p. Can be accessed through:
32 | P a g e
http://www.fs.fed.us/r6/nr/fid/fidls/fidl-29.pdf 30. Liebhold, A. 2010 draft. Geographical Distribution of Forest Pest Species in US. In: Frontiers in Ecology and the Environment. 31. Ciesla, William M. 2001. Tomicus piniperda. North American Forest Commission. Exotic Forest Pest Information System for North America (EXFOR). Can be accessed through: http://spfnic.fs.fed.us/exfor/data/pestreports.cfm?pestidval=86&langdisplay=english 32. Holsten, E.H.; Thier, R.W.; Munson, A.S.; Gibson, K.E. 1999. The Spruce Beetle. Forest Insect & Disease Leaflet 127. United States Department of Agriculture, Forest Service. 12 p. Can be accessed through: http://www.fs.fed.us/r6/nr/fid/fidls/fidl-127.pdf 33. Kucera, Daniel R.; Orr, Peter W. 1981. Spruce Budworm in the Eastern United States. Forest Pest Leaflet 160. United States Department of Agriculture, Forest Service. 8 p. Can be accessed through: http://www.fs.fed.us/r6/nr/fid/fidls/fidl-160.pdf 34. Kliejunas, John. 2005. Phytophthora ramorum. North American Forest Commission. Exotic Forest Pest Information System for North America (EXFOR). Can be accessed through: http://spfnic.fs.fed.us/exfor/data/pestreports.cfm?pestidval=62&langdisplay=english 35. Clarke, Stephen R.; Nowak, J.T. 2009. Southern Pine Beetle. Forest Insect & Disease Leaflet 49. United States Department of Agriculture, Forest Service. 8 p. Can be accessed through: http://www.fs.fed.us/r6/nr/fid/fidls/fidl-49.pdf 36. Haugen, Dennis A.; Hoebeke, Richard E. 2005. Sirex woodwasp - Sirex noctilio F. (Hymenoptera: Siricidae). Pest Alert. NA-PR-07-05. United States Department of Agriculture, Forest Service, Northern Area State and Private Forestry. Can be accessed through: http://na.fs.fed.us/spfo/pubs/pest_al/sirex_woodwasp/sirex_woodwasp.htm 37. Seybold, Steven ; Haugen, Dennis; Graves, Andrew. 2010. Thousand Cankers Disease-Pest Alert. NA-PR-02-10. Newtown Square, PA: U.S. Department of Agriculture, Forest Service, Northeastern Area State and Private Forestry. Cranshaw, W. and N. Tisserat. c. 2009. Walnut twig beetle and the thousand cankers disease of black walnut. Pest Alert. Colorado State University. http://www.ext.colostate.edu/pubs/insect/0812_alert.pdf 38. DeMars Jr., Clarence J.; Roettgering, Bruce H. 1982. Western Pine Beetle. Forest Insect & Disease Leaflet 1. United States Department of Agriculture, Forest Service. 8 p. Can be accessed through: http://www.fs.fed.us/r6/nr/fid/fidls/fidl-1.pdf 39. Nicholls, Thomas H.; Anderson, Robert L. 1977. How to Identify White Pine Blister Rust and Remove Cankers. United States Department of Agriculture, Forest Service, North Central Research Station. Can be accessed through: http://na.fs.fed.us/spfo/pubs/howtos/ht_wpblister/toc.htm 40. Fellin, David G.; Dewey, Jerald E. 1986. Western Spruce Budworm. Forest Insect & Disease Leaflet 53. United States Department of Agriculture, Forest Service. 10 p. Can be accessed through: http://www.fs.fed.us/r6/nr/fid/fidls/fidl-53.pdf 41. Nowak, D.J., and D.E. Crane. 2000. The Urban Forest Effects (UFORE) Model: quantifying urban forest structure and functions. In: Hansen, M. and T. Burk (Eds.) Integrated Tools for Natural Resources Inventories in the 21st Century. Proc. Of the IUFRO Conference. USDA Forest Service General Technical Report NC-212. North Central Research Station, St. Paul, MN. pp. 714-720. See also http://www.ufore.org
33 | P a g e
42. Nowak, D.J.; Crane, D.E.; Stevens, J.C.; Hoehn, R.E. 2005. The urban forest effects (UFORE) model: field data collection manual. V1b. Newtown Square, PA: U.S. Department of Agriculture, Forest Service, Northeastern Research Station, 34 p. http://www.fs.fed.us/ne/syracuse/Tools/downloads/UFORE_Manual.pdf 43. Nowak, D.J., R.E. Hoehn, D.E. Crane, J.C. Stevens, J.T. Walton, and J. Bond. 2008. A ground-based method of assessing urban forest structure and ecosystem services. Arboric. Urb. For. 34(6): 347-358. 44. Nowak, D.J. 1994. Atmospheric carbon dioxide reduction by Chicago's urban forest. In: McPherson, E.G.; Nowak, D.J.; Rowntree, R.A., eds. Chicago's urban forest ecosystem: results of the Chicago Urban Forest Climate Project. Gen. Tech. Rep. NE-186. Radnor, PA: U.S. Department of Agriculture, Forest Service, Northeastern Forest Experiment Station: 83-94. 45. Interagency Working Group on Social Cost of Carbon, United States Government. 2010 Technical Support Document: Social Cost of Carbon for Regulatory Impact Analysis Under Executive Order 12866. http://www.epa.gov/oms/climate/regulations/scc-tsd.pdf 46. Nowak, David J., Hoehn, R., and Crane, D. 2007. Oxygen production by urban trees in the United States. Arboriculture & Urban Forestry 33(3):220-226. 47. Baldocchi, D. 1988. A multi-layer model for estimating sulfur dioxide deposition to a deciduous oak forest canopy. Atmospheric Environment. 22: 869-884. 48. Baldocchi, D.D.; Hicks, B.B.; Camara, P. 1987. A canopy stomatal resistance model for gaseous deposition to vegetated surfaces. Atmospheric Environment. 21: 91-101. 49. Bidwell, R.G.S.; Fraser, D.E. 1972. Carbon monoxide uptake and metabolism by leaves. Canadian Journal of Botany. 50: 1435-1439. 50. Lovett, G.M. 1994. Atmospheric deposition of nutrients and pollutants in North America: an ecological perspective. Ecological Applications. 4: 629-650. 51. Zinke, P.J. 1967. Forest interception studies in the United States. In: Sopper, W.E.; Lull, H.W., eds. Forest Hydrology. Oxford, UK: Pergamon Press: 137-161. 52. Hirabayashi, S., C. Kroll, and D. Nowak. 2011. Component-based development and sensitivity analyses of an air pollutant dry deposition model. Environmental Modeling and Software 26(6): 804-816. 53. Hirabayashi, S., C. Kroll, and D. Nowak. 2012. i-Tree Eco Dry Deposition Model Descriptions V 1.0 54. Hirabayashi, S. 2011. Urban Forest Effects-Dry Deposition (UFORE-D) Model Enhancements, http://www.itreetools.org/eco/resources/UFORE-D enhancements.pdf 55. Davidson, K., A. Hallberg, D. McCubbin, and B. Hubbell. (2007). Analysis of PM2.5 Using the Environmental Benefits Mapping and Analysis Program (BenMAP). Journal of Toxicology and Environmental Health, Part A 70(3): 332-346. 56. Murray, F.J.; Marsh L.; Bradford, P.A. 1994. New York State Energy Plan, vol. II: issue reports. Albany, NY: New York State Energy Office. 57. U.S. Forest Service. Tree Guides. http://www.fs.fed.us/psw/programs/uesd/uep/tree_guides.php
McPherson, E.G., Simpson, J.R., Peper, P.J., Xiao, Q. 1999. Tree Guidelines for San Joaquin Valley Communities. Local Government Commission, Sacramento, CA.
34 | P a g e
McPherson, E.G., Simpson, J.R., Peper, P.J., Scott, K.I., Xiao, Q. 2000. Tree Guidelines for Coastal Southern California Communities. Local Government Commission, Sacramento, CA. McPherson, E.G., Simpson, J.R., Peper, P.J., Xiao, Q., Pittenger, D.R., Hodel, D.R.. 2001. Tree Guidelines for Inland Empire Communities. Local Government Commission, Sacramento, CA. McPherson, E.G., Maco, S.E., Simpson, J.R., Peper, P.J., Xiao, Q., VanDerZanden, A.M., Bell, N. 2002. Western Washington and Oregon Community Tree Guide: Benefits, Costs, and Strategic Planting. International Society of Arboriculture, Pacific Northwest, Silverton, OR. McPherson, E.G., Simpson, J.R., Peper, P.J., Xiao, Q., Maco, S.E., Hoefer, P.J. 2003. Northern Mountain and Prairie Community Tree Guide: Benefits, Costs and Strategic Planting. Center for Urban Forest Research, USDA Forest Service, Pacific Southwest Research Station, Albany, CA. McPherson, E.G., Simpson, J.R., Peper, P.J., Maco, S.E., Xiao Q., Mulrean, E. 2004. Desert Southwest Community Tree Guide: Benefits, Costs and Strategic Planting. Phoenix, AZ: Arizona Community Tree Council, Inc. 81 :81. McPherson, E.G., Simpson, J.R., Peper, P.J., Gardner, S.L., Vargas, K.E., Maco, S.E., Xiao, Q. 2006a. Coastal Plain Community Tree Guide: Benefits, Costs, and Strategic Planting PSW-GTR-201. USDA Forest Service, Pacific Southwest Research Station, Albany, CA. McPherson, E.G., Simpson, J.R., Peper, P.J., Maco, S.E., Gardner, S.L., Vargas, K.E., Xiao, Q. 2006b. Piedmont Community Tree Guide: Benefits, Costs, and Strategic Planting PSW-GTR 200. U.S. Department of Agriculture, Forest Service, Pacific Southwest Research Station, Albany, CA. McPherson, E.G., Simpson, J.R., Peper, P.J., Maco, S.E., Gardner, S.L., Cozad, S.K., Xiao, Q. 2006c. Midwest Community Tree Guide: Benefits, Costs and Strategic Planting PSW-GTR-199. U.S. Department of Agriculture, Forest Service, Pacific Southwest Research Station, Albany, CA. McPherson, E.G., Simpson, J.R., Peper, P.J., Gardner, S.L., Vargas, K.E., Xiao, Q. 2007. Northeast community tree guide: benefits, costs, and strategic planting. McPherson, E.G., Simpson, J.R., Peper, P.J., Crowell, A.M.N., Xiao, Q. 2010. Northern California coast community tree guide: benefits, costs, and strategic planting. PSW-GTR-228. Gen. Tech. Rep. PSW-GTR-228. U.S. Department of Agriculture, Forest Service, Pacific Southwest Research Station, Albany, CA. Peper, P.J., McPherson, E.G., Simpson, J.R., Vargas, K.E., Xiao Q. 2009. Lower Midwest community tree guide: benefits, costs, and strategic planting. PSW-GTR-219. Gen. Tech. Rep. PSW-GTR-219. U.S. Department of Agriculture, Forest Service, Pacific Southwest Research Station, Albany, CA. Peper, P.J., McPherson, E.G., Simpson, J.R., Albers, S.N., Xiao, Q. 2010. Central Florida community tree guide: benefits, costs, and strategic planting. Gen. Tech. Rep. PSW-GTR-230. U.S. Department of Agriculture, Forest Service, Pacific Southwest Research Station, Albany, CA. Vargas K.E., McPherson E.G., Simpson J.R., Peper P.J., Gardner S.L., Xiao Q. 2007a. Temperate Interior West Community Tree Guide: Benefits, Costs, and Strategic Planting. Vargas K.E., McPherson E.G., Simpson J.R., Peper P.J., Gardner S.L., Xiao Q. 2007b. Interior West Tree Guide. Vargas, K.E., McPherson, E.G., Simpson, J.R., Peper, P.J., Gardner, S.L., Xiao Q. 2008. Tropical community tree guide: benefits, costs, and strategic planting. PSW-GTR-216. Gen. Tech. Rep. PSW-GTR-216. U.S. Department of Agriculture, Forest Service, Pacific Southwest Research Station, Albany, CA.
35 | P a g e
58. Nowak, D.J.; Crane, D.E.; Stevens, J.C.; Ibarra, M. 2002. Brooklyn's Urban Forest. Gen. Tech. Rep. NE-290.
Newtown Square, PA: U.S. Department of Agriculture, Forest Service, Northeastern Research Station. 107 p. Council of Tree and Landscape Appraisers guidelines. For more information, see Nowak, D.J., D.E. Crane, and
J.F. Dwyer. 2002. Compensatory value of urban trees in the United States. J. Arboric. 28(4): 194-199.
59. Total city carbon emissions were based on 2003 U.S. per capita carbon emissions - calculated as total U.S. carbon emissions (Energy Information Administration, 2003, Emissions of Greenhouse Gases in the United States 2003. http://www.eia.doe.gov/oiaf/1605/ggrpt/) divided by 2003 U.S. total population (www.census.gov). Per capita emissions were multiplied by city population to estimate total city carbon emissions. 60. Average passenger automobile emissions per mile were based on dividing total 2002 pollutant emissions from light-duty gas vehicles (National Emission Trends http://www.epa.gov/ttn/chief/trends/index.html) divided by total miles driven in 2002 by passenger cars (National Transportation Statistics http://www.bts.gov/publications/national_transportation_statistics/2004/). Average annual passenger automobile emissions per vehicle were based on dividing total 2002 pollutant emissions from light-duty gas vehicles by total number of passenger cars in 2002 (National Transportation Statistics http://www.bts.gov/publications/national_transportation_statistics/2004/). Carbon dioxide emissions from automobile assumed six pounds of carbon per gallon of gasoline if energy costs of refinement and transportation are included (Graham, R.L., Wright, L.L., and Turhollow, A.F. 1992. The potential for short-rotation woody crops to reduce U.S. CO2 Emissions. Climatic Change 22:223-238. 61. Average household emissions based on average electricity kWh usage, natural gas Btu usage, fuel oil Btu usage, kerosene Btu usage, LPG Btu usage, and wood Btu usage per household from: Energy Information Administration. Total Energy Consumption in U.S. Households by Type of Housing Unit, 2001 http://www.eia.doe.gov/emeu/recs/contents.html. CO2, SO2, and NOx power plant emission per KWh from: U.S. Environmental Protection Agency. U.S. Power Plant Emissions Total by Year www.epa.gov/cleanenergy/egrid/samples.htm. CO emission per kWh assumes 1/3 of one percent of C emissions is CO based on: Energy Information Administration. 1994 Energy Use and Carbon Emissions: Non-OECD Countries DOE/EIA-0579. PM10 emission per kWh from: Layton, M. 2004. 2005 Electricity Environmental Performance Report: Electricity Generation and Air Emissions. California Energy Commission. http://www.energy.ca.gov/2005_energypolicy/documents/2004-11-15_workshop/2004-11-15_03-A_LAYTON.PDF CO2, NOx, SO2, PM10, and CO emission per Btu for natural gas, propane and butane (average used to represent LPG), Fuel #4 and #6 (average used to represent fuel oil and kerosene) from: Abraxas energy consulting, http://www.abraxasenergy.com/emissions/ CO2 and fine particle emissions per Btu of wood from: Houck, J.E. Tiegs, P.E, McCrillis, R.C. Keithley, C. and Crouch, J. 1998. Air emissions from residential heating: the wood heating option put into environmental perspective. In: Proceedings of U.S. EPA and Air Waste Management Association Conference: Living in a Global Environment, V.1: 373-384. CO, NOx and SOx emission per Btu based on total emissions and wood burning (tons) from: Residential Wood Burning Emissions in British Columbia, 2005. http://www.env.bc.ca/air/airquality/pdfs/wood_emissions.pdf. Emissions per dry ton of wood converted to emissions per Btu based on average dry weight per cord of wood and average Btu per cord from: Heating with Wood I. Species characteristics and volumes. http://ianrpubs.unl.edu/forestry/g881.htm
62. Nowak, D.J. 1995. Trees pollute? A "TREE" explains it all. In: Proceedings of the 7th National Urban Forestry Conference. Washington, DC: American Forests. Pp. 28-30
63. Nowak, D.J. 2000. The interactions between urban forests and global climate change. In: Abdollahi, K.K.,
Z.H. Ning, and A. Appeaning (Eds). Global Climate Change and the Urban Forest. Baton Rouge: GCRCC and Franklin Press. Pp. 31-44.