planning strategy impacts on housing opportunity · planning strategy impacts on housing ......
TRANSCRIPT

PLANNING STRATEGY IMPACTS ON HOUSING OPPORTUNITYGLEN EIRA CITY COUNCIL — OCTOBER 2017
CONTENTS
1. INTRODUCTION ........................................................................................................ 1
1.1 PURPOSE ........................................................................................................................................ 1
1.2 CONTEXT ..................................................................................................................................... 1
1.3 WHAT IS HOUSING OPPORTUNITY? ................................................................................ 2
2. HOUSING TARGETS .................................................................................................. 3
2.1 PLAN MELBOURNE DIRECTION FOR OUR REGION ................................................... 3
2.2 ESTIMATING GLEN EIRA’S HOUSING TARGETS ............................................................ 4
2.3 HOUSING OPPORTUNITY ASSESSEMENT BY HOUSING ID ...................................... 5
3. HOUSING OPPORTUNITY ANALYSIS .................................................................. 6
3.1 METHODOLOGY ....................................................................................................................... 6
3.2 DEVELOPABLE LAND ASSESSMENT .................................................................................... 8
3.3 HOUSING DENSITY ASSESSMENT ..................................................................................... 10
3.4 HOUSING OPPORTUNITY PROJECTIONS ..................................................................... 13
3.5 COMPARISON OF PROJECTIONS ...................................................................................... 17
4. SUMMARY OF KEY FINDINGS ............................................................................... 18
APPENDICES ............................................................................................................. 20
APPENDIX A – DEVELOPABLE LAND MAPPING AND DATA
APPENDIX B – PERMIT ACTIVITY EXAMPLES
APPENDIX C – PROJECTION CALCULATIONS
GLEN EIRA CITY COUNCIL
REPORT: PLANNING STRATEGY
IMPACTS ON HOUSING OPPORTUNITY PAGE 1 October 2017
1. INTRODUCTION
1.1 PURPOSE
This report provides a preliminary analysis of how alternative planning outcomes may impact the
delivery of new housing in the City of Glen Eira.
The report analyses:
Expected Housing targets.
Housing Opportunity outcomes based on current planning policy.
Housing Opportunity outcomes based on a range of alternative planning policy scenarios,
including implementation of new Structure Plan and Quality Design Guidelines
recommendations.
An assessment of how each scenario ‘stacks up’ to deliver on expected housing targets.
1.2 CONTEXT
Council is required to review its Planning Scheme on a regular basis. Council adopted the Glen Eira
Planning Scheme Review at a Council Meeting on Tuesday 9 August 2016, which included a work
plan to improve planning outcomes across the municipality. The work plan was formed based on
feedback from community engagement, meetings and written submissions throughout 2016.
Key strategic projects have been undertaken to meet the objectives of the work plan, including the
preparation of draft structure plans for key activity centres and the design guidelines to improve
built form outcomes through the planning process. This includes up to date at October 2017:
Structure Plans for Bentleigh, Carnegie, East Village and Elsternwick; and
Quality Design Guidelines.
These projects will impact on planning strategies across the municipality, and ultimately affect the
level of development and foreseeable opportunity for housing in the coming years.
This report provides some background regarding preliminary strategic considerations.
GLEN EIRA CITY COUNCIL
REPORT: PLANNING STRATEGY
IMPACTS ON HOUSING OPPORTUNITY PAGE 2 October 2017
1.3 WHAT IS HOUSING OPPORTUNITY?
Housing Opportunity assesses housing supply in a way that is linked to location attractiveness and
likely development uptake. It attempts to quantify how land will be developed in a realistic way for
the foreseeable medium-term.
Housing Opportunity differs from Housing Capacity in that:
Not all land is likely to be developed (for example, existing strata titled units or land that has
recently been developed are examples of land that is unlikely to be developed);
Not all land will be developed to its maximum capacity;
Some areas will experience higher levels of development based on their relative
attractiveness, which affects market demand (development uptake is not exclusively linked
to the spatial distribution of land or zoning – i.e. just because something is zoned for a
specific residential purpose doesn’t mean people will build/purchase new housing there:
development trends respond to demand from people who would like to live in an area).
Council should seek to demonstrate adequate Housing Opportunity to ensure that expected
housing targets will be met.
GLEN EIRA CITY COUNCIL
REPORT: PLANNING STRATEGY
IMPACTS ON HOUSING OPPORTUNITY PAGE 3 October 2017
2. HOUSING TARGETS
2.1 PLAN MELBOURNE DIRECTION FOR OUR REGION
Plan Melbourne is the metropolitan planning strategy that
defines the future shape of Melbourne over the next 35 years.
The plan sets a clear direction for housing growth including
housing distribution targets for regions across the broader
metropolitan area.
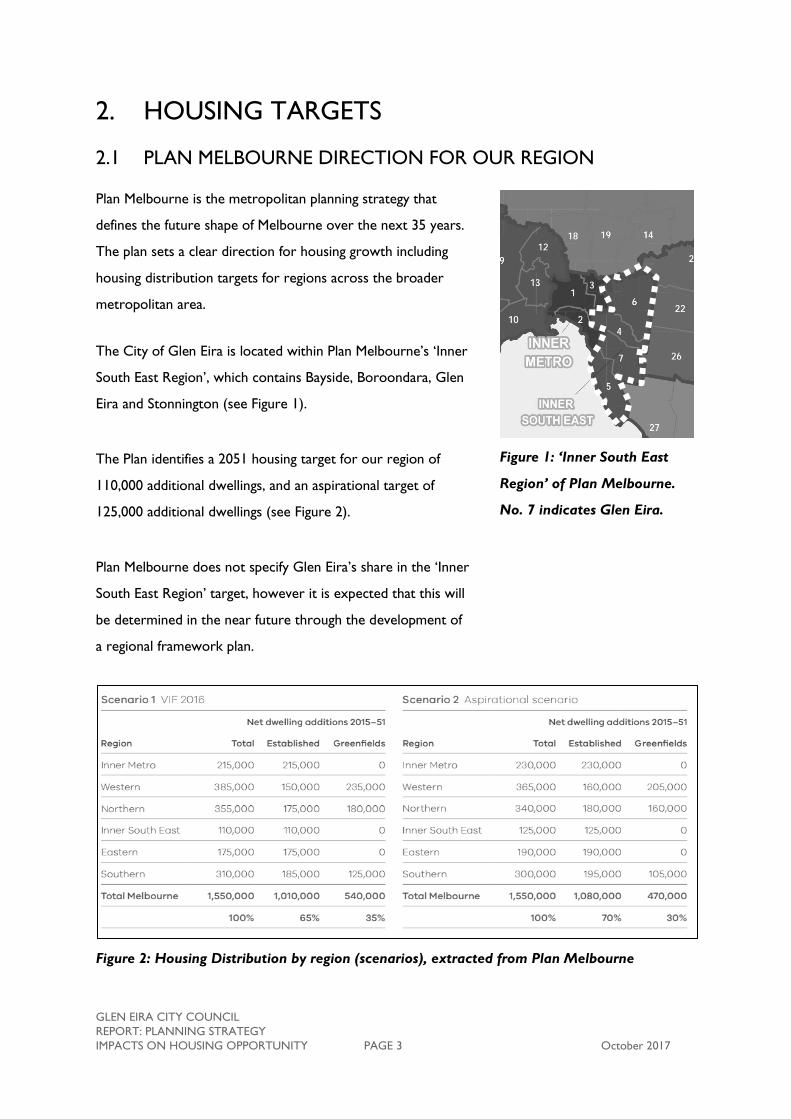
The City of Glen Eira is located within Plan Melbourne’s ‘Inner
South East Region’, which contains Bayside, Boroondara, Glen
Eira and Stonnington (see Figure 1).
The Plan identifies a 2051 housing target for our region of
110,000 additional dwellings, and an aspirational target of
125,000 additional dwellings (see Figure 2).
Plan Melbourne does not specify Glen Eira’s share in the ‘Inner
South East Region’ target, however it is expected that this will
be determined in the near future through the development of
a regional framework plan.
Figure 1: ‘Inner South East
Region’ of Plan Melbourne.
No. 7 indicates Glen Eira.
Figure 2: Housing Distribution by region (scenarios), extracted from Plan Melbourne
GLEN EIRA CITY COUNCIL
REPORT: PLANNING STRATEGY
IMPACTS ON HOUSING OPPORTUNITY PAGE 4 October 2017
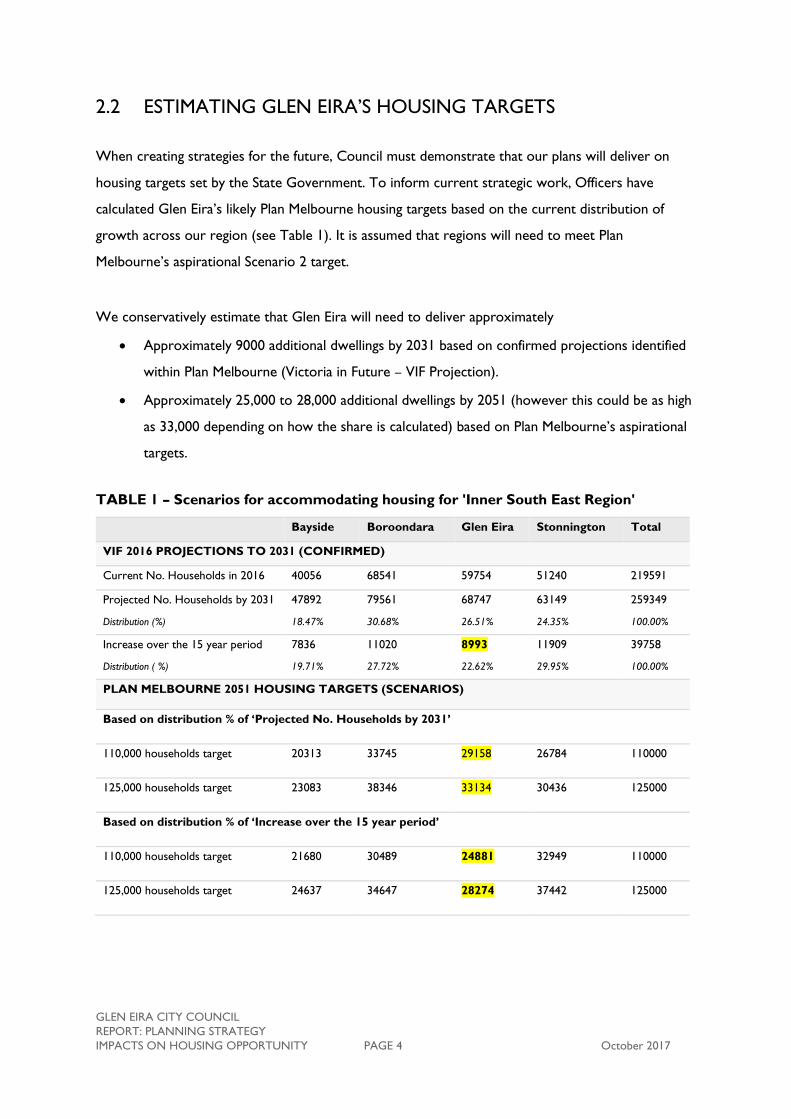
2.2 ESTIMATING GLEN EIRA’S HOUSING TARGETS
When creating strategies for the future, Council must demonstrate that our plans will deliver on
housing targets set by the State Government. To inform current strategic work, Officers have
calculated Glen Eira’s likely Plan Melbourne housing targets based on the current distribution of
growth across our region (see Table 1). It is assumed that regions will need to meet Plan
Melbourne’s aspirational Scenario 2 target.
We conservatively estimate that Glen Eira will need to deliver approximately
Approximately 9000 additional dwellings by 2031 based on confirmed projections identified
within Plan Melbourne (Victoria in Future – VIF Projection).
Approximately 25,000 to 28,000 additional dwellings by 2051 (however this could be as high
as 33,000 depending on how the share is calculated) based on Plan Melbourne’s aspirational
targets.
TABLE 1 – Scenarios for accommodating housing for 'Inner South East Region'
Bayside Boroondara Glen Eira Stonnington Total
VIF 2016 PROJECTIONS TO 2031 (CONFIRMED)
Current No. Households in 2016 40056 68541 59754 51240 219591
Projected No. Households by 2031 47892 79561 68747 63149 259349
Distribution (%) 18.47% 30.68% 26.51% 24.35% 100.00%
Increase over the 15 year period 7836 11020 8993 11909 39758
Distribution ( %) 19.71% 27.72% 22.62% 29.95% 100.00%
PLAN MELBOURNE 2051 HOUSING TARGETS (SCENARIOS)
Based on distribution % of ‘Projected No. Households by 2031’
110,000 households target 20313 33745 29158 26784 110000
125,000 households target 23083 38346 33134 30436 125000
Based on distribution % of ‘Increase over the 15 year period’
110,000 households target 21680 30489 24881 32949 110000
125,000 households target 24637 34647 28274 37442 125000
GLEN EIRA CITY COUNCIL
REPORT: PLANNING STRATEGY
IMPACTS ON HOUSING OPPORTUNITY PAGE 5 October 2017
2.3 HOUSING OPPORTUNITY ASSESSEMENT BY HOUSING ID
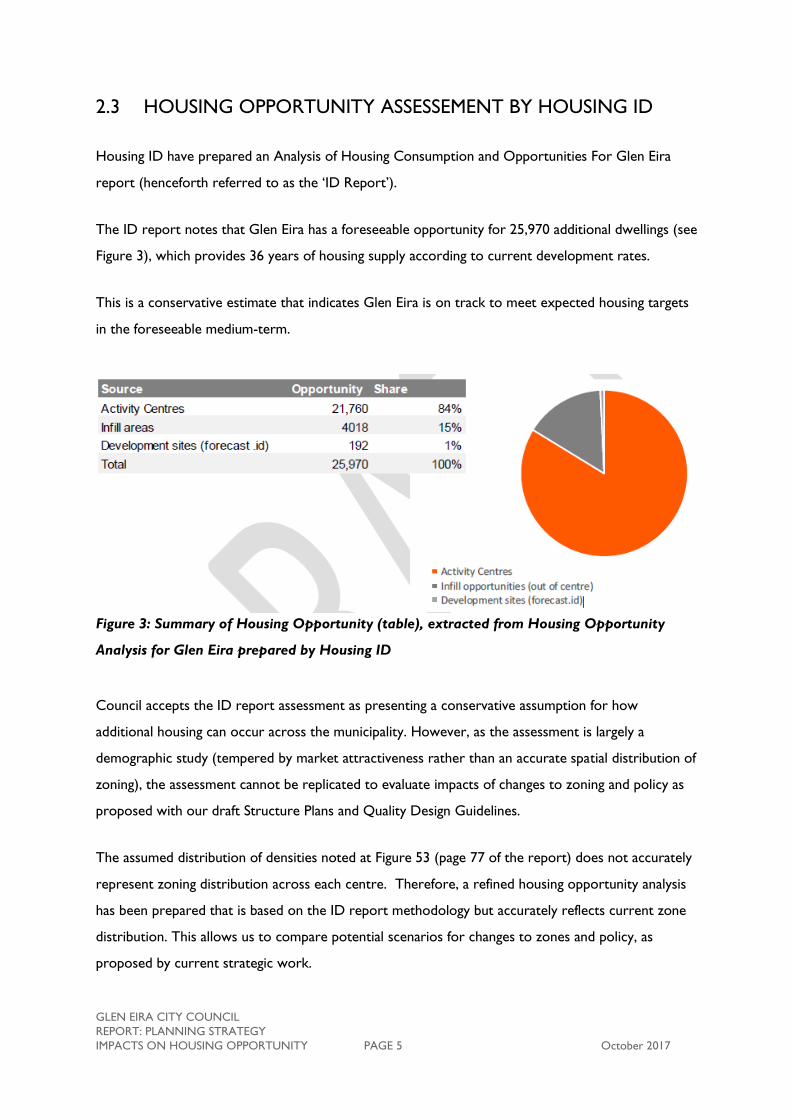
Housing ID have prepared an Analysis of Housing Consumption and Opportunities For Glen Eira
report (henceforth referred to as the ‘ID Report’).
The ID report notes that Glen Eira has a foreseeable opportunity for 25,970 additional dwellings (see
Figure 3), which provides 36 years of housing supply according to current development rates.
This is a conservative estimate that indicates Glen Eira is on track to meet expected housing targets
in the foreseeable medium-term.
Figure 3: Summary of Housing Opportunity (table), extracted from Housing Opportunity
Analysis for Glen Eira prepared by Housing ID
Council accepts the ID report assessment as presenting a conservative assumption for how
additional housing can occur across the municipality. However, as the assessment is largely a
demographic study (tempered by market attractiveness rather than an accurate spatial distribution of
zoning), the assessment cannot be replicated to evaluate impacts of changes to zoning and policy as
proposed with our draft Structure Plans and Quality Design Guidelines.
The assumed distribution of densities noted at Figure 53 (page 77 of the report) does not accurately
represent zoning distribution across each centre. Therefore, a refined housing opportunity analysis
has been prepared that is based on the ID report methodology but accurately reflects current zone
distribution. This allows us to compare potential scenarios for changes to zones and policy, as
proposed by current strategic work.
GLEN EIRA CITY COUNCIL
REPORT: PLANNING STRATEGY
IMPACTS ON HOUSING OPPORTUNITY PAGE 6 October 2017
3. HOUSING OPPORTUNITY ANALYSIS
3.1 METHODOLOGY
SCENARIO COMPARISON
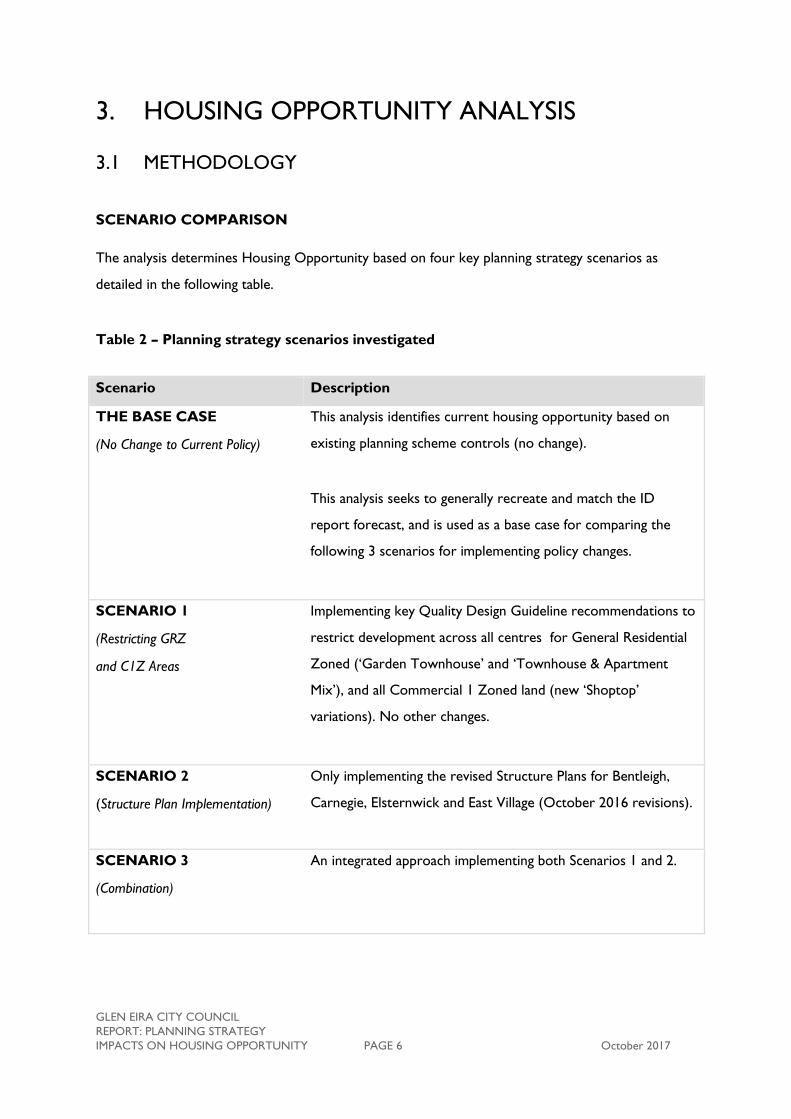
The analysis determines Housing Opportunity based on four key planning strategy scenarios as
detailed in the following table.
Table 2 – Planning strategy scenarios investigated
Scenario Description
THE BASE CASE
(No Change to Current Policy)
This analysis identifies current housing opportunity based on
existing planning scheme controls (no change).
This analysis seeks to generally recreate and match the ID
report forecast, and is used as a base case for comparing the
following 3 scenarios for implementing policy changes.
SCENARIO 1
(Restricting GRZ
and C1Z Areas
Implementing key Quality Design Guideline recommendations to
restrict development across all centres for General Residential
Zoned (‘Garden Townhouse’ and ‘Townhouse & Apartment
Mix’), and all Commercial 1 Zoned land (new ‘Shoptop’
variations). No other changes.
SCENARIO 2
(Structure Plan Implementation)
Only implementing the revised Structure Plans for Bentleigh,
Carnegie, Elsternwick and East Village (October 2016 revisions).
SCENARIO 3
(Combination)
An integrated approach implementing both Scenarios 1 and 2.
GLEN EIRA CITY COUNCIL
REPORT: PLANNING STRATEGY
IMPACTS ON HOUSING OPPORTUNITY PAGE 7 October 2017
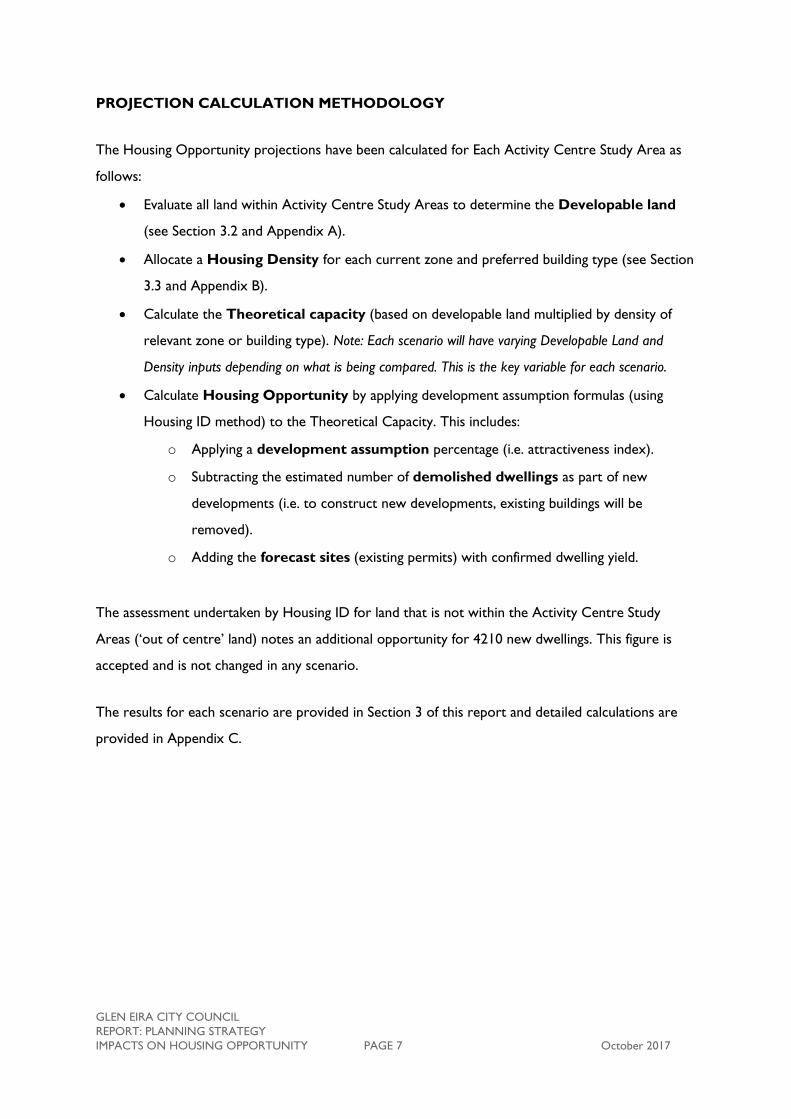
PROJECTION CALCULATION METHODOLOGY
The Housing Opportunity projections have been calculated for Each Activity Centre Study Area as
follows:
Evaluate all land within Activity Centre Study Areas to determine the Developable land
(see Section 3.2 and Appendix A).
Allocate a Housing Density for each current zone and preferred building type (see Section
3.3 and Appendix B).
Calculate the Theoretical capacity (based on developable land multiplied by density of
relevant zone or building type). Note: Each scenario will have varying Developable Land and
Density inputs depending on what is being compared. This is the key variable for each scenario.
Calculate Housing Opportunity by applying development assumption formulas (using
Housing ID method) to the Theoretical Capacity. This includes:
o Applying a development assumption percentage (i.e. attractiveness index).
o Subtracting the estimated number of demolished dwellings as part of new
developments (i.e. to construct new developments, existing buildings will be
removed).
o Adding the forecast sites (existing permits) with confirmed dwelling yield.
The assessment undertaken by Housing ID for land that is not within the Activity Centre Study
Areas (‘out of centre’ land) notes an additional opportunity for 4210 new dwellings. This figure is
accepted and is not changed in any scenario.
The results for each scenario are provided in Section 3 of this report and detailed calculations are
provided in Appendix C.
GLEN EIRA CITY COUNCIL
REPORT: PLANNING STRATEGY
IMPACTS ON HOUSING OPPORTUNITY PAGE 8 October 2017
3.2 DEVELOPABLE LAND ASSESSMENT
Developable land represents land that with expected potential to generate additional dwellings in
Glen Eira’s activity centre study areas. Developable land for this assessment includes a combination
of: Land with expected development opportunity, and strategic uplift areas. Developable land is used
as the base layer for spacial analysis and assessing Housing Opportunity. A detailed breakdown of
developable land (including mapping) is provided in Appendix A and the broad methodology for
ascertaining those figures is noted below.
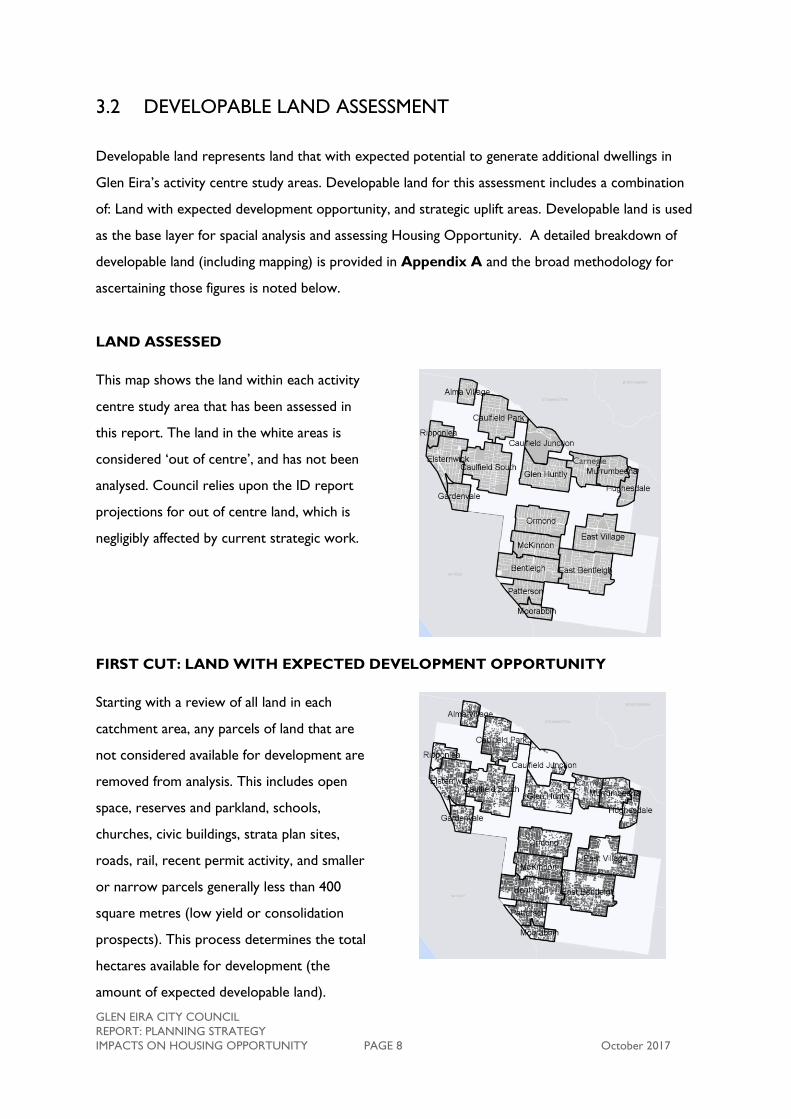
LAND ASSESSED
This map shows the land within each activity
centre study area that has been assessed in
this report. The land in the white areas is
considered ‘out of centre’, and has not been
analysed. Council relies upon the ID report
projections for out of centre land, which is
negligibly affected by current strategic work.
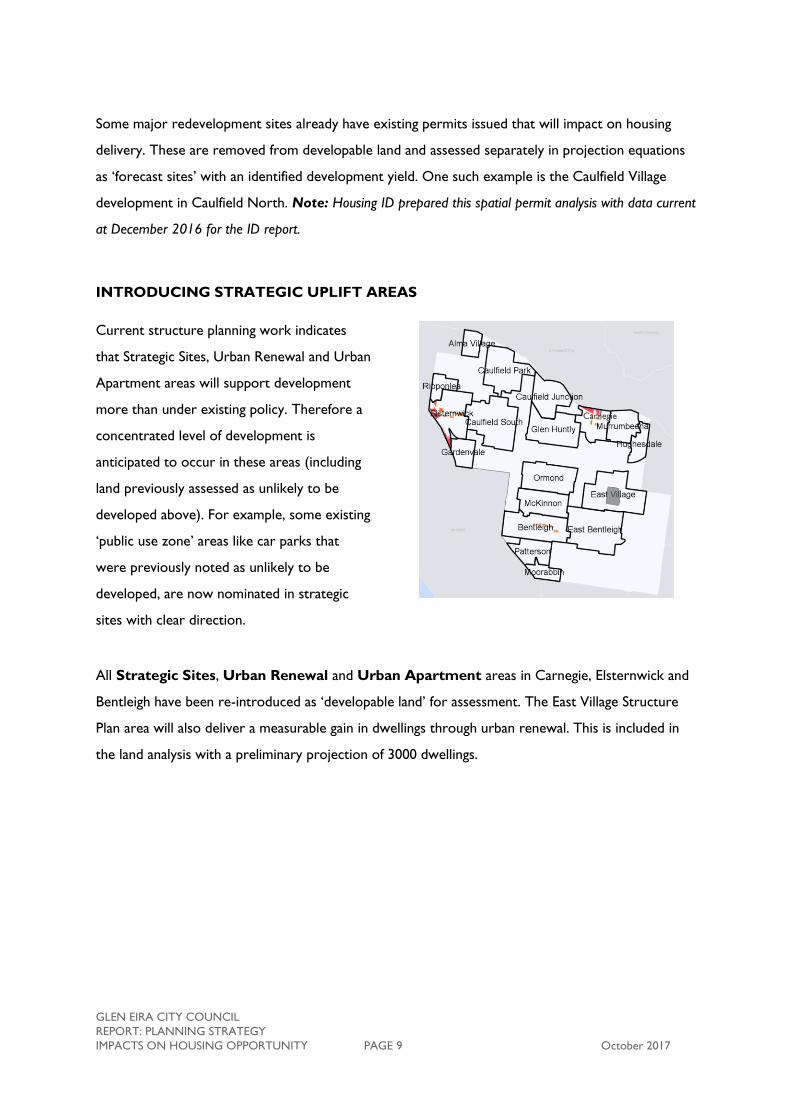
FIRST CUT: LAND WITH EXPECTED DEVELOPMENT OPPORTUNITY
Starting with a review of all land in each
catchment area, any parcels of land that are
not considered available for development are
removed from analysis. This includes open
space, reserves and parkland, schools,
churches, civic buildings, strata plan sites,
roads, rail, recent permit activity, and smaller
or narrow parcels generally less than 400
square metres (low yield or consolidation
prospects). This process determines the total
hectares available for development (the
amount of expected developable land).
Carnegie
Carnegie
GLEN EIRA CITY COUNCIL
REPORT: PLANNING STRATEGY
IMPACTS ON HOUSING OPPORTUNITY PAGE 9 October 2017
Some major redevelopment sites already have existing permits issued that will impact on housing
delivery. These are removed from developable land and assessed separately in projection equations
as ‘forecast sites’ with an identified development yield. One such example is the Caulfield Village
development in Caulfield North. Note: Housing ID prepared this spatial permit analysis with data current
at December 2016 for the ID report.
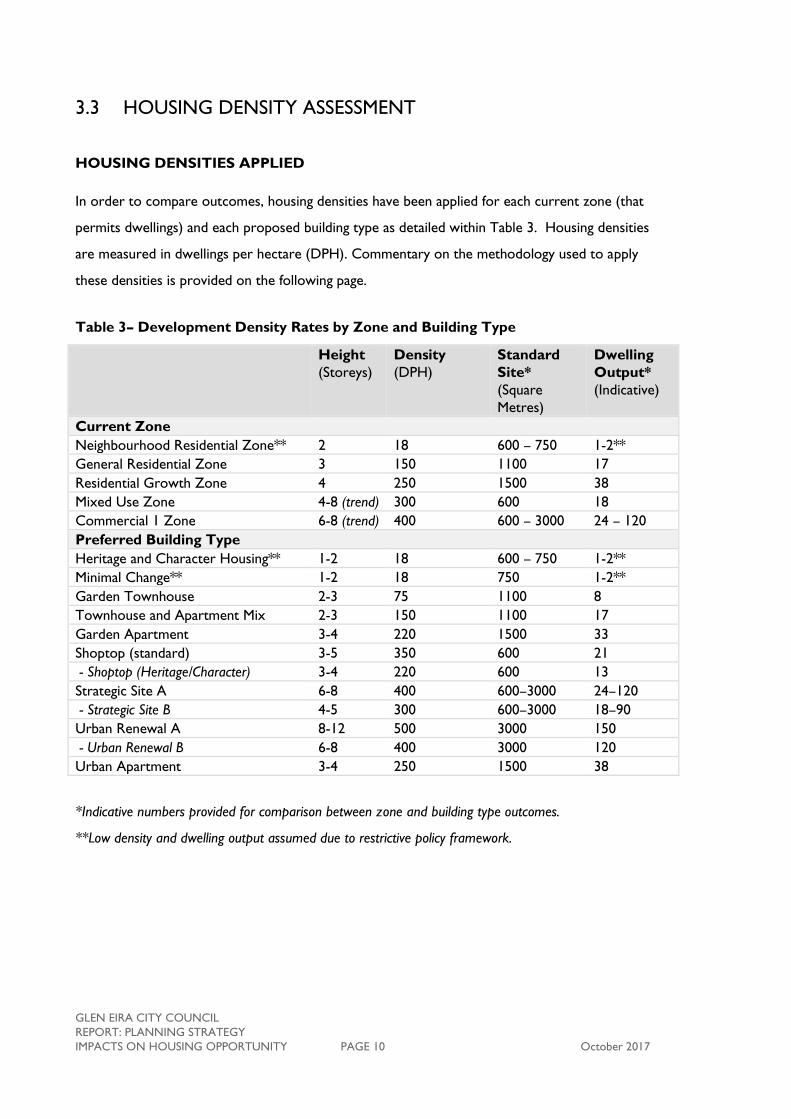
INTRODUCING STRATEGIC UPLIFT AREAS
Current structure planning work indicates
that Strategic Sites, Urban Renewal and Urban
Apartment areas will support development
more than under existing policy. Therefore a
concentrated level of development is
anticipated to occur in these areas (including
land previously assessed as unlikely to be
developed above). For example, some existing
‘public use zone’ areas like car parks that
were previously noted as unlikely to be
developed, are now nominated in strategic
sites with clear direction.
All Strategic Sites, Urban Renewal and Urban Apartment areas in Carnegie, Elsternwick and
Bentleigh have been re-introduced as ‘developable land’ for assessment. The East Village Structure
Plan area will also deliver a measurable gain in dwellings through urban renewal. This is included in
the land analysis with a preliminary projection of 3000 dwellings.
Carnegie
GLEN EIRA CITY COUNCIL
REPORT: PLANNING STRATEGY
IMPACTS ON HOUSING OPPORTUNITY PAGE 10 October 2017
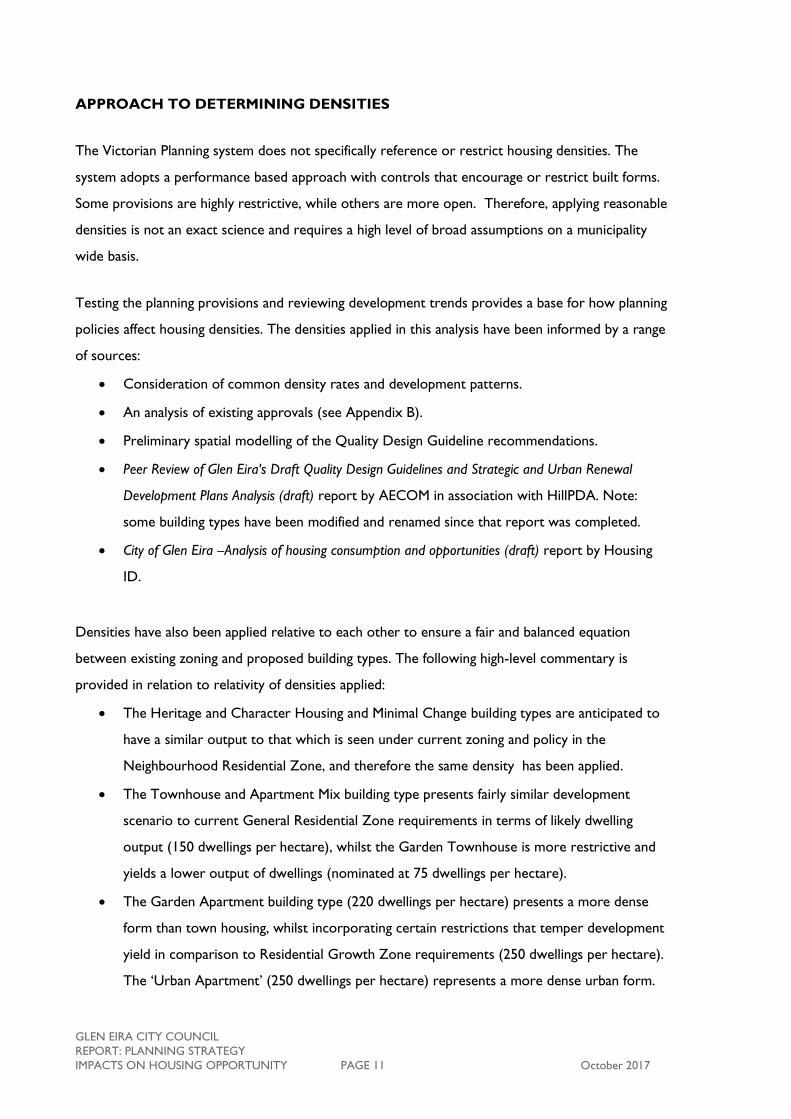
3.3 HOUSING DENSITY ASSESSMENT
HOUSING DENSITIES APPLIED
In order to compare outcomes, housing densities have been applied for each current zone (that
permits dwellings) and each proposed building type as detailed within Table 3. Housing densities
are measured in dwellings per hectare (DPH). Commentary on the methodology used to apply
these densities is provided on the following page.
Table 3– Development Density Rates by Zone and Building Type
Height
(Storeys)
Density
(DPH)
Standard
Site*
(Square
Metres)
Dwelling
Output*
(Indicative)
Current Zone
Neighbourhood Residential Zone** 2 18 600 – 750 1-2**
General Residential Zone 3 150 1100 17
Residential Growth Zone 4 250 1500 38
Mixed Use Zone 4-8 (trend) 300 600 18
Commercial 1 Zone 6-8 (trend) 400 600 – 3000 24 – 120
Preferred Building Type
Heritage and Character Housing** 1-2 18 600 – 750 1-2**
Minimal Change** 1-2 18 750 1-2**
Garden Townhouse 2-3 75 1100 8
Townhouse and Apartment Mix 2-3 150 1100 17
Garden Apartment 3-4 220 1500 33
Shoptop (standard) 3-5 350 600 21
- Shoptop (Heritage/Character) 3-4 220 600 13
Strategic Site A 6-8 400 600–3000 24–120
- Strategic Site B 4-5 300 600–3000 18–90
Urban Renewal A 8-12 500 3000 150
- Urban Renewal B 6-8 400 3000 120
Urban Apartment 3-4 250 1500 38
*Indicative numbers provided for comparison between zone and building type outcomes.
**Low density and dwelling output assumed due to restrictive policy framework.
GLEN EIRA CITY COUNCIL
REPORT: PLANNING STRATEGY
IMPACTS ON HOUSING OPPORTUNITY PAGE 11 October 2017
APPROACH TO DETERMINING DENSITIES
The Victorian Planning system does not specifically reference or restrict housing densities. The
system adopts a performance based approach with controls that encourage or restrict built forms.
Some provisions are highly restrictive, while others are more open. Therefore, applying reasonable
densities is not an exact science and requires a high level of broad assumptions on a municipality
wide basis.
Testing the planning provisions and reviewing development trends provides a base for how planning
policies affect housing densities. The densities applied in this analysis have been informed by a range
of sources:
Consideration of common density rates and development patterns.
An analysis of existing approvals (see Appendix B).
Preliminary spatial modelling of the Quality Design Guideline recommendations.
Peer Review of Glen Eira's Draft Quality Design Guidelines and Strategic and Urban Renewal
Development Plans Analysis (draft) report by AECOM in association with HillPDA. Note:
some building types have been modified and renamed since that report was completed.
City of Glen Eira –Analysis of housing consumption and opportunities (draft) report by Housing
ID.
Densities have also been applied relative to each other to ensure a fair and balanced equation
between existing zoning and proposed building types. The following high-level commentary is
provided in relation to relativity of densities applied:
The Heritage and Character Housing and Minimal Change building types are anticipated to
have a similar output to that which is seen under current zoning and policy in the
Neighbourhood Residential Zone, and therefore the same density has been applied.
The Townhouse and Apartment Mix building type presents fairly similar development
scenario to current General Residential Zone requirements in terms of likely dwelling
output (150 dwellings per hectare), whilst the Garden Townhouse is more restrictive and
yields a lower output of dwellings (nominated at 75 dwellings per hectare).
The Garden Apartment building type (220 dwellings per hectare) presents a more dense
form than town housing, whilst incorporating certain restrictions that temper development
yield in comparison to Residential Growth Zone requirements (250 dwellings per hectare).
The ‘Urban Apartment’ (250 dwellings per hectare) represents a more dense urban form.
GLEN EIRA CITY COUNCIL
REPORT: PLANNING STRATEGY
IMPACTS ON HOUSING OPPORTUNITY PAGE 12 October 2017
Strategic Site A and Urban Renewal A and B building types (400-500 dwellings per hectare)
represent development at the higher end of current Commercial 1 Zoning trends, with the
premise that these building types will be taller, but have an improved built form and will be
applied in the most suitable locations for this form of development.
Strategic Site B and Shoptop building types (220–350 dwellings per hectare) represent
development closer to the lower density end of development currently seen in the
Commercial 1 zone, with the premise that these will have an improved built form and be
applied in preferred lower scale and transitional contexts.
Densities can vary from site-to-site and area-to-area. In this analysis, with exception of restrictive
two-storey zones and building types, densities have generally been applied at the higher end of the
density spectrum and will be tempered in the modelling through the ‘development assumption’
percentage (attractiveness index), which benchmarks different areas relative to each other. For
example, commercial areas might receive more development and density in areas like Carnegie,
which has better access to public transport, than areas like Alma Village.
GLEN EIRA CITY COUNCIL
REPORT: PLANNING STRATEGY
IMPACTS ON HOUSING OPPORTUNITY PAGE 13 October 2017
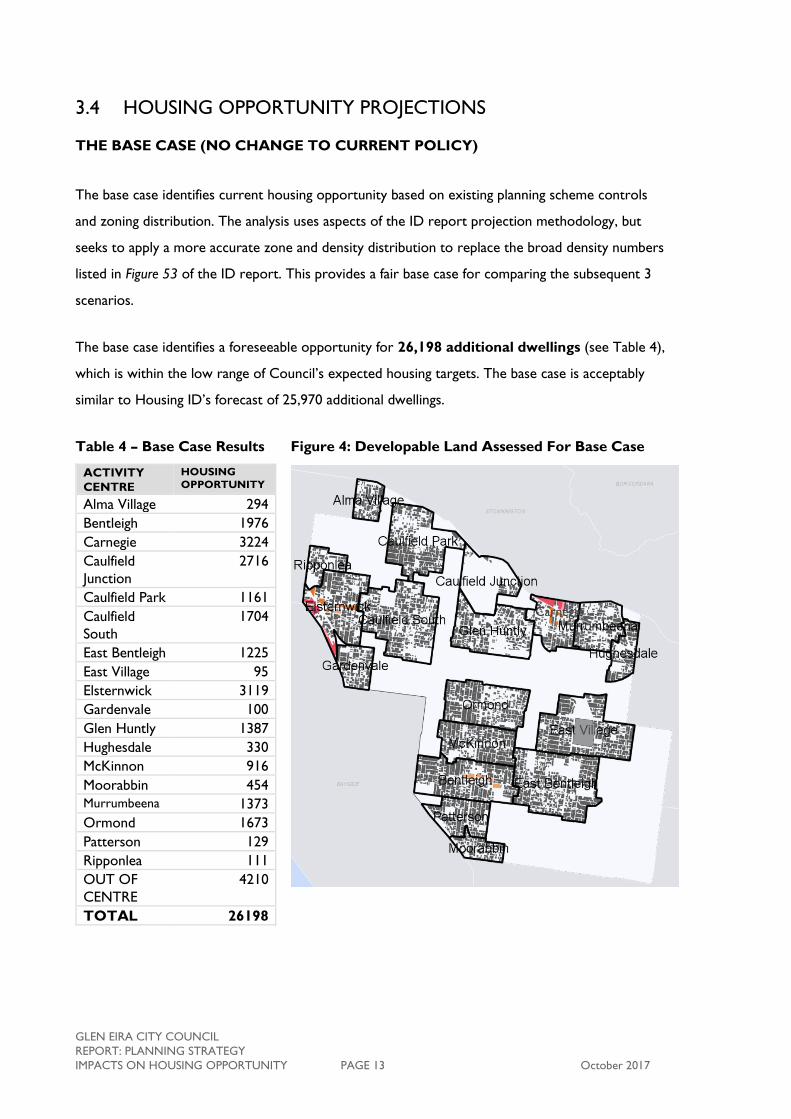
3.4 HOUSING OPPORTUNITY PROJECTIONS
THE BASE CASE (NO CHANGE TO CURRENT POLICY)
The base case identifies current housing opportunity based on existing planning scheme controls
and zoning distribution. The analysis uses aspects of the ID report projection methodology, but
seeks to apply a more accurate zone and density distribution to replace the broad density numbers
listed in Figure 53 of the ID report. This provides a fair base case for comparing the subsequent 3
scenarios.
The base case identifies a foreseeable opportunity for 26,198 additional dwellings (see Table 4),
which is within the low range of Council’s expected housing targets. The base case is acceptably
similar to Housing ID’s forecast of 25,970 additional dwellings.
Table 4 – Base Case Results
ACTIVITY
CENTRE
HOUSING
OPPORTUNITY
Alma Village 294
Bentleigh 1976
Carnegie 3224
Caulfield
Junction
2716
Caulfield Park 1161
Caulfield
South
1704
East Bentleigh 1225
East Village 95
Elsternwick 3119
Gardenvale 100
Glen Huntly 1387
Hughesdale 330
McKinnon 916
Moorabbin 454
Murrumbeena 1373
Ormond 1673
Patterson 129
Ripponlea 111
OUT OF
CENTRE
4210
TOTAL 26198
Figure 4: Developable Land Assessed For Base Case
Carnegie
GLEN EIRA CITY COUNCIL
REPORT: PLANNING STRATEGY
IMPACTS ON HOUSING OPPORTUNITY PAGE 14 October 2017
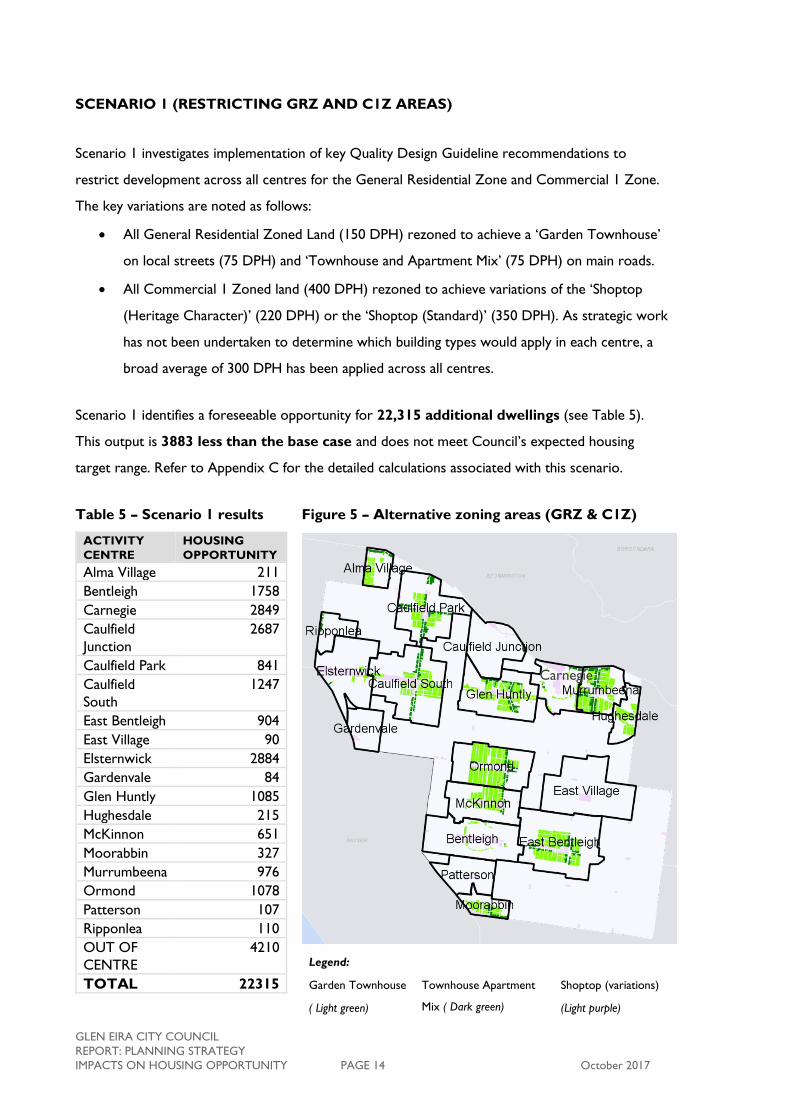
SCENARIO 1 (RESTRICTING GRZ AND C1Z AREAS)
Scenario 1 investigates implementation of key Quality Design Guideline recommendations to
restrict development across all centres for the General Residential Zone and Commercial 1 Zone.
The key variations are noted as follows:
All General Residential Zoned Land (150 DPH) rezoned to achieve a ‘Garden Townhouse’
on local streets (75 DPH) and ‘Townhouse and Apartment Mix’ (75 DPH) on main roads.
All Commercial 1 Zoned land (400 DPH) rezoned to achieve variations of the ‘Shoptop
(Heritage Character)’ (220 DPH) or the ‘Shoptop (Standard)’ (350 DPH). As strategic work
has not been undertaken to determine which building types would apply in each centre, a
broad average of 300 DPH has been applied across all centres.
Scenario 1 identifies a foreseeable opportunity for 22,315 additional dwellings (see Table 5).
This output is 3883 less than the base case and does not meet Council’s expected housing
target range. Refer to Appendix C for the detailed calculations associated with this scenario.
Table 5 – Scenario 1 results
ACTIVITY
CENTRE
HOUSING
OPPORTUNITY
Alma Village 211
Bentleigh 1758
Carnegie 2849
Caulfield
Junction
2687
Caulfield Park 841
Caulfield
South
1247
East Bentleigh 904
East Village 90
Elsternwick 2884
Gardenvale 84
Glen Huntly 1085
Hughesdale 215
McKinnon 651
Moorabbin 327
Murrumbeena 976
Ormond 1078
Patterson 107
Ripponlea 110
OUT OF
CENTRE
4210
TOTAL 22315
Figure 5 – Alternative zoning areas (GRZ & C1Z)
Legend:
Garden Townhouse
( Light green)
Townhouse Apartment
Mix ( Dark green)
Shoptop (variations)
(Light purple)
Carnegie
GLEN EIRA CITY COUNCIL
REPORT: PLANNING STRATEGY
IMPACTS ON HOUSING OPPORTUNITY PAGE 15 October 2017
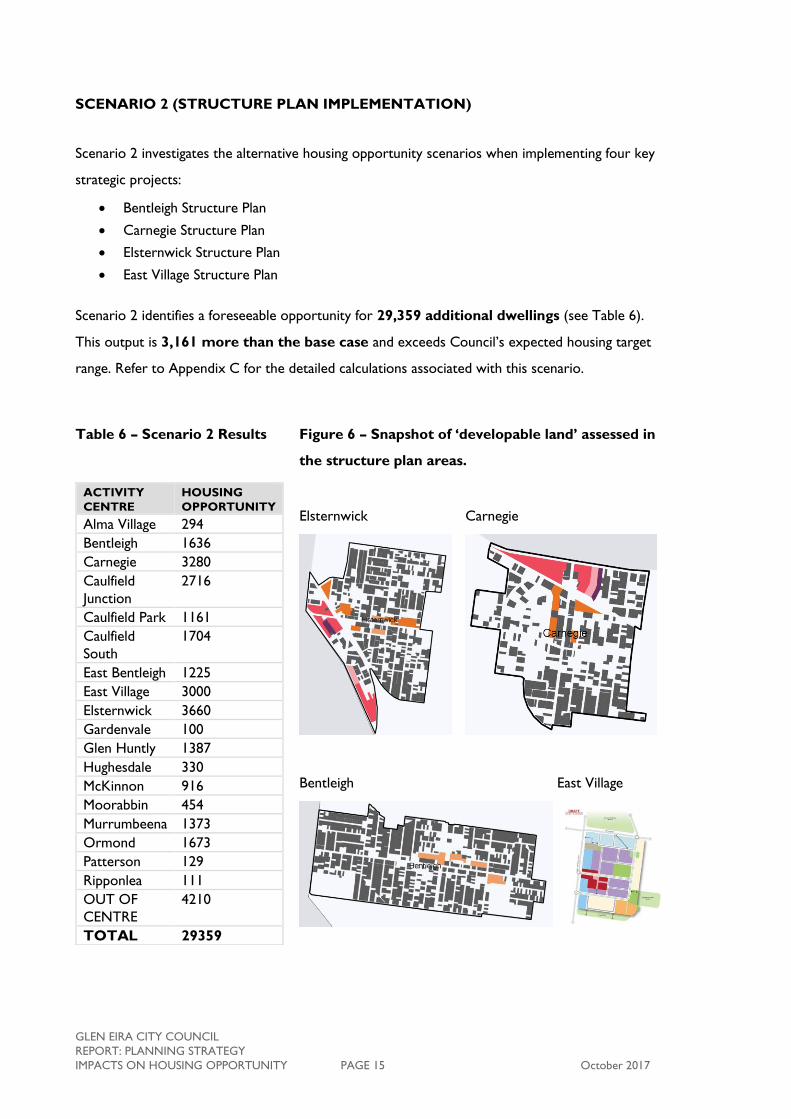
SCENARIO 2 (STRUCTURE PLAN IMPLEMENTATION)
Scenario 2 investigates the alternative housing opportunity scenarios when implementing four key
strategic projects:
Bentleigh Structure Plan
Carnegie Structure Plan
Elsternwick Structure Plan
East Village Structure Plan
Scenario 2 identifies a foreseeable opportunity for 29,359 additional dwellings (see Table 6).
This output is 3,161 more than the base case and exceeds Council’s expected housing target
range. Refer to Appendix C for the detailed calculations associated with this scenario.
Table 6 – Scenario 2 Results
ACTIVITY
CENTRE
HOUSING
OPPORTUNITY
Alma Village 294
Bentleigh 1636
Carnegie 3280
Caulfield
Junction
2716
Caulfield Park 1161
Caulfield
South
1704
East Bentleigh 1225
East Village 3000
Elsternwick 3660
Gardenvale 100
Glen Huntly 1387
Hughesdale 330
McKinnon 916
Moorabbin 454
Murrumbeena 1373
Ormond 1673
Patterson 129
Ripponlea 111
OUT OF
CENTRE
4210
TOTAL 29359
Figure 6 – Snapshot of ‘developable land’ assessed in
the structure plan areas.
Elsternwick Carnegie
Bentleigh East Village
GLEN EIRA CITY COUNCIL
REPORT: PLANNING STRATEGY
IMPACTS ON HOUSING OPPORTUNITY PAGE 16 October 2017
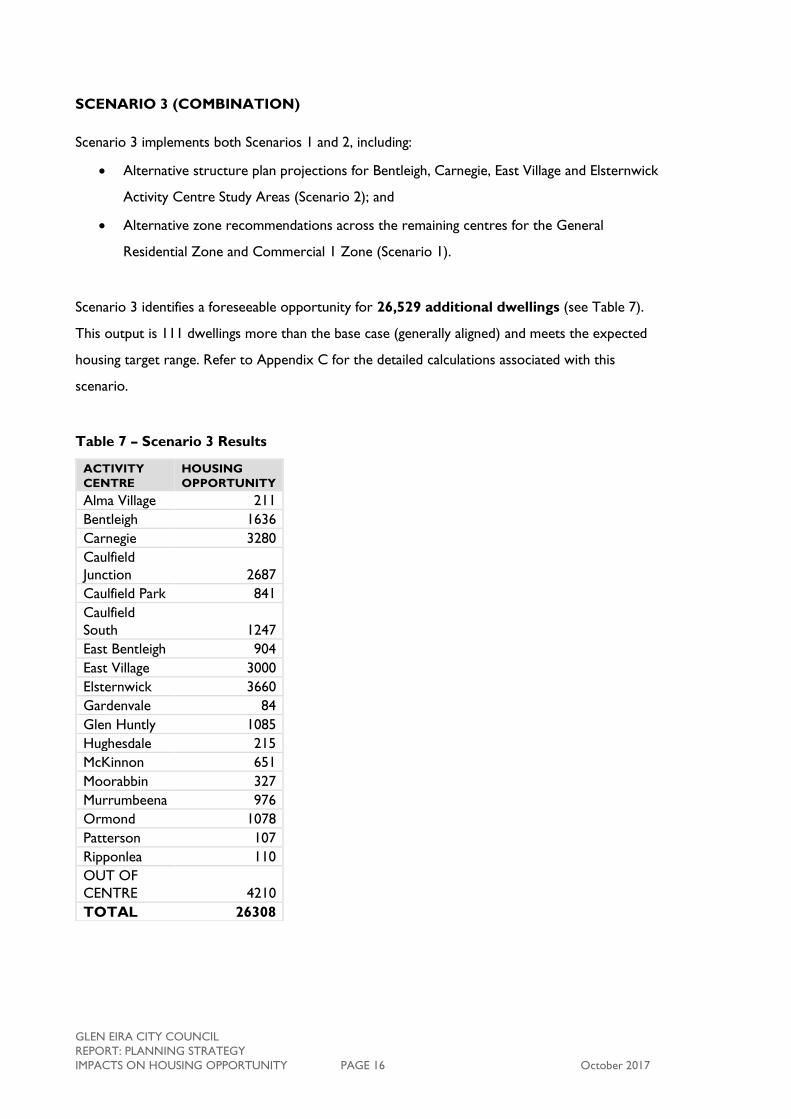
SCENARIO 3 (COMBINATION)
Scenario 3 implements both Scenarios 1 and 2, including:
Alternative structure plan projections for Bentleigh, Carnegie, East Village and Elsternwick
Activity Centre Study Areas (Scenario 2); and
Alternative zone recommendations across the remaining centres for the General
Residential Zone and Commercial 1 Zone (Scenario 1).
Scenario 3 identifies a foreseeable opportunity for 26,529 additional dwellings (see Table 7).
This output is 111 dwellings more than the base case (generally aligned) and meets the expected
housing target range. Refer to Appendix C for the detailed calculations associated with this
scenario.
Table 7 – Scenario 3 Results
ACTIVITY
CENTRE
HOUSING
OPPORTUNITY
Alma Village 211
Bentleigh 1636
Carnegie 3280
Caulfield
Junction 2687
Caulfield Park 841
Caulfield
South 1247
East Bentleigh 904
East Village 3000
Elsternwick 3660
Gardenvale 84
Glen Huntly 1085
Hughesdale 215
McKinnon 651
Moorabbin 327
Murrumbeena 976
Ormond 1078
Patterson 107
Ripponlea 110
OUT OF
CENTRE 4210
TOTAL 26308
GLEN EIRA CITY COUNCIL
REPORT: PLANNING STRATEGY
IMPACTS ON HOUSING OPPORTUNITY PAGE 17 October 2017
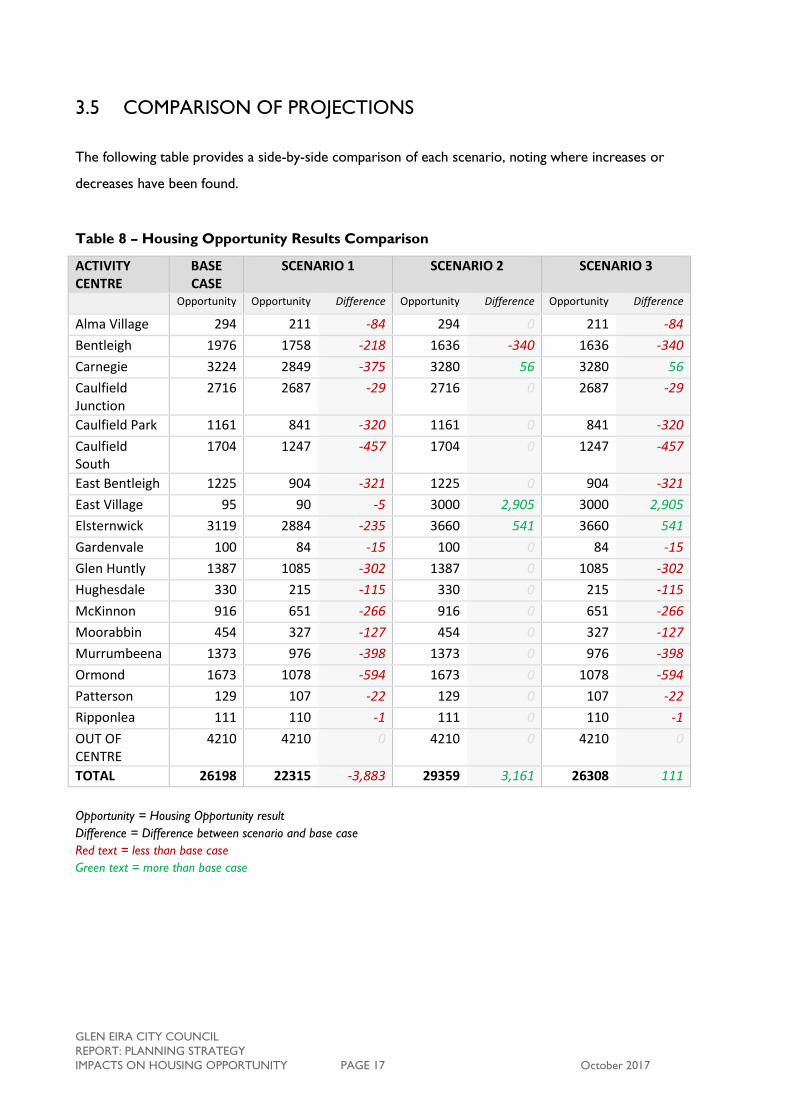
3.5 COMPARISON OF PROJECTIONS
The following table provides a side-by-side comparison of each scenario, noting where increases or
decreases have been found.
Table 8 – Housing Opportunity Results Comparison
ACTIVITY CENTRE
BASE CASE
SCENARIO 1 SCENARIO 2 SCENARIO 3
Opportunity Opportunity Difference Opportunity Difference Opportunity Difference
Alma Village 294 211 -84 294 0 211 -84
Bentleigh 1976 1758 -218 1636 -340 1636 -340
Carnegie 3224 2849 -375 3280 56 3280 56
Caulfield Junction
2716 2687 -29 2716 0 2687 -29
Caulfield Park 1161 841 -320 1161 0 841 -320
Caulfield South
1704 1247 -457 1704 0 1247 -457
East Bentleigh 1225 904 -321 1225 0 904 -321
East Village 95 90 -5 3000 2,905 3000 2,905
Elsternwick 3119 2884 -235 3660 541 3660 541
Gardenvale 100 84 -15 100 0 84 -15
Glen Huntly 1387 1085 -302 1387 0 1085 -302
Hughesdale 330 215 -115 330 0 215 -115
McKinnon 916 651 -266 916 0 651 -266
Moorabbin 454 327 -127 454 0 327 -127
Murrumbeena 1373 976 -398 1373 0 976 -398
Ormond 1673 1078 -594 1673 0 1078 -594
Patterson 129 107 -22 129 0 107 -22
Ripponlea 111 110 -1 111 0 110 -1
OUT OF CENTRE
4210 4210 0 4210 0 4210 0
TOTAL 26198 22315 -3,883 29359 3,161 26308 111
Opportunity = Housing Opportunity result
Difference = Difference between scenario and base case
Red text = less than base case
Green text = more than base case
GLEN EIRA CITY COUNCIL
REPORT: PLANNING STRATEGY
IMPACTS ON HOUSING OPPORTUNITY PAGE 18 October 2017
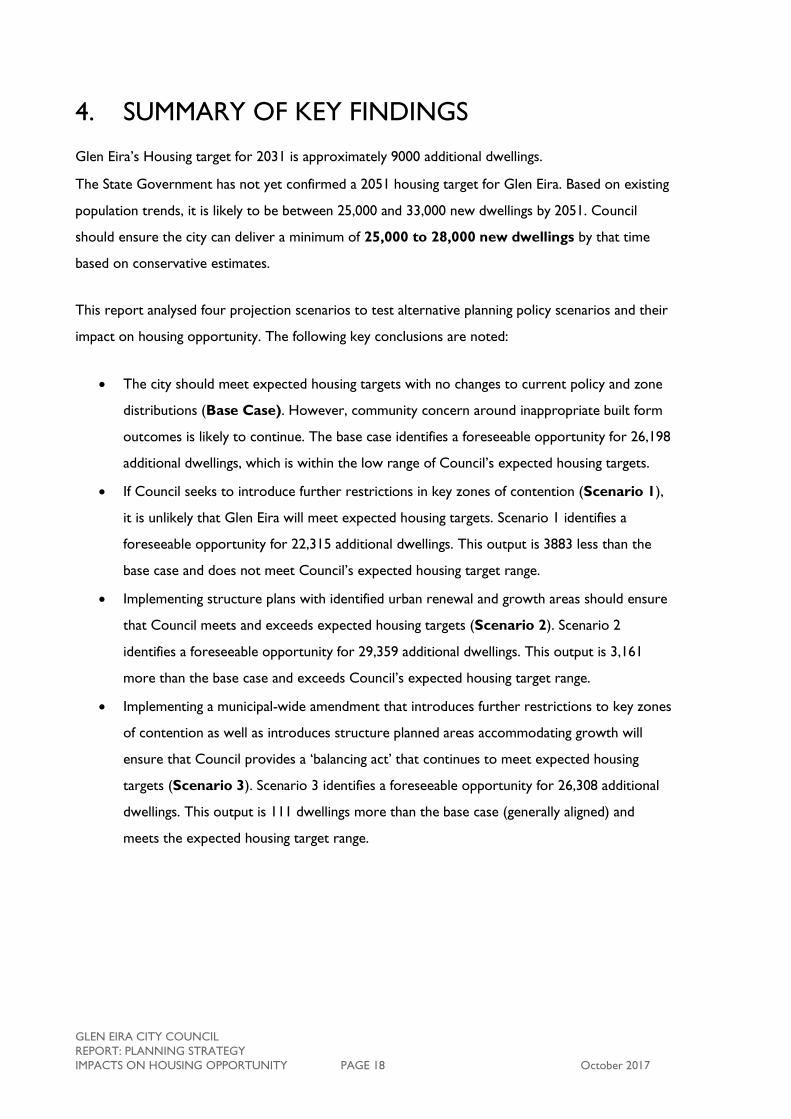
4. SUMMARY OF KEY FINDINGS
Glen Eira’s Housing target for 2031 is approximately 9000 additional dwellings.
The State Government has not yet confirmed a 2051 housing target for Glen Eira. Based on existing
population trends, it is likely to be between 25,000 and 33,000 new dwellings by 2051. Council
should ensure the city can deliver a minimum of 25,000 to 28,000 new dwellings by that time
based on conservative estimates.
This report analysed four projection scenarios to test alternative planning policy scenarios and their
impact on housing opportunity. The following key conclusions are noted:
The city should meet expected housing targets with no changes to current policy and zone
distributions (Base Case). However, community concern around inappropriate built form
outcomes is likely to continue. The base case identifies a foreseeable opportunity for 26,198
additional dwellings, which is within the low range of Council’s expected housing targets.
If Council seeks to introduce further restrictions in key zones of contention (Scenario 1),
it is unlikely that Glen Eira will meet expected housing targets. Scenario 1 identifies a
foreseeable opportunity for 22,315 additional dwellings. This output is 3883 less than the
base case and does not meet Council’s expected housing target range.
Implementing structure plans with identified urban renewal and growth areas should ensure
that Council meets and exceeds expected housing targets (Scenario 2). Scenario 2
identifies a foreseeable opportunity for 29,359 additional dwellings. This output is 3,161
more than the base case and exceeds Council’s expected housing target range.
Implementing a municipal-wide amendment that introduces further restrictions to key zones
of contention as well as introduces structure planned areas accommodating growth will
ensure that Council provides a ‘balancing act’ that continues to meet expected housing
targets (Scenario 3). Scenario 3 identifies a foreseeable opportunity for 26,308 additional
dwellings. This output is 111 dwellings more than the base case (generally aligned) and
meets the expected housing target range.
GLEN EIRA CITY COUNCIL
REPORT: PLANNING STRATEGY
IMPACTS ON HOUSING OPPORTUNITY PAGE 19 October 2017
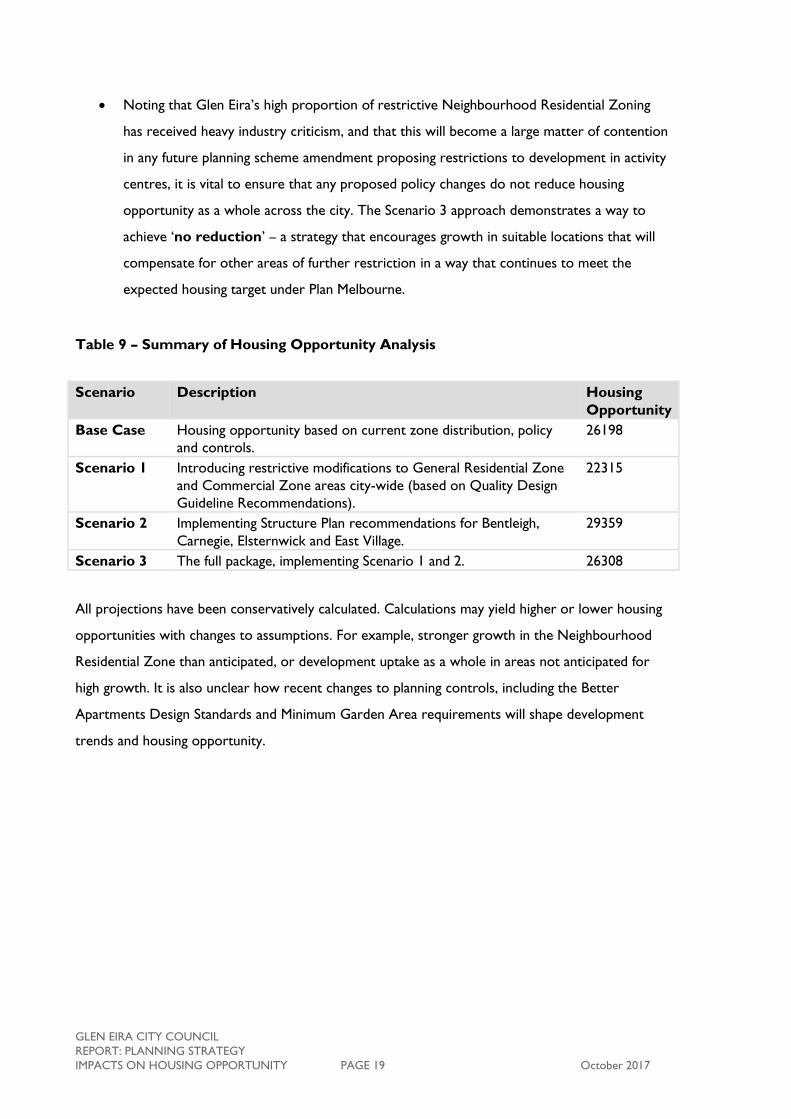
Noting that Glen Eira’s high proportion of restrictive Neighbourhood Residential Zoning
has received heavy industry criticism, and that this will become a large matter of contention
in any future planning scheme amendment proposing restrictions to development in activity
centres, it is vital to ensure that any proposed policy changes do not reduce housing
opportunity as a whole across the city. The Scenario 3 approach demonstrates a way to
achieve ‘no reduction’ – a strategy that encourages growth in suitable locations that will
compensate for other areas of further restriction in a way that continues to meet the
expected housing target under Plan Melbourne.
Table 9 – Summary of Housing Opportunity Analysis
Scenario Description Housing
Opportunity
Base Case Housing opportunity based on current zone distribution, policy
and controls.
26198
Scenario 1 Introducing restrictive modifications to General Residential Zone
and Commercial Zone areas city-wide (based on Quality Design
Guideline Recommendations).
22315
Scenario 2 Implementing Structure Plan recommendations for Bentleigh,
Carnegie, Elsternwick and East Village.
29359
Scenario 3 The full package, implementing Scenario 1 and 2. 26308
All projections have been conservatively calculated. Calculations may yield higher or lower housing
opportunities with changes to assumptions. For example, stronger growth in the Neighbourhood
Residential Zone than anticipated, or development uptake as a whole in areas not anticipated for
high growth. It is also unclear how recent changes to planning controls, including the Better
Apartments Design Standards and Minimum Garden Area requirements will shape development
trends and housing opportunity.

GLEN EIRA CITY COUNCIL
REPORT: PLANNING STRATEGY
IMPACTS ON HOUSING OPPORTUNITY PAGE 20 October 2017
APPENDICES
APPENDIX A – DEVELOPABLE LAND MAPPING AND DATA
APPENDIX B – PERMIT ACTIVITY EXAMPLES
APPENDIX C – PROJECTION CALCULATIONS
APPENDIX A – DEVELOPABLE LAND MAPPING AND DATA
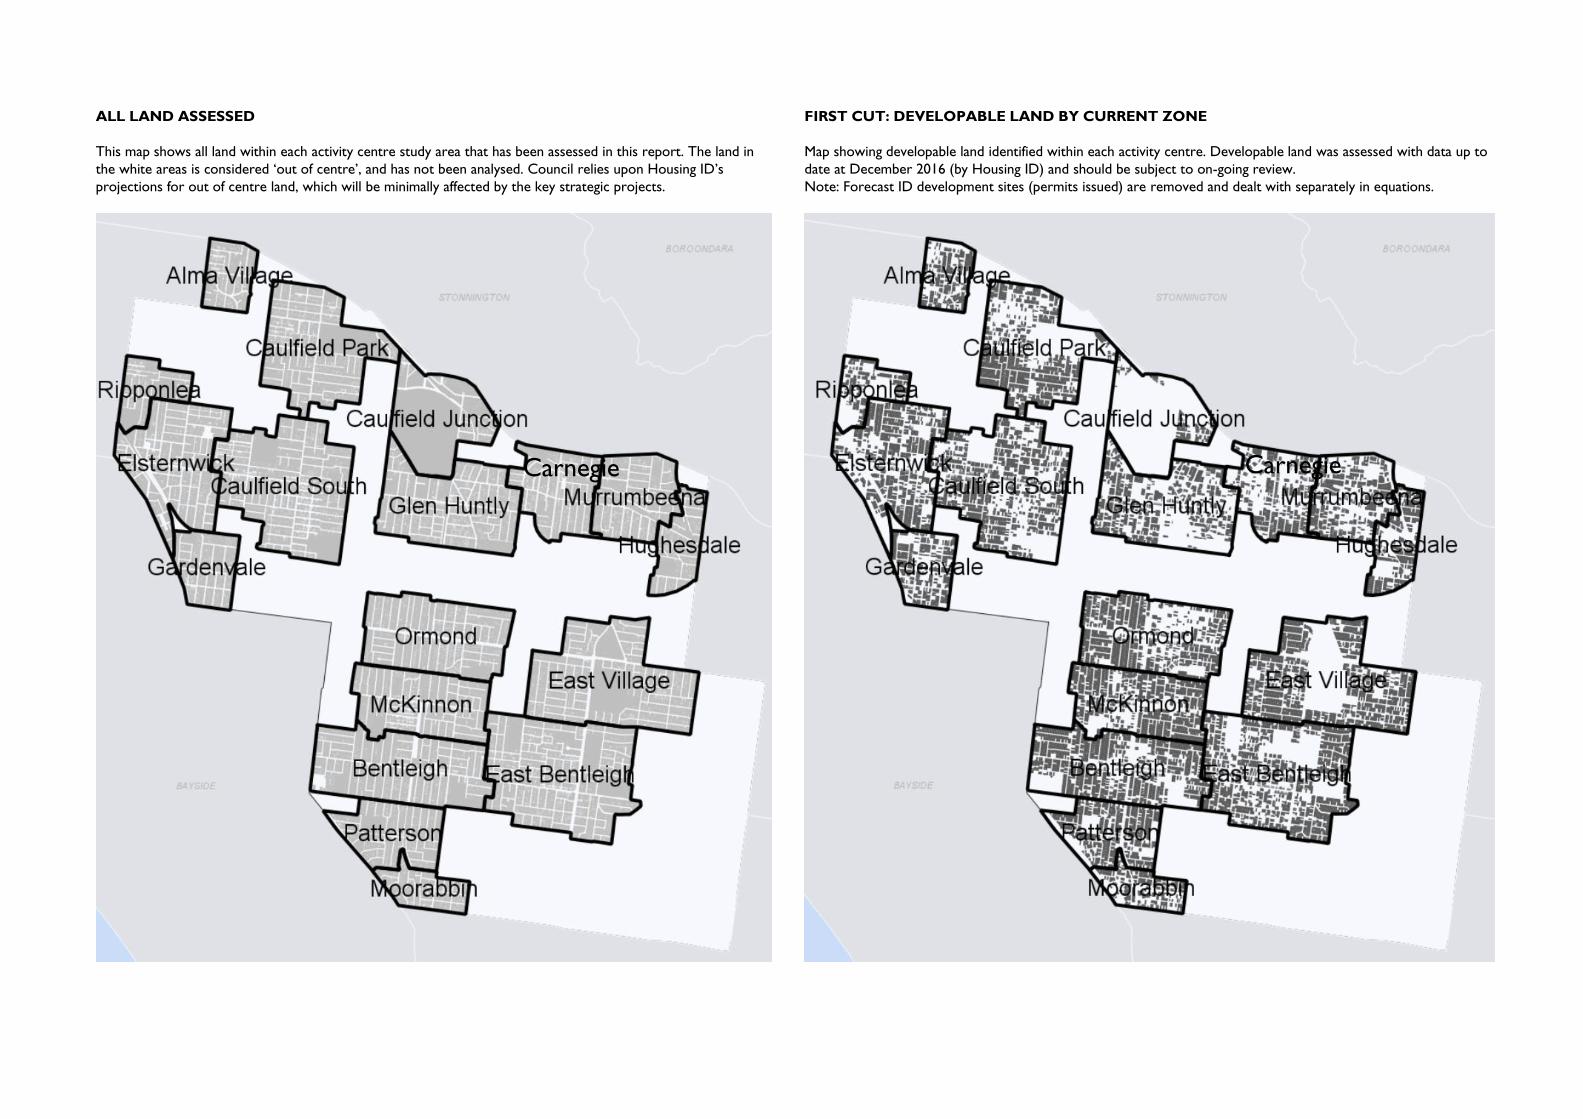
ALL LAND ASSESSED
This map shows all land within each activity centre study area that has been assessed in this report. The land in
the white areas is considered ‘out of centre’, and has not been analysed. Council relies upon Housing ID’s
projections for out of centre land, which will be minimally affected by the key strategic projects.
FIRST CUT: DEVELOPABLE LAND BY CURRENT ZONE
Map showing developable land identified within each activity centre. Developable land was assessed with data up to
date at December 2016 (by Housing ID) and should be subject to on-going review.
Note: Forecast ID development sites (permits issued) are removed and dealt with separately in equations.
CarnegieCarnegie
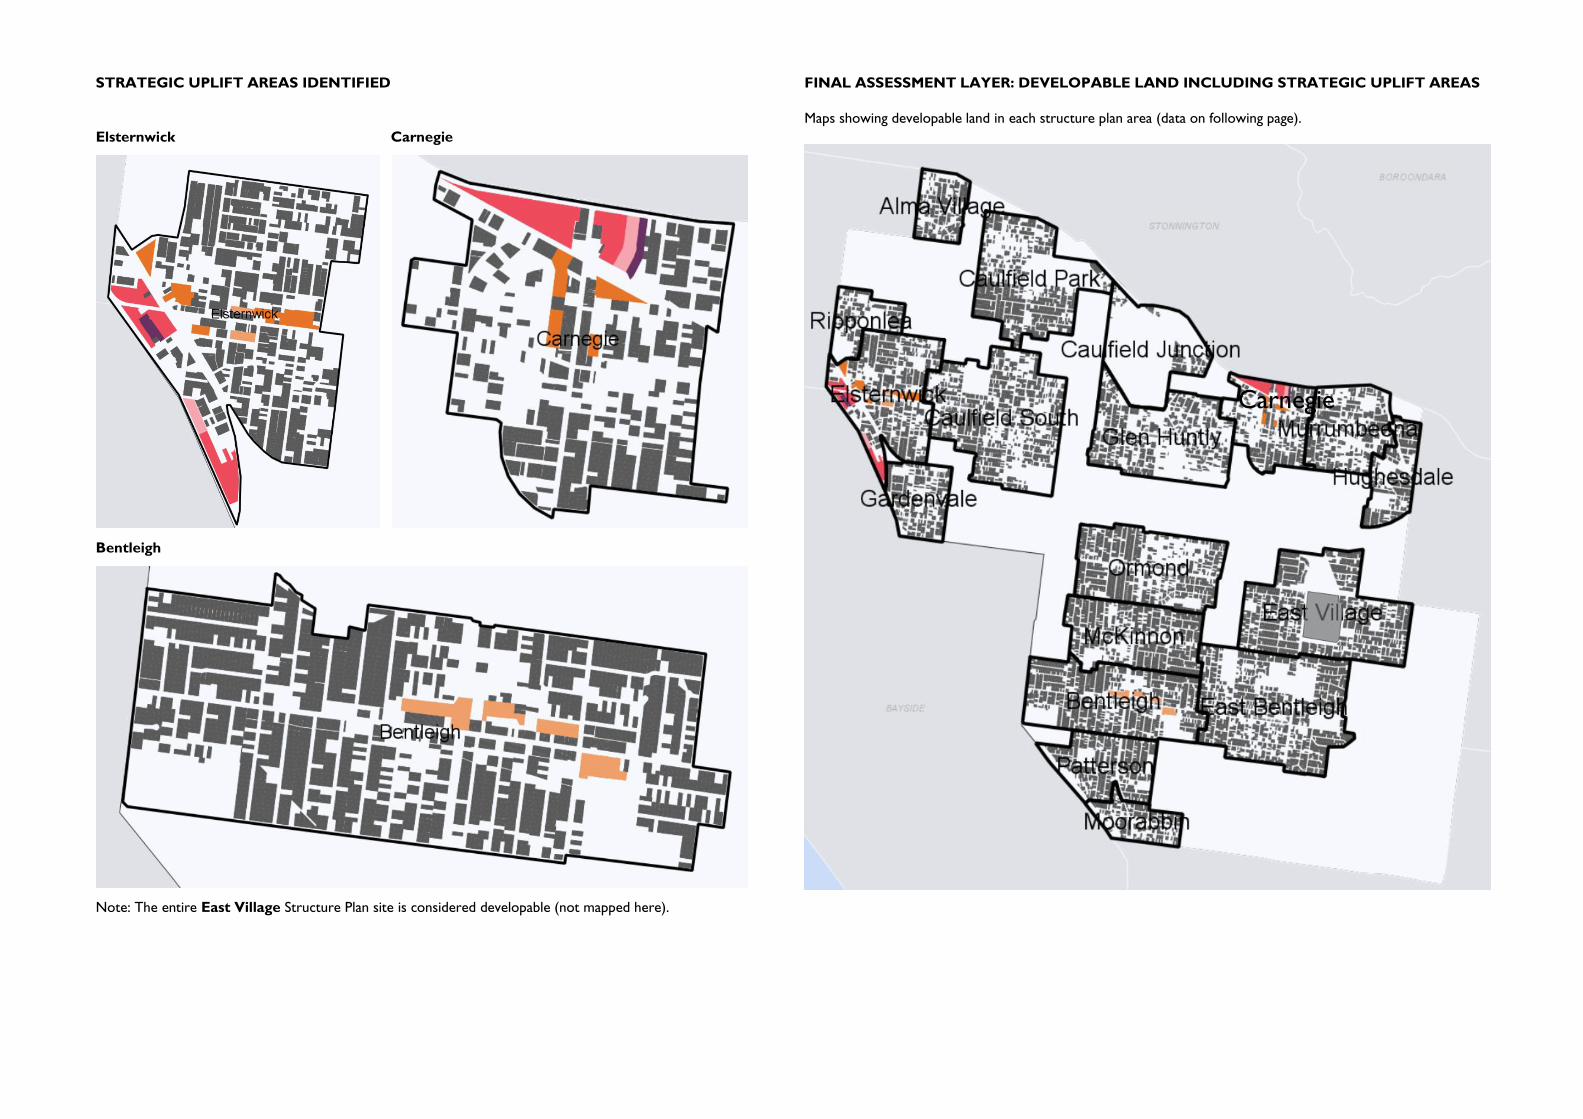
STRATEGIC UPLIFT AREAS IDENTIFIED
Elsternwick Carnegie
Bentleigh
FINAL ASSESSMENT LAYER: DEVELOPABLE LAND INCLUDING STRATEGIC UPLIFT AREAS
Maps showing developable land in each structure plan area (data on following page).
Note: The entire East Village Structure Plan site is considered developable (not mapped here).
Carnegie

ZONE DATA BREAKDOWN
Developable land (Area in Hectares) within each Zone, by Activity Centre Study Area
Alm
a V
illag
e
Bentleig
h
Car
negi
e
Cau
lfie
ld
Junct
ion
Cau
lfie
ld P
ark
Cau
lfie
ld S
outh
Eas
t B
entleig
h
Eas
t V
illag
e
Els
tern
wic
k
Gar
denva
le
Gle
n H
untly
Hugh
esd
ale
McK
innon
Moora
bbin
Murr
um
beena
Orm
ond
Pat
ters
on
Rip
ponle
a
TO
TA
L
NRZ* 14.72 71.24 18.23 6.14 47.44 64.13 73.86 91.68 48.55 25.99 41.36 18.58 48.68 11.71 14.01 37.08 41.53 14.67 689.61
GRZ* 5.26 2.70 4.19 0.29 17.68 15.81 27.22 0.00 1.28 0.00 12.72 5.60 13.69 6.23 22.79 32.11 0.00 0.40 167.98
RGZ1 0.00 8.67 7.28 0.88 0.00 0.00 0.00 0.00 15.42 0.00 0.00 0.00 0.00 0.00 0.00 0.00 0.00 0.00 32.25
MUZ* 0.08 0.00 1.36 0.00 0.00 0.11 0.17 0.00 1.50 0.00 0.91 0.30 0.00 0.00 0.33 0.44 0.00 0.09 5.28
C1Z 0.62 5.84 8.10 0.81 1.78 7.76 2.81 0.60 5.57 0.77 3.20 0.58 1.71 0.80 1.37 2.93 1.10 0.07 46.42
C2Z 0.00 0.00 0.00 0.00 0.00 0.00 0.00 0.00 4.81 0.11 0.00 0.00 0.00 0.00 0.00 0.00 0.00 0.00 4.92
PUZ* 0.00 3.39 1.00 0.00 0.00 0.00 0.21 0.00 2.54 0.42 0.00 0.00 1.11 0.00 0.00 0.00 0.00 0.00 8.68
IN* 0.00 0.00 0.00 0.00 0.00 0.00 0.00 0.00 0.00 0.00 0.00 0.00 0.37 0.00 0.00 0.00 0.00 0.00 0.37
PPRZ 0.00 0.00 0.00 0.00 0.00 0.00 0.00 0.00 0.00 0.00 0.00 0.00 0.00 0.00 0.00 0.00 0.00 0.00 0.00
PDZ* 0.00 0.00 0.00 0.00 0.00 0.00 0.00 0.00 0.00 0.00 0.00 0.00 0.00 0.00 0.00 0.00 0.00 0.00 0.00
SUZ* 0.00 0.00 0.00 0.00 0.00 0.00 0.00 0.00 0.00 0.00 0.00 0.00 0.00 0.00 0.00 0.00 0.00 0.00 0.00
TOTAL EACH CENTRE 20.68 91.84 40.17 8.11 66.90 87.80 104.27 92.28 79.68 27.30 58.20 25.06 65.57 18.74 38.50 72.56 42.63 15.23 955.50
Alternative GRZ breakdown for Scenario 1
GRZ (TOWNHOUSE APARTMENT
MIX) 0.51 0.10 1.11 0.29 4.79 4.40 4.24 0.00 0.00 0.00 2.63 0.00 1.21 1.25 5.68 3.00 0.00 0.40 29.61
GRZ (GARDEN TOWNHOUSE) 4.76 2.61 3.08 0.00 12.89 11.41 22.98 0.00 1.28 0.00 10.10 5.60 12.48 4.98 17.11 29.11 0.00 0.00 138.37
Developable land (Number of Properties) within each Zone, by Activity Centre Study Area (note: this represents ‘ground floor’ properties more than 100sqm to remove anomalies like common driveways or multi-level buildings)
Alm
a V
illag
e
Bentleig
h
Car
negi
e
Cau
lfie
ld
Junct
ion
Cau
lfie
ld P
ark
Cau
lfie
ld
South
Eas
t B
entleig
h
Eas
t V
illag
e
Els
tern
wic
k
Gar
denva
le
Gle
n H
untly
Hugh
esd
ale
McK
innon
Moora
bbin
Murr
um
beena
Orm
ond
Pat
ters
on
Rip
ponle
a
TO
TA
L
NRZ* 211 1074 306 99 666 994 1128 1418 767 387 630 272 773 181 190 554 646 236 10532
GRZ* 81 38 64 4 267 250 404 0 9 0 204 84 205 91 305 476 0 6 2488
RGZ1 0 130 137 15 0 0 0 0 190 0 0 0 0 0 0 0 0 0 472
MUZ* 1 0 25 0 0 7 2 0 18 0 2 7 0 0 4 11 0 1 78
C1Z 18 209 155 20 40 200 119 22 169 32 91 13 54 22 47 99 35 1 1346
C2Z 0 0 0 0 0 0 0 0 10 1 0 0 0 0 0 0 0 0 11
PUZ* 0 5 2 0 0 0 2 0 8 1 0 0 1 0 0 0 0 0 19
IN* 0 0 0 0 0 0 0 0 0 0 0 0 4 0 0 0 0 0 4
PPRZ 0 0 0 0 0 0 0 0 0 0 0 0 0 0 0 0 0 0 0
PDZ* 0 0 0 0 0 0 0 0 0 0 0 0 0 0 0 0 0 0 0
SUZ* 0 0 0 0 0 0 0 0 0 0 0 0 0 0 0 0 0 0 0
TOTAL EACH CENTRE 311 1456 689 138 973 1451 1655 1440 1171 421 927 376 1037 294 546 1140 681 244 14950
Alternative GRZ breakdown for Scenario 1
GRZ (TOWNHOUSE APARTMENT
MIX) 5 1 17 4 68 58 57 0 0 0 41 0 22 18 62 48 0 6 407
GRZ (GARDEN TOWNHOUSE) 76 37 47 0 199 192 347 0 9 0 163 84 183 73 243 428 0 0 2081

BUILDING TYPE DATA BREAKDOWN
Developable land (Area in Hectares) within each Building Type, by Activity Centre Study Area
Alm
a V
illag
e
Bentleig
h
Car
negi
e
Cau
lfie
ld
Junct
ion
Cau
lfie
ld P
ark
Cau
lfie
ld S
outh
Eas
t B
entleig
h
Eas
t V
illag
e
Els
tern
wic
k
Gar
denva
le
Gle
n H
untly
Hugh
esd
ale
McK
innon
Moora
bbin
Murr
um
beena
Orm
ond
Pat
ters
on
Rip
ponle
a
TO
TA
L
Heritage and character housing 0.00 20.20 1.16 0.00 0.00 0.00 0.00 0.00 32.97 0.00 0.00 0.00 0.00 0.00 0.00 0.00 0.00 0.00 54.33
Minimal change 0.00 48.30 14.30 0.00 0.00 0.00 0.00 0.00 20.22 0.00 0.00 0.00 0.00 0.00 0.00 0.00 0.00 0.00 82.83
Garden townhouse 0.00 6.64 3.83 0.00 0.00 0.00 0.00 0.00 0.39 0.00 0.00 0.00 0.00 0.00 0.00 0.00 0.00 0.00 10.87
Townhouse and apartment mix 0.00 4.19 5.00 0.00 0.00 0.00 0.00 0.00 0.00 0.00 0.00 0.00 0.00 0.00 0.00 0.00 0.00 0.00 9.19
Garden Apartment 0.00 1.99 3.51 0.00 0.00 0.00 0.00 0.00 4.46 0.00 0.00 0.00 0.00 0.00 0.00 0.00 0.00 0.00 9.96
Shop top heritage character 0.00 0.28 2.23 0.00 0.00 0.00 0.00 0.00 2.75 0.00 0.00 0.00 0.00 0.00 0.00 0.00 0.00 0.00 5.27
Shop top standard 0.00 4.41 1.46 0.00 0.00 0.00 0.00 0.00 0.43 0.00 0.00 0.00 0.00 0.00 0.00 0.00 0.00 0.00 6.30
Strategic site A 0.00 0.00 2.02 0.00 0.00 0.00 0.00 0.00 4.53 0.00 0.00 0.00 0.00 0.00 0.00 0.00 0.00 0.00 6.55
Strategic site B 0.00 3.70 0.00 0.00 0.00 0.00 0.00 0.00 0.97 0.00 0.00 0.00 0.00 0.00 0.00 0.00 0.00 0.00 4.67
Urban renewal A 0.00 0.00 4.31 0.00 0.00 0.00 0.00 0.00 6.84 0.00 0.00 0.00 0.00 0.00 0.00 0.00 0.00 0.00 11.15
Urban Renewal B 0.00 0.00 0.75 0.00 0.00 0.00 0.00 0.00 0.94 0.00 0.00 0.00 0.00 0.00 0.00 0.00 0.00 0.00 1.69
Urban Apartment 0.00 0.00 0.51 0.00 0.00 0.00 0.00 0.00 0.70 0.00 0.00 0.00 0.00 0.00 0.00 0.00 0.00 0.00 1.21
TOTAL 0.00 89.71 39.09 0.00 0.00 0.00 0.00 0.00 75.21 0.00 0.00 0.00 0.00 0.00 0.00 0.00 0.00 0.00 204.01
Developable land (Number of Properties) within each Building Type, by Activity Centre Study Area (note: this represents ‘ground floor’ properties more than 100sqm to remove anomalies like common driveways or multi-level buildings)
Alm
a V
illag
e
Bentleig
h
Car
negi
e
Cau
lfie
ld
Junct
ion
Cau
lfie
ld P
ark
Cau
lfie
ld
South
Eas
t B
entleig
h
Eas
t V
illag
e
Els
tern
wic
k
Gar
denva
le
Gle
n H
untly
Hugh
esd
ale
McK
innon
Moora
bbin
Murr
um
beena
Orm
ond
Pat
ters
on
Rip
ponle
a
TO
TA
L
Heritage and character housing 0 308 21 0 0 0 0 0 478 0 0 0 0 0 0 0 0 0 807
Minimal change 0 730 247 0 0 0 0 0 325 0 0 0 0 0 0 0 0 0 1302
Garden townhouse 0 96 62 0 0 0 0 0 7 0 0 0 0 0 0 0 0 0 165
Townhouse and apartment mix 0 63 80 0 0 0 0 0 0 0 0 0 0 0 0 0 0 0 143
Garden Apartment 0 29 59 0 0 0 0 0 75 0 0 0 0 0 0 0 0 0 163
Shop top heritage character 0 13 92 0 0 0 0 0 123 0 0 0 0 0 0 0 0 0 228
Shop top standard 0 188 37 0 0 0 0 0 9 0 0 0 0 0 0 0 0 0 234
Strategic site A 0 0 23 0 0 0 0 0 31 0 0 0 0 0 0 0 0 0 54
Strategic site B 0 28 0 0 0 0 0 0 8 0 0 0 0 0 0 0 0 0 36
Urban renewal A 0 0 38 0 0 0 0 0 79 0 0 0 0 0 0 0 0 0 0
Urban Renewal B 0 0 14 0 0 0 0 0 6 0 0 0 0 0 0 0 0 0 0
Urban Apartment 0 0 14 0 0 0 0 0 27 0 0 0 0 0 0 0 0 0 41
NO BUILDING TYPE APPLIED 311 1 2 138 973 1451 1655 1440 3 421 927 376 1037 294 546 1140 681 244 11640
TOTAL PROPERTIES WITH A
BUILDING TYPE 0 1455 687 0 0 0 0 0 1168 0 0 0 0 0 0 0 0 0 3310
TOTAL OF ALL PROPERTIES 311 1456 689 138 973 1451 1655 1440 1171 421 927 376 1037 294 546 1140 681 244 14950
APPENDIX B – PERMIT ACTIVITY EXAMPLES
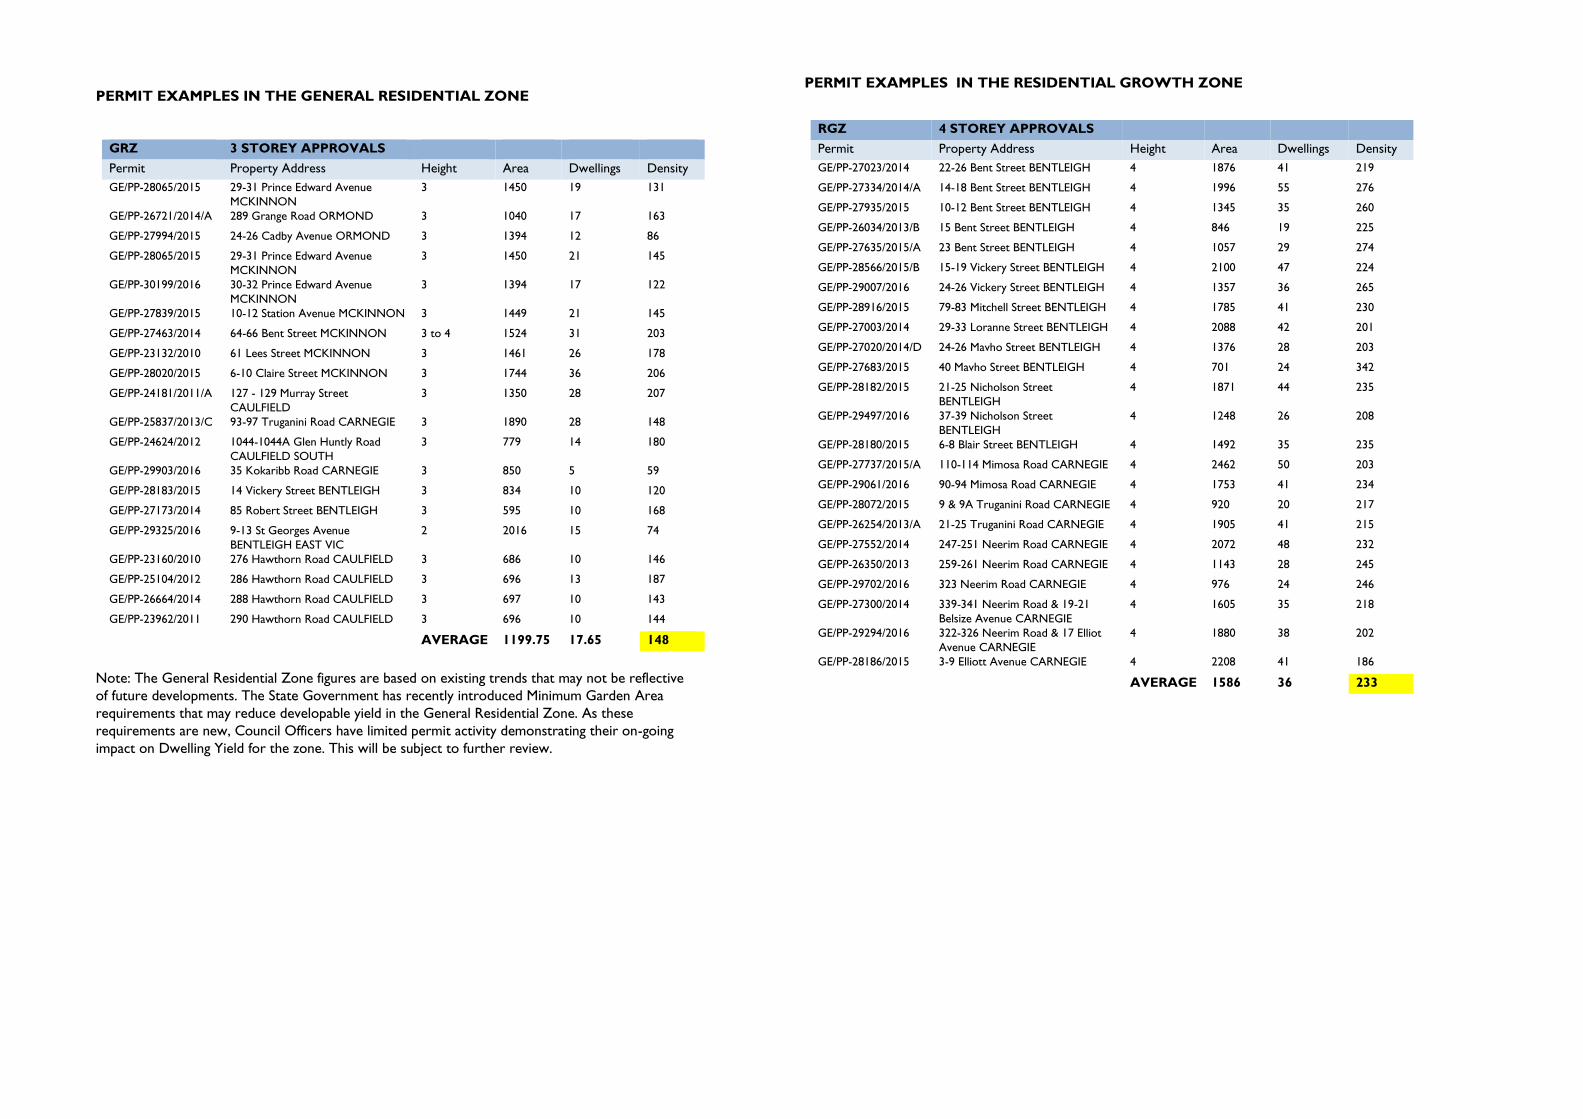
PERMIT EXAMPLES IN THE GENERAL RESIDENTIAL ZONE
GRZ 3 STOREY APPROVALS
Permit Property Address Height Area Dwellings Density
GE/PP-28065/2015 29-31 Prince Edward Avenue
MCKINNON
3 1450 19 131
GE/PP-26721/2014/A 289 Grange Road ORMOND 3 1040 17 163
GE/PP-27994/2015 24-26 Cadby Avenue ORMOND 3 1394 12 86
GE/PP-28065/2015 29-31 Prince Edward Avenue
MCKINNON
3 1450 21 145
GE/PP-30199/2016 30-32 Prince Edward Avenue
MCKINNON
3 1394 17 122
GE/PP-27839/2015 10-12 Station Avenue MCKINNON 3 1449 21 145
GE/PP-27463/2014 64-66 Bent Street MCKINNON 3 to 4 1524 31 203
GE/PP-23132/2010 61 Lees Street MCKINNON 3 1461 26 178
GE/PP-28020/2015 6-10 Claire Street MCKINNON 3 1744 36 206
GE/PP-24181/2011/A 127 - 129 Murray Street
CAULFIELD
3 1350 28 207
GE/PP-25837/2013/C 93-97 Truganini Road CARNEGIE 3 1890 28 148
GE/PP-24624/2012 1044-1044A Glen Huntly Road
CAULFIELD SOUTH
3 779 14 180
GE/PP-29903/2016 35 Kokaribb Road CARNEGIE 3 850 5 59
GE/PP-28183/2015 14 Vickery Street BENTLEIGH 3 834 10 120
GE/PP-27173/2014 85 Robert Street BENTLEIGH 3 595 10 168
GE/PP-29325/2016 9-13 St Georges Avenue
BENTLEIGH EAST VIC
2 2016 15 74
GE/PP-23160/2010 276 Hawthorn Road CAULFIELD 3 686 10 146
GE/PP-25104/2012 286 Hawthorn Road CAULFIELD 3 696 13 187
GE/PP-26664/2014 288 Hawthorn Road CAULFIELD 3 697 10 143
GE/PP-23962/2011 290 Hawthorn Road CAULFIELD 3 696 10 144
AVERAGE 1199.75 17.65 148
Note: The General Residential Zone figures are based on existing trends that may not be reflective
of future developments. The State Government has recently introduced Minimum Garden Area
requirements that may reduce developable yield in the General Residential Zone. As these
requirements are new, Council Officers have limited permit activity demonstrating their on-going
impact on Dwelling Yield for the zone. This will be subject to further review.
PERMIT EXAMPLES IN THE RESIDENTIAL GROWTH ZONE
RGZ 4 STOREY APPROVALS
Permit Property Address Height Area Dwellings Density
GE/PP-27023/2014 22-26 Bent Street BENTLEIGH 4 1876 41 219
GE/PP-27334/2014/A 14-18 Bent Street BENTLEIGH 4 1996 55 276
GE/PP-27935/2015 10-12 Bent Street BENTLEIGH 4 1345 35 260
GE/PP-26034/2013/B 15 Bent Street BENTLEIGH 4 846 19 225
GE/PP-27635/2015/A 23 Bent Street BENTLEIGH 4 1057 29 274
GE/PP-28566/2015/B 15-19 Vickery Street BENTLEIGH 4 2100 47 224
GE/PP-29007/2016 24-26 Vickery Street BENTLEIGH 4 1357 36 265
GE/PP-28916/2015 79-83 Mitchell Street BENTLEIGH 4 1785 41 230
GE/PP-27003/2014 29-33 Loranne Street BENTLEIGH 4 2088 42 201
GE/PP-27020/2014/D 24-26 Mavho Street BENTLEIGH 4 1376 28 203
GE/PP-27683/2015 40 Mavho Street BENTLEIGH 4 701 24 342
GE/PP-28182/2015 21-25 Nicholson Street
BENTLEIGH
4 1871 44 235
GE/PP-29497/2016 37-39 Nicholson Street
BENTLEIGH
4 1248 26 208
GE/PP-28180/2015 6-8 Blair Street BENTLEIGH 4 1492 35 235
GE/PP-27737/2015/A 110-114 Mimosa Road CARNEGIE 4 2462 50 203
GE/PP-29061/2016 90-94 Mimosa Road CARNEGIE 4 1753 41 234
GE/PP-28072/2015 9 & 9A Truganini Road CARNEGIE 4 920 20 217
GE/PP-26254/2013/A 21-25 Truganini Road CARNEGIE 4 1905 41 215
GE/PP-27552/2014 247-251 Neerim Road CARNEGIE 4 2072 48 232
GE/PP-26350/2013 259-261 Neerim Road CARNEGIE 4 1143 28 245
GE/PP-29702/2016 323 Neerim Road CARNEGIE 4 976 24 246
GE/PP-27300/2014 339-341 Neerim Road & 19-21
Belsize Avenue CARNEGIE
4 1605 35 218
GE/PP-29294/2016 322-326 Neerim Road & 17 Elliot
Avenue CARNEGIE
4 1880 38 202
GE/PP-28186/2015 3-9 Elliott Avenue CARNEGIE 4 2208 41 186
AVERAGE 1586 36 233
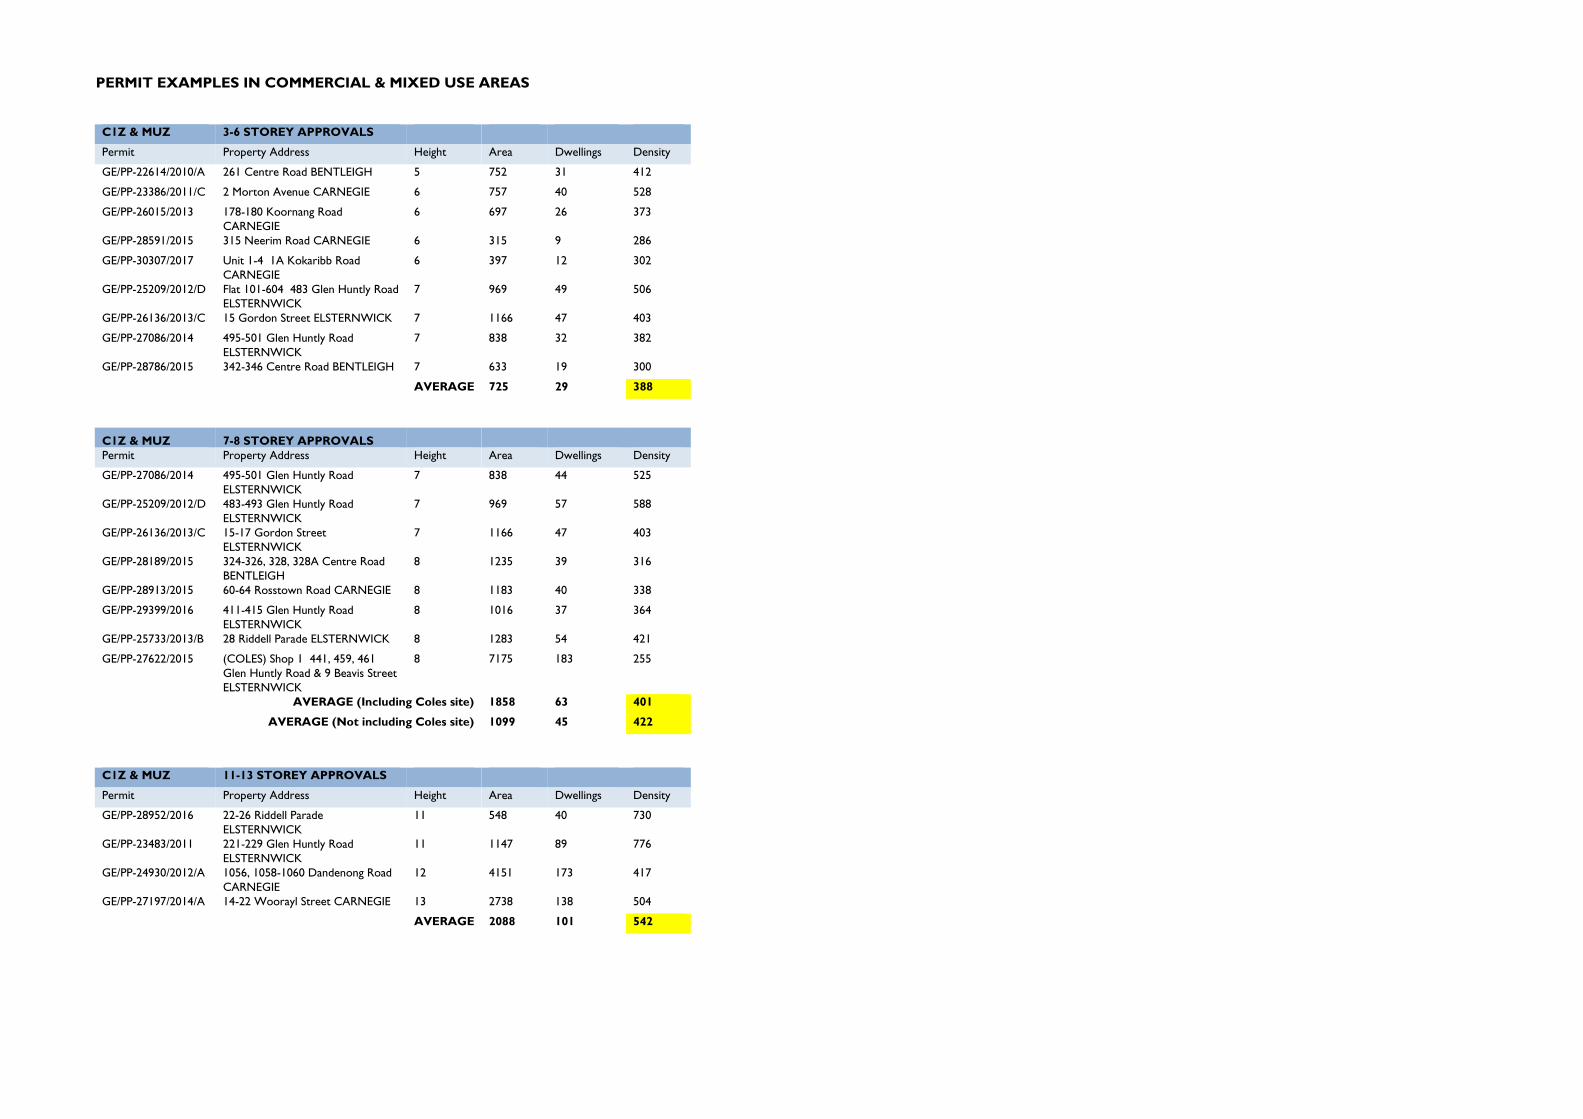
PERMIT EXAMPLES IN COMMERCIAL & MIXED USE AREAS
C1Z & MUZ 3-6 STOREY APPROVALS
Permit Property Address Height Area Dwellings Density
GE/PP-22614/2010/A 261 Centre Road BENTLEIGH 5 752 31 412
GE/PP-23386/2011/C 2 Morton Avenue CARNEGIE 6 757 40 528
GE/PP-26015/2013 178-180 Koornang Road
CARNEGIE
6 697 26 373
GE/PP-28591/2015 315 Neerim Road CARNEGIE 6 315 9 286
GE/PP-30307/2017 Unit 1-4 1A Kokaribb Road
CARNEGIE
6 397 12 302
GE/PP-25209/2012/D Flat 101-604 483 Glen Huntly Road
ELSTERNWICK
7 969 49 506
GE/PP-26136/2013/C 15 Gordon Street ELSTERNWICK 7 1166 47 403
GE/PP-27086/2014 495-501 Glen Huntly Road
ELSTERNWICK
7 838 32 382
GE/PP-28786/2015 342-346 Centre Road BENTLEIGH 7 633 19 300
AVERAGE 725 29 388
C1Z & MUZ 7-8 STOREY APPROVALS
Permit Property Address Height Area Dwellings Density
GE/PP-27086/2014 495-501 Glen Huntly Road
ELSTERNWICK
7 838 44 525
GE/PP-25209/2012/D 483-493 Glen Huntly Road
ELSTERNWICK
7 969 57 588
GE/PP-26136/2013/C 15-17 Gordon Street
ELSTERNWICK
7 1166 47 403
GE/PP-28189/2015 324-326, 328, 328A Centre Road
BENTLEIGH
8 1235 39 316
GE/PP-28913/2015 60-64 Rosstown Road CARNEGIE 8 1183 40 338
GE/PP-29399/2016 411-415 Glen Huntly Road
ELSTERNWICK
8 1016 37 364
GE/PP-25733/2013/B 28 Riddell Parade ELSTERNWICK 8 1283 54 421
GE/PP-27622/2015 (COLES) Shop 1 441, 459, 461
Glen Huntly Road & 9 Beavis Street
ELSTERNWICK
8 7175 183 255
AVERAGE (Including Coles site) 1858 63 401
AVERAGE (Not including Coles site) 1099 45 422
C1Z & MUZ 11-13 STOREY APPROVALS
Permit Property Address Height Area Dwellings Density
GE/PP-28952/2016 22-26 Riddell Parade
ELSTERNWICK
11 548 40 730
GE/PP-23483/2011 221-229 Glen Huntly Road
ELSTERNWICK
11 1147 89 776
GE/PP-24930/2012/A 1056, 1058-1060 Dandenong Road
CARNEGIE
12 4151 173 417
GE/PP-27197/2014/A 14-22 Woorayl Street CARNEGIE 13 2738 138 504
AVERAGE 2088 101 542

APPENDIX C – PROJECTION CALCULATIONS
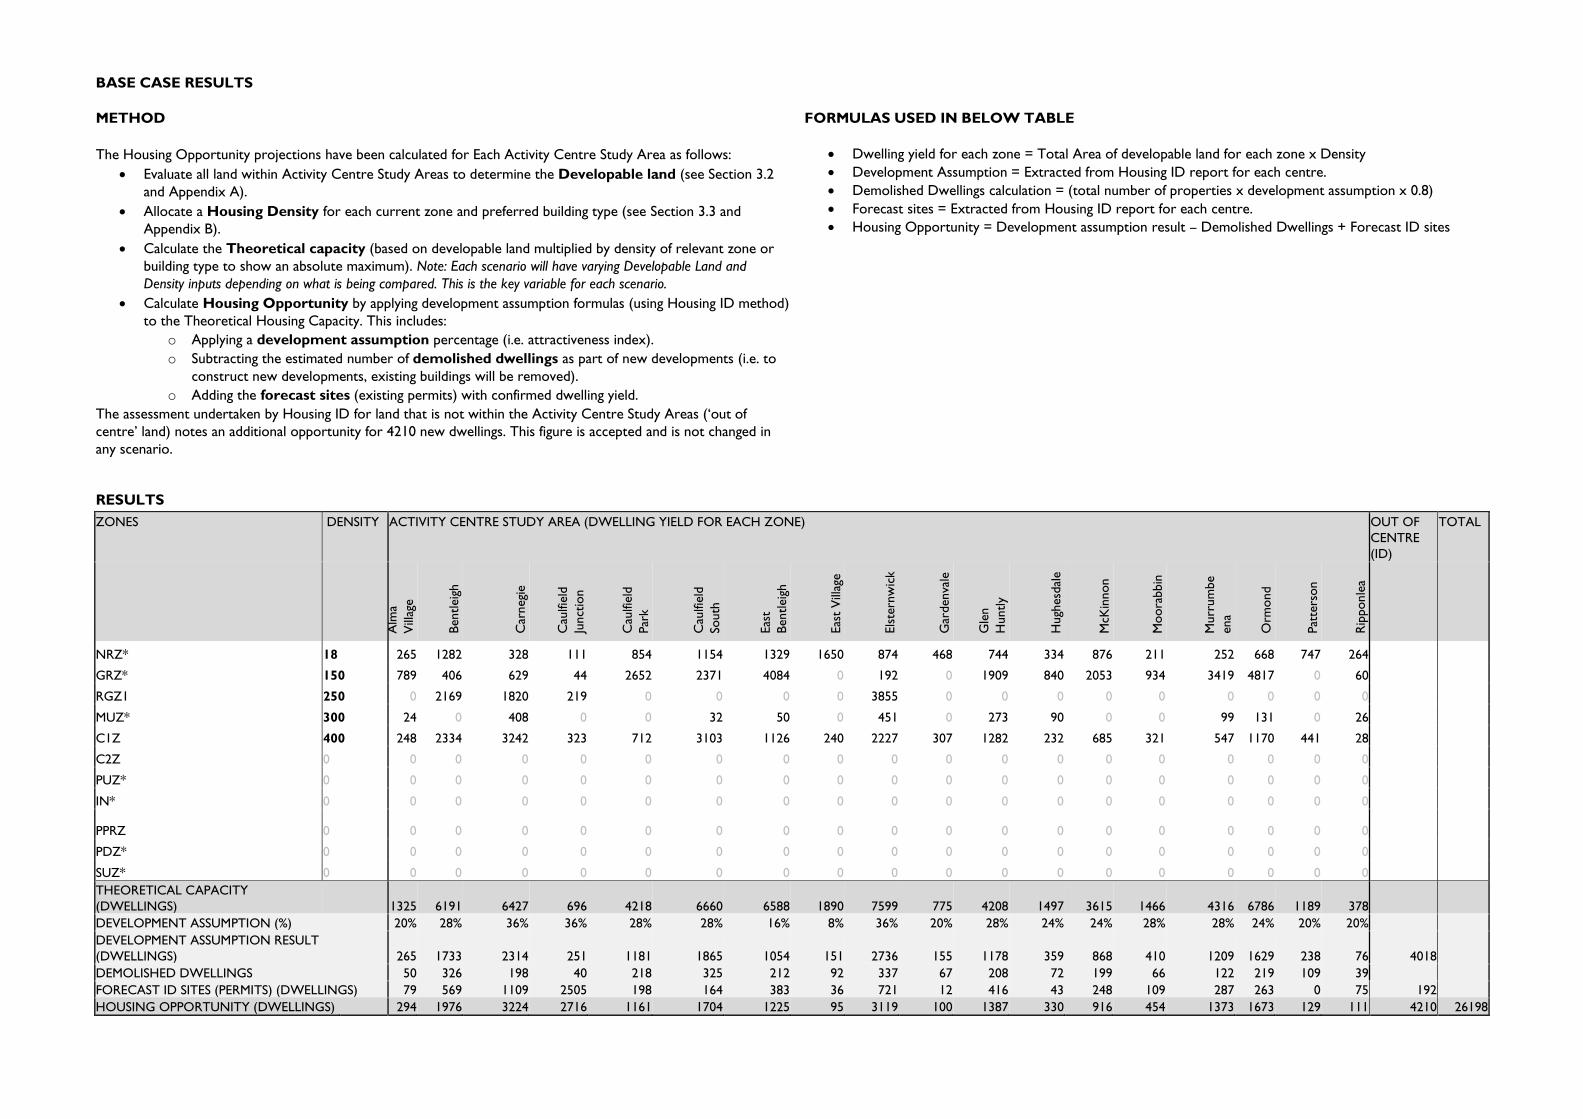
BASE CASE RESULTS
METHOD
The Housing Opportunity projections have been calculated for Each Activity Centre Study Area as follows:
Evaluate all land within Activity Centre Study Areas to determine the Developable land (see Section 3.2
and Appendix A).
Allocate a Housing Density for each current zone and preferred building type (see Section 3.3 and
Appendix B).
Calculate the Theoretical capacity (based on developable land multiplied by density of relevant zone or
building type to show an absolute maximum). Note: Each scenario will have varying Developable Land and
Density inputs depending on what is being compared. This is the key variable for each scenario.
Calculate Housing Opportunity by applying development assumption formulas (using Housing ID method)
to the Theoretical Housing Capacity. This includes:
o Applying a development assumption percentage (i.e. attractiveness index).
o Subtracting the estimated number of demolished dwellings as part of new developments (i.e. to
construct new developments, existing buildings will be removed).
o Adding the forecast sites (existing permits) with confirmed dwelling yield.
The assessment undertaken by Housing ID for land that is not within the Activity Centre Study Areas (‘out of
centre’ land) notes an additional opportunity for 4210 new dwellings. This figure is accepted and is not changed in
any scenario.
FORMULAS USED IN BELOW TABLE
Dwelling yield for each zone = Total Area of developable land for each zone x Density
Development Assumption = Extracted from Housing ID report for each centre.
Demolished Dwellings calculation = (total number of properties x development assumption x 0.8)
Forecast sites = Extracted from Housing ID report for each centre.
Housing Opportunity = Development assumption result – Demolished Dwellings + Forecast ID sites
RESULTS
ZONES DENSITY ACTIVITY CENTRE STUDY AREA (DWELLING YIELD FOR EACH ZONE) OUT OF
CENTRE
(ID)
TOTAL
Alm
a
Vill
age
Bentleig
h
Car
negi
e
Cau
lfie
ld
Junct
ion
Cau
lfie
ld
Par
k
Cau
lfie
ld
South
Eas
t
Bentleig
h
Eas
t V
illag
e
Els
tern
wic
k
Gar
denva
le
Gle
n
Huntly
Hugh
esd
ale
McK
innon
Moora
bbin
Murr
um
be
ena
Orm
ond
Pat
ters
on
Rip
ponle
a
NRZ* 18 265 1282 328 111 854 1154 1329 1650 874 468 744 334 876 211 252 668 747 264
GRZ* 150 789 406 629 44 2652 2371 4084 0 192 0 1909 840 2053 934 3419 4817 0 60
RGZ1 250 0 2169 1820 219 0 0 0 0 3855 0 0 0 0 0 0 0 0 0
MUZ* 300 24 0 408 0 0 32 50 0 451 0 273 90 0 0 99 131 0 26
C1Z 400 248 2334 3242 323 712 3103 1126 240 2227 307 1282 232 685 321 547 1170 441 28
C2Z 0 0 0 0 0 0 0 0 0 0 0 0 0 0 0 0 0 0 0
PUZ* 0 0 0 0 0 0 0 0 0 0 0 0 0 0 0 0 0 0 0
IN* 0 0 0 0 0 0 0 0 0 0 0 0 0 0 0 0 0 0 0
PPRZ 0 0 0 0 0 0 0 0 0 0 0 0 0 0 0 0 0 0 0
PDZ* 0 0 0 0 0 0 0 0 0 0 0 0 0 0 0 0 0 0 0
SUZ* 0 0 0 0 0 0 0 0 0 0 0 0 0 0 0 0 0 0 0
THEORETICAL CAPACITY
(DWELLINGS) 1325 6191 6427 696 4218 6660 6588 1890 7599 775 4208 1497 3615 1466 4316 6786 1189 378
DEVELOPMENT ASSUMPTION (%) 20% 28% 36% 36% 28% 28% 16% 8% 36% 20% 28% 24% 24% 28% 28% 24% 20% 20%
DEVELOPMENT ASSUMPTION RESULT
(DWELLINGS) 265 1733 2314 251 1181 1865 1054 151 2736 155 1178 359 868 410 1209 1629 238 76 4018
DEMOLISHED DWELLINGS 50 326 198 40 218 325 212 92 337 67 208 72 199 66 122 219 109 39
FORECAST ID SITES (PERMITS) (DWELLINGS) 79 569 1109 2505 198 164 383 36 721 12 416 43 248 109 287 263 0 75 192
HOUSING OPPORTUNITY (DWELLINGS) 294 1976 3224 2716 1161 1704 1225 95 3119 100 1387 330 916 454 1373 1673 129 111 4210 26198
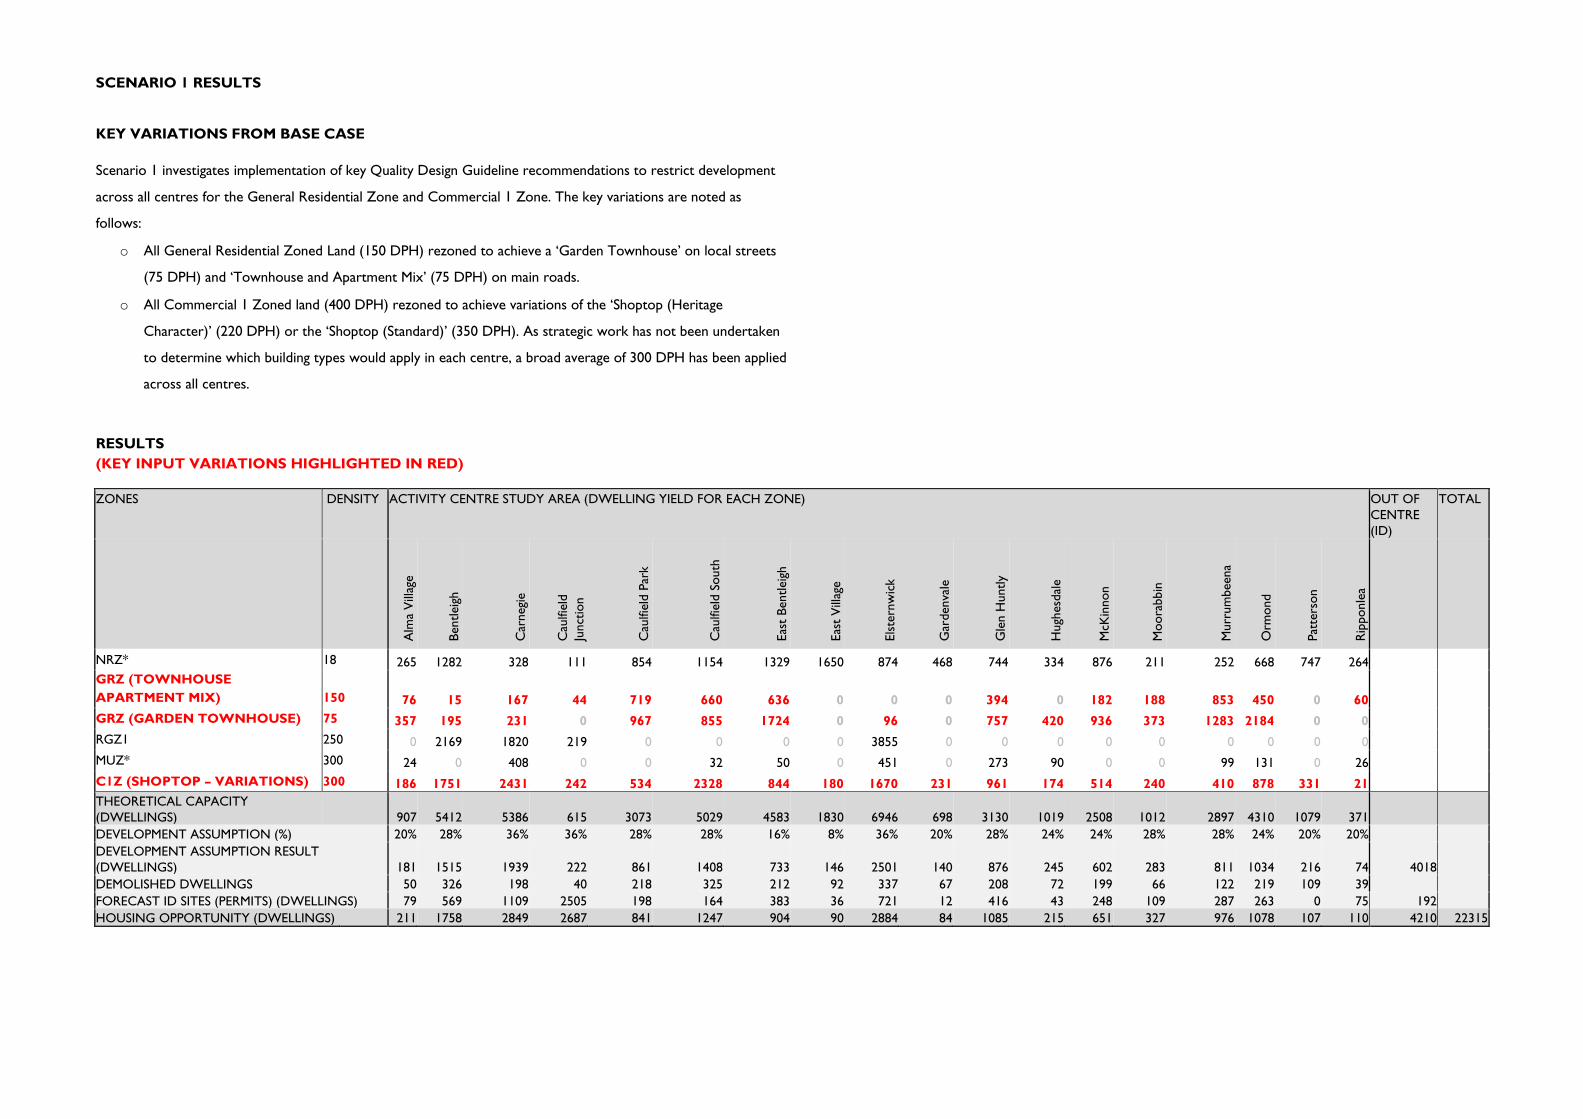
SCENARIO 1 RESULTS
KEY VARIATIONS FROM BASE CASE
Scenario 1 investigates implementation of key Quality Design Guideline recommendations to restrict development
across all centres for the General Residential Zone and Commercial 1 Zone. The key variations are noted as
follows:
o All General Residential Zoned Land (150 DPH) rezoned to achieve a ‘Garden Townhouse’ on local streets
(75 DPH) and ‘Townhouse and Apartment Mix’ (75 DPH) on main roads.
o All Commercial 1 Zoned land (400 DPH) rezoned to achieve variations of the ‘Shoptop (Heritage
Character)’ (220 DPH) or the ‘Shoptop (Standard)’ (350 DPH). As strategic work has not been undertaken
to determine which building types would apply in each centre, a broad average of 300 DPH has been applied
across all centres.
RESULTS
(KEY INPUT VARIATIONS HIGHLIGHTED IN RED)
ZONES DENSITY ACTIVITY CENTRE STUDY AREA (DWELLING YIELD FOR EACH ZONE) OUT OF
CENTRE
(ID)
TOTAL
Alm
a V
illag
e
Bentleig
h
Car
negi
e
Cau
lfie
ld
Junct
ion
Cau
lfie
ld P
ark
Cau
lfie
ld S
outh
Eas
t B
entleig
h
Eas
t V
illag
e
Els
tern
wic
k
Gar
denva
le
Gle
n H
untly
Hugh
esd
ale
McK
innon
Moora
bbin
Murr
um
beena
Orm
ond
Pat
ters
on
Rip
ponle
a
NRZ* 18 265 1282 328 111 854 1154 1329 1650 874 468 744 334 876 211 252 668 747 264
GRZ (TOWNHOUSE
APARTMENT MIX) 150 76 15 167 44 719 660 636 0 0 0 394 0 182 188 853 450 0 60
GRZ (GARDEN TOWNHOUSE) 75 357 195 231 0 967 855 1724 0 96 0 757 420 936 373 1283 2184 0 0
RGZ1 250 0 2169 1820 219 0 0 0 0 3855 0 0 0 0 0 0 0 0 0
MUZ* 300 24 0 408 0 0 32 50 0 451 0 273 90 0 0 99 131 0 26
C1Z (SHOPTOP – VARIATIONS) 300 186 1751 2431 242 534 2328 844 180 1670 231 961 174 514 240 410 878 331 21
THEORETICAL CAPACITY
(DWELLINGS) 907 5412 5386 615 3073 5029 4583 1830 6946 698 3130 1019 2508 1012 2897 4310 1079 371
DEVELOPMENT ASSUMPTION (%) 20% 28% 36% 36% 28% 28% 16% 8% 36% 20% 28% 24% 24% 28% 28% 24% 20% 20%
DEVELOPMENT ASSUMPTION RESULT
(DWELLINGS) 181 1515 1939 222 861 1408 733 146 2501 140 876 245 602 283 811 1034 216 74 4018
DEMOLISHED DWELLINGS 50 326 198 40 218 325 212 92 337 67 208 72 199 66 122 219 109 39
FORECAST ID SITES (PERMITS) (DWELLINGS) 79 569 1109 2505 198 164 383 36 721 12 416 43 248 109 287 263 0 75 192
HOUSING OPPORTUNITY (DWELLINGS) 211 1758 2849 2687 841 1247 904 90 2884 84 1085 215 651 327 976 1078 107 110 4210 22315
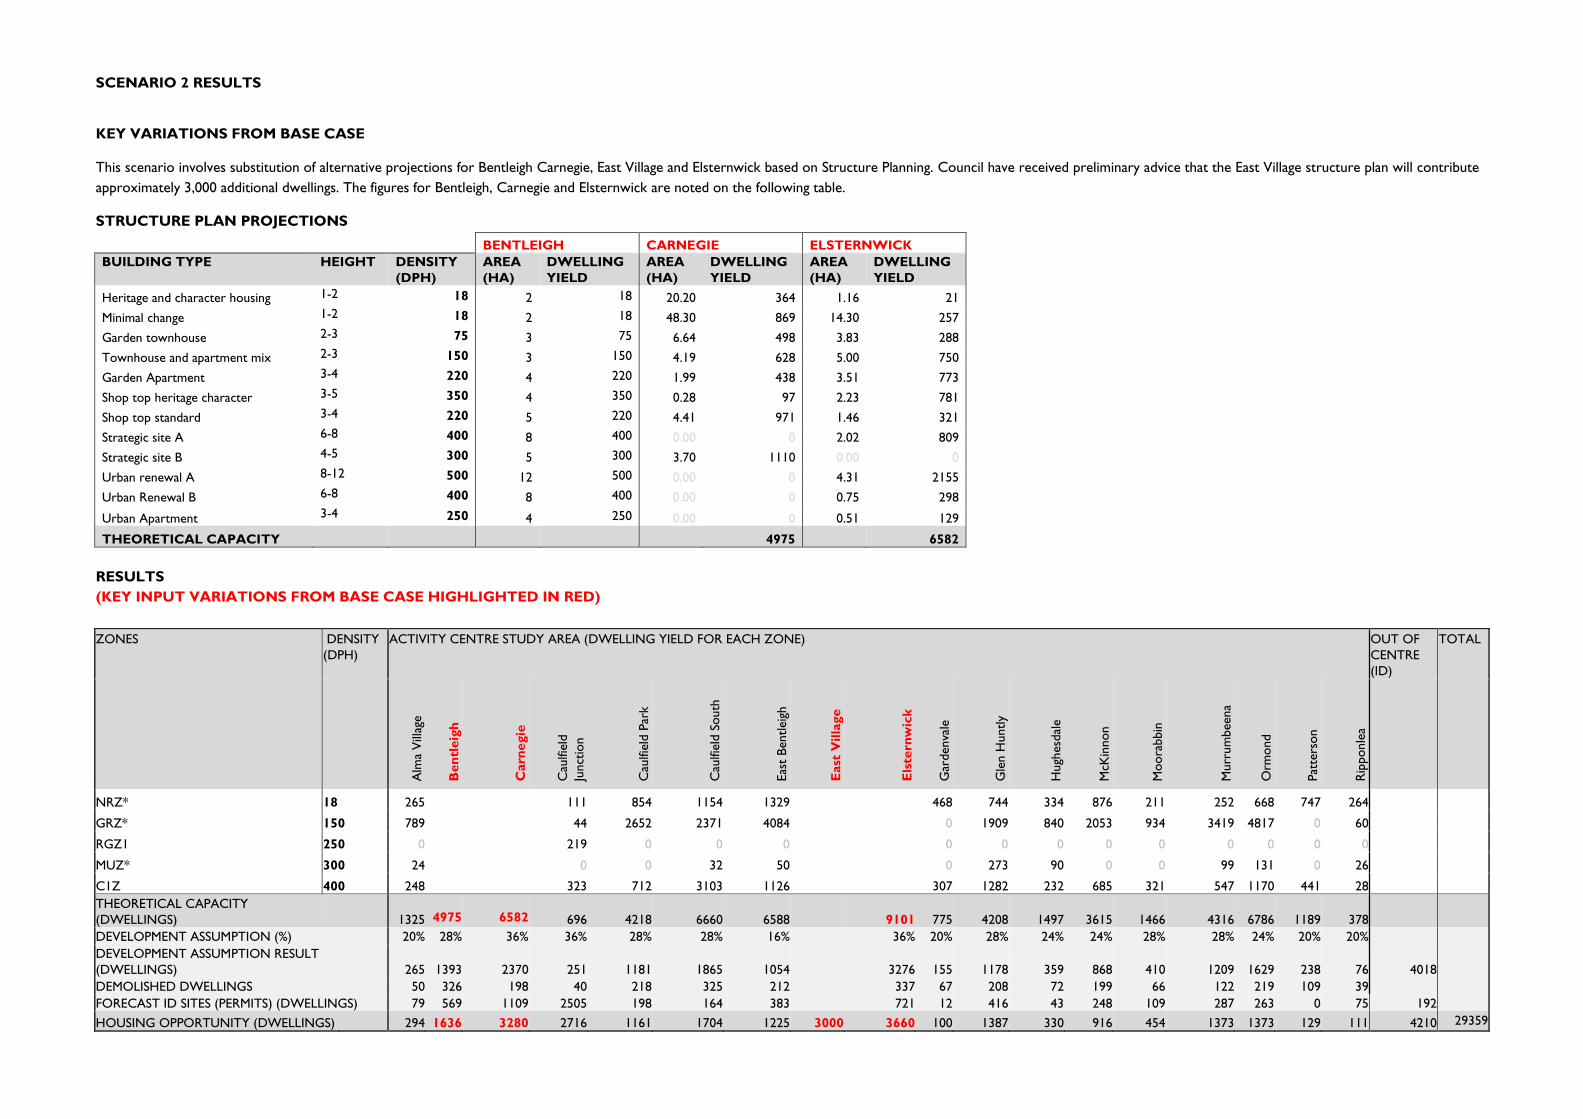
SCENARIO 2 RESULTS
KEY VARIATIONS FROM BASE CASE
This scenario involves substitution of alternative projections for Bentleigh Carnegie, East Village and Elsternwick based on Structure Planning. Council have received preliminary advice that the East Village structure plan will contribute
approximately 3,000 additional dwellings. The figures for Bentleigh, Carnegie and Elsternwick are noted on the following table.
STRUCTURE PLAN PROJECTIONS
BENTLEIGH CARNEGIE ELSTERNWICK
BUILDING TYPE HEIGHT DENSITY
(DPH)
AREA
(HA)
DWELLING
YIELD
AREA
(HA)
DWELLING
YIELD
AREA
(HA)
DWELLING
YIELD
Heritage and character housing 1-2 18 2 18 20.20 364 1.16 21
Minimal change 1-2 18 2 18 48.30 869 14.30 257
Garden townhouse 2-3 75 3 75 6.64 498 3.83 288
Townhouse and apartment mix 2-3 150 3 150 4.19 628 5.00 750
Garden Apartment 3-4 220 4 220 1.99 438 3.51 773
Shop top heritage character 3-5 350 4 350 0.28 97 2.23 781
Shop top standard 3-4 220 5 220 4.41 971 1.46 321
Strategic site A 6-8 400 8 400 0.00 0 2.02 809
Strategic site B 4-5 300 5 300 3.70 1110 0.00 0
Urban renewal A 8-12 500 12 500 0.00 0 4.31 2155
Urban Renewal B 6-8 400 8 400 0.00 0 0.75 298
Urban Apartment 3-4 250 4 250 0.00 0 0.51 129
THEORETICAL CAPACITY 4975 6582
RESULTS
(KEY INPUT VARIATIONS FROM BASE CASE HIGHLIGHTED IN RED)
ZONES DENSITY
(DPH)
ACTIVITY CENTRE STUDY AREA (DWELLING YIELD FOR EACH ZONE) OUT OF
CENTRE
(ID)
TOTAL
Alm
a V
illag
e
Ben
tleig
h
Carn
egie
Cau
lfie
ld
Junct
ion
Cau
lfie
ld P
ark
Cau
lfie
ld S
outh
Eas
t B
entleig
h
East
Villa
ge
Els
tern
wic
k
Gar
denva
le
Gle
n H
untly
Hugh
esd
ale
McK
innon
Moora
bbin
Murr
um
beena
Orm
ond
Pat
ters
on
Rip
ponle
a
NRZ* 18 265 111 854 1154 1329 468 744 334 876 211 252 668 747 264
GRZ* 150 789 44 2652 2371 4084 0 1909 840 2053 934 3419 4817 0 60
RGZ1 250 0 219 0 0 0 0 0 0 0 0 0 0 0 0
MUZ* 300 24 0 0 32 50 0 273 90 0 0 99 131 0 26
C1Z 400 248 323 712 3103 1126 307 1282 232 685 321 547 1170 441 28
THEORETICAL CAPACITY
(DWELLINGS) 1325 4975 6582 696 4218 6660 6588 9101 775 4208 1497 3615 1466 4316 6786 1189 378
DEVELOPMENT ASSUMPTION (%) 20% 28% 36% 36% 28% 28% 16% 36% 20% 28% 24% 24% 28% 28% 24% 20% 20%
DEVELOPMENT ASSUMPTION RESULT
(DWELLINGS) 265 1393 2370 251 1181 1865 1054 3276 155 1178 359 868 410 1209 1629 238 76 4018
DEMOLISHED DWELLINGS 50 326 198 40 218 325 212 337 67 208 72 199 66 122 219 109 39
FORECAST ID SITES (PERMITS) (DWELLINGS) 79 569 1109 2505 198 164 383 721 12 416 43 248 109 287 263 0 75 192
HOUSING OPPORTUNITY (DWELLINGS) 294 1636 3280 2716 1161 1704 1225 3000 3660 100 1387 330 916 454 1373 1373 129 111 4210 29359
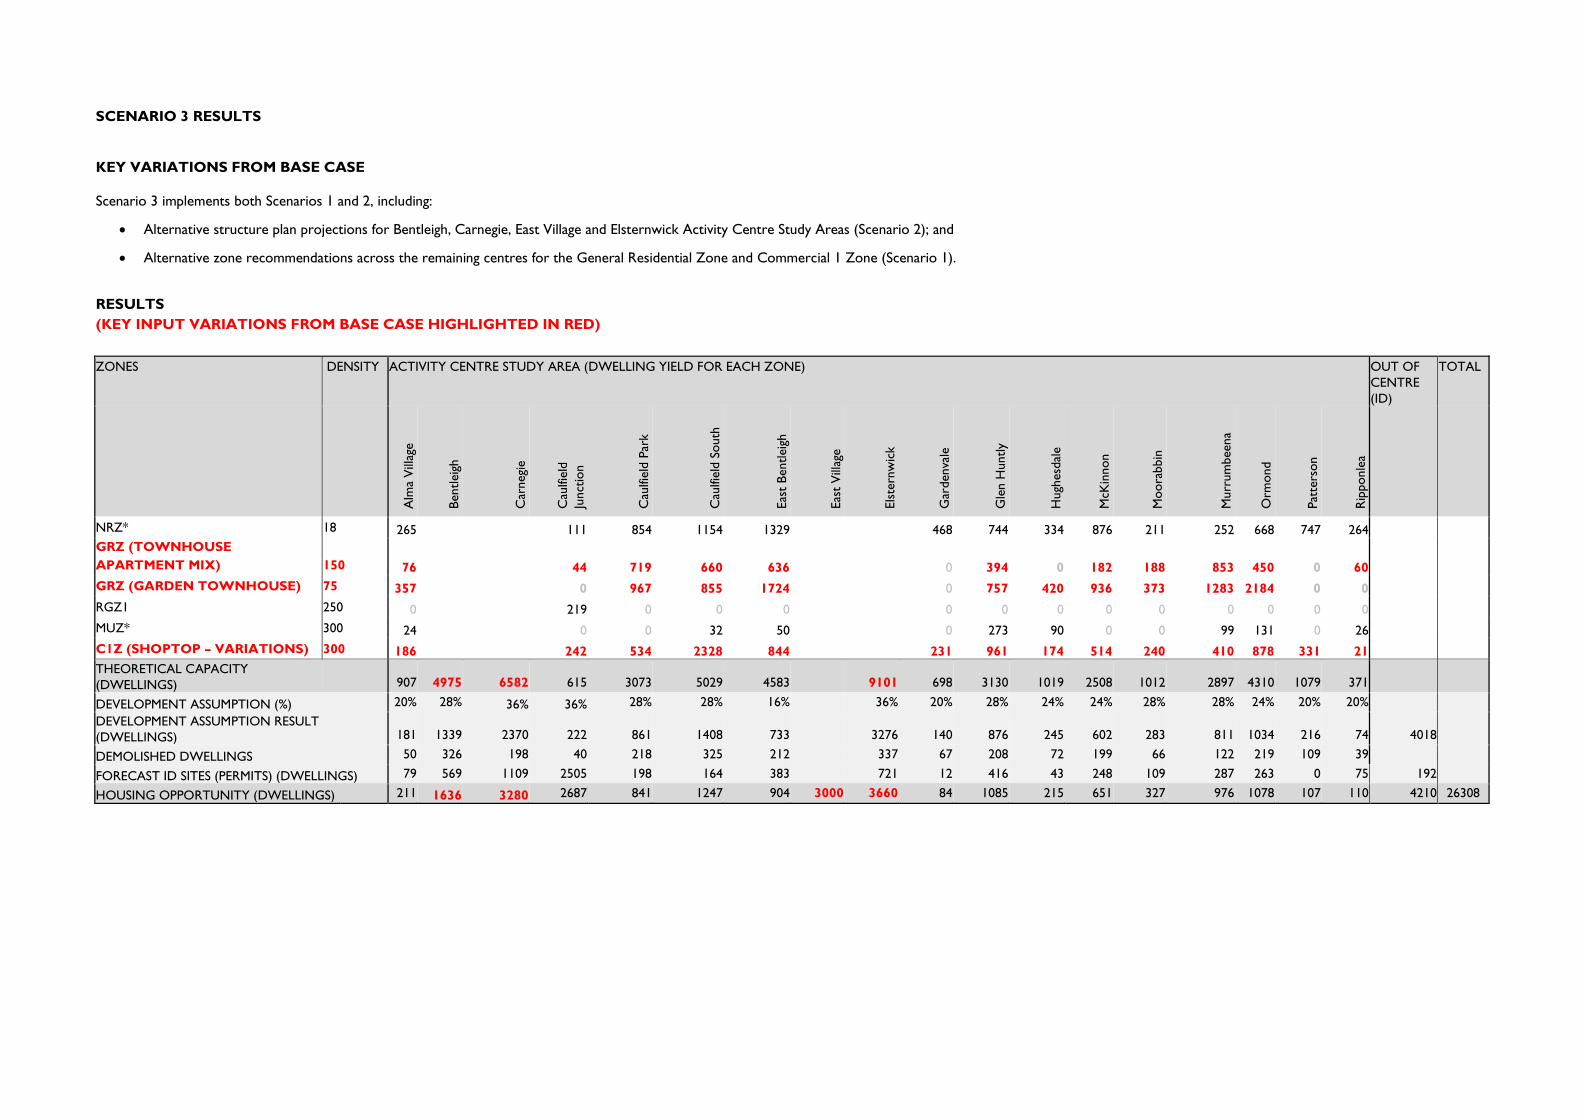
SCENARIO 3 RESULTS
KEY VARIATIONS FROM BASE CASE
Scenario 3 implements both Scenarios 1 and 2, including:
Alternative structure plan projections for Bentleigh, Carnegie, East Village and Elsternwick Activity Centre Study Areas (Scenario 2); and
Alternative zone recommendations across the remaining centres for the General Residential Zone and Commercial 1 Zone (Scenario 1).
RESULTS
(KEY INPUT VARIATIONS FROM BASE CASE HIGHLIGHTED IN RED)
ZONES DENSITY ACTIVITY CENTRE STUDY AREA (DWELLING YIELD FOR EACH ZONE) OUT OF
CENTRE
(ID)
TOTAL
Alm
a V
illag
e
Bentleig
h
Car
negi
e
Cau
lfie
ld
Junct
ion
Cau
lfie
ld P
ark
Cau
lfie
ld S
outh
Eas
t B
entleig
h
Eas
t V
illag
e
Els
tern
wic
k
Gar
denva
le
Gle
n H
untly
Hugh
esd
ale
McK
innon
Moora
bbin
Murr
um
beena
Orm
ond
Pat
ters
on
Rip
ponle
a
NRZ* 18 265 111 854 1154 1329 468 744 334 876 211 252 668 747 264
GRZ (TOWNHOUSE
APARTMENT MIX) 150 76 44 719 660 636 0 394 0 182 188 853 450 0 60
GRZ (GARDEN TOWNHOUSE) 75 357 0 967 855 1724 0 757 420 936 373 1283 2184 0 0
RGZ1 250 0 219 0 0 0 0 0 0 0 0 0 0 0 0
MUZ* 300 24 0 0 32 50 0 273 90 0 0 99 131 0 26
C1Z (SHOPTOP – VARIATIONS) 300 186 242 534 2328 844 231 961 174 514 240 410 878 331 21
THEORETICAL CAPACITY
(DWELLINGS) 907 4975 6582 615 3073 5029 4583 9101 698 3130 1019 2508 1012 2897 4310 1079 371
DEVELOPMENT ASSUMPTION (%) 20% 28% 36% 36% 28% 28% 16% 36% 20% 28% 24% 24% 28% 28% 24% 20% 20%
DEVELOPMENT ASSUMPTION RESULT
(DWELLINGS) 181 1339 2370 222 861 1408 733 3276 140 876 245 602 283 811 1034 216 74 4018
DEMOLISHED DWELLINGS 50 326 198 40 218 325 212 337 67 208 72 199 66 122 219 109 39
FORECAST ID SITES (PERMITS) (DWELLINGS) 79 569 1109 2505 198 164 383 721 12 416 43 248 109 287 263 0 75 192
HOUSING OPPORTUNITY (DWELLINGS) 211 1636 3280 2687 841 1247 904 3000 3660 84 1085 215 651 327 976 1078 107 110 4210 26308