planning process ► early transport planning engineering-oriented 1944, first “ o-d ” study ...
TRANSCRIPT

Planning ProcessPlanning Process
►Early Transport PlanningEarly Transport Planning Engineering-orientedEngineering-oriented 1944, First 1944, First ““O-DO-D”” study study Computational advances helped launch Computational advances helped launch
new era in planningnew era in planning
Planning ProcessPlanning Process
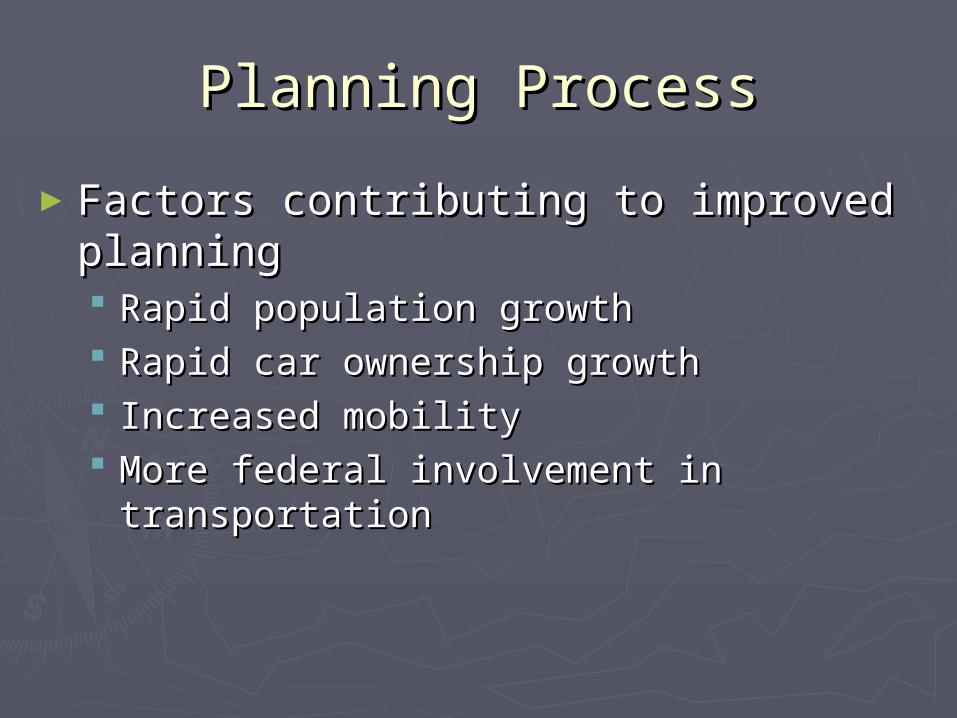
►Factors contributing to improved Factors contributing to improved planningplanning Rapid population growthRapid population growth Rapid car ownership growthRapid car ownership growth Increased mobilityIncreased mobility More federal involvement in More federal involvement in
transportationtransportation

Planning ProcessPlanning Process
►1963 Federal Aid Highway Act1963 Federal Aid Highway Act Instituted Instituted ““3C3C”” process process
►ContinuingContinuing►ComprehensiveComprehensive►CooperativeCooperative
Made federal funds contingent upon 3C Made federal funds contingent upon 3C processprocess

Planning ProcessPlanning Process
►Feds also acted as technical Feds also acted as technical assistanceassistance Technology transferTechnology transfer Manuals and guidesManuals and guides Creation of standardsCreation of standards
►PlanningPlanning►AnalysisAnalysis►ImplementationImplementation

Planning ProcessPlanning Process
►Federal involvement expandedFederal involvement expanded What was just the Bureau of Public Roads What was just the Bureau of Public Roads
soon becamesoon became►FHWAFHWA►UMTA (now FTA)UMTA (now FTA)
More requirementsMore requirements►NEPANEPA►TSMTSM►TIPTIP

Planning ProcessPlanning Process
►Devolution in 1980sDevolution in 1980s Feds became more or less Feds became more or less ““advisoryadvisory”” Mandates existed, but flexibility Mandates existed, but flexibility
encouragedencouraged Planning didnPlanning didn’’t change, transport patterns t change, transport patterns
diddid

Planning ProcessPlanning Process
►Federal resurgenceFederal resurgence Recognizing regional travel patternsRecognizing regional travel patterns
►Multi-jurisdictional solutions required Multi-jurisdictional solutions required involvement at a higher levelinvolvement at a higher level
Tied transportation plans to Tied transportation plans to environmental planningenvironmental planning►Transportation plans could not contribute to Transportation plans could not contribute to
the degradation of air qualitythe degradation of air quality

Transportation and Land Transportation and Land Development CycleDevelopment Cycle
Land Use Change
Increased TrafficGeneration
Increased TrafficConflict
Deterioration inLevel-of-Service
Arterial Improvements
Increased AccessibilityIncreased Land Value

Street ClassificationStreet Classification

Street ClassificationStreet Classification

Transportation Planning Process
Pre-Analysis Phase•Problem/Issue Identification•Formulation of Goals and Objectives•Data Collection•Generation of Alternatives
Technical Analysis Phase•Land Use Activity System Model•UTMS (or, UTPS; or UTPP)•Impact Prediction Models
Post Analysis Phase•Evaluation of Alternatives•Decision Making•Implementation of Plan•Monitoring

Transportation Planning Transportation Planning ProcessProcess
► InputsInputs land use activity systemland use activity system transportation system transportation system
characteristicscharacteristics
►OutputsOutputs Quantity (volume)Quantity (volume) Quality (speed)Quality (speed)
► U.T.M.S.U.T.M.S. Trip GenerationTrip Generation Trip DistributionTrip Distribution Mode ChoiceMode Choice Trip AssignmentTrip Assignment

Inputs for UTMSInputs for UTMS
►Transportation System CharacteristicsTransportation System Characteristics Layout of transportation networkLayout of transportation network Speed, Directionality, Turn RestrictionsSpeed, Directionality, Turn Restrictions
►Land Use Activity System CharacteristicsLand Use Activity System Characteristics Region divided into Region divided into ““zoneszones”” Each zone has its own unique characteristicsEach zone has its own unique characteristics
►land useland use►social and economic attributessocial and economic attributes


Watauga County V/C
Boone V/C


1
2 3
4 5

Urban Transportation Model Urban Transportation Model SystemSystem
►Trip GenerationTrip Generation ““How many trips?How many trips?”” Predicting quantity of travel to and from a Predicting quantity of travel to and from a
piece of landpiece of land Depends on characteristics of the landDepends on characteristics of the land
►land use type and intensityland use type and intensity►socioeconomic characteristics of activities socioeconomic characteristics of activities
using the landusing the land

Linear Regression for TGLinear Regression for TG

Urban Transportation Model Urban Transportation Model SystemSystem
►Trip DistributionTrip Distribution ““Where do they go?Where do they go?”” Links origins and destinationsLinks origins and destinations
►how many from zone how many from zone ‘‘aa ’’ goes to all other goes to all other zones?zones?
►how many to zone how many to zone ‘‘aa ’’ comes from all other comes from all other zoneszones
Dependent upon:Dependent upon:►attractiveness of zoneattractiveness of zone►““frictionfriction””, or difficulty of travel, or difficulty of travel

Simple Gravity ModelSimple Gravity Model
Tobler’s First Law of Geography: Everything is related to everything else, but near things are more related than distant things.

Intervening OpportunitiesIntervening Opportunities
# of trips
# of opportunities at destination
# of intervening opportunities
calibrating constant

Urban Transportation Model Urban Transportation Model SystemSystem
►Mode ChoiceMode Choice ““How do they travel?How do they travel?”” Predicts the share of travel by modePredicts the share of travel by mode
►autoauto►transittransit
Dependent uponDependent upon►cost of travel by modecost of travel by mode►socioeconomic characteristicssocioeconomic characteristics

Mode Choice ModelMode Choice Model
Variable
Meaning
T Travel Time (in hours)
C Travel Cost (in dollars)
Y Annual Income (in 000’s)
Mode Time Cost
Drive 0.50 2.00
Carpool 0.75 1.00
Bus 1.00 .75
Mode Y=40 Y=10
Drive
Carpool
Bus

Urban Transportation Model Urban Transportation Model SystemSystem
►Trip AssignmentTrip Assignment ““By what route?By what route?”” Predicting what parts of the network will Predicting what parts of the network will
be used to travel between origin and be used to travel between origin and destinationdestination
Dependent upon:Dependent upon:►all alternative routes (and their attractiveness)all alternative routes (and their attractiveness)
distancedistance travel timetravel time perceived safetyperceived safety

Trip AssignmentTrip Assignment
►All or nothingAll or nothing Find shortest path for between two zonesFind shortest path for between two zones Load all trips on that pathLoad all trips on that path

Trip AssignmentTrip Assignment
► Incremental Loading (feedback)Incremental Loading (feedback) Split total flow in to subsets (i.e, 5% Split total flow in to subsets (i.e, 5%
samples)samples) Find shortest path between zonesFind shortest path between zones Load first 5% of trips onto that pathLoad first 5% of trips onto that path Re-analyze shortest pathRe-analyze shortest path Load next 5% of trips onto that pathLoad next 5% of trips onto that path Repeat until total flow is dispensed withRepeat until total flow is dispensed with

Output of UTMSOutput of UTMS
►QuantityQuantity Volume of traffic on networkVolume of traffic on network
►QualityQuality Flow of traffic on networkFlow of traffic on network

Volume to Capacity Ratios Volume to Capacity Ratios (V/C)(V/C)
►Traffic volume compared to the capacity of Traffic volume compared to the capacity of a segment of the networka segment of the network Different street classifications have different Different street classifications have different
capacitiescapacities
►v/c = 1: volume of traffic equals capacityv/c = 1: volume of traffic equals capacity►v/c less than 1: capacity of street not metv/c less than 1: capacity of street not met►v/c greater than 1: traffic exceeds capacityv/c greater than 1: traffic exceeds capacity

Levels of Service (LOS)
► AA Free FlowFree Flow
► Freedom of ChoiceFreedom of Choice
► BB Stable Flow (I)Stable Flow (I)
► Choice slightly affected Choice slightly affected by othersby others
► CC Stable Flow (II)Stable Flow (II)
► Choice significantly Choice significantly affected by othersaffected by others
►DD High Density FlowHigh Density Flow
► Freedom to maneuver Freedom to maneuver severely restrictedseverely restricted
► EE At or Near CapacityAt or Near Capacity
► Unstable operations Unstable operations (small changes = large (small changes = large effects)effects)
► FF Breakdown FlowBreakdown Flow
► traffic approaching traffic approaching exceeds traffic exitingexceeds traffic exiting

From: Route 228 Improvement Project – Pennsylvania DOT

Impact Prediction ModelsImpact Prediction Models
►Assessing the Assessing the consequencesconsequences of of alternativesalternatives
►Using UTMS predictions as inputs to Using UTMS predictions as inputs to estimate:estimate: construction and operating costsconstruction and operating costs energy consumptionenergy consumption air qualityair quality noise levelsnoise levels accident ratesaccident rates

Further Readings/ReviewFurther Readings/Review
►Transportation Models►Impact Models