planning for resilience in east africa through policy, … · 2018-05-14 · iii planning for...
TRANSCRIPT

i
PLANNING FOR RESILIENCE IN EAST AFRICA THROUGH POLICY, ADAPTATION, RESEARCH, AND ECONOMIC DEVELOPMENT (PREPARED) WASH ASSESSMENT PHASE II: APPRAISAL AND BASELINE STUDY FOR KIGALI, MUSANZE, AND NYAGATARE WASH SITES

ii
This publication was produced for review by the United States Agency for International Development by Tetra Tech, through USAID/East Africa Contract No. AID-623-C-13-00003. This report was prepared by:
Tetra Tech 159 Bank Street, Suite 300 Burlington, Vermont 05401 USA Telephone: (802) 495-0282 Fax: (802) 658-4247 E-Mail: [email protected]
Tetra Tech Contacts:
John Parker, Senior Technical Advisor/Manager Tel.: (802) 658-3890 Email: [email protected]
Thomas McCann, Project Manager Tel.: (802) 658-3890 [email protected]
COVER PHOTO: A map showing the improved water supply in the provinces of the Republic of Burundi.

iii
PLANNING FOR RESILIENCE IN EAST AFRICA THROUGH POLICY, ADAPTATION, RESEARCH, AND ECONOMIC DEVELOPMENT (PREPARED) WASH ASSESSMENT PHASE II: APPRAISAL AND BASELINE STUDY FOR KIGALI, MUSANZE, AND NYAGATARE WASH SITES
SEPTEMBER 10, 2014
DISCLAIMER The views expressed in this publication do not necessarily reflect the views of the United States Agency for International Development or the United States Government.

iv
TABLE OF CONTENTS
TABLE OF CONTENTS ................................................................................................................................... iv
LIST OF TABLES............................................................................................................................................. vi
LIST OF FIGURES .......................................................................................................................................... vii
ACRONYMS AND ABBREVIATIONS ............................................................................................................. viii
EXECUTIVE SUMMARY ...................................................................................................................................1
Introduction ............................................................................................................................................................... 1
Baseline information................................................................................................................................................. 1
Proposed interventions ............................................................................................................................................ 3
1.0 BACKGROUND INFORMATION .................................................................................................................4
1.1 Introduction ........................................................................................................................................................ 4
1.2 Overview of Energy Water and Sanitation Authority (EWSA) .................................................................. 5
1.2.1 Nyagatare Water Utility ............................................................................................................................. 8
1.2.2 Musanze EWSA Branch ..........................................................................................................................10
1.2.3 Kigali City ..................................................................................................................................................11
2.0 KEY WASH PROJECT OBJECTIVES ....................................................................................................... 12
3.0 METHODOLOGY ...................................................................................................................................... 13
3.1 Entry/Brief Meetings.......................................................................................................................................13
3.2 Documentary Review ......................................................................................................................................14
3.3 Field Visits .........................................................................................................................................................14
3.4 Exit/Debriefing Meetings ...............................................................................................................................14
3.5 Analysis of Collected Data ..............................................................................................................................14
4.0 FINDINGS AND DISCUSSION ................................................................................................................... 15
4.1 Water Sources ...................................................................................................................................................15
4.1.1 Karenge Water Treatment Plant ............................................................................................................15
4.1.2 Nzove Water Treatment Plant................................................................................................................16

v
4.1.3 Kimisagara Water Treatment Plant........................................................................................................17
4.1.4 Mutobo Water Treatment Plant .............................................................................................................17
4.1.5 Nyagatare Water Treatment Plant..........................................................................................................18
4.2 Distribution network .......................................................................................................................................18
4.3 Regulation of Water and Sanitation Service Provision ...............................................................................20
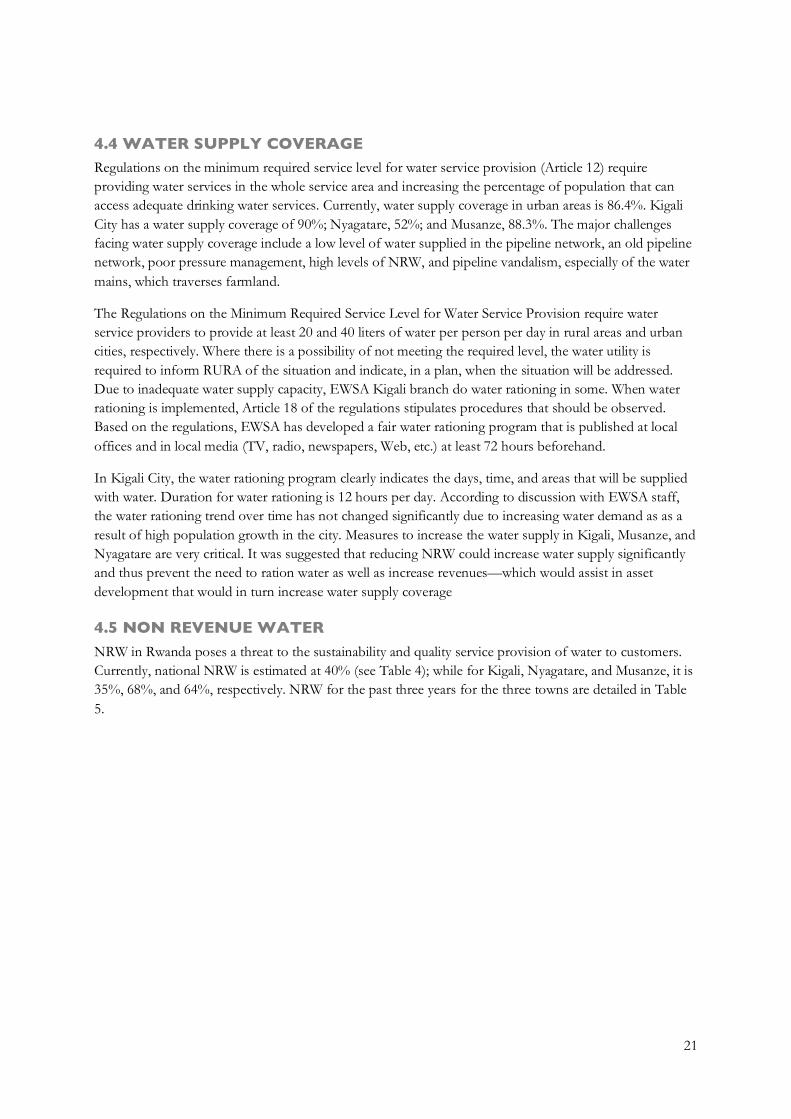
4.4 Water supply Coverage ....................................................................................................................................21
4.5 Non Revenue Water ........................................................................................................................................21
4.6 Connections.......................................................................................................................................................23
4.7 Meter Reading ...................................................................................................................................................24
4.8 Billing and Revenue Collection ......................................................................................................................24
4.8 Complaints Handling .......................................................................................................................................25
4.9 Human Resources ............................................................................................................................................26
5.0 PROPOSED WASH INTERVENTION PROJECT ACTIVITIES.................................................................... 27
5.1 Reduction of Non-Revenue Water ................................................................................................................27
5.2 Network and Customer mapping ..................................................................................................................28
5.3 Improvement of Information Management System ...................................................................................28
5.4 Introduce Quality Service Improvement Program .....................................................................................29
5.5 Protection of Water Catchment Areas and Water Pipeline Network System ........................................29
5.6 Skills Development/Capacity Building .........................................................................................................29
6.0 PROPOSED INTERVENTION AND IMPLEMENTATION FRAMEWORK .................................................... 30
7.0 RISKS ANALYSIS ..................................................................................................................................... 31
8.0 CONCLUSION AND RECOMMENDATIONS .............................................................................................. 32
9.0 LIST OF CONTACTED LITERATURE........................................................................................................ 33
10.0 LIST OF CONTACTED PERSONS........................................................................................................... 34
vi
LIST OF TABLES
Table 1: Types, sizes, lengths and ages of the distribution network for Musanze Branch .............................18
Table 2: Types, sizes, length and ages of the distribution network for EWSA Nyagatare Branch ...............18
Table 3: Water Tariffs currently charged by EWSA and other water service providers in Rwanda ..............20
Table 4: Levels of NRW in Rwanda towns. ............................................................................................................22
Table 5: NRW trends from 2010–2011 to 2012–2013 in Kigali, Musanze, and Nyagatare. ...........................22
Table 6: Types of water connections in Kigali City. ..............................................................................................23
Table 7: Types of water connections in Musanze. .................................................................................................23
Table 8: Types of water connections in Nyagatare. ...............................................................................................23
Table 9: Customers billed, annual billing, and annual collection in Musanze. ..................................................24
Table 10: Customers billed, annual billing, and annual collection in Kigali.......................................................25
Table 11: Types and number of customer complaints in Musanze Branch. ......................................................25
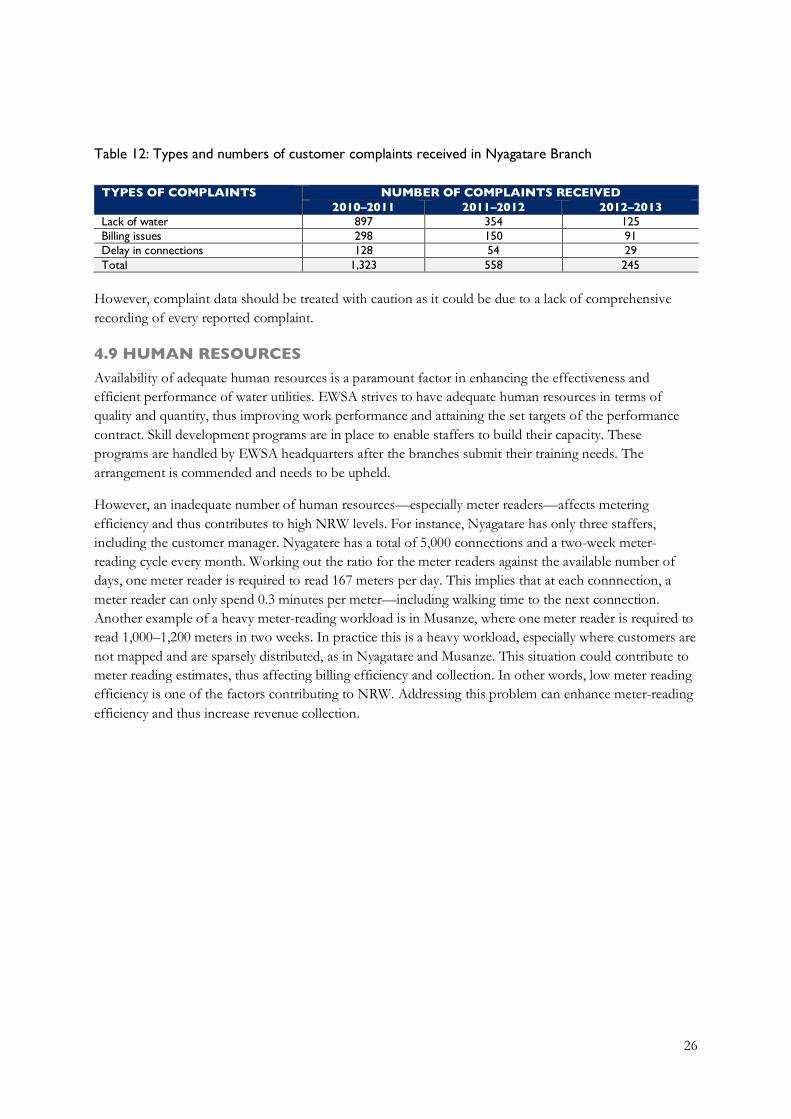
Table 12: Types and numbers of customer complaints received in Nyagatare Branch ...................................26
Table 13: Risk analysis to the proposed interventions. .........................................................................................31

vii
LIST OF FIGURES
Figure 1: Organogram structure of EWSA. .............................................................................................................. 7
Figure 2: General organization structure for EWSA branches .............................................................................. 8
Figure 3: A busy street in Nyagatare Town. .............................................................................................................. 9
Figure 4: The Nyagatare EWRA Branch offices. ...................................................................................................10
Figure 5: The Musanze EWRA Branch offices. .....................................................................................................11
Figure 6: Kigali City’s growing suburb is putting pressure on the water utility.................................................12
Figure 7: WEMA Consult team with senior EWSA staff after a brief meeting in Kigali. ...............................13
Figure 8: The water aeration process at Karenge water treatment. .....................................................................14
Figure 9: Part of the pumping house at the Karenge Water Treatment Plant. .................................................16
Figure 10: One of the 31 wells draining groundwater for the Nzove Water Treatment Plant. ......................16
Figure 11: The Kimisigara Water Treatment Plant’s system is computerized. ..................................................17
Figure 12: The leak detection machine (Sewerin). .................................................................................................19
Figure 13: Possible causes of physical and commercial water losses. .................................................................28

viii
ACRONYMS AND ABBREVIATIONS CBO Community Based Organization
DMA District Meter Areas
EAC East Africa Community
EICV Integrated Household Living Conditions survey
EWSA Energy Water and Sanitation Authority
FRw Rwandan Francs
GCAP Global Climate Adaptation Partnership
GDP Gross Domestic Product
HDPE High-Density Polyethylene
ICPAC IGAD Climate Prediction and Applications Centre
ICT Information Communication Technology
LVBC Lake Victoria Basin Commission
NGO Non-Governmental Organization
NISR National Institute of Statistics of Rwanda
NRW Non-Revenue Water
NWSC National Water and Sewerage Corporation
PIP Performance Improvement Programs
PPR Pipe Penetrating Radar
PREPARED Planning for Resilience in East Africa through Policy, Adaptation, Research, and Economic Development
PVC Polyvinyl Chloride
QSIP Quality Service Improvement Program
RCMRD Regional Centre for Mapping of Resources for Development
RECO Rwanda Electricity Corporation
REGIDESO Water and Electricity Board of Burundi
RURA Rwanda Utilities Regulatory Authority

ix
RWASCO Rwanda Water and Sanitation Corporation
RWASHTF Regional WASH Task Force
USAID United State Agency for International Development
WASH Water Sanitation and Hygiene
WEMA Consult Water and Environmental Management Consultants
WHO World Health Organization
WSS Water Supply and Sanitation
WSSP Water Supply and Sanitation Service Provider
1
EXECUTIVE SUMMARY INTRODUCTION Provision of adequate water supply and sanitation services is a prerequisite and indicator for socio-economic development. Access to drinking water is also a basic amenity, ranked among the highest-priority public services by Rwanda’s population. Rwanda has committed itself to reaching very ambitious targets in water supply and sanitation, with the vision of attaining 100% service coverage by 2020. However, these efforts are hampered by various issues, including low water supply and sanitation coverage, low water production, and high non-revenue water (NRW).
As a strategy to address the challenges facing the Republic of Rwanda and other East Africa Community (EAC) partner states, the United States Agency for International Development (USAID)/East Africa office launched a regional project, Planning for Resilience in East Africa through Policy, Adaptation, Research, and Economic Development (PREPARED), which is aimed at addressing three key challenges:
1. Component 1: Transboundary freshwater biodiversity conservation 2. Component 2: Increased resiliency to climate change 3. Component 3: Improved access to drinking water supply and sanitation services (WASH) This report is for component three (WASH) in the Republic of Rwanda for the three identified WASH sites of Kigali, Musanze, and Nyagatare. Prior to this study, an assessment of the WASH situation (WASH Assessment Phase I) was carried out in all five EAC countries in order to understand the regional WASH outlook. After WASH Assessment Phase I and development/adoption of regional WASH site selection criteria by the Regional WASH Task Force (RWASHTF) in February 2014 in Burundi, the Rwandan delegation selected three priotity WASH sites that will be supported under the PREPARED Project and that were eligible for this WASH Assessment Phase II.
Better understanding of the water utilities would enable the PREPARED Project to formulate interventions that are more specific, thus addressing the real needs of the assessd water utilities. For Rwanda, detailed assessment of water utilities in Nyagatare, Musanze, and Kigali was conducted May 7–15, 2014. The aim of the assessment was to collect detailed baseline data and analyze the water utilities’ capacity to effectively provide WASH services. The team collected data by administering a questionnaire and by having one-on-one discussions with key institutional staff during the entry/exit meetings. The water utilities assessment exercise also used secondary data, interviews, and field observations to gather data.
BASELINE INFORMATION Surface water and groundwater are the main water sources for all the assessed water utilities in the Republic of Rwanda. Lake Mugesera supplies 700 cubic meters of raw water per hour to the Karenge Water Treatment Plant; the Yanze River supplies about 1,000 cubic meters of raw water per hour to the Kimisagara Water Treatment Plant; the Nzove Water Treatment Plant receives 1,262 cubic meters of groundwater per hour from 31 wells located in the outskirts of the city. The Karenge, Kimisagara and Nzove water treatment plants supply treated water to Kigali City, with a population of 1,135,394 people residing in the districts of Gasabo, Nyarugenge and Kicukiro.
Nyagatare has two water sources: groundwater and surface water. The groundwater comes from seven water springs, namely:

2
Cyondo, Gihengeri, Tovu, Rwabugeyo, NKG, Rwasama, and Kanwririr springs, which combined produce 6,508.4 cubic meters of water daily. The surface water is taken from the Umuvumba River, with an average abstraction rate of 300 cubic meters daily. The Karenge Water Treatment Plant has the capacity to produce 14,000 cubic meters of water daily. Water treatment includes chlorination by adding 250 kg of calcium hypochlorite daily. The Nzove Water Treatment Plant has a capacity of producing 28,000 cubic meters of water daily. The Kimisagara Water Treatment Plant abstracts raw water from the Yanze River at a rate of 1,000 cubic meters per hour and has the capacity to produce 22,000 cubic meters of water daily.
The water sources for Musanze are two springs, namely Mutobo and Rubidi, which are located south of Musanze The two springs produce a combined volume of 1,000 cubic meters per hour, divided as follows:
1. Mutobo Spring produces 600 cubic meters of water per hour. 2. Rubidi Spring produces 400 cubic meters of water per hour. The Mutobo Water Treatment Plant receives water from the Mutobo and Rubidi springs and produces treated water amounting to 10,000 cubic meters daily. It is worth noting here that the installed capacity of the Mutobo treatment plant is 12,500 cubic meters per day. Thus, it is operating below designed capacity.
The water supply distribution network consists of the trunk mains and reticulation networks made of polyvinyl chloride (PVC), high-density polyethylene (HDPE), ductile iron, steel, and pipe penetrating radar (PPR). The length of the water supply distribution network is
1. 348.22 km (for Musanze), 2. 205 km (for Nyagatare), and 3. 2,080 km (for Kigali City).
The major challenges facing the network system include aged pipes, which lead to frequent bursts and leakages; illegal connections; inadequate pressure management; and rust, mainly for steel pipes. On the other hand, network system leakages are being attributed to old pipeline, illegal connections, vandalism, high water pressure, and poor connections (due to the use of substandard materials, water hammers at the treatment plant caused by a lack of surge vessels, and breakages caused by road construction [a result of poor urban planning]).
Regulations on the minimum required service level of water service requires providing to the whole service area and to increase the percentage of the population that can access adequate drinking water. Currently, the average water supply coverage in urban areas stands at 86.4%. Kigali City has a water supply coverage of 90%; Nyagatare’s is 52%; and Musanze’s is 88.3%. The major challenges to water supply coverage include a low level of water supplied by the network, an aging water network, high NRW, and water network vandalism. NRW in Rwanda poses a threat to the sustainability and quality of water supply service provision. The national NRW for Rwanda is estimated at 40%; while for Kigali, Nyagatare, and Musanze, it is 35%, 68% and 64%, respectively. The main causes of NRW in the visited towns are similar to the challenges faced by the water distribution networks as named above. Other challenges include overflow of reservoirs; a lack of customer mapping; and a sparse population distribution, especially in the rural areas, thus making it difficult for meter readers to reach.
At the time of this assesssment, the number of connections in Kigali is estimated to be 71,188. The active connections are 62,202, accounting for 87.4.%; while the inactive accounts are estimated to be 8,986 (12.6% of the total connection). For Musanze, the total number of connection is 7,597, of which 593 or 7.8% of these total connections are inactive. Nyagatare has 4,512 connections, with 1,100 inactive accounts (24.4%). The Energy Water and Sanitation Authority (EWSA) bills its customers every month. In Musanze, the average water volume billed per month is 113,630 cubic meters which generate about

3
60,872,863 Rwandan Francs (FRw) per month, roughly equivalent to US$88,221.50. The average revenue collected from the billed amount is about RFR 701,255,572, roughly equivalent to US$1,016,312.4. In Nyagatare, the average monthly water volume billed is 65,000 cubic meters, with revenue amounting to US$33,873.40 per month. In Kigali, the average monthly water volume billed is 1,181,693 cubic meters (14,180,318 cubic meters per year); monthly water billings are US$975,285 (US$11,703,422 per year).
With regard to handling customer complaints, the Energy Water and Sewerage Authority (EWSA) registers and log in complaints through telephone, in person, short message service (SMS), and mail. Appropriate measures are taken to ensure that customers are satisfied with service provision as required by the Rwanda Utility Regulatory authority (RURA). The emphasis is put on making sure that the minimum required service level on water service provision—as specified by governing authorities—is met.
PROPOSED INTERVENTIONS Based on the results of this study, the following interventions would be viable for the utilities and the PREPARED Project and are therefore proposed:
1. NRW reduction, starting with a diagnostic study to identify the specific contributing factors of physical and commercial losses
2. Network and customer mapping, so as to establish district meter areas for enhancing monitoring activities
3. Improvement of information management system to make it live, web-based, and customized according to EWSA needs
4. Introduction of a quality service improvement program (QSIP); protection of water catchment areas; and network system and skills development
The approach to be used in implementing the proposed activities is that EWSA will be the lead agency for the entire process. However, for activities such as protection of water catchment, sources, and the environment, this can be contracted to other actors, such as Non-Governmental Organizations (NGOs) and community groups through special agreement.

4
1.0 BACKGROUND INFORMATION 1.1 INTRODUCTION Provision of adequate water supply and sanitation services is a prerequisite and indicator of socio-economic development. Access to drinking water is also a basic amenity, ranked among the highest-priority public services by Rwanda’s population. Providing access to at least basic water supply and sanitation services is in the public interest and should be affordable for the entire population. While the primary responsibility for water supply and sanitation (WSS) services provision rests with districts/local governments and the EWSA, the central government has an obligation and interest to make sure that these institutions are able to excute their duties accordingly.
Rwanda has committed itself to reaching very ambitious targets in water supply and sanitation, with the vision to attain 100% service coverage by 2020. The importance of adequate water supply and sanitation services as the drivers for social and economic development, poverty reduction, and public health is fully acknowledged in Rwanda’s flagship policy documents and political goals. However, these efforts are being hampered by various bottlenecks, including low water supply and sanitation coverage, low water production, and high NRW.
As a strategy to address the challenges being faced by the EAC partner states, USAID/East Africa launched a regional five-year project titled PREPARED, aimed at strengthening the resiliency and sustainability of East African economies, transboundary freshwater ecosystems, and communities. The PREPARED Project targets three key development challenges of the EAC region, which are transboundary freshwater biodiversity conservation; improved access to drinking water supply and sanitation services; and increased resiliency to climate change. Based on the aforesaid, the PREPARED Project therefore comprises five components, which include three technical components and two components that focus on cross-cutting program coordination and management. The project’s technical components aim to ensure:
1. Regional institutions’ climate-change-adaptation technical capacity; policy leadership; and action readiness
2. Resilient and sustainable management of biologically significant transboundary freshwater ecosystems in the EAC region
3. Resilient and sustainable water supply, sanitation, and wastewater treatment services in the Lake Victoria Basin
PREPARED’s key institutional partners include the EAC, the Lake Victoria Basin Commission (LVBC); the IGAD Climate Prediction and Applications Centre (ICPAC); the Regional Centre for Mapping of Resources for Development (RCMRD); and EAC partner states. Tetra Tech ARD is the prime institutional contractor implementing the PREPARED Project, and is supported by a team comprising SSG Advisors, a leader in the field of developing public-private partnerships; LTS Africa, with extensive experience in transboundary biodiversity conservation in East Africa; Water and Environmental Management Consultants [WEMA Consult (T) Ltd], with relevant regional experience in WASH activities in East Africa countries and in the Lake Victoria Basin; Columbia University’s Center for International Earth Science Information Network (CIESIN), which specializes in data and information management and state-of-the-art decision support tools; and the Global Climate Adaptation Partnership (GCAP), a
5
leading climate change adaptation consulting firm whose staff includes some of the world’s leading climate adaptation experts and trainers.
During WASH Assessment Phase I (Regional WASH Outlook) in the East Africa partner states, it was noted that there is a need to have detailed study at the lower levels, where water utilities would be assessed in terms of their capacity to deliver quality water and sanitation services. Better understanding of the water utilities would enable formulation of interventions that are more specific, thus addressing the utilities’ real needs.
With the understanding of the aforesaid situation, the RWASHTF met in Bujumbura, Burundi, February 11–13, 2014. As part of this meeting, regional WASH sites selection criteria was formulated and adopted for water utilities that will be supported under the PREPARED Project. This criteria looked at the following areas:
1. Its location within the Lake Victoria basin 2. Population size (8,000 to 300,000 people in service area), including clusters 3. Limited investments in and access to WASH services 4. Area of high incidences of waterborne diseases and poverty 5. Vulnerability to climate change 6. Institutional and operational modalities [presence of water supply and sanitation service provider
(WSSP)] that are in place and can be built upon 7. The town is either significantly impacted by or significantly impacts Lake Victoria 8. Potential exists for quick win-win solutions Based on the set criteria, Regional WASH Task Force members from Rwanda selected three water utilities (Gicumbi, Muhanga and Nyamagabe) to be considered for PREPARED Project interventions. However, after consultation with the Government of Rwanda and the EWSA, it was agreed to change these three to Nyagatare, Musanze, and Kigali due to their high NRW levels. The WASH sites Assessment Phase II exercise, therefore, was undertaken by the WEMA Consult team, accompanied by the WASH Task Force member from Rwanda. The exercise was held June 8–15, 2014.
1.2 OVERVIEW OF ENERGY WATER AND SANITATION AUTHORITY (EWSA) The EWSA is the national institution charged with the production and distribution of energy and water. EWSA has been in existence since 1976, when it was known as ELECTROGAZ. The ELECTROGAZ was founded in 1939 as “REGIDESO” and operated in Rwanda and Burundi, with its headquarters in Bujumbura. The company was later divided into the Water and Electricity Board (REGIDESO) Rwanda and REGIDESO Burundi in 1963.
In 1976, REGIDESO Rwanda became ELECTROGAZ by Decree No. 18/76 of April 20, 1976, and was granted the monopoly for the production and distribution of water and electricity in the country for 99 years. After the 1994 genocide, there was an increase in urban settlements—thus, an increased demand for water and electricity that ELECTROGAZ could not meet. In August 1999, statute No. 18/99 was passed, removing the monopoly on electricity and water. Thus, private operators were allowed. In 2003, ELECTROGAZ was placed under a management contract with Lahmayer International to manage and restructure ELECTROGAZ in collaboration with Hamburg Water Works for five years. This lasted for only two years; on March 31, 2006, the management contract was terminated, and management responsibility reverted to the Government of Rwanda.
6
The Board of Directors of ELECTROGAZ was asked to appoint new management and restructure the utility to meet the needs of the nation. Under law No. 43/2008 of September 9, 2008, ELECTROGAZ was spilt into RECO (Rwanda Electricity Corporation) and RWASCO (Rwanda Water and Sanitation Corporation). Again, on December 7, 2010, Parliament adopted a new law (No. 43/2010) that merged RECO and RWASCO and established Rwanda Energy, Water and Sanitation Authority (EWSA). Law No. 41/20111 of May 20, 2011, determines the organizational structure and summary of EWSA job positions. However, law No. 97/2013 of January 30, 2014, repealed Law No. 43/2010 of December 7, 2010, and Rwanda Energy, Water and Sanitation Authority was replaced by Energy Water and Sanitation Authority Limted (EWSA Ltd).
Currently, EWSA Ltd is charged with: coordinating all activities related to programs aimed at development and exploitation of energy sources; sensitization of customers; development of sanitation infrastructure; protection of Lake Kivu, its shores, and nearby residents during methane gas extraction activities; proper management of electricity infrastructure, of gas and petroleum products, and of water and sanitation; putting in place a system for waste management and transportation; and any other obligations included in the law establishing the new authority.
EWSA Ltd’s vision is “to be the most efficient and customer-centric utility company in the region,” while its mission is “to provide sufficient and quality water and electricity to customers at affordable and sustainable rates that support the socio-economic development of the country.” Based on the vision and mission, EWSA has key objectives that are financial (achieve solvency for the company); technical (improve the scope and reliability of EWSA’s water and electricity supply/distribution, including new connection requests for all provinces and all types of customers); operational (increase the efficiency of EWSA operations, reducing cost and increasing the amount of water and electricity produced per employee); and commercial (drastically improve EWSA’s commercial operations and services).
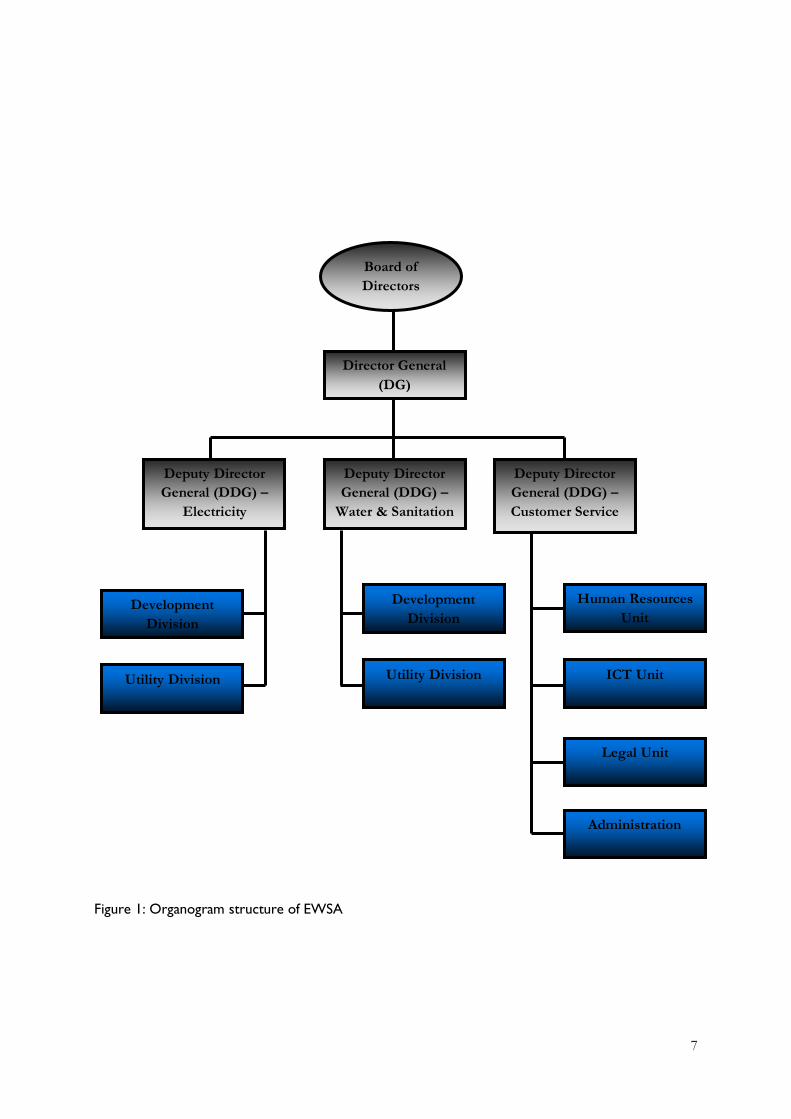
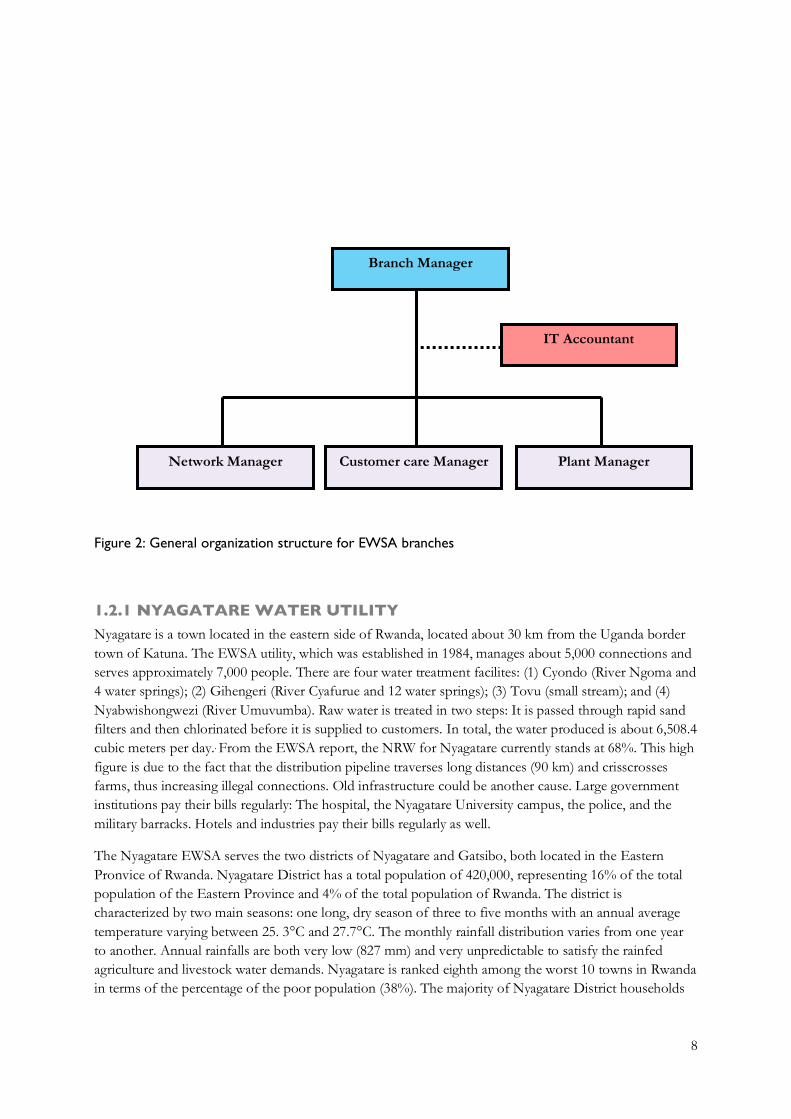
EWSA is managed by the board of directors; the director general is the secretary to the board and is responsible for the company’s day-to-day activties. The director general is assisted by three deputy directors general, who are responsible for electricty, water and sanitation service, and customer service. Deputy director general for water and sanitation has two divisions, development and utility—each of which are headed by the director. The utility division oversees activities performed by the 23 EWSA branches. Each branch is headed by a branch manager, who is assisted by a customer manager, a network manager, and a plant manager. The deputy director general of customer service has four units: human resources, information communication technology (ICT), legal, and administration (Figures 1 and 2 shows organograms for EWSA and EWSA branches, respectively).
7
Figure 1: Organogram structure of EWSA
Board of Directors
Director General (DG)
Deputy Director General (DDG) –
Electricity
Deputy Director General (DDG) –
Water & Sanitation
Deputy Director General (DDG) – Customer Service
Administration
Utility Division
Development Division
Utility Division
Human Resources Unit
ICT Unit
Legal Unit
Development Division
8
Figure 2: General organization structure for EWSA branches
1.2.1 NYAGATARE WATER UTILITY Nyagatare is a town located in the eastern side of Rwanda, located about 30 km from the Uganda border town of Katuna. The EWSA utility, which was established in 1984, manages about 5,000 connections and serves approximately 7,000 people. There are four water treatment facilites: (1) Cyondo (River Ngoma and 4 water springs); (2) Gihengeri (River Cyafurue and 12 water springs); (3) Tovu (small stream); and (4) Nyabwishongwezi (River Umuvumba). Raw water is treated in two steps: It is passed through rapid sand filters and then chlorinated before it is supplied to customers. In total, the water produced is about 6,508.4 cubic meters per day.. From the EWSA report, the NRW for Nyagatare currently stands at 68%. This high figure is due to the fact that the distribution pipeline traverses long distances (90 km) and crisscrosses farms, thus increasing illegal connections. Old infrastructure could be another cause. Large government institutions pay their bills regularly: The hospital, the Nyagatare University campus, the police, and the military barracks. Hotels and industries pay their bills regularly as well.
The Nyagatare EWSA serves the two districts of Nyagatare and Gatsibo, both located in the Eastern Pronvice of Rwanda. Nyagatare District has a total population of 420,000, representing 16% of the total population of the Eastern Province and 4% of the total population of Rwanda. The district is characterized by two main seasons: one long, dry season of three to five months with an annual average temperature varying between 25. 3°C and 27.7°C. The monthly rainfall distribution varies from one year to another. Annual rainfalls are both very low (827 mm) and very unpredictable to satisfy the rainfed agriculture and livestock water demands. Nyagatare is ranked eighth among the worst 10 towns in Rwanda in terms of the percentage of the poor population (38%). The majority of Nyagatare District households
IT Accountant
Branch Manager
Network Manager Customer care Manager Plant Manager

9
(58%) use unimproved drinking water sources, and only 23% of households in the district are within 15 minutes’ walking distance to an improved water source.
Figure 3: A busy street in Nyagatare Town
According to the National Institute of Statistics of Rwanda (NISR, 2012) the majority of females in Nyagatare District are small-scale farm workers (74.5%), followed by wage farmers (13.6%) and wage non-farmers (4.4%). Males are also involved in small-scale farm work, but at a lower percentage (57%) than the female population.
Gatsibo is one of the seven districts making up the Eastern Province. It is divided into 14 sectors: Gasange, Gatsibo, Gitoki, Kabarore, Kageyo, Kiramuruzi, Kiziguro, Muhura, Murambi, Ngarama, Nyagihanga, Remera, Rugarama and Rwimbogo. It is also divided into 69 cells and 603 villages (imidugudu). According to the 2012 national census, the total population of Gatsibo District increased from 283,456 in 2002 to 433,997 in 2012. The Gatsibo District has a population density of 275 persons per square kilometer. The increase in the population represents an annual growth rate of 4.3%.
According to the integrated household living conditions survey (EICV3), 84.9% of the population is employed in the agriculture sector; 12.3% is in waged labor, while 72.2% are independent farmers. Off-farm employment accounts for 15.5% of the total population. Of this, 8.9% are waged or paid, 5.7% work independently, and 0.9% are unpaid. Over 81.7% of the district's working population is engaged in the informal private sector; 8.4% work in the formal public sector; 2.4% are employed in parastatals; and 2.5% work in other sectors.
The Nyagatare EWSA Branch was designed to serve a population of 9,000. Currently, the utility serves around 7,000 people, with a total of 5,000 conections. The branch is headed by a branch manager, who is assisted by a customer manager, a network manager, and a plant manager. In total, the branch has 26 employees deployed in these units as follows:
1. Branch manager’s office (7 employees) 2. Plant (6 employees)
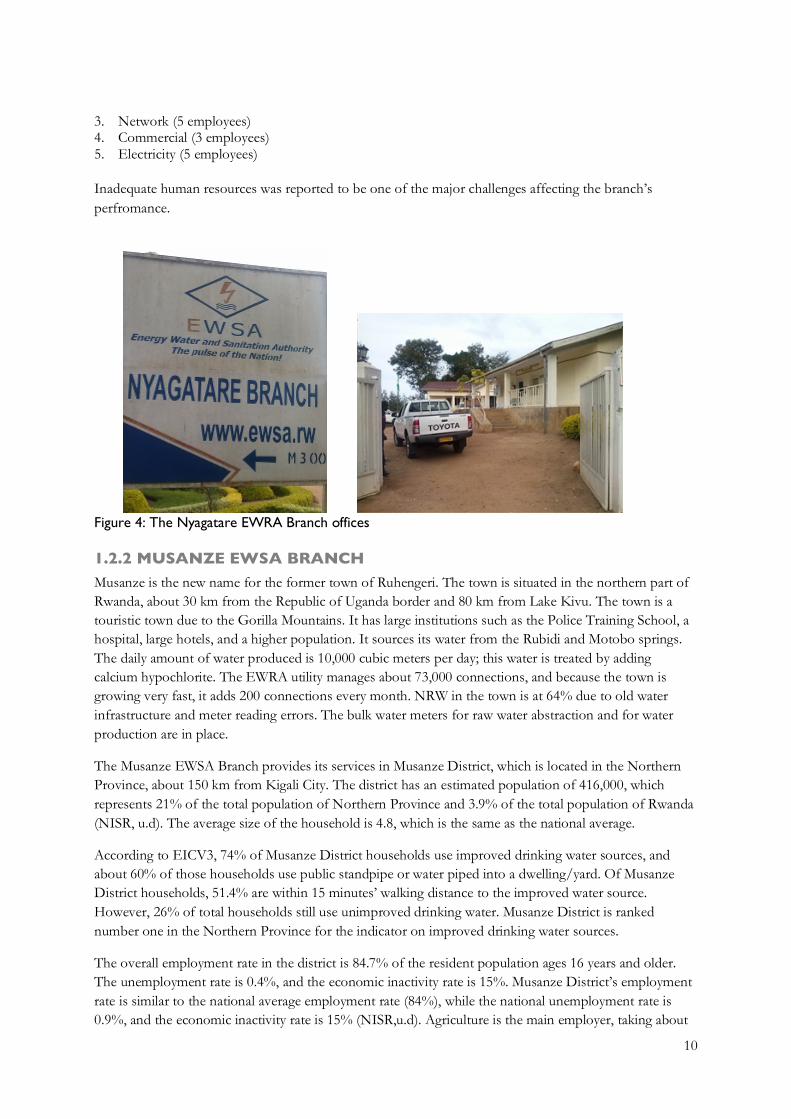
10
3. Network (5 employees) 4. Commercial (3 employees) 5. Electricity (5 employees) Inadequate human resources was reported to be one of the major challenges affecting the branch’s perfromance.
Figure 4: The Nyagatare EWRA Branch offices
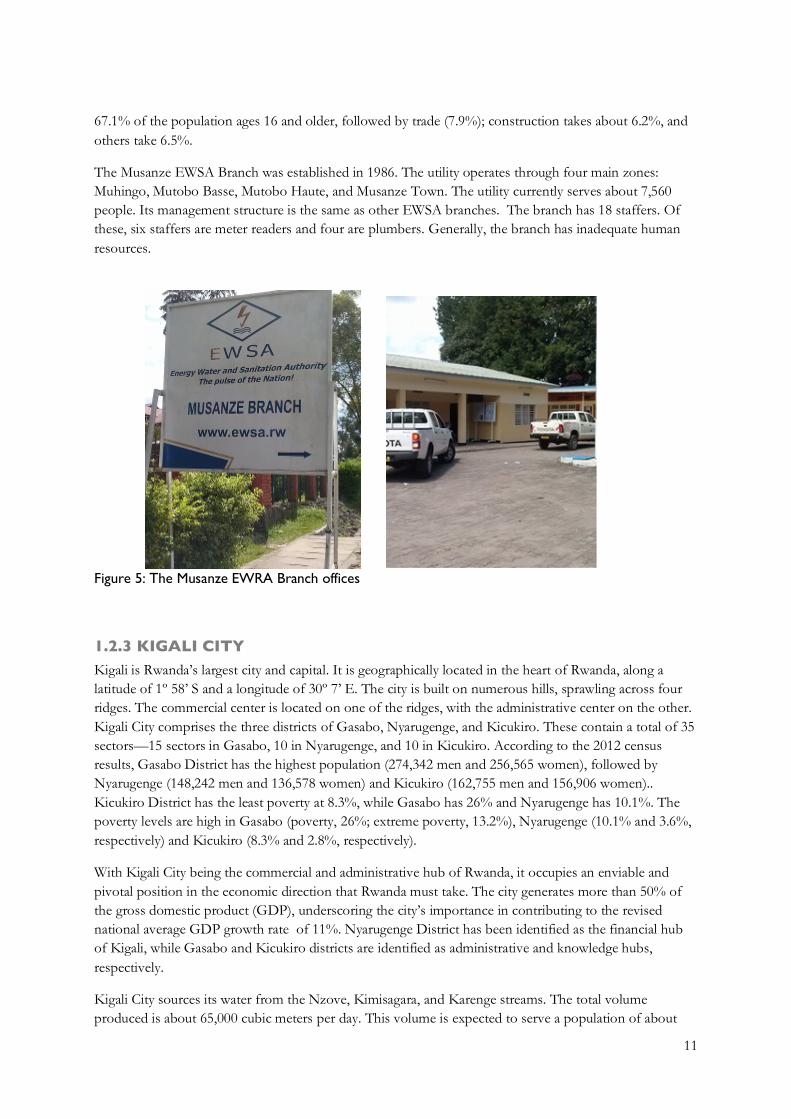
1.2.2 MUSANZE EWSA BRANCH Musanze is the new name for the former town of Ruhengeri. The town is situated in the northern part of Rwanda, about 30 km from the Republic of Uganda border and 80 km from Lake Kivu. The town is a touristic town due to the Gorilla Mountains. It has large institutions such as the Police Training School, a hospital, large hotels, and a higher population. It sources its water from the Rubidi and Motobo springs. The daily amount of water produced is 10,000 cubic meters per day; this water is treated by adding calcium hypochlorite. The EWRA utility manages about 73,000 connections, and because the town is growing very fast, it adds 200 connections every month. NRW in the town is at 64% due to old water infrastructure and meter reading errors. The bulk water meters for raw water abstraction and for water production are in place.
The Musanze EWSA Branch provides its services in Musanze District, which is located in the Northern Province, about 150 km from Kigali City. The district has an estimated population of 416,000, which represents 21% of the total population of Northern Province and 3.9% of the total population of Rwanda (NISR, u.d). The average size of the household is 4.8, which is the same as the national average.
According to EICV3, 74% of Musanze District households use improved drinking water sources, and about 60% of those households use public standpipe or water piped into a dwelling/yard. Of Musanze District households, 51.4% are within 15 minutes’ walking distance to the improved water source. However, 26% of total households still use unimproved drinking water. Musanze District is ranked number one in the Northern Province for the indicator on improved drinking water sources.
The overall employment rate in the district is 84.7% of the resident population ages 16 years and older. The unemployment rate is 0.4%, and the economic inactivity rate is 15%. Musanze District’s employment rate is similar to the national average employment rate (84%), while the national unemployment rate is 0.9%, and the economic inactivity rate is 15% (NISR,u.d). Agriculture is the main employer, taking about
11
67.1% of the population ages 16 and older, followed by trade (7.9%); construction takes about 6.2%, and others take 6.5%.
The Musanze EWSA Branch was established in 1986. The utility operates through four main zones: Muhingo, Mutobo Basse, Mutobo Haute, and Musanze Town. The utility currently serves about 7,560 people. Its management structure is the same as other EWSA branches. The branch has 18 staffers. Of these, six staffers are meter readers and four are plumbers. Generally, the branch has inadequate human resources.
Figure 5: The Musanze EWRA Branch offices
1.2.3 KIGALI CITY Kigali is Rwanda’s largest city and capital. It is geographically located in the heart of Rwanda, along a latitude of 1º 58’ S and a longitude of 30º 7’ E. The city is built on numerous hills, sprawling across four ridges. The commercial center is located on one of the ridges, with the administrative center on the other. Kigali City comprises the three districts of Gasabo, Nyarugenge, and Kicukiro. These contain a total of 35 sectors—15 sectors in Gasabo, 10 in Nyarugenge, and 10 in Kicukiro. According to the 2012 census results, Gasabo District has the highest population (274,342 men and 256,565 women), followed by Nyarugenge (148,242 men and 136,578 women) and Kicukiro (162,755 men and 156,906 women).. Kicukiro District has the least poverty at 8.3%, while Gasabo has 26% and Nyarugenge has 10.1%. The poverty levels are high in Gasabo (poverty, 26%; extreme poverty, 13.2%), Nyarugenge (10.1% and 3.6%, respectively) and Kicukiro (8.3% and 2.8%, respectively).
With Kigali City being the commercial and administrative hub of Rwanda, it occupies an enviable and pivotal position in the economic direction that Rwanda must take. The city generates more than 50% of the gross domestic product (GDP), underscoring the city’s importance in contributing to the revised national average GDP growth rate of 11%. Nyarugenge District has been identified as the financial hub of Kigali, while Gasabo and Kicukiro districts are identified as administrative and knowledge hubs, respectively.
Kigali City sources its water from the Nzove, Kimisagara, and Karenge streams. The total volume produced is about 65,000 cubic meters per day. This volume is expected to serve a population of about
12
1,000,000 people. The Kigali water system has NRW of about 35%. There are no bulk water meters in some of the water sources.
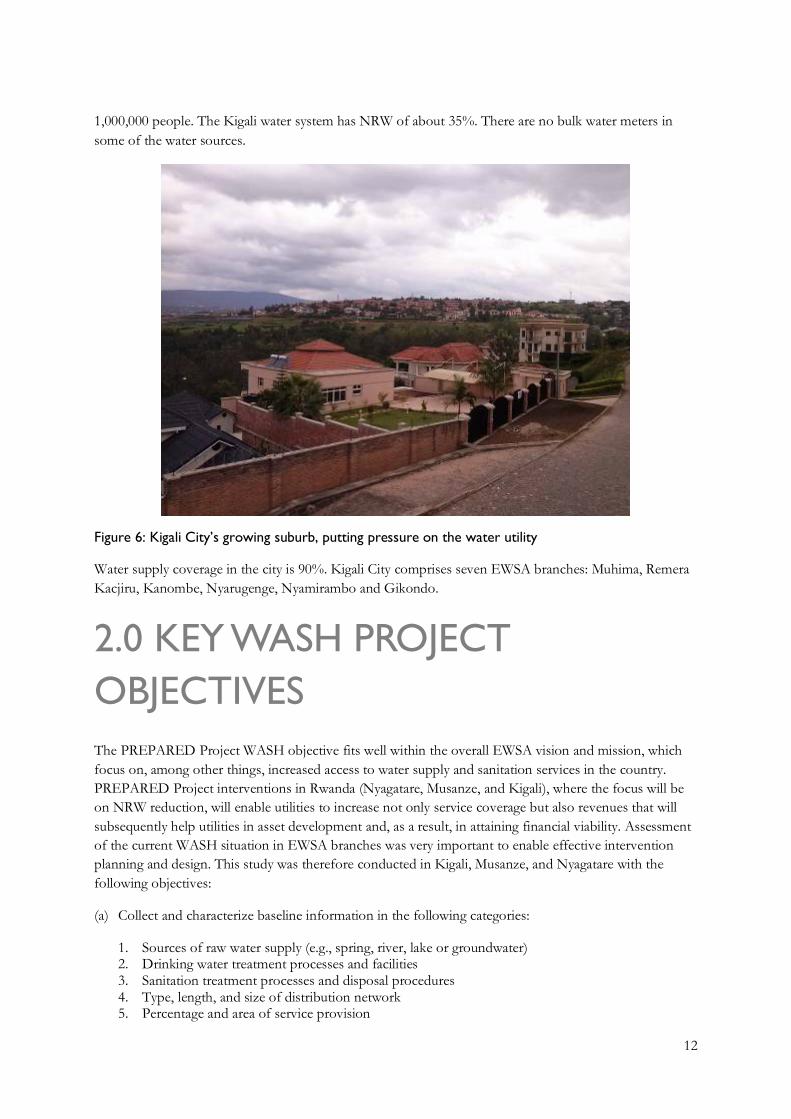
Figure 6: Kigali City’s growing suburb, putting pressure on the water utility
Water supply coverage in the city is 90%. Kigali City comprises seven EWSA branches: Muhima, Remera Kacjiru, Kanombe, Nyarugenge, Nyamirambo and Gikondo.
2.0 KEY WASH PROJECT OBJECTIVES The PREPARED Project WASH objective fits well within the overall EWSA vision and mission, which focus on, among other things, increased access to water supply and sanitation services in the country. PREPARED Project interventions in Rwanda (Nyagatare, Musanze, and Kigali), where the focus will be on NRW reduction, will enable utilities to increase not only service coverage but also revenues that will subsequently help utilities in asset development and, as a result, in attaining financial viability. Assessment of the current WASH situation in EWSA branches was very important to enable effective intervention planning and design. This study was therefore conducted in Kigali, Musanze, and Nyagatare with the following objectives:
(a) Collect and characterize baseline information in the following categories:
1. Sources of raw water supply (e.g., spring, river, lake or groundwater) 2. Drinking water treatment processes and facilities 3. Sanitation treatment processes and disposal procedures 4. Type, length, and size of distribution network 5. Percentage and area of service provision
13
6. Level of billing and NRW 7. Personnel management and capacity building 8. Financial sustainability
(b) Analyze and describe service delivery effectiveness by determining:
1. Institutional and governance framework that adequately describes the type of WSSP utility, legal basis, operational modalities, management structure, and existence and content of strategic or operational plans
2. Challenges in meeting the national and regional standards for service provision 3. Levels of WSSP regulation, including provisions for establishing and revising tariffs 4. Mechanisms for developing and implementing performance improvement programs (PIPs) 5. Compliance with required subsidiary legislation on managing water resources and protecting the
environment 6. National or local government subsidies, if any, and level to which they are targeted at specific
groups (e.g., pro-poor).
3.0 METHODOLOGY To achieve the mission objective, the team used the following methods to collect the necessary information/data.
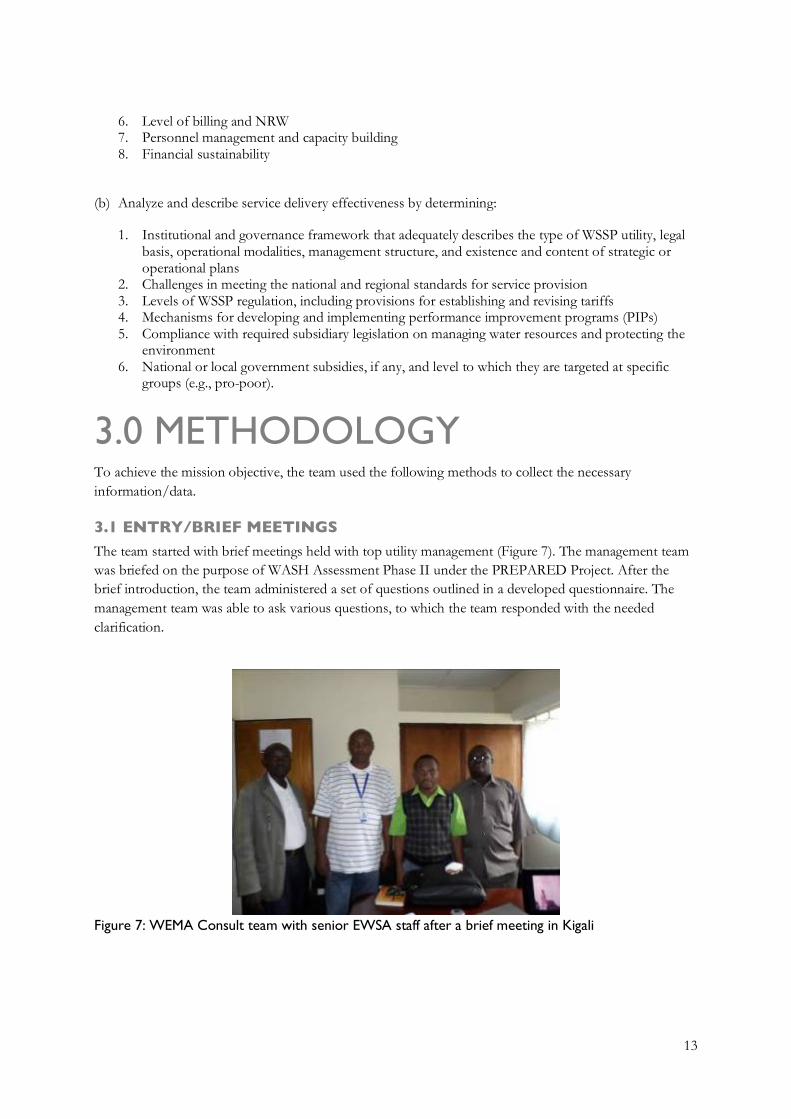
3.1 ENTRY/BRIEF MEETINGS The team started with brief meetings held with top utility management (Figure 7). The management team was briefed on the purpose of WASH Assessment Phase II under the PREPARED Project. After the brief introduction, the team administered a set of questions outlined in a developed questionnaire. The management team was able to ask various questions, to which the team responded with the needed clarification.
Figure 7: WEMA Consult team with senior EWSA staff after a brief meeting in Kigali

14
3.2 DOCUMENTARY REVIEW Various documents provided by management were reviewed, and all relevant information was recorded. Valuable information about the organization and its branches was obtained from the EWSA website (www.ewsa.rw).
3.3 FIELD VISITS The team visited the water treatment plants in Karenge, Kimisigara, Nzove, and Mutobo to see their operations. Plant managers explained how raw water is tapped at the intake and how water treatment processes are done (Figure 8). All relevant data was collected. Field visits also were made to the branch offices of Musanze and Nyagatare, which entailed physical observation of the utility operation. These visits enabled the team members to have a better understanding of the documented challenges and of the issues that came out of the discussions and the questionnaire answers. The field visit plus literature review therefore provided the study team with an opportunity to see the real situations and issues and prepare a clear WASH sites appraisal and baseline report.
Figure 8: The water aeration process at Karenge water treatment
3.4 EXIT/DEBRIEFING MEETINGS Exit/debriefing meetings were aimed at getting the opinions of the EWSA’s top managers, including national policy makers. In these meetings, the team briefly presented field visit findings, the recommended interventions to be addressed by the PREPARED Project, and the outline of the appraisal and baseline report. In most cases, top managers agreed and even suggested additional, valuable interventions for consideration.
3.5 ANALYSIS OF COLLECTED DATA Descriptive statistics, content analysis, and pairwise ranking were employed for data analysis. Descriptive statistics such as frequencies, percentages, and means were used to obtain the variability and central tendencies of variables. Content analysis was used to analyze the qualitative data obtained through
15
discussions during the entry/briefing meeting, field visits, exit/debriefing meeting, and discussion with key informants. This entailed transcribing all notes and categorizing the obtained information into main themes and issues.
4.0 FINDINGS AND DISCUSSION 4.1 WATER SOURCES Availability of realiable water sources is one of the important factors for water supply service provision. Water sources need to be well protected to ensure a continuous supply of quality water. The current water sources for Kigali city include Lake Mugesera and the Yanze River, as well as groundwater. Lake Mugesera also supplies water to Rwamagana Town (not covered in this study). Lake Mugesera supplies raw water amounting to 700 cubic meters per hour to the Karenge Water Treatment Plant, while the Yanze River supplies about 1,000 cubic meters per hour to the Kimisagara Water Treatment Plant. Also, there are 31 wells, which produce about 1,262 cubic meters of water per hour to the Nzove Water Treatment Plant. All three of these treatment plants (Karenge, Kimisagara, and Nzove) supply water to Kigali City. The details on each water treatment plant are discussed in sections 4.1.1, 4.1.2, and 4.1.3 below.
The water sources for Nyagatare are both surface and groundwater. Groundwater comes from seven springs—namely Cyondo, Gihengeri, Tovu, Rwabigeyo, NKG, Rwasama, and Kanwiriri. Cyondo spring produces 2,337.3 cubic meters per day; Gihengeri spring produces 2,101.2 cubic meters per day; Tovu spring, 622.3 cubic meters per day; Rwabigeyo spring, 748.3 cubic meters per day; NKG spring, 62.6 cubic meters per day; Rwasama spring, 205.6 cubic meters per day; and Kanwriri, 202.1 cubic meters per day. Surface water is abstracted from the Umuvumba River through the intake at Nyabwishongwezi Town. The average abstraction rate at the Umuvumba River intake is 300 cubic meters per day. During dry season, water from both the springs and the Umuvumba River tends to decrease. However, according to the utility, there is no monitoring data to know exactly how much the decline is. Umuvumba River pollution is due to soil erosion and impacts the quality of raw water abstracted.
Water sources for Musanze are two springs, Mutobo and Rubidi, which are located on the south of Musanze Town. The two springs abstract water amounting to 1,000 cubic meters per hour. This means that the volume of raw water abstracted from Mutobo spring is 600 cubic meters per hour; the volume abstracted from Rubidi spring is 400 cubic meters per hour. Abstraction of water is done through common DN500 water mains to the water treatment plant.
4.1.1 KARENGE WATER TREATMENT PLANT The Karenge Water Treatment Plant is located 50 km from Kigali City. The plant is conventional, with a designed capacity for producing about 14,000 cubic meters of water per day (Figure 9). The plant was constructed in 1976, with an installed capacity of 3,500 cubic meters per day. In 2008, extension of the plant increased its capacity to the current level of 14,000 cubic meters per day. Water treatment in Karenge includes chlorination with sodium hypochlorite. The daily dosage is 15 kg. To reduce the cost of production, hyprochorite production is done at the plant, and the capacity of sodium hypochlorite production is 90 kg per day.

16
Figure 9: Part of the pumping house at the Karenge Water Treatment Plant
4.1.2 NZOVE WATER TREATMENT PLANT This plant gets its water from 31 wells along the Nyabarongo Valley. Figure 10 shows one of the wells supplying water to the treatment plant. However, only 25 wells were functioning by the time of this assessment exercise. The plant was constructed in 2003, with an installed capacity of 3,500 cubic meters per day. In 2009, extension of the plant increased its capacity to 28,000 cubic meters per day. This capacity makes Nzove the largest water treatment plant in the country. Sodium hypochlorite is produced on-site to treat water, while 10 kg of sodium hypochlorite are used daily for chlorination. Produced water is measured through the installed bulk meter.
Figure 10: One of the 31 wells draining groundwater for the Nzove Water Treatment Plant

17
4.1.3 KIMISAGARA WATER TREATMENT PLANT The plant draws raw water from the Yanze River. The abstraction capacaty is 1,000 cubic meters per hour, and two water mains are used to transfer water to the treatment plant. The plant was constructed in 1981, and a 1988 extension increased the installed capacity of the plant from kkkk cubic meters to 30,000 cubic meters per day. Currently, plant water production stands at 22,000 cubic meters per day. The clear water tank has a capacity of 4,800 cubic meters. The plant system is computerized (Figure 11), and thus enables more-effective monitoring of the plant’s operational parameters. Kimisagara also disinfects the water through chlorination. The calcium hypochlorite (chlorine) dosage is between 7 to 10 grams per liter daily. During the rainy season, a heavier dosage is required, as water becomes highly polluted due to increased runoff from the water catchment. It was reported that 630 and 200 liters of calcium hypochlorite solution per hour is used to treat water during the rainy and dry seasons, respectively.
Figure 11: The Kimisigara Water Treatment Plant’s computerized system
4.1.4 MUTOBO WATER TREATMENT PLANT The plant was installed in 1988 with a capacity of 12,500 cubic meters per day. However, the current capacity of the plant is 10,000 cubic meters per day. Generally, the water sources to this treatment plant have very clean water suitable for drinkng. Thus, disinfection by chlorination is very minimal—to remove bacteria and algae in the water as well as to maintain the level of residual chlorine per World Health Organization (WHO) guidelines. The chlorination process consists of a single-unit process. The chlorine dosage is 14 kg of calcium hypochlorite daily. Two reinforced concrete clear water tanks, each with a capacity of 1,500 cubic meters, feed the storage reservoir that supplies water to customers.

18
4.1.5 NYAGATARE WATER TREATMENT PLANT EWSA Nyagatare operates a chlorination and conventional water treatment system that treats raw water from four treatment plants: (1) Cyondo (River Ngoma and 4 water springs); (2) Gihengeri (River Cyafurue and 12 water springs); (3) Tovu (small stream) and (4) Nyabuwishongwezi (River Umuvumba).. The chlorine dosage is 6 kg of calcium hypochlorite daily. Chlorination is done to the spring waters of Cyondo, Gihengeri, and Tovu. The conventional water treatment system at Shongwezi consists of flocculation, sedimentation, filtration, and disinfection processes. Springs located at Rwabigeyo, NKG, Rwasama, and Kanwiriri in the Gatsibo District produce clean, drinakble quality water that does not require further treatment. The average water production in Nyagatare amounts to 6508.4 cubic meters per day.
4.2 DISTRIBUTION NETWORK The distribution network consists of the trunk mains and reticulation networks made of PVC, HDPE, ductile iron, steel, and PPR. Tables 1 and 2 show types, length, and ages of the distribution network for Musanze and Nyagatare during the May 2014 assessment exercise. The result shows that the total length of the water distribution network for Musanze is 348.22 km, while Nyangatare is 205 km and Kigali is 2,080 km.
Table 1: Types, sizes, lengths and ages of the distribution network for Musanze Branch
MATERIAL SIZE RANGE (MM. DIA) LENGTH IN (KM) AGE RANGE(IN YEARS) PVC 25–315 175 28 HDPE 25–90 8 4 Ductile Iron 150–315 98 25 Steel 25–62 65.72 28 Others(PPR) 25–32 1.5 1
Table 2: Types, sizes, length and ages of the distribution network for EWSA Nyagatare Branch
MATERIALS SIZE RANGE (MM.DIA) LENGTH (KM) AGE RANGE (YEARS) PVC 280 39 32 PVC 200 37 32 PVC 160 49 32 PVC 125 3.7 32 PVC 110 4.9 32 PVC 90 3.2 32 PVC 75 1.1 4 PVC 63 11 4 PVC 50 3.7 32 PVC 40 2.2 32 PVC 32 5.4 32 Steel 44.45 (1’,3/4) 2.8 Over 32 HDPE 110 7 2 HDPE 75 12 2 HDPE 50 2.3 2 HDPE 32 4.7 2 HDPE 25 15.9 2 Ductile Iron 200 0.4 32 Total Length: 205.3 km

19
To maintain water quality in the distribution system, the following procedures are being undertaken by the utilities:
• Pipe washout • Washing tank/water reservoirs monthly • Regular water quality testing (physicochemical as well as bacteriological tests) and daily monitoring of
the network system • Chlornation of water in the clear water tanks The major challenges facing the distribution network include an aged network system that leads to frequent bursts and leaks; illegal connections; inadequate pressure management; poor service connections; water hammers due to a lack of surge vessels; road constrcution; and rusting of steel pipes.
Leak detection is another critical activity of EWSA staff in Nyagatare, Kigali, and Musanze. The common methods or techniques used to detect leaks include observation by patrol team and information provided to a call center via a toll-free 3535 number. It was reported that the call center is the most effective method of obtaing information about pipeline water leaks. However, in Musanze, there is special equipment for leak detection known as Sewerin, which according to its manual/guide, can effectively detect leakages in the system (Figure 12). Unfortunately, this equipment is currently not in use due to lack of technial know-how. Capacity building on the use of such equipment would be very important to EWSA staff.
Figure 12: Leak detection machine (Sewerin)
20
4.3 REGULATION OF WATER AND SANITATION SERVICE PROVISION In Rwanda, water and sanitation service provisions are regulated by the Rwanda Utilities Regulatory Authority (RURA) which was initially established by Law No. 39/2001 of September 13, 2001. This law was reviewed and replaced by Law No. 09/2013 of March 1, 2013, with a purpose to clearly streamline the mission, powers, organization, and functions of RURA. The same law gives the authority a legal personality, as well as financial and administrative autonomy in the fulfilment of its mandate.
Generally, the authority plays a pivotal role as a policy maker and as a licensee to water service providers and consumers. The authority reports to the office of the prime minister, and it coordinates with ministries responsible for each regulated sector in executing its functions. i.e., the Ministry for Energy and the Ministry for Water.
In order to regulate effectively and efficiently, RURA uses various instruments, including water service regulations, which include regulations on the minimum required service level for water service provision. RURA—through regulations for minimum required service levels on water service provision—strives to ensure that water service providers adhere to the following:
1. Quality of service level indicators for water supply 2. Monitoring the quality of drinking water 3. Installation of water meters and billing of customers accordingly 4. Complaints handling: Water utilities are required to establish procedures for handling complaints;
customer rights are observed. RURA, through the use of the available instruments, does the monitoring to ensure that the set requirements are met by all water service providers. When there is no compliance, the authority takes appropriate measures to ensure that the regulations are enforced accordingly to protect the rights of consumers.
With regard to tariff setting, the process is participatory where stakeholders are involved. The process involves water service providers submitting proposals for tariffs review to RURA. Before RURA approves the tariff, it holds a consultative meeting with various stakeholders. After the consultations and depending on the consultations’ outcome, RURA approves the tariffs.
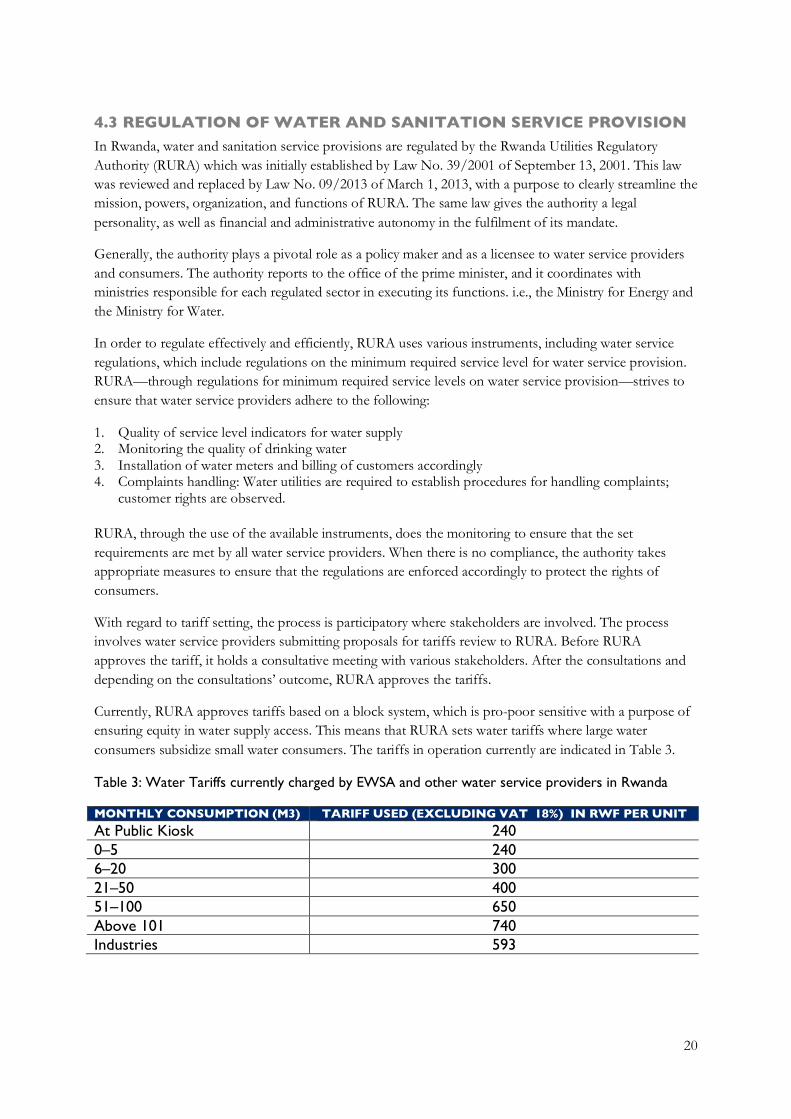
Currently, RURA approves tariffs based on a block system, which is pro-poor sensitive with a purpose of ensuring equity in water supply access. This means that RURA sets water tariffs where large water consumers subsidize small water consumers. The tariffs in operation currently are indicated in Table 3.
Table 3: Water Tariffs currently charged by EWSA and other water service providers in Rwanda
MONTHLY CONSUMPTION (M3) TARIFF USED (EXCLUDING VAT 18%) IN RWF PER UNIT At Public Kiosk 240 0–5 240 6–20 300 21–50 400 51–100 650 Above 101 740 Industries 593
21
4.4 WATER SUPPLY COVERAGE Regulations on the minimum required service level for water service provision (Article 12) require providing water services in the whole service area and increasing the percentage of population that can access adequate drinking water services. Currently, water supply coverage in urban areas is 86.4%. Kigali City has a water supply coverage of 90%; Nyagatare, 52%; and Musanze, 88.3%. The major challenges facing water supply coverage include a low level of water supplied in the pipeline network, an old pipeline network, poor pressure management, high levels of NRW, and pipeline vandalism, especially of the water mains, which traverses farmland.
The Regulations on the Minimum Required Service Level for Water Service Provision require water service providers to provide at least 20 and 40 liters of water per person per day in rural areas and urban cities, respectively. Where there is a possibility of not meeting the required level, the water utility is required to inform RURA of the situation and indicate, in a plan, when the situation will be addressed. Due to inadequate water supply capacity, EWSA Kigali branch do water rationing in some. When water rationing is implemented, Article 18 of the regulations stipulates procedures that should be observed. Based on the regulations, EWSA has developed a fair water rationing program that is published at local offices and in local media (TV, radio, newspapers, Web, etc.) at least 72 hours beforehand.
In Kigali City, the water rationing program clearly indicates the days, time, and areas that will be supplied with water. Duration for water rationing is 12 hours per day. According to discussion with EWSA staff, the water rationing trend over time has not changed significantly due to increasing water demand as as a result of high population growth in the city. Measures to increase the water supply in Kigali, Musanze, and Nyagatare are very critical. It was suggested that reducing NRW could increase water supply significantly and thus prevent the need to ration water as well as increase revenues—which would assist in asset development that would in turn increase water supply coverage
4.5 NON REVENUE WATER NRW in Rwanda poses a threat to the sustainability and quality service provision of water to customers. Currently, national NRW is estimated at 40% (see Table 4); while for Kigali, Nyagatare, and Musanze, it is 35%, 68%, and 64%, respectively. NRW for the past three years for the three towns are detailed in Table 5.

22
Table 4: Levels of NRW in Rwanda towns
MONTH SUPPLIED WATER
TOTAL BILLED
LOSS(M3) NETWORK EFFICIENCY
NRW (%)
KIGALI CITY 21,696,424 14,180,318 7,516,106 65% 35
MUHANGA 652,757 563,310 89,447 86% 24
RUBAVU 2,863,137 1,771,719 1,091,418 62% 38
MUSANZE 3,514,254 1,263,239 2,251,015 36% 64
RUSIZI 664,217 440,611 223,606 66% 34
HUYE 1,938,600 1,098,277 840,323 57% 43
NYANZA 297,305 269,287 28,018 91% 9
NGOMA 470,775 344,276 126,499 73% 27
GICUMBI 387,442 314,097 73,345 81% 29
RWAMAGANA 1,633,972 839,337 794,635 51% 49
NYAMAGABE 569,287 322,969 246,318 57% 43
KARONGI 296,050 255,248 40,802 86% 14
NYAGATARE 2,333,376 753,137 1,580,239 32% 68
BUGESERA 1,059,309 630,349 428,960 60% 40
RUHANGO 187,843 121,794 66,049 65% 35
Total 38,564,748 23,167,968 15,396,780 60% 40 Source: EWSA 2013
Table 5: NRW trends from 2010–2011 to 2012–2013 in Kigali, Musanze, and Nyagatare
YEAR NON REVENUE WATER IN (%) KIGALI MUSANZE NYAGATARE
2012–2013 35 64 68 2011–2012 40 57.5 61 2010–2011 52.6 **
The main causes of NRW in the visited towns include an old network; illegal connections; water theft; invisible leakages (especially in Musanze due to its volcanic soil); poor pressure management; overflow of reservoirs; lack of customer mapping; a sparse distribution of customers in rural areas, which makes it difficult for them to be reached by meter readers; and vandalism of the water network. Other reasons for NRW include commercial losses, such as inaccurate meters and meter reading/billing errors.
Measures that have been put in place to manage NRW in the visited Rwanda towns include meter replacement; zoning and customer mapping by establishing district meter areas (DMAs); customer billing improvements; and improving network monitoring in order to detect illegal connections and unrecorded water uses—and ensure revenue recovery.
Based on the set targets for NRW reduction, Nyagatare aims to increase network efficiency up to 60% and thus reduce NRW from 68% to 40%. Musanze aims to reduce NRW by 4% by this year (2013–2014). Kigali aims to reduce NRW to 30%. However it should be kept in mind that the targets are set every year by EWSA headquarters as an indicator under a contract management model that is in operation.
In order to attain the aforesaid targets, various interventions have been implemented, including NRW reduction. EWSA also has a three-year program for NRW reduction, which intends to increase national
23
network efficiency to 70% and is expected to reduce NRW from the current 40% to 30% by 2017. The strategies highlighted under this program include: network zoning and mapping; establishment of hydraulic pressure zones; installation of pressure-reducer valves; establishment and implementation of a water meter replacement plan; and regular follow-up of meter reader performance to ensure that all customers are billed accordingly. It is in program like this where the PREPARED Project can intervene and help.
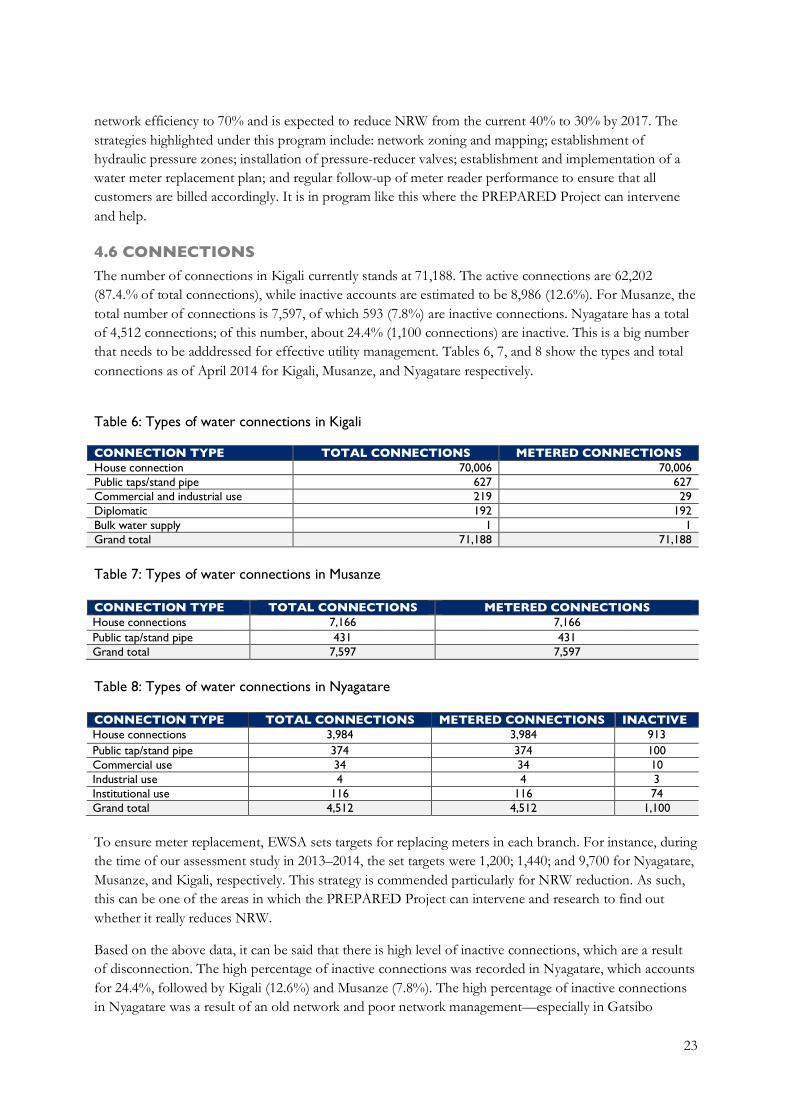
4.6 CONNECTIONS The number of connections in Kigali currently stands at 71,188. The active connections are 62,202 (87.4.% of total connections), while inactive accounts are estimated to be 8,986 (12.6%). For Musanze, the total number of connections is 7,597, of which 593 (7.8%) are inactive connections. Nyagatare has a total of 4,512 connections; of this number, about 24.4% (1,100 connections) are inactive. This is a big number that needs to be adddressed for effective utility management. Tables 6, 7, and 8 show the types and total connections as of April 2014 for Kigali, Musanze, and Nyagatare respectively.
Table 6: Types of water connections in Kigali
CONNECTION TYPE TOTAL CONNECTIONS METERED CONNECTIONS House connection 70,006 70,006 Public taps/stand pipe 627 627 Commercial and industrial use 219 29 Diplomatic 192 192 Bulk water supply 1 1 Grand total 71,188 71,188
Table 7: Types of water connections in Musanze
Table 8: Types of water connections in Nyagatare
To ensure meter replacement, EWSA sets targets for replacing meters in each branch. For instance, during the time of our assessment study in 2013–2014, the set targets were 1,200; 1,440; and 9,700 for Nyagatare, Musanze, and Kigali, respectively. This strategy is commended particularly for NRW reduction. As such, this can be one of the areas in which the PREPARED Project can intervene and research to find out whether it really reduces NRW.
Based on the above data, it can be said that there is high level of inactive connections, which are a result of disconnection. The high percentage of inactive connections was recorded in Nyagatare, which accounts for 24.4%, followed by Kigali (12.6%) and Musanze (7.8%). The high percentage of inactive connections in Nyagatare was a result of an old network and poor network management—especially in Gatsibo
CONNECTION TYPE TOTAL CONNECTIONS METERED CONNECTIONS House connections 7,166 7,166 Public tap/stand pipe 431 431 Grand total 7,597 7,597
CONNECTION TYPE TOTAL CONNECTIONS METERED CONNECTIONS INACTIVE House connections 3,984 3,984 913 Public tap/stand pipe 374 374 100 Commercial use 34 34 10 Industrial use 4 4 3 Institutional use 116 116 74 Grand total 4,512 4,512 1,100
24
District , which initially was being operated by the local government. Other reasons for inactive accounts include disconnection due to non-payment of bills; mismanagement of meters; and low water pressure. It is clear from this situation that strategizing on how best to encourage customers with dormant accounts to reconnect is very important for the utility’s growth and effectiveness.
4.7 METER READING Meter reading is done during the last two weeks of the month. Using a special device, meter readers are required to visit each customer to read the meters. However, meter-reading efficiency is limited by various problems, including faulty meter-reading devices; lack of customer mapping, which results in not locating some premises; and rural areas (as in Musanze and Nyagatare) that are only accessible by a long-distance walk, which leads to estimation of bills.
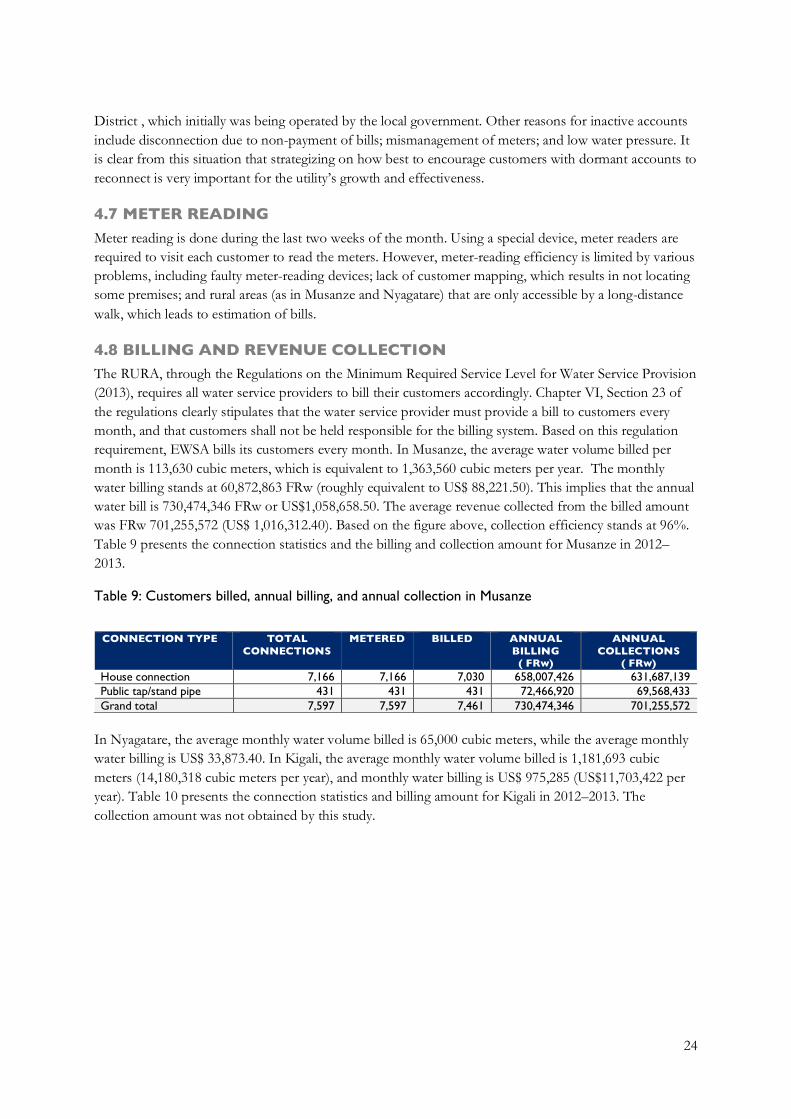
4.8 BILLING AND REVENUE COLLECTION The RURA, through the Regulations on the Minimum Required Service Level for Water Service Provision (2013), requires all water service providers to bill their customers accordingly. Chapter VI, Section 23 of the regulations clearly stipulates that the water service provider must provide a bill to customers every month, and that customers shall not be held responsible for the billing system. Based on this regulation requirement, EWSA bills its customers every month. In Musanze, the average water volume billed per month is 113,630 cubic meters, which is equivalent to 1,363,560 cubic meters per year. The monthly water billing stands at 60,872,863 FRw (roughly equivalent to US$ 88,221.50). This implies that the annual water bill is 730,474,346 FRw or US$1,058,658.50. The average revenue collected from the billed amount was FRw 701,255,572 (US$ 1,016,312.40). Based on the figure above, collection efficiency stands at 96%. Table 9 presents the connection statistics and the billing and collection amount for Musanze in 2012–2013.
Table 9: Customers billed, annual billing, and annual collection in Musanze
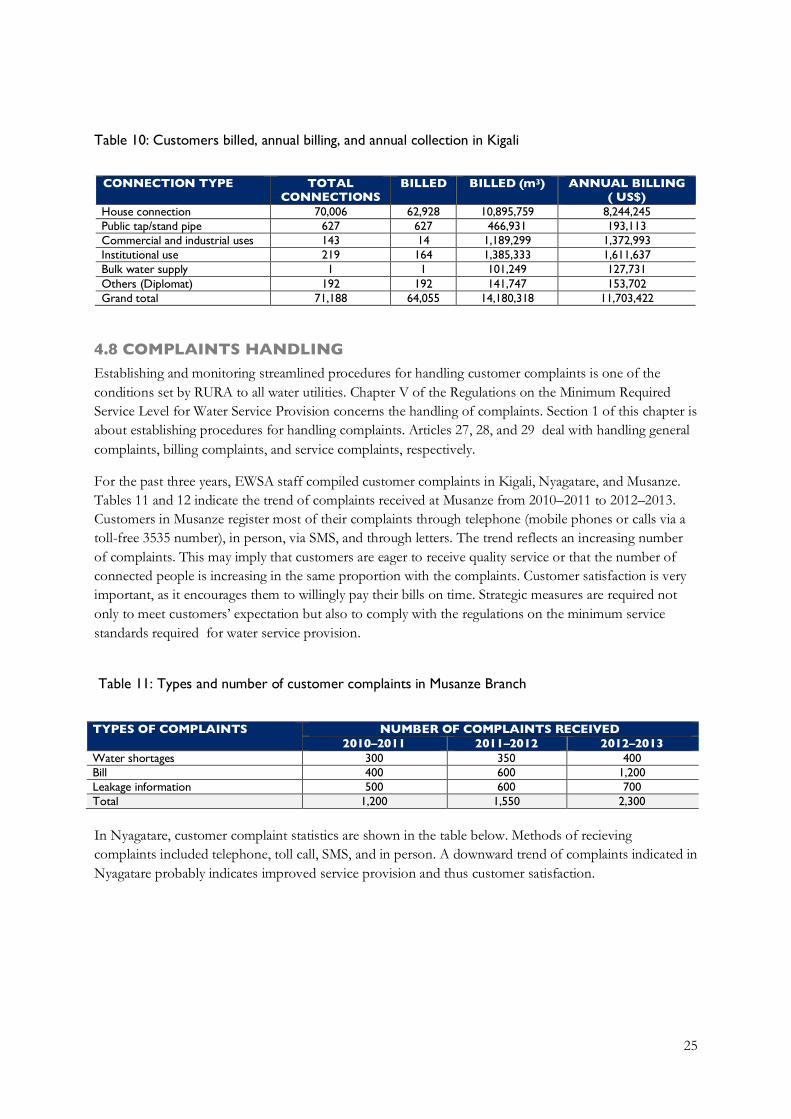
In Nyagatare, the average monthly water volume billed is 65,000 cubic meters, while the average monthly water billing is US$ 33,873.40. In Kigali, the average monthly water volume billed is 1,181,693 cubic meters (14,180,318 cubic meters per year), and monthly water billing is US$ 975,285 (US$11,703,422 per year). Table 10 presents the connection statistics and billing amount for Kigali in 2012–2013. The collection amount was not obtained by this study.
CONNECTION TYPE TOTAL CONNECTIONS
METERED BILLED ANNUAL BILLING
( FRw)
ANNUAL COLLECTIONS
( FRw) House connection 7,166 7,166 7,030 658,007,426 631,687,139 Public tap/stand pipe 431 431 431 72,466,920 69,568,433 Grand total 7,597 7,597 7,461 730,474,346 701,255,572
25
Table 10: Customers billed, annual billing, and annual collection in Kigali
4.8 COMPLAINTS HANDLING Establishing and monitoring streamlined procedures for handling customer complaints is one of the conditions set by RURA to all water utilities. Chapter V of the Regulations on the Minimum Required Service Level for Water Service Provision concerns the handling of complaints. Section 1 of this chapter is about establishing procedures for handling complaints. Articles 27, 28, and 29 deal with handling general complaints, billing complaints, and service complaints, respectively.
For the past three years, EWSA staff compiled customer complaints in Kigali, Nyagatare, and Musanze. Tables 11 and 12 indicate the trend of complaints received at Musanze from 2010–2011 to 2012–2013. Customers in Musanze register most of their complaints through telephone (mobile phones or calls via a toll-free 3535 number), in person, via SMS, and through letters. The trend reflects an increasing number of complaints. This may imply that customers are eager to receive quality service or that the number of connected people is increasing in the same proportion with the complaints. Customer satisfaction is very important, as it encourages them to willingly pay their bills on time. Strategic measures are required not only to meet customers’ expectation but also to comply with the regulations on the minimum service standards required for water service provision.
Table 11: Types and number of customer complaints in Musanze Branch
In Nyagatare, customer complaint statistics are shown in the table below. Methods of recieving complaints included telephone, toll call, SMS, and in person. A downward trend of complaints indicated in Nyagatare probably indicates improved service provision and thus customer satisfaction.
CONNECTION TYPE TOTAL CONNECTIONS
BILLED BILLED (m3) ANNUAL BILLING ( US$)
House connection 70,006 62,928 10,895,759 8,244,245 Public tap/stand pipe 627 627 466,931 193,113 Commercial and industrial uses 143 14 1,189,299 1,372,993 Institutional use 219 164 1,385,333 1,611,637 Bulk water supply 1 1 101,249 127,731 Others (Diplomat) 192 192 141,747 153,702 Grand total 71,188 64,055 14,180,318 11,703,422
TYPES OF COMPLAINTS NUMBER OF COMPLAINTS RECEIVED 2010–2011 2011–2012 2012–2013
Water shortages 300 350 400 Bill 400 600 1,200 Leakage information 500 600 700 Total 1,200 1,550 2,300
26
Table 12: Types and numbers of customer complaints received in Nyagatare Branch
However, complaint data should be treated with caution as it could be due to a lack of comprehensive recording of every reported complaint.
4.9 HUMAN RESOURCES Availability of adequate human resources is a paramount factor in enhancing the effectiveness and efficient performance of water utilities. EWSA strives to have adequate human resources in terms of quality and quantity, thus improving work performance and attaining the set targets of the performance contract. Skill development programs are in place to enable staffers to build their capacity. These programs are handled by EWSA headquarters after the branches submit their training needs. The arrangement is commended and needs to be upheld.
However, an inadequate number of human resources—especially meter readers—affects metering efficiency and thus contributes to high NRW levels. For instance, Nyagatare has only three staffers, including the customer manager. Nyagatere has a total of 5,000 connections and a two-week meter-reading cycle every month. Working out the ratio for the meter readers against the available number of days, one meter reader is required to read 167 meters per day. This implies that at each connnection, a meter reader can only spend 0.3 minutes per meter—including walking time to the next connection. Another example of a heavy meter-reading workload is in Musanze, where one meter reader is required to read 1,000–1,200 meters in two weeks. In practice this is a heavy workload, especially where customers are not mapped and are sparsely distributed, as in Nyagatare and Musanze. This situation could contribute to meter reading estimates, thus affecting billing efficiency and collection. In other words, low meter reading efficiency is one of the factors contributing to NRW. Addressing this problem can enhance meter-reading efficiency and thus increase revenue collection.
TYPES OF COMPLAINTS NUMBER OF COMPLAINTS RECEIVED 2010–2011 2011–2012 2012–2013
Lack of water 897 354 125 Billing issues 298 150 91 Delay in connections 128 54 29 Total 1,323 558 245
27
5.0 PROPOSED WASH INTERVENTION PROJECT ACTIVITIES
Based on these findings under the WASH Assessment Phase II exercise and on the key priorities given by EWSA—which include NRW reduction, billing efficiency through improved technology, increased network coverage, and water network mapping—the following activities are proposed for the PREPARED Project.
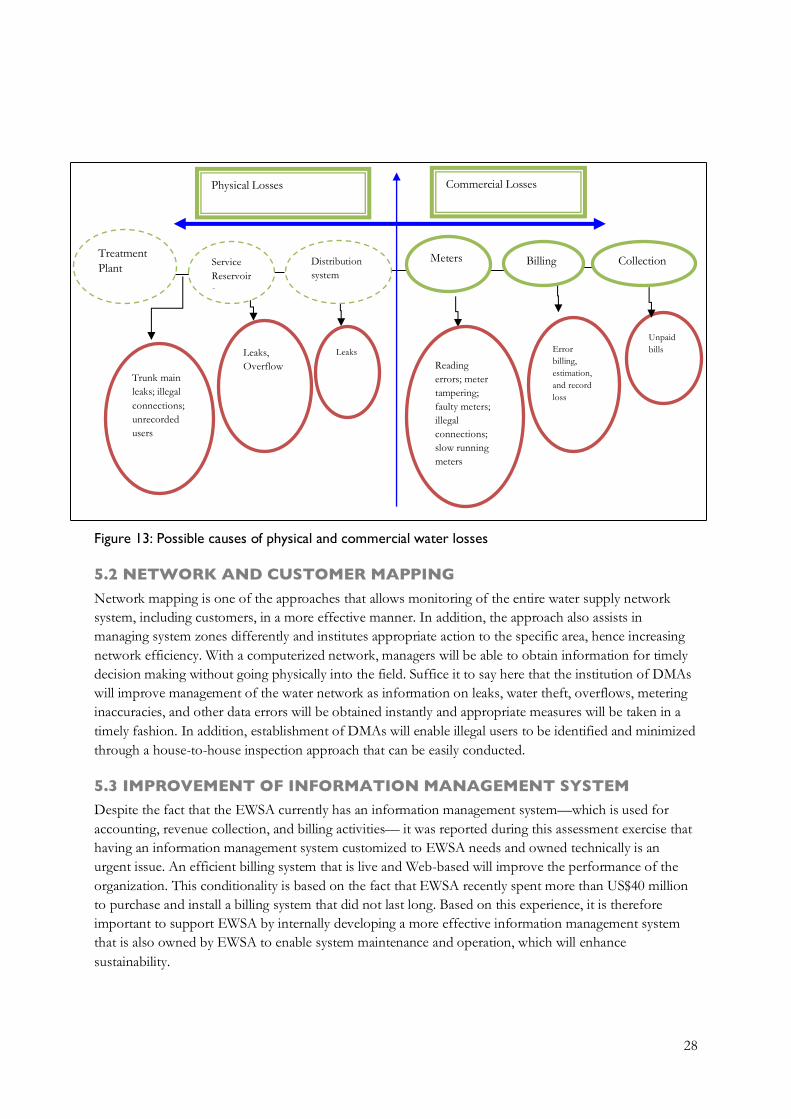
5.1 REDUCTION OF NON-REVENUE WATER NRW reduction by the EWSA is important not only for improved service provision but also for mitigating the financial losses being incurred by water utilities. With NRW of 68% and 61% in Nyagatare and Musanze, respectively, this poses a significant threat to the viability and sustainability of the utilities. Because it is not clearly known how much NRW is associated with apparent and real losses, it is very important to conduct a thorough study to investigate the contributing factors to apparent and real losses. The apparent and real losses for Rwandan utilities are shown in Figure 13. This kind of information will assist in designing and implementing more specific measures for addressing NRW challenges. This intervention is also in line with proposals made during the Regional WASH Task Force (RWSHTF) meeting in Bujumbura in February 2014. It was proposed that East Africa Community partner states should prioritize NRW as a regional challenge that should be addressed with urgency.
28
Figure 13: Possible causes of physical and commercial water losses
5.2 NETWORK AND CUSTOMER MAPPING Network mapping is one of the approaches that allows monitoring of the entire water supply network system, including customers, in a more effective manner. In addition, the approach also assists in managing system zones differently and institutes appropriate action to the specific area, hence increasing network efficiency. With a computerized network, managers will be able to obtain information for timely decision making without going physically into the field. Suffice it to say here that the institution of DMAs will improve management of the water network as information on leaks, water theft, overflows, metering inaccuracies, and other data errors will be obtained instantly and appropriate measures will be taken in a timely fashion. In addition, establishment of DMAs will enable illegal users to be identified and minimized through a house-to-house inspection approach that can be easily conducted.
5.3 IMPROVEMENT OF INFORMATION MANAGEMENT SYSTEM Despite the fact that the EWSA currently has an information management system—which is used for accounting, revenue collection, and billing activities— it was reported during this assessment exercise that having an information management system customized to EWSA needs and owned technically is an urgent issue. An efficient billing system that is live and Web-based will improve the performance of the organization. This conditionality is based on the fact that EWSA recently spent more than US$40 million to purchase and install a billing system that did not last long. Based on this experience, it is therefore important to support EWSA by internally developing a more effective information management system that is also owned by EWSA to enable system maintenance and operation, which will enhance sustainability.
Reading errors; meter tampering; faulty meters; illegal connections; slow running meters
Trunk main leaks; illegal connections; unrecorded users
Error billing, estimation, and record loss
Leaks, Overflow
Leaks
Unpaid bills
Physical Losses Commercial Losses
Meters Billing Collection Distribution system
Treatment Plant Service
Reservoirs
29
5.4 INTRODUCE QUALITY SERVICE IMPROVEMENT PROGRAM A quality service improvement program (QSIP) is an interlocking series of activities within an organization that is intended to move the organization towards a more service-and customer-focused culture. Sometimes called an “organizational culture change” campaign, it attempts to change attitudes, behaviors, and the actual practices within an organization. It is therefore important that the PREPARED Project introduce, demonstrate, and institutionalize a QSIP that will foster a service culture by involving managers, staffers who provide the service, and customers in establishing service standards and in defining the means to achieve them. In order for EWSA Nyagatare, Musanze, and Kigali to implement the program successfully, the PREPARED Project should train EWSA staffers at the branches as well as at the head office. EWSA could implement a QSIP by conducting service audits and preparing service improvement strategies that will complement the current performance contract.
5.5 PROTECTION OF WATER CATCHMENT AREAS AND WATER PIPELINE NETWORK SYSTEM Activities to protect water sources are of great importance in enhancing the availability of quality water resources for human use. Soil conservation measures are equally important, as soil erosion is the main problem not only affecting water quality but also increasing water treatment costs. Interventions leading to the protection of water sources as well as soil conservation through tree planting and reforestation of catchment areas are suggested. Protection of the network system—especially for the main pipelines and water reservoirs—is also very important. The main issue here is to ensure that where the pipeline passes through individually owned farmlands, way-leave agreements are prepared and signed by both EWSA and the farm owners. This would ensure that portions of land where water mains are passing private land have been acquired legally to avoid land ownership conflicts.
5.6 SKILLS DEVELOPMENT/CAPACITY BUILDING Capacity building of EWSA staff to enable execution of their duties will help utilities realize their vision and mission. Technical know-how on various technologies and facilities—such as leak-detection equipment, water treatment to increase production capacity, an efficient billing system, NRW reduction, etc.—are of great importance. Capacity building should also involve other actors in the water sector, such as NGOs and community-based organizations (CBOs). These organizations are very important as they play a key role in managing water resources. This is vital, because water sources, such as springs that originate from catchment areas, are sparsely distributed and threatened by human activities like farming and deforestration. Adding capacity to these CBOs on conservation of water sources would enhance water resource availability in a more sustainable way and mitigate climate change impacts.

30
6.0 PROPOSED INTERVENTION AND IMPLEMENTATION FRAMEWORK In order to have effective implementation of the proposed interventions through the PREPARED Project, a participatory approach through existing EWSA management structure will be important. Both EWSA headquarters and branches should be fully involved in management. Involvement of EWSA at both levels is due to the fact that EWSA currently operates through a centralized system in which the head office is responsible for decision making. Branches have no mandate to decide major issues/affairs affecting their areas of jurisdiction. In addition, EWSA involvement will ensure ownership of the proposed interventions to be done by the PREPARED Project and thus enhance sustainability of project activities.
Involvement of other partners who will be interested—particularly the one with specialized expertise in the area of intervention—will be vital for the intervention’s successes. The partnership with Itron France, for example, for NRW interventions in the National Water and Sewerage Corporation (NWSC)-Jinja, could be extended to Kigali, Musanze, and Nyagatare. Itron has experience in handling detailed NRW diagnostic studies to establish the contributing factors to apparent and real losses. Bringing them on board, given that they already have an interest of working in Rwanda, will be advantageous. However, in every activity, EWSA staff should also be involved.
Protection of water sources and catchment areas should involve EWSA, NGOs, CBOs, and private actors. In addition, community groups could also be involved in protecting the water pipeline network system, thus assisting in leak detection as well as prevention of vandalism and illegal use. Involvement of these actors—especially NGOs and CBOs—will reduce the EWSA workload and thus enable the authority to concentrate on core organization functions (i.e., production and distribution of water). However, framework preparation, which will enable effective involvement of NGOs, CBOs, and other private actors, is very important as this will clearly stipulate how these actors execute their roles.
Building capacity for EWSA staff should be on long-term and short-term training courses and on-the-job training. One example of such training can be staffers accompanying the PREPARED Project consultant, partners, and team members during field work in Rwanda. The proposed training arrangement will help EWSA have skill development in terms of long-term and short-term perspectives that enable effective and efficient implementation of its mandate. On the other hand, capacity building of NGOs and CBOs is also important to enable them to execute their activities relating to protection of water sources and catchment areas.
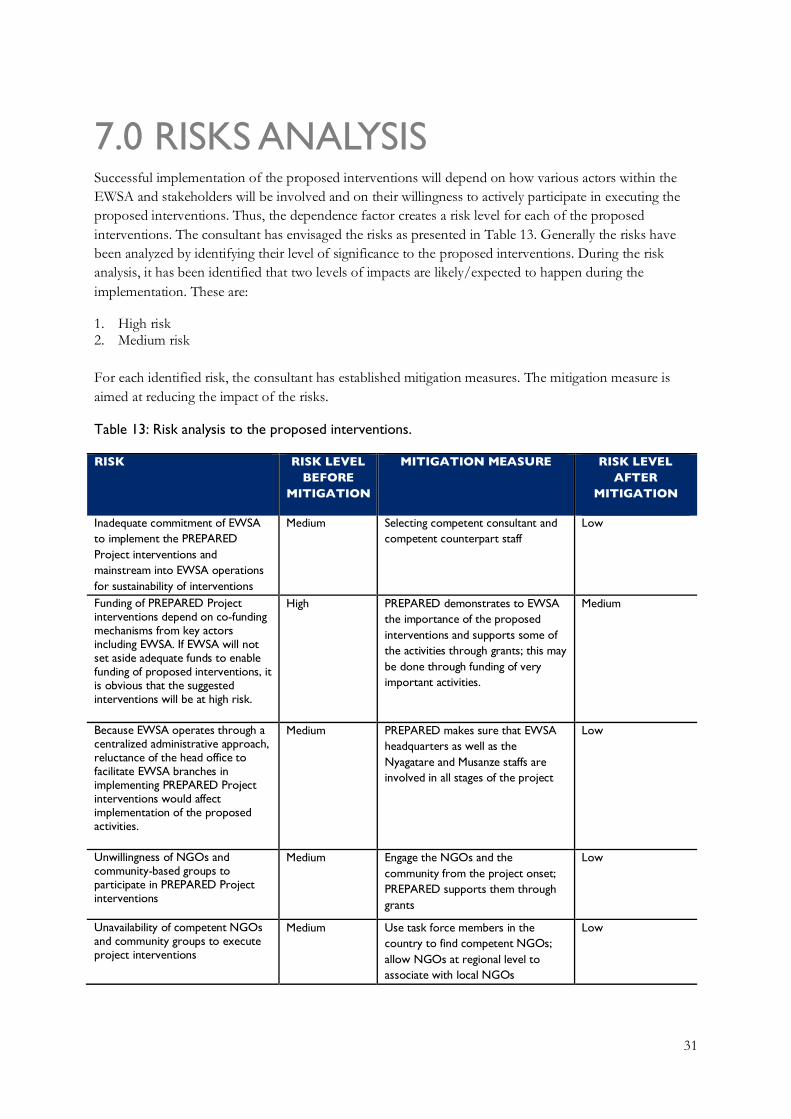
31
7.0 RISKS ANALYSIS Successful implementation of the proposed interventions will depend on how various actors within the EWSA and stakeholders will be involved and on their willingness to actively participate in executing the proposed interventions. Thus, the dependence factor creates a risk level for each of the proposed interventions. The consultant has envisaged the risks as presented in Table 13. Generally the risks have been analyzed by identifying their level of significance to the proposed interventions. During the risk analysis, it has been identified that two levels of impacts are likely/expected to happen during the implementation. These are:
1. High risk 2. Medium risk For each identified risk, the consultant has established mitigation measures. The mitigation measure is aimed at reducing the impact of the risks.
Table 13: Risk analysis to the proposed interventions.
RISK RISK LEVEL BEFORE
MITIGATION
MITIGATION MEASURE RISK LEVEL AFTER
MITIGATION
Inadequate commitment of EWSA to implement the PREPARED Project interventions and mainstream into EWSA operations for sustainability of interventions
Medium Selecting competent consultant and competent counterpart staff
Low
Funding of PREPARED Project interventions depend on co-funding mechanisms from key actors including EWSA. If EWSA will not set aside adequate funds to enable funding of proposed interventions, it is obvious that the suggested interventions will be at high risk.
High PREPARED demonstrates to EWSA the importance of the proposed interventions and supports some of the activities through grants; this may be done through funding of very important activities.
Medium
Because EWSA operates through a centralized administrative approach, reluctance of the head office to facilitate EWSA branches in implementing PREPARED Project interventions would affect implementation of the proposed activities.
Medium PREPARED makes sure that EWSA headquarters as well as the Nyagatare and Musanze staffs are involved in all stages of the project
Low
Unwillingness of NGOs and community-based groups to participate in PREPARED Project interventions
Medium Engage the NGOs and the community from the project onset; PREPARED supports them through grants
Low
Unavailability of competent NGOs and community groups to execute project interventions
Medium Use task force members in the country to find competent NGOs; allow NGOs at regional level to associate with local NGOs
Low

32
8.0 CONCLUSION AND RECOMMENDATIONS
The EWSA strives to increase water supply coverage in urban areas in the country. Despite the efforts being done to achieve its vision and mission, the EWSA is facing several challenges that impact service delivery. The major challenges include low water production, low water supply coverage, high NRW, and inadequate staff in terms of quantity and quality. Other challenges include old water network systems, network leakages, vandalism, and illegal use of water (including illegal connections). Insufficient protection of water sources and their associated catchment areas also pose a major threat to adeqaute availability of quality water. Soil erosion is a common problem that affects the water quality and hence increases the costs of operating and maintaing the treatment works and that of water production. Also, the issue of NRW not only affects water supply coverage but also affects the utilities’ financial position. Addressing NRW accordingly will enable EWSA to be financially viable—and, as a result, meet its operation and maintence costs as well as embark on assest development, which is currently at a very slow pace.
Based on the aforesaid and the results of this mission, the following are proposed for possible intervention by the PREPARED Project:
1. Conduct a detailed diagonostic study to determine the contributing factors to physical and commercial NRW losses; the diagnostic should involve all segments of the network system as well as customer- and administrative-related aspects; this study will enable designing appropriate measures for NRW reduction. The study should be conducted in all appraised utilities (Nyagatare, Musanze, and Kigali).
2. Based on the results of the diagnostic study, implement the recommendations for reducing NRW 3. Customer mapping to enhance effective customer management, particularly on issues related to
connections, billing, metering, and meter reading 4. Establish DMAs, especially in Kigali City, that are based on hydraulic modeling; this will enable
effective monitoring of the network system and hence lead to interventions that are more focused and specific to the identified issue.
5. Put in place an efficient billing system to countercheck erroneous billing as well as bill estimations 6. Based on the skills-needs assessment provide staff with the technical know-how, especially in the
areas of reading meters, customer care, accounts, plant operations, and network management 7. Identify and/or strengthen NGOs and community groups to be involved in implementing project
interventions, such as protection of water sources and their associated catchment areas, protection of network systems, etc.
8. Ensure that materials used for water networks are per recommended standards; EWSA should supervise purchase of the materials for customers.
33
9.0 LIST OF CONTACTED LITERATURE
1. Republic of Rwanda. 2009. Guidelines on Required Minimum Service Level for Water Service Provision. www.rura.rw/fileadmin/docs/MRSL_Guidelines.pdf.
2. Republic of Rwanda. 2011. National Water Resource Management Policy. rnra.rw. 3. Republic of Rwanda. 2011. Water Resources Management Sub-Sector Strategic Plan: 2011–2015.
rnra.rw/index.php?...Rwanda Waterstrategy...file%5Bcontroller%5D 4. Republic of Rwanda. 2010. National Policy and Strategy for Water Supply and Sanitation Services.
www.ewsa.rw/Docs/National%20Policy%20and%20Strategy%20for%20water%20and%20sanitation.pdf.
5. Republic of Rwanda. 2012. Water Services Licensing Regulations. www.rura.rw/fileadmin/docs/Board_Decisions/Water_Services_Licensing_Regulations.pdf.
6. Tetra Tech ARD. 2014. Planning for Resilience in East Africa through Policy, Adaptation, Research and Economic Development (PREPARED): Proceeding of the Regional WASH Task Force Meeting Report Held at Royal Palace Hotel from 11–13th February, 2014, Bujumbura, Burundi.
7. Tetra Tech ARD. 2014. Planning for Resilience in East Africa through Policy, Adaptation, Research and Economic Development (PREPARED): WASH Baseline Report.
8. Republic of Rwanda. 2013. District Development Plan 2013–2018 for Nyagatare District, Eastern Province.
9. Republic of Rwanda. 2013. District Development Plan 2013–2018 for Musanze District, Northen Province.
10. Ministry of Infrastructure. 2014. Rwanda Hosts the Annual Review Meeting for Water, Sanitation, and Hygiene. MINIFRA Newsletter Issue No. 3, page 4.
11. Ministry of Infrastructure. 2013. EWSA Awards Best Customers. MINIFRA Newsletter Issue No. 2, page 3.

34
10.0 LIST OF CONTACTED PERSONS 1. Vedaste Kanarwugire, Branch Manager
Musanze EWSA Branch Tel.: +250 788307457 Email: [email protected]
2. Munyankindi Justus, Water Network Manager Musanze EWSA Branch Tel.: +250 788779129 Email: [email protected]
3. Mukagatare Betty, Customer Service Manager Musanze EWSA Branch Tel.: +250 788453256 Email: [email protected]
4. 1 Anaclet Mukiza, Manager Nyagatare Branch Tel.: +250 788541775 Email: [email protected]
5. Nsabimana Edison, Head of Water Network Operations Service Nyagatare EWSA Branch Email: [email protected]
6. Munyaneza Eric, Head of Customer Care Nyagatare EWSA Branch Tel: +250 788890453 Email: [email protected]
7. Marcellin Shumbusho, Water Plant Manager Nyagatare EWSA Branch Tel: +250 788 848479 Email: [email protected]
8. James C. Sano, Deputy Director General–Water and Sanitation Tel: +250 788 307891 Email: [email protected]
35
9. Mugabo Anselme, Head of Water Network Operations Tel: +250 788 522406 Email: [email protected]
10. Celestin Mwambutsa, Head Non-Revenue Water section Tel: +250 788 638762 Email: [email protected]
11. Clement Gafishi, LVWATSAN Cordinator
12. Viator Munyanshongore, NRW Senior Officer Tel: +250 788 307215 Email: [email protected]
13. Vedaste Kanarwugire, Branch Manager EWSA Musanze Branch Contact

36
U.S. Agency for International Development
1300 Pennsylvania Avenue, NW
Washington, DC 20523
Tel: (202) 712-0000
Fax: (202) 216-3524
www.usaid.gov