planning and scheduling for traffic...
TRANSCRIPT
ICAPS 2010 Tutorial
Scott Sanner
Planning and Scheduling for Traffic Control
Outline
• Motivation
• History
• Fundamentals
• Simulation
• Control
– Single Intersection
– Multiple Intersection
• Future

Motivation
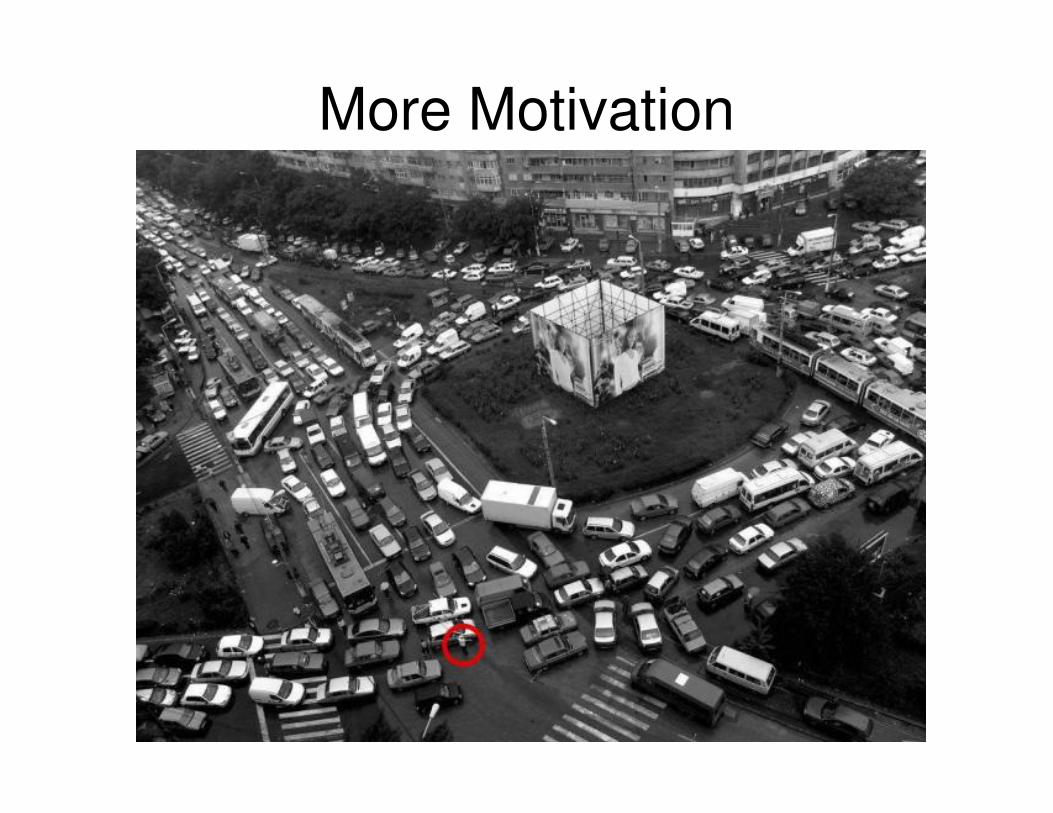
More Motivation

Unreal Motivation

Traffic Impacts Everyone
• Not a problem I have to motivate– Economically, impact of better control is in billions
of $$$ for large cities!
• Real & unsolved problem– Multidimensional state (integer / continuous)
– Multidimensional concurrent actions
– Stochastic
– Building a high fidelity model is difficult

Theory vs. Practice
• Theory
– Idealized
– Models major phenomena
– Good analytical techniques
• Practice
– Every case is different
– Control is principled
• but over-constrained
– Manually tuned
Need a stronger connection!
Integrating into the Food-chain
• Important to understand what exists theoretically– Entire field devoted to transportation research
• And how your research can integrate practically
– Billions of $$$ in legacy infrastructure
– Hardware is limited (e.g., 1970’s era)• But still more integrated than you think
– Systems are safety verified• Difficult and expensive to replace
• Figure out where to fit in for lowest cost
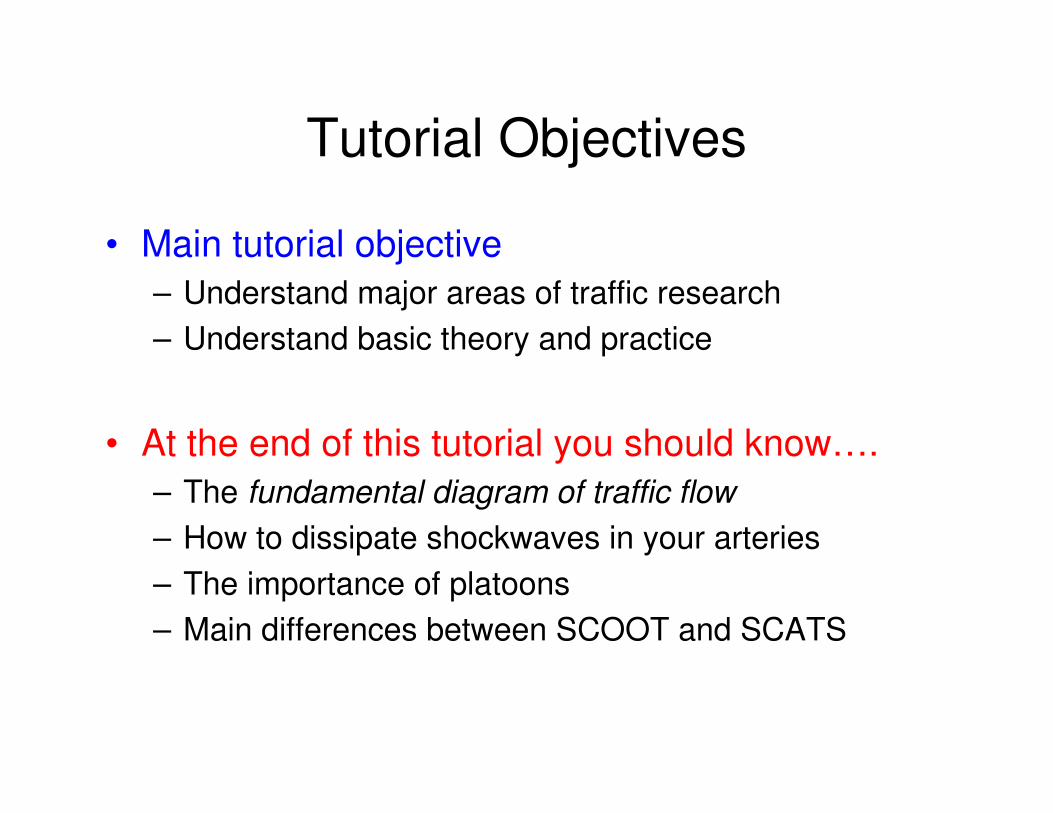
Tutorial Objectives
• Main tutorial objective
– Understand major areas of traffic research
– Understand basic theory and practice
• At the end of this tutorial you should know….
– The fundamental diagram of traffic flow
– How to dissipate shockwaves in your arteries
– The importance of platoons
– Main differences between SCOOT and SCATS
ICAPS 2010 Tutorial
Scott Sanner
Traffic Control: History
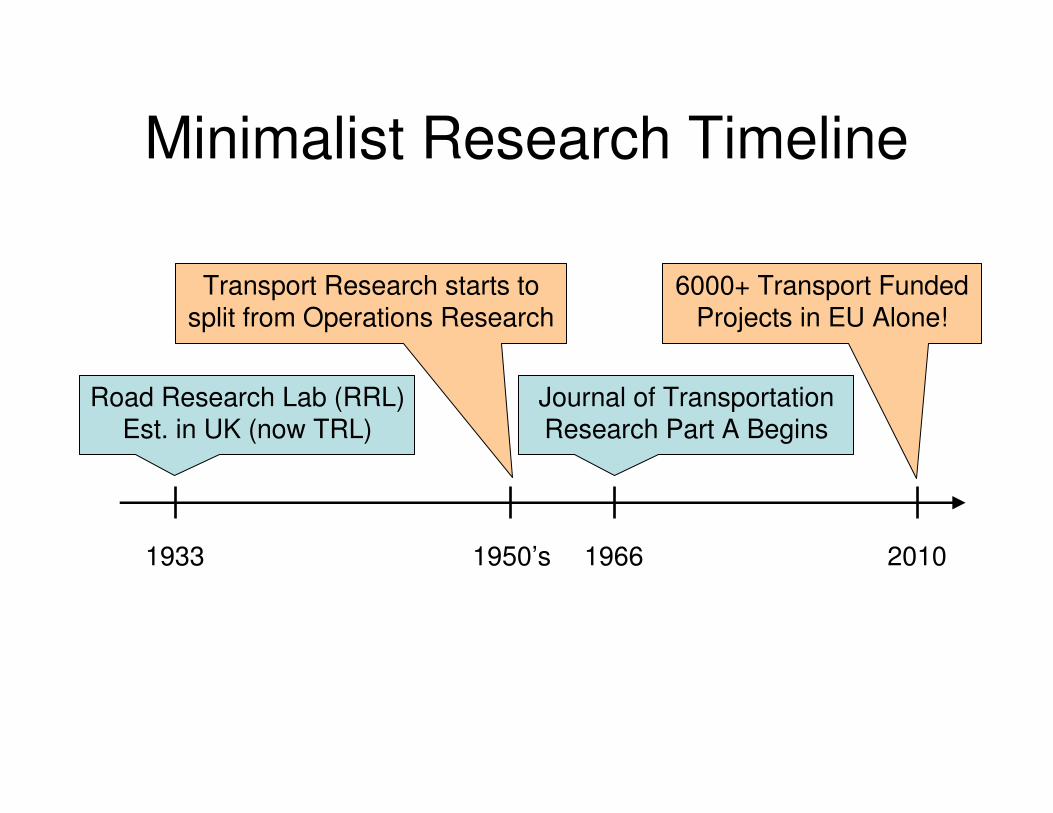
Minimalist Research Timeline
Road Research Lab (RRL) Est. in UK (now TRL)
1933 1950’s 2010
Transport Research starts to split from Operations Research
1966
Journal of Transportation Research Part A Begins
6000+ Transport Funded Projects in EU Alone!

Signalized Control Timeline
Timed ControlSome Sensing
Late 1920’s
1952 2000+
Analog Control (Denver)
1960
Digital Control (Toronto) IBM Mainframe, Some Sensing, Coord. Plans
Regional Coordination, Metering, VSL, Priority
Late 1970’s
SCATS, SCOOT: Adaptive Control

SCATS
• Sydney Coordinated Adaptive Traffic System
• Stoplinedetectors
• Coordinateddecentralizedcontrol
Car Detected!
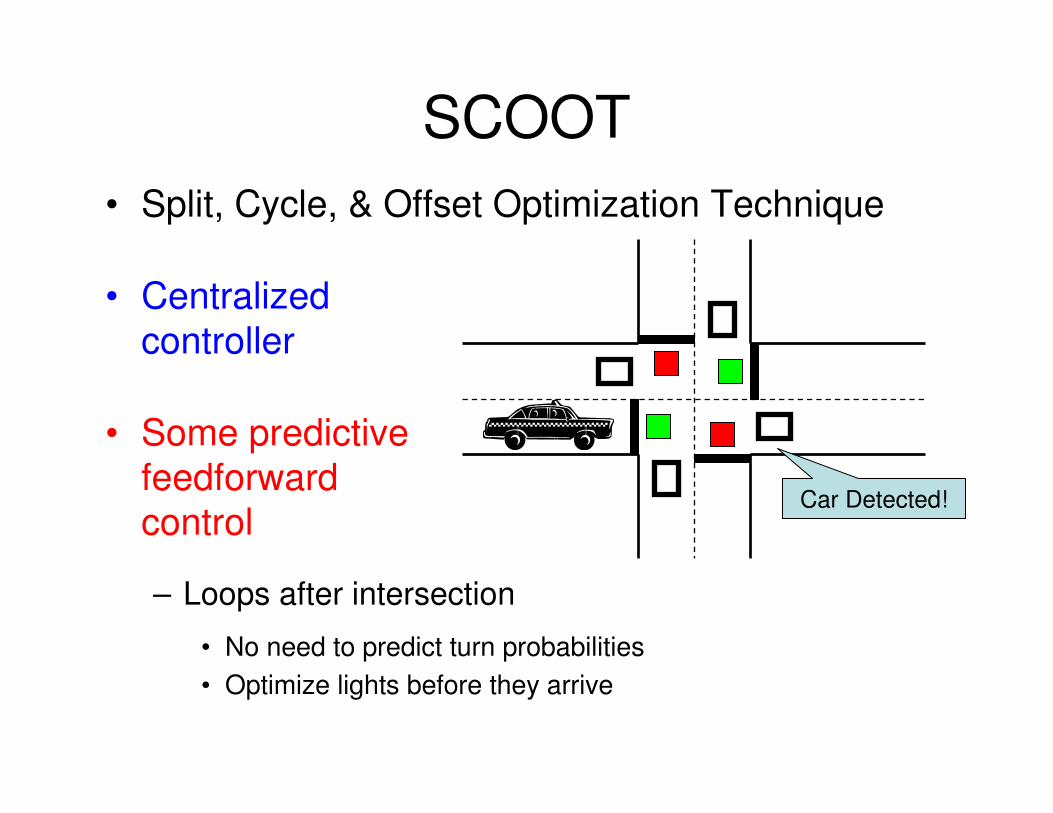
SCOOT
• Split, Cycle, & Offset Optimization Technique
• Centralized controller
• Some predictive feedforwardcontrol
– Loops after intersection
• No need to predict turn probabilities
• Optimize lights before they arrive
Car Detected!
ICAPS 2010 Tutorial
Scott Sanner
Traffic Control: Fundamentals
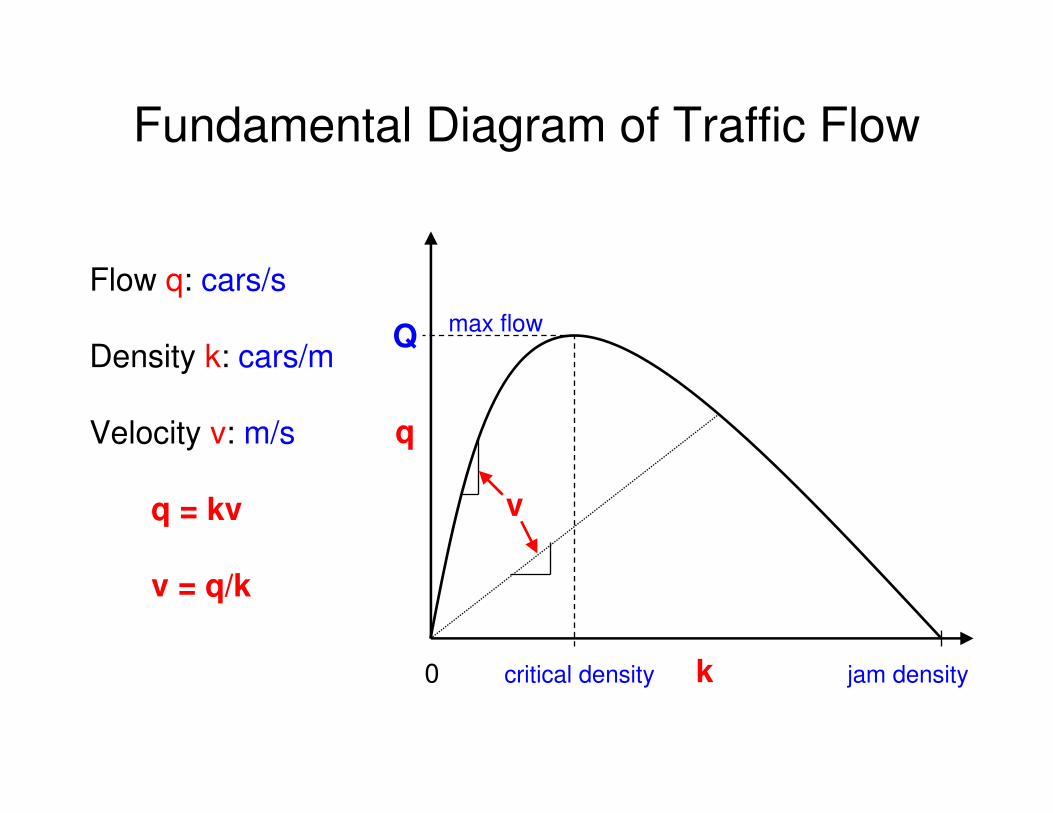
Fundamental Diagram of Traffic Flow
Flow q: cars/s
Density k: cars/m
Velocity v: m/s
q = kv
v = q/k
k
q
Q
critical density jam density
max flow
v
0

Terminology
• Signal, e.g.,
• Signal Group
• Phase
• Turns
– Protected Turn
– Filter Turn
• unprotected
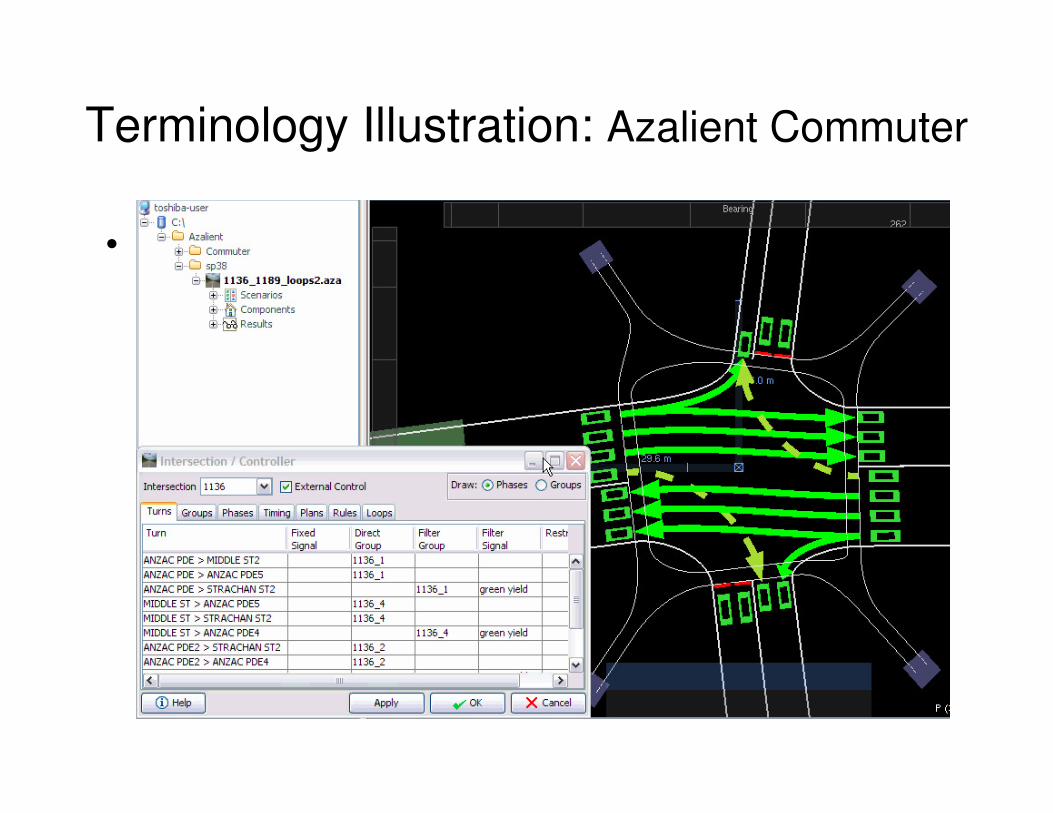
Terminology Illustration: Azalient Commuter
• A

• Each intersection has one or more phase plans
– Time percentage of cycle time is phase split
– Some absolute or variable times• Intergreen period
• Walk signals
• Turns
• Typically four plans per intersection– Heavy inbound / outbound, balanced, & light
Phase Plans
Stretch Phase
35%: Phase B
40%: Phase A & D
35%: Phase C
Cycle TimeNow just choose a plan and cycle time for one intersection!

ICAPS 2010 Tutorial
Scott Sanner
Traffic Control: Simulation
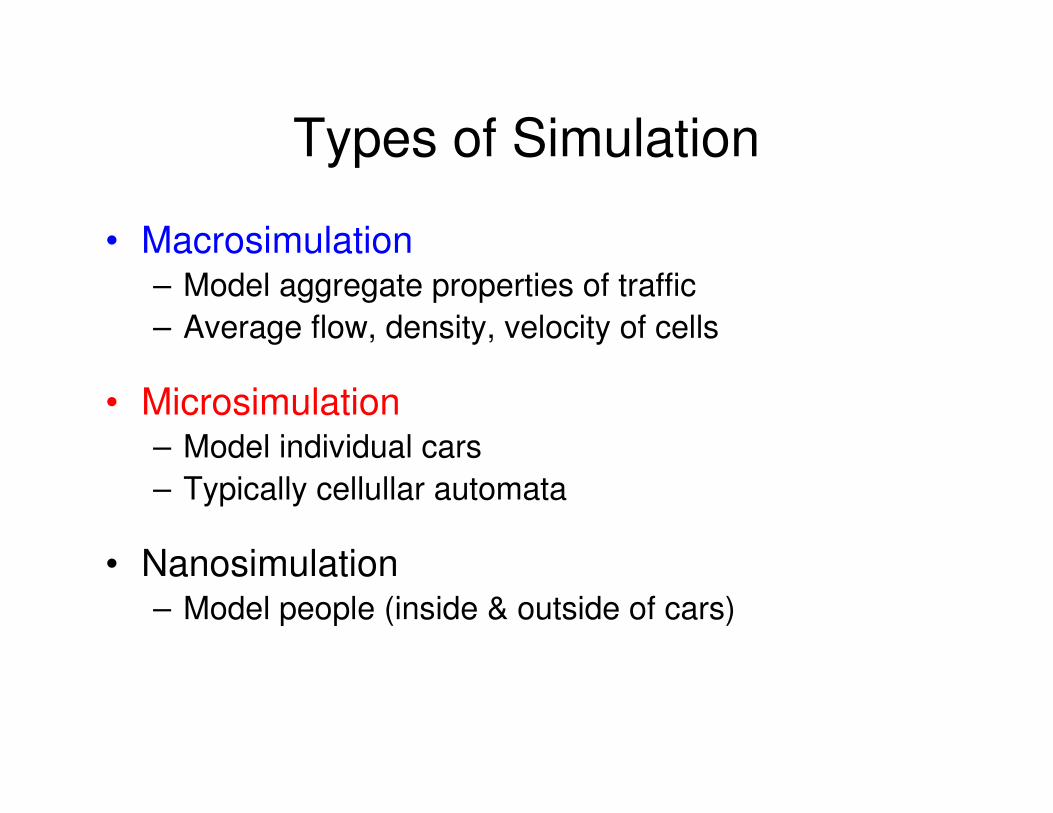
Types of Simulation
• Macrosimulation– Model aggregate properties of traffic
– Average flow, density, velocity of cells
• Microsimulation– Model individual cars
– Typically cellullar automata
• Nanosimulation– Model people (inside & outside of cars)
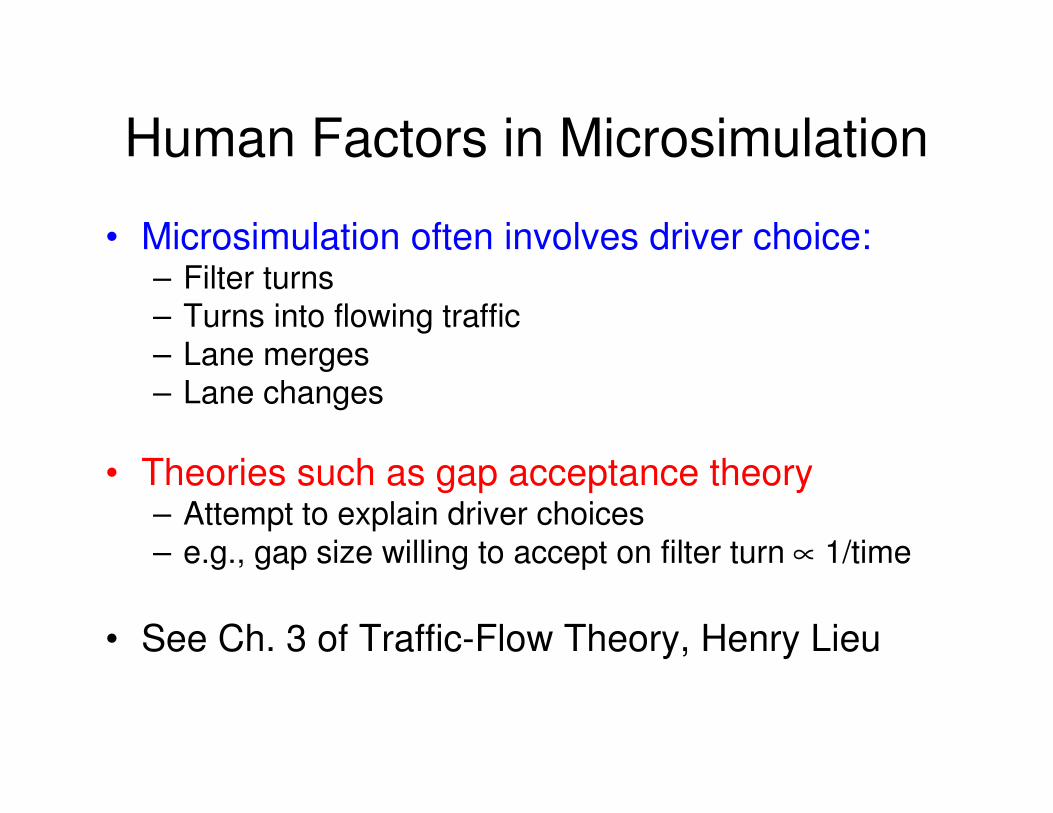
Human Factors in Microsimulation
• Microsimulation often involves driver choice:– Filter turns– Turns into flowing traffic– Lane merges– Lane changes
• Theories such as gap acceptance theory– Attempt to explain driver choices– e.g., gap size willing to accept on filter turn ∝ 1/time
• See Ch. 3 of Traffic-Flow Theory, Henry Lieu
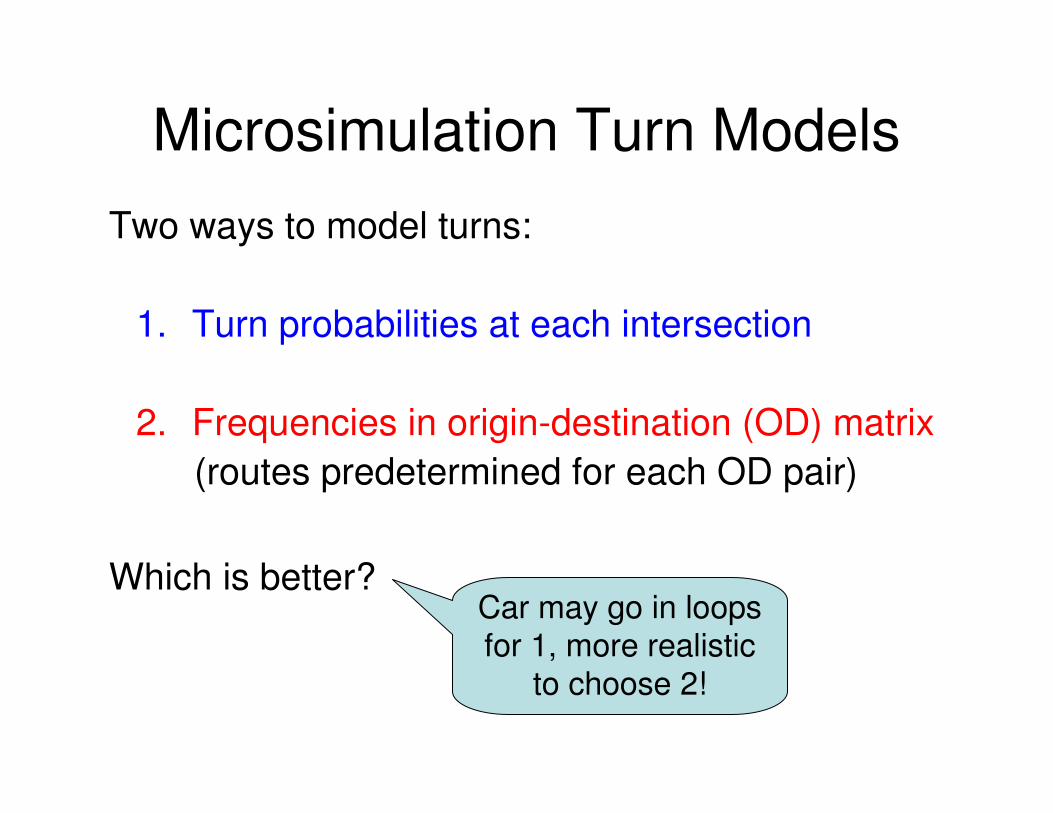
Microsimulation Turn Models
Two ways to model turns:
1. Turn probabilities at each intersection
2. Frequencies in origin-destination (OD) matrix
(routes predetermined for each OD pair)
Which is better?Car may go in loops for 1, more realistic
to choose 2!

Microsimulation
• Nagle-Schreckenberg
– Cellular Automata Model
• nominally each cell is 7.5m in length
– Simplest model that reproduces realistictraffic behavior
Image and description from: http://www.thp.uni-koeln.de/~as/Mypage/traffic.html

Car Following in Microsimulation
• Nagel-Schreckenberg
• 4 Rules
– Acceleration: vi := min(vi +1,vmax)
– Safety Distance: vi := min(vi,d)
– Randomization: prob p: vi := vi -1
– Driving: xi’ = xi + vi
Image and description from: http://www.thp.uni-koeln.de/~as/Mypage/traffic.html
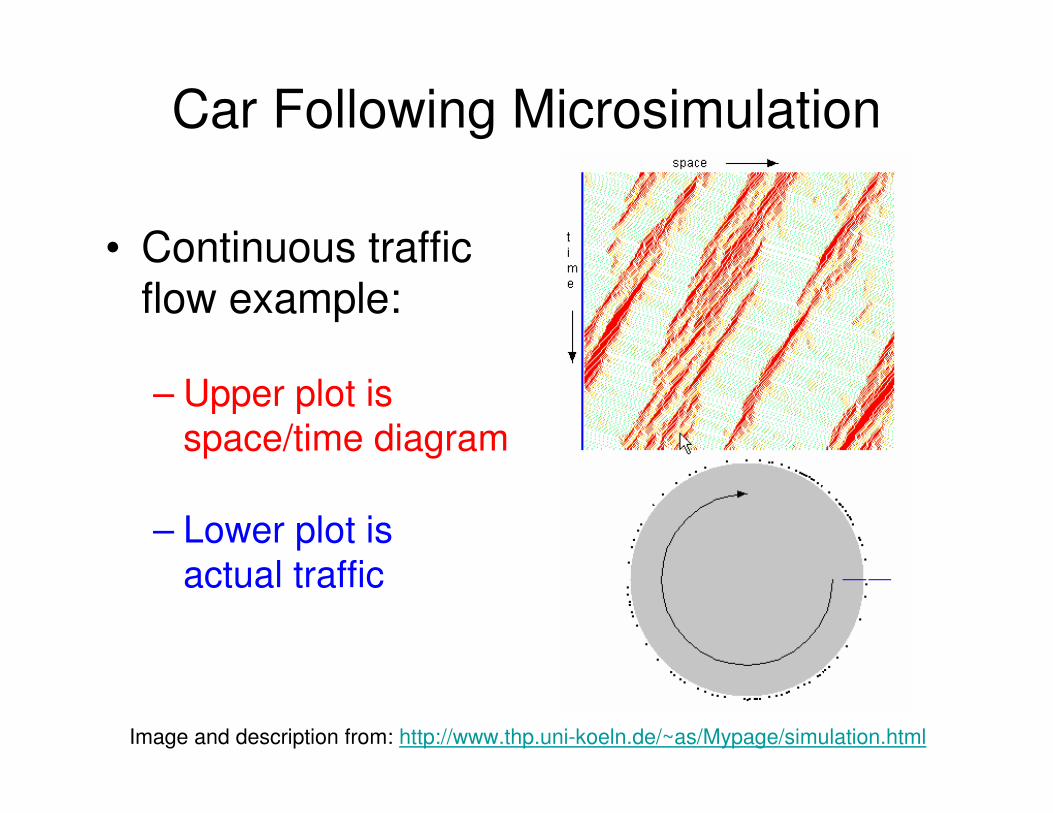
Car Following Microsimulation
• Continuous traffic flow example:
– Upper plot is space/time diagram
– Lower plot is actual traffic
Image and description from: http://www.thp.uni-koeln.de/~as/Mypage/simulation.html

An Even Better Microsimulator
http://news.sciencemag.org/sciencenow/2008/03/28-01.html

Shockwaves
• Low density traffic meets high density traffic…
Kd=.1 cars/m, vd=15m/sKu=.05 cars/m, vu=30 m/st=10
Kd=.1 cars/m, vd=15m/sKu=.05 cars/m, vu=30 m/st=20
Kd=.1 cars/m, vd=15m/sKu=.05 cars/m, vu=30 m/st=30
Shockwave (density wave)
Shockwave velocityu = -5m/s

Calculation of Shockwave Speed
• Law of conservation of cars:
– “Cars can neither be created nor destroyed”
• Traffic flows in/out of shockwave at rate:
qenter = ku(vu − u)
qexit = kd(vd − u)
qexit = qexit ⇒ u =kdvd − kuvu
kd − ku=qd − qu
kd − ku=∆q
∆k
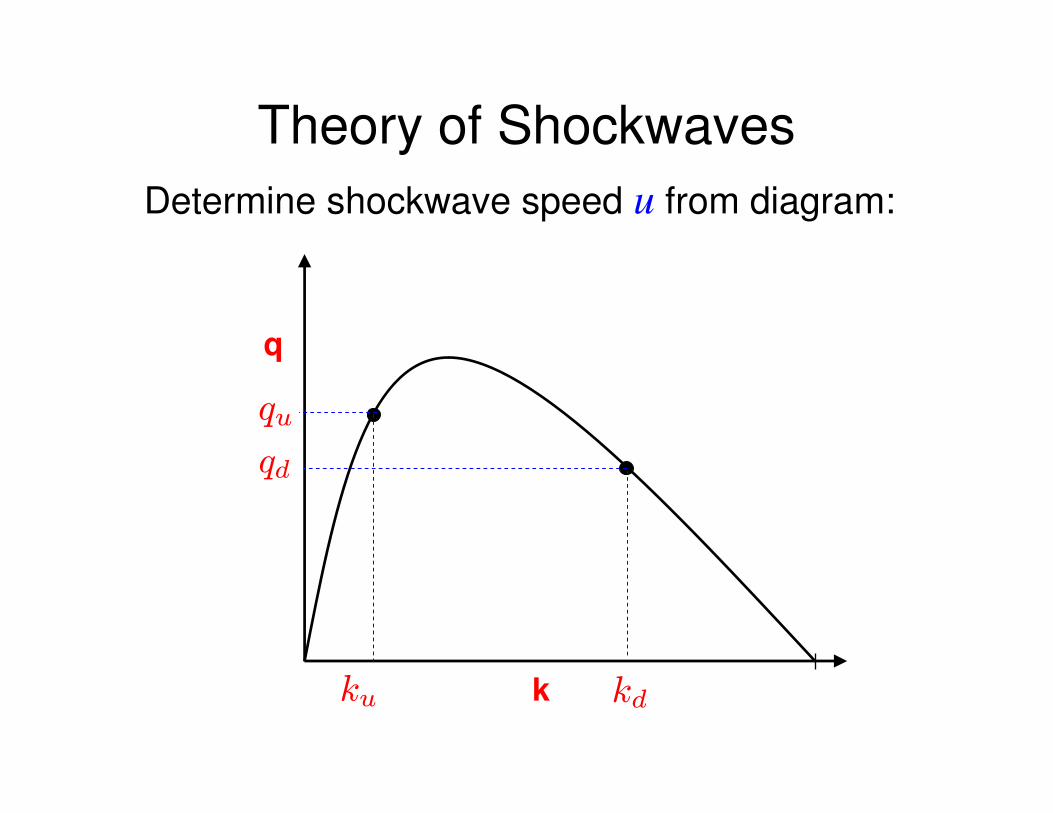
Theory of Shockwaves
Determine shockwave speed u from diagram:
k
q
qu
kd
qd
ku
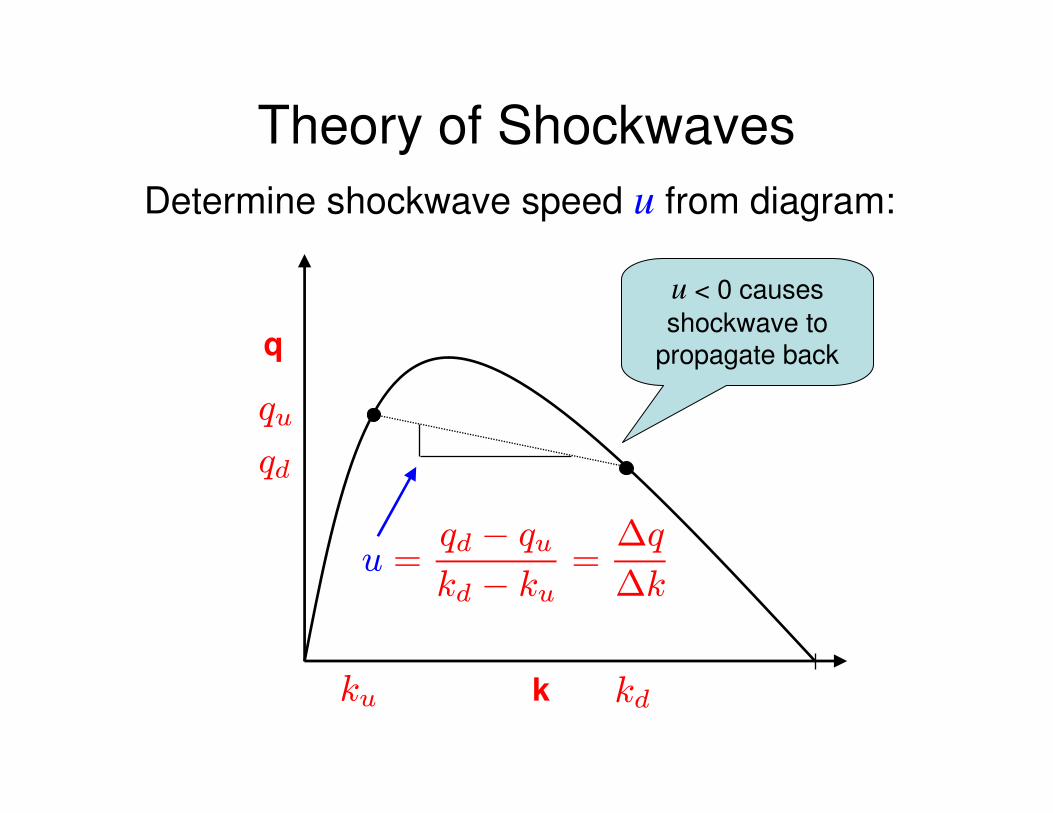
Theory of Shockwaves
Determine shockwave speed u from diagram:
k
q
kdku
u =qd − qu
kd − ku=∆q
∆k
u < 0 causes
shockwave to propagate back
qu
qd

u =qd − qu
kd − ku=∆q
∆k
Theory of Shockwaves
Determine shockwave speed u from diagram:
k
q
qd
kd
qu
ku
u > 0 dissipates
shockwaves!
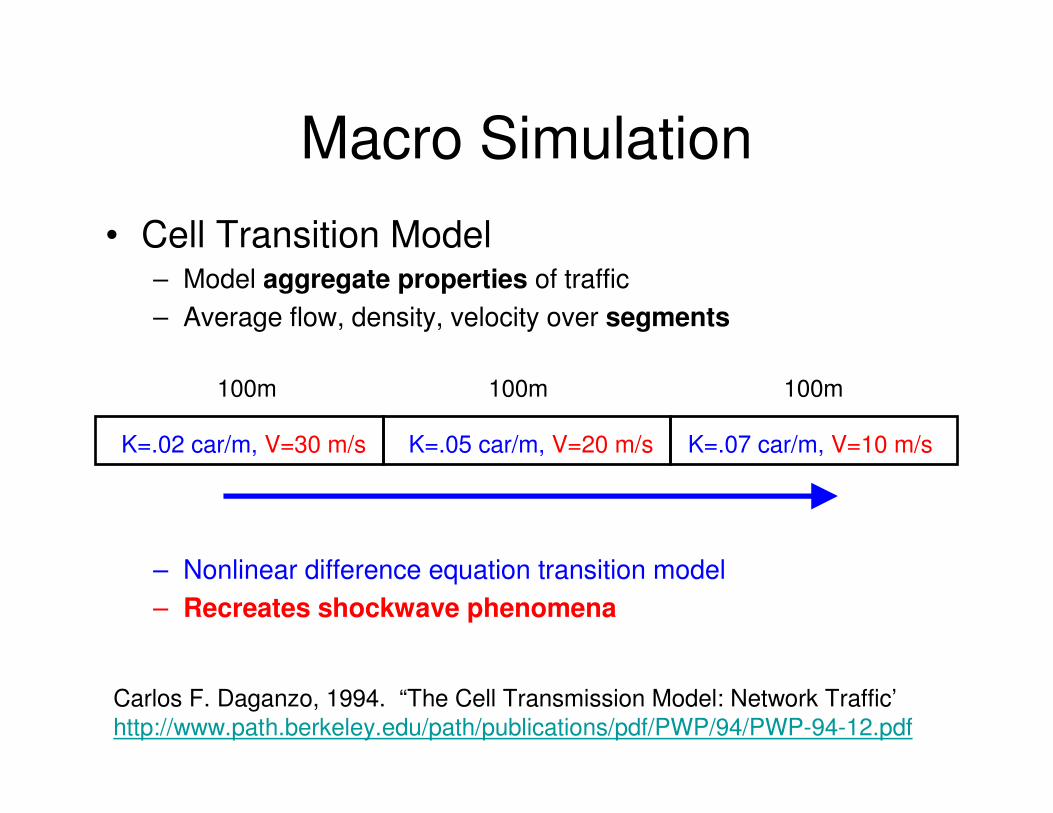
Macro Simulation
• Cell Transition Model– Model aggregate properties of traffic
– Average flow, density, velocity over segments
– Nonlinear difference equation transition model
– Recreates shockwave phenomena
Carlos F. Daganzo, 1994. “The Cell Transmission Model: Network Traffic’http://www.path.berkeley.edu/path/publications/pdf/PWP/94/PWP-94-12.pdf
100m 100m 100m
K=.02 car/m, V=30 m/s K=.05 car/m, V=20 m/s K=.07 car/m, V=10 m/s

Simulation Software
• Quadstone Paramics (microsimulation)– Largest market share
– Industrial strength
– Expensive
• Azalient Commuter (micro- and nano-simulation)– Relatively recent startup
– Intuitive 3D GUI
– Java API for external control and evaluation
– More economical for academia
Azalient Commuter
ICAPS 2010 Tutorial
Scott Sanner
Traffic Control:Single & Multi-intersection

Optimization Objective
• Can minimize– Delays,
– Stops,
– Fuel consumption,
– Emission of pollutants,
– Accidents
• Here we focus on delays in car-seconds(and implicitly stops, fuel, emissions)
Coordinated Control
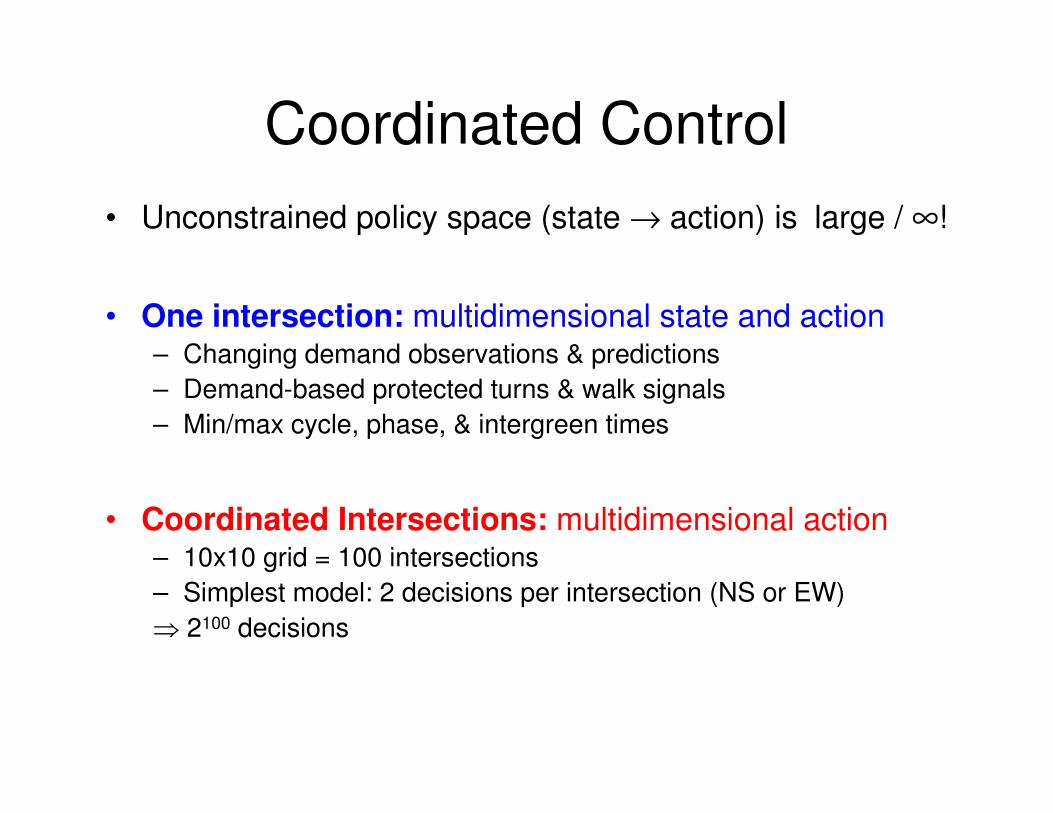
• Unconstrained policy space (state → action) is large / ∞!
• One intersection: multidimensional state and action– Changing demand observations & predictions
– Demand-based protected turns & walk signals
– Min/max cycle, phase, & intergreen times
• Coordinated Intersections: multidimensional action– 10x10 grid = 100 intersections
– Simplest model: 2 decisions per intersection (NS or EW)
⇒ 2100 decisions
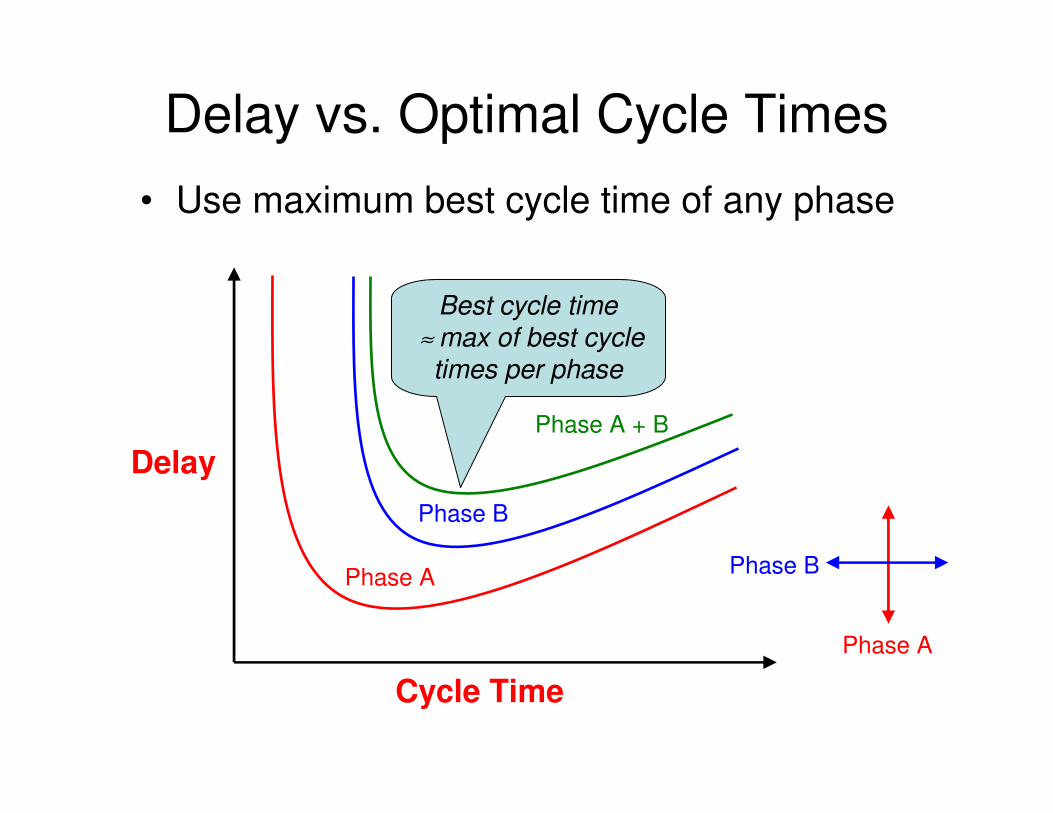
Delay vs. Optimal Cycle Times
Cycle Time
Delay
Phase A
Phase A
Phase B
Phase B
Phase A + B
Best cycle time
≈ max of best cycle
times per phase
• Use maximum best cycle time of any phase
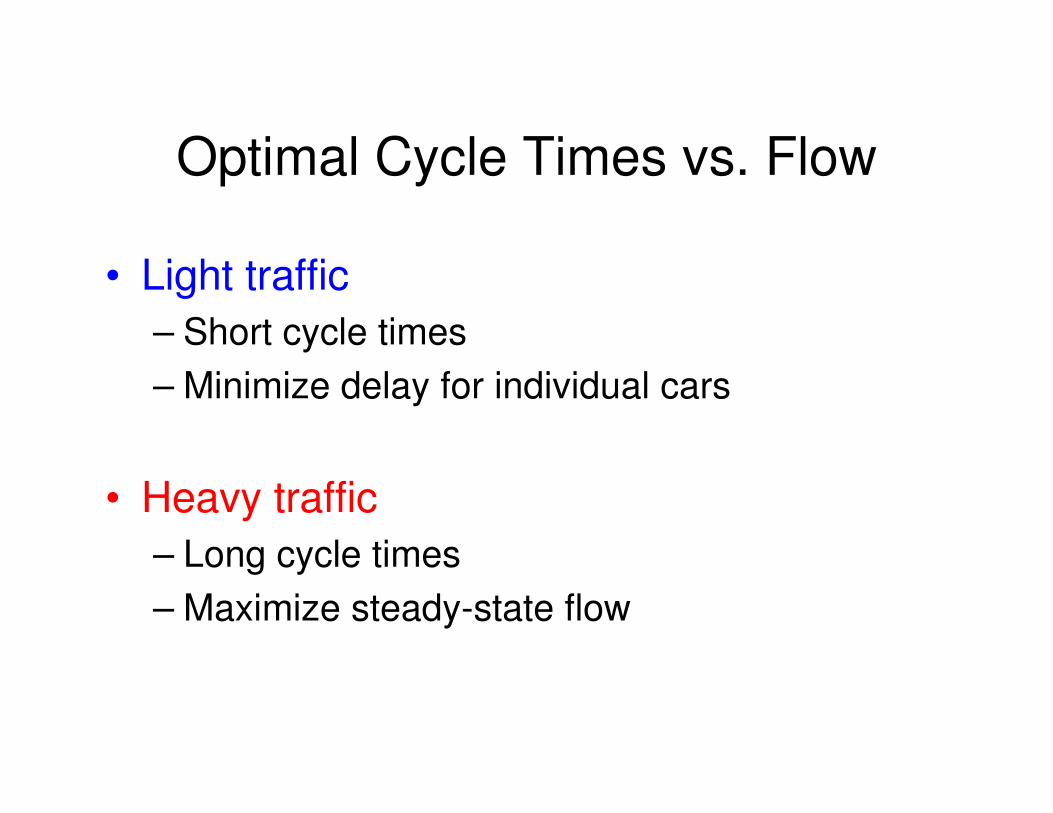
Optimal Cycle Times vs. Flow
• Light traffic
– Short cycle times
– Minimize delay for individual cars
• Heavy traffic
– Long cycle times
– Maximize steady-state flow
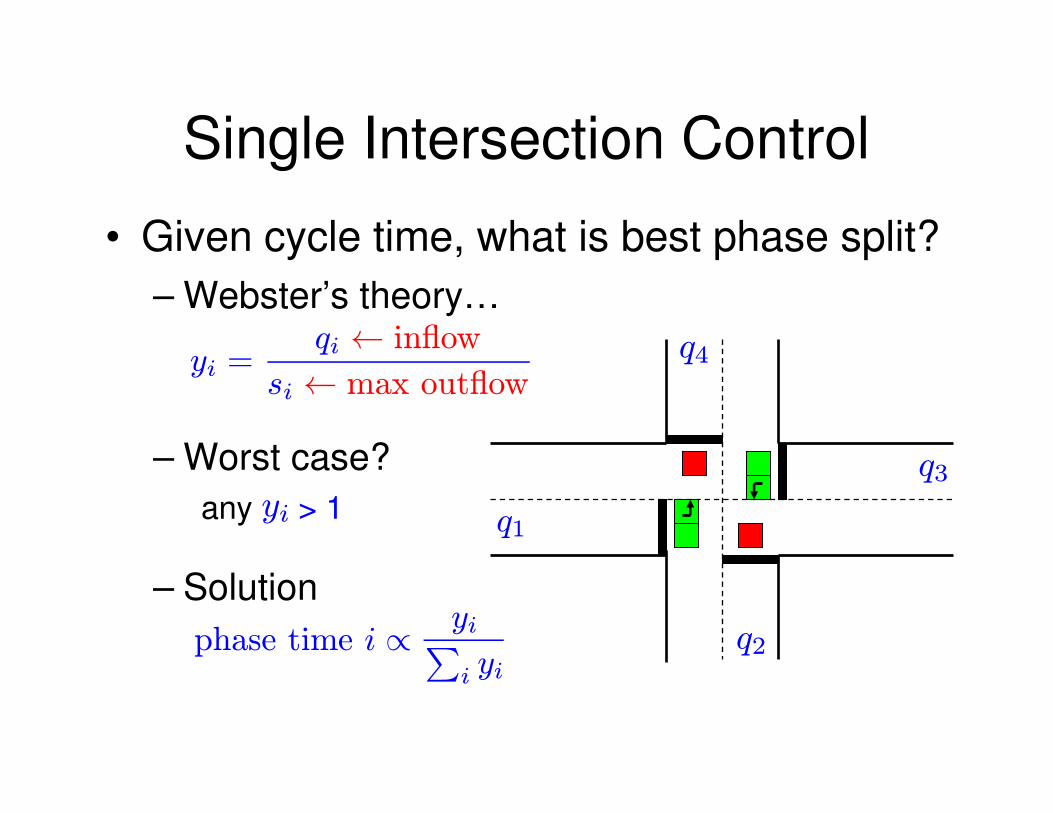
Single Intersection Control
• Given cycle time, what is best phase split?
– Webster’s theory…
– Worst case?
any > 1
– Solution
yi =qi ← inflow
si ← max outflow
yi
q2
q3
q4
phase time i ∝yi∑iyi
q1
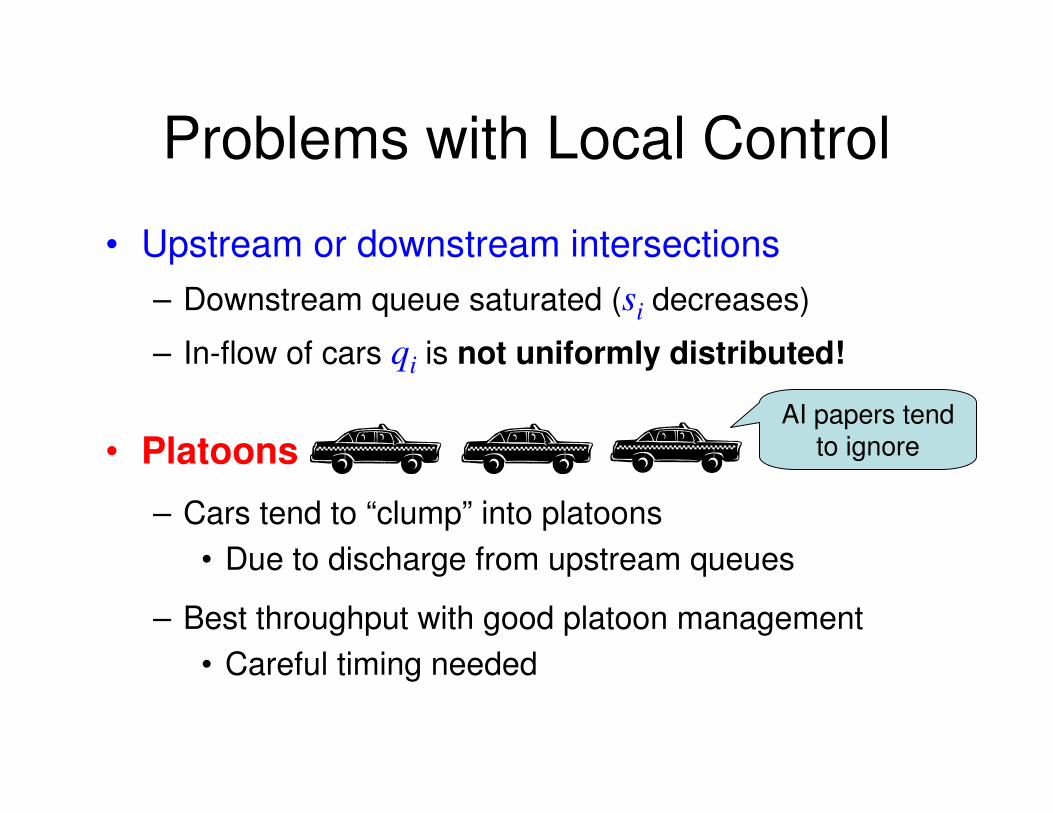
Problems with Local Control
• Upstream or downstream intersections
– Downstream queue saturated (si decreases)
– In-flow of cars qi is not uniformly distributed!
• Platoons
– Cars tend to “clump” into platoons
• Due to discharge from upstream queues
– Best throughput with good platoon management
• Careful timing needed
AI papers tend to ignore

Multi-intersection Control
• Optimize phase offsets for platoon throughput:
Time
Space
Light 1
Light 2
Light 3
Free flow velocity
Delay!
Delay!
Delay!
Optimize for platoons!

Master/Slave Offset Control
• Fix timing offsets from critical intersections
– Allows platoons to pass in dominant flow direction
Critical intersection
Offset Green = 25s
Offset Green = 30sOffset Green = 40s
Married intersections should share cycle
times (or 2x)!
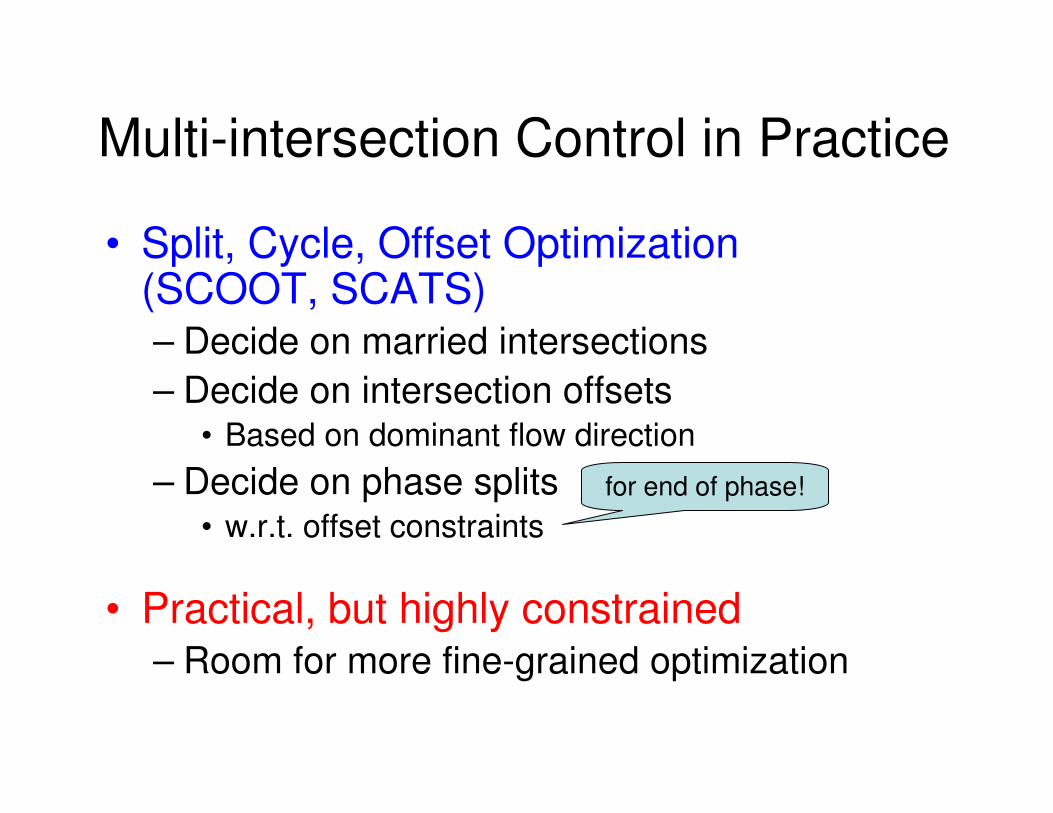
Multi-intersection Control in Practice
• Split, Cycle, Offset Optimization (SCOOT, SCATS)– Decide on married intersections
– Decide on intersection offsets• Based on dominant flow direction
– Decide on phase splits • w.r.t. offset constraints
• Practical, but highly constrained– Room for more fine-grained optimization
for end of phase!

ICAPS 2010 Tutorial
Scott Sanner
Traffic Control: Future
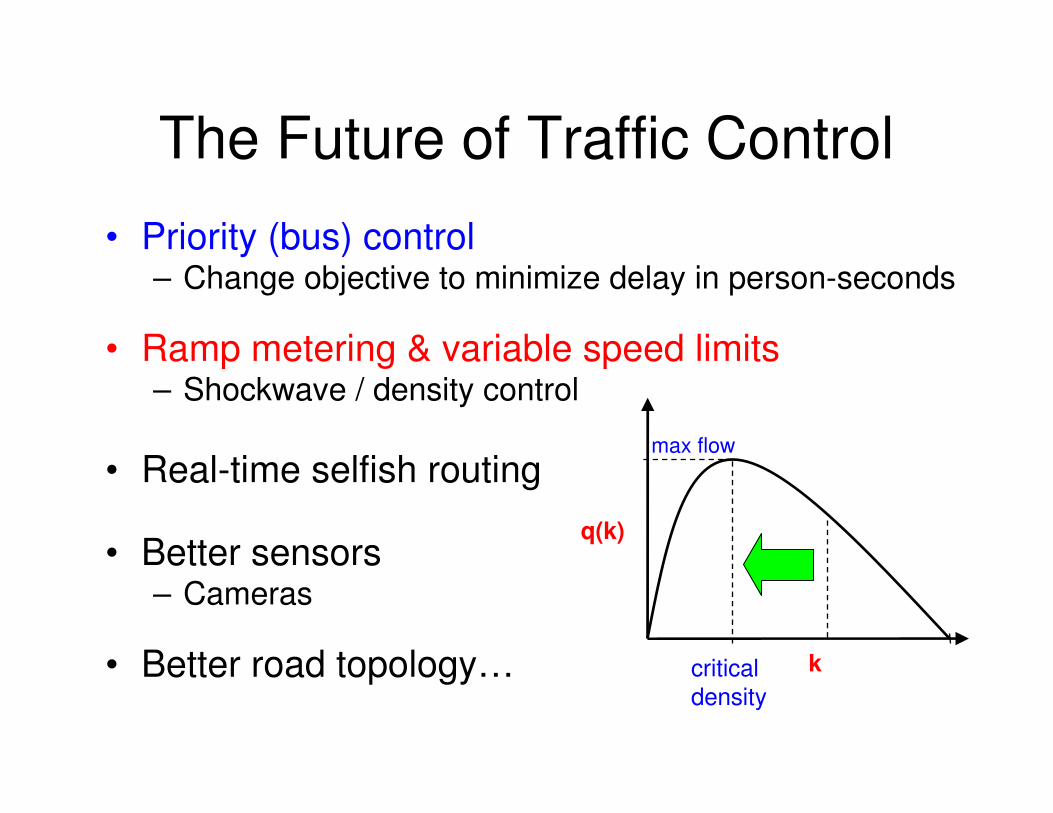
The Future of Traffic Control
• Priority (bus) control– Change objective to minimize delay in person-seconds
• Ramp metering & variable speed limits– Shockwave / density control
• Real-time selfish routing
• Better sensors– Cameras
• Better road topology… k
q(k)
critical density
max flow
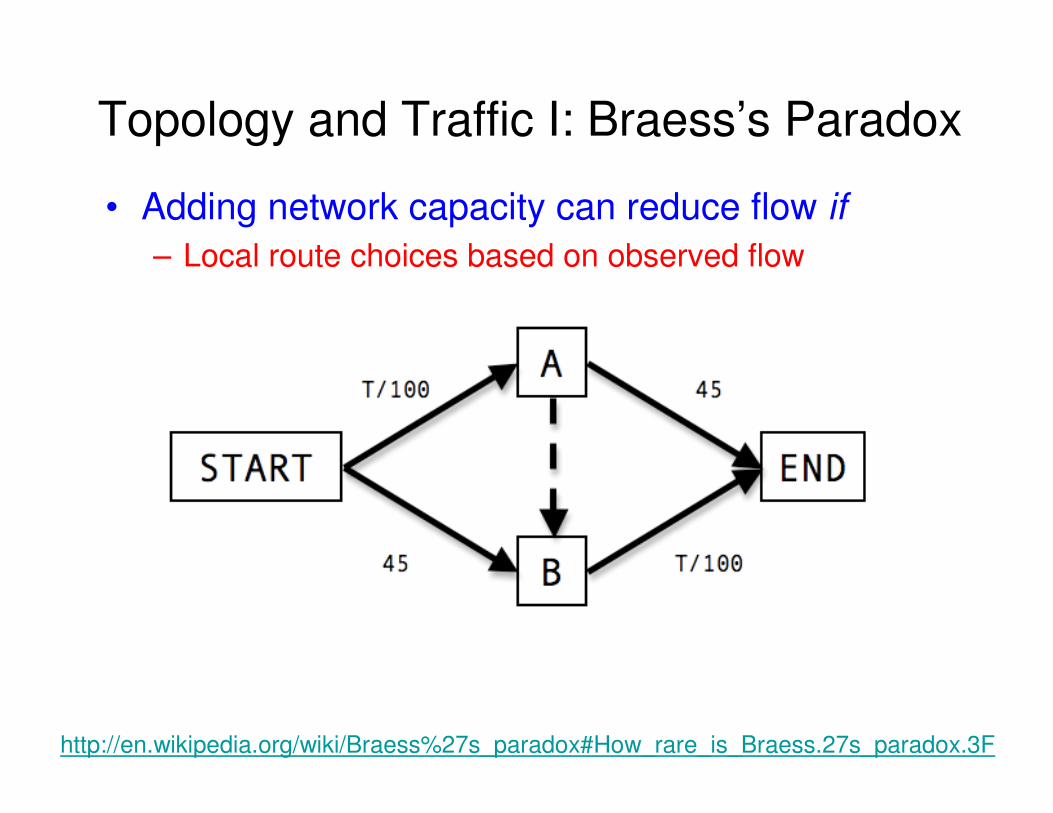
Topology and Traffic I: Braess’s Paradox
• Adding network capacity can reduce flow if
– Local route choices based on observed flow
http://en.wikipedia.org/wiki/Braess%27s_paradox#How_rare_is_Braess.27s_paradox.3F
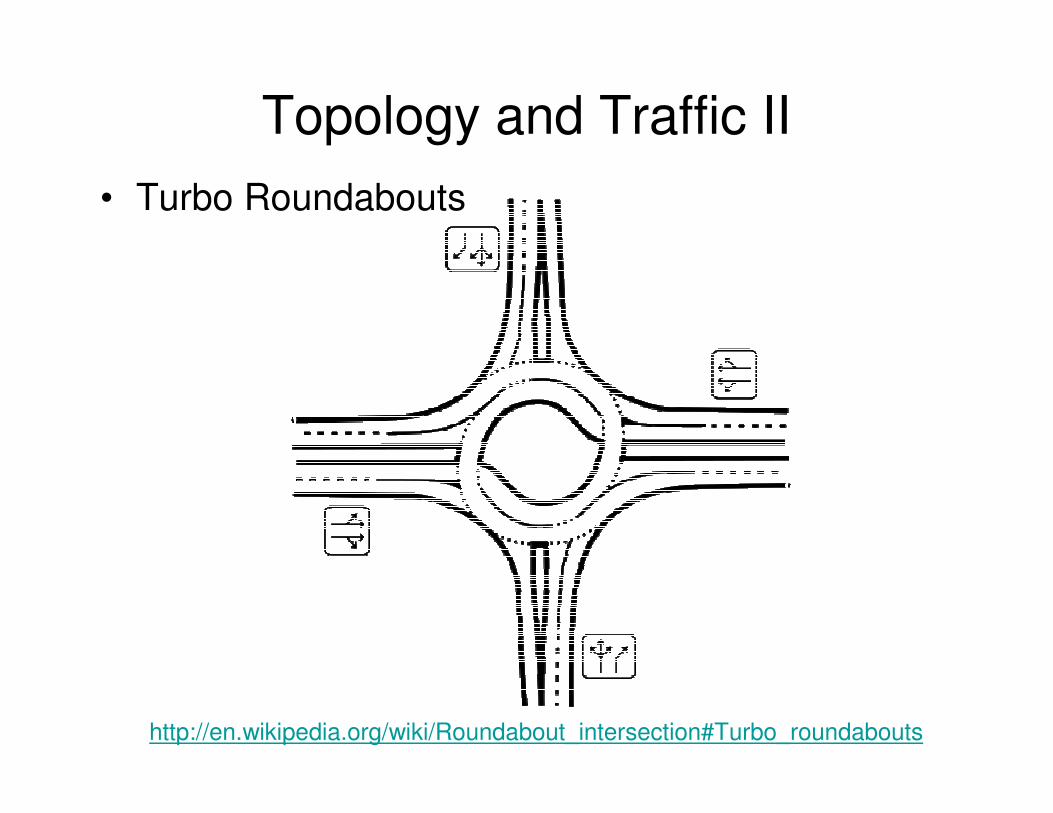
Topology and Traffic II
• Turbo Roundabouts
http://en.wikipedia.org/wiki/Roundabout_intersection#Turbo_roundabouts
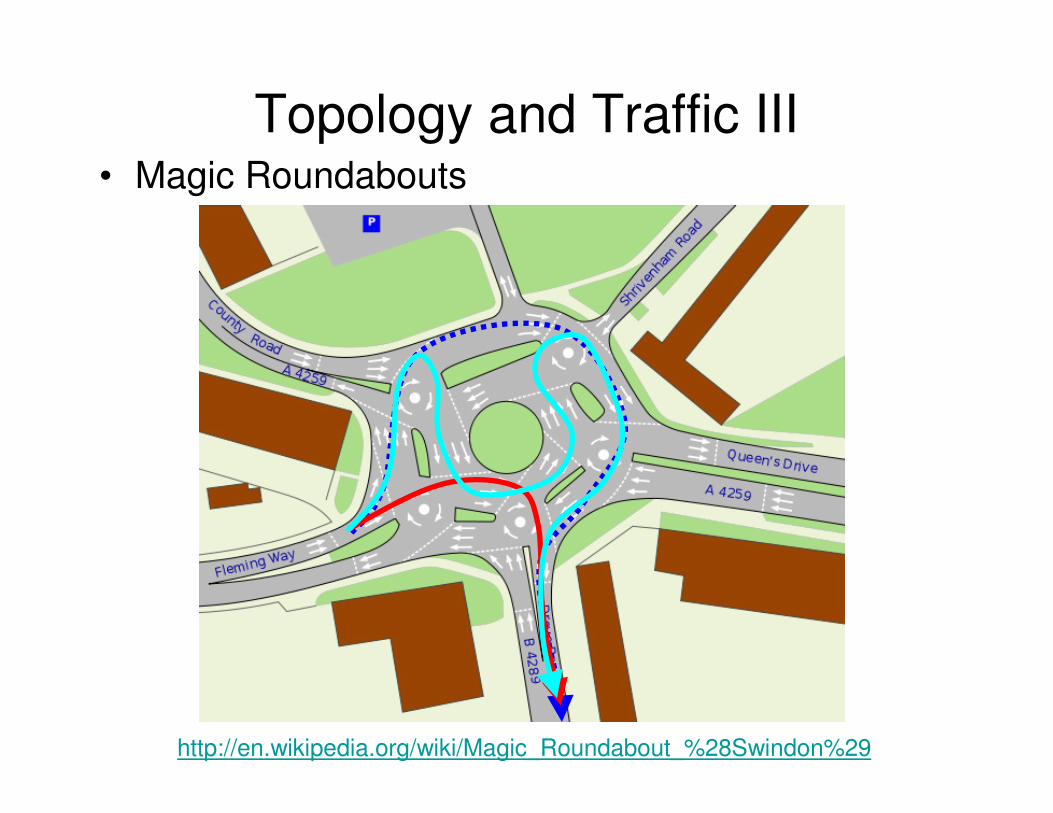
Topology and Traffic III• Magic Roundabouts
http://en.wikipedia.org/wiki/Magic_Roundabout_%28Swindon%29

ICAPS 2010 Tutorial
Scott Sanner
Traffic Control: Conclusions
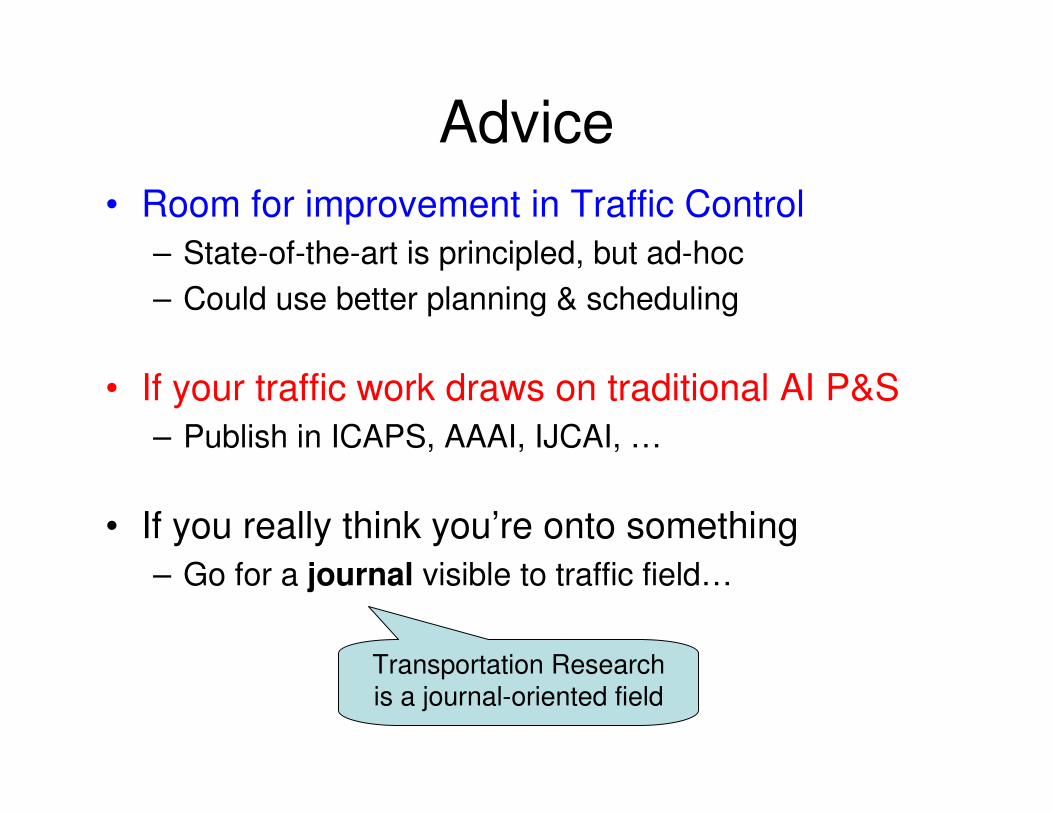
Advice
• Room for improvement in Traffic Control
– State-of-the-art is principled, but ad-hoc
– Could use better planning & scheduling
• If your traffic work draws on traditional AI P&S
– Publish in ICAPS, AAAI, IJCAI, …
• If you really think you’re onto something
– Go for a journal visible to traffic field…
Transportation Research is a journal-oriented field

Publish in a Journal (bold top-rated)
• Transportation Research (TR)– TR Part A: Policy and Practice
– TR Part B: Methodological
– TR Part C: Emerging Technologies
– TR Part D: Transport and Environment
– TR Part E: Logistics and Transportation Review
– TR Part F: Traffic Psychology and Behaviour
• Transportation Science
• Journal of Transport Economics and Policy
• Environment and Planning
• Transportation
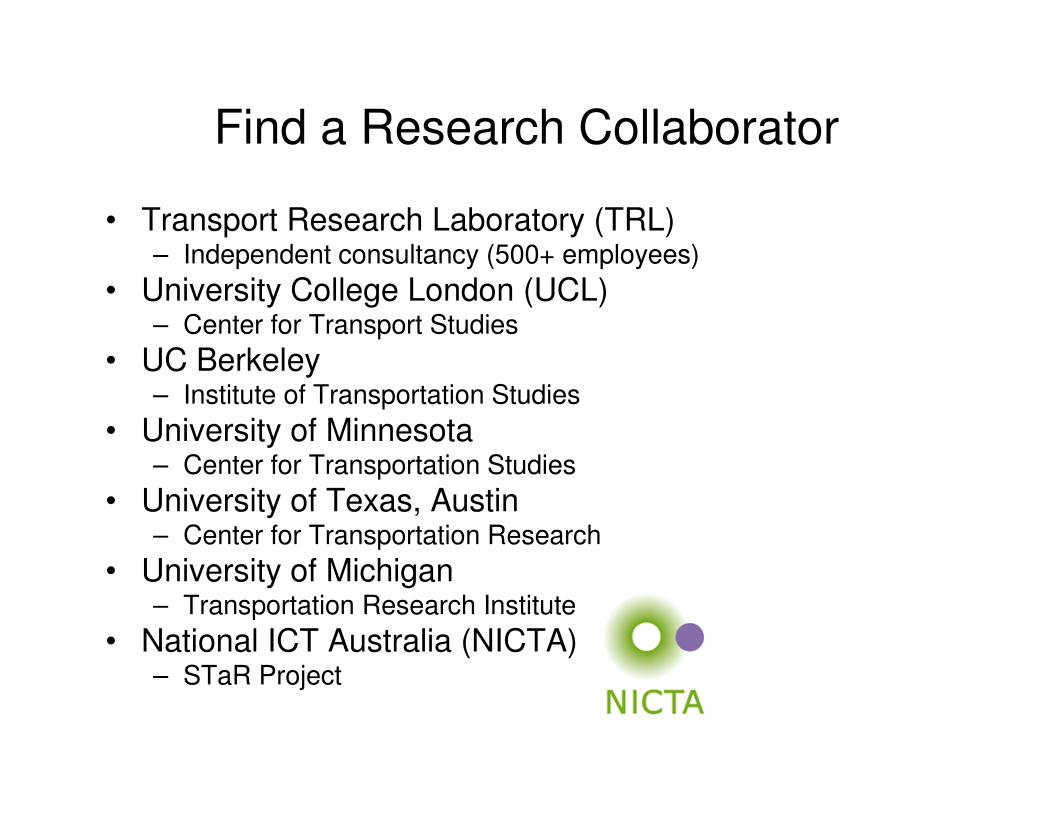
Find a Research Collaborator
• Transport Research Laboratory (TRL)– Independent consultancy (500+ employees)
• University College London (UCL)– Center for Transport Studies
• UC Berkeley– Institute of Transportation Studies
• University of Minnesota– Center for Transportation Studies
• University of Texas, Austin– Center for Transportation Research
• University of Michigan– Transportation Research Institute
• National ICT Australia (NICTA)– STaR Project

Thank you!
Questions?