planning and operational applications of transims and... · gulf coast center for evacuation and...
TRANSCRIPT

Gulf Coast Center for Evacuation and Transportation Resiliency
Planning and Operational
Applications of TRANSIMS
Brian Wolshon, Ph.D., P.E. Louisiana State University
2011 DOTD Congestion Management Seminar September 13, 2011
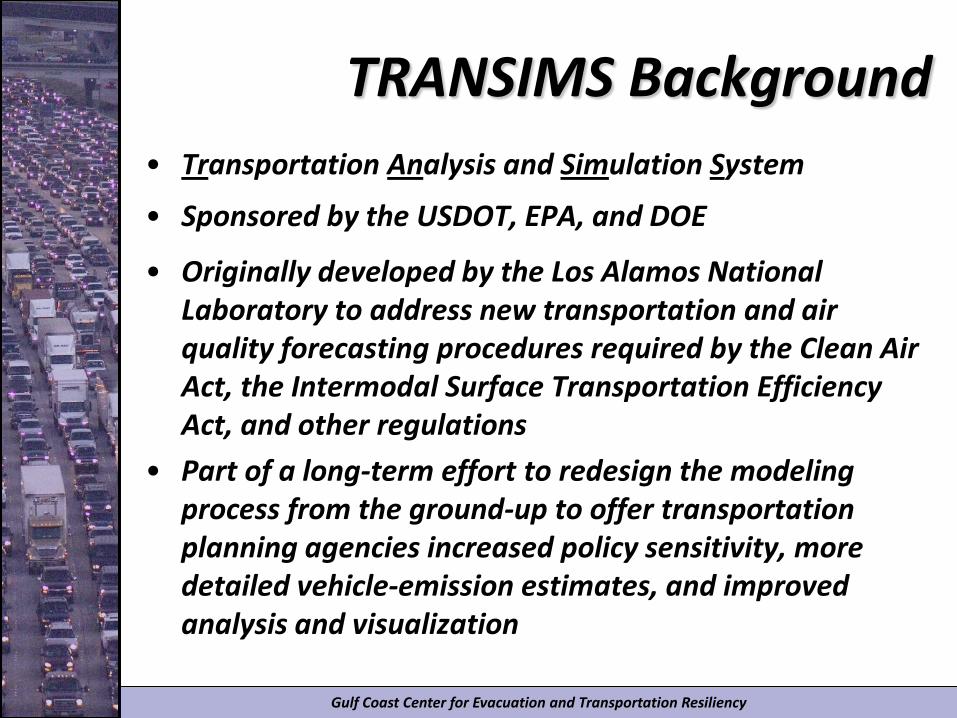
TRANSIMS Background • Transportation Analysis and Simulation System
• Sponsored by the USDOT, EPA, and DOE
• Originally developed by the Los Alamos National Laboratory to address new transportation and air quality forecasting procedures required by the Clean Air Act, the Intermodal Surface Transportation Efficiency Act, and other regulations
• Part of a long-term effort to redesign the modeling process from the ground-up to offer transportation planning agencies increased policy sensitivity, more detailed vehicle-emission estimates, and improved analysis and visualization
Gulf Coast Center for Evacuation and Transportation Resiliency

The Pro’s • It’s Free
http://www.transims-opensource.net/
• It’s use is growing
http://tmip.fhwa.dot.gov/community/user_groups/transims
• It is better documented http://tmip.fhwa.dot.gov/resources/clearinghouse/doc
s/transims_fundamentals/ • Training is free and available http://tmip.fhwa.dot.gov/about/projects/49 • Interfaces with available and popular formats • It is being updated and simplified
Gulf Coast Center for Evacuation and Transportation Resiliency

The Con’s • Not nearly as widely used, known, or accepted, as
other systems
• Does this effect its validity?
• Documentation still lags
• “Quirky” (ex. units in meters)
• User interface makes coding cumbersome and laborious
• Output format is primitive • Output visualization capability is limited • Can require significant computational resources and
memory storage
Gulf Coast Center for Evacuation and Transportation Resiliency

My Perspective • Like all software, there is a learning curve
• TRANSIMS has suffered from years of bad PR (a lot of it justified)
• Users tend to be “territorial” – don’t listen to opinions from people who have never used it
• What it does, it does very well
• It is a one-stop-shop
• It has applications beyond traffic and transportation planning
• USDOT wants it out there
Gulf Coast Center for Evacuation and Transportation Resiliency

What is TRANSIMS? • Uses census data and land use data • Tracks individuals, households, and vehicles, not zonal
aggregation of households and employment as do existing models
• Attempts to synthesize complete activity-travel pattern for synthetic populations in order to create a virtual study region with a complete representation of the real world. TRANSIMS builds a model of households and activity demand
• Tries to capture every important interaction between travel subsystems, such as an individual's activity plans and congestion on the transportation system
Gulf Coast Center for Evacuation and Transportation Resiliency

Evacuation Modeling Spectrum
From: “Structuring Modeling and Simulation Analyses for Evacuation Planning and Operations”
By: Hardy, Wunderlich, Bunchand, and Smith
Reg
ionC
orridor
MACRO MESO MICRO
ETIS
VISSIM
CORSIMTRANSIMS
HEADSUP
PCDYNEV
OREMS
CUBE Avenue
DYNASMART-P
TransCAD
EMME/2 Integration 2.0 DYNAMIT
Paramics

TRANSIMS Structure • Network Input
– Structure and characteristics of the transportation network (control, capacity, etc.) and activity locations
• Population Synthesizer – Creates a disaggregate synthetic population based on aggregate
census zonal information • Activity Generator
– Travel surveys or observation of past evacuations • Router
– Spatial and temporal travel behavior and route assignments • Microsimulator
– Tracks and compiles movements and statistics of each agent (vehciles & peds)
• Visualizer – 3rd party developer Argonne National Labs , Balfour Technologies
Inc., etc.
Gulf Coast Center for Evacuation and Transportation Resiliency

TRANSIMS System
• Allows planning- / operational-level analyses • Model large geographical regions and large
numbers of travelers • Model populations, travel activities, routing,
and/or microsimulate separately • Second-by-second movements • Track individual agents • Model multimodal systems • Assess performance continuously and/or in
separate time periods • Verification, validation, and calibration issues
Gulf Coast Center for Evacuation and Transportation Resiliency

Louisiana TRANSIMS
Demonstration Project
Gulf Coast Center for Evacuation and Transportation Resiliency
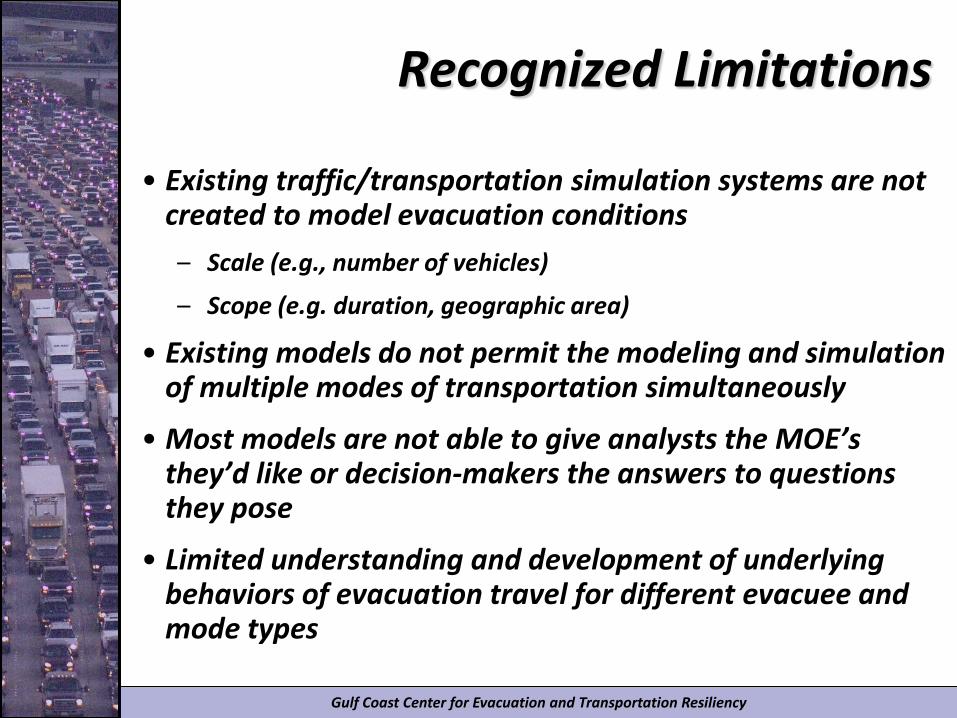
Recognized Limitations
• Existing traffic/transportation simulation systems are not created to model evacuation conditions – Scale (e.g., number of vehicles)
– Scope (e.g. duration, geographic area)
• Existing models do not permit the modeling and simulation of multiple modes of transportation simultaneously
• Most models are not able to give analysts the MOE’s they’d like or decision-makers the answers to questions they pose
• Limited understanding and development of underlying behaviors of evacuation travel for different evacuee and mode types
Gulf Coast Center for Evacuation and Transportation Resiliency

Assisted Evacuations
•Evacuation planning has historically been targeted at persons with personal vehicles
•A substantial percentage of potential vulnerable populations do not have personal vehicles
•Plans to evacuate “carless” populations in many locations have been created relatively recently or are currently in development
•There have been few actual activations to gain knowledge and experience, nor tests, drills or simulations to evaluate potential weakness and needs
Gulf Coast Center for Evacuation and Transportation Resiliency

Longitudinal Approach
• Step 1 – Network development
• Step 2 - “Base Model” validation and calibration based on 2005 Katrina evacuation
• Step 3 - Code “New” New Orleans multimodal plan
• Step 4 - Code and test alternative plans and ideas in New Orleans and develop Houston models
• Step 5 – Develop and assess Mega-Region evacuation concepts
Gulf Coast Center for Evacuation and Transportation Resiliency
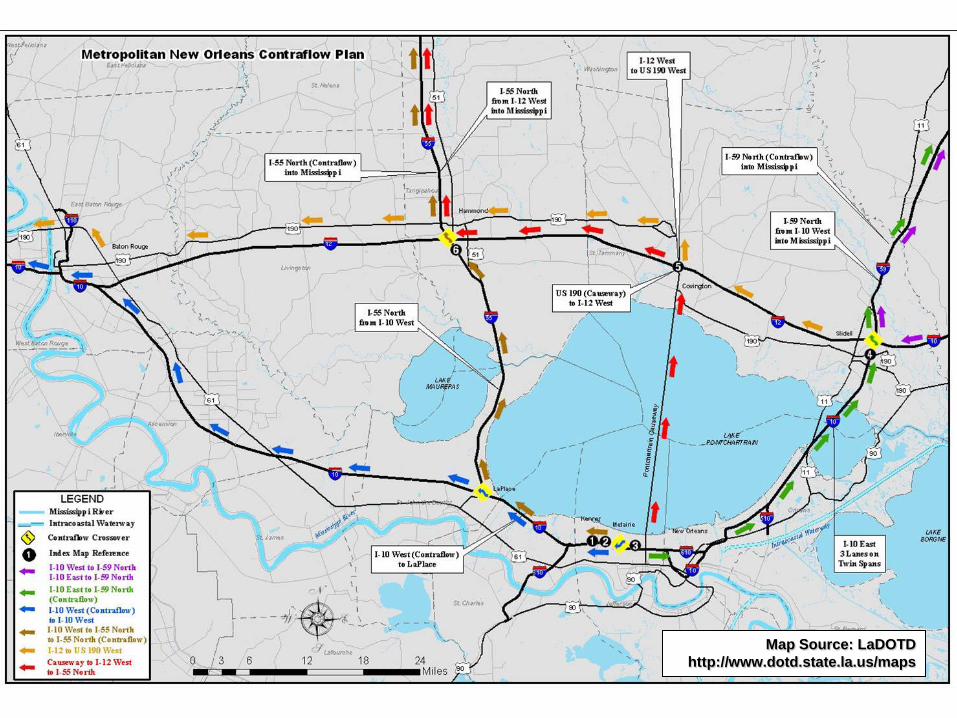
Map Source: LaDOTD http://www.dotd.state.la.us/maps

Gulf Coast Center for Evacuation and Transportation Resiliency

Study Questions
• Proof-of-Concept - Can TRANSIMS be used for evacuation analysis? Are its results reasonable?
• Develop a variety and range of hazard-response scenarios
• How many buses might be needed under various scenarios? What routes should they take?
• Potential to estimate the number of location of evacuees
• Examine the potential of alternate plans
Gulf Coast Center for Evacuation and Transportation Resiliency

Map Source: LaDOTD http://www.dotd.state.la.us/maps
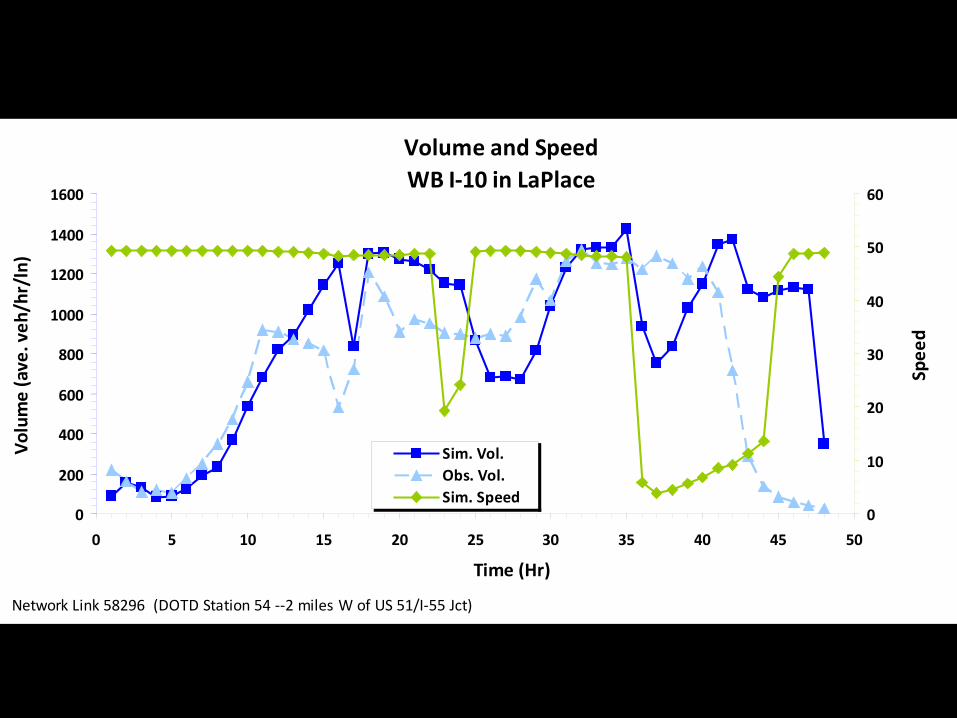
Volume and SpeedWB I-10 in LaPlace
0
200
400
600
800
1000
1200
1400
1600
0 5 10 15 20 25 30 35 40 45 50
Time (Hr)
Volu
me
(ave
. veh
/hr/
ln)
0
10
20
30
40
50
60
Sim. Vol.Obs. Vol.Sim. Speed
Network Link 58296 (DOTD Station 54 --2 miles W of US 51/I-55 Jct)
Spee
d

Map Source: LaDOTD http://www.dotd.state.la.us/maps

325
2925
5525
8125
1072
513
325
1592
518
525
2112
523
725
2632
528
925
3152
534
125
3672
539
325
4192
544
525
4712
549
725
5232
554
925
5752
560
125
6272
565
325
6792
570
525
7312
575
725
7832
5
0
6
12
18
24
30
36
42
Westbound I-10 Traffic Speed

Map Source: LaDOTD http://www.dotd.state.la.us/maps
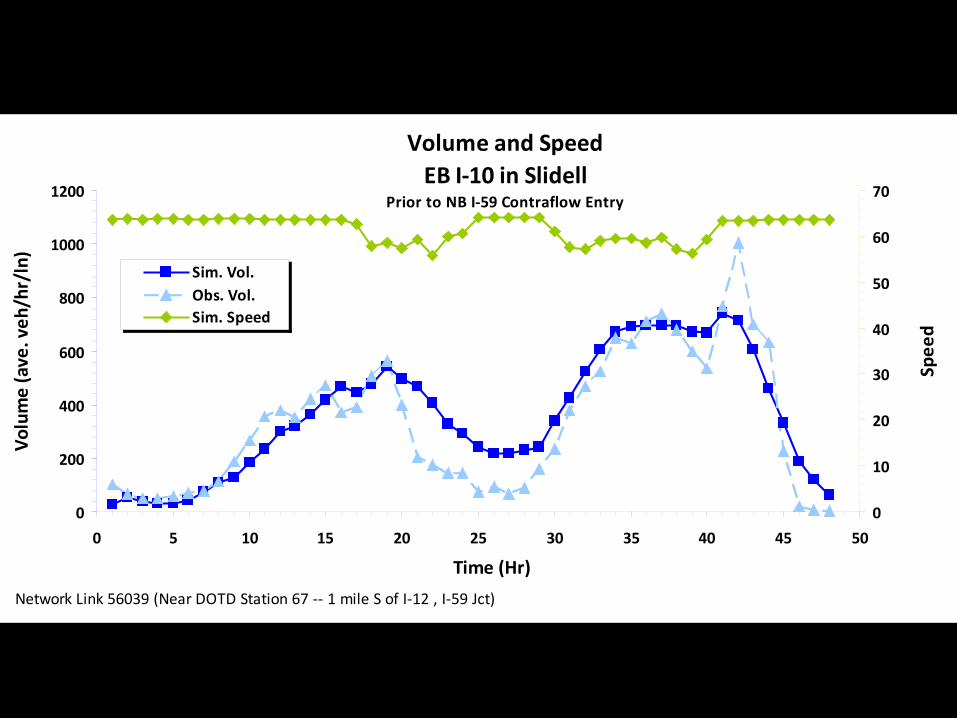
Volume and SpeedEB I-10 in Slidell
Prior to NB I-59 Contraflow Entry
0
200
400
600
800
1000
1200
0 5 10 15 20 25 30 35 40 45 50
Time (Hr)
Volu
me
(ave
. veh
/hr/
ln)
0
10
20
30
40
50
60
70
Sim. Vol.Obs. Vol.Sim. Speed
Spee
d
Network Link 56039 (Near DOTD Station 67 -- 1 mile S of I-12 , I-59 Jct)

Map Source: LaDOTD http://www.dotd.state.la.us/maps

Volume and SpeedWB US 190 in Baton Rouge
0
100
200
300
400
500
600
700
800
0 5 10 15 20 25 30 35 40 45 50
Time (Hr)
Volu
me
(ave
. veh
/hr/
ln)
0
10
20
30
40
50
60
70
Sim. Vol.Obs. Vol.Sim. Speed
Network Link 57784 (DOTD Station 18 -- 1.1 miles E of O'Neal Ln Jct)
Spee
d

US 190 WESTBOUNDDenham Springs@Amite River Bridge
0
500
1000
1500
2000
2500
3000
0 12 24 12 24 12 24 12 24 12 24
Flow
Rat
e (v
ph)
Ave. of Prior 3 WeeksKatrina Evacuation
Thursday Friday Saturday Sunday Monday

Jefferson Parish Bus Routes


Demo Video

Conclusions and Contributions
• Evidence that TRANSIMS can be an effective tool for regional multi-modal evacuation modeling and planning
• Constituent models can be useful in whole or when used separately (e.g., Wilmot predictive evacuation demand model)
• Development of new mathematical methods to calibrate models and analyze output data
• Current work focuses on analyses of alternative strategies that could be incorporated in future plans
Gulf Coast Center for Evacuation and Transportation Resiliency

Acknowledgements
• Current work is funded by the United Stated Department of Homeland Security through the DHS Centers of Excellence Program
• Financial support for earlier project development provided by the United States Department of Transportation through the Federal Highway Administration’s Transportation Model Improvement Program
• Additional technical support provided by the New Orleans Regional Planning Commission, Louisiana Department of Transportation and Development, Louisiana State University, and the LSU-UNO UTC
Gulf Coast Center for Evacuation and Transportation Resiliency
