planit testing index full report will take you on a journey through what kinds of projects have been...
TRANSCRIPT
2016Planit Testing IndexReporting on a decade of industry data.
AU: 1300 992 967 | NZ: 0800 752 648 | UK: +44 203 457 5020 | IN: +91 40 4646 [email protected] | www.planittesting.com
PLANITaccelerating your delivery of quality
PLANIT TESTING IN
DEX
CELEBRATING

2
Planit Testing Index 2016
Contents
01 Introduction 4
02 Executive Summary 6
03 What kinds of projects were popular? 8
04 Where are organisations investing? 9 Project budgets 9
Project budget allocation 10
Allocation across testing phases 11
Investing in tools and processes 12
Investing in the testing team 12
Outsourcing of testing effort 13
05 Why invest in testing? 14 View of testing 14
Benefits of increasing testing investment 15
Business cases for testing 16
Risks being mitigated 16
06 How did projects perform? 18 Project outcomes 18
Causes of failure 15
Strategies under pressure 16

3
Planit Testing Index 2016
07 What conditions characterised projects? 21 Methodologies 21
When testing starts 22
Project conditions 23
08 Who is focusing on CX through performance? 26 Performance testing utilisation 26
09 Where, why and how to automate? 27 Test automation utilisation 27
Automated test coverage 28
Where automation is conducted 28
How automation is conducted 29
10 What tools are being utilised? 30 Test management tool utilisation 30
Test automation tool utilisation 31
Performance testing tool utilisation 31
Cloud utilisation 32
Service virtualisation utilisation 33
11 What trends will impact projects over the coming years? 34

4
Planit Testing Index 2016
Marking the tenth annual release of the Planit
Testing Index, our 2016 report proudly builds upon
a full decade of industry-leading software
testing analysis, allowing software practitioners and
professionals to share knowledge and gain insights
into the application of testing across different
facets of the software industry.
Celebrating ten years of first-hand research, the
Planit Testing Index continues to offer a
comprehensive, unparalleled report of software
testing across project methodologies, budgets,
business cases, activities, types, benefits,
conditions, outcomes, strategies, trends and tools
in Australia and New Zealand.
Our 2016 report analyses data gathered from 254 participants across a wide range of industries/
sectors including financial services (24%, down
2 percentage points), government (15%, down 3
points), software development (11%, up 1 point)
and telecoms & ICT (11%, down 1 point).
The majority of respondents held a leadership role in their organisation/projects (54%),
including 15% IT executives, 4% project
managers, 31% test managers and 4% Agile
leads. The balance comprised of specialists and
practitioners in testing, business analysis, software
development and Agile.
A quarter (25%) of respondents were
representing small organisations of less than 100
staff, with 36% mid-market representatives in the
100 – 2,000 space, and the remaining 39%
belonging to large organisations with headcounts
surpassing 2,000 employees.
These respondents represent 12,199 total projects; 9,828 from Australia and 2,371 from
New Zealand.
1. Introduction
Financia l Servic es
Governme nt
Software Developm ent
Telecoms& ICT
Resource s & Utilitie s
Retail & Hosp itality
Professional Servic es
Education
Health & Pharmaceut icals
Transpor t & Logis tics
Other
15%
11%11%
7%
23%
5%
5%
5%
3%
5%
10%
INDUSTRIES
1 –910 – 24
25 – 49
50 – 99
100 – 499
500 – 1999
2000 +
3%
10%
9%
18%
3%
39%
18%
ORG SIZE
5
Planit Testing Index 2016
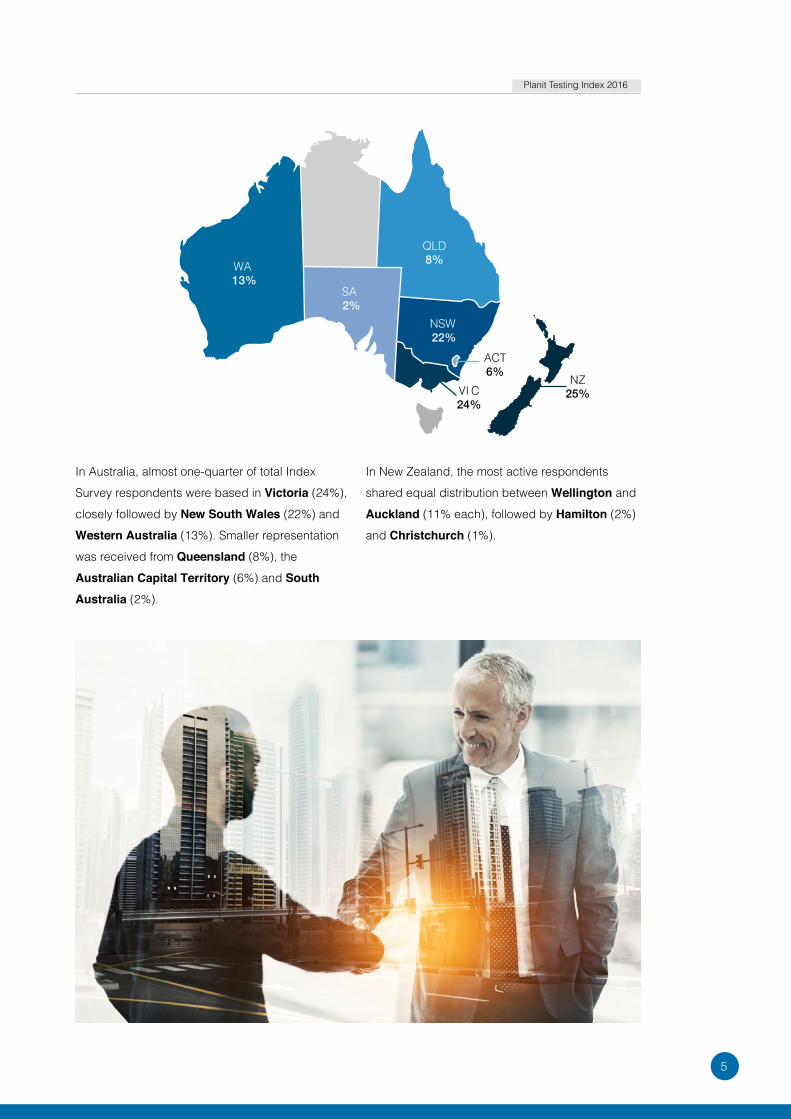
In Australia, almost one-quarter of total Index
Survey respondents were based in Victoria (24%),
closely followed by New South Wales (22%) and
Western Australia (13%). Smaller representation
was received from Queensland (8%), the
Australian Capital Territory (6%) and South Australia (2%).
In New Zealand, the most active respondents
shared equal distribution between Wellington and
Auckland (11% each), followed by Hamilton (2%)
and Christchurch (1%).
QLD8%WA
13%
NSW22%
SA 2%
NZ25%VI C
24%
ACT6%

6
Planit Testing Index 2016

7
Planit Testing Index 2016
2. Executive Summary
The age of digital transformation is upon us as
digital systems have become the new battleground
for competitive advantage. In the quest to appease
customers, user experience is paramount with
poor performance and defects being considered
unacceptable for many organisations.
In this digital landscape, some key themes and
trends have presented themselves.
1. Continuous everythingIn an effort to accelerate delivery, reach first to
market and unlock value quickly, organisations
have adopted processes around integrating
quality in every step, to avoid rework and allow
iterative releases without compromising customer
experience through brand-damaging defects.
• Whether following a pure Agile methodology
or a hybrid, Agile is now being applied in the
majority of projects, with Government now
amongst those adopters.
• The impact of DevOps is really yet to be
felt, but will surely become a factor over the
coming years as more and more organisations
embrace DevOps principles.
2. Technical and cross-functional skillsetsDemand for testers to be cross-functional and
technical has exploded, with automation skills in
high demand. This trend is only set to escalate,
as organisations increase their automated test
coverage with growing emphasis on scripts being
executed automatically in response to developers
checking-in code, ensuring that defects are caught
immediately.
3. Efficiency through tools and solutionsThe need for speed and efficiency is also driving
adoption of cloud-based infrastructure and
services. This includes cloud-based development
and test environments, now being used by more
than half of the industry, up 20 percentage points
from 2015.
The full report will take you on a journey through
what kinds of projects have been popular in 2016,
where organisations are investing, why they are
investing in testing, how projects performed,
what conditions characterised projects and how
performance, automation and tools are being
utilised. It looks at the trends expected to impact
projects over the coming years and compares the
state of the industry against the past ten years of
data.
8
Planit Testing Index 2016
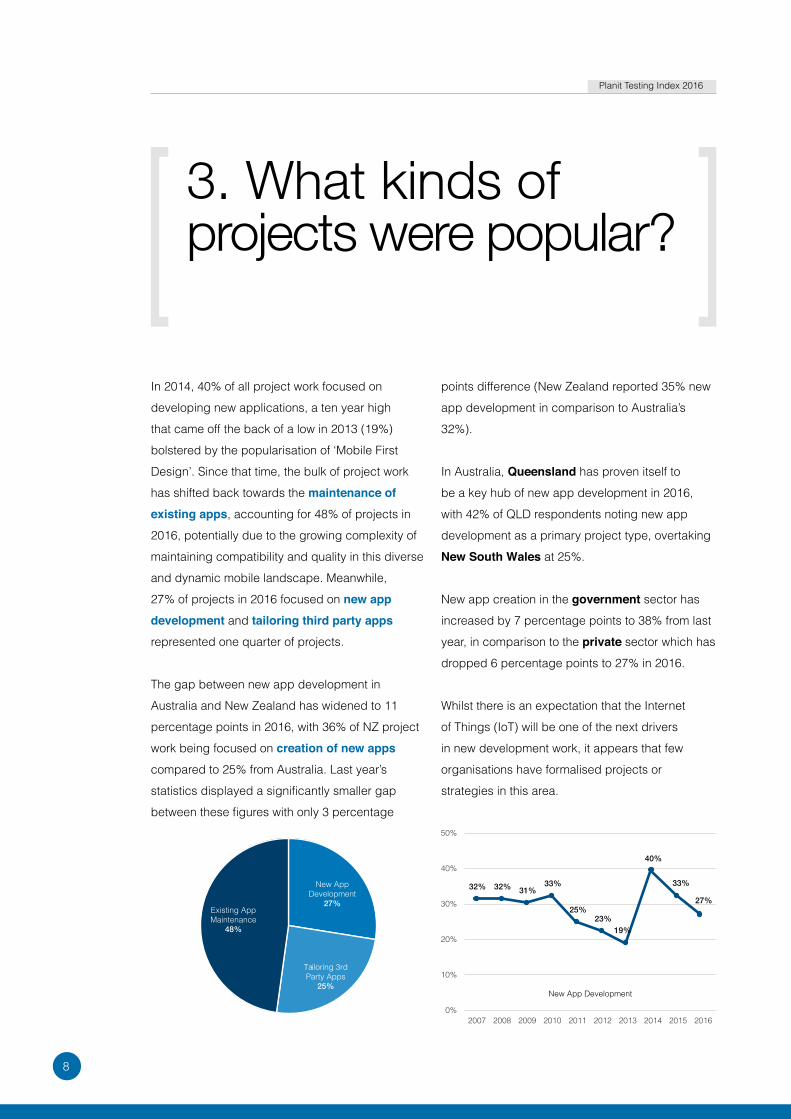
In 2014, 40% of all project work focused on
developing new applications, a ten year high
that came off the back of a low in 2013 (19%)
bolstered by the popularisation of ‘Mobile First
Design’. Since that time, the bulk of project work
has shifted back towards the maintenance of existing apps, accounting for 48% of projects in
2016, potentially due to the growing complexity of
maintaining compatibility and quality in this diverse
and dynamic mobile landscape. Meanwhile,
27% of projects in 2016 focused on new app development and tailoring third party apps
represented one quarter of projects.
The gap between new app development in
Australia and New Zealand has widened to 11
percentage points in 2016, with 36% of NZ project
work being focused on creation of new apps
compared to 25% from Australia. Last year’s
statistics displayed a significantly smaller gap
between these figures with only 3 percentage
points difference (New Zealand reported 35% new
app development in comparison to Australia’s
32%).
In Australia, Queensland has proven itself to
be a key hub of new app development in 2016,
with 42% of QLD respondents noting new app
development as a primary project type, overtaking
New South Wales at 25%.
New app creation in the government sector has
increased by 7 percentage points to 38% from last
year, in comparison to the private sector which has
dropped 6 percentage points to 27% in 2016.
Whilst there is an expectation that the Internet
of Things (IoT) will be one of the next drivers
in new development work, it appears that few
organisations have formalised projects or
strategies in this area.
3. What kinds of projects were popular?
New App Development
27%
Tailoring 3rd Party Apps
25%
Existing App Maintenance
48%

9
Planit Testing Index 2016
Project budgets2016 saw organisations commence more projects
with smaller budgets (below $250k), leading to
a 7 percentage point increase from 2015. This
category has fluctuated significantly over the past
decade, influenced by factors including inflation,
‘appisation’ and the movement to smaller iterative
releases.
Large project budgets have increased
significantly in the government sector, with $15m
plus projects increasing by 5 percentage points
to 8% in 2016. The opposite has occurred in the
private sector, with large project budgets dropping
4 percentage points to 3% from the previous year.
At the next budget tier down, projects valued at
$2m to $14.9m have increased by a relative 34%
from 2009 to the present across all sectors, whilst
a relative 8 percentage point decline in projects
less than $100k was experienced from 2009 to the
present.
4. Where are organisations investing?
28% 27% 28% 13% 4%
<$100k $100k–250k $250k–2m $2m–$15m >$15m

10
Planit Testing Index 2016
Project budget allocation
Software development continues to receive
the highest share of project budgets at 32%,
consistently reported as such from 2007 – 2016,
with only a 1 percentage point drop experienced
over the last decade.
Investment in requirements is up 1 percentage
point, receiving 17% of project budgets, with a
slightly higher investment being made by telecoms & ICT at 19% of project budgets, 2 points above
the average.
Budget allocation to testing has also been
steady at 20% of project funds, retaining relative
consistency with Index responses over the last
decade, only registering modest movement
between a low of 18% in 2008 and a high of 22%
in 2012.
Budget allocation towards testing in the
government sector has decreased by 2
percentage points from 20% in 2015 to 18% in
2016, whilst the software industry registered a 3
point increase to 22% in 2016, the highest among
the sectors analysed.
17%
8%
32%
20%
Development
Testing
9%
Implementation
Release/ Iteration Planning
14%Design

11
Planit Testing Index 2016
Allocation across testing phases
Retaining consistency with Index responses
provided over the last decade, test execution
remains the most utilised form of testing allocation
at 42% in 2016, following a high of 49% in 2008
and a low of 40% from 2011-2012.
Allocation of testing towards test execution
this year was most prominent in the software development sector (50%), followed by the
private (43%), financial (42%) and government (38%) sectors. This figure was also reported at
42% in 2015 and has experienced a 2 percentage
point increase from 2011 – 2016.
The second highest allocation of testing in 2016
was towards test preparation at 23%, reported
by 31% of government sector respondents at 9
percentage points more than the private sector at
22%.
Allocation of testing towards test preparation has
been consistently reported at 23% from 2011 -
2016, dropping down slightly from a high of 26%
reported in 2008 and 2010.
2016 saw a relatively even distribution of testing
allocation between requirements review (12%),
test strategy & planning (12%) and test
environment & architecture (11%), with testing
allocation towards requirements review slightly
higher in the private sector (12%) in comparison to
the government sector (9%) in 2016.
Each of these three categories have remained
statistically consistent over the last decade,
experiencing a 1 percentage point increase for
testing allocation towards requirements review and
a 2 percentage point decrease for test strategy
& planning and test environment & architecture
between 2011 – 2016.
Testing allocation towards requirements review was noted at 14% in New Zealand this year, 3
percentage points higher than Australia’s 11%.
12%
11%
23%
42%
Testing Strategy & Planning
Test Environment & Architecture
Test Preparation
Test Execution
12%
Requirements Review

12
Planit Testing Index 2016
Investing in tools and processes
Over the past decade, investment in testing tools
has never dipped, registering a net increase of at
least 33% year-on-year each and every year. This
can be attributed to increasing reliance on software
and adoption of new technologies to ensure quality.
In 2016, this net increase in tools investment was
an impressive 49%, with only 4% of respondents
expecting to decrease their investment in testing
tools. Across New Zealand organisations,
there was a net increase of 73% compared with
Australian organisations who registered 41%. The
least amount of net growth in spending on tools
was reported by government at 18%.
Similarly, the upswing of new methodologies and
practices designed to accelerate delivery, such
as Agile and DevOps, has meant that investment in structured testing processes has also seen a
substantial net increase, with 44% expecting this
investment to increase (up 5 points) compared with
just 5% who expect their investment in this area to
decrease (down 1 point).
Investing in the testing teamThere is a concerted effort among organisations
to keep their test teams relevant with the right
skillsets. This is reflected through the increasing
investment in both training for existing staff as well
as employing testing staff with certified skillsets.
36% more organisations saw their investment in training increasing rather than decreasing. The
software industry was the most eager to keep their
teams upskilled, with 64% foreseeing an increase
in investment in training, with the balance (36%)
expecting no change in training investment. No
respondents in this sector saw their investment in
training decreasing.
26% of organisations were looking to increase
investment in sourcing skills for their projects by
employing certified testing staff. The telecoms & ICT sector was the most focused on bringing these
skills in, with 33% expecting an increase in spend
on employing certified testers compared to 7%
expecting spending to decrease in this area.

13
Planit Testing Index 2016
Outsourcing of testing effortSkills shortages and the rate of technical change
has maintained decade-high levels of outsourcing,
with 37% of all testing being outsourced. In fact,
only a third of organisations performing all of their
QA activities use in-house resources.
Local outsourcingLocal outsourcing of testing activity was the
most popular form of outsourcing, utilised by 61%
of 2016 respondents and accounting for 24% of
testing effort. Past Index statistics show a minor 1
percentage point decline in local outsourcing from
2007 – 2016.
Outsourcing locally was most prominently
experienced in the telecoms & ICT sector (41%),
followed by above average utilisation in the
financial (27%) and government (26%) sectors.
Average utilisation was discovered in the private
sector (24%), whilst lowest use of local outsourcing
was reported in the software development sector
(19%), 5 percentage points lower than the 2016
average of 24%.
Consistent with years gone by, organisations are
looking to shift their investment in local outsourcing
from more traditional models (expected net decline
of 4%) to on-site contract testing professionals (expected net increase of 19%), although this
ambition has rarely been realised.
Offshored outsourcingIn comparison to local outsourcing, offshoring
was discovered to be used by 50% of 2016 Index
respondents, but only accounted for 13% of testing
activity. This figure is level with 2015 but up over
double the level of uptake reported in 2007 (6%).
Offshored projects are most prominently utilised
by the telecoms & ICT (19%), financial (18%)
and private (14%) sectors in 2016. Much lower
utilisation of offshoring was recorded in the
government sector (4%) in 2016 at 8 points
below the industry average, however this figure
marks a significant increase in comparison to zero
offshored government projects reported in 2015.
Higher utilisation of offshoring was reported in
Australia (15%) in comparison to New Zealand (6%) in 2016, marking a 9 percentage point
difference between the two countries. This marks
a significant increase for both Australia and New
Zealand this year however, with only 1% off-shored
projects for both countries reported in 2015.
The telecoms & ICT sector outsourced 60% of
their testing work, double that of the software and
government sectors (reporting 30% each).
Like local outsourcing, more organisations are
hoping to decrease their offshore investment (22%)
than those looking to looking to increase their
investment in this area (18%).

14
Planit Testing Index 2016
View of testing
Positive view of testingIn 2016, 78% of organisations hold a positive view
of testing. This includes almost one-quarter (24%)
who agree that testing is strategically important to ensure organisational success. This response
has experienced an 11 percentage point increase
from 2007 – 2016, beginning with a low of 13% in
2007 and achieving a high of 26% in 2012.
Significantly above average respondents share this
view in the software development sector (39%),
whilst slightly above average sentiment towards
testing as strategically important for organisational
success was found in the ICT (27%) and financial (25%) sectors.
Additionally, over half of 2016 respondents (53%)
believe that testing is a critical element in producing reliable software, with this sentiment
increasing by 4 percentage points from 2007 –
2016, reaching a low of 44% in 2011 and a high of
57% in 2008.
Negative view of testingOn the negative end of the spectrum, testing was
considered a necessary evil in 14% of respondent’s
organisations. This was slightly up from 11%
reported in 2015, but overall experiencing a
significant 12 percentage point decrease from 2007
– 2016. This sentiment was significantly higher in
the government sector (21%) in comparison to the
private sector (13%) by 8 percentage points.
Responses towards testing as a cost to be minimised is down 4 percentage points to 6% in
2016 from 10% the previous year. Overall, the view
that testing is a cost to be minimised has remained
consistently low (less than 1 percentage point
variance) over the last decade.
Only 3% of 2016 respondents believe testing is a low priority, and this sentiment has reduced by a relative 2
percentage points over the last ten years, experiencing
a high of 7% in 2010 and a low of 2% in 2009, 2012,
2013 and 2015. No responses were provided for this
option in the software and ICT sectors, however more
government (5%) respondents share this sentiment
in comparison to the private (3%) sector, marking a 2
percentage point difference.
5. Why invest in testing?

15
Planit Testing Index 2016
Benefits of increasing testing investment
70% of respondents cited multiple noteworthy
benefits when increasing investment in testing,
while 28% provided one response and a further
2% saw no discernible benefit when boosting this
investment.
Most common among these benefits was
projects being more likely to deliver results in expectations, reported at 71% this year and
continually being the top reason for increasing
testing investment from 2011 – 2016. This figure
reached a peak of 78% in 2013 and a low of 71%
in 2014 and 2012.
Also retaining consistency as the 2nd most
reported benefit of increasing investment in testing
over the last decade is reduced maintenance cost after project implementation, 4 percentage
points less than the previous year and 6
percentage points down from 2011 – 2016. This
sentiment was reported significantly more by
Agile practitioners (59%) over users of traditional methodologies (29%), noting a 30-point difference.
71%
55%
55%
41%
29%
19%
2%
0% 20%4 0% 60%
Delivery in line with expectations
Reduced maintenance costs
Fewer anomolies and problems
Faster project delivery
Reduced likelihood of cost overruns
Better able to manage project costs

16
Planit Testing Index 2016
Business cases for testingWith these benefits in mind, what primary business
case was most commonly put forward to senior
management when justifying investment in testing?
.
The majority of 2016 respondents note delivery of reliable software, enhancing customer satisfaction as the primary business case for
testing at 70%. This marks a 2 percentage point
decrease in this response from the previous
year, however this business case for testing has
increased by 11 percentage points from 2007
– 2016. This was the most prominent primary
business case in the software development (82%)
and telecoms & ICT (74%) sectors.
Reducing software maintenance costs post implementation was the most popular secondary
business case for testing at 39%, matching
the same response rate provided in 2015. This
response was most prominent in the software
(57%) sector, followed by government (46%) and
the financial (43%) sectors.
Risks being mitigatedThe most common application of testing as a
primary risk mitigation strategy was compliance with legal / regulatory frameworks, answered
by 35% of 2016 respondents and increasing by
16 percentage points from 2007 - 2016. More than
half of these responses were received from the
government sector at 56%, in comparison to 31%
from the private sector.
40% of respondents who use testing as a risk
mitigation strategy for compliance with legal and
regulatory requirements also use traditional methodologies (such as Waterfall and V-Model), in
comparison to 29% of respondents in this category
who use Agile.
Testing to avoid damaging reputation is the
second most popular primary risk mitigation
strategy at 33% in 2016. This was primarily
noted by 43% of respondents from the software development sector, which is 10 percentage
points higher than the 2016 average.

17
Planit Testing Index 2016
The use of testing to avoid damaging reputation
has increased 9 percentage points from 2007 to
the present, significantly higher utilised by Agile
(37%) over traditional (20%) practitioners in 2016.
Losing money or costing opportunities is the
third most utilised application of testing as a
primary risk mitigation strategy in 2016 at 20%,
experiencing an 11-point increase from 2007 to
2016. This was noted by 22% of respondents in
the private sector in comparison to 10% in the
government sector, and 27% in the software development sector in comparison to 15% in
the telecoms & ICT sector (marking a 12-point
difference in both respective instances).

18
Planit Testing Index 2016
Project outcomes38% of projects are reported to be completed
optimally in 2016, delivered on time, budget and scope. This is one percentage point higher
than 2015 (37%), and this figure has fluctuated
significantly from 2007 to the present, hitting a low
of 33% in 2008 and peaking at 52% in 2013.
Victoria continues to out-perform the 2016
average by 10 percentage points, with a
significantly higher number of projects completed
on time, within budget and scope at 48%. This is
8 percentage points higher than NSW (40%) and a
significant 29 percentage points higher than QLD
(19%) and WA (19%).
Among the regions represented in this study, QLD
reported the highest number of projects completed
over time and over budget at 43%, 20% higher
than the 2016 average.
As with 2015, project postponements and
cancellations remain at a combined 15% in 2016,
continuing to remain at the highest level on record.
Project postponement has steadily increased by
1 to 2 percentage points year-on-year from 4% in
2009 to 10% in 2016. Project cancellation figures
have fluctuated over the last decade, hitting a low
of 0% in 2009 and peaking at 6% in 2015.
6. How did projects perform?
19
Planit Testing Index 2016
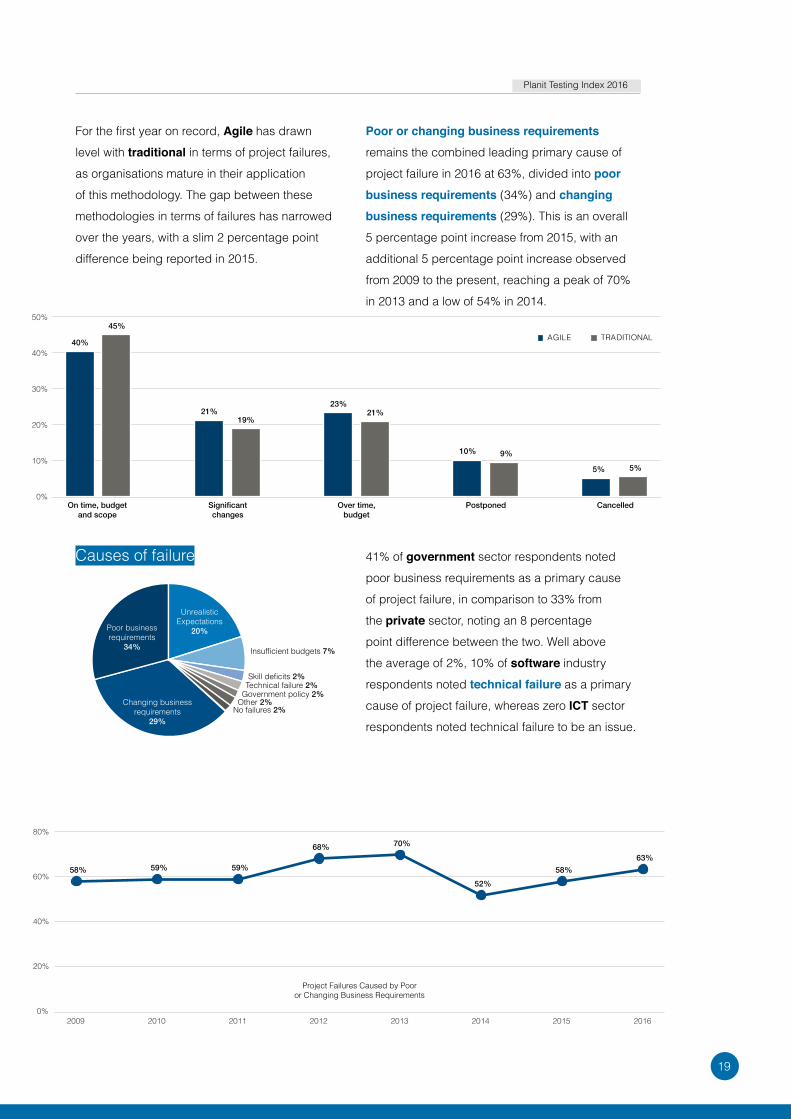
For the first year on record, Agile has drawn
level with traditional in terms of project failures,
as organisations mature in their application
of this methodology. The gap between these
methodologies in terms of failures has narrowed
over the years, with a slim 2 percentage point
difference being reported in 2015.
Causes of failure
Poor or changing business requirements
remains the combined leading primary cause of
project failure in 2016 at 63%, divided into poor business requirements (34%) and changing business requirements (29%). This is an overall
5 percentage point increase from 2015, with an
additional 5 percentage point increase observed
from 2009 to the present, reaching a peak of 70%
in 2013 and a low of 54% in 2014.
41% of government sector respondents noted
poor business requirements as a primary cause
of project failure, in comparison to 33% from
the private sector, noting an 8 percentage
point difference between the two. Well above
the average of 2%, 10% of software industry
respondents noted technical failure as a primary
cause of project failure, whereas zero ICT sector
respondents noted technical failure to be an issue.

20
Planit Testing Index 2016
Strategies under pressure
When a project comes under pressure, 71%
of organisations are unwilling to compromise
the quality or scope of the project. Most 2016
respondents reported extending the completion date as their primary strategy if a project is
to come under pressure at 49%, noting a 5
percentage point increase from 2015. This was
even more prevalent in the software industry at
60%, closely followed by the telecoms & ICT sector at 59%.
37% respondents from the financial services sector reported completion date extension as a
primary strategy under pressure, 12 percentage
points below the 2016 average. Instead, their most
common course of action was to significantly reduce the scope of deliverables (38%). This
was utilised as the primary strategy under pressure
among 25% of Australian organisations and 17%
of New Zealand organisations. This strategy is also
prominently utilised in the private sector at 24%,
an 11 percentage point difference in comparison to
13% in the government sector.
Reducing focus on quality is the least utilised
primary strategy under pressure by all respondents
at 6% in 2016, 3 percentage points lower than
9% in 2015. This figure was lower than the 2016
average in the private (5%), development (4%), financial (3%) and ICT sectors (0%),
however reducing quality as a primary strategy
was reported by 15% of government sector
respondents, 9 percentage points higher than the
2016 average. Reducing focus on quality as a
primary strategy under pressure has reduced by a
relative 75% since 2008.
49% 22% 23% 6%
Extend completion date
Increase resoucing
Reducescope
Reduce focus on quality

21
Planit Testing Index 2016
Methodologies
The vast majority of organisations (94%, up 6
points) are now utilising Agile in some portion of
their projects as a means to accelerate delivery.
Nonetheless, its prominence continues to grow
with Agile achieving a majority share of all projects
undertaken in 2016 at 55%, up 12 percentage
points since 2015 and doubling in adoption since
2011 (28%). 6,734 of respondent projects utilised
Agile in 2016, in comparison to 5,002 following
traditional methods of Waterfall and V-Model.
The prevalence of Agile is even higher in New Zealand at 66% in comparison to Australia at
53%, a 13 percentage point difference. When
examining sectors, Agile is most utilised by
software industry respondents at 73%, 18
percentage points higher than the 2016 average.
The sector with the lowest Agile adoption,
government, is also the area demonstrating the
most significant growth, up 18 percentage points
from 27% last year to 45% in 2016.
7. What conditions characterised projects?

22
Planit Testing Index 2016
For years, the benefits of Agile have been touted
by industry professionals, including improved
responsiveness to change, team collaboration
and overall project success, and its impact can
be seen in the adoption of traditional methods,
with the cumulative total of Waterfall and V-Model
projects down 8 percentage points since 2015 to
41%. This includes a massive 13 percentage point
drop in V-Model projects, down to just 4%.
The ICT sector makes the most use of Waterfall at 46%, 9 percentage points more than the 2016
average. This is followed by the government (41%), financial (38%) and private (7%) sectors.
V-Model is most common in the public sector, at 9%,
in comparison to 4% in the private sector. This is
significantly down from 14% use by government and
18% private sector respondents in 2015. V-Model is
used by 9% of telecoms & ICT sector respondents,
5 percentage points higher than the 2016 average.
It is lowest utilised in the software industry at 1%.
When testing starts62% of respondents would prefer testing to begin
at the requirements phase, in comparison to 17%
of 2016 respondents noting that this is when testing
begins. This marks a 4 percentage point increase in
actual testing beginning at the requirements stage (up
from 13% in 2015), and a 7 percentage point decrease
in the desire to start testing at the requirements
phase (down from 68% in 2015).
Testing beginning at the requirements phase this
year experienced a 12 percentage point increase
in New Zealand (24%) in comparison to Australia
(14%), marking a shift from the previous year’s
statistics where Australia (14%) began testing at
the requirements stage more prominently than New
Zealand (12%).
The financial (27%) and telecoms & ICT (26%)
sectors start testing at the requirements phase at a
higher rate than the 2016 average (17%), whereas
the software industry (11%) is lower than the 2016
average by 6 percentage points.
More than half (52%) of 2016 respondents report
that testing begins at the build/development stage,
in contrast to 12% noting a desire to begin testing
during this phase. Testing was reported to start at this
juncture by approximately half of respondents in
each sector, with significantly higher uptake in the software industry (68%) this year (16 percentage
points higher than the 2016 average of 52%).
Actual testing at the build / development level has
fluctuated slightly above or below 50% over the
last ten years, reaching a peak of 65% in 2012 and
a low of 56% in 2015. The desire to start testing at
this level has gradually declined by 13 percentage
points from 2011 – 2016, reaching a high of 24% in
2011 and a low of 12% this year.

23
Planit Testing Index 2016
Project conditionsOverall, the industry was feeling more positive
about their project conditions in 2016, with a 2
percentage point gain in positive opinions (38%)
at the expense of neutral opinions (14%), while
negative opinions of overall project conditions
remained stable at 14%.
When looking deeper into project conditions, most
favourable areas continue to be project staff quality and management buy-in, while the least
favourable areas remain realistic expectations
and requirements definition.
Another area looked upon positively was user involvement, remaining consistent with results
reported in 2015, with 36% holding a positive
opinion in this area with Agile (38%) responding
more positively than organisations following traditional methods (26%). The same could
be said of communication (44%) and test environments (44%), although the gap between
Agile (49% for both) and traditional (27% and
28% respectively) was even more substantial.
Another area where Agile (42%) responded more
positively than traditional (22%) was in small/regular project milestones. This should come
as no surprise as this is a cornerstone of the
Agile methodology. However, the most positive
responses in this category were posted by the software and ICT industries, with over 50% of
respondents in each of these industries having a
positive view of their milestones.
At the negative end of the spectrum, poor estimation remains a burden to projects both
in terms of project timelines and budgets.
Nonetheless, budgetary estimation and timeline
estimation each received a more positive response
compared with 2015, improving 11 percentage
points in net opinion for timelines (to 6% negative
overall) and improving 2 points in net opinion for
budgets (to 2% negative overall).

24
Planit Testing Index 2016
Project staff qualityProject staff quality registered the most positive
sentiment since 2009, with 62% of respondents
considering their staff as ‘good / excellent’ while
only 7% reported their staff to be ‘poor / very poor’.
Management buy-in2016 reported a 6 year high in management buy-in, with 54% of respondents considering
management buy-in as ‘good / excellent’ compared
with 9% stating it to be ‘poor / very poor’.
The opinion towards the quality of project staff
varied significantly between industries, with the
software industry registering by far the most
positive opinion, coming in at a net positive of
82%. While still registering a net positive, at 31%,
government was less impressive.
In telecoms & ICT, management buy-in proved
to be a very positive attribute, with 74% rating
their management team as ‘good / excellent’ in
this area. This is over double the portion of the
government sector, among whom only a third
considered management buy-in to be a positive
attribute in their organisation.

25
Planit Testing Index 2016
Realistic expectationsAfter requirements, unrealistic expectations has
consistently been next most troubling condition
in projects causing failure. 2016 is no exception,
as unrealistic expectations were cited to be the
primary cause of 20% of projects failures.
Requirements definitionRequirements keep getting worse. In 2016,
excellence in requirements definition continues to
be a rarity (consistent at 2%), with fewer organisations
feeling positive about their requirements than ever
before (24%). In fact, 2016 is the most negative net
opinion of requirements on record, with 14 points more
respondents possessing a negative view of their
requirements than those that have a positive view.
The industry investing most heavily in requirements
definition, telecoms & ICT, is reaping the benefits
of this investment.
When asked to rate realistic expectations, only
18% considered this to be a positive attribute in
their organisations while 36% reported a negative
rating. This equated to a 9 year low in respondent
sentiment.
The least realistic of all was financial services,
who reported a 30 percentage point difference
between positive (15%) and negative (45%)
opinions.
Not only did half as many of these respondents
report a negative opinion of their requirements
(19% vs. the average of 38%) but they also
performed best in terms of project cancellations
and postponements at just 3% and 8%
respectively.
Still, no-one from the telecoms & ICT industry
considered their requirements to be ‘excellent’, with
a third considering them to be ‘good’ and a half
considering them to be ‘OK’.
The software industry saw the greatest spread in
responses, with 39% of respondents classing their
requirements definition as ‘good’ or ‘excellent’, and
36% considering it to be ‘poor’ or ‘very poor’.

26
Planit Testing Index 2016
For too long performance has been seen as a
matter of ensuring a system does not fall over,
when it is about ensuring customer experience
(CX) through appropriate response times and
minimising impact in the case of failure.
Performance testing utilisation
While most technical areas of testing have
been increasing in adoption, performance has
bucked the trend, with 3 percentage points fewer
organisations utilising performance testing as a
key part of the SDLC (21%) in 2016.
Perhaps more alarming is the 6 percentage
point increase in organisations not utilising performance testing in any capacity (22%).
The sectors most likely to embrace performance
testing in their SDLC were financial services (30%)
and telecoms & ICT (27%). Meanwhile, only 11%
of government respondents utilise performance
testing as a key part of the SDLC, 12 percentage
points lower than the private sector and 10
percentage points lower than the 2016 average.
Interestingly, government organisations were
the most likely to use performance testing for a specific project/demand at 69%, 12 points
higher than the industry average. However this is
not enough as highlighted by recent high profile
system failures, such as the Australian Bureau of
Statistics’ Online Census. This event has flicked a
figurative switch in government, and we expect the
sector’s adoption of performance measures to be
much higher in 2017.
8. Who is focusing on CX through performance?
27
Planit Testing Index 2016
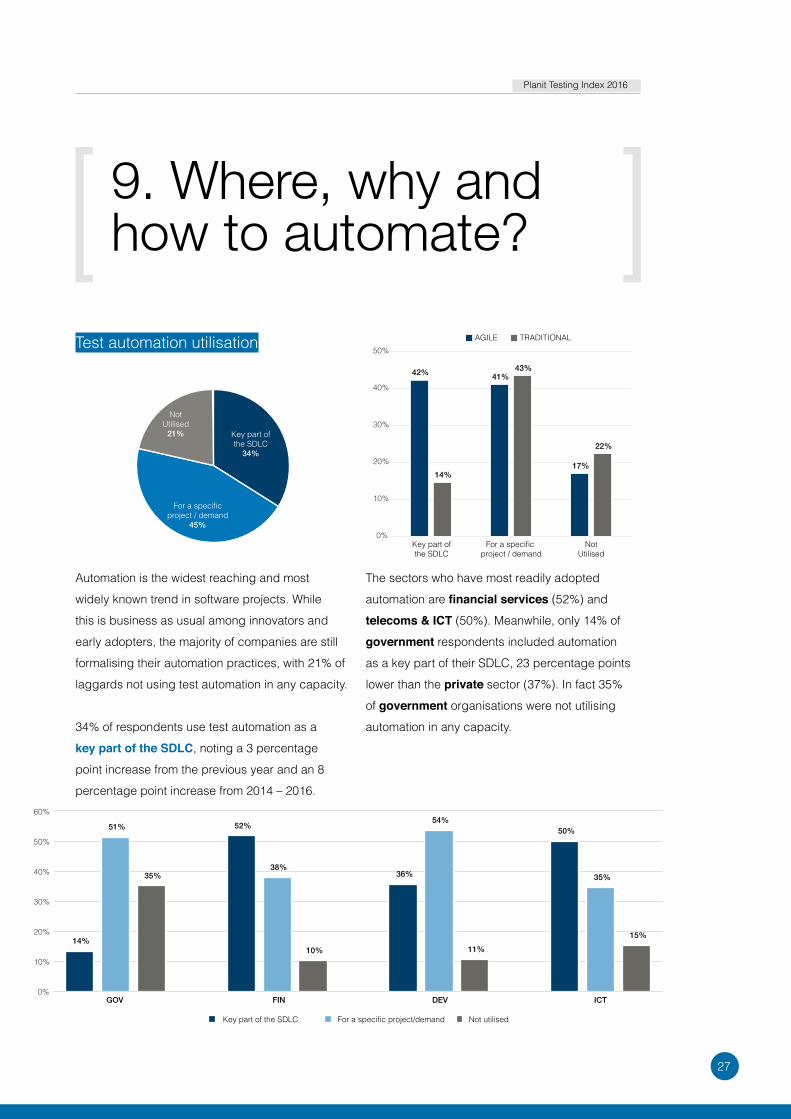
Test automation utilisation
Automation is the widest reaching and most
widely known trend in software projects. While
this is business as usual among innovators and
early adopters, the majority of companies are still
formalising their automation practices, with 21% of
laggards not using test automation in any capacity.
34% of respondents use test automation as a
key part of the SDLC, noting a 3 percentage
point increase from the previous year and an 8
percentage point increase from 2014 – 2016.
The sectors who have most readily adopted
automation are financial services (52%) and
telecoms & ICT (50%). Meanwhile, only 14% of
government respondents included automation
as a key part of their SDLC, 23 percentage points
lower than the private sector (37%). In fact 35%
of government organisations were not utilising
automation in any capacity.
9. Where, why and how to automate?
42% 41%
17%14%
43%
22%
0%
10%
20%
30%
40%
50%
AGILE TRADITIONAL
Key part ofthe SDLC
NotUtilised

28
Planit Testing Index 2016
45% of 2016 respondents use test automation
for a specific project/demand, 4 percentage
points higher than 41% last year, and matching
45% reported in 2014. This figure was significantly
larger in Australia (49%) compared to New Zealand (33%), noting a 16 percentage point
difference. Meanwhile, New Zealand (41%)
reported higher utilisation of test automation as a
key part of the SDLC in comparison to Australia (32%).
Not surprisingly, organisations who primarily
followed Agile practices in their projects had a far
higher rate of automation adoption as an essential
part of their SDLC at 42%, 28 percentage points
higher than their traditional counterparts.
Automated test coverageOverall automated test coverage was reported
at 27% this year, marking a 10 percentage point
increase from 2012 – 2016. There was a 19
percentage point difference in automated test
coverage between organisations primarily using
Agile (32%) and traditional (13%) methodologies.
A similar difference was noted when comparing
automated test coverage in the private sector
(30%) with the public sector (13%).
Above average overall automated test coverage
was noted in the ICT (39%) and development (34%) sectors.
Among adopters of automation, the amount of
test coverage that is automated has not changed
quite as significantly, coming in at 34% this year,
4 percentage points above the figures reported in
2012.

29
Planit Testing Index 2016
Where automation is conductedWhen examining the overall responses for test
layers where automation is conducted it appears
relatively evenly balanced with slightly more
automated user interface tests (38%) and
service/integration tests (36%) being carried out
ahead of automated unit tests (26%).
Upon closer inspection, it can be seen that most
individual organisations invest the majority of their
automation effort in one of these testing layers,
with 26% of organisations primarily automating
at the user interface layer, with a further 20% of
organisations favouring the service/integration
layer and finally 13% predominantly automating
unit tests.
Agile organisations were more likely to invest more
automation effort earlier in the development cycle
at the unit testing layer (28%) 7 points higher than
traditional organisations, with an inverse gap
being reflected in automated service/integration
tests where traditional projects focus 41% of their
effort.
How automation is executedAmongst users of automation, the most common
means of executing automated tests is by
manually triggering them on an ad hoc basis,
a path taken by a majority of organisations (73%).
Fewer organisations were scheduling execution of automated tests (47%) or automating execution in response to developers checking-in code (39%).
Scheduling execution of automated tests, e.g.
nightly, weekly, etc., was more prevalent among
private sector respondents (49%) and those
primarily following Agile methods (53%) in
comparison to government respondents (35%)
and those following traditional methodologies
(38%).
The gap was even larger in automating execution
in response to code check-in, a method used
by only 13% of government automation users
and 19% of organisations following traditional methods. By comparison, 43% of private sector
automation users automated their execution, a path
also followed by 53% of Agile organisations.
As practices mature, we can expect a shift towards
automated execution in response to code check-in
as organisations seek efficiencies through instant
verification, minimising the likelihood that defects
can make their way further down the development
lifecycle where their impact becomes much more
costly.
30
Planit Testing Index 2016
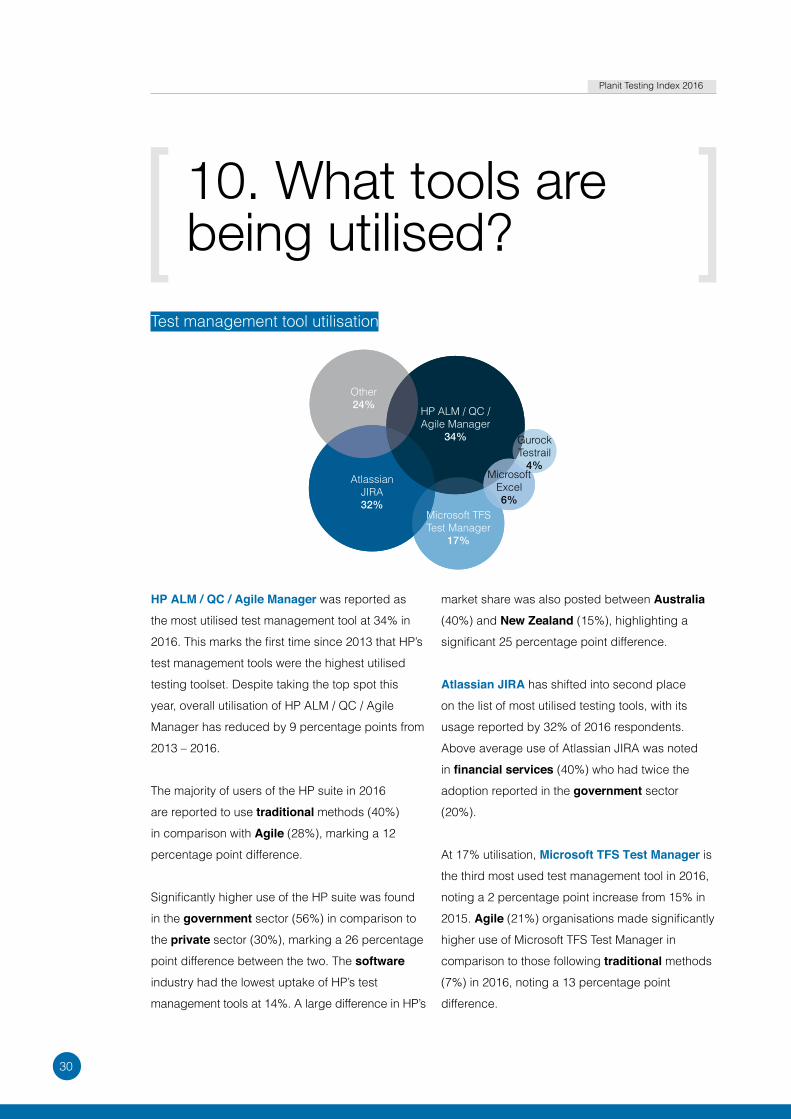
Test management tool utilisation
HP ALM / QC / Agile Manager was reported as
the most utilised test management tool at 34% in
2016. This marks the first time since 2013 that HP’s
test management tools were the highest utilised
testing toolset. Despite taking the top spot this
year, overall utilisation of HP ALM / QC / Agile
Manager has reduced by 9 percentage points from
2013 – 2016.
The majority of users of the HP suite in 2016
are reported to use traditional methods (40%)
in comparison with Agile (28%), marking a 12
percentage point difference.
Significantly higher use of the HP suite was found
in the government sector (56%) in comparison to
the private sector (30%), marking a 26 percentage
point difference between the two. The software
industry had the lowest uptake of HP’s test
management tools at 14%. A large difference in HP’s
market share was also posted between Australia
(40%) and New Zealand (15%), highlighting a
significant 25 percentage point difference.
Atlassian JIRA has shifted into second place
on the list of most utilised testing tools, with its
usage reported by 32% of 2016 respondents.
Above average use of Atlassian JIRA was noted
in financial services (40%) who had twice the
adoption reported in the government sector
(20%).
At 17% utilisation, Microsoft TFS Test Manager is
the third most used test management tool in 2016,
noting a 2 percentage point increase from 15% in
2015. Agile (21%) organisations made significantly
higher use of Microsoft TFS Test Manager in
comparison to those following traditional methods
(7%) in 2016, noting a 13 percentage point
difference.
10. What tools are being utilised?

31
Planit Testing Index 2016
Test automation tool utilisation
Among our respondent pool, over 30 automation
tools were reported to be used. None more than
Selenium / Cucumber retaining its top spot at
36% utilisation in 2016. Selenium / Cucumber
has gradually increased in popularity, achieving
second place with 25% utilisation in 2013 and
increasing in use by 11 percentage points from
2013 – 2016. The highest usage of Selenium /
Cucumber for test automation was reported in the software (60%) and financial services (45%)
industries, with lower levels of utilisation amongst
government (26%).
Selenium / Cucumber adoption is significantly
higher utilised by organisations primarily practising
Agile (42%) in comparison to those following
traditional methods (24%).
In second place, the former king of the automation
tools, HP QTP / UFT, was utilised by 22% of
organisations in 2016, reflecting an 8 percentage
point decrease in utilisation as a test automation
tool from 2013 – 2016. This was more commonly
used in government (33%) with lower usage in
the software development (7%) sector, 15 points
under the 2016 average.
Performance testing tool utilisation
One-quarter (25%) of 2016 respondents rate HP LoadRunner/Performance Center to be the most
utilised performance testing tool, however, this
response has experienced an 11 percentage point
decline from 2013 – 2016. The biggest users of
HP’s performance tools were the telecoms & ICT
(37%) and government (36%) sectors, with few
(10%) of the software industry utilising this toolset.
HP’s presence in the Australian market was
again much more significant (30%) than the New Zealand market (9%) for performance tooling,
registering a significant 21 percentage points of
difference.
JMeter is the 2nd most utilised performance
testing tool in 2016 at 21%, experiencing a
minor 1 percentage point decline in usage
from 2013 – 2016. This tool is most prominently
used for performance testing by the software industry (29%) with below average usage in the government sector (13%).
An 11 percentage point difference was discovered
regarding the use of JMeter for performance
testing in Australia (18%) and New Zealand (29%)
in 2016.

32
Planit Testing Index 2016
Cloud utilisationFor many years organisations were touting
their plans for embracing cloud-based tools
and technologies but the uptake did not match
their ambitions. Now, in 2016, we can see many
organisations achieving their long laid plans, with
cloud-based development and test environments
leading the way at 52%.
In 2016, 46% of respondents noted cloud
utilisation for tools and applications, marking a
9 percentage point increase from 2015 and a 36
percentage point increase from 2012 – 2016. This
was most prominent in the telecoms & ICT (63%)
sector, but below average in the government sector (36%).
Making significant gains this year, cloud-based
development / test environments was reported
to be used by over half of respondents (52%), a
significant 20 percentage points higher than the
previous year’s 32%. Coming in 27 percentage
points above average utilisation was the software industry at 79%.
Cloud use for production environments was
reported at 39% utilisation in 2016, experiencing
a slight 7 percentage point increase from 32% in
2015. Most prominent use was in the software development (57%) sector, and a 16 percentage
point difference in cloud use for production
environments was reported from the private sector
(42%) in comparison to the government sector
(26%).
Cloud utilisation was least used for data warehousing/analytics at 24% in 2016, 3
percentage points lower than the figure reported in
2015. This was reported to be notably lower than
average by 7 percentage points in the financial sector (17%).

33
Planit Testing Index 2016
Service virtualisation utilisation
Uptake of service virtualisation has remained
static over the past year as many professionals
and, in cases, entire organisations have limited
understanding of what service virtualisation is and
its power in accelerating project delivery of highly
integrated systems, alleviating bottlenecks in test
environments to start testing earlier. Currently,
only innovators and early adopters are embracing
virtualisation as a key part of their SDLC (19%, up
6 percentage points since 2014), many of whom
were in the software industry (40% using as a key
part of their SDLC).
With 38% of organisations using service
virtualisation for specific projects, it’s clear that
the majority are trialling this technology. This is
particularly the case in the telecoms & ICT and
financial services industries (46% and 44%
respectively).
Still, the largest response in 2016 was ‘no use of service virtualisation’ at 43%. The public sector
was most likely to not use service virtualisations at
64%, 24 percentage points higher than the private sector (40%). This is followed by the financial (35%), ICT (33%) and software development (24%) sectors, with the highest utilisation of service
virtualisation found in the software industry at 19
percentage points difference in comparison to the
2016 average.
34
Planit Testing Index 2016
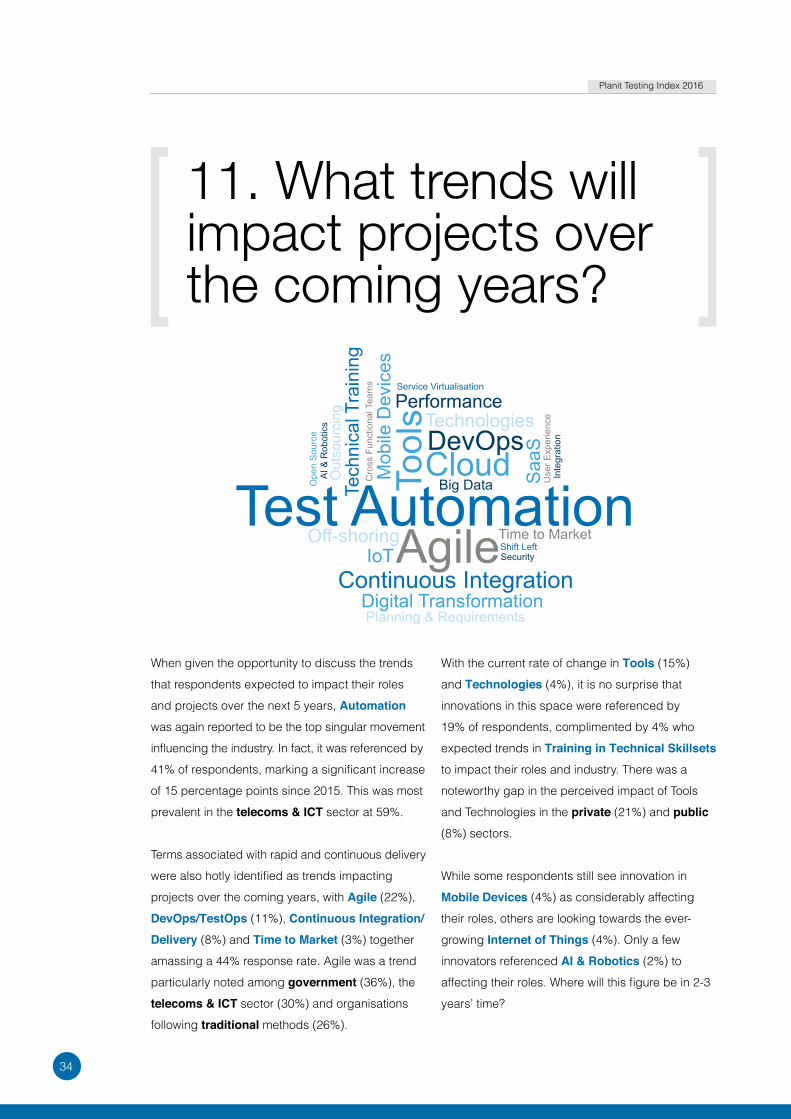
When given the opportunity to discuss the trends
that respondents expected to impact their roles
and projects over the next 5 years, Automation
was again reported to be the top singular movement
influencing the industry. In fact, it was referenced by
41% of respondents, marking a significant increase
of 15 percentage points since 2015. This was most
prevalent in the telecoms & ICT sector at 59%.
Terms associated with rapid and continuous delivery
were also hotly identified as trends impacting
projects over the coming years, with Agile (22%),
DevOps/TestOps (11%), Continuous Integration/Delivery (8%) and Time to Market (3%) together
amassing a 44% response rate. Agile was a trend
particularly noted among government (36%), the
telecoms & ICT sector (30%) and organisations
following traditional methods (26%).
With the current rate of change in Tools (15%)
and Technologies (4%), it is no surprise that
innovations in this space were referenced by
19% of respondents, complimented by 4% who
expected trends in Training in Technical Skillsets to impact their roles and industry. There was a
noteworthy gap in the perceived impact of Tools
and Technologies in the private (21%) and public (8%) sectors.
While some respondents still see innovation in
Mobile Devices (4%) as considerably affecting
their roles, others are looking towards the ever-
growing Internet of Things (4%). Only a few
innovators referenced AI & Robotics (2%) to
affecting their roles. Where will this figure be in 2-3
years’ time?
11. What trends will impact projects over the coming years?

35
Planit Testing Index 2016
UNT HARUM SENT Oreruptur sit orat Delent
volorit aectur, sus excercias

Contact usAUSTRALIA: 1300 992 967NEW ZEALAND: 0800 752 648UNITED KINGDOM: +44 203 457 5020INDIA: +91 40 4646 5555
[email protected] www.planittesting.com
https://www.linkedin.com/company/planit-software-testing https://www.facebook.com/PlanitTesting https://twitter.com/PlanitTesting
PLANITaccelerating your delivery of quality