plan business city of mississauga 2014 business plan and budget 2011-2014 table of contents existing...
TRANSCRIPT
2011
-201
4
Rec
reat
ion
an
d P
ark
s B
usi
nes
s P
lan
City
of M
issi
ssau
ga

THE PAGE INTENTIONALLY LEFT BLANK

G-2 Business Plan and Budget 2011-2014
Table of Contents
Existing Core Services ................................................................................................................................. 3 1.0 Vision ....................................................................................................................................................................... 3 2.0 Service Delivery Model ........................................................................................................................................... 4 3.0 Past Achievements ................................................................................................................................................... 5 4.0 Opportunities and Challenges .................................................................................................................................. 6 5.0 Current Service Levels ............................................................................................................................................. 8 5.1 Maintaining Our Infrastructure .............................................................................................................................. 10 6.0 Looking Ahead: Goals for the next 4 years ........................................................................................................... 11 7.0 Engaging our Customers ........................................................................................................................................ 13 Proposed Changes ...................................................................................................................................... 15 8.0 Base Changes ......................................................................................................................................................... 16 9.0 Continuous Improvement....................................................................................................................................... 19 10.0 Proposed Changes .................................................................................................................................................. 22 Required Resources ................................................................................................................................... 29 11.0 Human Resources .................................................................................................................................................. 29 12.0 Technology ............................................................................................................................................................ 31 13.0 Facilities ................................................................................................................................................................. 32 14.0 Budget .................................................................................................................................................................... 33 Performance Measures ............................................................................................................................... 36 15.0 Balanced Scorecard ................................................................................................................................................ 36

Business Plan and Budget 2011-2014 G-3
Existing Core Services
1.0 Vision Recreation and Parks will anticipate and respond to the needs of our communities as a committed partner in fostering a healthy city in which to live, work and play.
Mission
A dynamic team of staff, volunteers and partners working together to strengthen individuals, families, communities and the environment through stewardship and encouraging lifelong learning, leisure and sustainable recreation experiences.
G-4 Business Plan and Budget 2011-2014
2.0 Service Delivery Model The chart above outlines the service delivery model within Recreation and Parks and the major services provided through the Division.
Recreation and Parks and Planning Development and Business Services operate within the Community Services Department. The service areas are responsible for the planning, design, programs, day to maintenance and overall management of Mississauga’s parks, recreation facilities, sport fields, trails, marina’s, golf and cemetery operations.
Program delivery is accomplished through a wide variety of operational activities including: parks design; facility planning; living green efforts; aquatic programs; general programs and camps; facilitation of community events; forestry services; fitness activities; ice, meeting rooms and sport field bookings; marina operations; golf operations; cemetery services; customer service and day to day maintenance of all the associated infrastructure.
The service has a number of key links and dependencies with other City service areas including the Mississauga Public Libraries, Facility and Property Management, Legal Services, Roads, Storm Drainage and Watercourses and Strategic Policy.
Key Documents that inform our Business Plan
• Strategic Plan • Future Directions • Older Adult Study • Youth Plan • Mississauga Arts and Culture • Downtown 21 Master Plan • Cycling Master Plan and Implementation Strategy • Waterfront Parks Strategy • Credit Valley Conservation and Toronto Regional
Conservation Authority Plans
Business Plan and Budget 2011-2014 G-5
3.0 Past Achievements Recent achievements within the division reflect the commitment to the strategic plan and are aligned to the strategic pillars of Move, Belong, Connect, Prosper and Living Green.
• Completed Future Directions for Recreation and Parks Master Plan; the Waterfront Parks Strategy; Parks and Natural Areas study; Older Adult Plan; the Youth Plan and the Cycling Master Plan. The Older Adult Plan was recognized for excellence and given an award by the Canadian Institute of Planners;
• Grant applications for the Infrastructure Stimulus Fund (ISF) and the Recreation Investment in Community (RInC) funding led to the approval of $98.4 million investment in new and renovated recreation and park facilities;
• Over the past two years Parks Planning has acquired approximately 150 acres of park land and green belt to enhance the waterfront and protect the natural environment;
• Partnerships enhance the effectiveness and efficiency of programs. Examples include;
o Recreation and Parks worked with the school boards and the Lifesaving Saving Society to deliver the Swim to Survive program to 3,700 grade three students. Swim to Survive introduces basic swimming survival skills too many students who might not otherwise participate;
o In 2010 Corporate sponsors increased their contributions allowing the City to expand after school drop-in programs and increased contributions from
corporate donors allowed an additional 800 children the opportunity to participate in recreation programs through the Jerry Love fund;
• Recreation and Parks, in conjunction with the Mississauga Public Libraries, are establishing Youth Advisory groups in Community Centres across the City. The Youth Advisory groups are providing leadership and input into new youth programs and events related to Youth Plan outputs;
• ActiveAssist fee assistance program in 2010 provided 4,000 residents with the opportunity to participate in healthy active living activities. In addition, GotSkates was introduced providing 2,000 youth with the opportunity to skate for the first time. These new efforts complement the Jerry Love Fund and Walmart at Play programs that provide opportunities for children, youth and adults from across the city support to enjoy recreation programs and activities that would not otherwise be available to them;
• My Mississauga attracted 220,000 participants, celebrating the diversity in the City of Mississauga, celebrating Canada, and celebrating the unique identity of communities within the city;
• The division connected with 2,500 volunteers planting 20,800 native trees and shrubs on City property. In addition, with support of the Region of Peel, recycling programs were extended to parks and recreation facilities; and
• Introduced one to one dynamic email of program opportunities to program participants. In addition, 25,000 customers responded to on-line surveys providing valuable feedback and an overall satisfaction rating in 2010 of 85 percent.

G-6 Business Plan and Budget 2011-2014
4.0 Opportunities and Challenges A Strengths, Weaknesses, Opportunities and Threats (SWOT) analysis was conducted for this service to help identify the opportunities and challenges that Recreation and Parks faces over the next few years. In addition, a risk assessment was conducted to ensure mitigation measures were in place where relevant. Both of these exercises informed the content of this plan.
Opportunities
The opportunities for Recreation and Parks services are significant.
The ability to maintain, renew and provide infrastructure aligned to recreation trends, adapt services to demographic change and meet customer expectations for program delivery will determine participation in, support for, and the general health and well being of the community. Recreation and Parks connects individuals, families and the community.
The desire to continue to acquire, develop and design waterfront and parkland across the city is an opportunity to support living green, enhance resident sense of belonging and ensure that Mississauga is an attractive community for residents and business ensuring the city prospers.
Executing the Cycling Master Plan is a long term plan that involves expanding the cycling network from 350km to 890km of bike pathways to help residents “move”. This supports Mississauga’s living green principles.
Ongoing customer input is an opportunity to ensure services meet customer expectations, appeal to different cultures and age groups, thereby enhancing a sense of belonging within the community.
Leveraging a greater variety of communication processes and portals will create awareness of the benefits that
recreation and parks delivers and allows connectivity with the community.
The ability to transition into new service models based on strategic links and partnerships is an opportunity to diversify services, work with other third party experts and maximize efficiency. Partnership experiences with school boards, the Mississauga Public Library Board, and other third party organizations enhance the ability to connect our neighbourhoods.
The opportunities for Recreation and Parks are accompanied by challenges that will influence outcomes.
Challenges
Challenges represent both an opportunity and a threat depending on the organizational response and events that occur in the external environment. In general, the challenges are driven by demographics, technology, financial and human resource demands that combine to influence effective and efficient service delivery.
Demographics
Anticipating external environmental change is largely based on demographics. For example, Mississauga will not have the population growth in the next 20 years that it experienced in the last 20 years. It is also understood that the population of Mississauga will continue to be increasingly multi-cultural and that the real numbers of adults over the age of 50 will be the fastest growing demographic component within the City (increasing from approximately 50,000 people today to over 150,000 individuals in the next decade). This challenges staff to change and adapt programming to different age groups, different program interests, and ensure a wide variety of price points to encourage participation.

Business Plan and Budget 2011-2014 G-7
Technology and Customer Expectations
The rate of technological change has increased the channels and speed of communication. Global information exchange happens at the push of a “button”. This increases consumer knowledge and expectation for service. In addition, the growth of web based communications integrated with television, smart phones and other social media is changing traditional communication methods. These changes present challenges for new modes of communication and a higher expectation for personalized one on one communication with customers.
Financial and Human Capital
Recreation and Parks competes for financial and human resource capital and is in a state of continuous change. Recreation and Parks works with the community and Council to allocate scarce resources against high priority outcomes (risk mitigation).
Within this context, Recreation and Parks is challenged to execute the opportunities that will keep its services relevant and meaningful to the residents and visitors of Mississauga.
Recreation and Parks
– meeting customer expectations – everybody gets to play.

G-8 Business Plan and Budget 2011-2014
5.0 Current Service Levels The Parks and Forestry service levels that are delivered to residents across the City are outlined in this table. This includes gross operating cost per person, the average amount of open space, standards for grass cutting, garbage and recycling, winter snow clearing, street tree pruning and maintenance levels.
These measures and services are valuable as they provide historical context for service delivery, allow staff to reference delivery against similar service providers, and provide an opportunity to explore best practices. This data analysis creates the opportunity for innovation and change to increase effectiveness and/ or efficiencies.
The Business Plan and Budget allows Parks and Forestry to maintain these service levels while accommodating new capital development into the operating budget and dealing with the consequences of intensification, changing community needs and shifting demographics. Parks and Forestry will continue to monitor service standards and delivery across the city and will shift resources as required to achieve service and budget objectives.
Residents enjoying the city cycling paths.
Parks and Forestry Service Levels
Operating costs for parks per person
$38.29
Hectares of open space per 1,000 persons
3.81
General Parkland Maintenance
grass cutting every 10 working days
Urban Park Maintenance grass cutting every 7 days; daily litter pickup; daily horticultural
Garbage & Recycling Disposal every 7 days
Winter Maintenance – Clearing Parking & Paths
within 48 hours
Street Tree Pruning and maintenance
within 12 months
Business Plan and Budget 2011-2014 G-9
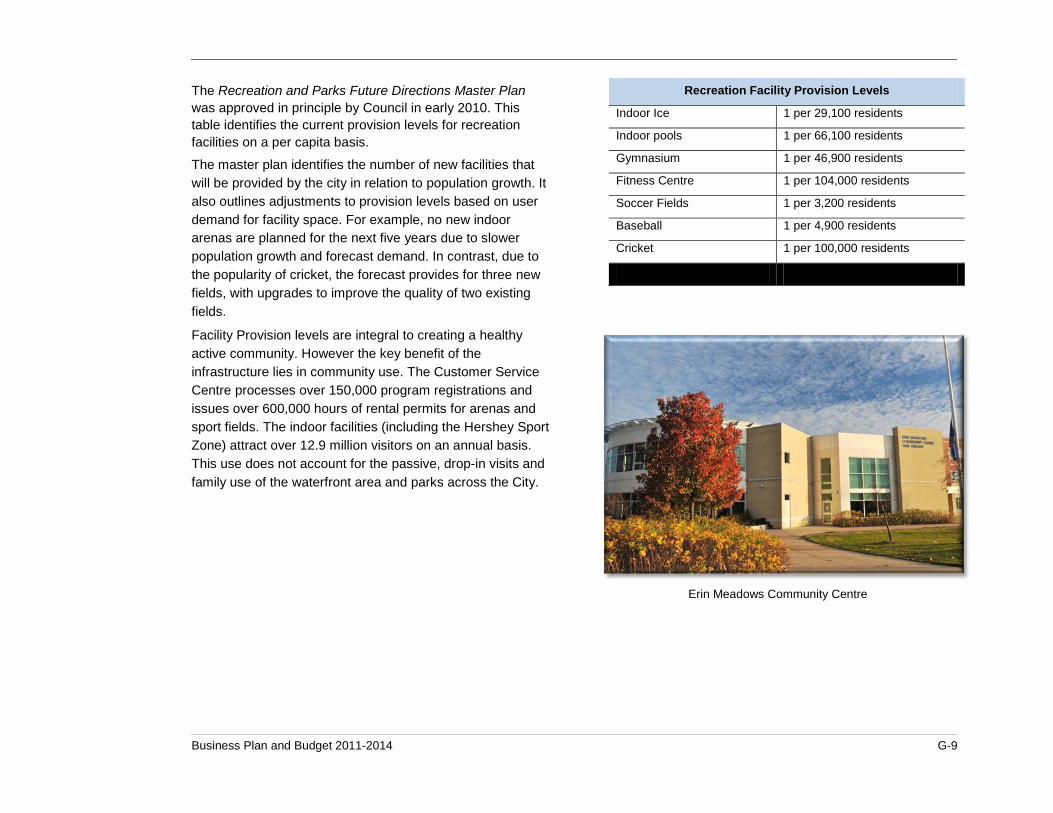
The Recreation and Parks Future Directions Master Plan was approved in principle by Council in early 2010. This table identifies the current provision levels for recreation facilities on a per capita basis.
The master plan identifies the number of new facilities that will be provided by the city in relation to population growth. It also outlines adjustments to provision levels based on user demand for facility space. For example, no new indoor arenas are planned for the next five years due to slower population growth and forecast demand. In contrast, due to the popularity of cricket, the forecast provides for three new fields, with upgrades to improve the quality of two existing fields.
Facility Provision levels are integral to creating a healthy active community. However the key benefit of the infrastructure lies in community use. The Customer Service Centre processes over 150,000 program registrations and issues over 600,000 hours of rental permits for arenas and sport fields. The indoor facilities (including the Hershey Sport Zone) attract over 12.9 million visitors on an annual basis. This use does not account for the passive, drop-in visits and family use of the waterfront area and parks across the City.
Erin Meadows Community Centre
Recreation Facility Provision Levels
Indoor Ice 1 per 29,100 residents
Indoor pools 1 per 66,100 residents
Gymnasium 1 per 46,900 residents
Fitness Centre 1 per 104,000 residents
Soccer Fields 1 per 3,200 residents
Baseball 1 per 4,900 residents
Cricket 1 per 100,000 residents
G-10 Business Plan and Budget 2011-2014
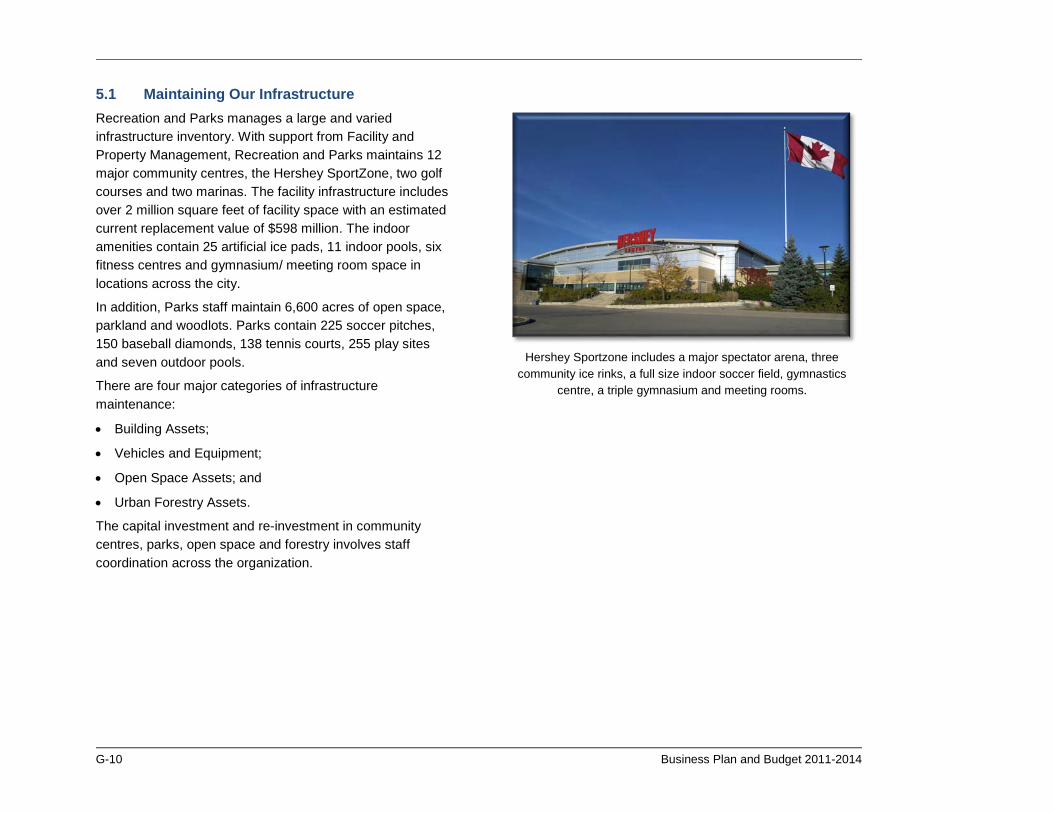
5.1 Maintaining Our Infrastructure Recreation and Parks manages a large and varied infrastructure inventory. With support from Facility and Property Management, Recreation and Parks maintains 12 major community centres, the Hershey SportZone, two golf courses and two marinas. The facility infrastructure includes over 2 million square feet of facility space with an estimated current replacement value of $598 million. The indoor amenities contain 25 artificial ice pads, 11 indoor pools, six fitness centres and gymnasium/ meeting room space in locations across the city.
In addition, Parks staff maintain 6,600 acres of open space, parkland and woodlots. Parks contain 225 soccer pitches, 150 baseball diamonds, 138 tennis courts, 255 play sites and seven outdoor pools.
There are four major categories of infrastructure maintenance:
• Building Assets;
• Vehicles and Equipment;
• Open Space Assets; and
• Urban Forestry Assets.
The capital investment and re-investment in community centres, parks, open space and forestry involves staff coordination across the organization.
Hershey Sportzone includes a major spectator arena, three
community ice rinks, a full size indoor soccer field, gymnastics centre, a triple gymnasium and meeting rooms.

Business Plan and Budget 2011-2014 G-11
6.0 Looking Ahead: Goals for the next 4 years The key goal for Recreation and Parks is to provide opportunities for healthy active living that are valued by residents and visitors while delivered at a reasonable cost.
The operational objectives for the service area over the next years include:
Customer Satisfaction and Service Development
• Utilize e-survey technology to invite customer feedback ensuring that services are meeting customer expectations. Make adjustments for service improvements/ new activities based on customer feedback;
• Implement e-communication technology through Facebook, Twitter and electronic mail to inform customers of new programs and opportunities;
• Use the trend analysis from completed plans to modify and adjust service delivery. Examples include developing new buildings, parks and sport fields as identified in Future Directions for Recreation and Park. Continue to work with the 35 Older Adult groups across the City to implement the Older Adult Plan. Implement Youth Plan objectives including Youth Advisory Committees at Community Centers, increased training/ development for staff and an increasing number of events and drop-in programs across the City; and
• Implement the recommendations in the Cycling Master Plan to increase the cycling trails and roadways across the City.
Asset Management
• Maintain a state of good repair for parks, facilities, sport fields, play grounds, trails and street trees;
• Respond to legislative changes with respect to Ontario’s Accessibility Standards and Minimum Maintenance Standards for municipal assets; and
• Lever technology to plan and track repair and replacement of asset management. Including facility life-cycle repairs, equipment replacement and park renovations.
Utilize Partnerships to Maximize Effectiveness and Efficiency
Partnerships for the service are created in different formats, from formal legal contracts to much more informal “letters of understanding”. The primary outcome of any partnership is realization that by working together the organizations are able to achieve a greater impact than if they pursued the objective on their own. Recreation and Parks will:
• Strengthen formal partnerships with private organizations that understand the benefits of social responsibility to continue to enhance programs for youth, the environment and other priority markets;
• Continue to work with public sector organizations in education and the health sector to provide facilities and programs that are effective and increase the efficiency of public sector investment;
• Enhance our relationship with over 190 affiliate groups to support festivals, events and sport across the City; and
• Work with the 35 Older Adult organizations in the City to increase programs for this demographic and implement the recommendations in the Older Adult plan.

G-12 Business Plan and Budget 2011-2014
• Actively pursue public sector, private sector contributions and community involvement to deliver Living Green outcomes such as Plant a Million Trees.
Recreation and Parks is in a unique position to leverage partnerships that continue to build healthy, active living opportunities for residents across the city.
Living Green – Recreation and Parks Efforts
• Continue to expand the recycling program in facilities and parks;
• Continue to monitor and adapt green practices related to park land and facility maintenance as new approaches emerge;
• Work with Energy Management to continue to implement energy efficient practices in facilities;
• “Green” the design of capital projects where appropriate; and
• Work with the Living Green staff to establish community connections and involvement in green initiatives such as tree plantings, water course clean up and other environmentally friendly projects that connect our communities and foster a sense of belonging.
Key Projects • Complete ISF and RInC capital projects including
Celebration Square, two indoor pools, six outdoor pools and park pathways;
• Host the Memorial Cup Junior hockey championship;
• Introduce year round programming to Celebration Square;
• Establish Youth Advisory Groups across the City, expand youth programs and events, enhance internal training to create a “youth friendly” culture;
• Continue to work with the 35 Older Adult groups across the City to increase program opportunities;
• Complete the Living Green Master Plan; and
• In 2012 launch the Plant a Million Trees program.
Business Plan and Budget 2011-2014 G-13
7.0 Engaging our Customers Recreation and Park facilities attract over 12.9 million visitors on an annual basis (excluding park uses). The service is respected by residents and has a high customer satisfaction ranking [top 3 in City with 80 percent satisfaction level based on 2009 Pollara ratings].
Recreation and Parks staff search for and implement activities that are focused on maintaining a high degree of community satisfaction and interaction. Tangible examples of efforts are outlined below.
Ongoing Customer Input
In 2009 Recreation and Parks introduced e-valuations [an on-line survey process]. The Customer Insights Program received feedback from 25,000 customers in 2009 – 85 percent rated their experience very good or excellent.
Core lines of business [programs, aquatics, fitness, and memberships] assess customer input and use it to launch new products and services with differing price points. The customer input also allows us to recognize teams and individuals.
Community Engagement
Recreation and Parks staff engages the community on a regular basis and understand the value of public input to shape design and operating outputs. Engaging other organizations, partners and volunteers to help deliver services enhances the breadth of opportunities to the community.
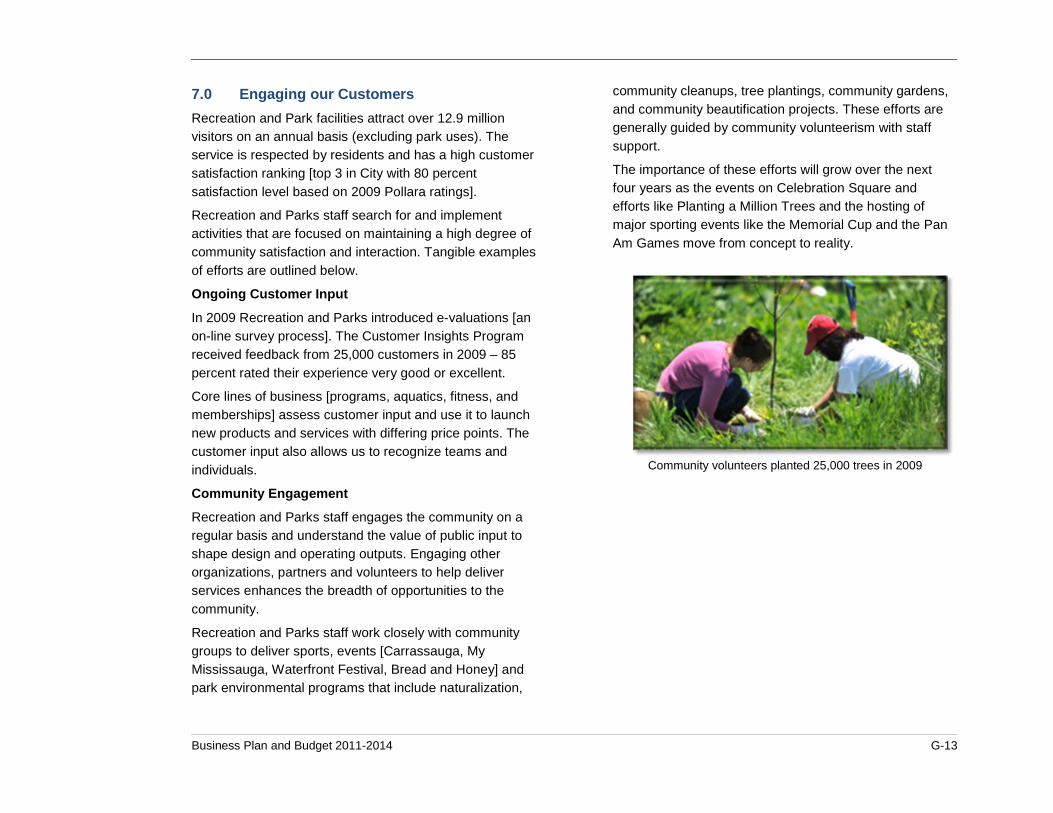
Recreation and Parks staff work closely with community groups to deliver sports, events [Carrassauga, My Mississauga, Waterfront Festival, Bread and Honey] and park environmental programs that include naturalization,
community cleanups, tree plantings, community gardens, and community beautification projects. These efforts are generally guided by community volunteerism with staff support.
The importance of these efforts will grow over the next four years as the events on Celebration Square and efforts like Planting a Million Trees and the hosting of major sporting events like the Memorial Cup and the Pan Am Games move from concept to reality.
Community volunteers planted 25,000 trees in 2009
G-14 Business Plan and Budget 2011-2014
Marketing and Communications Plan The marketing efforts within the division are based on allocating resources to priority lines of business focusing on customer retention and growing participation in activities.
The 2011-2014 Business Plan brings a shift to a greater amount of electronic based communication and marketing tools. The shift is in progress as business development has segmented the customer base launching dynamic email communications to keep various segments aware of services and programs aligned to their interests.
In addition, e-valuation surveys are completed on line allowing customer feedback to be tabulated in real time. This allows programmers and programs to cycle through continuous improvement at a faster rate. The continuous improvement cycle will create a culture of customer service excellence allowing the City to keep pace with market expectations.
The marketing effort is also focused on communicating the message of healthy active living across the community. Visual identity standards are in place providing a consistent look and feel for print and digital material. There will be ongoing improvements to the Recreation and Parks website and an increasing expansion of messaging through other electronic based social networking mediums such as Facebook, Twitter, and smart phone applications.
Improvements will also occur to our existing electronic applications including the Connect2Rec registration, an improved digital version of the ACTIVE MISSISSAUGA publication and a migration to on-line forms for volunteer group application.
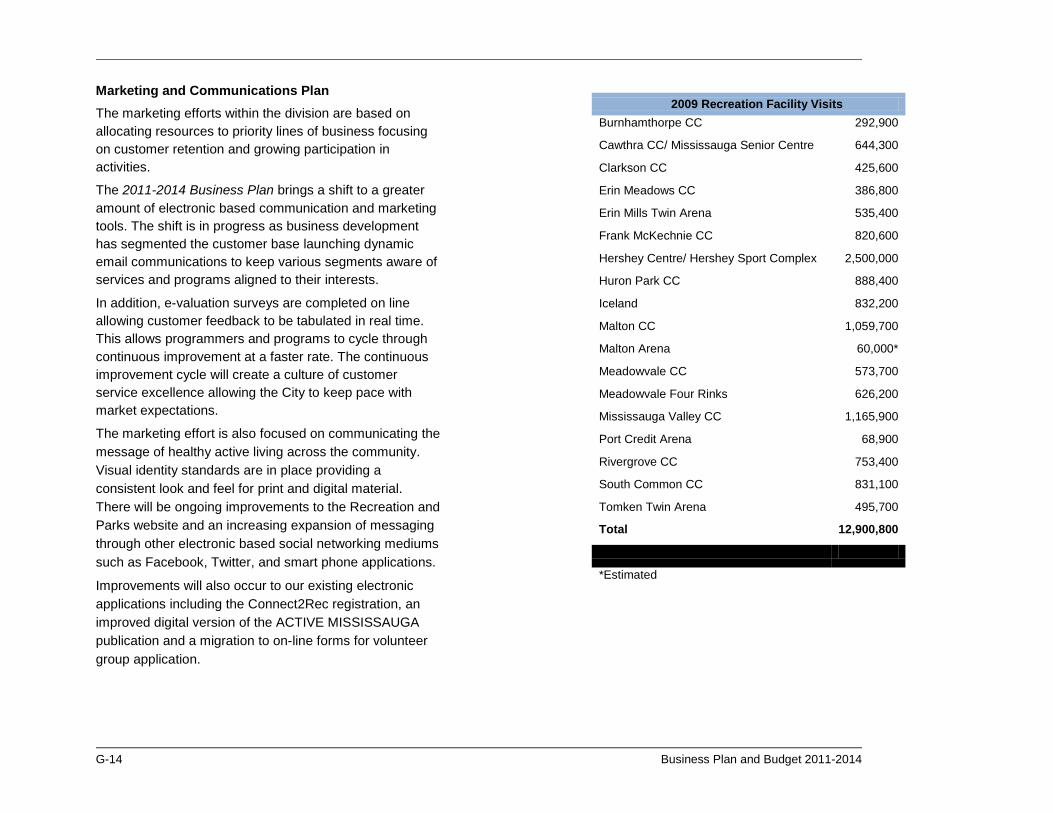
2009 Recreation Facility Visits Burnhamthorpe CC 292,900
Cawthra CC/ Mississauga Senior Centre 644,300
Clarkson CC 425,600
Erin Meadows CC 386,800
Erin Mills Twin Arena 535,400
Frank McKechnie CC 820,600
Hershey Centre/ Hershey Sport Complex 2,500,000
Huron Park CC 888,400
Iceland 832,200
Malton CC 1,059,700
Malton Arena 60,000*
Meadowvale CC 573,700
Meadowvale Four Rinks 626,200
Mississauga Valley CC 1,165,900
Port Credit Arena 68,900
Rivergrove CC 753,400
South Common CC 831,100
Tomken Twin Arena 495,700
Total 12,900,800
*Estimated
Business Plan and Budget 2011-2014 G-15
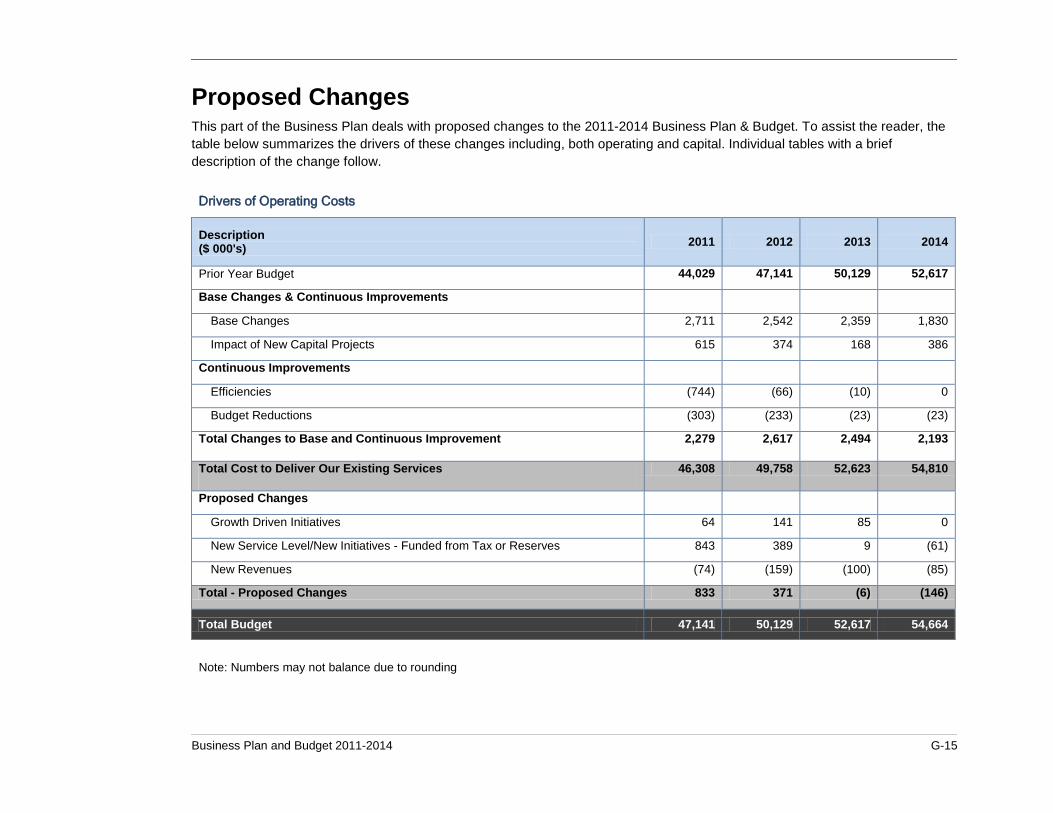
Proposed Changes This part of the Business Plan deals with proposed changes to the 2011-2014 Business Plan & Budget. To assist the reader, the table below summarizes the drivers of these changes including, both operating and capital. Individual tables with a brief description of the change follow.
Drivers of Operating Costs
Description ($ 000's) 2011 2012 2013 2014
Prior Year Budget 44,029 47,141 50,129 52,617
Base Changes & Continuous Improvements
Base Changes 2,711 2,542 2,359 1,830
Impact of New Capital Projects 615 374 168 386
Continuous Improvements
Efficiencies (744) (66) (10) 0
Budget Reductions (303) (233) (23) (23)
Total Changes to Base and Continuous Improvement 2,279 2,617 2,494 2,193
Total Cost to Deliver Our Existing Services 46,308 49,758 52,623 54,810
Proposed Changes
Growth Driven Initiatives 64 141 85 0
New Service Level/New Initiatives - Funded from Tax or Reserves 843 389 9 (61)
New Revenues (74) (159) (100) (85)
Total - Proposed Changes 833 371 (6) (146)
Total Budget 47,141 50,129 52,617 54,664
Note: Numbers may not balance due to rounding

G-16 Business Plan and Budget 2011-2014
8.0 Base Changes The following table illustrates highlights of this service area’s base budget. This would include costs to maintain existing service levels including the annualized impact of previous Council decisions. Costs identified here are related to labour and benefit increases for existing staff, increases of an inflationary nature as well as service demand changes (e.g. declining program enrolments). This table does not represent a reconciliation of all budget changes, just highlights.
Highlights of Base Budget Changes
Description ($ 000's) FTE 2011 2012 2013 2014
Total Net
Costs Labour Allocation 0.0 1,993 2,361 2,359 1,678 8,391
Utility Increase 0.0 451 337 235 242 1,265
Program & Rental Fee Increase - 2.5% 0.0 (315) (320) (325) (329) (1,289)
Labour Gapping 0.0 (315) 0 0 0 (315)
Lakeview Golf Course - Revenue Pressure 0.0 170 0 0 0 170
Allocations (Building, IT and Departmental Services) 0.0 133 152 140 98 523
Increased Contractor Costs at Hershey 0.0 146 0 0 0 146
Room Rental - Revenue Pressure 0.0 140 0 0 0 140
Contract Staff for Special Capital projects - Labour Recovery from Reserve 0.0 126 126 0 0 252
Contract Staff for Special Capital projects - Part Time reduction (3.0) (126) (126) 0 0 (252)
Leased Vehicles - Parks Operations 0.0 80 12 0 0 92
Iceland Concession - Revenue Pressure 0.0 80 0 0 0 80
Equipment Reduction for Urban Forestry Crew 0.0 (70) 0 0 0 (70)
Cemetery Operations - Revenue Pressure 0.0 65 30 0 0 95
Community Commons-Annualization 0.5 60 0 0 0 60
Arborist - Annualization 0.0 42 0 0 0 42
BraeBen Capital Replacement Program - Transfer Profits to Capital Reserve 0.0 34 0 0 0 34
Note: Numbers may not balance due to rounding

Business Plan and Budget 2011-2014 G-17
Highlights of Base Budget Changes
Description ($ 000's) FTE 2011 2012 2013 2014
Total Net
Costs Other Base Changes 0.0 14 0 0 0 14
201 City Centre Lease Increase 0.0 5 4 0 0 9
Meadowvale Community Centre Redevelopment Closure 0.0 0 (34) (50) 141 57
Fitness Centre - Full Recovery 5.0 0 0 0 0 0
Port Credit Arena - Re-Opening - Reinstate Expenses & Revenues (Net Zero Impact)
4.5 0 0 0 0 0
Total Base Budget Highlights 7.0 2,711 2,542 2,359 1,830 9,442
Note: Numbers may not balance due to rounding
G-18 Business Plan and Budget 2011-2014
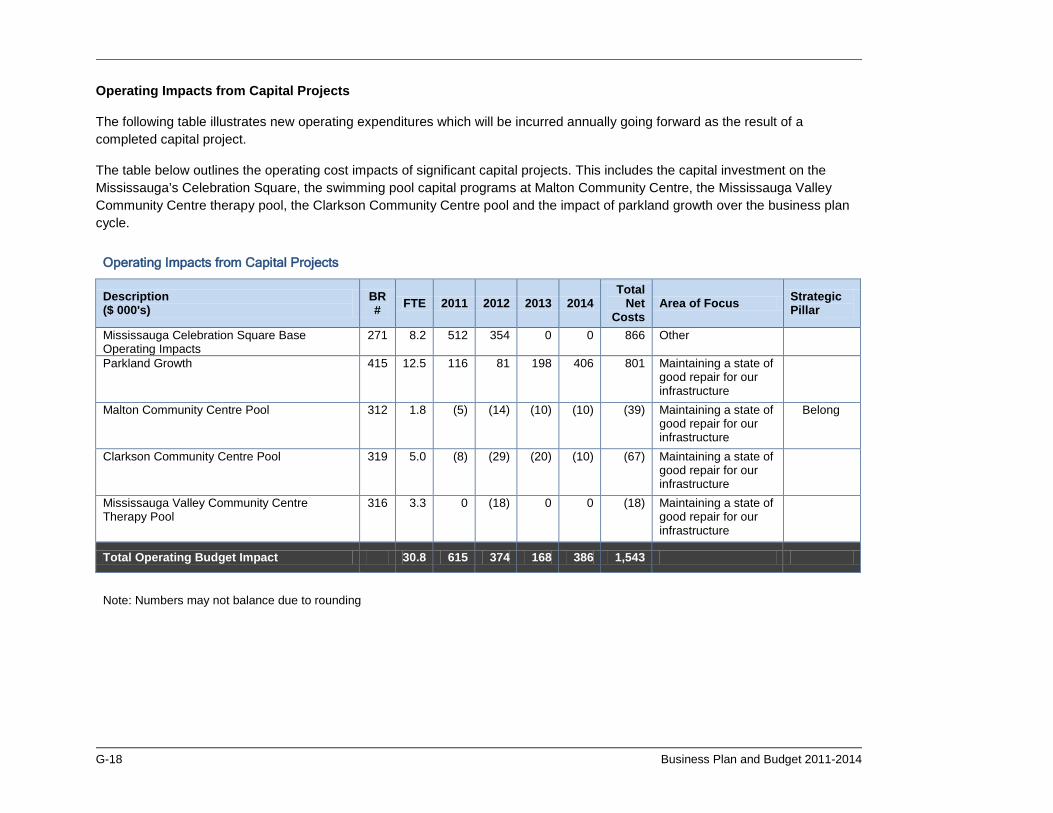
Operating Impacts from Capital Projects
The following table illustrates new operating expenditures which will be incurred annually going forward as the result of a completed capital project.
The table below outlines the operating cost impacts of significant capital projects. This includes the capital investment on the Mississauga’s Celebration Square, the swimming pool capital programs at Malton Community Centre, the Mississauga Valley Community Centre therapy pool, the Clarkson Community Centre pool and the impact of parkland growth over the business plan cycle.
Operating Impacts from Capital Projects
Description ($ 000's)
BR # FTE 2011 2012 2013 2014
Total Net
Costs Area of Focus Strategic
Pillar
Mississauga Celebration Square Base Operating Impacts
271 8.2 512 354 0 0 866 Other
Parkland Growth 415 12.5 116 81 198 406 801 Maintaining a state of good repair for our infrastructure
Malton Community Centre Pool 312 1.8 (5) (14) (10) (10) (39) Maintaining a state of good repair for our infrastructure
Belong
Clarkson Community Centre Pool 319 5.0 (8) (29) (20) (10) (67) Maintaining a state of good repair for our infrastructure
Mississauga Valley Community Centre Therapy Pool
316 3.3 0 (18) 0 0 (18) Maintaining a state of good repair for our infrastructure
Total Operating Budget Impact 30.8 615 374 168 386 1,543
Note: Numbers may not balance due to rounding

Business Plan and Budget 2011-2014 G-19
9.0 Continuous Improvement Over the next four years Recreation and Parks will continue with various initiatives that are based on continuous improvement and have been highlighted in the 2011-2014 Business Plan and Budget. The division will focus on:
• Working with 35 older adult organizations across the city to engage them in executing the key outcomes of the Older Adult plan;
• Working with youth and youth based organizations across the city to implement the Youth Plan recommendations;
• Rationalize routes for winter maintenance and waste disposal to deliver Park services more efficiently;
• Utilize technology to speed the customer interaction process, improve communications and monitor customer satisfaction with services; and
• Continuously scan for opportunities to develop new programs supported by user fees and search for opportunities to introduce new processes that can provide efficiency (while delivering a similar service outcome).

G-20 Business Plan and Budget 2011-2014
Efficiencies
The following table illustrates reductions that are a result of conducting work quicker or in an improved manner which does not result in a change in service level. In some cases it represents an investment which will result in future savings or cost containment. It highlights cost efficiencies that are based on technological improvements and the opportunity for a continuous service review as the city workforce migrates to new opportunities and/ or retires. In addition, after review of the actual utility costs within the division over the last two years, a one- time cost reduction was warranted.
Efficiencies
Description ($ 000's) BR # FTE 2011 2012 2013 2014
Total Net
Costs Area of Focus Strategic
Pillar
Reduce Utility Budget for Recreation and Parks
288 0.0 (600) 0 0 0 (600) Continuous improvement
Reduce Office Supplies and Mileage Budget
285 0.0 (87) 0 0 0 (87) Continuous improvement
Reduce Cost of Active Mississauga Guide
216 0.0 (40) 0 0 0 (40) Continuous improvement
Outdoor Pool Operating Budget Reduction
315 0.0 (17) 0 0 0 (17) Maintaining a state of good repair for our infrastructure
Community Groups On-line Services
200 (1.0) 0 (66) 0 0 (66) Continuous improvement
Rental Contract Processing Automation
215 (0.5) 0 0 (10) 0 (10) Continuous improvement
Total Operating Budget Impact (1.5) (744) (66) (10) 0 (820)
Note: Numbers may not balance due to rounding

Business Plan and Budget 2011-2014 G-21
Recommended Program Reductions
Items captured in the tables below represent budget reductions or reductions to service levels recommended by staff. The tables highlight a number of areas that can offset the need for tax based funding.
An organization review will re-balance supply and demand of resources by allowing existing resource levels to shift to higher demand areas minimizing impacts to service levels. At the same time this will ensure effective and efficient work design.
Recommended Program Reductions
Description ($ 000's)
BR # FTE 2011 2012 2013 2014
Total Net
Costs Area of Focus Strategic
Pillar
Organization Review 227 (7.0) (303) (233) (23) (23) (582) Continuous improvement
Total Operating Budget Impact (7.0) (303) (233) (23) (23) (582)
Note: Numbers may not balance due to rounding

G-22 Business Plan and Budget 2011-2014
10.0 Proposed Changes
Growth Driven Service Costs
Description ($ 000's)
BR # FTE 2011 2012 2013 2014
Total Net
Costs Area of Focus Strategic
Pillar
Asset Management Program 476 3.0 64 141 85 0 290 Maintaining a state of good repair for our infrastructure
Total Operating Budget Impact 3.0 64 141 85 0 290
Note: Numbers may not balance due to rounding

Business Plan and Budget 2011-2014 G-23
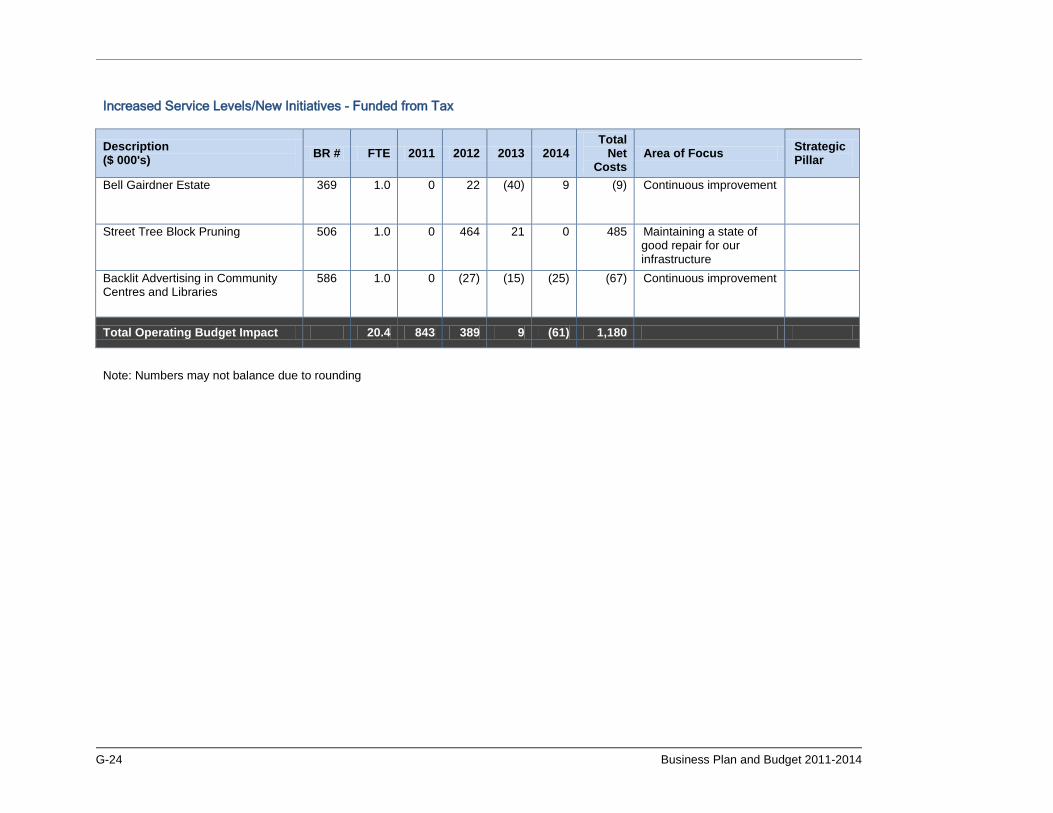
Increased Service Levels/New Initiatives – Funded from Tax
These changes are recommended and impact the ability to maintain our infrastructure, support a strategic pillar, or take advantage of an opportunity that will help moderate tax funding pressures. Full explanations of each initiative can be found within Volume 2 of the 2011-2014 Business Plan and Budget.
Increased Service Levels/New Initiatives - Funded from Tax
Description ($ 000's) BR # FTE 2011 2012 2013 2014
Total Net
Costs Area of Focus Strategic
Pillar
Mississauga Celebration Square Events and Programs
640 4.0 617 (50) (75) (100) 392 Other
Debris Management - Cooksville Creek
421 1.0 214 21 0 0 235 Maintaining a state of good repair for our infrastructure
Youth Plan 322 7.5 80 100 100 80 360 Delivering on initiatives within the Strategic Action Plan
Belong
Woodland Hazardous Tree Maintenance
229 0.0 50 50 0 0 100 Maintaining a state of good repair for our infrastructure
Digital Advertising in Community Centres and Libraries
567 1.0 (5) (10) (10) (25) (50) Continuous improvement
Dome Field at Hershey SportZone (Hershey #1)
629 2.9 (114) (268) 0 0 (382) Continuous improvement
Million Trees over Ten Years 225 1.0 0 87 28 0 115 Delivering on initiatives within the Strategic Action Plan
Green
G-24 Business Plan and Budget 2011-2014
Increased Service Levels/New Initiatives - Funded from Tax
Description ($ 000's) BR # FTE 2011 2012 2013 2014
Total Net
Costs Area of Focus Strategic
Pillar
Bell Gairdner Estate 369 1.0 0 22 (40) 9 (9) Continuous improvement
Street Tree Block Pruning 506 1.0 0 464 21 0 485 Maintaining a state of good repair for our infrastructure
Backlit Advertising in Community Centres and Libraries
586 1.0 0 (27) (15) (25) (67) Continuous improvement
Total Operating Budget Impact 20.4 843 389 9 (61) 1,180
Note: Numbers may not balance due to rounding
Business Plan and Budget 2011-2014 G-25
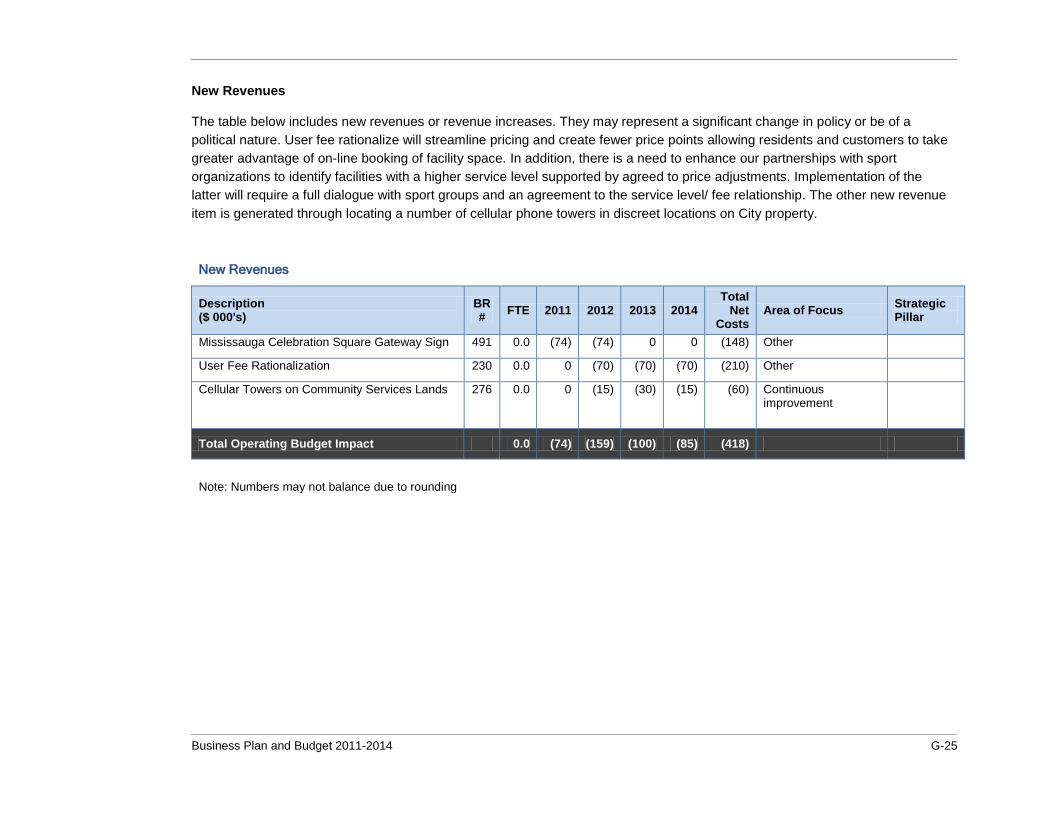
New Revenues
The table below includes new revenues or revenue increases. They may represent a significant change in policy or be of a political nature. User fee rationalize will streamline pricing and create fewer price points allowing residents and customers to take greater advantage of on-line booking of facility space. In addition, there is a need to enhance our partnerships with sport organizations to identify facilities with a higher service level supported by agreed to price adjustments. Implementation of the latter will require a full dialogue with sport groups and an agreement to the service level/ fee relationship. The other new revenue item is generated through locating a number of cellular phone towers in discreet locations on City property.
New Revenues
Description ($ 000's)
BR # FTE 2011 2012 2013 2014
Total Net
Costs Area of Focus Strategic
Pillar
Mississauga Celebration Square Gateway Sign 491 0.0 (74) (74) 0 0 (148) Other
User Fee Rationalization 230 0.0 0 (70) (70) (70) (210) Other
Cellular Towers on Community Services Lands 276 0.0 0 (15) (30) (15) (60) Continuous improvement
Total Operating Budget Impact 0.0 (74) (159) (100) (85) (418)
Note: Numbers may not balance due to rounding

G-26 Business Plan and Budget 2011-2014
2011-2014 Net Capital Detail Changes
The table below/above lists newly identified capital projects in 2011-2014.
2011 - 2014 Net Capital Detail Changes
Program Expenditures ($ 000's)
BR # 2011 Budget
2012 Budget
2013 Forecast
2014 Forecast
Post 2014
Forecast Total
($) Area of Focus Strategic Pillar
P-389 Not Yet Named (Bell-Gairdner) Main & Carriage House
369 950 950 Continuous Improvement
Belong
Community Groups On-line Services
200 75 25 100 Continuous Improvement
Connect
CLASS On-line Service Modules
210 59 59 Continuous Improvement
Connect
Equipment for Urban Forestry Crew
219 320 320 Continuous Improvement
Green
Mississauga Valley Community Centre Therapy Pool
316 1,150 1,150 Delivering on Initiatives within the Strategic Action Plan
Belong
Meadowvale Community Centre & Library Renovation
412 (6,471) (3,029) 6,488 3,012 0 Delivering on Initiatives within the Strategic Action Plan
Belong
Street Tree Replacement
221 600 600 600 600 3,600 6,000 Maintaining a state of good repair for our infrastructure
Business Plan and Budget 2011-2014 G-27
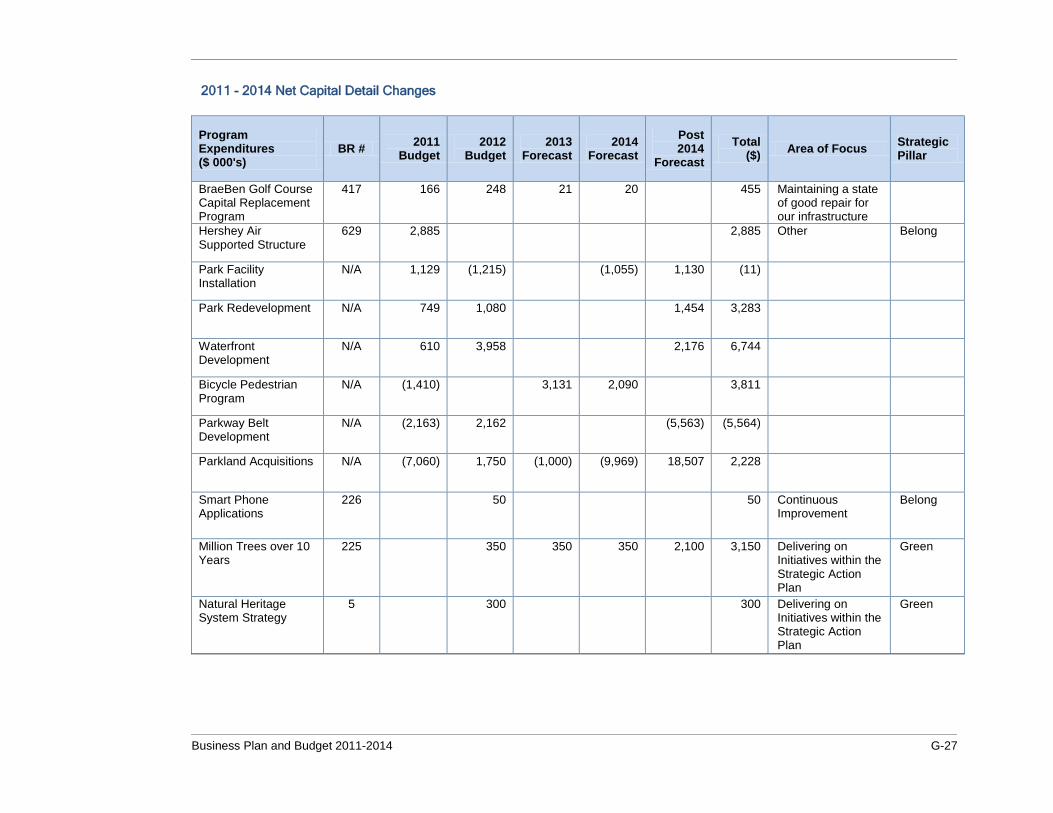
2011 - 2014 Net Capital Detail Changes
Program Expenditures ($ 000's)
BR # 2011 Budget
2012 Budget
2013 Forecast
2014 Forecast
Post 2014
Forecast Total
($) Area of Focus Strategic Pillar
BraeBen Golf Course Capital Replacement Program
417 166 248 21 20 455 Maintaining a state of good repair for our infrastructure
Hershey Air Supported Structure
629 2,885 2,885 Other Belong
Park Facility Installation
N/A 1,129 (1,215) (1,055) 1,130 (11)
Park Redevelopment N/A 749 1,080 1,454 3,283
Waterfront Development
N/A 610 3,958 2,176 6,744
Bicycle Pedestrian Program
N/A (1,410) 3,131 2,090 3,811
Parkway Belt Development
N/A (2,163) 2,162 (5,563) (5,564)
Parkland Acquisitions N/A (7,060) 1,750 (1,000) (9,969) 18,507 2,228
Smart Phone Applications
226 50 50 Continuous Improvement
Belong
Million Trees over 10 Years
225 350 350 350 2,100 3,150 Delivering on Initiatives within the Strategic Action Plan
Green
Natural Heritage System Strategy
5 300 300 Delivering on Initiatives within the Strategic Action Plan
Green

G-28 Business Plan and Budget 2011-2014
2011 - 2014 Net Capital Detail Changes
Program Expenditures ($ 000's)
BR # 2011 Budget
2012 Budget
2013 Forecast
2014 Forecast
Post 2014
Forecast Total
($) Area of Focus Strategic Pillar
Asset Management Program
476 100 100 200 Maintaining a state of good repair for our infrastructure
Cooksville Creek South Trail Reconstruction
N/A 550 550
Self Service Kiosks 187 100 100 200 Continuous Improvement
Belong
Hershey Centre POS Replacement
223 150 150 300 Maintaining a state of good repair for our infrastructure
Wall of Fame on Celebration Square
520 100 100 Maintaining a state of good repair for our infrastructure
River Grove Community Centre Renovation
N/A (6,500) 5,900 600 0
North West Community Centre as Partnership
414 1,400 12,240 13,640 Delivering on Initiatives within the Strategic Action Plan
Belong
Riverwood Park Development
N/A (489) (3,224) (3,713)
Parkland Development
N/A (2,381) 4,125 1,744
City Centre Development
N/A (3,352) 7,038 3,686
Total Net Expenditures (8,411) 6,929 3,540 (3,624) 44,183 42,617
Note: Numbers may not balance due to rounding.

Business Plan and Budget 2011-2014 G-29
Required Resources
11.0 Human Resources Recreation and Parks human resource requirements adjust to the ebb and flow of market demand, the need for infrastructure maintenance and the impact of growth.
Recreation and Parks strives to address its need for human resources through participation in a variety of programs that provide resources with a minimal net cost. The ability to achieve a zero based net cost impact is determined by the service.
Quality Assurance and Staff Training
During 2009 and into 2010 the Division completed a system-wide program standards and procedures review. This effort was aimed at providing quality assurance to individuals and organizations utilizing our facilities and services.
It also provided the opportunity for internal assessment of staff training needs and allows staff to plan and execute training modules. For example, in 2009 Training and Development working with Administrative / Customer Service staff at recreation facilities identified, planned and delivered new customer service training modules for this work group. Recreation and Parks internal training processes have been recognized by Parks and Recreation Ontario (PRO) and staff have done a number of presentations at Provincial conferences.
Volunteer Contributions
In addition, Recreation and Parks encourages volunteer contributions to activities and community events. These contributions help connect our communities and build community pride – supporting the “belong” strategic pillar. In
2009 just under 800 volunteers contributed 36,000 hours to Recreation and Park programs with an estimated value of $337,000.
Changes forecast during 2011 – 2014 business plan are being driven by:
Parkland Growth
Park staff maintains over 6,600 acres of parks and open space. Parkland growth is forecast in each year of the business plan. New parkland requires maintenance and upkeep. Staff review service levels on a regular basis and seek efficiencies and implement alternatives where possible. Sport fields, waterfront parks, green space and wood lots have a cost impact. These amenities also provide a host of benefits to residents involving both active and passive recreation opportunities that have strong links to strategic outcomes that the City is striving to achieve.
Mississauga’s Celebration Square
The development of Celebration Square is a $40 million capital project that is the catalyst for future Downtown 21 development. The range of activity and events at Celebration Square requires an investment of resources to support the infrastructure renewal and the activities.
Infrastructure Re-development
A number of recreation facilities are going through renovations based on the need to re-invest in aging infrastructure (outdoor pools) and to provide program delivery aligned to demographic changes (therapy pools). This investment increases the need for resources, which for the most part, is offset by user fees.

G-30 Business Plan and Budget 2011-2014
Human Resources Requirement
Description Total FTE
2010 Restated Complement 1,092.0
2011 Budget Requirement 1,117.4
2012 Budget Requirement 1,120.5
2013 Forecast 1,122.5
2014 Forecast 1,144.7
Human Resources Requirement Distribution
Program 2010 2011 2012 2013 2014
Recreation Facilities and Programs 617.5 622.8 619.1 617.1 632.6
Divisional Support Services 72.0 79.0 79.3 78.8 79.5
Boulevards and Forestry 42.0 43.0 45.0 45.0 45.0
Golf/Marinas and Hershey Centre 71.0 77.1 78.9 78.9 78.9
Parks Maintenance 255.5 262.0 265.2 268.7 274.7
Parks Planning and Development 34.0 33.5 33.0 34.0 34.0
Total Service Distribution 1,092.0 1,117.4 1,120.5 1,122.5 1,144.7

Business Plan and Budget 2011-2014 G-31
12.0 Technology The current technologies, tools, and skills are focused on customer service for registration and facility booking through the CLASS software application. New CLASS modules will provide new and enhanced internet capabilities including; online rental bookings, improved membership services and better platform to build a management decision support system (DSS).
In addition, online service and applications will support volunteer group applications, special event permits and the grant application process.
As previously mentioned the division has migrated to dynamic one to one email marketing which will become increasingly sophisticated, is aware of the potential of smart phone applications and will migrate to digital media and internet based social networking communication channels to connect with residents.
Parks is in the process of implementing a work order system using Hansen 8.0. This application will simplify current paper work and provide increased process automation for work orders. Parks Development and Business Services are working with other Divisions across the organization to implement an asset management program that will improve cost forecasts, prioritize investments and streamline reporting.
Malton Community Centre lobby
G-32 Business Plan and Budget 2011-2014
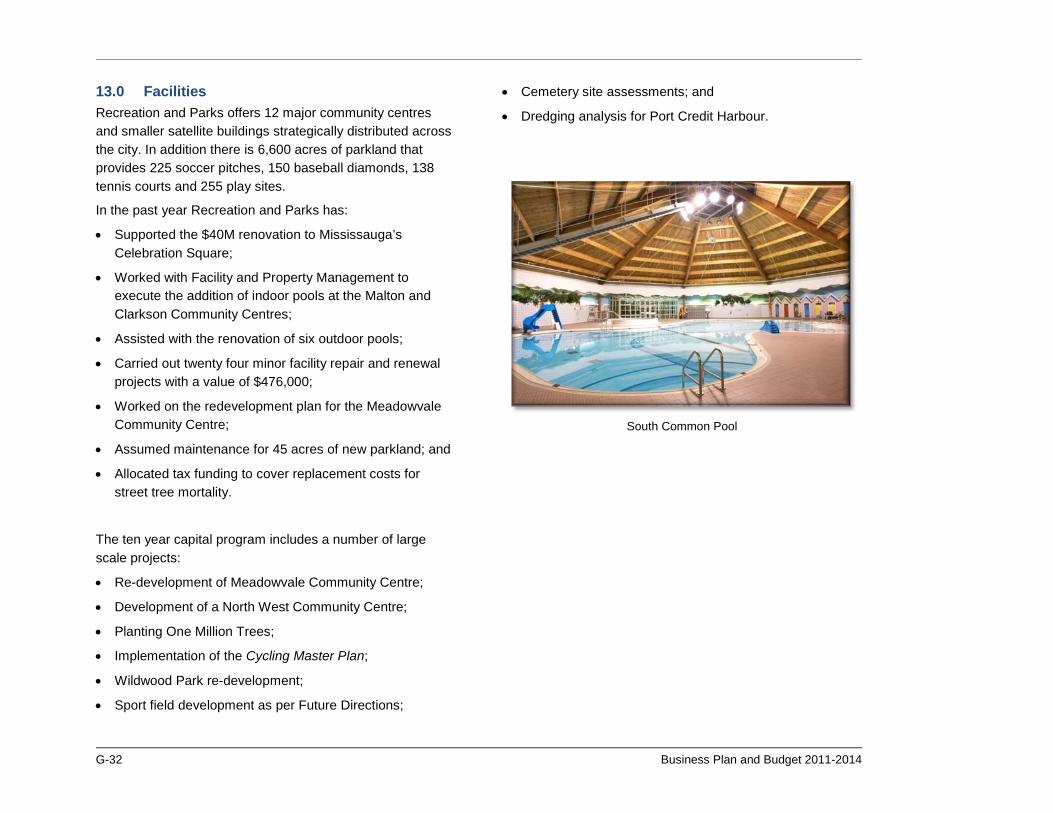
13.0 Facilities Recreation and Parks offers 12 major community centres and smaller satellite buildings strategically distributed across the city. In addition there is 6,600 acres of parkland that provides 225 soccer pitches, 150 baseball diamonds, 138 tennis courts and 255 play sites.
In the past year Recreation and Parks has:
• Supported the $40M renovation to Mississauga’s Celebration Square;
• Worked with Facility and Property Management to execute the addition of indoor pools at the Malton and Clarkson Community Centres;
• Assisted with the renovation of six outdoor pools;
• Carried out twenty four minor facility repair and renewal projects with a value of $476,000;
• Worked on the redevelopment plan for the Meadowvale Community Centre;
• Assumed maintenance for 45 acres of new parkland; and
• Allocated tax funding to cover replacement costs for street tree mortality.
The ten year capital program includes a number of large scale projects:
• Re-development of Meadowvale Community Centre;
• Development of a North West Community Centre;
• Planting One Million Trees;
• Implementation of the Cycling Master Plan;
• Wildwood Park re-development;
• Sport field development as per Future Directions;
• Cemetery site assessments; and
• Dredging analysis for Port Credit Harbour.
South Common Pool

Business Plan and Budget 2011-2014 G-33
14.0 Budget
4 Year Budget and Forecast
($ 000's) 2010 Budget 2011 Budget 2012 Budget 2013 Forecast 2014 Forecast
Labour Costs 58,764 61,618 63,625 65,967 69,239
Other Operating Expenses 29,706 30,707 32,176 32,567 33,303
Total Costs 88,469 92,325 95,801 98,534 102,542
Total Revenues (47,719) (48,597) (49,236) (49,621) (51,679)
Net Cost 40,750 43,729 46,565 48,913 50,863
Allocations 3,279 3,412 3,564 3,704 3,802
Net of Allocations 44,029 47,141 50,129 52,617 54,664
Note: Numbers may not balance due to rounding.
Financial Plan
2011 - 2014 Net Operating Budget by Program
Program Expenditures ($ 000's)
2011 Budget
2012 Budget
2013 Forecast
2014 Forecast
Recreation Facilities and Programs 11,120 12,067 12,895 13,639
Divisional Support Services 10,457 10,442 10,676 10,764
Boulevards and Forestry 5,841 6,651 6,858 6,968
Golf/Marinas and Hershey Centre (1,036) (1,098) (916) (767)
Parks Maintenance 17,786 18,748 19,497 20,309
Parks Planning and Development 2,972 3,319 3,608 3,752
Net Budget Impact 47,141 50,129 52,617 54,664
Note: Numbers may not balance due to rounding.

G-34 Business Plan and Budget 2011-2014
2011 Net Budget by Program
Program Expenditures ($ 000's)
2009 Actual
2010 Budget
2011 Base
Budget
Base Change
%
2011 Program Changes
2011 Request
2011 Change
2011 Change
(%)
Recreation Facilities and Programs 9,830 10,324 11,800 14.3 (680) 11,120 796 7.7
Divisional Support Services 9,792 9,570 9,683 1.2 773 10,457 886 9.3
Boulevards and Forestry 5,059 5,210 5,587 7.2 254 5,841 631 12.1
Golf/Marinas and Hershey Centre (967) (986) (771) 21.8 (264) (1,036) (49) (5.0)
Parks Maintenance 15,714 17,050 17,532 2.8 254 17,786 736 4.3
Parks Planning and Development 2,201 2,861 2,908 1.6 64 2,972 111 3.9
Net Budget Impact 41,628 44,029 46,740 6.2% 401 47,141 3,112 7.1%
Note: Numbers may not balance due to rounding.
Business Plan and Budget 2011-2014 G-35
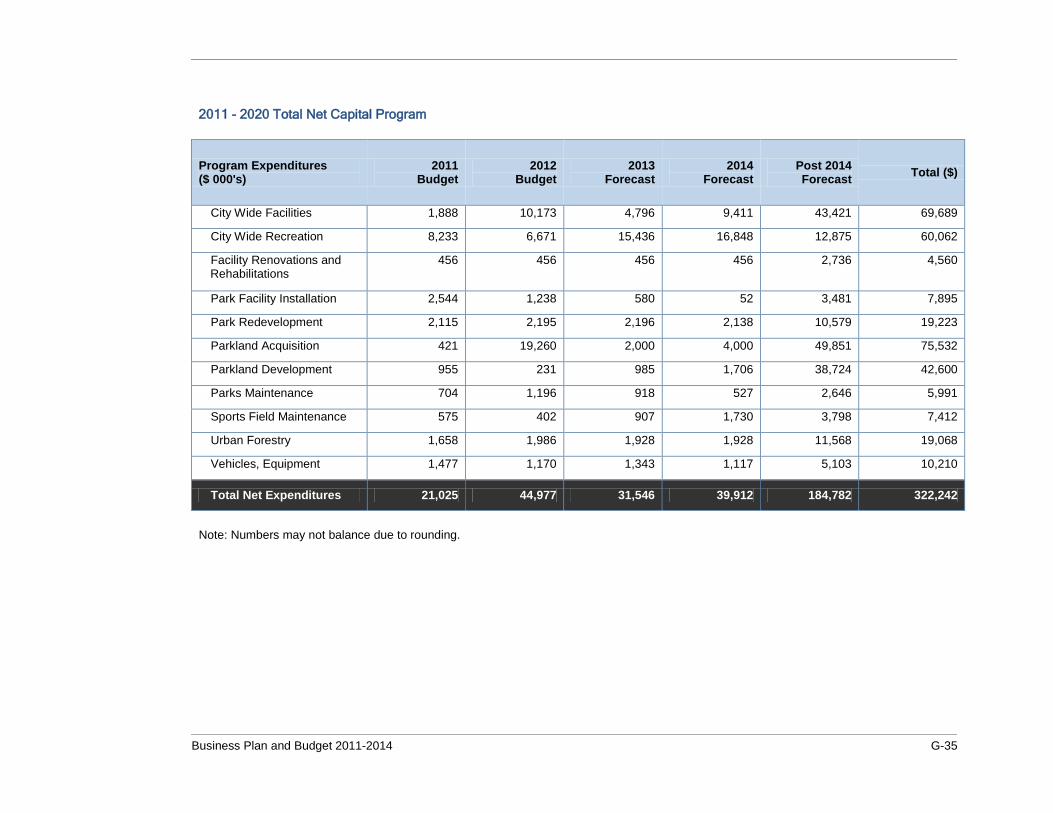
2011 - 2020 Total Net Capital Program
Program Expenditures ($ 000's)
2011 Budget
2012 Budget
2013 Forecast
2014 Forecast
Post 2014 Forecast Total ($)
City Wide Facilities 1,888 10,173 4,796 9,411 43,421 69,689
City Wide Recreation 8,233 6,671 15,436 16,848 12,875 60,062
Facility Renovations and Rehabilitations
456 456 456 456 2,736 4,560
Park Facility Installation 2,544 1,238 580 52 3,481 7,895
Park Redevelopment 2,115 2,195 2,196 2,138 10,579 19,223
Parkland Acquisition 421 19,260 2,000 4,000 49,851 75,532
Parkland Development 955 231 985 1,706 38,724 42,600
Parks Maintenance 704 1,196 918 527 2,646 5,991
Sports Field Maintenance 575 402 907 1,730 3,798 7,412
Urban Forestry 1,658 1,986 1,928 1,928 11,568 19,068
Vehicles, Equipment 1,477 1,170 1,343 1,117 5,103 10,210
Total Net Expenditures 21,025 44,977 31,546 39,912 184,782 322,242
Note: Numbers may not balance due to rounding.
G-36 Business Plan and Budget 2011-2014
Performance Measures
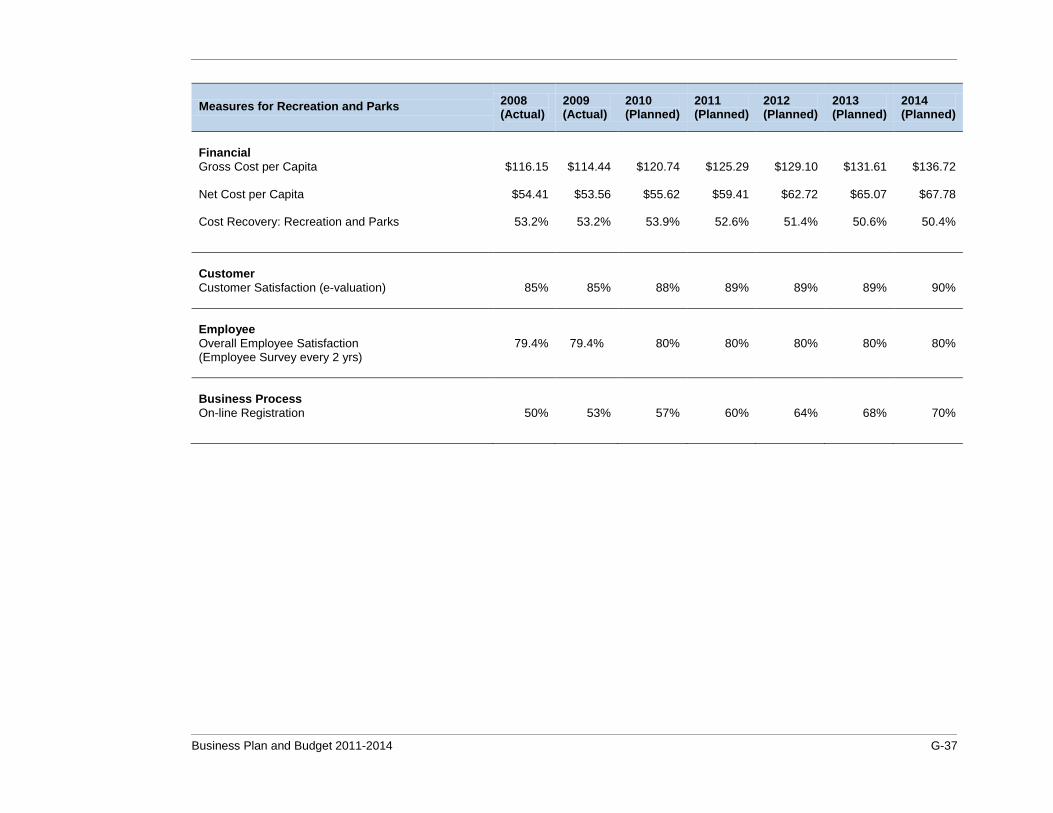
15.0 Balanced Scorecard A Balanced Scorecard identifies measures for four key areas for an organization’s performance: Financial; Customers; Employees and Business Processes.
By paying attention to all four areas an organization can retain balance to its performance and know that it is moving towards the attainment of its goals.
About the Measures for Recreation and Parks Financial Measures
Gross Cost per Capita is the total cost of Recreation and Parks [including Park Planning and Development] divided by the total population. It indicates the cost of service before user fees and other revenue streams generated by the service. The park maintenance cost per capita was 13 percent lower than next best benchmarked city.
Net Cost per Capita is the net cost of Recreation and Parks [including Park Planning and Development]. Net cost is calculated by deducting gross revenues from gross expenditures and dividing the remainder by the total population. Net cost is an important measure as Recreation and Parks services are supported by a combination of user fees and tax based funding. The net cost represents the tax based funding supporting the services on an annual basis. This service was delivered with lowest net cost per capita – 31 percent lower than next best benchmarked city.
Cost Recovery is the percentage of gross costs recovered through user fees and other revenue sources other than the tax base. It is a financial efficiency measure that indicates the balance between user pay and tax supported funding for
the service. At 53.2 percent cost recovery, Mississauga is 25 percent higher than the average. Cost recovery includes utility charges.
Customer Measures
Customer Satisfaction is measured through e-valuation survey of program participants. Participants in Recreation and Parks programs are asked to complete an on line survey. The survey information is automatically tabulated and the results are used to identify participant satisfaction, look for areas of improvement and keep in touch with customer ideas for new program opportunities.
Employee Measures
Employee Satisfaction is the key to achieving success in a service based organization is grounded in the approach, attitude and outputs of employees. The City understands the benefit being recognized as an “employer of choice”. Employee satisfaction measurement is part of the city culture and provides employees with the opportunity to provide insight and direction for future opportunities. The results are based on the bi-annual Employee Engagement Survey conducted by Metrics@Work.
Business Process Measures
Process Improvements in general can increase effectiveness by reducing the number of steps in a process translating to better service for the customer. Process improvements can also reduce costs, creating an efficiency. On-line registration is highlighted within the Recreation and Parks balanced scorecard as it allows customer to register from any “connected” location saving a trip to the local community centre and reducing the cost of mailing and paper to for a registration confirmation.
Business Plan and Budget 2011-2014 G-37
Measures for Recreation and Parks 2008 (Actual)
2009 (Actual)
2010 (Planned)
2011 (Planned)
2012 (Planned)
2013 (Planned)
2014 (Planned)
Financial Gross Cost per Capita Net Cost per Capita
$116.15
$54.41
$114.44
$53.56
$120.74
$55.62
$125.29
$59.41
$129.10
$62.72
$131.61
$65.07
$136.72
$67.78
Cost Recovery: Recreation and Parks 53.2% 53.2% 53.9% 52.6% 51.4% 50.6% 50.4%
Customer
Customer Satisfaction (e-valuation)
85% 85% 88% 89% 89% 89% 90%
Employee
Overall Employee Satisfaction (Employee Survey every 2 yrs)
79.4% 79.4% 80% 80% 80% 80% 80%
Business Process
On-line Registration 50% 53% 57% 60% 64% 68% 70%
G-38 Business Plan and Budget 2011-2014