pitchbook us template - business standard
TRANSCRIPT

GMR Infrastructure Limited
September 25, 2020
BSE Limited, Phiroze Jeejeebhoy Towers,
Dalal Street, Mumbai 400001.
Dear Sir/Madam,
Ref: Investor Presentation
Corporate Office: New Udaan Bhawan, Opp. Terminal-3 Indira Gandhi International Airport New Delhi-11 0037 CIN: L45203MH1996PLC281138 T +91 11 42532600 F +91 11 47197181 W www.gmrgroup.in E [email protected]
National Stock Exchange of India Ltd. Exchange Plaza, Plot no. C/1, G Block, Bandra-Kurla Complex Sandra (E) Mumbai - 400051.
Sub: Intimation under SEBI (Listing Obligations and Disclosure Requirements) Regulations, 2015
Further to our intimation dated August 28, 2020 and August 29, 2020, please find enclosed herewith an updated presentation.
Please take the same on record.
Thanking you,
a Company Secretary &
Complaince Officer
Airports 1 Energy I Transportation I Urban Infrastructure I Foundation
Registered Office: Plot No. C-31, G Block 7th Floor, Naman Centre Sandra Kurla Complex (Opp. Dena Bank) Bandra(East). Mumbai-400 051

0
Investor Presentation
Non-Deal Roadshow
September 2020

1
DISCLAIMER
All statements, graphics, data, tables, charts, logos, names, figures and all other
information (“Contents”) contained in this document (“Material”) are prepared by
GMR Infrastructure Limited (“Company”) solely for the purpose of this Material and
not otherwise. This Material is prepared as on the date mentioned herein which is
solely intended for reporting the developments of the Company to the investors of
equity shares in the Company as on such date, the Contents of which are subject to
change without any prior notice. The Material is based upon information that we
consider reliable, but we do not represent that it is accurate or complete.
Neither the Company, its subsidiaries and associate companies (“GMR Group”), nor
any director, member, manager, officer, advisor, auditor and other persons
(“Representatives”) of the Company or the GMR Group provide any representation
or warranties as to the correctness, accuracy or completeness of the Contents and
this Material. It is not the intention of the Company to provide a complete or
comprehensive analysis or prospects of the financial or other information within the
Contents and no reliance should be placed on the fairness on the same as this
Material has not been independently verified by any person.
NONE OF THE COMPANY, THE GMR GROUP AND THE REPRESENTATIVES
OF THE COMPANY AND THE GMR GROUP ACCEPT ANY LIABILITY
WHATSOEVER FROM ANY LOSS OR DAMAGE HOWSOEVER ARISING FROM
ANY CONTENTS OR OTHERWISE ARISING OUT OF OR IN CONNECTION
WITH THIS MATERIAL.
This Material is published and available on the Company’s website
www.gmrgroup.in which is subject to the laws of India, and is soley for information
purposes only and should not be reproduced, retransmitted, republished, quoted or
distributed to any other person whether in whole or in part or for any other purpose
or otherwise.
Any reproduction, retransmission, republishing or distribution of this Material or the
Contents thereof in certain jurisdictions may be restricted by law and persons who
come into possession of this Material should observe such laws and restrictions if
any.
This Material and any discussions which follows may contain ‘forward looking
statements’ relating to the Company and the GMR Group and may include
statements relating to future results of operation, financial condition, business
prospects, plans and objectives, are based on the current beliefs, assumptions,
expectations, estimates, and projections of the directors and management of the
Company about the business, industry and markets in which the Company and the
GMR Group operates and such statements are not guarantees of future
performance, and are subject to known and unknown risks, uncertainties, and other
factors, some of which are beyond the Company’s or the GMR Group’s control and
difficult to predict, that could cause actual results, performance or achievements to
differ materially from those in the forward looking statements. Such statements are
not, and should not be construed, as a representation as to future performance or
achievements of the Company or the GMR Group. In particular, such statements
should not be regarded as a projection of future performance of the Company or the
GMR Group. It should be noted that the actual performance or achievements of the
Company and the GMR Group may vary significantly from such statements.
Forward-looking statements are not predictions and may be subject to change
without notice.
This Material is not and does not constitute any offer or invitation or
recommendation or advice to purchase, acquire or subscribe to shares and other
securities of the Company or the GMR Group and no part of this Material shall form
the basis of or part of any contract, commitment or investment decision nor be relied
upon as a basis for entering into any contract, commitment or investment decision in
relation thereto. Recipients should seek their own professional advice including from
legal, tax or investment advisors before making an investment decision in shares or
other securities of the Company or the GMR Group. Remember, investments are
subject to risks including the risk of loss of the initial principal amount invested; past
performance is not indicative of future results.
This presentation is not a prospectus, a statement in lieu of a prospectus, an
offering circular, an advertisement or an offer document under the Companies Act,
2013, and the rules made thereunder, as amended, the Securities and Exchange
Board of India (Issue of Capital and Disclosure Requirements) Regulations, 2018,
as amended, or any other applicable law in India.
REGULATORY AUTHORITIES IN THE UNITED STATES OF AMERICA, INDIA,
OR OTHER JURISDICTIONS, INCLUDING THE SECURITIES AND EXCHANGE
COMMISSION AND THE SECURITIES AND EXCHANGE BOARD OF INDIA
(“SEBI”), HAVE NEITHER APPROVED OR DISAPPROVED THIS MATERIAL OR
DETERMINED IF THIS MATERIAL IS TRUTHFUL OR COMPLETE. ANY
REPRESENTATION TO THE CONTRARY MAY CONSTITUTE A CRIMINAL
OFFENSE.

2
Table of Contents
Particulars Pg. No.
Group Overview 3-5
Business Update 6-10
Airports Business 11-25
Other Businesses 26-29
Managing COVID Impact 30-32
Key Takeaways 33-34
Annexures 35-44

Group Overview

4
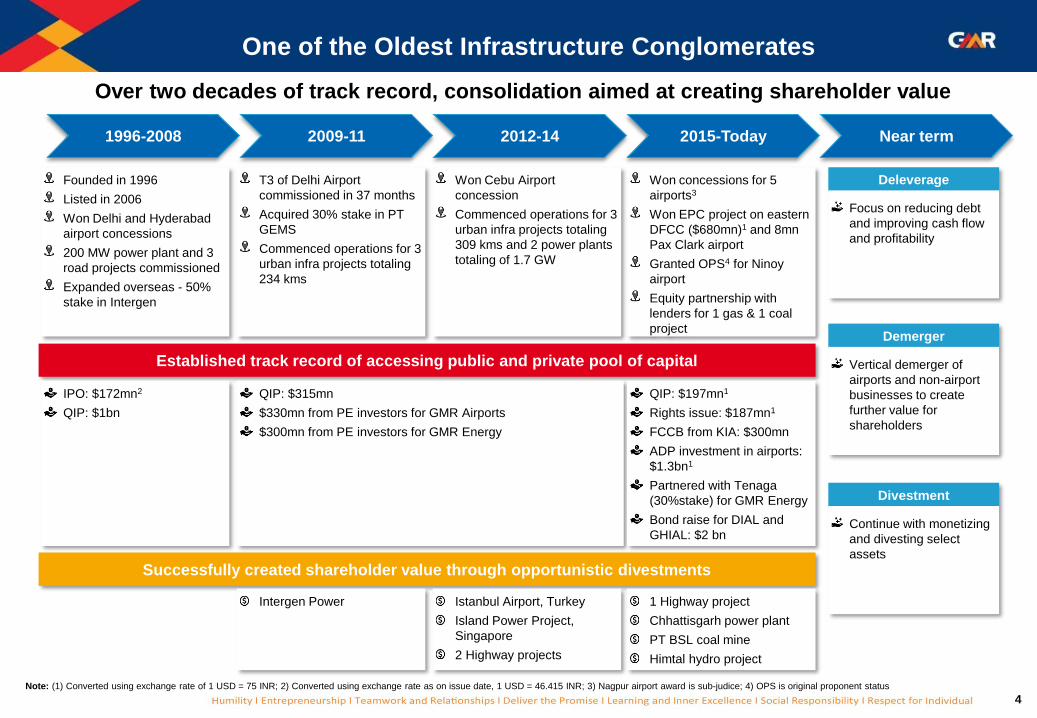
One of the Oldest Infrastructure Conglomerates
Over two decades of track record, consolidation aimed at creating shareholder value
Note: (1) Converted using exchange rate of 1 USD = 75 INR; 2) Converted using exchange rate as on issue date, 1 USD = 46.415 INR; 3) Nagpur airport award is sub-judice; 4) OPS is original proponent status
1996-2008 2009-11 2012-14 2015-Today Near term
Established track record of accessing public and private pool of capital
Successfully created shareholder value through opportunistic divestments
Founded in 1996
Listed in 2006
Won Delhi and Hyderabad
airport concessions
200 MW power plant and 3
road projects commissioned
Expanded overseas - 50%
stake in Intergen
T3 of Delhi Airport
commissioned in 37 months
Acquired 30% stake in PT
GEMS
Commenced operations for 3
urban infra projects totaling
234 kms
Won Cebu Airport
concession
Commenced operations for 3
urban infra projects totaling
309 kms and 2 power plants
totaling of 1.7 GW
Won concessions for 5
airports3
Won EPC project on eastern
DFCC ($680mn)1 and 8mn
Pax Clark airport
Granted OPS4 for Ninoy
airport
Equity partnership with
lenders for 1 gas & 1 coal
project
IPO: $172mn2
QIP: $1bn
QIP: $315mn
$330mn from PE investors for GMR Airports
$300mn from PE investors for GMR Energy
QIP: $197mn1
Rights issue: $187mn1
FCCB from KIA: $300mn
ADP investment in airports:
$1.3bn1
Partnered with Tenaga
(30%stake) for GMR Energy
Bond raise for DIAL and
GHIAL: $2 bn
Intergen Power Istanbul Airport, Turkey
Island Power Project,
Singapore
2 Highway projects
1 Highway project
Chhattisgarh power plant
PT BSL coal mine
Himtal hydro project
Deleverage
Focus on reducing debt
and improving cash flow
and profitability
Demerger
Vertical demerger of
airports and non-airport
businesses to create
further value for
shareholders
Divestment
Continue with monetizing
and divesting select
assets

5
Leading Airport Focused Infrastructure Player
65.6%
12.3%
22.1%
1) Includes Barge Plant (220 MW) for which Sale and Purchase Agreement for divestment is signed; 2) Revenue for GMR Energy Limited is not consolidated in FY20 financials hence, revenue for ‘power’ segment shown above
includes mainly power trading and mining operations
Airports
Power
Transport &
Urban Infra
Amongst the LargestPrivate airport developers in the
world, largest in India
7 nos.Of airport assets under operations or
various stages of development
300 mmRated capacity across portfolio of
airport assets
179 mmCurrent capacity: 94 mm under
operations
101 mmPassengers handled in FY20 across
key gateway airports
~2,240 acresOf land with strong RE development
potential
Strategic PartnershipsWith marquee operators at platform
and asset level
IntegratedAirport development and operation
capabilities
4.5 GWOf total generation
capacity, over 2.8
GW commissioned
1bn Tons+Coal reserves, total
resources ~2.9 bn tons
Marquee Investors• Temasek Holdings Pte
Limited
• Tenaga Nasional Bhd.
• IDFC Alternatives
4 nos.Of highway projects
covering ~350 km
13,000 acresOf land at strategic
locations, integrated
industrial development
417 kmOf railway stretch
getting constructed
FY20
Revenue
Split

Business Update
7
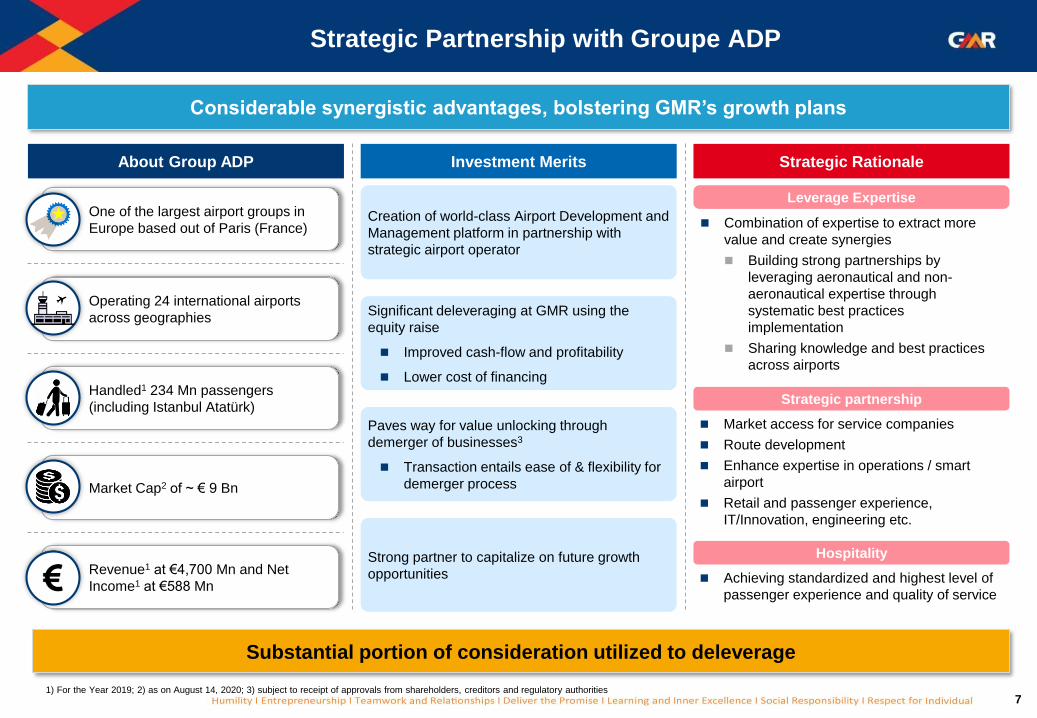
One of the largest airport groups in
Europe based out of Paris (France)
Operating 24 international airports
across geographies
Handled1 234 Mn passengers
(including Istanbul Atatürk)
Market Cap2 of ~ € 9 Bn
Revenue1 at €4,700 Mn and Net
Income1 at €588 Mn
Strategic Partnership with Groupe ADP
Considerable synergistic advantages, bolstering GMR’s growth plans
Substantial portion of consideration utilized to deleverage
About Group ADP Investment Merits Strategic Rationale
Creation of world-class Airport Development and
Management platform in partnership with
strategic airport operator
◼ Combination of expertise to extract more
value and create synergies
◼ Building strong partnerships by
leveraging aeronautical and non-
aeronautical expertise through
systematic best practices
implementation
◼ Sharing knowledge and best practices
across airports
Leverage Expertise
◼ Market access for service companies
◼ Route development
◼ Enhance expertise in operations / smart
airport
◼ Retail and passenger experience,
IT/Innovation, engineering etc.
Strategic partnership
◼ Achieving standardized and highest level of
passenger experience and quality of service
Hospitality
Significant deleveraging at GMR using the
equity raise
◼ Improved cash-flow and profitability
◼ Lower cost of financing
Paves way for value unlocking through
demerger of businesses3
◼ Transaction entails ease of & flexibility for
demerger process
Strong partner to capitalize on future growth
opportunities
1) For the Year 2019; 2) as on August 14, 2020; 3) subject to receipt of approvals from shareholders, creditors and regulatory authorities

8
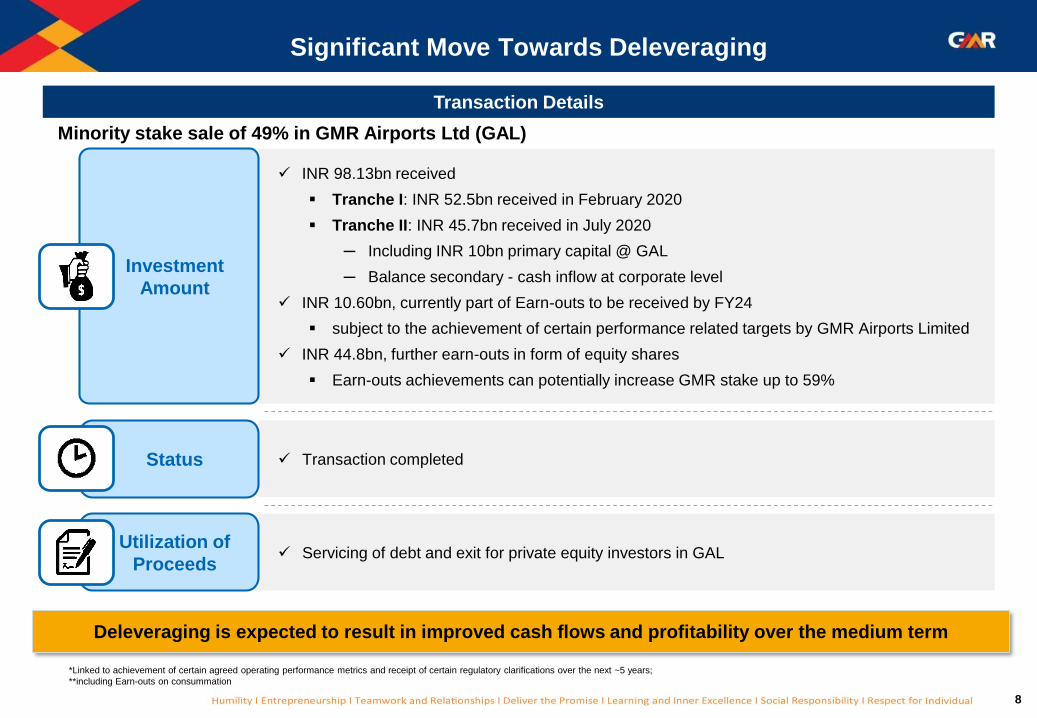
Significant Move Towards Deleveraging
*Linked to achievement of certain agreed operating performance metrics and receipt of certain regulatory clarifications over the next ~5 years;
**including Earn-outs on consummation
Deleveraging is expected to result in improved cash flows and profitability over the medium term
Transaction Details
Minority stake sale of 49% in GMR Airports Ltd (GAL)
✓ INR 98.13bn received
▪ Tranche I: INR 52.5bn received in February 2020
▪ Tranche II: INR 45.7bn received in July 2020
─ Including INR 10bn primary capital @ GAL
─ Balance secondary - cash inflow at corporate level
✓ INR 10.60bn, currently part of Earn-outs to be received by FY24
▪ subject to the achievement of certain performance related targets by GMR Airports Limited
✓ INR 44.8bn, further earn-outs in form of equity shares
▪ Earn-outs achievements can potentially increase GMR stake up to 59%
✓ Transaction completed
✓ Servicing of debt and exit for private equity investors in GAL
Investment
Amount
Status
Utilization of
Proceeds

9
• Vertical split demerger of the Non-Airport Business of
GIL1 into GPUIL1 as a going concern
Rationale for Demerger
Business Separation to Unlock Value for Shareholders
Note: 1) GIL: GMR Infrastructure Limited, GPUIL: GMR Power and Urban Infra Limited, GPIL: GMR Power Infra Limited 2) The date on which the undertakings shall vest in the respective resulting
companies 3) Unaudited pro forma Condensed Consolidated Financial Information has been compiled by management to illustrate the impact of the proposed demerger of the Non-airport business of the
Group into GPUIL, subsidiary of the GIL on the Group’s Balance Sheet and Profit & Loss Account
The Scheme of Arrangement has been filed with Stock Exchange and is subject to necessary approvals from
shareholders, creditors and regulatory authorities
◼ Value unlocking of Airport & Non-Airport
businesses
◼ Simplification of the Corporate Holding
Structure
◼ Enable both Airport & Non-Airport businesses
to chart out their respective growth plan
independently
◼ Multiple platforms to raise fund to grow
respective businesses – both from private &
public market
GMR Infrastructure
LimitedKey Highlights of Scheme of Arrangement
• Mirror shareholding of GIL in GPUIL with all existing
shareholders of GIL becoming shareholder of GPUIL
in same proportion
• Issue of 1 additional share of Rs.5/- each of GPUIL for
every 10 shares in GIL of Rs.1/- each as on the record
date
• Post the Scheme, GIL to emerge as India's Only Pure-
Play Listed Airports Company
• Amalgamation of GPIL1 with GIL as a step preceding
demerger
• Appointed date2 fixed at April 1, 2021
GMR Power and
Urban Infra Limited
Airport Non-Airport
Pro Forma Financials3
Click to View

10
Airport53%
Energy10%
Highways10%
Others1%
Corporate (Inc. debt for PE Exit)
26%
Visible Path to Deleveraging
Divestment Initiatives
Power
Business
⚫ Cash flow from thermal assets sufficient to service debt,
⚫ Strong prospects for divestment of thermal assets given improved
performance
⚫ Monetisation of Barge Plant – SPA3 signed, partial consideration
received
Port &
Industrial
Land
⚫ Land at strategic industrial locations to benefit from manufacturing
dislocation from China
⚫ Total land—10,500 acre; significant potential to unlock large latent
value
Highways
⚫ Debt to be pared from favourable judgment on significant
arbitration claim (Hyderabad-Vijayawada and Chennai ORR4)
⚫ Monetization to gain momentum post arbitration claim settlement
Airports
⚫ Recent capital raise to help largely aimed at deleveraging
⚫ Stable assets to generate robust cash flows towards servicing of
existing debt
GMR Consolidated Debt
321.0 58.0
263.0
Gross Debt Cash &equivalents
Net Debt
Gross & Net Debt (INR bn) ^
Net Debt (Sector-wise) ^
Note : 1) FCCB not considered in debt, 2) Certain loans part of Energy and Others segment till Mar’19 are reclassified as Corporate Debt, 3) SPA – Sale and Purchase Agreement ̂As on June 2020
4) Government of Tamil Nadu has challenged the award in Madras High Court
Coal Mines
(Indonesia)⚫ To re-start the process of divestment once coal prices stabiles
Plan to divest select assets across businesses

Airports Vertical

12
One of the World’s Leading Integrated Airport Platforms
India’s Largest Airport Operator
Note: *Private Operator (Government holding <50%)
1. Based on 2037 passenger forecast by IATA
2. Delhi, Hyderabad and Cebu LTM (Apr 2019-Mar 2020) passenger data; Nagpur airport award is sub-judice.
3. Only for India
4. As of Jan 2020 through Ministry of Tourism website
5. Includes DIAL (230 acres), GHIAL (1,463 acres), Goa (232 acres), Bhogapuram (294 acres), Cebu (11 acres),Greece (~ 10 acres).
Wide range of capabilities and services across the entire airport value chain; with demonstrated
replicability and scalability
One of the fastest growing aviation market globally with an expected passenger traffic growth of 7.4% CAGR1 for the period 2020-2037
Large Market
Opportunity in India
Portfolio of 7 marquee airports– Delhi, Hyderabad, Cebu, Goa, Bhogapuram, Bidar and Crete; handling ~101 mn2
passengers globally
Among the Largest
Private Operators
Globally
Highly visible cash flows through defined tariff setting; with a assured
regulated return3
RegulatedAero
Business
Unique Consumer-facing, retail-focused play on India’s
demographics and consumer story; catering to 27.4%4 of international
arrivals
High quality, multiple contiguous land parcels spanning 2,2405 acres; located close to the heart of economic activity
Real Estate Development
Opportunity
High-growth Non-Aero
Business
Leading Integrated
Airport Platform

13
Portfolio of World Class AssetsMOPABhogapuramGHIALCebuNagpurDIALCreteBidarCurrent PAX (FY20) (m n)PAX CAGR FY15–20 Cargo CAGRFY15–20 Current/Max Capacity(MPPA)5Revenue Share (%)Revenue per PaxGAL Stake(%)

14
Airport Development
& Construction (EPC)
Airport
Operation
Airport Maintenance
Cargo
Fuel Farm
MRO
Duty FreeF&B
Advertising
Car Park
Real Estate
Development
Airport
Advisory
Training Academy
15
Some of The Best Rated Airports in The World

16
4 Pillars of Value Creation in Airport Development and Operations
Market Opportunity Further Complemented by a Well Defined Regulatory Model
Multi-pronged Approach to Create Shareholder Value and Enhance Returns
Aero Non-Aero Real EstateAirport EPC &
Allied Services
▪ Regulated nature provides
strong visibility over cash
flows, any short term
disruptions expected to
get mitigated over longer
runs
▪ Strong play over India
consumption story and
global tourism growth
▪ Large upside potential to
be realized through
monetization
▪ Asset light business
enhancing returns over
capital

17
1. Aero Revenue
Growth in aero revenue driven by substantially under-penetrated Indian markets
…supported by robust growth
drivers
Supportive Regulatory
EnvironmentSignificant movement to a welldefined
regulatory model
Fleet GrowthIndian carriers expected to double their
fleet to 1,100 by 20273
Growing Middle Class~140mn households will move into middle-
income bracket by 20302
Rising Travel
SpendingBusiness & leisure travel spending to
increase 10x between 2018-283
Increasing Airport CapacityGovernment plans to expand airport capacity
by five times to handle 1 billion trips a year4
Source: 1) IATA 2) World Economic Forum 3) IBEF 4) Ministry of Civil Aviation
Note: Above numbers and data points are basis pre-COVID estimates
Substantially under-penetrated
aviation market
… poised to grow substantially over
medium to long run
Indian passenger market likely to outpace other key aviation markets1
341
1,144
2020 2037E
3.4x
1
2017 2019 2021 2023 2025 2027 2029 2031 2033 2035 2037
1
2
3
4
5
6
7
8
9
10
1
2
3
4
5
6
7
8
9
10
Average Trips per capita1
0.10
1.00
0.60
1.00
2018 2038E
India
China
Passengers (mm)

18
1. Aero Revenue (Cont’d)
Robust performance of assets in the high growth Indian marketStrong growth runway for
key assets
8.6%
15.0%
11.7%
17.7%
2.4%
14.3% 14.6%
10.0%11.1%
DIAL GHIAL Goa Nagpur Mumbai Bangaluru Kolkata Chennai IndiaAverage
PA
XC
AG
R(%
)
5.0%
6.9%
2.7%
10.7%
5.2%
6.4%
2.3%3.0%
5.3%
DIAL GHIAL Goa Nagpur Mumbai Bangaluru Kolkata Chennai IndiaAverage
Ca
rgo
CA
GR
(%)
FY16-20A
6
16
8
12
66
24
28
33
80
119
Bhogapuram
Cebu
Goa
GHIAL
DIAL
Source: ICF.Note: 1) PAX CAGR includes both domestic and International passenger data 2) Including under development assets
(in millions)
179
300
Total GMR Assets
Current Capacity Final Capacity2

19
1. Aero Revenue (Cont’d)
Regulated nature ensures strong visibility over cash flows
RAB x FROR + D + OM + T – S = TR
Return on a
Regulated
Asset Base
“RAB”)
(RAB X WAC)
Depreciation
on Aero RAB
(D)
Aero Operating
Costs
(OM)
Aero Tax
(T)
Cross
Subsidization
by (30%) of
Non-Aero
Revenues
Target
Aeronautical
Revenue
6
54
3
2
1
RAB
Opening project cost of airport determined by AERA with
future capex attributed to aeronautical development
WACC
Fair rate of return calculated to include cost of equity and
actual cost of debt
Depreciation on Aero RAB
Depreciated based on ratges in the Companies Act such
that it matches accounting depreciation rates
Operating Costs
Operating and maintenance costs are pass through with
difference in forecast and actuals adjusted every period
Hybrid Till
Cross subsidization of 30% of non-aero revenues
1
1
2
3
5
Aero Tax
Corporates Taxes pertaining to aeronautical services
4
Well-Defined
Model
Regulatory
environment has
evolved to become
more mature and
efficient
Policy Clarity
Clarity on hybrid till
and end-use on
Airport Real Estate
(Endorsed by highest
court)
Well-Defined
Processes
Capex validation done
before incurring
New Concessions
New concessions
address issues faced
in earlier concessions
Note: 1) BAC: Base airport charges
Tariff Protection through BAC(1)
Contractual framework allows DIAL to charge BAC + 10%
as minimum tariff driving returns on capital
6

20
2.3
4.3
5.5
2014 2019 2024E
2. Non-Aero Business
Expected growth in industries forming a considerable part of non-aero revenue
Organised Retail
expected to drive the
total market size to
US$1,750 bn by 2026
RetailTotal retail market size (US$ bn)
Source: IBEF
950
1,200
1,750
2018 2021E 2026E
1.8x
Promising growth indomestic cargo due to
eCommerce; expected
CAGR of ~8.5% over next 20 years
Cargo
Total cargo transported (mm tonnes)
Source: FICCI
3.3
17.0
2020 2040E
Favourable
demographics
driving strong growth in
QSR Sector
QSR
Total QSR Sales (in US$ bn)1
Source: Euromonitor
Advertisement
Advertising market size (US$ bn)1
Airports, Malls and
Corporate Parks
expected to drive the
growth
Source: Zenith Optimedia
8.4
13.4
2018 2022E
1.6x
Significant growth in underlying industries
5.2x
Note: 1) Exchange rate – 1 USD = 75 INR 2) All data points relate to India market
2.4x

21
Retail (incl. Duty Free)
29%
Space Rentals
25%
Cargo Income
12%
F&B7%
Ads7%
Ground Handling
5%
Others15%
2. Non-Aero Business (Cont’d)
Source: Company data
Note: (1) Revenue numbers are based on IGAAP till FY17 and are in accordance with IND AS from FY18 onwards
Delivering Significant Growth in Non Aero Business…
DIAL Non-aero Revenue1
(INR bn)
Non-aero revenue split (FY20)
DIAL Standalone Non Aero Mix
…With Diversified Revenue Streams
11.413.6
15.3
18.0
20.922.0
FY15 FY16 FY17 FY18 FY19 FY20
GHIAL Standalone Non Aero Mix
Retail (incl. Duty Free)
27%
Car Park20%
Space Rentals
15%
F&B13%
Ads10%
Others15%
GHIAL Non-aero Revenue1
(INR bn)
1.92.2
2.73.0
3.4
3.9
FY15 FY16 FY17 FY18 FY19 FY20

22
3. Real Estate Business – DIAL and GHIAL
Company is also evaluating different monetization strategies including self-development
Aerotropolis – Large Integrated Ecosystem Synergistic with the Airport Demonstrated Track Record of Monetization
Aerocity – Upcoming Central Business District in NCR Demonstrated Track Record of Monetization
45 acres
6.1 Msf
11 Hospitality
Operators
2.2 Msf of
office & retail
Upcoming large
conferencing
facility
Prime Real Estate
230 acres available for development
Strategic Location
Between Central Delhi (current CBD) & Gurgaon
(commercial hub)
Long Lease Period
Land parcels available till 2066
Track Record of Monetization
Hospitality, Retail, Commercial
High Occupancy
Prime hospitality market with scope for hotel additions
Excellent Connectivity
Dedicated high speed metro line & 8-lane access road to
NH8
Delhi Airport
Large Land Bank
1,463 acres available for development
Key Location
Organic extension of commercialized west
Hyderabad
Long Lease Period
Land parcels available till 2068
Monetization gaining traction
Future strategy includes self-development
Mixed Use Model
Land Use across hospitality, education, warehousing,
entertainment etc.
Excellent Connectivity
Connected by NH44, NH765 and Nehru Ring Road
~300 rooms
Inventory
~2.2 Msf of Logistics
& Warehousing
0.43 Msf of
office & retail
~366 acres for
Aerospace & Industrial
Hyderabad Airport

23
4. Airport Development & Services
Source: Company DataNote: 1. SOP: Standard Operating Procedure 2. Nagpur airport award is sub-judice
GADL: Providing Services across the
Airport Lifecycle
Large Set of Addressable Opportunities
across India and Internationally
Complete Suite of Capabilities with a
Significant Base of Marquee Customers
400+
People employed
across Technical &
Business Background
Multiple Revenue
Streams
Revenue Stream
divided across
construction and
services
State-of-art
Systems
Comprehensive SOPs1
covering all aspects of
airport development
Wide range of
Services
Services across the
Airport Value Chain
Standardized
Processes
Adherence to Global
And

24
24
India Opportunities
Strong operating and development track record
coupled with ADP’s partnership expected to give
significant boost to qualification scores
Addressable opportunity pipeline of 47+ mmpassenger capacity through some of the fastest
growing airports in India
25
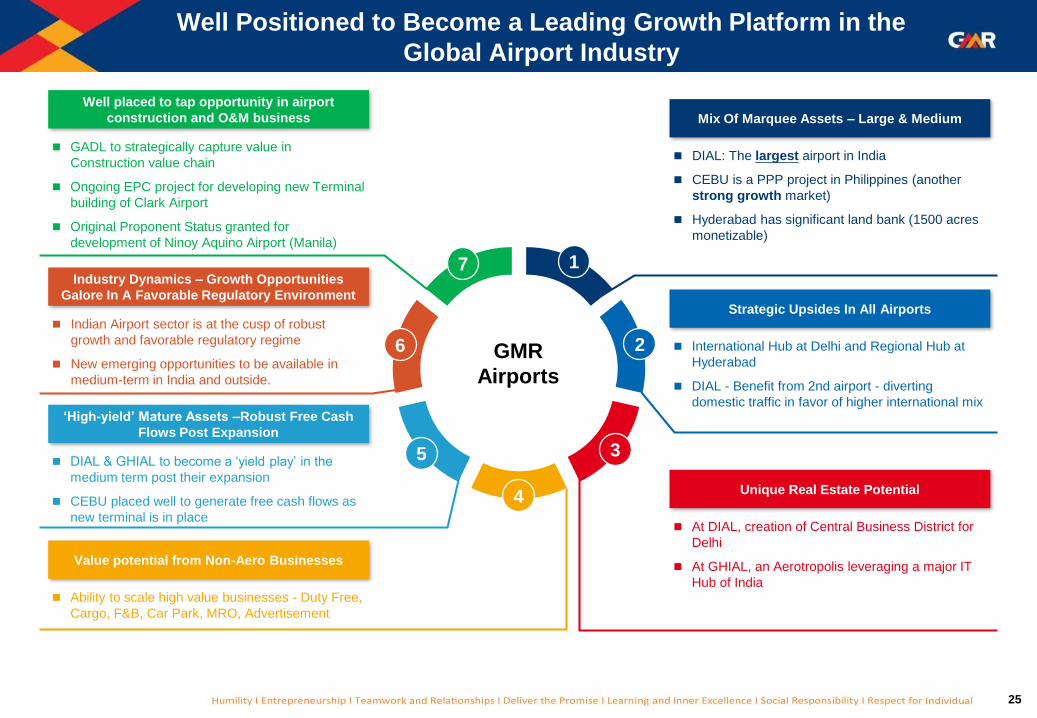
Well Positioned to Become a Leading Growth Platform in the
Global Airport Industry
GMR
Airports
6
1
2
3
4
5
◼ DIAL: The largest airport in India
◼ CEBU is a PPP project in Philippines (another
strong growth market)
◼ Hyderabad has significant land bank (1500 acres
monetizable)
◼ International Hub at Delhi and Regional Hub at
Hyderabad
◼ DIAL - Benefit from 2nd airport - diverting
domestic traffic in favor of higher international mix
◼ At DIAL, creation of Central Business District for
Delhi
◼ At GHIAL, an Aerotropolis leveraging a major IT
Hub of India ◼ Ability to scale high value businesses - Duty Free,
Cargo, F&B, Car Park, MRO, Advertisement
◼ DIAL & GHIAL to become a ‘yield play’ in the
medium term post their expansion
◼ CEBU placed well to generate free cash flows as
new terminal is in place
◼ Indian Airport sector is at the cusp of robust
growth and favorable regulatory regime
◼ New emerging opportunities to be available in
medium-term in India and outside.
Industry Dynamics – Growth Opportunities
Galore In A Favorable Regulatory Environment
Mix Of Marquee Assets – Large & Medium
Strategic Upsides In All Airports
Unique Real Estate Potential
Value potential from Non-Aero Businesses
‘High-yield’ Mature Assets –Robust Free Cash
Flows Post Expansion
7
Well placed to tap opportunity in airport
construction and O&M business
◼ GADL to strategically capture value in
Construction value chain
◼ Ongoing EPC project for developing new Terminal
building of Clark Airport
◼ Original Proponent Status granted for
development of Ninoy Aquino Airport (Manila)

Other Businesses

27
Diversified Portfolio of Energy Assets
Warora
(Maharashtra)Kamalanga, (Orissa)
Vemagiri, (Andhra Pradesh)
Bajoli Holi, (Himachal Pradesh)
Rajahmundry, (Andhra Pradesh)
PT Gems, Indonesia
PT Gems (Indonesia)
▪ 2.07 bn tons resources
▪ 710 mm tons reserves
▪ 30% stake
▪ 30 mm ton sales in CY20
Warora (Coal, 600MW)
Kamalanga (Coal, 1050MW1)
Partnerships in Businesses
Note: (1) Excludes 350MW of Unit 4 which is yet to be developed (2) Decline in PLF of Kamalanga plant for FY20 is primarily related to major maintenance work undertaken during the year
Key energy assets performing at healthy
PLF, steady improvement over years
Vemagiri (388 MW)
• 100% contracted under a long term PPA
with State Government
• Debt free asset
• Operated under imported LNG
Rajahmundry (768 MW)
• 45% ownership
• Debt resolution plan approved by
lenders
• Visibility over gas supply with ramp-up
in gas production at ONGC’s and RIL’s
gas fields
• Well suited for round-the-clock clean
energy by bundling with renewable
which has received strong government
focus recently
Recovery in gas based plant performance
▪ Near commissioning
▪ 50% capacity already tied up under long
term PPA
Bajoli Holi (Hydro, 180 MW)
72%
Long term off-take
Fuel linkage
63%
73%66%
FY18 FY19 FY20
PLF2
84%
64%
100%
Long term off-take
Fuel linkage
78% 79% 82%
FY18 FY19 FY20
PLF
Key Operational Highlights
► Substantially Contracted Power Supply
Power Offtake is contracted through long term PPAs
with State Electricity Boards
► Strong Fuel Linkage
Robust fuel supply chain with confirmed linkage from
Coal India
► Improving PLF at asset level
Other Assets
▪ 1.2GW Hydro power capacity (under construction)
▪ ~28MW of operational renewables capacity

28
Transportation Assets
35 181
20 Years(from May 2006)
25 Years(from Apr 2010)
November 2008 December 2012
GACEPL GHVEPL
100%
Toll Based Road Projects (216 kms)
90%
Road
Road Length
(kms)
Concession
Period
Commercial
Operations Date
103 30
20 Years(from Sep 2006)
20 Years(from Jun 2010)
March 2009 June 2013
GPEL GCORRPL
GMR
Shareholding 100% 90%
Annuity Based Road Projects (133 kms)
Note: 1) GPEL: GMR Pochanpalli Expressways Limited , 2) GCORRPL: GMR Chennai Outer Ring Road Private Limited, 3) GACEPL: GMR Ambala Chandigarh Expressways Private Limited, 4) GHVEPL: GMR Hyderabad
Vijayawada Expressways Private Limited

29
Urban Infrastructure – Potential to Unlock Substantial
Value
Kakinada Special Investment Region
Note: 1) subject to receipt of regulatory and other statutory approvals 2) Kakinada SEZ Limited, 3) GMR SEZ and Port Holding Limited - wholly owned subsidiary of GMR Infrastructure Ltd, 4) Kakinada Gateway Port
Limited, 5) Tamil Nadu Industrial Development Corporation – TIDCO is a governmental agency in the state of Tamil Nadu, India
Krishnagiri Special Investment Region
✓ 2,500 acres of land
✓ 275 acres being used for infra development, approvals in place
✓ Joint Venture with TIDCO5
✓ Industrial cluster catering to aerospace, automobile, logistics, engineering
and electronics sectors
✓

Managing COVID-19 Impact

31
• Ensuring maximum security & safety to our customers to
restore their confidence through adoption of latest
technologies and processes in sanitization and contact
less travelling
• Reviewed all budgets which has resulted in reducing
operating expenses
• Consolidation of infrastructures to adapt to the nature of
traffic and reduce operating costs.
✓ Closed Terminal 1 & 2 and is now operating from
only Terminal 3 at Delhi Airport for both
international and domestic flights
◼ Repatriation initiative by the Ministry of
Civil Aviation
◼ Bilateral arrangements with US, France
and Germany to restart commercial
passenger services, more such
arrangements likely in near term
◼ Test on Arrival facility at CEBU Airport
since June’20 – likely to aid traffic in
India once such measure is permitted
◼ Cabin air is freshened every 2 minutes
with a mixture of fresh air and air being
filtered through HEPA filters
◼ Clean and hygienic conditions through
periodic sanitation
Effectively Managing COVID Impact on Airport Operations
• Cash conservation through rescheduling of our Capex
plan
Aligning Business Position Response Amidst Unprecedented Pandemic
Vande Bharat
Mission
Establishment
of Air Bubbles
‘Test on
Arrival or pre-
Embarkation’
Increased
safety in
Aviation
32
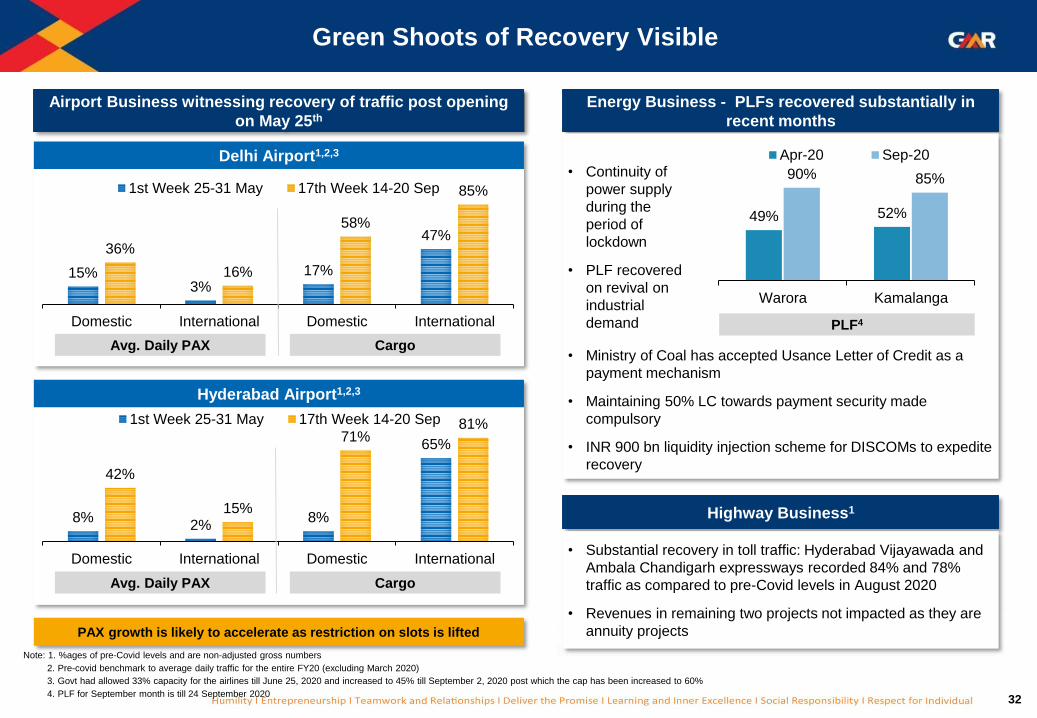
Energy Business - PLFs recovered substantially in
recent months
Green Shoots of Recovery Visible
Note: 1. %ages of pre-Covid levels and are non-adjusted gross numbers
2. Pre-covid benchmark to average daily traffic for the entire FY20 (excluding March 2020)
3. Govt had allowed 33% capacity for the airlines till June 25, 2020 and increased to 45% till September 2, 2020 post which the cap has been increased to 60%
4. PLF for September month is till 24 September 2020
49% 52%
90% 85%
Warora Kamalanga
Apr-20 Sep-20
15%3%
17%
47%36%
16%
58%
85%
Domestic International Domestic International
1st Week 25-31 May 17th Week 14-20 Sep
8%2%
8%
65%
42%
15%
71%81%
Domestic International Domestic International
1st Week 25-31 May 17th Week 14-20 Sep
Avg. Daily PAX Cargo
Avg. Daily PAX Cargo
Delhi Airport1,2,3
Hyderabad Airport1,2,3
Airport Business witnessing recovery of traffic post opening
on May 25th
Highway Business1
• Substantial recovery in toll traffic: Hyderabad Vijayawada and
Ambala Chandigarh expressways recorded 84% and 78%
traffic as compared to pre-Covid levels in August 2020
• Revenues in remaining two projects not impacted as they are
annuity projects
• Ministry of Coal has accepted Usance Letter of Credit as a
payment mechanism
• Maintaining 50% LC towards payment security made
compulsory
• INR 900 bn liquidity injection scheme for DISCOMs to expedite
recovery
• Continuity of
power supply
during the
period of
lockdown
• PLF recovered
on revival on
industrial
demand PLF4
PAX growth is likely to accelerate as restriction on slots is lifted

Key Takeaways

34
GMR Infrastructure – Key Takeaways
One of the world’s largest integrated airport platforms with significant potential for expansion04
Pure play airport business on the cards – to drive GMR’s leadership in airports business02
Significant deleveraging of the group via equity capital transaction with marquee partners01
Ability to derive value from strong partnerships with global majors across businesses06
Strong underlying macro fundamentals, including fast growing aviation market in India, to act as
tailwinds for the group 03
Strong management and leadership teams with ability to successfully build strong businesses07
Non Aero – on the back of growing retail consumption – and Real Estate to provide additional
upside for the Airport segment05

Annexures

36

37
48.3 50.5 49.5
17.4 18.7 17.8
65.7 69.2 67.3
FY18 FY19 FY20
Domestic International
DIAL – the Largest Indian Airport
Delhi Airport: Gateway to India Sizeable Catchment Area including Major Commercial Hubs
20%
Indian Aviation Market Share in
FY20
78 / 71
International /
Domestic Routes
67mn /
66mnCurrent Passengers
/ Current Capacity
INR 125bn2
Project Cost for
DIAL
119 mn
Planned Final
Capacity
30 + 30
Total Years of
Concession
National Capital Region
New DelhiNCR is one of the largest urban
conglomeration in the world
NoidaOne of the biggest industrial
clusters in the country
GurgaonNCR’s Central Business District
Delhi Airport
Delhi1
2
Noida
Gurgaon
3
1
2
3
Robust Passenger Growth Diversified Revenue Mix
FY20 Revenue Mix3,4(Passengers in millions)
Source: Company data
Note: (1) From NCAER Report “ The Economic Impact of Indira Gandhi International Airport, Delhi” March 2017. GSDP for year 2014-15.; (2) Project cost for Phase 1; (3) Refers to Gross Revenue (4) FY19 revenue and EBITDA lower due to change of control period and true-up exercise
EBITDA Margins
17.19.9 9.5
18.0
20.9 22.0
1.81.8
7.6
36.832.6
39.1
FY18 FY19 FY20
Aero Non Aero CPD Rentals
EBITDA4
8.2
5.1
9.7
FY18 FY19 FY20
42.9% 30.6% 47.2%
EBITDA Margin
(INR bn) (INR bn)

38
8.8
9.9 9.9
FY18 FY19 FY20
GHIAL – Gateway to Southern India
Robust Passenger Growth
(Passengers in
millions)
Diversified Revenue Mix
One of the Fastest Growing Airports in India
6%
Indian Aviation Market Share in
FY20
15 / 55
International / Domestic Routes
22mn / 12mm
Current Passengers
/ Current Capacity
INR 29bn1
Project Cost for GHIAL
80mn
Planned Final Capacity
30 + 30
Total Years of Concession
Strategically Located Catchment Area
Hyderabad
#2 Largest
Contributor to India’s revenue from IT
exports3
State of Telangana has
#2 Highest Number
of Operational SEZs3
Industrial HubFor Pharma, IT, and Real Estate
New Delhi
Kolkata
ChennaiBangalore
MumbaiHyderabad
Cochin
Goa
Gateway to South and
Central India
Ahmedabad
EBITDA Margins
73.7% 71.4% 67.8%
EBITDA Margin
14.717.4 17.9
3.6
3.9 3.918.3
21.4 21.7
FY18 FY19 FY20
Domestic International
FY20 Revenue Mix3
9.5 11.1 11.3
3.03.4 3.9
12.5
14.5 15.3
FY18 FY19 FY20
Aero Non Aero CPD Rentals
EBITDA(INR bn) (INR bn)
Source: Company data
Note: 1) Project cost for Phase 1; 2)Refers to Gross Revenue; 3) As mentioned on the website of Invest India, Ministry of Commerce and Industry
39
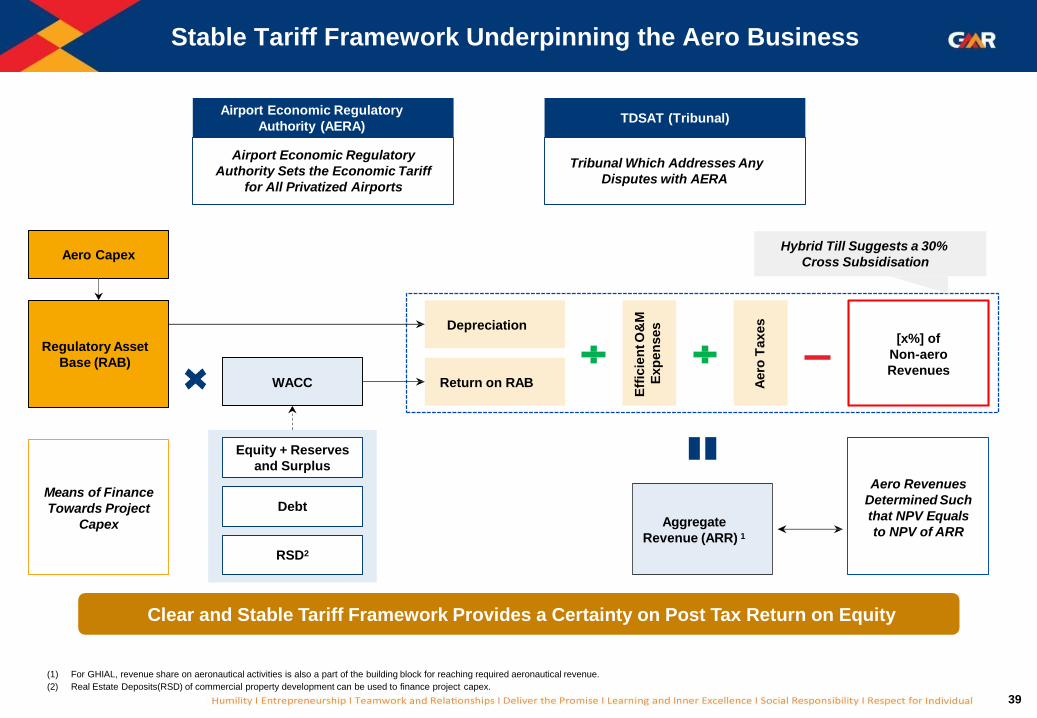
Stable Tariff Framework Underpinning the Aero Business
Tribunal Which Addresses Any
Disputes with AERA
Aero Capex
Regulatory Asset
Base (RAB)
Means of Finance
Towards Project
Capex
WACC
Depreciation
Return on RAB
Eff
icie
ntO
&M
Exp
en
ses
Aero
Taxes
[x%] of
Non-aero
Revenues
Aggregate
Revenue (ARR) 1
Aero Revenues
Determined Such
that NPV Equals
to NPV of ARR
Airport Economic Regulatory
Authority Sets the Economic Tariff
for All Privatized Airports
Airport Economic Regulatory
Authority (AERA)
Hybrid Till Suggests a 30%
Cross Subsidisation
Equity + Reserves
and Surplus
Debt
RSD2
TDSAT (Tribunal)
Clear and Stable Tariff Framework Provides a Certainty on Post Tax Return on Equity
(1) For GHIAL, revenue share on aeronautical activities is also a part of the building block for reaching required aeronautical revenue.
(2) Real Estate Deposits(RSD) of commercial property development can be used to finance project capex.

40
Environment
• 1st Carbon Neutral
Airport in Asia Pacific
region, under Airport
Carbon Accreditation of
ACI.
• Terminal 3 is First IGBC
LEED* certified NC
building –GOLD
(Feb’11) and IGBC
Platinum rated existing
building (Oct’16)
• 7.85 MW on site solar PV
plant installed – further
renewable energy
sourced through open
access
• Received the best
landscape awards from
the State Government -
~685 tons of CO2 saved
annually through green
belt
• Passenger Terminal
Building LEED certified
for “silver rating” by the
US Green Building
Council (USGBC).
• Certified to the new
international
Environmental
Management System ISO
14001:2015 in Sept’18
• Installation of 10 MW
Solar Power Plant
• Majority of the operational
and under construction
assets are certified for
ISO 9001 : QMS, ISO
14001 : EMS, OHSAS
18001
• Plantation of new
10,000+ saplings at
different location to
increase the green
density in addition to
already existing Green
Belt
• DFCC projects certified
with ISO14001 for
Environmental
management system and
working under the strict
environmental norms of
World Bank in DFCC
projects.
• Operational units in
Kakinada Industrial Park
are in the Green &
Orange Category
Company has invested substantially and allocated resources to increase adherence to environmental standards and pollution
control measures and enhance environment health safety levels
DIAL GHIAL Energy Others
* LEED = Leadership in Energy & Environmental Design

41
Visionary Leadership
Company has an independent external advisory council comprising eminent industry leaders
providing inputs on business strategies
GM Rao
Group Chairman
• Founder Chairman of the Group
• Since 1978, he has successfully led the
Group creating infrastructure assets of
national importance
Srinivas Bommidala
Chairman, Energy
and International
Airports
GBS Raju
Chairman,
Airports
G Kiran Kumar
Corporate
Chairman & MD
B V N Rao
Chairman,
Transportation
and Urban
Infra
NC Sarabeswaran
• Ex- nominee director of
RBI and Vysya Bank
Board
R S S L N
Bhaskarudu
• Ex- MD of Maruti Udyog
Limited
S Sandilya
• Chairman - Eicher Motors
• Board Member - Mastek
S Rajagopal
• Ex-Chairman & MD of
Bank of India, Indian Bank
C. R. Muralidharan
• Ex-CGM of RBI and an Ex-
member of IRDA
Kameswari Vissa
• CA with 24 yrs of
experience
• Board Member: L&T
valves, Madura microfin.
INDEPENDENT DIRECTORS ON GMR BOARDGROUP DIRECTORS ON GMR BOARD
Madhva
Bhimacharya
Terdal
Whole Time
Director
Suresh Narang
• Ex-Board member of
Mandiri Securities
• Ex-Chief Country Officer
of Deutsche Bank in
Indonesia
ADDITIONAL DIRECTOR

42
Committed to “Giving Back” to the Community through GMR
Varalakshmi Foundation
“To make sustainable impact on the human development of under-served
communities through initiatives in education, health and livelihoods”
Mission of GMR
Varalakshmi Foundation
Our Four Pronged approachThrough
“Our Projects”
▪ Working with communities where:
o Group has business operations- 25
locations in India & 1 in Nepal
o 350+ school & 35 K students
o Vocational training to ~44K
▪ GHIAL recognized as an example of
“Reaching out to Bottom of Pyramid”
in 2012/13
Through
“Personal Philanthropy”
▪ Started from Rajam (A.P) in 1991
▪ Personal Holding in the Group -
pledged to foundation by GM Rao
▪ Family Constitution ensures donation
by the family members to the
Foundation
GMR Varalakshmi Foundation
Education
Health, Hygiene & Sanitation
Community Development
Livelihood
*National Voluntary Guidelines for Responsible Business published by Ministry of Corporate Affairs

43
Detailed Financials
(INR mm) FY18 FY19 FY20 Q1FY20 Q1FY21
Gross Revenue 87,212 75,760 85,555 19,921 11,341
Less Revenue Share 19,115 17,648 20,372 4,872 1,775
Net Revenue 68,097 58,112 65,184 15,049 9,566
Total Expenditure 46,238 41,055 38,898 9,061 9,755
EBITDA 21,859 17,057 26,286 5,988 (189)
EBITDA Margin 32% 29% 40% 40% (2%)
Other Income 5,530 7,088 6,666 2,138 904
Interest & Finance Charges 23,163 26,842 35,451 8,123 7,810
Depreciation 10,284 9,840 10,643 2,605 2,631
PBT before exceptional items (6,058) (12,536) (13,142) (2,602) (9,727)
Exceptional Income / (Expense) - (22,123) (6,809) - -
PBT (6,058) (34,659) (19,951) (2,602) (9,727)
Tax 455 (874) (849) 561 (1,511)
Profit after Tax (PAT) (6,513) (33,785) (19,101) (3,164) (8,216)
Add: Share in Profit / Loss of JV's / Associates (4,314) (879) (2,883) (185) (122)
PAT for Continuing Operations (10,827) (34,664) (21,985) (3,349) (8,339)
Add: Profit / (Loss) from Discontinued Operations (319) 1,101 (37) (13) (0)
Add: Other Comprehensive Income (OCI) (1,107) 1,736 241 1,948 1,639
Total Comprehensive Income (OCI) (12,253) (31,827) (21,780) (1,413) (6,700)
Less: Minority Interest (MI) 2,570 2,376 2,831 1,786 (2,105)
Total Comprehensive Income (post MI) (14,822) (34,203) (24,611) (3,199) (4,595)
GMR Infra - Consolidated

44
(INR mm) FY18 FY19 FY20 Q1FY20 Q1FY21
Aero Revenue 25,108 18,982 20,628 4,695 746
Non Aero Revenues 27,356 32,665 33,640 8,445 3,617
CPD Rentals 1,874 2,069 7,641 1,457 580
Gross Revenues 54,338 53,716 61,909 14,597 4,944
Less: Revenue Share 18,144 16,528 19,136 4,558 1,607
Net Revenue 36,194 37,188 42,773 10,039 3,337
Operating Expenditure 15,887 20,696 20,121 4,723 4,288
EBITDA 20,307 16,492 22,652 5,316 (951)
EBITDA Margin 56% 44% 53% 53% (29%)
Other Income 4,138 5,642 5,205 1,622 534
Interest & Finance Charges 8,918 10,982 13,825 3,216 3,586
Depreciation 8,947 8,483 8,908 2,223 2,383
PBT 6,580 2,669 5,124 1,499 (6,386)
Tax (50) (1,104) 1,355 491 (1,534)
Profit after Tax (PAT) 6,630 3,773 3,768 1,008 (4,852)
Add: Share in Profit / Loss of JVs / Associates 1,662 1,820 1,570 372 (170)
PAT (After share in JVs / Associates) 8,292 5,593 5,339 1,380 (5,022)
Airports Business - Consolidated
Detailed Financials

0
Investor Presentation
Non-Deal Roadshow
September 2020

1
DISCLAIMER
All statements, graphics, data, tables, charts, logos, names, figures and all other
information (“Contents”) contained in this document (“Material”) are prepared by
GMR Infrastructure Limited (“Company”) solely for the purpose of this Material and
not otherwise. This Material is prepared as on the date mentioned herein which is
solely intended for reporting the developments of the Company to the investors of
equity shares in the Company as on such date, the Contents of which are subject to
change without any prior notice. The Material is based upon information that we
consider reliable, but we do not represent that it is accurate or complete.
Neither the Company, its subsidiaries and associate companies (“GMR Group”), nor
any director, member, manager, officer, advisor, auditor and other persons
(“Representatives”) of the Company or the GMR Group provide any representation
or warranties as to the correctness, accuracy or completeness of the Contents and
this Material. It is not the intention of the Company to provide a complete or
comprehensive analysis or prospects of the financial or other information within the
Contents and no reliance should be placed on the fairness on the same as this
Material has not been independently verified by any person.
NONE OF THE COMPANY, THE GMR GROUP AND THE REPRESENTATIVES
OF THE COMPANY AND THE GMR GROUP ACCEPT ANY LIABILITY
WHATSOEVER FROM ANY LOSS OR DAMAGE HOWSOEVER ARISING FROM
ANY CONTENTS OR OTHERWISE ARISING OUT OF OR IN CONNECTION
WITH THIS MATERIAL.
This Material is published and available on the Company’s website
www.gmrgroup.in which is subject to the laws of India, and is soley for information
purposes only and should not be reproduced, retransmitted, republished, quoted or
distributed to any other person whether in whole or in part or for any other purpose
or otherwise.
Any reproduction, retransmission, republishing or distribution of this Material or the
Contents thereof in certain jurisdictions may be restricted by law and persons who
come into possession of this Material should observe such laws and restrictions if
any.
This Material and any discussions which follows may contain ‘forward looking
statements’ relating to the Company and the GMR Group and may include
statements relating to future results of operation, financial condition, business
prospects, plans and objectives, are based on the current beliefs, assumptions,
expectations, estimates, and projections of the directors and management of the
Company about the business, industry and markets in which the Company and the
GMR Group operates and such statements are not guarantees of future
performance, and are subject to known and unknown risks, uncertainties, and other
factors, some of which are beyond the Company’s or the GMR Group’s control and
difficult to predict, that could cause actual results, performance or achievements to
differ materially from those in the forward looking statements. Such statements are
not, and should not be construed, as a representation as to future performance or
achievements of the Company or the GMR Group. In particular, such statements
should not be regarded as a projection of future performance of the Company or the
GMR Group. It should be noted that the actual performance or achievements of the
Company and the GMR Group may vary significantly from such statements.
Forward-looking statements are not predictions and may be subject to change
without notice.
This Material is not and does not constitute any offer or invitation or
recommendation or advice to purchase, acquire or subscribe to shares and other
securities of the Company or the GMR Group and no part of this Material shall form
the basis of or part of any contract, commitment or investment decision nor be relied
upon as a basis for entering into any contract, commitment or investment decision in
relation thereto. Recipients should seek their own professional advice including from
legal, tax or investment advisors before making an investment decision in shares or
other securities of the Company or the GMR Group. Remember, investments are
subject to risks including the risk of loss of the initial principal amount invested; past
performance is not indicative of future results.
This presentation is not a prospectus, a statement in lieu of a prospectus, an
offering circular, an advertisement or an offer document under the Companies Act,
2013, and the rules made thereunder, as amended, the Securities and Exchange
Board of India (Issue of Capital and Disclosure Requirements) Regulations, 2018,
as amended, or any other applicable law in India.
REGULATORY AUTHORITIES IN THE UNITED STATES OF AMERICA, INDIA,
OR OTHER JURISDICTIONS, INCLUDING THE SECURITIES AND EXCHANGE
COMMISSION AND THE SECURITIES AND EXCHANGE BOARD OF INDIA
(“SEBI”), HAVE NEITHER APPROVED OR DISAPPROVED THIS MATERIAL OR
DETERMINED IF THIS MATERIAL IS TRUTHFUL OR COMPLETE. ANY
REPRESENTATION TO THE CONTRARY MAY CONSTITUTE A CRIMINAL
OFFENSE.

2
Table of Contents
Particulars Pg. No.
Group Overview 3-5
Business Update 6-10
Airports Business 11-25
Other Businesses 26-29
Managing COVID Impact 30-32
Key Takeaways 33-34
Annexures 35-44

Group Overview
4
One of the Oldest Infrastructure Conglomerates
Over two decades of track record, consolidation aimed at creating shareholder value
Note: (1) Converted using exchange rate of 1 USD = 75 INR; 2) Converted using exchange rate as on issue date, 1 USD = 46.415 INR; 3) Nagpur airport award is sub-judice; 4) OPS is original proponent status
1996-2008 2009-11 2012-14 2015-Today Near term
Established track record of accessing public and private pool of capital
Successfully created shareholder value through opportunistic divestments
Founded in 1996
Listed in 2006
Won Delhi and Hyderabad
airport concessions
200 MW power plant and 3
road projects commissioned
Expanded overseas - 50%
stake in Intergen
T3 of Delhi Airport
commissioned in 37 months
Acquired 30% stake in PT
GEMS
Commenced operations for 3
urban infra projects totaling
234 kms
Won Cebu Airport
concession
Commenced operations for 3
urban infra projects totaling
309 kms and 2 power plants
totaling of 1.7 GW
Won concessions for 5
airports3
Won EPC project on eastern
DFCC ($680mn)1 and 8mn
Pax Clark airport
Granted OPS4 for Ninoy
airport
Equity partnership with
lenders for 1 gas & 1 coal
project
IPO: $172mn2
QIP: $1bn
QIP: $315mn
$330mn from PE investors for GMR Airports
$300mn from PE investors for GMR Energy
QIP: $197mn1
Rights issue: $187mn1
FCCB from KIA: $300mn
ADP investment in airports:
$1.3bn1
Partnered with Tenaga
(30%stake) for GMR Energy
Bond raise for DIAL and
GHIAL: $2 bn
Intergen Power Istanbul Airport, Turkey
Island Power Project,
Singapore
2 Highway projects
1 Highway project
Chhattisgarh power plant
PT BSL coal mine
Himtal hydro project
Deleverage
Focus on reducing debt
and improving cash flow
and profitability
Demerger
Vertical demerger of
airports and non-airport
businesses to create
further value for
shareholders
Divestment
Continue with monetizing
and divesting select
assets

5
Leading Airport Focused Infrastructure Player
65.6%
12.3%
22.1%
1) Includes Barge Plant (220 MW) for which Sale and Purchase Agreement for divestment is signed; 2) Revenue for GMR Energy Limited is not consolidated in FY20 financials hence, revenue for ‘power’ segment shown above
includes mainly power trading and mining operations
Airports
Power
Transport &
Urban Infra
Amongst the LargestPrivate airport developers in the
world, largest in India
7 nos.Of airport assets under operations or
various stages of development
300 mmRated capacity across portfolio of
airport assets
179 mmCurrent capacity: 94 mm under
operations
101 mmPassengers handled in FY20 across
key gateway airports
~2,240 acresOf land with strong RE development
potential
Strategic PartnershipsWith marquee operators at platform
and asset level
IntegratedAirport development and operation
capabilities
4.5 GWOf total generation
capacity, over 2.8
GW commissioned
1bn Tons+Coal reserves, total
resources ~2.9 bn tons
Marquee Investors• Temasek Holdings Pte
Limited
• Tenaga Nasional Bhd.
• IDFC Alternatives
4 nos.Of highway projects
covering ~350 km
13,000 acresOf land at strategic
locations, integrated
industrial development
417 kmOf railway stretch
getting constructed
FY20
Revenue
Split

Business Update

7
One of the largest airport groups in
Europe based out of Paris (France)
Operating 24 international airports
across geographies
Handled1 234 Mn passengers
(including Istanbul Atatürk)
Market Cap2 of ~ € 9 Bn
Revenue1 at €4,700 Mn and Net
Income1 at €588 Mn
Strategic Partnership with Groupe ADP
Considerable synergistic advantages, bolstering GMR’s growth plans
Substantial portion of consideration utilized to deleverage
About Group ADP Investment Merits Strategic Rationale
Creation of world-class Airport Development and
Management platform in partnership with
strategic airport operator
◼ Combination of expertise to extract more
value and create synergies
◼ Building strong partnerships by
leveraging aeronautical and non-
aeronautical expertise through
systematic best practices
implementation
◼ Sharing knowledge and best practices
across airports
Leverage Expertise
◼ Market access for service companies
◼ Route development
◼ Enhance expertise in operations / smart
airport
◼ Retail and passenger experience,
IT/Innovation, engineering etc.
Strategic partnership
◼ Achieving standardized and highest level of
passenger experience and quality of service
Hospitality
Significant deleveraging at GMR using the
equity raise
◼ Improved cash-flow and profitability
◼ Lower cost of financing
Paves way for value unlocking through
demerger of businesses3
◼ Transaction entails ease of & flexibility for
demerger process
Strong partner to capitalize on future growth
opportunities
1) For the Year 2019; 2) as on August 14, 2020; 3) subject to receipt of approvals from shareholders, creditors and regulatory authorities
8
Significant Move Towards Deleveraging
*Linked to achievement of certain agreed operating performance metrics and receipt of certain regulatory clarifications over the next ~5 years;
**including Earn-outs on consummation
Deleveraging is expected to result in improved cash flows and profitability over the medium term
Transaction Details
Minority stake sale of 49% in GMR Airports Ltd (GAL)
✓ INR 98.13bn received
▪ Tranche I: INR 52.5bn received in February 2020
▪ Tranche II: INR 45.7bn received in July 2020
─ Including INR 10bn primary capital @ GAL
─ Balance secondary - cash inflow at corporate level
✓ INR 10.60bn, currently part of Earn-outs to be received by FY24
▪ subject to the achievement of certain performance related targets by GMR Airports Limited
✓ INR 44.8bn, further earn-outs in form of equity shares
▪ Earn-outs achievements can potentially increase GMR stake up to 59%
✓ Transaction completed
✓ Servicing of debt and exit for private equity investors in GAL
Investment
Amount
Status
Utilization of
Proceeds

9
• Vertical split demerger of the Non-Airport Business of
GIL1 into GPUIL1 as a going concern
Rationale for Demerger
Business Separation to Unlock Value for Shareholders
Note: 1) GIL: GMR Infrastructure Limited, GPUIL: GMR Power and Urban Infra Limited, GPIL: GMR Power Infra Limited 2) The date on which the undertakings shall vest in the respective resulting
companies 3) Unaudited pro forma Condensed Consolidated Financial Information has been compiled by management to illustrate the impact of the proposed demerger of the Non-airport business of the
Group into GPUIL, subsidiary of the GIL on the Group’s Balance Sheet and Profit & Loss Account
The Scheme of Arrangement has been filed with Stock Exchange and is subject to necessary approvals from
shareholders, creditors and regulatory authorities
◼ Value unlocking of Airport & Non-Airport
businesses
◼ Simplification of the Corporate Holding
Structure
◼ Enable both Airport & Non-Airport businesses
to chart out their respective growth plan
independently
◼ Multiple platforms to raise fund to grow
respective businesses – both from private &
public market
GMR Infrastructure
LimitedKey Highlights of Scheme of Arrangement
• Mirror shareholding of GIL in GPUIL with all existing
shareholders of GIL becoming shareholder of GPUIL
in same proportion
• Issue of 1 additional share of Rs.5/- each of GPUIL for
every 10 shares in GIL of Rs.1/- each as on the record
date
• Post the Scheme, GIL to emerge as India's Only Pure-
Play Listed Airports Company
• Amalgamation of GPIL1 with GIL as a step preceding
demerger
• Appointed date2 fixed at April 1, 2021
GMR Power and
Urban Infra Limited
Airport Non-Airport
Pro Forma Financials3
Click to View

10
Airport53%
Energy10%
Highways10%
Others1%
Corporate (Inc. debt for PE Exit)
26%
Visible Path to Deleveraging
Divestment Initiatives
Power
Business
⚫ Cash flow from thermal assets sufficient to service debt,
⚫ Strong prospects for divestment of thermal assets given improved
performance
⚫ Monetisation of Barge Plant – SPA3 signed, partial consideration
received
Port &
Industrial
Land
⚫ Land at strategic industrial locations to benefit from manufacturing
dislocation from China
⚫ Total land—10,500 acre; significant potential to unlock large latent
value
Highways
⚫ Debt to be pared from favourable judgment on significant
arbitration claim (Hyderabad-Vijayawada and Chennai ORR4)
⚫ Monetization to gain momentum post arbitration claim settlement
Airports
⚫ Recent capital raise to help largely aimed at deleveraging
⚫ Stable assets to generate robust cash flows towards servicing of
existing debt
GMR Consolidated Debt
321.0 58.0
263.0
Gross Debt Cash &equivalents
Net Debt
Gross & Net Debt (INR bn) ^
Net Debt (Sector-wise) ^
Note : 1) FCCB not considered in debt, 2) Certain loans part of Energy and Others segment till Mar’19 are reclassified as Corporate Debt, 3) SPA – Sale and Purchase Agreement ̂As on June 2020
4) Government of Tamil Nadu has challenged the award in Madras High Court
Coal Mines
(Indonesia)⚫ To re-start the process of divestment once coal prices stabiles
Plan to divest select assets across businesses

Airports Vertical

12
One of the World’s Leading Integrated Airport Platforms
India’s Largest Airport Operator
Note: *Private Operator (Government holding <50%)
1. Based on 2037 passenger forecast by IATA
2. Delhi, Hyderabad and Cebu LTM (Apr 2019-Mar 2020) passenger data; Nagpur airport award is sub-judice.
3. Only for India
4. As of Jan 2020 through Ministry of Tourism website
5. Includes DIAL (230 acres), GHIAL (1,463 acres), Goa (232 acres), Bhogapuram (294 acres), Cebu (11 acres),Greece (~ 10 acres).
Wide range of capabilities and services across the entire airport value chain; with demonstrated
replicability and scalability
One of the fastest growing aviation market globally with an expected passenger traffic growth of 7.4% CAGR1 for the period 2020-2037
Large Market
Opportunity in India
Portfolio of 7 marquee airports– Delhi, Hyderabad, Cebu, Goa, Bhogapuram, Bidar and Crete; handling ~101 mn2
passengers globally
Among the Largest
Private Operators
Globally
Highly visible cash flows through defined tariff setting; with a assured
regulated return3
RegulatedAero
Business
Unique Consumer-facing, retail-focused play on India’s
demographics and consumer story; catering to 27.4%4 of international
arrivals
High quality, multiple contiguous land parcels spanning 2,2405 acres; located close to the heart of economic activity
Real Estate Development
Opportunity
High-growth Non-Aero
Business
Leading Integrated
Airport Platform

13
Portfolio of World Class AssetsMOPABhogapuramGHIALCebuNagpurDIALCreteBidarCurrent PAX (FY20) (m n)PAX CAGR FY15–20 Cargo CAGRFY15–20 Current/Max Capacity(MPPA)5Revenue Share (%)Revenue per PaxGAL Stake(%)

14
Airport Development
& Construction (EPC)
Airport
Operation
Airport Maintenance
Cargo
Fuel Farm
MRO
Duty FreeF&B
Advertising
Car Park
Real Estate
Development
Airport
Advisory
Training Academy

15
Some of The Best Rated Airports in The World

16
4 Pillars of Value Creation in Airport Development and Operations
Market Opportunity Further Complemented by a Well Defined Regulatory Model
Multi-pronged Approach to Create Shareholder Value and Enhance Returns
Aero Non-Aero Real EstateAirport EPC &
Allied Services
▪ Regulated nature provides
strong visibility over cash
flows, any short term
disruptions expected to
get mitigated over longer
runs
▪ Strong play over India
consumption story and
global tourism growth
▪ Large upside potential to
be realized through
monetization
▪ Asset light business
enhancing returns over
capital

17
1. Aero Revenue
Growth in aero revenue driven by substantially under-penetrated Indian markets
…supported by robust growth
drivers
Supportive Regulatory
EnvironmentSignificant movement to a welldefined
regulatory model
Fleet GrowthIndian carriers expected to double their
fleet to 1,100 by 20273
Growing Middle Class~140mn households will move into middle-
income bracket by 20302
Rising Travel
SpendingBusiness & leisure travel spending to
increase 10x between 2018-283
Increasing Airport CapacityGovernment plans to expand airport capacity
by five times to handle 1 billion trips a year4
Source: 1) IATA 2) World Economic Forum 3) IBEF 4) Ministry of Civil Aviation
Note: Above numbers and data points are basis pre-COVID estimates
Substantially under-penetrated
aviation market
… poised to grow substantially over
medium to long run
Indian passenger market likely to outpace other key aviation markets1
341
1,144
2020 2037E
3.4x
1
2017 2019 2021 2023 2025 2027 2029 2031 2033 2035 2037
1
2
3
4
5
6
7
8
9
10
1
2
3
4
5
6
7
8
9
10
Average Trips per capita1
0.10
1.00
0.60
1.00
2018 2038E
India
China
Passengers (mm)

18
1. Aero Revenue (Cont’d)
Robust performance of assets in the high growth Indian marketStrong growth runway for
key assets
8.6%
15.0%
11.7%
17.7%
2.4%
14.3% 14.6%
10.0%11.1%
DIAL GHIAL Goa Nagpur Mumbai Bangaluru Kolkata Chennai IndiaAverage
PA
XC
AG
R(%
)
5.0%
6.9%
2.7%
10.7%
5.2%
6.4%
2.3%3.0%
5.3%
DIAL GHIAL Goa Nagpur Mumbai Bangaluru Kolkata Chennai IndiaAverage
Ca
rgo
CA
GR
(%)
FY16-20A
6
16
8
12
66
24
28
33
80
119
Bhogapuram
Cebu
Goa
GHIAL
DIAL
Source: ICF.Note: 1) PAX CAGR includes both domestic and International passenger data 2) Including under development assets
(in millions)
179
300
Total GMR Assets
Current Capacity Final Capacity2

19
1. Aero Revenue (Cont’d)
Regulated nature ensures strong visibility over cash flows
RAB x FROR + D + OM + T – S = TR
Return on a
Regulated
Asset Base
“RAB”)
(RAB X WAC)
Depreciation
on Aero RAB
(D)
Aero Operating
Costs
(OM)
Aero Tax
(T)
Cross
Subsidization
by (30%) of
Non-Aero
Revenues
Target
Aeronautical
Revenue
6
54
3
2
1
RAB
Opening project cost of airport determined by AERA with
future capex attributed to aeronautical development
WACC
Fair rate of return calculated to include cost of equity and
actual cost of debt
Depreciation on Aero RAB
Depreciated based on ratges in the Companies Act such
that it matches accounting depreciation rates
Operating Costs
Operating and maintenance costs are pass through with
difference in forecast and actuals adjusted every period
Hybrid Till
Cross subsidization of 30% of non-aero revenues
1
1
2
3
5
Aero Tax
Corporates Taxes pertaining to aeronautical services
4
Well-Defined
Model
Regulatory
environment has
evolved to become
more mature and
efficient
Policy Clarity
Clarity on hybrid till
and end-use on
Airport Real Estate
(Endorsed by highest
court)
Well-Defined
Processes
Capex validation done
before incurring
New Concessions
New concessions
address issues faced
in earlier concessions
Note: 1) BAC: Base airport charges
Tariff Protection through BAC(1)
Contractual framework allows DIAL to charge BAC + 10%
as minimum tariff driving returns on capital
6

20
2.3
4.3
5.5
2014 2019 2024E
2. Non-Aero Business
Expected growth in industries forming a considerable part of non-aero revenue
Organised Retail
expected to drive the
total market size to
US$1,750 bn by 2026
RetailTotal retail market size (US$ bn)
Source: IBEF
950
1,200
1,750
2018 2021E 2026E
1.8x
Promising growth indomestic cargo due to
eCommerce; expected
CAGR of ~8.5% over next 20 years
Cargo
Total cargo transported (mm tonnes)
Source: FICCI
3.3
17.0
2020 2040E
Favourable
demographics
driving strong growth in
QSR Sector
QSR
Total QSR Sales (in US$ bn)1
Source: Euromonitor
Advertisement
Advertising market size (US$ bn)1
Airports, Malls and
Corporate Parks
expected to drive the
growth
Source: Zenith Optimedia
8.4
13.4
2018 2022E
1.6x
Significant growth in underlying industries
5.2x
Note: 1) Exchange rate – 1 USD = 75 INR 2) All data points relate to India market
2.4x

21
Retail (incl. Duty Free)
29%
Space Rentals
25%
Cargo Income
12%
F&B7%
Ads7%
Ground Handling
5%
Others15%
2. Non-Aero Business (Cont’d)
Source: Company data
Note: (1) Revenue numbers are based on IGAAP till FY17 and are in accordance with IND AS from FY18 onwards
Delivering Significant Growth in Non Aero Business…
DIAL Non-aero Revenue1
(INR bn)
Non-aero revenue split (FY20)
DIAL Standalone Non Aero Mix
…With Diversified Revenue Streams
11.413.6
15.3
18.0
20.922.0
FY15 FY16 FY17 FY18 FY19 FY20
GHIAL Standalone Non Aero Mix
Retail (incl. Duty Free)
27%
Car Park20%
Space Rentals
15%
F&B13%
Ads10%
Others15%
GHIAL Non-aero Revenue1
(INR bn)
1.92.2
2.73.0
3.4
3.9
FY15 FY16 FY17 FY18 FY19 FY20

22
3. Real Estate Business – DIAL and GHIAL
Company is also evaluating different monetization strategies including self-development
Aerotropolis – Large Integrated Ecosystem Synergistic with the Airport Demonstrated Track Record of Monetization
Aerocity – Upcoming Central Business District in NCR Demonstrated Track Record of Monetization
45 acres
6.1 Msf
11 Hospitality
Operators
2.2 Msf of
office & retail
Upcoming large
conferencing
facility
Prime Real Estate
230 acres available for development
Strategic Location
Between Central Delhi (current CBD) & Gurgaon
(commercial hub)
Long Lease Period
Land parcels available till 2066
Track Record of Monetization
Hospitality, Retail, Commercial
High Occupancy
Prime hospitality market with scope for hotel additions
Excellent Connectivity
Dedicated high speed metro line & 8-lane access road to
NH8
Delhi Airport
Large Land Bank
1,463 acres available for development
Key Location
Organic extension of commercialized west
Hyderabad
Long Lease Period
Land parcels available till 2068
Monetization gaining traction
Future strategy includes self-development
Mixed Use Model
Land Use across hospitality, education, warehousing,
entertainment etc.
Excellent Connectivity
Connected by NH44, NH765 and Nehru Ring Road
~300 rooms
Inventory
~2.2 Msf of Logistics
& Warehousing
0.43 Msf of
office & retail
~366 acres for
Aerospace & Industrial
Hyderabad Airport

23
4. Airport Development & Services
Source: Company DataNote: 1. SOP: Standard Operating Procedure 2. Nagpur airport award is sub-judice
GADL: Providing Services across the
Airport Lifecycle
Large Set of Addressable Opportunities
across India and Internationally
Complete Suite of Capabilities with a
Significant Base of Marquee Customers
400+
People employed
across Technical &
Business Background
Multiple Revenue
Streams
Revenue Stream
divided across
construction and
services
State-of-art
Systems
Comprehensive SOPs1
covering all aspects of
airport development
Wide range of
Services
Services across the
Airport Value Chain
Standardized
Processes
Adherence to Global
And

24
24
India Opportunities
Strong operating and development track record
coupled with ADP’s partnership expected to give
significant boost to qualification scores
Addressable opportunity pipeline of 47+ mmpassenger capacity through some of the fastest
growing airports in India

25
Well Positioned to Become a Leading Growth Platform in the
Global Airport Industry
GMR
Airports
6
1
2
3
4
5
◼ DIAL: The largest airport in India
◼ CEBU is a PPP project in Philippines (another
strong growth market)
◼ Hyderabad has significant land bank (1500 acres
monetizable)
◼ International Hub at Delhi and Regional Hub at
Hyderabad
◼ DIAL - Benefit from 2nd airport - diverting
domestic traffic in favor of higher international mix
◼ At DIAL, creation of Central Business District for
Delhi
◼ At GHIAL, an Aerotropolis leveraging a major IT
Hub of India ◼ Ability to scale high value businesses - Duty Free,
Cargo, F&B, Car Park, MRO, Advertisement
◼ DIAL & GHIAL to become a ‘yield play’ in the
medium term post their expansion
◼ CEBU placed well to generate free cash flows as
new terminal is in place
◼ Indian Airport sector is at the cusp of robust
growth and favorable regulatory regime
◼ New emerging opportunities to be available in
medium-term in India and outside.
Industry Dynamics – Growth Opportunities
Galore In A Favorable Regulatory Environment
Mix Of Marquee Assets – Large & Medium
Strategic Upsides In All Airports
Unique Real Estate Potential
Value potential from Non-Aero Businesses
‘High-yield’ Mature Assets –Robust Free Cash
Flows Post Expansion
7
Well placed to tap opportunity in airport
construction and O&M business
◼ GADL to strategically capture value in
Construction value chain
◼ Ongoing EPC project for developing new Terminal
building of Clark Airport
◼ Original Proponent Status granted for
development of Ninoy Aquino Airport (Manila)

Other Businesses

27
Diversified Portfolio of Energy Assets
Warora
(Maharashtra)Kamalanga, (Orissa)
Vemagiri, (Andhra Pradesh)
Bajoli Holi, (Himachal Pradesh)
Rajahmundry, (Andhra Pradesh)
PT Gems, Indonesia
PT Gems (Indonesia)
▪ 2.07 bn tons resources
▪ 710 mm tons reserves
▪ 30% stake
▪ 30 mm ton sales in CY20
Warora (Coal, 600MW)
Kamalanga (Coal, 1050MW1)
Partnerships in Businesses
Note: (1) Excludes 350MW of Unit 4 which is yet to be developed (2) Decline in PLF of Kamalanga plant for FY20 is primarily related to major maintenance work undertaken during the year
Key energy assets performing at healthy
PLF, steady improvement over years
Vemagiri (388 MW)
• 100% contracted under a long term PPA
with State Government
• Debt free asset
• Operated under imported LNG
Rajahmundry (768 MW)
• 45% ownership
• Debt resolution plan approved by
lenders
• Visibility over gas supply with ramp-up
in gas production at ONGC’s and RIL’s
gas fields
• Well suited for round-the-clock clean
energy by bundling with renewable
which has received strong government
focus recently
Recovery in gas based plant performance
▪ Near commissioning
▪ 50% capacity already tied up under long
term PPA
Bajoli Holi (Hydro, 180 MW)
72%
Long term off-take
Fuel linkage
63%
73%66%
FY18 FY19 FY20
PLF2
84%
64%
100%
Long term off-take
Fuel linkage
78% 79% 82%
FY18 FY19 FY20
PLF
Key Operational Highlights
► Substantially Contracted Power Supply
Power Offtake is contracted through long term PPAs
with State Electricity Boards
► Strong Fuel Linkage
Robust fuel supply chain with confirmed linkage from
Coal India
► Improving PLF at asset level
Other Assets
▪ 1.2GW Hydro power capacity (under construction)
▪ ~28MW of operational renewables capacity

28
Transportation Assets
35 181
20 Years(from May 2006)
25 Years(from Apr 2010)
November 2008 December 2012
GACEPL GHVEPL
100%
Toll Based Road Projects (216 kms)
90%
Road
Road Length
(kms)
Concession
Period
Commercial
Operations Date
103 30
20 Years(from Sep 2006)
20 Years(from Jun 2010)
March 2009 June 2013
GPEL GCORRPL
GMR
Shareholding 100% 90%
Annuity Based Road Projects (133 kms)
Note: 1) GPEL: GMR Pochanpalli Expressways Limited , 2) GCORRPL: GMR Chennai Outer Ring Road Private Limited, 3) GACEPL: GMR Ambala Chandigarh Expressways Private Limited, 4) GHVEPL: GMR Hyderabad
Vijayawada Expressways Private Limited

29
Urban Infrastructure – Potential to Unlock Substantial
Value
Kakinada Special Investment Region
Note: 1) subject to receipt of regulatory and other statutory approvals 2) Kakinada SEZ Limited, 3) GMR SEZ and Port Holding Limited - wholly owned subsidiary of GMR Infrastructure Ltd, 4) Kakinada Gateway Port
Limited, 5) Tamil Nadu Industrial Development Corporation – TIDCO is a governmental agency in the state of Tamil Nadu, India
Krishnagiri Special Investment Region
✓ 2,500 acres of land
✓ 275 acres being used for infra development, approvals in place
✓ Joint Venture with TIDCO5
✓ Industrial cluster catering to aerospace, automobile, logistics, engineering
and electronics sectors
✓

Managing COVID-19 Impact

31
• Ensuring maximum security & safety to our customers to
restore their confidence through adoption of latest
technologies and processes in sanitization and contact
less travelling
• Reviewed all budgets which has resulted in reducing
operating expenses
• Consolidation of infrastructures to adapt to the nature of
traffic and reduce operating costs.
✓ Closed Terminal 1 & 2 and is now operating from
only Terminal 3 at Delhi Airport for both
international and domestic flights
◼ Repatriation initiative by the Ministry of
Civil Aviation
◼ Bilateral arrangements with US, France
and Germany to restart commercial
passenger services, more such
arrangements likely in near term
◼ Test on Arrival facility at CEBU Airport
since June’20 – likely to aid traffic in
India once such measure is permitted
◼ Cabin air is freshened every 2 minutes
with a mixture of fresh air and air being
filtered through HEPA filters
◼ Clean and hygienic conditions through
periodic sanitation
Effectively Managing COVID Impact on Airport Operations
• Cash conservation through rescheduling of our Capex
plan
Aligning Business Position Response Amidst Unprecedented Pandemic
Vande Bharat
Mission
Establishment
of Air Bubbles
‘Test on
Arrival or pre-
Embarkation’
Increased
safety in
Aviation

32
Energy Business - PLFs recovered substantially in
recent months
Green Shoots of Recovery Visible
Note: 1. %ages of pre-Covid levels and are non-adjusted gross numbers
2. Pre-covid benchmark to average daily traffic for the entire FY20 (excluding March 2020)
3. Govt had allowed 33% capacity for the airlines till June 25, 2020 and increased to 45% till September 2, 2020 post which the cap has been increased to 60%
4. PLF for September month is till 24 September 2020
49% 52%
90% 85%
Warora Kamalanga
Apr-20 Sep-20
15%3%
17%
47%36%
16%
58%
85%
Domestic International Domestic International
1st Week 25-31 May 17th Week 14-20 Sep
8%2%
8%
65%
42%
15%
71%81%
Domestic International Domestic International
1st Week 25-31 May 17th Week 14-20 Sep
Avg. Daily PAX Cargo
Avg. Daily PAX Cargo
Delhi Airport1,2,3
Hyderabad Airport1,2,3
Airport Business witnessing recovery of traffic post opening
on May 25th
Highway Business1
• Substantial recovery in toll traffic: Hyderabad Vijayawada and
Ambala Chandigarh expressways recorded 84% and 78%
traffic as compared to pre-Covid levels in August 2020
• Revenues in remaining two projects not impacted as they are
annuity projects
• Ministry of Coal has accepted Usance Letter of Credit as a
payment mechanism
• Maintaining 50% LC towards payment security made
compulsory
• INR 900 bn liquidity injection scheme for DISCOMs to expedite
recovery
• Continuity of
power supply
during the
period of
lockdown
• PLF recovered
on revival on
industrial
demand PLF4
PAX growth is likely to accelerate as restriction on slots is lifted

Key Takeaways

34
GMR Infrastructure – Key Takeaways
One of the world’s largest integrated airport platforms with significant potential for expansion04
Pure play airport business on the cards – to drive GMR’s leadership in airports business02
Significant deleveraging of the group via equity capital transaction with marquee partners01
Ability to derive value from strong partnerships with global majors across businesses06
Strong underlying macro fundamentals, including fast growing aviation market in India, to act as
tailwinds for the group 03
Strong management and leadership teams with ability to successfully build strong businesses07
Non Aero – on the back of growing retail consumption – and Real Estate to provide additional
upside for the Airport segment05

Annexures

36

37
48.3 50.5 49.5
17.4 18.7 17.8
65.7 69.2 67.3
FY18 FY19 FY20
Domestic International
DIAL – the Largest Indian Airport
Delhi Airport: Gateway to India Sizeable Catchment Area including Major Commercial Hubs
20%
Indian Aviation Market Share in
FY20
78 / 71
International /
Domestic Routes
67mn /
66mnCurrent Passengers
/ Current Capacity
INR 125bn2
Project Cost for
DIAL
119 mn
Planned Final
Capacity
30 + 30
Total Years of
Concession
National Capital Region
New DelhiNCR is one of the largest urban
conglomeration in the world
NoidaOne of the biggest industrial
clusters in the country
GurgaonNCR’s Central Business District
Delhi Airport
Delhi1
2
Noida
Gurgaon
3
1
2
3
Robust Passenger Growth Diversified Revenue Mix
FY20 Revenue Mix3,4(Passengers in millions)
Source: Company data
Note: (1) From NCAER Report “ The Economic Impact of Indira Gandhi International Airport, Delhi” March 2017. GSDP for year 2014-15.; (2) Project cost for Phase 1; (3) Refers to Gross Revenue (4) FY19 revenue and EBITDA lower due to change of control period and true-up exercise
EBITDA Margins
17.19.9 9.5
18.0
20.9 22.0
1.81.8
7.6
36.832.6
39.1
FY18 FY19 FY20
Aero Non Aero CPD Rentals
EBITDA4
8.2
5.1
9.7
FY18 FY19 FY20
42.9% 30.6% 47.2%
EBITDA Margin
(INR bn) (INR bn)

38
8.8
9.9 9.9
FY18 FY19 FY20
GHIAL – Gateway to Southern India
Robust Passenger Growth
(Passengers in
millions)
Diversified Revenue Mix
One of the Fastest Growing Airports in India
6%
Indian Aviation Market Share in
FY20
15 / 55
International / Domestic Routes
22mn / 12mm
Current Passengers
/ Current Capacity
INR 29bn1
Project Cost for GHIAL
80mn
Planned Final Capacity
30 + 30
Total Years of Concession
Strategically Located Catchment Area
Hyderabad
#2 Largest
Contributor to India’s revenue from IT
exports3
State of Telangana has
#2 Highest Number
of Operational SEZs3
Industrial HubFor Pharma, IT, and Real Estate
New Delhi
Kolkata
ChennaiBangalore
MumbaiHyderabad
Cochin
Goa
Gateway to South and
Central India
Ahmedabad
EBITDA Margins
73.7% 71.4% 67.8%
EBITDA Margin
14.717.4 17.9
3.6
3.9 3.918.3
21.4 21.7
FY18 FY19 FY20
Domestic International
FY20 Revenue Mix3
9.5 11.1 11.3
3.03.4 3.9
12.5
14.5 15.3
FY18 FY19 FY20
Aero Non Aero CPD Rentals
EBITDA(INR bn) (INR bn)
Source: Company data
Note: 1) Project cost for Phase 1; 2)Refers to Gross Revenue; 3) As mentioned on the website of Invest India, Ministry of Commerce and Industry

39
Stable Tariff Framework Underpinning the Aero Business
Tribunal Which Addresses Any
Disputes with AERA
Aero Capex
Regulatory Asset
Base (RAB)
Means of Finance
Towards Project
Capex
WACC
Depreciation
Return on RAB
Eff
icie
ntO
&M
Exp
en
ses
Aero
Taxes
[x%] of
Non-aero
Revenues
Aggregate
Revenue (ARR) 1
Aero Revenues
Determined Such
that NPV Equals
to NPV of ARR
Airport Economic Regulatory
Authority Sets the Economic Tariff
for All Privatized Airports
Airport Economic Regulatory
Authority (AERA)
Hybrid Till Suggests a 30%
Cross Subsidisation
Equity + Reserves
and Surplus
Debt
RSD2
TDSAT (Tribunal)
Clear and Stable Tariff Framework Provides a Certainty on Post Tax Return on Equity
(1) For GHIAL, revenue share on aeronautical activities is also a part of the building block for reaching required aeronautical revenue.
(2) Real Estate Deposits(RSD) of commercial property development can be used to finance project capex.

40
Environment
• 1st Carbon Neutral
Airport in Asia Pacific
region, under Airport
Carbon Accreditation of
ACI.
• Terminal 3 is First IGBC
LEED* certified NC
building –GOLD
(Feb’11) and IGBC
Platinum rated existing
building (Oct’16)
• 7.85 MW on site solar PV
plant installed – further
renewable energy
sourced through open
access
• Received the best
landscape awards from
the State Government -
~685 tons of CO2 saved
annually through green
belt
• Passenger Terminal
Building LEED certified
for “silver rating” by the
US Green Building
Council (USGBC).
• Certified to the new
international
Environmental
Management System ISO
14001:2015 in Sept’18
• Installation of 10 MW
Solar Power Plant
• Majority of the operational
and under construction
assets are certified for
ISO 9001 : QMS, ISO
14001 : EMS, OHSAS
18001
• Plantation of new
10,000+ saplings at
different location to
increase the green
density in addition to
already existing Green
Belt
• DFCC projects certified
with ISO14001 for
Environmental
management system and
working under the strict
environmental norms of
World Bank in DFCC
projects.
• Operational units in
Kakinada Industrial Park
are in the Green &
Orange Category
Company has invested substantially and allocated resources to increase adherence to environmental standards and pollution
control measures and enhance environment health safety levels
DIAL GHIAL Energy Others
* LEED = Leadership in Energy & Environmental Design

41
Visionary Leadership
Company has an independent external advisory council comprising eminent industry leaders
providing inputs on business strategies
GM Rao
Group Chairman
• Founder Chairman of the Group
• Since 1978, he has successfully led the
Group creating infrastructure assets of
national importance
Srinivas Bommidala
Chairman, Energy
and International
Airports
GBS Raju
Chairman,
Airports
G Kiran Kumar
Corporate
Chairman & MD
B V N Rao
Chairman,
Transportation
and Urban
Infra
NC Sarabeswaran
• Ex- nominee director of
RBI and Vysya Bank
Board
R S S L N
Bhaskarudu
• Ex- MD of Maruti Udyog
Limited
S Sandilya
• Chairman - Eicher Motors
• Board Member - Mastek
S Rajagopal
• Ex-Chairman & MD of
Bank of India, Indian Bank
C. R. Muralidharan
• Ex-CGM of RBI and an Ex-
member of IRDA
Kameswari Vissa
• CA with 24 yrs of
experience
• Board Member: L&T
valves, Madura microfin.
INDEPENDENT DIRECTORS ON GMR BOARDGROUP DIRECTORS ON GMR BOARD
Madhva
Bhimacharya
Terdal
Whole Time
Director
Suresh Narang
• Ex-Board member of
Mandiri Securities
• Ex-Chief Country Officer
of Deutsche Bank in
Indonesia
ADDITIONAL DIRECTOR

42
Committed to “Giving Back” to the Community through GMR
Varalakshmi Foundation
“To make sustainable impact on the human development of under-served
communities through initiatives in education, health and livelihoods”
Mission of GMR
Varalakshmi Foundation
Our Four Pronged approachThrough
“Our Projects”
▪ Working with communities where:
o Group has business operations- 25
locations in India & 1 in Nepal
o 350+ school & 35 K students
o Vocational training to ~44K
▪ GHIAL recognized as an example of
“Reaching out to Bottom of Pyramid”
in 2012/13
Through
“Personal Philanthropy”
▪ Started from Rajam (A.P) in 1991
▪ Personal Holding in the Group -
pledged to foundation by GM Rao
▪ Family Constitution ensures donation
by the family members to the
Foundation
GMR Varalakshmi Foundation
Education
Health, Hygiene & Sanitation
Community Development
Livelihood
*National Voluntary Guidelines for Responsible Business published by Ministry of Corporate Affairs
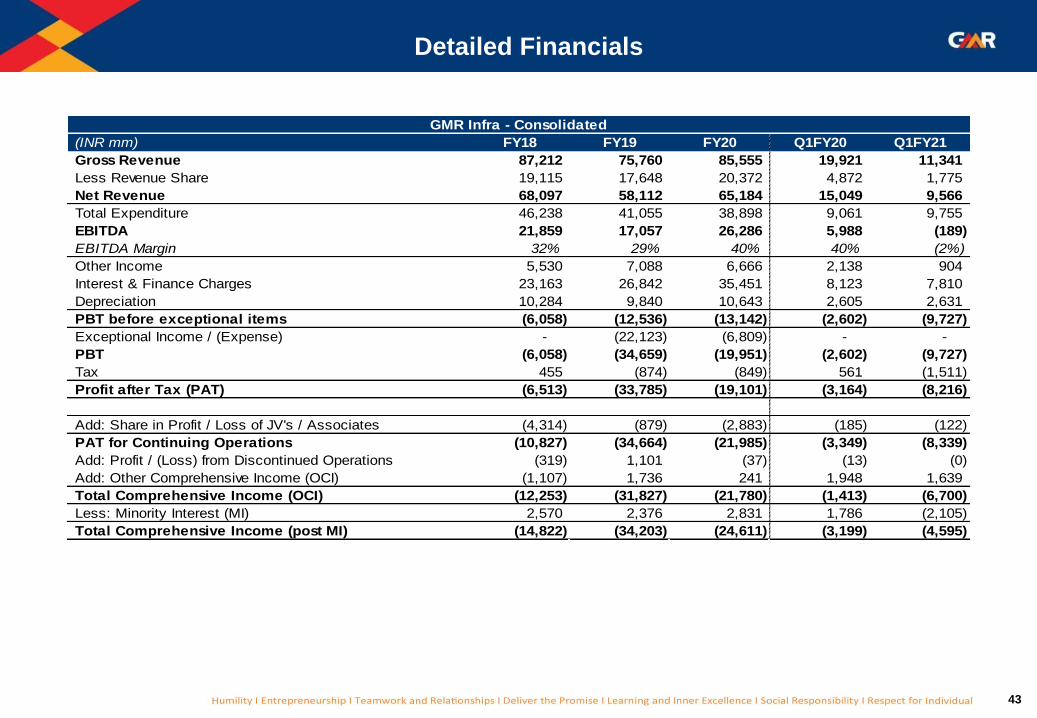
43
Detailed Financials
(INR mm) FY18 FY19 FY20 Q1FY20 Q1FY21
Gross Revenue 87,212 75,760 85,555 19,921 11,341
Less Revenue Share 19,115 17,648 20,372 4,872 1,775
Net Revenue 68,097 58,112 65,184 15,049 9,566
Total Expenditure 46,238 41,055 38,898 9,061 9,755
EBITDA 21,859 17,057 26,286 5,988 (189)
EBITDA Margin 32% 29% 40% 40% (2%)
Other Income 5,530 7,088 6,666 2,138 904
Interest & Finance Charges 23,163 26,842 35,451 8,123 7,810
Depreciation 10,284 9,840 10,643 2,605 2,631
PBT before exceptional items (6,058) (12,536) (13,142) (2,602) (9,727)
Exceptional Income / (Expense) - (22,123) (6,809) - -
PBT (6,058) (34,659) (19,951) (2,602) (9,727)
Tax 455 (874) (849) 561 (1,511)
Profit after Tax (PAT) (6,513) (33,785) (19,101) (3,164) (8,216)
Add: Share in Profit / Loss of JV's / Associates (4,314) (879) (2,883) (185) (122)
PAT for Continuing Operations (10,827) (34,664) (21,985) (3,349) (8,339)
Add: Profit / (Loss) from Discontinued Operations (319) 1,101 (37) (13) (0)
Add: Other Comprehensive Income (OCI) (1,107) 1,736 241 1,948 1,639
Total Comprehensive Income (OCI) (12,253) (31,827) (21,780) (1,413) (6,700)
Less: Minority Interest (MI) 2,570 2,376 2,831 1,786 (2,105)
Total Comprehensive Income (post MI) (14,822) (34,203) (24,611) (3,199) (4,595)
GMR Infra - Consolidated

44
(INR mm) FY18 FY19 FY20 Q1FY20 Q1FY21
Aero Revenue 25,108 18,982 20,628 4,695 746
Non Aero Revenues 27,356 32,665 33,640 8,445 3,617
CPD Rentals 1,874 2,069 7,641 1,457 580
Gross Revenues 54,338 53,716 61,909 14,597 4,944
Less: Revenue Share 18,144 16,528 19,136 4,558 1,607
Net Revenue 36,194 37,188 42,773 10,039 3,337
Operating Expenditure 15,887 20,696 20,121 4,723 4,288
EBITDA 20,307 16,492 22,652 5,316 (951)
EBITDA Margin 56% 44% 53% 53% (29%)
Other Income 4,138 5,642 5,205 1,622 534
Interest & Finance Charges 8,918 10,982 13,825 3,216 3,586
Depreciation 8,947 8,483 8,908 2,223 2,383
PBT 6,580 2,669 5,124 1,499 (6,386)
Tax (50) (1,104) 1,355 491 (1,534)
Profit after Tax (PAT) 6,630 3,773 3,768 1,008 (4,852)
Add: Share in Profit / Loss of JVs / Associates 1,662 1,820 1,570 372 (170)
PAT (After share in JVs / Associates) 8,292 5,593 5,339 1,380 (5,022)
Airports Business - Consolidated
Detailed Financials