pirls reporting australia’s results 2016
TRANSCRIPT
PIRLS 2016Reporting Australia’s results
Sue Thomson
Kylie Hillman
Marina Schmid
Sima Rodrigues
Jessica Fullarton

First published 2017 by Australian Council for Educational Research Ltd 19 Prospect Hill Road, Camberwell, Victoria, 3124, Australia
www.acer.org www.acer.org/pirls
Text © Australian Council for Educational Research Ltd
Cover design, text design and typesetting by ACER Creative Services
This report is copyright. All rights reserved. Except under the conditions described in the Copyright Act 1968 of Australia and subsequent amendments, and any exceptions permitted under the current statutory licence scheme administered by Copyright Agency (www.copyright.com.au), no part of this publication may be reproduced, stored in a retrieval system, transmitted, broadcast or communicated in any form or by any means, optical, digital, electronic, mechanical, photocopying, recording or otherwise, without the written permission of the publisher.
ISBN 9781742864952 (ebook)
The views expressed in this report are those of the authors and not necessarily those of the Commonwealth, state and territory governments.
A catalogue record for this book is available from the National Library of Australia

Contents iii
Contents
List of Tables iv
List of Figures v
Executive summary vii
Acknowledgements xiii
Reader’s Guide xv
Chapter 1: Introduction 1
Chapter 2: Year 4 reading results: International, national and Australian demographic groups 13
Chapter 3: Findings for schools and the learning environment in Australia 41
Chapter 4: Findings for teachers and the teaching of reading in Australia 65
Chapter 5: Student attitudes and engagement 83
References 95
Appendix A 97
Appendix B 103

PIRLS 2016: Reporting Australia’s resultsiv
List of Tables
TABLE 1.1 PIRLS reading purposes, processes and proportion of assessment 3
TABLE 1.2 The PIRLS Context Questionnaire Framework 4
TABLE 1.3 The PIRLS 2016 designed and achieved school and student sample for Australia 6
TABLE 1.4 The average age of Year 4 students by Australian jurisdiction and overall 7
TABLE 1.5 The PIRLS 2016 international benchmarks for Year 4 reading 9
TABLE 2.1 Relative trends in Year 4 reading achievement, by country 22
TABLE 2.2 Multiple comparisons of Year 4 reading achievement, by jurisdiction 24
TABLE 2.3 Relative achievement in the Year 4 reading purposes, for Australia and by jurisdiction, sex and Indigenous background 38
TABLE 2.4 Relative achievement in the Year 4 reading processes, for Australia and by jurisdiction, sex and Indigenous background 39
TABLE 2.5 Trends in Australian achievement in the Year 4 reading purposes and processes 39
TABLE 3.1 Principals’ formal education, Australia and the international average 43
TABLE 3.2 Principals’ years of experience, Australia and the international average 44
TABLE 3.2 Principals’ reports on School Discipline Problems scale items, by school socioeconomic background 59
TABLE 3.3 Percentage of Australian students’ responses to items on the Student Bullying scale 63
TABLE 4.1 Qualifications held by Year 4 reading teachers, Australia and the international average 67
TABLE 4.2 Emphasis on language and reading areas in teachers’ formal education, Australia and the international average 68
TABLE 4.3 Year 4 reading teachers’ years of experience, Australia and the international average 69
TABLE 4.4 Instruction time spent on language and reading, Australia and comparison countries 71
TABLE 4.5 Organisation of students for reading instruction, Australia and the international average 71
TABLE 4.6 Types of literary texts assigned for reading instruction, Australia and the international average 72
TABLE 4.7 Types of informational texts assigned for reading instruction, Australia and the international average 73
TABLE 4.8 Computer activities during reading lessons and Year 4 student achievement in reading, Australia and the international average 75
TABLE A.1 Rates of exclusion from the Australian national target population for PIRLS 2016 98
TABLE A.2 Allocation of school sample in Australia for PIRLS 2016 99
TABLE A.3 Student sample sizes in Australia for PIRLS 2016 99
TABLE A.4 PIRLS 2016 participation rates (weighted) for Australia 100
TABLE B.1 Mean scores for Year 4 reading achievement, 2011–2016 by country 103
TABLE B.2 Mean scores for Year 4 reading achievement, 2011–2016 by Australian jurisdiction 104
TABLE B.3 Demographic characteristics associated with being a poorer reader for Australian students in PIRLS 2016 105

Contents v
List of Figures
FIGURE 1.1 Map of countries and benchmarking entities participating in PIRLS 2016 5
BOX 1.1 Advanced international benchmark, Year 4 reading – example literary item 10
BOX 1.2 Advanced international benchmark, Year 4 reading – example informational item 10
BOX 1.3 Intermediate international benchmark, Year 4 reading – example literary item 11
BOX 1.4 Intermediate international benchmark, Year 4 reading – example informational item 11
BOX 1.5 Low international benchmark, Year 4 reading – example literary item 11
BOX 1.6 Low international benchmark, Year 4 reading – example informational item 12
FIGURE 2.1 Mean scores and distribution of Year 4 reading achievement, by country 16
FIGURE 2.2 Percentage of students at the international benchmarks for Year 4 reading, by country 18
FIGURE 2.3 Trends in Year 4 reading achievement scores, 2001–2016, selected countries 20
FIGURE 2.4 Trends in Year 4 reading achievement score and distribution, 2011–2016, Australia 21
FIGURE 2.5 Percentage of students in year 4 reading below the Low benchmark and at or above the Advanced benchmark in PIRLS 2011–2016, by country 23
FIGURE 2.6 Mean scores and distribution of Year 4 reading achievement, by jurisdiction 24
FIGURE 2.7 Percentage of Australian students at the international benchmarks for Year 4 reading, by jurisdiction and international comparisons 25
FIGURE 2.8 Trends in Year 4 reading achievement by jurisdiction 25
FIGURE 2.9 Percentage of students at the international benchmarks for reading in PIRLS 2011–2016, by jurisdiction 26
FIGURE 2.10 Sex differences in Year 4 reading achievement, by country 27
FIGURE 2.11 Mean scores and distribution of Year 4 reading achievement within Australia, by sex 28
FIGURE 2.12 Percentage of Australian students at the international benchmarks for Year 4 reading, by sex 28
FIGURE 2.13 Trends in Year 4 reading achievement within Australia, 2011–2016, by sex 29
FIGURE 2.14 Sex differences in Year 4 reading achievement within Australia, by jurisdiction and international comparisons 29
FIGURE 2.15 Percentage of Australian students at the international benchmarks for Year 4 reading, by sex within jurisdiction 30
FIGURE 2.16 Mean scores and distribution of Year 4 reading achievement within Australia, by Indigenous background 31
FIGURE 2.17 Percentage of Australian students at the international benchmarks for Year 4 reading, by Indigenous background 31
FIGURE 2.18 Trends in Year 4 reading achievement within Australia, 2011-2016, by Indigenous background 32
FIGURE 2.19 Mean scores and distribution of Year 4 reading achievement within Australia, by language spoken at home 32
FIGURE 2.20 Percentage of Australian students at the international benchmarks for Year 4 reading, by language spoken at home 33
FIGURE 2.21 Mean scores and distribution of Year 4 reading achievement within Australia, by number of books in the home 33
FIGURE 2.22 Percentage of Australian students at the international benchmarks for Year 4 reading, by number of books in the home 34
FIGURE 2.23 Mean scores and distribution of Year 4 reading achievement within Australia, by school socioeconomic composition 35

PIRLS 2016: Reporting Australia’s resultsvi
FIGURE 2.24 Percentage of Australian students at the international benchmarks for Year 4 reading, by school socioeconomic composition 35
FIGURE 2.25 Mean scores and distribution of Year 4 reading achievement within Australia, by geographic location 36
FIGURE 2.26 Percentage of Australian students at the international benchmarks for Year 4 reading, by geographic location 36
FIGURE 3.1 Socioeconomic composition of schools and Australian student achievement in reading 45
FIGURE 3.2 Language background of Australian schools’ populations and student achievement in reading 46
FIGURE 3.3 Language background of school Australian populations and school socioeconomic background 46
FIGURE 3.4 Reading achievement by language background and school socioeconomic background 47
FIGURE 3.5 Schools Where Students Enter the Primary Grades with Literacy Skills scale and Australian student achievement in reading 48
FIGURE 3.6 Schools Where Students Enter the Primary Grades with Literacy Skills scale and Australian school socioeconomic background 49
FIGURE 3.7 The Reading Resource Shortages scale and Australian student achievement in reading 50
FIGURE 3.8 The Reading Resource Shortages scale and school socioeconomic background 51
FIGURE 3.9 The Students’ Sense of Belonging scale and Australian student achievement in reading 52
FIGURE 3.10 The Students’ Sense of Belonging scale by school socioeconomic background 52
FIGURE 3.11 The School Emphasis on Academic Success scale (principals’ reports) and Australian student achievement in reading 53
FIGURE 3.12 The School Emphasis on Academic Success scale (principals’ reports) and school socioeconomic background 54
FIGURE 3.13 The School Emphasis on Academic Success scale (teachers’ reports) and Australian student achievement in reading 55
FIGURE 3.14 The School Emphasis on Academic Success scale (teachers’ reports) and school socioeconomic background 56
FIGURE 3.15 The Teacher Job Satisfaction scale and Australian student achievement in reading 57
FIGURE 3.16 The School Discipline Problems scale and Australian student achievement in reading 58
FIGURE 3.17 The School Discipline Problems scale and school socioeconomic background 59
FIGURE 3.18 The Safe and Orderly School scale and Australian student achievement in reading 60
FIGURE 3.19 The Safe and Orderly School scale and school socioeconomic background 61
FIGURE 3.20 The Student Bullying scale and Australian student achievement in reading 62
FIGURE 3.21 The Student Bullying scale and school socioeconomic background 62
FIGURE 4.1 Percentage of Australian Year 4 students by the age of their reading teachers, by jurisdiction 66
FIGURE 4.2 Percentage of Australian Year 4 students by the sex of their reading teachers, by jurisdiction 67
FIGURE 4.3 Percentage of Year 4 students by reading teachers’ time spent on professional development, Australia and the international average 70
FIGURE 4.4 Reading skills and strategies emphasised by teachers on at least a weekly basis, Australia and the international average 74
FIGURE 4.5 Students Limit Classroom Instruction scale and Australian student achievement in reading 76
FIGURE 4.6 Students Limit Classroom Instruction scale by school socioeconomic background 76
FIGURE 4.7 Students Limit Classroom Instruction scale and Australian student achievement in reading by school socioeconomic background 77
FIGURE 4.8 Frequency of student absences and Australian student achievement in reading 78

Contents vii
FIGURE 4.9 Frequency of student absences, by school socioeconomic background 78
FIGURE 4.10 Frequency of student absences and Australian student achievement in reading, by school socioeconomic background 79
FIGURE 4.11 Students arrive at school feeling tired or hungry and Australian student achievement in reading 80
FIGURE 4.12 Students arrive at school feeling hungry, by school socioeconomic background 80
FIGURE 4.13 Students arrive at school feeling tired, by school socioeconomic background 81
FIGURE 5.1 The Students Like Reading scale and Year 4 student achievement in reading, Australia and the international average 85
FIGURE 5.2 The Students Like Reading scale and Year 4 student achievement in reading, by sex 85
FIGURE 5.3 The Students Like Reading scale and Year 4 student achievement in reading, by Indigenous background 86
FIGURE 5.4 The Students Like Reading scale and Year 4 student achievement in reading, by number of books in the home 87
FIGURE 5.5 The Student Confidence in Reading scale, by the Students Like Reading Scale, Australian Students 88
FIGURE 5.6 The Student Confidence in Reading scale and Year 4 student achievement in reading, Australia and the international average 88
FIGURE 5.7 The Student Confidence in Reading scale and Year 4 student achievement in reading, by sex 89
FIGURE 5.8 The Student Confidence in Reading scale and Year 4 student achievement in reading, by Indigenous background 90
FIGURE 5.9 The Student Confidence in Reading scale and Year 4 student achievement in reading, by books in the home 91
FIGURE 5.10 The Student Engagement in Reading Lessons scale and Year 4 student achievement in reading, Australia and the international average 92
FIGURE 5.11 The Student Engagement in Reading Lessons scale and Year 4 student achievement in reading, by sex 93
FIGURE 5.12 The Student Engagement in Reading Lessons scale and Year 4 student achievement in reading, by Indigenous background 93
FIGURE 5.13 The Student Engagement in Reading Lessons scale and Year 4 student achievement in reading, by books in the home 94

PIRLS 2016: Reporting Australia’s resultsviii
Executive summary
The Progress in International Reading Literacy Study (PIRLS) is an international comparative study of student achievement directed by the International Association for the Evaluation of Educational Achievement (IEA). PIRLS 2016 represents the fourth such study since PIRLS was first conducted in 2001. Australia has participated in the two most recent cycles – PIRLS 2011 and 2016.
In Australia, PIRLS is managed by the Australian Council for Educational Research (ACER) and is jointly funded by the Australian Government and the state and territory governments.
The goal of PIRLS is to provide the best policy-relevant information about how to improve teaching and learning and to help young students become accomplished and self-sufficient readers, by assisting countries monitor and evaluate their teaching of reading across time.
Students in the fourth year of schooling typically have gained most of their reading skills in a multitude of environments – at school and at home; in different classrooms with different teachers. In order to reflect this situation, PIRLS collects a rich array of background data from students, schools and teachers, and also collects data about the education systems themselves.
This report analyses and interprets the Australian data collected as part of PIRLS 2016. Where appropriate, this report makes comparisons with the results of other countries and with the international average to better understand Australian achievement in reading literacy and its context.
Who was assessed?Across the world, over 580,000 Year 4 students in 50 countries and 11 benchmarking entities took part in PIRLS 2016.
Within Australia, a stratified random sample of 286 primary schools participated in the data collection for PIRLS 2016. The stratification of the sample ensured that the PIRLS sample was representative of the Australian Year 4 population (according to jurisdiction, school sector, geographic location of each school and socioeconomic category for the area of each school).
At each sampled school, one intact Year 4 class – along with all Indigenous students in that year level – was selected to participate in PIRLS 2016. This resulted in a sample of 6341 Year 4 students. Statistical weighting enables these students to represent the total student population at Year 4.

Executive summary ix
What was assessed?The reading assessment in PIRLS is organised around two dimensions – the purposes for reading, and the processes of comprehension readers use in understanding the texts and their related questions.
The two purposes for reading that account for most of the reading activities done by young students in and out of school are identified in PIRLS as reading for literary experience and reading to acquire and use information.
Within each of these two major reading purposes, four processes of comprehension are also assessed:
� focusing on and retrieving explicitly stated information
� making straightforward inferences
� interpreting and integrating ideas and information
� examining and evaluating content, language, and textual elements.
Overall, half of the PIRLS assessment focuses on reading for literary experience and half on reading to acquire and use information.
What did PIRLS 2016 participants do?Students completed a PIRLS booklet, which contained two short texts (either two literary texts, two informational texts or one of each) and their associated questions. In total, 12 texts were used in the PIRLS 2016 assessment, which included six texts used in PIRLS 2011. These texts and their associated test questions were combined to create 16 different PIRLS booklets, each containing multiple-choice and constructed response items. The booklets were evenly distributed within each participating class, thus, only one or two students in each class completed a particular PIRLS booklet. After completing their PIRLS reading assessment, students were asked to complete a background questionnaire, which sought information on home contexts, and on their characteristics and attitudes towards learning and reading.
Teachers, principals and curriculum experts also completed questionnaires, which enabled collection of information about the various contexts of teaching and learning reading.
How are the results reported?Results are reported as average scores with standard errors, as distributions of scores and as percentages of students who attain the international benchmarks, for countries and for specific groups of students within Australia.
The international benchmarks were developed using scale-anchoring techniques. Internationally, it was decided that performance should be measured at four levels: the ‘Advanced international benchmark’, which was set at 625 score points; the ‘High international benchmark’, which was set at 550 score points; the ‘Intermediate international benchmark’, which was set at 475 score points; and the ‘Low international benchmark’, which was set at 400 score points.
Year 4 reading results: International, national and Australian demographic groups
Key findings � The mean score for Australian students on PIRLS 2016 was 544 points, a statistically significant 17
points higher than in PIRLS 2011.
� Australian students performed significantly higher, on average, than students in 24 countries, including three other countries that tested in English – New Zealand, Trinidad and Tobago, and Malta.
� Australian Year 4 students were outperformed by students in 13 countries, including Singapore, Hong Kong, Ireland, Northern Ireland and England (all testing in English), as well as the Russian Federation, Finland and Poland.
PIRLS 2016: Reporting Australia’s resultsx
� Sixteen per cent of Australian students reached the Advanced international benchmark, compared to 29 per cent of students in Singapore, 26 per cent in the Russian Federation and 22 per cent in Northern Ireland.
� Eighty-one per cent of Australian Year 4 students reached the Intermediate international benchmark, which is the proficient standard for Australia.
� Australian students showed a relative strength in the Literary reading purpose (reading for interest and pleasure) but the score on the Informational reading purpose (reading to gain information) was not different to the overall reading score.
� Performance across the Australian jurisdictions was fairly similar, with the only exceptions being that students in Victoria performed at the same level as students in the Australian Capital Territory and at a level higher than all other jurisdictions, while students in South Australia performed significantly lower, on average, than students in Western Australia and the Australian Capital Territory, as well as those in Victoria.
� All jurisdictions saw an increase in the proportion of students at the Advanced international benchmark, and Victoria, Queensland and Western Australia had a large decrease in the proportion of students at or below the Low international benchmark.
� Female students continue to perform at a higher level in reading literacy, on average, than their male peers.
� Fifty-seven per cent of Australian Indigenous students reached the Intermediate international benchmark, compared to 83 per cent of non-Indigenous students.
� Students who primarily spoke English at home scored a statistically significant 15 points higher, on average, than students who spoke a language other than English at home.
� Twenty-eight per cent of students who reported many books in the home reached the Advanced international benchmark, compared to 17 per cent of students with an average number of books, and just 4 per cent of students with a few books.
� Eighteen per cent of students in metropolitan schools, compared with 22 per cent of students in provincial schools and 30 per cent of those in remote schools, did not achieve the Intermediate benchmark.
Schools and the learning environment in Australia
Key findings � Forty-one per cent of students attended schools in which the principal had completed a
postgraduate university degree, and about 30 per cent had a principal with between 10 and 20 years of experience.
� Thirty-five per cent of students attended schools categorised by their principals as having a more affluent student population, 26 per cent as having a more disadvantaged student population and the remainder were in schools that were neither more affluent nor more disadvantaged.
� Students attending more affluent schools scored 61 points higher, on average, than students attending more disadvantaged schools.
� Students in schools whose principals indicated that 90 per cent or more of the students had English as their first language tended to have higher average achievement than students in schools whose principals indicated that less than 90 per cent of the student population had English as their first language.
� Students attending more affluent schools were more likely than those attending more disadvantaged schools to be in an environment where most students spoke English as their first language.
� Students who attended schools where less than 25 per cent of students had literacy skills upon entry to school had significantly lower achievement, on average, than students who attended schools where more than 25 per cent of students had literacy skills upon entry to school.
� Of those students at more affluent schools, 7 per cent attended schools in which more than 75 per cent of students entered school with literacy skills, compared to none in more disadvantaged schools. In contrast, 81 per cent of students in more disadvantaged schools were in schools in

Executive summary xi
which fewer than 25 per cent of students entered with literacy skills, compared to 42 per cent of students in more affluent schools.
� Sixty-four per cent of students attended schools where reading instruction was not affected by resource shortages, and average reading scores were significantly higher in these schools compared those in which instruction was affected by resource shortages.
� A greater proportion of students in more disadvantaged schools than in more affluent schools were affected by reading resource shortages (58% and 26%, respectively).
� More than half of Australian Year 4 students were categorised as having a high sense of school belonging, 33 per cent had some sense of belonging and 10 per cent had little sense of school belonging. Students with a high sense of school belonging scored 37 points higher, on average, than students with little sense of school belonging.
� There was a clear relationship between Australian students’ reading achievement and their principals’ and teachers’ reports of school emphasis on academic success, with a higher emphasis on academic success associated with higher average achievement.
� Only 4 per cent of students in more disadvantaged schools were in environments with a very high emphasis on academic success, as rated by their principals, compared to 26 per cent of students at more affluent schools.
� Job satisfaction was relatively high among Australian teachers, with only 2 per cent of Year 4 students being taught by a teacher who was less than satisfied, and 58 per cent taught by a teacher who was very satisfied. There was no difference in the average job satisfaction scores of teachers in more affluent schools and more disadvantaged schools.
� There was a clear relationship between Australian students’ reading achievement and their principals’ reports of school discipline problems – with fewer discipline problems associated with higher achievement. Students who attended more disadvantaged schools were far more likely than those in more affluent schools to face moderate to severe problems regarding school discipline.
� Higher teacher ratings on the Safe and Orderly Schools scale were associated with higher student achievement, on average. Sixty per cent of students at more disadvantaged schools and 86 per of students at more affluent schools had teachers who classified the school as being very safe and orderly, however 7 per cent of students in more disadvantaged schools were in environments deemed by their teachers to be less than safe and orderly.
� Nineteen per cent of Australian Year 4 students reported being bullied about weekly. Students who reported almost never being bullied had average reading scores more than 30 points higher than students who reported being bullied about weekly. Fifteen per cent of students who attended more affluent schools, compared to 23 per cent of students who attended more disadvantaged schools, reported being bullied about weekly.
Teachers and the teaching of reading in Australia
Key findings � The majority of Year 4 students (84%) were taught reading by a female teacher.
� Over 80 per cent of Year 4 students were being taught by a teacher with a bachelor’s degree or equivalent, with a further 12 per cent of students being taught by a teacher with a postgraduate degree.
� The relationship between the amount of time teachers reported spending in professional development and Australian student performance on the PIRLS assessments ran counter to what may have been expected – students whose teachers had spent 16 or more hours in professional development scored lower (544 points) on average than students whose teachers had spent less than six hours on professional development (556 points).
� A far greater proportion of Australian Year 4 students, compared to the international average, had computers available for use during reading lessons.
� There was a clear relationship between the reading achievement of Australian students and teachers’ reports that their teaching was limited by student needs, with fewer limitations associated with higher reading achievement.
� There was a clear relationship between the reading achievement of Australian students and the frequency of student absences, with fewer absences associated with higher reading achievement.

PIRLS 2016: Reporting Australia’s resultsxii
Student attitudes and engagement
Key findings � Students who reported enjoying reading very much scored significantly higher, on average, in
reading than students who somewhat like reading, who in turn scored higher, on average, than students who do not like reading.
� Higher levels of student confidence in reading were also associated with higher scores on the PIRLS reading assessment.
� Students who were less than engaged during their reading lessons, according to their own report, scored significantly lower, on average, than other students.
� Among Indigenous students, there were no significant differences in the average reading scores of students who very much like reading and those who somewhat like reading. Students in both of these groups, however, scored higher in reading than students who do not like reading.
� There were no differences in the average reading scores of Indigenous students who were less than engaged, somewhat engaged or very engaged during their reading lessons.
� For students with a few books in the home, according to their own estimation, there were no significant differences in reading achievement associated with enjoyment of reading.
� The proportion of students with a few books in the home who were classified as not confident readers was more than twice the proportion of students with either an average number of books or many books at home who were not confident in their reading abilities.
Acknowledgements xiii
Acknowledgements
The funding for the Australian component of PIRLS 2016 was provided jointly by the Australian Government and the state and territory governments. All of Australia’s share of the international overheads and half of the basic funding for PIRLS within Australia was defrayed by the Australian Government Department of Education and Training (DET), while each state and territory government school system provided funding in proportion to the size of its student population.
In Australia, PIRLS is managed by a team from the Australian Council for Educational Research (ACER) and guided by the International Assessments Joint National Advisory Committee (IAJNAC). ACER wishes to thank the IAJNAC members for the continued interest in, and commitment to, the project through each of its phases. The IAJNAC members’ involvement included assisting with the implementation of PIRLS in schools in their jurisdictions, reviewing the report and providing valuable information to ensure the continued success of PIRLS in Australia.
The undertaking of PIRLS 2016 was a collaborative effort. A national survey such as PIRLS could not be undertaken successfully without the cooperation and contributions of the school systems, principals, teachers, parents and, of course, the students. Data of the quality collected and analysed in PIRLS depends upon a high participation rate of the randomly selected schools and students. Australia was able to meet the response criteria set internationally for school and students in PIRLS 2016. ACER gratefully recognises the assistance of the education system officials Australia-wide, and of the principals, teachers, parents and students in the participating schools, who gave generously of their time and support in contributing to the project.
Parts of this report are reproduced and/or modified, with permission, from the PIRLS 2016 International Results in Reading report and the PIRLS 2016 Assessment Framework:
Mullis, I.V.S., Martin, M.O., Foy, P. & Hooper, M. (2017). PIRLS 2016 International Results in Reading. Retrieved from: http://timssandpirls.bc.edu/pirls2016/international-results.html
Mullis, I.V.S. & Martin, M.O. (Eds.) (2015). PIRLS 2016 Assessment Framework. Retrieved from: http://timssandpirls.bc.edu/pirls2016/framework.html

PIRLS 2016: Reporting Australia’s resultsxiv

Reader’s Guide xv
Reader’s Guide
Sample surveysPIRLS is conducted as a sample survey in most participating countries. In surveys such as this, a sample of students is selected to represent the population of students at a particular year level in a given country. The samples are designed and conducted so that they provide reliable estimates about the population that they represent. Sample surveys are cheaper to undertake and less of a burden for schools than a full census of the particular population.
The basic sample design for PIRLS is generally referred to as ‘a two-stage stratified cluster sample design’. The first stage consists of a sample of schools and the second stage consists of the identification of a single classroom selected at random from the target year level in sampled schools.
Students in the selected classrooms are representative of the students in the population, and weights are used to adjust for any differences arising from intended features of the design (e.g. to oversample minorities) or non-participation by students who were selected. In this way we can provide measures of achievement for the population, based on the responses of a sample.
PIRLS achievement scalesPIRLS 2016 used item response theory (IRT) methods to summarise the achievement of students on a scale with a mean of 500 and a standard deviation of 100 (please refer to the international PIRLS website for more information about IRT methods: https://timssandpirls.bc.edu/publications/pirls/2016-methods.html).
The PIRLS reading scales for Year 4 were based on the 2001 assessment and the methodology enables comparable trend measures from assessment to assessment.
International comparison statisticsSeveral international comparison statistics are given in the report: the PIRLS scale centrepoint, the international average and the international median.
The PIRLS scale centrepoint is the mean of the scales for (Year 4 reading) established in the first cycle of the study (2001), calibrated to be 500, with a standard deviation of 100 score points.
PIRLS 2016: Reporting Australia’s resultsxvi
The international average is the mean score or percentage of all countries participating in PIRLS 2016 at that year level.
The international median is the midpoint in a ranking of countries ordered by score or percentage. By definition, half of the participating countries will have a score or percentage above the median and half below.
It should be noted that both the international average and the international median will vary depending on the set of countries included. Therefore, these statistics should be used in the context of a number of comparison statistics.
Standard errors and confidence intervalsIn this and other reports, student achievement is often described using a mean score. For PIRLS, each mean score is calculated from the sample of students who undertook the assessments. These sample means are an approximation of the actual mean score (known as the population mean) that would have been derived had all students in Australia participated in the PIRLS assessment. If another sample of students was chosen on a different day, it is highly likely that the sample mean would be slightly different. Indeed, the sample mean is just one point along the range of student achievement scores, and so more information is needed to gauge whether the sample mean is an underestimation or overestimation of the population mean.
In this report, means are presented with an associated standard error. The standard error is an estimate of the error in the estimate of the population mean from the sample and is based on the standard deviation of the sampling distribution of the mean. The size of the sample, as well as the variance in the scores within the sample, can affect the size of the standard error. Smaller samples, or samples with a greater variance in scores, will have larger standard errors.
The calculation of confidence intervals can assist our assessment of a sample mean’s precision as a population mean. Confidence intervals provide a range of scores within which we are ‘confident’ that the population mean actually lies. The confidence interval is within plus or minus 1.96 standard errors of the sample mean. Thus, a larger standard error results in a larger confidence interval and a greater likelihood that the confidence intervals of two means will overlap.
Statistical significanceThe term ‘significantly’ is used throughout the report to describe a difference that meets the requirements of statistical significance at the 0.05 level, and would be found in at least 95 analyses out of 100 if the comparison were to be repeated. It is not to be confused with the term ‘substantial’, which is qualitative and based on judgement rather than statistical comparisons. A difference may appear substantial but not be statistically significant (due to factors that affect the size of the standard errors around the estimate, for example) while another difference may seem small but reach statistical significance because the estimate was more accurate.
TrendsIt should be noted that a change in 2015 to the method of calculating standard errors means that standard errors for data from past cycles presented in the current report will not match those presented in earlier reports (please refer to the international PIRLS website for more information on calculation of standard errors: https://timssandpirls.bc.edu/publications/pirls/2016-methods.html). PIRLS 2016 is the second cycle in which Australia has participated in PIRLS, and so analysis of any trends is restricted to comparison of data from 2011 and 2016, and the standard errors for 2011 have been recalculated for this activity.
Reader’s Guide xvii
Rounding of figuresDue to rounding to eliminate decimals, some percentages in tables and figures may not exactly add to 100. Totals, differences and averages are always calculated on the basis of exact numbers and are rounded only after calculation. When standard errors have been rounded to one decimal place and the value 0.0 is shown, this does not imply that the standard error is zero, rather that its value is smaller than 0.05.
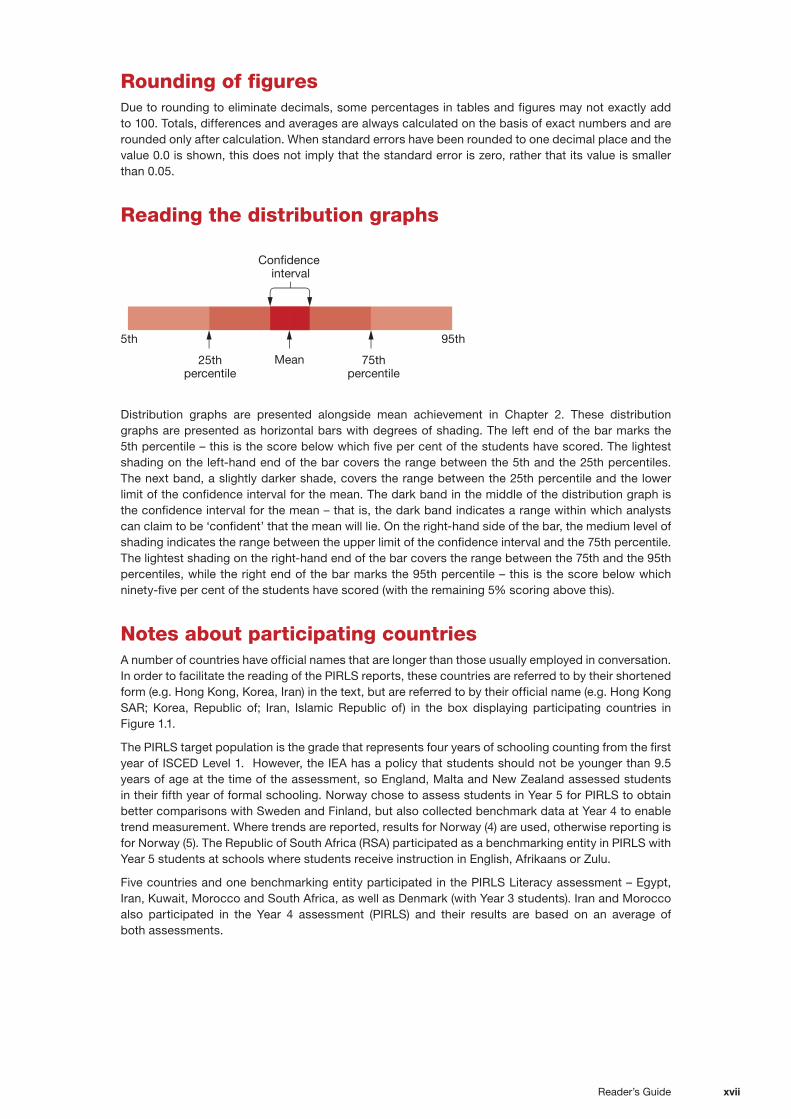
Reading the distribution graphs
Con�dence interval
Mean
5th 95th
25thpercentile
75thpercentile
Distribution graphs are presented alongside mean achievement in Chapter 2. These distribution graphs are presented as horizontal bars with degrees of shading. The left end of the bar marks the 5th percentile – this is the score below which five per cent of the students have scored. The lightest shading on the left-hand end of the bar covers the range between the 5th and the 25th percentiles. The next band, a slightly darker shade, covers the range between the 25th percentile and the lower limit of the confidence interval for the mean. The dark band in the middle of the distribution graph is the confidence interval for the mean – that is, the dark band indicates a range within which analysts can claim to be ‘confident’ that the mean will lie. On the right-hand side of the bar, the medium level of shading indicates the range between the upper limit of the confidence interval and the 75th percentile. The lightest shading on the right-hand end of the bar covers the range between the 75th and the 95th percentiles, while the right end of the bar marks the 95th percentile – this is the score below which ninety-five per cent of the students have scored (with the remaining 5% scoring above this).
Notes about participating countriesA number of countries have official names that are longer than those usually employed in conversation. In order to facilitate the reading of the PIRLS reports, these countries are referred to by their shortened form (e.g. Hong Kong, Korea, Iran) in the text, but are referred to by their official name (e.g. Hong Kong SAR; Korea, Republic of; Iran, Islamic Republic of) in the box displaying participating countries in Figure 1.1.
The PIRLS target population is the grade that represents four years of schooling counting from the first year of ISCED Level 1. However, the IEA has a policy that students should not be younger than 9.5 years of age at the time of the assessment, so England, Malta and New Zealand assessed students in their fifth year of formal schooling. Norway chose to assess students in Year 5 for PIRLS to obtain better comparisons with Sweden and Finland, but also collected benchmark data at Year 4 to enable trend measurement. Where trends are reported, results for Norway (4) are used, otherwise reporting is for Norway (5). The Republic of South Africa (RSA) participated as a benchmarking entity in PIRLS with Year 5 students at schools where students receive instruction in English, Afrikaans or Zulu.
Five countries and one benchmarking entity participated in the PIRLS Literacy assessment – Egypt, Iran, Kuwait, Morocco and South Africa, as well as Denmark (with Year 3 students). Iran and Morocco also participated in the Year 4 assessment (PIRLS) and their results are based on an average of both assessments.

PIRLS 2016: Reporting Australia’s resultsxviii
The proficient standardThe Measurement Framework for Schooling in Australia 2015 (Australian Curriculum, Assessment and Reporting Authority, 2015) specifies the proficient standard for PIRLS Reading as the Intermediate international benchmark. The Measurement Framework for Schooling in Australia is the basis for reporting on progress towards the Melbourne Declaration on Educational Goals for Young Australians (MCEETYA, 2008). Proficient standards represent a ‘challenging but reasonable’ expectation of student achievement. Further information on the PIRLS Intermediate benchmark and the types of tasks students at this level are capable of doing is provided in Chapter 1.
Definitions of background characteristicsThere are various definitions used in this report that are particular to the Australian context, as well as many that are used internationally. This section provides an explanation for those that may not be self-evident.
Number of books in the homeThis variable is used as a proxy for socioeconomic status, where information about parents’ occupations, education and wealth are not available. It is derived from student self-reports of the number of books in their homes. Their responses have been grouped so that a few books equals 25 or fewer books, an average number of books equals between 26 and 200 books and many books equals more than 200 books. Students with many books in the home generally come from households with higher socioeconomic status.
School socioeconomic compositionAs PIRLS does not collect detailed socioeconomic data from its Year 4 students (instead using the number of books in the home as a proxy measure of student level socioeconomic status), the school questionnaire asked school principals to report on the socioeconomic composition of their school by indicating what percentage of students came from economically affluent homes and what percentage came from economically disadvantaged homes. The responses to these questions were then used to create three categories of school socioeconomic composition:
� more affluent – schools where more than 25 per cent of the student body comes from economically affluent homes and not more than 25 per cent from economically disadvantaged homes
� more disadvantaged – schools where more than 25 per cent of the student body comes from economically disadvantaged homes and not more than 25 per cent from economically affluent homes
� neither more affluent nor more disadvantaged – all other response combinations.
Indigenous backgroundIndigenous background is derived from school records – collected from parents and guardians in accordance with the nationally agreed definitions as set out in the 2012 Data Standards Manual of the Australian Curriculum, Assessment and Reporting Authority – that identify students as being of Australian Aboriginal or Torres Strait Islander origin. Students were identified as either Indigenous or not Indigenous for the purpose of PIRLS.
Language spoken at homeThe language spoken at home variable is derived from student self-report of how often English was spoken at home. Where the student spoke English ‘never’ or only ‘sometimes’, the student was considered to speak a language other than English at home. Those who indicated that they spoke English ‘always’ or ‘almost always’ were considered to be English speakers in the home environment.

Reader’s Guide xix
Geographic location of the schoolIn Australia, the participating schools were coded with respect to the Ministerial Council on Education, Employment, Training and Youth Affairs (MCEETYA) Schools Geographic Location Classification. For the analysis in this report, only the broadest categories are used:
� metropolitan – including mainland state capital cities or major urban districts with a population of 100,000 or more (e.g. Queanbeyan, Cairns, Geelong, Hobart)
� provincial – including provincial cities and other non-remote provincial areas (e.g. Darwin, Ballarat, Bundaberg, Geraldton, Tamworth)
� remote – remote areas and very remote areas. Remote: very restricted accessibility of goods, services and opportunities for social interaction (e.g. Coolabah, Mallacoota, Capella, Mt Isa, Port Lincoln, Port Hedland and Alice Springs). Very remote: very little accessibility of goods, services and opportunities for social interaction (e.g. Bourke, Thursday Island, Yalata, Condingup, Nhulunbuy).
Teacher educationOne path to becoming a qualified teacher in Australia is to complete a graduate diploma in education, following completion of an undergraduate degree. For the purposes of this report, given that the graduate diploma is necessary for teacher accreditation, the graduate diploma has been included in the same category as the bachelor’s degree or equivalent. This was not the case in PIRLS 2011, when the graduate diploma was included as a postgraduate degree, thus responses to the teacher-education variable cannot be compared across cycles.

PIRLS 2016: Reporting Australia’s resultsxx

Introduction 1
1Chapter
Introduction
In 2016, Australia participated in the Progress in International Reading Literacy Study (PIRLS) for the second time. PIRLS is an assessment of the reading literacy of students at Year 4 level and has been conducted on a five-year cycle since 2001. PIRLS is an international study directed by the International Association for the Evaluation of Educational Achievement (IEA), an independent international cooperative of national research institutions and government agencies that has been conducting studies of cross-national achievement in a wide range of subjects since 1959.
In Australia, just over 6000 Year 4 students participated in PIRLS 2016. These students completed tests in reading achievement, and answered questionnaires on their background and experiences in learning reading at school. To inform educational policy in the participating countries, alongside the assessment of reading literacy, PIRLS also routinely collects extensive background information that addresses concerns about the quantity, quality and content of instruction. This background information is collected through a series of questionnaires for students, parents, teachers, principals and curriculum specialists.
Why PIRLS?Reading literacy is one of the most important abilities students acquire as they progress through their early school years. It forms the foundation for future learning across all academic subjects as well as for personal growth and recreation (Eunice Kennedy Shriver National Institute of Child Health and Human Development, 2000). Reading literacy also equips young students with the foundational skills that will be needed in order to participate fully in their communities and the larger society (Organisation for Economic Cooperation and Development, 2010).
The PIRLS definition of reading literacy
Reading literacy is the ability to understand and use those written language forms required by society and/or valued by the individual. Readers can construct meaning from texts in a variety of forms. They read to learn, to participate in communities of readers in school and everyday life, and for enjoyment.

1C
hapter
PIRLS 2016: Reporting Australia’s results2
The main goal of PIRLS is to assist countries to monitor and evaluate their teaching of reading across time. PIRLS offers countries an opportunity to:
� collect comprehensive and internationally comparable data about the reading concepts, processes and attitudes that students have learnt by Year 4
� assess progress internationally in reading learning across time for students in Year 4
� understand the contexts in which students learn best, since PIRLS enables international comparisons of the key policy variables in relation to school curricula, modes of instruction and provision of resources that result in higher levels of student achievement
� use PIRLS to address internal policy issues – within countries, for example, PIRLS provides an opportunity to examine the performance of population sub-groups (e.g. students in metropolitan, regional and remote school locations) and address equity concerns.
The goal of PIRLS is to provide the best policy-relevant information about how to improve teaching and learning and to help young students become accomplished and self-sufficient readers.
(Mullis, Martin, Foy & Hooper, 2017)
This report provides the Australian perspective for Year 4 achievement in reading, examining the issues presented above and issues particular to the Australian context, such as:
� How do Australian students score in reading?
� How does this compare internationally and what is happening within Australia?
� Are there trends over time in reading achievement that can be seen from these data?
� Has Australia’s achievement remained the same over the last five years in comparison to other countries to which we would normally compare ourselves?
Another characteristic of PIRLS is that data are also collected at the teacher and school level, and these data can be used to highlight characteristics of reading instruction in Australia.
The PIRLS Reading FrameworkThe PIRLS reading assessment is based on a comprehensive framework, which is developed by the Reading Development Group, made up of representatives from participating countries along with external reading consultants and members of the PIRLS International Study Center at Boston College.
Two purposes for reading are identified as accounting for most of the reading activities done by young students in and out of school:
� for literary experience
� to acquire and use information.
Within each of these two major reading purposes, four processes of comprehension are also assessed:
� focusing on and retrieving explicitly stated information
� making straightforward inferences
� interpreting and integrating ideas and information
� examining and evaluating content, language, and textual elements.
Overall, half of the PIRLS assessment focuses on reading for literary experience and half on reading to acquire and use information. The proportion of the assessment focusing on each of the four reading processes is shown in Table 1.1, along with examples of tasks relevant to each process.

1C
hap
ter
Introduction 3
TABLE 1.1 PIRLS reading purposes, processes and proportion of assessment
Purposes for reading
Proportion of assessment (%) Examples
Literary experience 50 Narrative fiction
Acquire and use information
50 Magazine articles
Processes of Comprehension
Focus on and retrieve explicitly stated information
20 Identifying information that is relevant to the specific goal of reading.
Looking for specific ideas.
Searching for definitions of words or phrases.
Identifying the setting of a story (e.g. time and place).
Finding the topic sentence or main idea (when explicitly stated).
Make straightforward inferences
30 Inferring that one event caused another event.
Concluding what is the main point made by a series of arguments.
Identifying generalisations made in the text.
Describing the relationship between two characters.
Interpret and integrate ideas and information
30 Discerning the overall message or theme of a text.
Considering an alternative to actions of characters.
Comparing and contrasting text information.
Inferring a story’s mood or tone.
Interpreting a real-world application of text information.
Evaluate and critique content and textual elements
20 Judging the completeness or clarity of information in the text.
Evaluating the likelihood that the events described could really happen.
Evaluating how likely an author’s argument would be to change what people think and do.
Judging how well the title of the text reflects the main theme.
Describing the effect of language features, such as metaphors or tone.
Determining an author’s perspective on the central topic.
Further details about the PIRLS 2016 Reading Assessment Framework are available from: https://timssandpirls.bc.edu/pirls2016/framework.html
The PIRLS 2016 Context Questionnaire FrameworkStudents in the fourth year of schooling typically have gained most of their reading skills in a multitude of environments – at school and at home; in different classrooms with different teachers. Community, school, classroom, and home environments that support each other can create extremely effective climates for learning. In order to reflect this situation, the PIRLS 2016 Context Questionnaire Framework encompasses five broad areas:
� national and community contexts
� home contexts
� school contexts
� classroom contexts
� student characteristics and attitudes toward learning.
This framework was used to develop questionnaires for students, parents, teachers, principals and national research centres to provide data at each level.
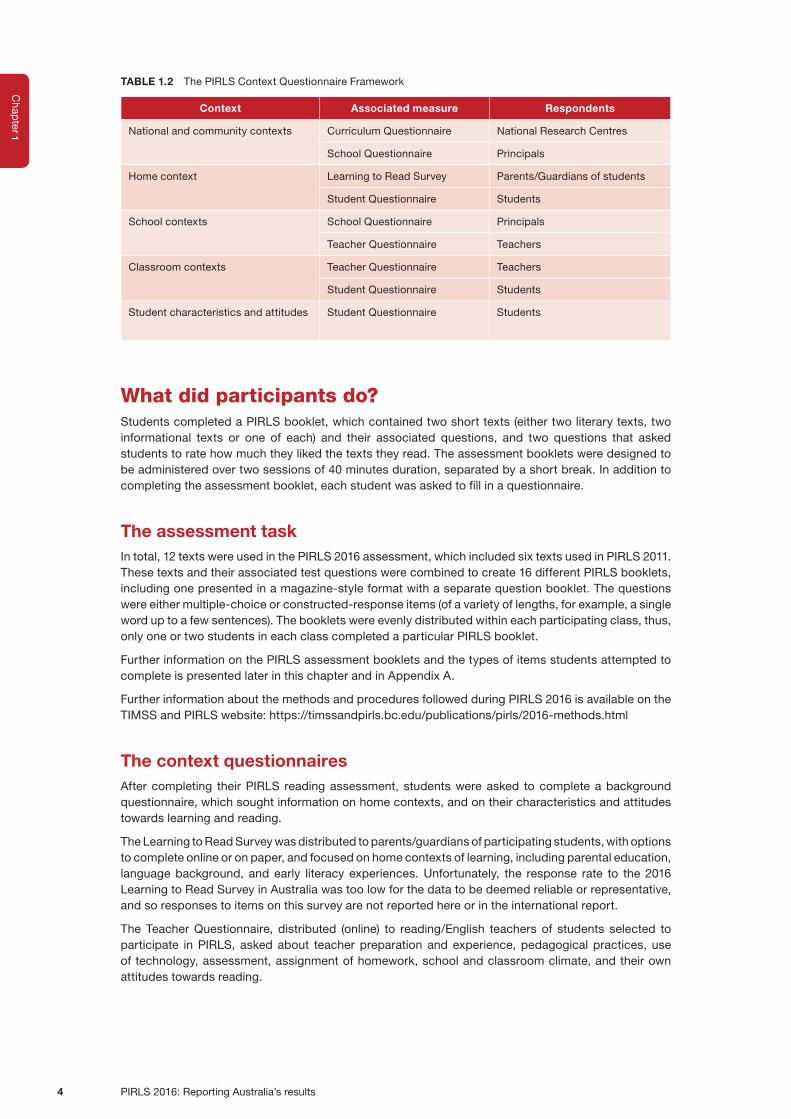
Table 1.2 presents a summary of the PIRLS context questionnaires, which cover a wide array of policy-relevant information about participating countries’ various contexts for teaching and learning reading.
1C
hapter
PIRLS 2016: Reporting Australia’s results4
TABLE 1.2 The PIRLS Context Questionnaire Framework
Context Associated measure Respondents
National and community contexts Curriculum Questionnaire National Research Centres
School Questionnaire Principals
Home context Learning to Read Survey Parents/Guardians of students
Student Questionnaire Students
School contexts School Questionnaire Principals
Teacher Questionnaire Teachers
Classroom contexts Teacher Questionnaire Teachers
Student Questionnaire Students
Student characteristics and attitudes Student Questionnaire Students
What did participants do?Students completed a PIRLS booklet, which contained two short texts (either two literary texts, two informational texts or one of each) and their associated questions, and two questions that asked students to rate how much they liked the texts they read. The assessment booklets were designed to be administered over two sessions of 40 minutes duration, separated by a short break. In addition to completing the assessment booklet, each student was asked to fill in a questionnaire.
The assessment taskIn total, 12 texts were used in the PIRLS 2016 assessment, which included six texts used in PIRLS 2011. These texts and their associated test questions were combined to create 16 different PIRLS booklets, including one presented in a magazine-style format with a separate question booklet. The questions were either multiple-choice or constructed-response items (of a variety of lengths, for example, a single word up to a few sentences). The booklets were evenly distributed within each participating class, thus, only one or two students in each class completed a particular PIRLS booklet.
Further information on the PIRLS assessment booklets and the types of items students attempted to complete is presented later in this chapter and in Appendix A.
Further information about the methods and procedures followed during PIRLS 2016 is available on the TIMSS and PIRLS website: https://timssandpirls.bc.edu/publications/pirls/2016-methods.html
The context questionnairesAfter completing their PIRLS reading assessment, students were asked to complete a background questionnaire, which sought information on home contexts, and on their characteristics and attitudes towards learning and reading.
The Learning to Read Survey was distributed to parents/guardians of participating students, with options to complete online or on paper, and focused on home contexts of learning, including parental education, language background, and early literacy experiences. Unfortunately, the response rate to the 2016 Learning to Read Survey in Australia was too low for the data to be deemed reliable or representative, and so responses to items on this survey are not reported here or in the international report.
The Teacher Questionnaire, distributed (online) to reading/English teachers of students selected to participate in PIRLS, asked about teacher preparation and experience, pedagogical practices, use of technology, assessment, assignment of homework, school and classroom climate, and their own attitudes towards reading.
1C
hap
ter
Introduction 5
The School Questionnaire, answered by the principal (or the principal’s designate), sought descriptive information about school characteristics, instructional time, resources and technology, school climate for learning, students’ school readiness, and principal preparation and experience.
The Curriculum Questionnaire focused on the reading curriculum, school organisational approaches and instructional practices in participating countries. Australia’s response to this extensive questionnaire was provided by the Australian Council for Educational Research (ACER), reviewed by curriculum experts in each state and territory education department, and then submitted to the International Study Center.
Further information about the curricula and education policies of participating PIRLS countries is available in the PIRLS 2016 Encyclopedia: https://timssandpirls.bc.edu/pirls2016/encyclopedia.html
Who participated?
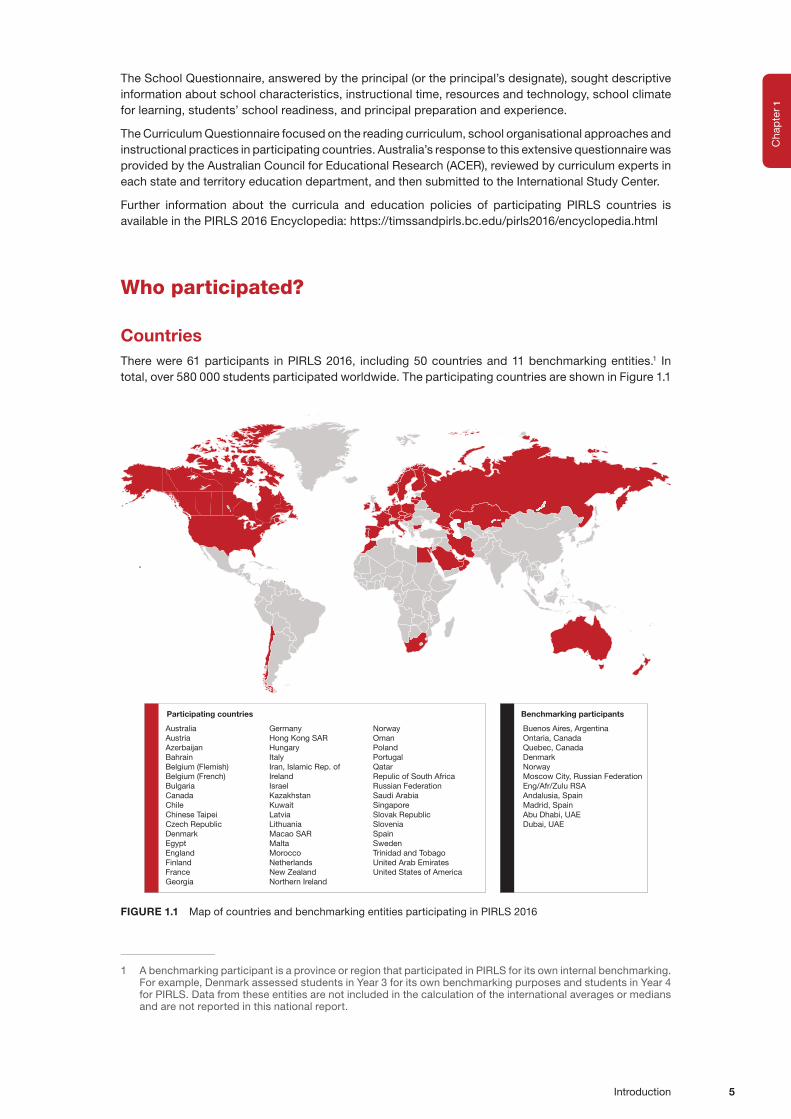
CountriesThere were 61 participants in PIRLS 2016, including 50 countries and 11 benchmarking entities.1 In total, over 580 000 students participated worldwide. The participating countries are shown in Figure 1.1
Participating countries
Buenos Aires, ArgentinaOntaria, CanadaQuebec, CanadaDenmarkNorwayMoscow City, Russian FederationEng/Afr/Zulu RSAAndalusia, SpainMadrid, SpainAbu Dhabi, UAEDubai, UAE
Benchmarking participants
AustraliaAustriaAzerbaijanBahrainBelgium (Flemish)Belgium (French)BulgariaCanadaChileChinese TaipeiCzech RepublicDenmarkEgyptEnglandFinlandFranceGeorgia
GermanyHong Kong SARHungaryItalyIran, Islamic Rep. ofIrelandIsraelKazakhstanKuwaitLatviaLithuaniaMacao SARMaltaMoroccoNetherlandsNew ZealandNorthern Ireland
NorwayOmanPolandPortugalQatarRepulic of South AfricaRussian FederationSaudi ArabiaSingaporeSlovak RepublicSloveniaSpainSwedenTrinidad and TobagoUnited Arab EmiratesUnited States of America
FIGURE 1.1 Map of countries and benchmarking entities participating in PIRLS 2016
1 A benchmarking participant is a province or region that participated in PIRLS for its own internal benchmarking. For example, Denmark assessed students in Year 3 for its own benchmarking purposes and students in Year 4 for PIRLS. Data from these entities are not included in the calculation of the international averages or medians and are not reported in this national report.
1C
hapter
PIRLS 2016: Reporting Australia’s results6
Schools and studentsThe international sample design for PIRLS is generally referred to as ‘a two-stage stratified cluster sample design’. The first stage consists of a sample of schools, which in Australia is stratified by jurisdiction, school sector (government, Catholic or independent), geographic location (metropolitan, regional or remote) and a socioeconomic variable.2 The intention is that the sample drawn will be representative of each of these strata.
The second stage of sampling consists of a sample of one or two intact classrooms from the target year in sampled schools. In most countries, 150 schools and one classroom in each school (resulting in at least 4500 participating students per country) were selected to participate in PIRLS 2016. In some countries, including Australia, a larger sample of schools and students participated in order to allow for meaningful comparisons to be made between different sections of the school population. In Australia, a larger sample of schools and students participated in PIRLS to produce reliable estimates for each of the Australian jurisdictions and also for Indigenous students.
In Australia, 286 primary schools participated in the data collection for PIRLS 2016. At least one intact class from each school from Year 4 from each school – along with all Indigenous students in that year level – was selected to participate in the assessment. In schools with composite or staged classes (i.e. classes with students from more than one year level), multiple classes were selected in order to provide sufficient numbers of Year 4 students, and only the Year 4 students participated in PIRLS. This resulted in a sample of 6341 Year 4 students. For more information about sampling and the Australian PIRLS sample, please refer to Appendix A.
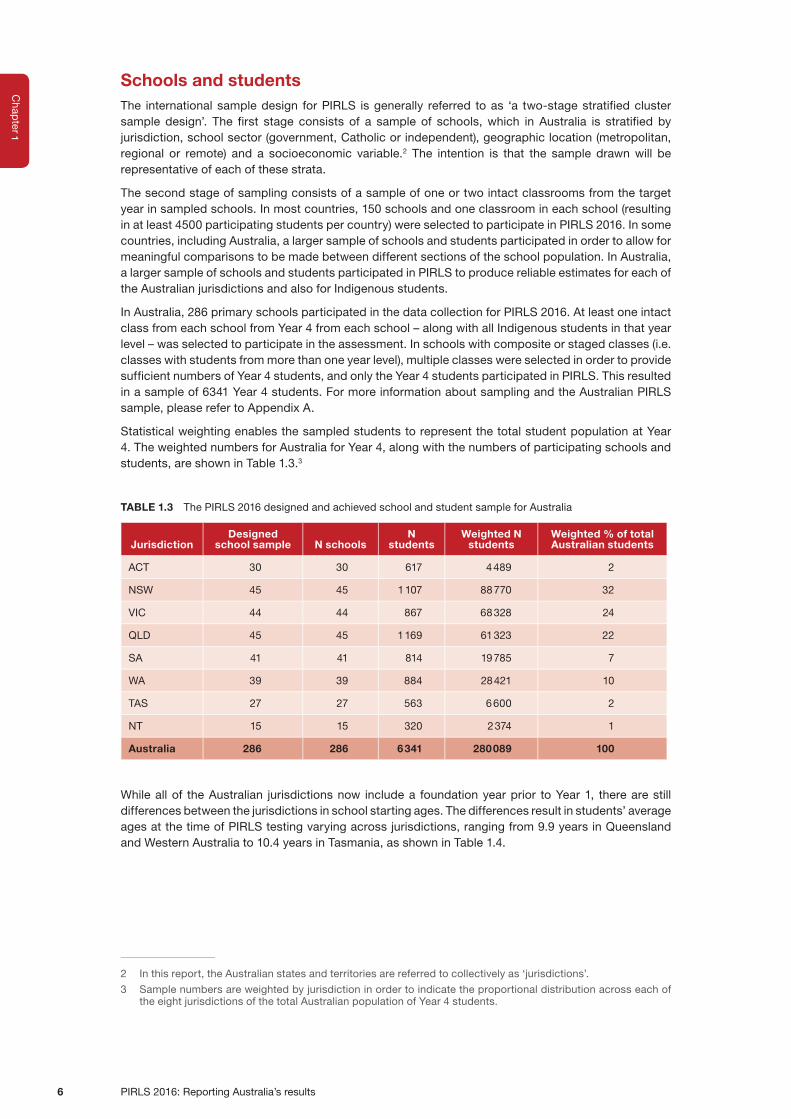
Statistical weighting enables the sampled students to represent the total student population at Year 4. The weighted numbers for Australia for Year 4, along with the numbers of participating schools and students, are shown in Table 1.3.3
TABLE 1.3 The PIRLS 2016 designed and achieved school and student sample for Australia
JurisdictionDesigned
school sample N schoolsN
studentsWeighted N
studentsWeighted % of total Australian students
ACT 30 30 617 4 489 2
NSW 45 45 1 107 88 770 32
VIC 44 44 867 68 328 24
QLD 45 45 1 169 61 323 22
SA 41 41 814 19 785 7
WA 39 39 884 28 421 10
TAS 27 27 563 6 600 2
NT 15 15 320 2 374 1
Australia 286 286 6 341 280 089 100
While all of the Australian jurisdictions now include a foundation year prior to Year 1, there are still differences between the jurisdictions in school starting ages. The differences result in students’ average ages at the time of PIRLS testing varying across jurisdictions, ranging from 9.9 years in Queensland and Western Australia to 10.4 years in Tasmania, as shown in Table 1.4.
2 In this report, the Australian states and territories are referred to collectively as ‘jurisdictions’.
3 Sample numbers are weighted by jurisdiction in order to indicate the proportional distribution across each of the eight jurisdictions of the total Australian population of Year 4 students.

1C
hap
ter
Introduction 7
TABLE 1.4 The average age of Year 4 students by Australian jurisdiction and overall
STATE Average age of PIRLS Year 4 students
ACT 10.1
NSW 10.1
VIC 10.2
QLD 9.9
SA 10.1
WA 9.9
TAS 10.4
NT 10.0
Australia 10.0
Internationally, the average age of students at Year 4 varied from 9.6 years in Kuwait to 10.9 years of age in Latvia (students in the Russian Federation, Bulgaria, Finland, Lithuania and Norway were 10.8 years old, on average, although Norway’s students were in Grade 5).
For more information about the age of participating students, please refer to Chapter 5 of Methods and Procedures in PIRLS 2016: https://timssandpirls.bc.edu/publications/pirls/2016-methods.html.
When did testing take place?
For comparability across countries and across assessments, testing was conducted at the end of the school year. Southern Hemisphere countries tested in the period from October to November 2015. The remaining countries tested at the end of the Northern Hemisphere school year, from May to June 2016.
Who organises PIRLS internationally? PIRLS 2016 was organised by the International Association for the Evaluation of Educational Achievment (IEA) and managed by the TIMSS & PIRLS International Study Center, Lynch School of Education, at Boston College in the United States. Sampling procedures were overseen by Statistics Canada and the IEA Data Processing and Research Center (DPC); the IEA Secretariat and the TIMSS & PIRLS International Study Center oversaw the translation and verification process as well as the quality-assurance program; and the IEA DPC was responsible for oversight of the data collection, data processing and data analysis.
PIRLS in Australia In Australia, the study was funded by the Australian Government Department of Education and Training (DET) and by state and territory departments of education proportional to the size of their student populations. The study was managed in Australia by ACER, which represents Australia to the IEA.
Appendix A provides more information about the operations and procedures involved in PIRLS 2016.
PIRLS is a part of Australia’s National Assessment Program (NAP). Components of the NAP include the National Assessment Program – Literacy and Numeracy (NAPLAN), which is conducted annually for every student in Years 3, 5, 7 and 9; the national sample assessments of civics and citizenship, information and communication technology (ICT) literacy, and science literacy; and the international assessments, which comprise – in addition to PIRLS – TIMSS and the OECD’s Programme for International Student Assessment (PISA).
Results collected from these assessments allow for nationally comparable reporting of progress towards the Melbourne Declaration on Educational Goals for Young Australians (MCEETYA, 2008),

1C
hapter
PIRLS 2016: Reporting Australia’s results8
which set goals for high-quality schooling in Australia designed to secure for students the necessary knowledge, understanding, skills and values for a productive and rewarding life.
The Australian Curriculum, Assessment and Reporting Authority (ACARA) reports on the NAP assessments annually in its National Report on Schooling in Australia, which is the main vehicle for reporting against nationally agreed key performance measures defined in the Measurement Framework for Schooling in Australia 2015 (Australian Curriculum, Assessment and Reporting Authority, 2015).
How are PIRLS results reported? The PIRLS reading achievement scale summarises Year 4 students’ performance when interacting with a variety of texts and questions. Students’ achievement is based on their responses to test questions designed to assess the different reading purposes described earlier in this chapter. When comparing groups of students across and within countries, summary statistics such as the average, or mean, scale score are often used (please see the Reader’s Guide for more information about the achievement scales and the various statistics used in this report).
A single score, whether a mean or median, does not provide detailed information as to what types of tasks students were able to undertake successfully. Instead, PIRLS uses international benchmarks to provide descriptions of achievement on the scale in relation to performance on the questions asked.
The PIRLS benchmarksInternationally, it was decided that performance should be measured at four levels. These four levels summarise the achievement reached by:
� the ‘Advanced international benchmark’, which was set at 625 score points
� the ‘High international benchmark’, which was set at 550 score points
� the ‘Intermediate international benchmark’, which was set at 475 score points
� the ‘Low international benchmark’, which was set at 400 score points.
The descriptions of the levels are cumulative, so that a student who reached the High benchmark can typically demonstrate the knowledge and skills for both the Intermediate and the Low benchmarks.
Table 1.5 provides a summary of the PIRLS 2016 Year 4 reading benchmarks.

1C
hap
ter
Introduction 9
TABLE 1.5 The PIRLS 2016 international benchmarks for Year 4 reading
International benchmarks
Advanced 625 Literacy
When reading relatively complex literary texts, students can:
� interpret story events and character actions to describe reasons, motivations, feelings and character development with full text-based support
� begin to evaluate the effect on the reader of the author’s lanaguage and style choices
Informational
When reading relatively complex informational texts, students can:
� distinguish and interpret complex information from different parts of the text and provide full text-based support
� integrate information across a text to explain relationships and sequence activities
� begin to evaluate visual and textual elements to consider the author’s point of view
High 550 Literacy
When reading relatively complex literary texts, students can:
� locate and distinguish significant actions and details embedded across the text
� make inferences to explain relationships between intentions, actions, events and feelings, and provide text-based support
� interpret and integrate story events and character actions, traits and feelings as they develop across the text
� recognise the use of some language features (e.g. metaphor, tone, imagery)
Informational
When reading relatively complex informational texts, students can:
� locate and distinguish relevant information within a dense text or complex table
� make inferences about logical connections to provide explanations and reasons
� integrate textual and visual information to interpret the relationship between ideas
� evaluate and make generalisations about content and textual elements
Intermediate 475 Literacy
When reading a mix of simpler and relatively complex literary texts, students can:
� independently locate, recognise, and reproduce explicitly stated actions, events and feelings
� make straightforward inferences about the attributes, feelings and motivations of main characters
� interpret obvious reasons and causes, recognise evidence and provide examples
� begin to recognise language choices
Informational
When reading a mix of simpler and relatively complex informational texts, students can:
� locate and reproduce two or three pieces of information from the text
� make straightforward inferences to provide factual explanations
� begin to interpret and integrate information to order events
Low 400 Literacy
When reading predominantly simpler literary texts, students can:
� locate and retrieve explicitly stated information, actions or ideas
� make straightforward inferences about events and reasons for actions
� begin to interpret story events and central ideas
Informational
When reading predominantly simpler informational texts, students can:
� locate and reproduce explicitly stated information from text and other formats (e.g. charts, diagrams)
� begin to make straightforward inferences about explanations, actions and descriptions

1C
hapter
PIRLS 2016: Reporting Australia’s results10
At Year 4, students achieving the Advanced international benchmark are able to interpret story events and character actions to provide reasons, motivations, feelings and character traits with full text-based support, and when reading informational texts are able to distinguish and interpret complex information from different parts of text, integrate information across texts and evaluate textual and visual features to explain their function.
As an example, Box 1.1 shows an item from the literary text ‘Macy and the Red Hen’. Students were asked to provide one reason the alternative title Macy Finds a Way might be appropriate for the story. A correct response required the reader to evaluate story events and actions of the characters Macy and the hen.
BOX 1.1 Advanced international benchmark, Year 4 reading – example literary item
An example of an Advanced informational item is provided in Box 1.2. This multiple-choice item required the reader to evaluate textual elements and content to recognise how they exemplify the writer’s point of view.
BOX 1.2 Advanced international benchmark, Year 4 reading – example informational item
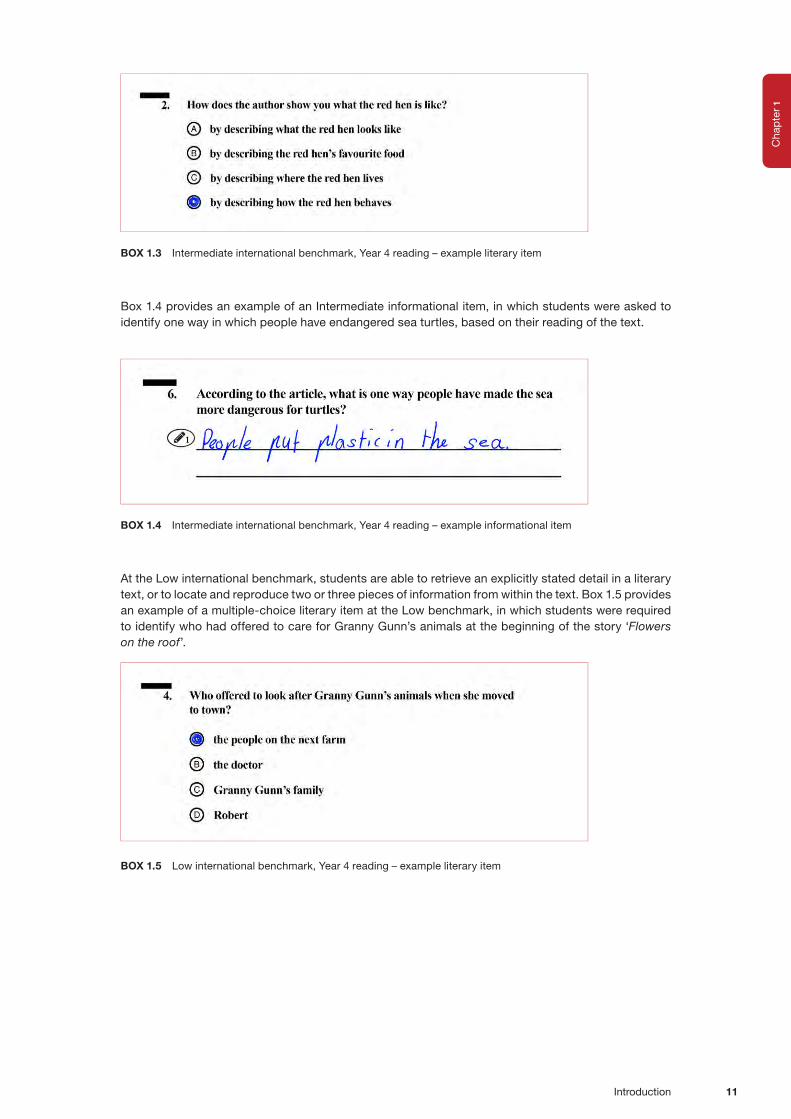
At the Intermediate international benchmark, the proficient standard for Australian students, readers demonstrate greater facility in retrieving explicitly stated information and making inferences, in interpreting and integrating story events and information (please see the Readers’ Guide for further information about the proficient standard). They also demonstrate an emerging ability to recognise language choices. Box 1.3 provides an example of an Intermediate literary item (multiple-choice), in which students were asked to indicate how an author could demonstrate a character’s traits or personality.
1C
hap
ter
Introduction 11
BOX 1.3 Intermediate international benchmark, Year 4 reading – example literary item
Box 1.4 provides an example of an Intermediate informational item, in which students were asked to identify one way in which people have endangered sea turtles, based on their reading of the text.
BOX 1.4 Intermediate international benchmark, Year 4 reading – example informational item
At the Low international benchmark, students are able to retrieve an explicitly stated detail in a literary text, or to locate and reproduce two or three pieces of information from within the text. Box 1.5 provides an example of a multiple-choice literary item at the Low benchmark, in which students were required to identify who had offered to care for Granny Gunn’s animals at the beginning of the story ‘Flowers on the roof’.
BOX 1.5 Low international benchmark, Year 4 reading – example literary item

1C
hapter
PIRLS 2016: Reporting Australia’s results12
Box 1.6 provides an example of a Low informational items. This text, titled ‘Rhinos’ was not presented to Australian students, but to students in countries participating in PIRLS Literacy. However, it does represent the type of informational item at the Low benchmark that Australian students would have faced in the other, secured, PIRLS texts.
Again, this item required students to make an inference based on information presented in the text, namely, the reason hunters would want to kill rhinoceroses.
BOX 1.6 Low international benchmark, Year 4 reading – example informational item
Further information about the types of reading skills demonstrated by Year 4 students who performed at each of the international benchmarks, along with examples of the types of responses given by students at each of the benchmarks, is provided in PIRLS 2016 International Results in Reading, available from: http://timssandpirls.bc.edu/pirls2016/international-results.html.
Structure of this reportChapter 2 describes Australia’s results in PIRLS 2016 within the international context, followed by a detailed presentation of results for the Australian jurisdictions and for different demographic groups within Australia, including male and female students. The next section provides the PIRLS 2016 results in the purposes and processes domains. The final section in Chapter 2 presents a more detailed examination of the characteristics of Australia’s poorest readers – those who do not reach the Low international benchmark.
Chapters 3, 4 and 5 of this report present the results from the contextual questionnaires. Each chapter focuses on a different element of the contexts in which learning and achievement occur. Chapter 3 examines the school environment, Chapter 4 focuses on teachers and classrooms, and Chapter 5 reports on student attitudes and engagement.

Year 4 reading results: International, national and Australian demographic groups 13
2Chapter
Year 4 reading results: International, national and Australian demographic groups
Key findings
� The mean score for Australian students on PIRLS 2016 was 544 points.
� Australian students performed significantly higher, on average, than students in 24 countries, including three other countries that tested in English – New Zealand, Trinidad and Tobago, and Malta.
� Australian Year 4 students were outperformed by students in 13 countries, including Singapore, Hong Kong, Ireland, Northern Ireland and England (all testing in English), as well as the Russian Federation, Finland and Poland.
� Australia’s score was a statistically significant 17 points higher than in PIRLS 2011.
� Sixteen per cent of Australian students reached the Advanced international benchmark, compared to 29 per cent of students in Singapore, 26 per cent in the Russian Federation and 22 per cent in Northern Ireland.
� Eighty-one per cent of Australian Year 4 students reached the Intermediate international benchmark, which is the proficient standard for Australia.
� Australian students showed a relative strength in the Literary reading purpose (reading for interest and pleasure) but the score on the Informational reading purpose (reading to gain information) was not different to the overall reading score.
� Performance across the Australian jurisdictions was fairly similar, with the only exceptions being that students in Victoria performed at the same level as students in the Australian Capital Territory and at a level higher than all other jurisdictions, while students in South Australia performed significantly lower, on average, than students in Western Australia and the Australian Capital Territory, as well as those in Victoria.

2C
hapter
PIRLS 2016: Reporting Australia’s results14
� The average scores for students in Victoria, Queensland and Western Australia were significantly higher in PIRLS 2016 than in PIRLS 2011, by 21, 26 and 28 points respectively.
� All jurisdictions saw an increase in the proportion of students at the Advanced international benchmark, and Victoria, Queensland and Western Australia had a large decrease in the proportion of students at or below the Low international benchmark.
� Female students continue to perform at a higher level in reading literacy, on average, than their male peers.
� Fifty-seven per cent of Australian Indigenous students reached the Intermediate international benchmark, compared to 83 per cent of non-Indigenous students.
� Students who primarily spoke English at home scored a statistically significant 15 points higher, on average, than students who spoke a language other than English at home.
� Twenty-eight per cent of students who reported many books in the home reached the Advanced international benchmark, compared to 17 per cent of students with an average number of books, and just 4 per cent of students with a few books. At the opposite end of the achievement scale, 11 per cent of students with many books, compared to 14 per cent of those with an average number of books and 35 per cent of those with a few books, failed to reach the Intermediate benchmark.
� Eighteen per cent of students in metropolitan schools, compared with 22 per cent of students in provincial schools and 30 per cent of those in remote schools, did not achieve the Intermediate benchmark.

2C
hap
ter
Year 4 reading results: International, national and Australian demographic groups 15
Australia’s Year 4 reading results within the international contextThis chapter presents the PIRLS 2016 reading results as average scores and distributions on the PIRLS Reading scale (please refer to the Reader’s Guide for further information about the achievement scale).
Figure 2.1 provides a summary of the overall performance of students in Year 4 across different countries on the PIRLS reading achievement scale, in terms of the mean (average) scores achieved by students in each country, the standard error of the mean, and the range of scores between the 5th and 95th percentiles.
Countries are presented in Figure 2.1 according to decreasing level of achievement, with the highest scoring countries – the Russian Federation and Singapore – at the top. The shading in the figure indicates whether the mean score for a country is statistically different to that of Australia. Multiple-comparison tables, for use in comparing scores between all participating countries, are available in the PIRLS 2016 International Results in Reading: http://timssandpirls.bc.edu/pirls2016/international-results.html.
Students in the Russian Federation performed better, on average, than students in all other participating countries, apart from those in Singapore. Students in Singapore, in turn, performed better in reading than students in all other countries, apart from Hong Kong. The average scores of students in these countries was above the High benchmark, but not quite at the Advanced benchmark.
Australia’s average reading score of 544 was significantly higher than the scores of 24 other countries, including France and French-speaking Belgium, New Zealand, Trinidad and Tobago and Malta (the latter three countries tested in English). This places the average achievement of Australian students above the Intermediate benchmark (the proficient standard) and just under the High benchmark.
Australia’s average score was lower than the average scores for 13 other countries, including Singapore, Hong Kong, Ireland, Northern Ireland and England (who all tested in English), as well as other top-performing countries Finland, Poland and the Russian Federation.
Figure 2.1 also shows a measure of the range of achievement within participating countries (between the 5th and 95th percentile of achievement). A larger range between the 5th and 95th percentile indicates that there is greater diversity in the achievement of students in a particular country, while a smaller range indicates greater similarity in achievement, whether this be higher (i.e. placed closer to the right side of the figure) or lower (i.e. placed towards the left side of the figure. When comparing the performance of Australia with that of other countries, it is worthwhile considering the range of achievement as well as the mean score. Australia’s gap between high and low achievers – 274 points – was mid-range, similar to that of Northern Ireland (267), the Slovak Republic (266) and Bulgaria (280 points). In the Netherlands, only 198 score points separated the 5th and 95th percentiles, while more than 350 score points separated the highest and lowest scoring students in Egypt (408 score points), Qatar (359 score points) and Iran (355 score points).

2C
hapter
PIRLS 2016: Reporting Australia’s results16
Country/Region Mean SE Range 5th–95th percentiles Reading achievement distribution
Hig
her
than
Aus
tral
ia
Russian Federation 581 2.2 219
Singapore 576 3.2 263
Hong Kong SAR 569 2.7 206
Ireland 567 2.5 243
Finland 566 1.8 218
Northern Ireland 565 2.2 267
Poland 565 2.1 239
Chinese Taipei 559 2.0 212
England 559 1.9 259
Norway (5) 559 2.3 215
Latvia 558 1.7 205
Sweden 555 2.4 222
Hungary 554 2.9 247
No
t d
iffer
ent
to A
ustr
alia
Bulgaria 552 4.2 280
United States 549 3.1 256
Italy 548 2.2 215
Lithuania 548 2.6 230
Denmark 547 2.1 225
Macao SAR 546 1.0 217
Netherlands 545 1.7 198
Australia 544 2.5 274
Canada 543 1.8 250
Czech Republic 543 2.1 221
Slovenia 542 2.0 238
Austria 541 2.4 213
Germany 537 3.2 257
Low
er t
han
Aus
tral
ia
Kazakhstan 536 2.5 206
Slovak Republic 535 3.1 266
Israel 530 2.5 295
Portugal 528 2.3 216
Spain 528 1.7 215
Belgium (Flemish) 525 1.9 200
New Zealand 523 2.2 300
France 511 2.2 228
Belgium (French) 497 2.6 228
Chile 494 2.5 258
Georgia 488 2.8 259
Trinidad and Tobago 479 3.3 309
Azerbaijan 472 4.2 282
Malta 452 1.8 294
United Arab Emirates 450 3.2 362
Bahrain 446 2.3 322
Qatar 442 1.8 359
Saudi Arabia 430 4.2 319
Iran, Islamic Rep. of 428 4.0 355
Oman 418 3.3 346
Kuwait 393 4.1 349
Morocco 358 3.9 349
Egypt 330 5.6 408
South Africa 320 4.4 351
100 200 300 400 500 600 700
FIGURE 2.1 Mean scores and distribution of Year 4 reading achievement, by country

2C
hap
ter
Year 4 reading results: International, national and Australian demographic groups 17
Performance at the international benchmarks across countriesFigure 2.2 presents the percentage of students in each country who performed at each of the international benchmarks, which are described in Chapter 1. The countries are ordered by the percentage of students reaching the Intermediate benchmark, which is the proficient standard set for PIRLS reading in Australia (please see the Reader’s Guide for further information about the proficient standard).
Singapore and the Russian Federation were again stand-out performers, with around one in four of their students reaching the Advanced benchmark, and very few students (3% and 1%, respectively) not reaching the Low benchmark.
Northern Ireland, Ireland, England, and Poland all had around one in five students at the Advanced benchmark, and only two in every hundred not reaching the Low benchmark.
In the Netherlands, the country with the narrowest gap between high and low achievers, 8 per cent of students achieved the Advanced benchmark, while 11 per cent were at the Low benchmark and only 1 per cent did not achieve this basic level.
Sixteen per cent of Australian students reached the Advanced benchmark, while 35 per cent performed at the High benchmark and a further 30 per cent performed at the Intermediate benchmark. This means that over 80 per cent of Australian students reached at least the Intermediate benchmark. Of concern are the 20 per cent of Australian Year 4 students reading at or below the Low benchmark (13% performed at the Low benchmark and a further 6% did not reach the Low benchmark).
While the average reading score for Australia (544 points) was significantly higher than that of Kazakhstan, Portugal, Spain and Flemish-speaking Belgium, each of these countries had significantly lower proportions of their students fail to reach the Low benchmark than did Australia.

2C
hapter
PIRLS 2016: Reporting Australia’s results18
14
14
20
22
29
27
28
28
28
24
25
28
27
25
26
26
27
22
17
16
18
17
17
13
14
12
12
13
13
13
14
14
12
12
11
11
11
12
10
11
10
11
8
9
9
8
9
9
7
6
5
4
78
69
64
49
41
37
35
31
34
32
27
19
20
14
13
8
6
10
9
3
3
3
6
5
7
5
4
4
4
2
2
3
3
3
3
3
2
3
2
2
3
2
2
2
2
35
6
8
11
16
22
24
26
27
25
23
32
36
31
38
36
43
42
32
29
41
41
45
30
34
34
28
30
33
34
37
42
29
36
29
34
34
36
26
35
31
40
23
27
28
31
32
33
29
28
24
37
2
3
3
5
8
10
10
12
14
15
12
16
20
20
22
19
26
30
33
31
33
31
35
36
37
36
37
37
38
39
35
39
39
37
40
41
40
39
41
43
40
37
41
41
45
43
43
44
47
44
10
2
2
3
5
2
4
2
3
3
4
11
13
7
6
4
16
11
10
19
16
13
11
8
7
17
10
20
12
11
10
22
11
14
8
29
21
20
14
15
14
18
18
26
International medianSouth Africa
EgyptMorocco
KuwaitOman
Saudi ArabiaIran, Islamic Rep. of
BahrainQatar
United Arab EmiratesMalta
AzerbaijanTrinidad and Tobago
GeorgiaChile
Belgium (French)France
New ZealandIsrael
PortugalSpain
Belgium (Flemish)AustraliaGermany
Slovak RepublicBulgaria
United StatesCanada
SloveniaAustria
KazakhstanHungary
Czech RepublicEngland
LithuaniaDenmark
Macao SARNorthern Ireland
ItalySweden
NetherlandsSingapore
IrelandPoland
Chinese TaipeiNorway (5)
LatviaFinland
Hong Kong SARRussian Federation
LowBelow Low Intermediate High Advanced
0 1008060402020406080100
Note: Where the percentage is 1% or less, the numeric label is not displayed on the band. This convention applies to all �gures about benchmarks.
FIGURE 2.2 Percentage of students at the international benchmarks for Year 4 reading, by country
Country/Region Students (%) at each of the PIRLS international benchmarks

2C
hap
ter
Year 4 reading results: International, national and Australian demographic groups 19
International trends in Year 4 reading performanceThe trends in reading performance show more improvements than downturns over the four cycles that have been conducted since PIRLS 2001. Of the countries that have data for all PIRLS cycles, four have shown increases of over 40 points, including the top performers Singapore, Russian Federation and Hong Kong, along with Slovenia.
Australia participated in PIRLS for the first time in 2011, and so only two time points are available for monitoring trends in reading performance using PIRLS. Among the group of countries who participated in PIRLS 2011 and 2016, 18 showed improvements, 13 recorded similar achievement in both cycles and 10 showed declines.
Figure 2.3 shows trends in Year 4 reading performance for a selection of countries that have comparable data from previous PIRLS assessments. Those presented include English-speaking countries with which Australia usually makes comparisons – Canada, England, the United States and New Zealand – along with the top performers Singapore, Russian Federation and Hong Kong (all of whom showed large improvements over time).
Data and graphs for all participating countries are available in PIRLS 2016: International Results in Reading Achievement: http://timssandpirls.bc.edu/pirls2016/international-results.html.

2C
hapter
PIRLS 2016: Reporting Australia’s results20
Rea
din
g ac
hiev
emen
t
553
539552
559
510
590
2001 2006 2011 2016PIRLS cycle
England
Rea
din
g ac
hiev
emen
t
510
590
2001 2006 2011 2016PIRLS cycle
Australia
527
544
Rea
din
g ac
hiev
emen
t
510
590
2001 2006 2011 2016PIRLS cycle
USA
542 540
556549
Rea
din
g ac
hiev
emen
t510
590
2001 2006 2011 2016PIRLS cycle
New Zealand
529 532 531523
Rea
din
g ac
hiev
emen
t
510
590
2001 2006 2011 2016PIRLS cycle
Canada
548543
Rea
din
g ac
hiev
emen
t
510
590
2001 2006 2011 2016PIRLS cycle
Singapore
528
558567
576
Rea
din
g ac
hiev
emen
t
510
590
2001 2006 2011 2016PIRLS cycle
Russian Federation
528
565 568581
Rea
din
g ac
hiev
emen
t
510
590
2001 2006 2011 2016PIRLS cycle
Hong Kong SAR
528
564571 569
FIGURE 2.3 Trends in Year 4 reading achievement scores, 2001–2016, selected countries
As Figure 2.3 shows, Australia recorded a significant improvement of around 20 points in the average reading score between PIRLS 2011 and 2016.
Among English-speaking comparison countries, the United States showed gains between 2006 and 2011 but performance dropped off slightly in 2016 (by 7 points). Canada and New Zealand also recorded

2C
hap
ter
Year 4 reading results: International, national and Australian demographic groups 21
significant, though not substantial, declines in their performance in PIRLS 2016. England showed an initial decline in reading performance from 2001 to 2006, followed by significant improvements that have brought it back, in 2016, to their initial level.
In contrast, the three top performers in PIRLS 2016 have shown great improvements in reading performance over time – the Russian Federation improved by 37 points between 2001 to 2006 and then by another 12 points between 2011 and 2016. Hong Kong and Singapore both improved dramatically between 2001 and 2006, with another (smaller) gain between 2006 and 2011.
Figure 2.4 presents the mean reading scores and distributions for Australian students in PIRLS 2011 and 2016. Along with the increase in average score noted earlier, Figure 2.4 shows that the entire distribution has shifted slightly to the right, indicating improvements in the performance of the groups of lowest scoring students and the highest scoring students.
300 400 500 600 700
PIRLS cycle Mean SE Range 5th–95th percentiles Reading achievement distribution
2016 544 2.5 274
2011 527 2.2 265
FIGURE 2.4 Trends in Year 4 reading achievement score and distribution, 2011–2016, Australia
Table 2.1 presents a comparison of Australia’s average reading score with those of other participating countries over the past two cycles. This summary of relative trends indicates that Australia’s performance has improved since 2011 when compared to twelve other countries. Australia’s mean score was lower than that of Canada, the United States and Germany, for example, in 2011 but not significantly different in 2016. Portugal, Israel and the Slovak Republic all performed at a higher level, on average, than Australia in 2011 but scored lower, on average, than Australia in PIRLS 2016.

2C
hapter
PIRLS 2016: Reporting Australia’s results22
TABLE 2.1 Relative trends in Year 4 reading achievement, by country
Country/Region Position relative to Australia 2016 Position relative to Australia 2011
Russian Federation
Singapore
Hong Kong SAR
Ireland
Finland
Northern Ireland
Poland
Chinese Taipei
England
Norway (5)
Latvia –
Sweden
Hungary
Bulgaria
United States
Italy
Lithuania
Denmark
Macao SAR -
Netherlands
Australia
Canada
Czech Republic
Slovenia
Austria
Germany
Kazakhstan –
Slovak Republic
Israel
Portugal
Spain
Belgium (Flemish) –
New Zealand
France
Belgium (French)
Chile –
Georgia
Trinidad and Tobago
Azerbaijan
Malta
United Arab Emirates
Bahrain -
Qatar
Saudi Arabia
Iran, Islamic Rep. of
Oman
Kuwait –
Morocco
Egypt –
South Africa –
average achievement significantly higher than Australia’s average achievement not significantly different to Australia’s
average achievement significantly lower than Australia’s – did not participate in this cycle

2C
hap
ter
Year 4 reading results: International, national and Australian demographic groups 23
5152535 5 15 25 35
Singapore
Russian Federation
England
Hong Kong SAR
United States
Australia
Canada
New Zealand
2016 2011
Proportion of students performing belowthe Low benchmark (400)
Proportion of students performing at or abovethe Advanced benchmark (625)
Note: A coloured bar and a coloured circle indicate that the difference in the percentages of students between 2011and 2016 was signi�cant.
Students (%)
FIGURE 2.5 Percentage of students in year 4 reading below the Low benchmark and at or above the Advanced benchmark in PIRLS 2011–2016, by country
While the proportion of Australian students who performed at or above the Advanced benchmark increased between 2011 and 2016, there was no change in the proportion of Australian students who failed to reach the Low benchmark (around 7% of students), as shown in Figure 2.5. Over this time period, the proportion of students in the Russian Federation who performed at or above the Advanced benchmark also increased significantly, while the proportion of English students who did not reach the Low benchmark decreased significantly. New Zealand, Canada and the United States all saw an increase between the 2011 and 2016 PIRLS cycles in the proportion of their students who did not reach the Low benchmark.
Australia’s results at the national levelFigure 2.6 presents the distribution of Year 4 reading performance for each of the Australian jurisdictions for PIRLS 2016. To place the jurisdiction results in perspective, the means and distributions for Australia and for the the highest-achieving countries in PIRLS 2016, the Russian Federation and Singapore, are also included.
Figure 2.6 should be read in conjunction with Table 2.2, which presents the multiple comparisons of mean reading performance between jurisdictions and indicates which jurisdiction’s performance differs significantly from the performance of each of the other jurisdictions.
Figure 2.6 and Table 2.2 together show that the spread of average scores across the jurisdictions was 33 points (less than half of a standard deviation) between the highest performing jurisdictions, Victoria and the Australian Capital Territory, and the lowest performing jurisdictions, the Northern Territory and South Australia.
The performance of students in Victoria was significantly higher than that of students in all other jurisdictions except the Australian Capital Territory. Students in South Australia performed significantly lower, on average, than students in Victoria, the Australian Capital Territory and Western Australia.
The largest range of student performance was seen in Tasmania and the Northern Territory, where the range between the 5th and 95th percentiles was over 300 points. Victoria had the narrowest range of reading achievement, at 254 points.

2C
hapter
PIRLS 2016: Reporting Australia’s results24
Jurisdiction Mean SE Range 5th–95th percentiles Reading achievement distribution
VIC 560 4.2 254
ACT 552 5.2 297
WA 544 6.0 275
NSW 542 5.4 272
QLD 537 5.4 286
TAS 537 8.0 303
SA 527 5.6 290
NT 527 13.5 334
Australia 544 2.5 274
Russian Federation 581 2.2 219
Singapore 576 3.2 263
100 200 300 400 500 600 700 800Score points
FIGURE 2.6 Mean scores and distribution of Year 4 reading achievement, by jurisdiction
TABLE 2.2 Multiple comparisons of Year 4 reading achievement, by jurisdiction
STATE Mean SE VIC ACT WA NSW QLD TAS SA NT
VIC 560 4.2
ACT 552 5.2
WA 544 6.0
NSW 542 5.4
QLD 537 5.4
TAS 537 8.0
SA 527 5.6
NT 527 13.5
average achievement significantly higher than other jurisdictions’ average achievement not significantly different to other jurisdictions’ average achievement significantly lower than other jurisdictions’
Figure 2.7 shows the percentage of students in each jurisdiction at each of the international benchmarks for Year 4 reading, along with the percentages for Australia, Singapore and the Russian Federation (as the highest-scoring countries) and the international median for comparison.
The jurisdictions with the highest proportion of students who reached the Advanced benchmark were the Australian Capital Territory and Victoria (20% and 19%, respectively). Sixteen per cent of students in New South Wales, Tasmania and Western Australia reached the Advanced benchmark, while 14 per cent of students reached this benchmark in Queensland and the Northern Territory. South Australia had the lowest proportion of students at this level, with 11 per cent achieving the Advanced benchmark, which was similar to the International median of 10 per cent.
Around 25 per cent of students in South Australia and the Northern Territory did not reach the Intermediate benchmark, which is the proficient standard for Australia. In the other jurisdictions, this proportion ranged from 14 per cent in Victoria to over 20 per cent in Queensland and Tasmania.

2C
hap
ter
Year 4 reading results: International, national and Australian demographic groups 25
Eleven per cent of students in the Northern Territory did not reach the Low benchmark, compared to only 3 per cent of students in Victoria.
1411 29 32 14
4
3
13
14
8
5
6
35
23
24
30
37
37
44
35
10
29
26
16
179 30 34 11
148 30 32 16
147 30 34 14
145 31 34 16
136 29 36 16
117 27 35 20
113 28 39 19
International Median
Singapore
Russian Federation
Australia
SA
NT
TAS
QLD
NSW
WA
ACT
VIC
Students (%) at PIRLS international benchmarks
LowBelow Low Intermediate High Advanced
FIGURE 2.7 Percentage of Australian students at the international benchmarks for Year 4 reading, by jurisdiction and international comparisons
Trends in Year 4 reading achievement by jurisdictionFigure 2.8 presents the trends in reading performance for each of the jurisdictions for PIRLS 2011 and 2016, along with an indication of the statistical significance of the difference between cycles. Between 2011 and 2016, there has been a significant improvement in three of the eight jurisdictions. Western Australia showed the greatest improvement of 28 points, followed by Queensland (26 points) and Victoria (21 points). There was no significant change in average scores between 2011 and 2016 in the remaining jurisdictions.
2011 2016 Difference between 2016 and
2011Jurisdiction Mean SE Mean SE
ACT 558 5.5 552 5.2 -6
NSW 535 5.0 542 5.4 7
SA 518 4.4 527 5.6 9
TAS 525 7.3 537 8.0 12
NT 509 9.9 527 13.5 18
VIC 539 4.2 560 4.2 21
QLD 511 5.1 537 5.4 26
WA 516 4.6 544 6.0 28
Australia 527 2.2 544 2.5 17
30 20 10 0 10 20 30
2011 scorehigher than 2016
2016 scorehigher than 2011
signi�cantlydifferent
not signi�cantlydifferent
FIGURE 2.8 Trends in Year 4 reading achievement by jurisdiction
Figure 2.9 presents the proportion of students at each of the reading benchmarks in PIRLS 2011 and 2016 in each jurisdiction.
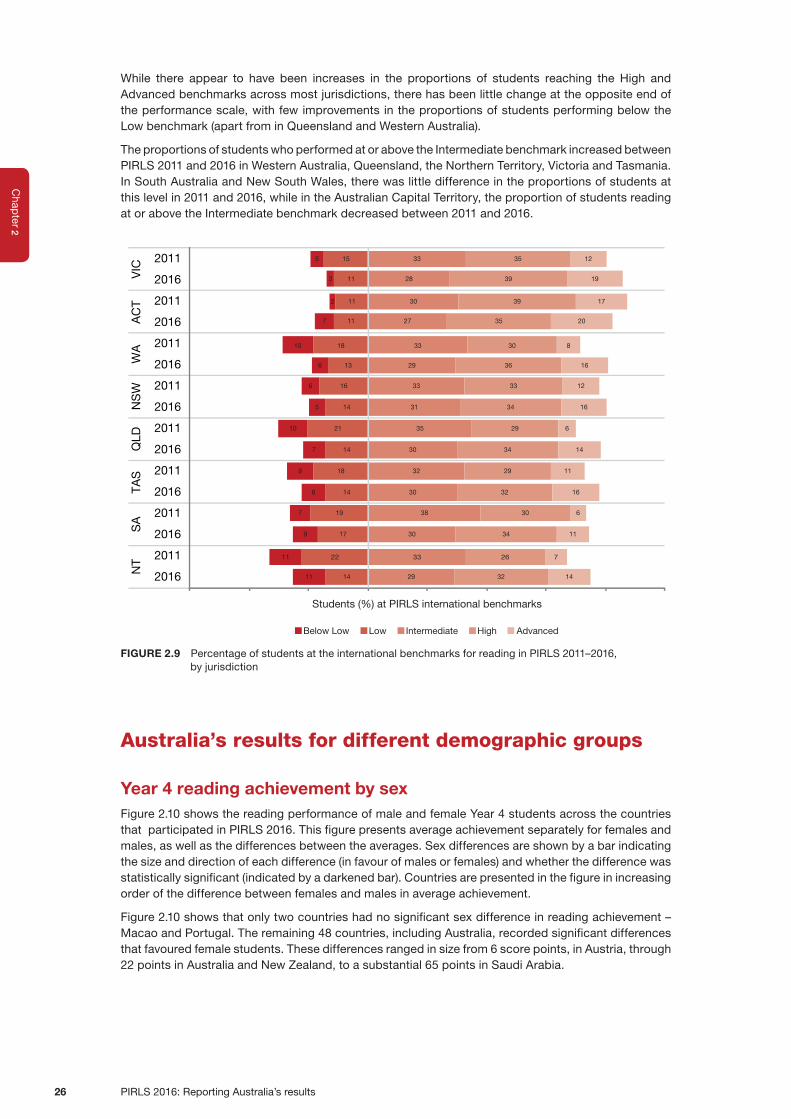
2C
hapter
PIRLS 2016: Reporting Australia’s results26
While there appear to have been increases in the proportions of students reaching the High and Advanced benchmarks across most jurisdictions, there has been little change at the opposite end of the performance scale, with few improvements in the proportions of students performing below the Low benchmark (apart from in Queensland and Western Australia).
The proportions of students who performed at or above the Intermediate benchmark increased between PIRLS 2011 and 2016 in Western Australia, Queensland, the Northern Territory, Victoria and Tasmania. In South Australia and New South Wales, there was little difference in the proportions of students at this level in 2011 and 2016, while in the Australian Capital Territory, the proportion of students reading at or above the Intermediate benchmark decreased between 2011 and 2016.
2211 33 26 7
1411 29 32 14
2011
2011
2011
2011
2011
2011
2011
2011
2016
2016
2016
2016
2016
2016
2016
2016
SA
NT
TAS
QLD
NS
WW
AA
CT
VIC
Students (%) at PIRLS international benchmarks
LowBelow Low Intermediate High Advanced
197 38 30 6
179 30 34 11
189 32 29 11
148 30 32 16
2110 35 29 6
147 30 34 14
166 33 33 12
145 31 34 16
1810 33 30 8
136 29 36 16
112 30 39 17
117 27 35 20
155 33 35 12
113 28 39 19
FIGURE 2.9 Percentage of students at the international benchmarks for reading in PIRLS 2011–2016, by jurisdiction
Australia’s results for different demographic groups
Year 4 reading achievement by sexFigure 2.10 shows the reading performance of male and female Year 4 students across the countries that participated in PIRLS 2016. This figure presents average achievement separately for females and males, as well as the differences between the averages. Sex differences are shown by a bar indicating the size and direction of each difference (in favour of males or females) and whether the difference was statistically significant (indicated by a darkened bar). Countries are presented in the figure in increasing order of the difference between females and males in average achievement.
Figure 2.10 shows that only two countries had no significant sex difference in reading achievement – Macao and Portugal. The remaining 48 countries, including Australia, recorded significant differences that favoured female students. These differences ranged in size from 6 score points, in Austria, through 22 points in Australia and New Zealand, to a substantial 65 points in Saudi Arabia.

2C
hap
ter
Year 4 reading results: International, national and Australian demographic groups 27
Country/ Region
Females Males Difference (absolute
value)SEStudents
(%) SE (%) Mean SE Students (%) SE (%) Mean SE
Saudi Arabia 48 2.6 464 5.4 52 2.6 399 5.8 65 7.5
South Africa 48 0.7 347 4.0 52 0.7 295 5.1 52 3.0
Iran, Islamic Rep. of 47 1.1 452 4.5 53 1.1 407 5.1 46 5.9
Oman 50 0.7 442 3.2 50 0.7 395 3.9 46 3.0
Bahrain 50 1.5 468 2.8 50 1.5 424 3.5 43 3.8
Egypt 49 1.2 349 5.6 51 1.2 312 6.6 37 4.8
Qatar 50 2.4 460 1.9 50 2.4 424 3.4 36 4.0
Kuwait 52 1.8 410 4.8 48 1.8 376 6.4 34 7.7
United Arab Emirates 49 2.1 465 4.2 51 2.1 436 4.5 30 5.8
Morocco 49 0.7 372 4.0 51 0.7 344 4.4 28 3.0
Australia 50 0.8 555 2.6 50 0.8 534 3.0 22 2.5
Finland 50 0.9 577 1.9 50 0.9 555 2.3 22 2.2
New Zealand 50 0.9 533 2.4 50 0.9 512 3.0 22 3.2
Trinidad and Tobago 52 1.8 490 3.8 48 1.8 468 4.4 22 4.9
Malta 48 0.6 463 2.6 52 0.6 442 2.2 21 3.1
Norway (5) 50 1.1 570 2.6 50 1.1 548 2.6 21 2.3
Lithuania 50 1.0 558 2.7 50 1.0 538 3.3 20 3.1
Slovenia 50 0.9 552 2.3 50 0.9 533 2.6 19 2.9
Georgia 49 0.7 498 2.7 51 0.7 479 3.6 19 3.2
Poland 50 0.8 574 2.5 50 0.8 556 2.6 18 3.0
Northern Ireland 50 1.2 574 2.8 50 1.2 555 2.8 18 3.5
Latvia 51 1.1 566 2.1 49 1.1 549 2 17 2.4
Singapore 49 0.6 585 3.5 51 0.6 568 3.4 17 3.0
Bulgaria 49 0.7 559 4.9 51 0.7 544 4.3 16 3.4
Russian Federation 49 0.8 588 2.2 51 0.8 574 2.6 15 2.1
England 50 0.9 566 2.2 50 0.9 551 2.4 15 2.8
Sweden 49 0.9 563 2.7 51 0.9 548 2.6 15 2.5
Chile 48 1.4 501 2.9 52 1.4 487 3.2 14 3.7
Hungary 49 0.8 561 3.4 51 0.8 548 3.1 13 3.1
Denmark 51 0.9 554 2.6 49 0.9 541 2.7 13 3.1
Azerbaijan 47 0.8 479 4.3 53 0.8 466 4.5 13 3.0
Israel 51 1.5 537 2.9 49 1.5 524 3.4 13 3.8
Canada 49 0.6 549 2.2 51 0.6 537 2.1 12 2.2
Ireland 50 1.6 572 2.9 50 1.6 561 3.3 12 3.8
Kazakhstan 49 0.8 542 2.8 51 0.8 531 2.5 11 2.1
Belgium (French) 50 1.0 503 2.5 50 1.0 492 3.4 11 3.0
Germany 49 0.7 543 3.2 51 0.7 532 3.7 11 2.9
Belgium (Flemish) 51 0.9 530 2.1 49 0.9 520 2.3 10 2.0
Czech Republic 49 0.9 549 2.2 51 0.9 538 2.6 10 2.4
Netherlands 51 1.1 550 1.7 49 1.1 540 2.3 10 2.2
Hong Kong SAR 49 1.5 573 2.9 51 1.5 564 3.1 9 2.5
Slovak Republic 49 1.0 539 3.7 51 1.0 530 3.1 9 2.7
Chinese Taipei 48 0.6 563 2.2 52 0.6 555 2.3 8 1.9
France 50 0.9 515 2.6 50 0.9 507 2.5 8 2.7
United States 50 0.7 553 3.2 50 0.7 545 3.6 8 2.9
Spain 49 0.6 532 1.4 51 0.6 524 2.7 8 2.5
Italy 49 0.9 552 2.7 51 0.9 544 2.4 7 2.6
Austria 48 0.9 544 2.7 52 0.9 538 2.7 6 2.4
Macao SAR 49 0.5 546 1.6 51 0.5 545 1.7 1 2.6
Portugal 49 0.8 529 2.7 51 0.8 527 2.5 1 2.7
International Avg. 49 0.2 520 0.4 51 0.2 501 0.5 19 0.5
0 10 20 30 40 50 60 70Sex difference in score points
signi�cantlydifferent
not signi�cantlydifferent
FIGURE 2.10 Sex differences in Year 4 reading achievement, by country

2C
hapter
PIRLS 2016: Reporting Australia’s results28
Figure 2.11 presents the difference in the average reading score of Australian male and female students. The range of scores was greater for Australian Year 4 male students (282 points) than for Year 4 female students (260 points), with a slightly larger ‘tail’ evident among male students.
300 400 500 600 700Score points
Sex Students (%) Mean SE
Range 5th– 95th
percentilesReading achievement distribution
Females 50 555 2.6 260
Males 50 534 3.0 282
FIGURE 2.11 Mean scores and distribution of Year 4 reading achievement within Australia, by sex
Figure 2.12 also highlights the difference in the reading performance of male and female Year 4 students – with greater proportions of female students reaching the High and Advanced benchmarks and greater proportions of male students at or below the Low benchmark. These differences are statistically significant and combine to paint a less than impressive picture for male students, with fewer of them performing at relatively high standards and more of them failing to reach the minimum standard. Eighty-five per cent of female students reached the Australian proficient standard (the Intermediate benchmark), compared to 77 per cent of male students. In comparison, the results from TIMSS 2015 indicated little difference in the proportions of male and female students who reached the proficient standard in Year 4 mathematics and science.
4 11 29 37 19
7 16 30 34 13
Females
Males
Students (%) at PIRLS international benchmarks
LowBelow Low Intermediate High AdvancedFIGURE 2.12 Percentage of Australian students at the international benchmarks for Year 4 reading, by sex
Trends in reading achievement by sex
Figure 2.13 shows that the sex difference in reading performance in Year 4 students in Australia has remained the same between PIRLS 2011 and 2016. While both male and female students have improved over the two cycles, the gender ‘gap’ has not changed significantly.

2C
hap
ter
Year 4 reading results: International, national and Australian demographic groups 29
519
534*536
555*
500
560
2011 2016
Ave
rage
rea
din
g sc
ore
PIRLS cycle
Males
Score signi�cantlydifferent to PIRLS 2011
*
Females
FIGURE 2.13 Trends in Year 4 reading achievement within Australia, 2011–2016, by sex
Sex differences in reading achievement by jurisdiction
Figure 2.14 shows the sex differences in Year 4 reading by jurisdiction. Female students scored higher, on average, than male students in Victoria, Queensland, Western Australia, New South Wales and South Australia. In the Australian Capital Territory, the average scores of male and female students were very similar. In Tasmania and the Northern Territory, the differences between male and female students were larger (substantially so in the case of the Northern Territory) but did not reach statistical significance due to the large standard errors.
Females Males Difference (absolute
value)Jurisdiction/Country Mean SE Mean SE
ACT 554 8.5 549 10.4 5
VIC 567 5.3 552 4.6 15
TAS 545 7.5 529 10.0 16
QLD 548 5.7 527 6.2 21
WA 555 5.7 532 7.0 23
NSW 554 5.5 530 6.3 24
SA 544 5.8 514 6.4 31
NT 544 10.9 507 18.0 36
Australia 555 2.6 534 3.0 22
International Avg. 520 0.4 501 0.5 19
0 10 20 30 4010203040
Females score higherthan males
Males score higherthan females
signi�cantlydifferent
not signi�cantlydifferent
Sex difference in score points
FIGURE 2.14 Sex differences in Year 4 reading achievement within Australia, by jurisdiction and international comparisons

2C
hapter
PIRLS 2016: Reporting Australia’s results30
16
13
16
7
30
28
30
33
9
19
17
11
10
6
27
33
33
32
14
17
15
12
6
5
33
26
34
37
11
20
20
13
11
6
30
29
31
37
8
15
16
13
10
5
29
31
32
36
13
16
14
9
3
2
28
27
38
40
17
21
17
12
7
3
32
30
32
35
12
19
12
10
7
6
25
28
36
34
19
21
Females
Females
Females
Females
Females
Females
Females
Females
Males
Males
Males
Males
Males
Males
Males
Males
SA
NT
TAS
QLD
NS
WW
AA
CT
VIC
Students (%) at PIRLS international benchmarks
LowBelow Low Intermediate High AdvancedFIGURE 2.15 Percentage of Australian students at the international benchmarks for Year 4 reading, by sex
within jurisdiction
Figure 2.15 shows the percentages of students at each of the international benchmarks in reading in each jurisdiction, by sex.
In New South Wales and the Northern Territory, the proportion of males who were below the Low benchmark was significantly higher than the proportion of female students, while the proportion of female students at the Advanced benchmark was significantly greater than the corresponding proportion of male students at this level.
In Queensland, there was a significant gender difference in the proportion of students below the Low benchmark, while in South Australia and Western Australia, there was a gender difference (in favour of females) at the Advanced benchmark. The proportions of male and females students at each of the international reading benchmarks were similar in the Australian Capital Territory.
In the Northern Territory and South Australia, over 30 per cent of male students did not reach the Intermediate benchmark (the proficient standard for Australia). In Victoria and New South Wales, only 11 and 15 per cent of females did not reach the Intermediate benchmark.
Year 4 reading achievement by Indigenous backgroundThe education attainment of Indigenous students in core subject areas such as reading is an important issue, and the previous PIRLS cycle provided an initial picture of Indigenous achievement in this area. This section presents Australian students’ reading achievement according to Indigenous background. For more information about this variable, please refer to the Reader’s Guide.
As shown in Figure 2.16, 6 per cent of the PIRLS Year 4 sample identified as having an Indigenous background. These students attained an average score of 483 points in reading, which is 67 points lower than the average score for non-Indigenous students of 550. The mean score for Indigenous students is within the range of the Intermediate benchmark, while the average reading score of non-Indigenous students is at the High benchmark (set at 550 points).
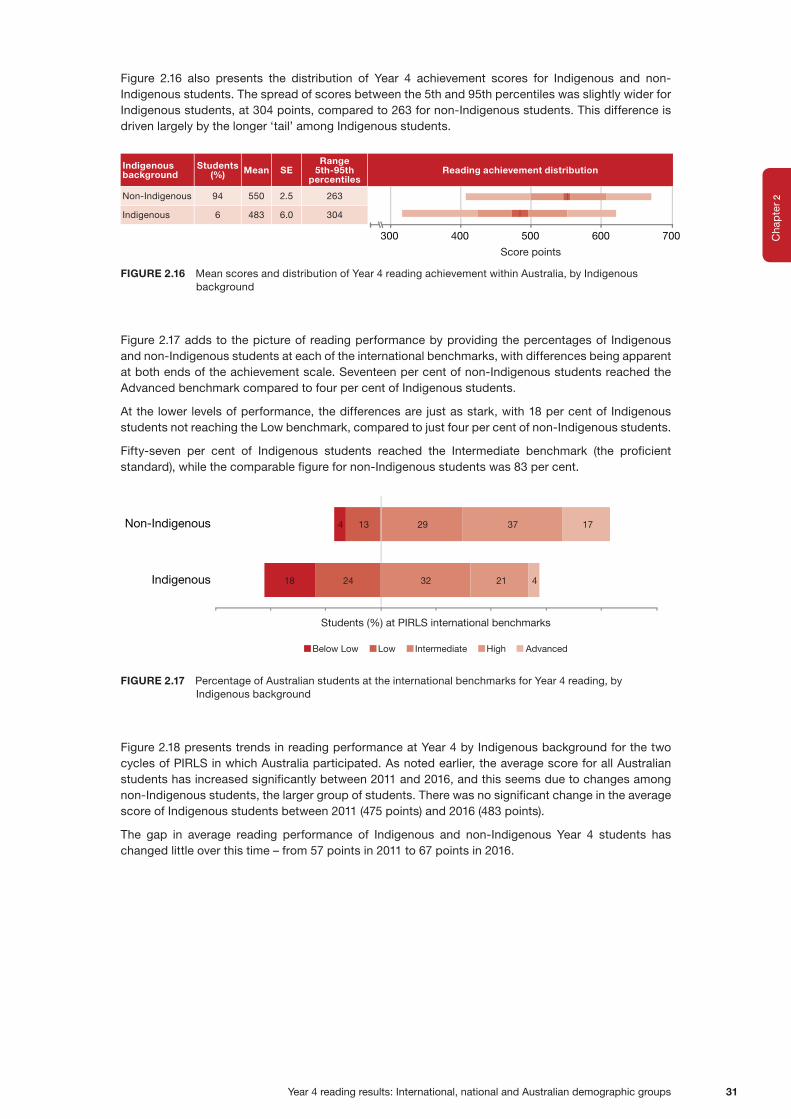
2C
hap
ter
Year 4 reading results: International, national and Australian demographic groups 31
Figure 2.16 also presents the distribution of Year 4 achievement scores for Indigenous and non-Indigenous students. The spread of scores between the 5th and 95th percentiles was slightly wider for Indigenous students, at 304 points, compared to 263 for non-Indigenous students. This difference is driven largely by the longer ‘tail’ among Indigenous students.
300 400 500 600 700
Score points
Indigenous background
Students (%) Mean SE
Range 5th-95th
percentilesReading achievement distribution
Non-Indigenous 94 550 2.5 263
Indigenous 6 483 6.0 304
FIGURE 2.16 Mean scores and distribution of Year 4 reading achievement within Australia, by Indigenous background
Figure 2.17 adds to the picture of reading performance by providing the percentages of Indigenous and non-Indigenous students at each of the international benchmarks, with differences being apparent at both ends of the achievement scale. Seventeen per cent of non-Indigenous students reached the Advanced benchmark compared to four per cent of Indigenous students.
At the lower levels of performance, the differences are just as stark, with 18 per cent of Indigenous students not reaching the Low benchmark, compared to just four per cent of non-Indigenous students.
Fifty-seven per cent of Indigenous students reached the Intermediate benchmark (the proficient standard), while the comparable figure for non-Indigenous students was 83 per cent.
134 29 37
2418 32 21 4
17
Indigenous
Non-Indigenous
Students (%) at PIRLS international benchmarks
LowBelow Low Intermediate High Advanced
FIGURE 2.17 Percentage of Australian students at the international benchmarks for Year 4 reading, by Indigenous background
Figure 2.18 presents trends in reading performance at Year 4 by Indigenous background for the two cycles of PIRLS in which Australia participated. As noted earlier, the average score for all Australian students has increased significantly between 2011 and 2016, and this seems due to changes among non-Indigenous students, the larger group of students. There was no significant change in the average score of Indigenous students between 2011 (475 points) and 2016 (483 points).
The gap in average reading performance of Indigenous and non-Indigenous Year 4 students has changed little over this time – from 57 points in 2011 to 67 points in 2016.
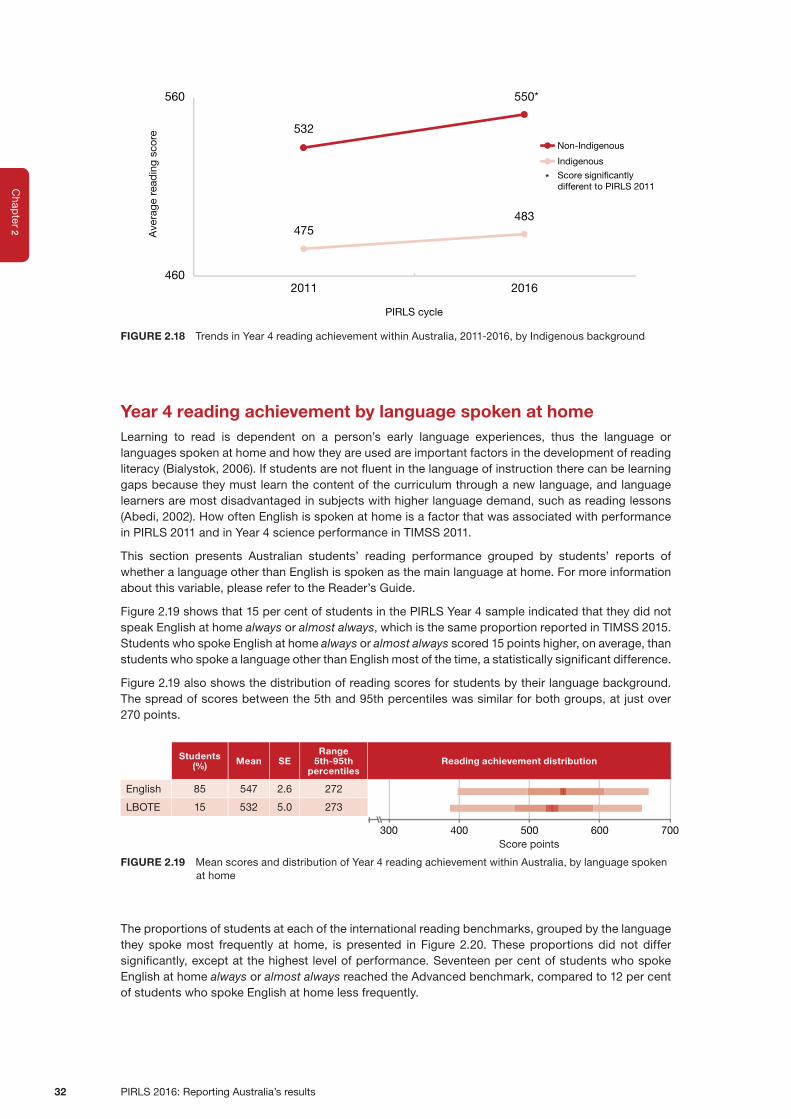
2C
hapter
PIRLS 2016: Reporting Australia’s results32
532
550*
475483
460
560
2011 2016
PIRLS cycle
Ave
rage
rea
din
g sc
ore
Indigenous
Score signi�cantlydifferent to PIRLS 2011
*
Non-Indigenous
FIGURE 2.18 Trends in Year 4 reading achievement within Australia, 2011-2016, by Indigenous background
Year 4 reading achievement by language spoken at homeLearning to read is dependent on a person’s early language experiences, thus the language or languages spoken at home and how they are used are important factors in the development of reading literacy (Bialystok, 2006). If students are not fluent in the language of instruction there can be learning gaps because they must learn the content of the curriculum through a new language, and language learners are most disadvantaged in subjects with higher language demand, such as reading lessons (Abedi, 2002). How often English is spoken at home is a factor that was associated with performance in PIRLS 2011 and in Year 4 science performance in TIMSS 2011.
This section presents Australian students’ reading performance grouped by students’ reports of whether a language other than English is spoken as the main language at home. For more information about this variable, please refer to the Reader’s Guide.
Figure 2.19 shows that 15 per cent of students in the PIRLS Year 4 sample indicated that they did not speak English at home always or almost always, which is the same proportion reported in TIMSS 2015. Students who spoke English at home always or almost always scored 15 points higher, on average, than students who spoke a language other than English most of the time, a statistically significant difference.
Figure 2.19 also shows the distribution of reading scores for students by their language background. The spread of scores between the 5th and 95th percentiles was similar for both groups, at just over 270 points.
300 400 500 600 700Score points
Students (%) Mean SE
Range 5th-95th
percentilesReading achievement distribution
English 85 547 2.6 272
LBOTE 15 532 5.0 273
FIGURE 2.19 Mean scores and distribution of Year 4 reading achievement within Australia, by language spoken at home
The proportions of students at each of the international reading benchmarks, grouped by the language they spoke most frequently at home, is presented in Figure 2.20. These proportions did not differ significantly, except at the highest level of performance. Seventeen per cent of students who spoke English at home always or almost always reached the Advanced benchmark, compared to 12 per cent of students who spoke English at home less frequently.

2C
hap
ter
Year 4 reading results: International, national and Australian demographic groups 33
Over 80 per cent of English-speaking students managed to reach the Intermediate benchmark, while 76 per cent of non-English speaking students reached this level.
17
13
7
5
31
29
33
36
12
17
LBOTE
English
Students (%) at PIRLS international benchmarks
LowBelow Low Intermediate High Advanced
FIGURE 2.20 Percentage of Australian students at the international benchmarks for Year 4 reading, by language spoken at home
Year 4 reading achievement by books in the homeSocioeconomic status has been found (in PIRLS and other studies) to be related to achievement (Schagen, 2004, Shiel & Eivers, 2009). In PIRLS, the number of books in the home is used as a proxy for socioeconomic status. This section presents Australian students’ reading achievement according to the number of books in the home. For more information about this variable, please refer to the Reader’s Guide.
As shown in Figure 2.21, the majority of Australian students (56%) reported having an average number of books and only 19 per cent reported having many books at home. Students who have many books in the home recorded the highest reading performance, scoring, on average, 22 points higher than students with an average number of books in the home, and 80 points higher than those with a few books in the home. This is consistent with previous cycles of PIRLS and TIMSS that have shown that students from homes with more literacy resources achieve, on average, at higher levels in Year 4 reading, mathematics and science than students from less well-resourced homes.
Figure 2.21 also shows the spread of scores in reading for students according to their report of the number of books in the home. The spread of scores for students with many books in the home was similar to that for students with a few books in the home, over 260 points. The range between the 5th and 95th percentiles was slightly narrower for students in the group who reported having an average number of books in the home (248 points).
Students (%) Mean SE
Range 5th– 95th
percentilesReading achievement distribution
Many books 19 578 4.3 261
Avg. no. of books 56 556 2.3 248
A few books 26 498 3.3 268
300 400 500 600 700
FIGURE 2.21 Mean scores and distribution of Year 4 reading achievement within Australia, by number of books in the home
Figure 2.22 presents the proportions of students at each of the international benchmarks for reading, grouped by the number of books they reported having in the home. Of those students who reported having many books in the home, 28 per cent reached the Advanced benchmark, compared to 17 per cent for students in the average number of books category and just 4 per cent for those with a few books in the home.
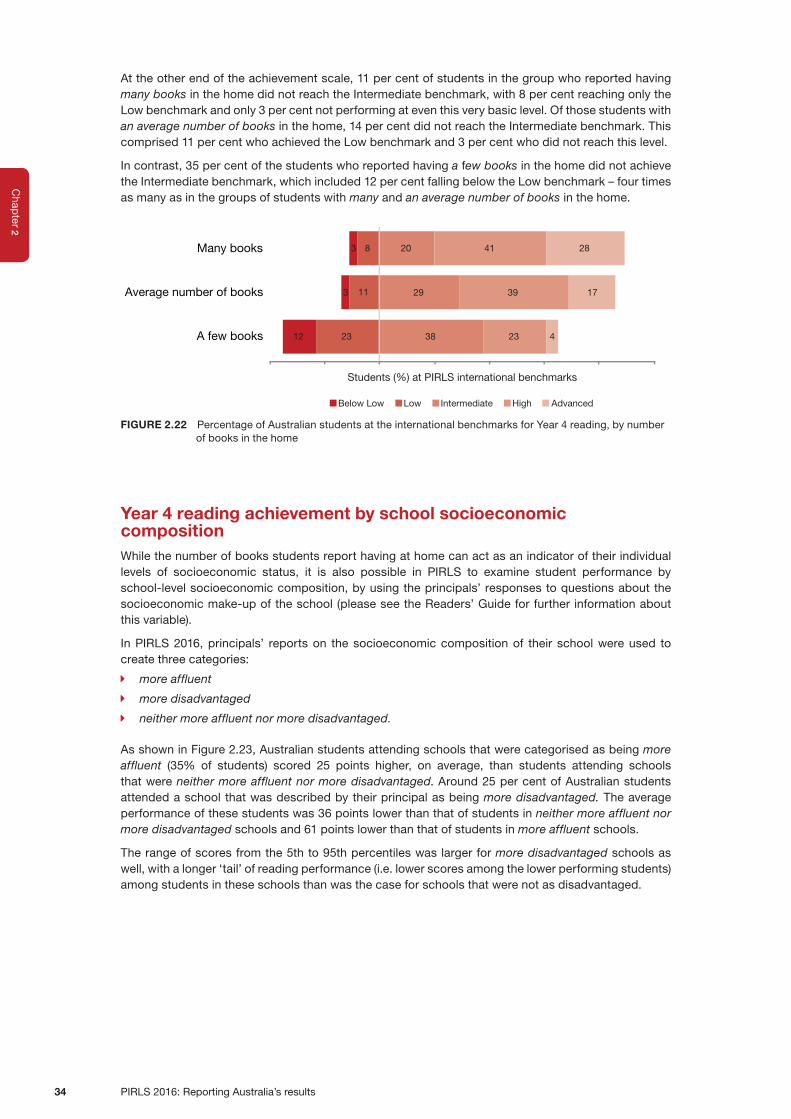
2C
hapter
PIRLS 2016: Reporting Australia’s results34
At the other end of the achievement scale, 11 per cent of students in the group who reported having many books in the home did not reach the Intermediate benchmark, with 8 per cent reaching only the Low benchmark and only 3 per cent not performing at even this very basic level. Of those students with an average number of books in the home, 14 per cent did not reach the Intermediate benchmark. This comprised 11 per cent who achieved the Low benchmark and 3 per cent who did not reach this level.
In contrast, 35 per cent of the students who reported having a few books in the home did not achieve the Intermediate benchmark, which included 12 per cent falling below the Low benchmark – four times as many as in the groups of students with many and an average number of books in the home.
23
11
8
12
3
3
38
29
20
23
39
41
4
17
28
A few books
Average number of books
Many books
Students (%) at PIRLS international benchmarks
LowBelow Low Intermediate High Advanced
FIGURE 2.22 Percentage of Australian students at the international benchmarks for Year 4 reading, by number of books in the home
Year 4 reading achievement by school socioeconomic compositionWhile the number of books students report having at home can act as an indicator of their individual levels of socioeconomic status, it is also possible in PIRLS to examine student performance by school-level socioeconomic composition, by using the principals’ responses to questions about the socioeconomic make-up of the school (please see the Readers’ Guide for further information about this variable).
In PIRLS 2016, principals’ reports on the socioeconomic composition of their school were used to create three categories:
� more affluent
� more disadvantaged
� neither more affluent nor more disadvantaged.
As shown in Figure 2.23, Australian students attending schools that were categorised as being more affluent (35% of students) scored 25 points higher, on average, than students attending schools that were neither more affluent nor more disadvantaged. Around 25 per cent of Australian students attended a school that was described by their principal as being more disadvantaged. The average performance of these students was 36 points lower than that of students in neither more affluent nor more disadvantaged schools and 61 points lower than that of students in more affluent schools.
The range of scores from the 5th to 95th percentiles was larger for more disadvantaged schools as well, with a longer ‘tail’ of reading performance (i.e. lower scores among the lower performing students) among students in these schools than was the case for schools that were not as disadvantaged.

2C
hap
ter
Year 4 reading results: International, national and Australian demographic groups 35
300 400 500 600 700Score points
Students (%) Mean SE
Range 5th–95th
percentilesReading achievement distribution
More affluent 35 570 4.6 251
Neither more affluent nor more disadvantaged
38 545 3.2 264
More disadvantaged 26 509 4.3 287
FIGURE 2.23 Mean scores and distribution of Year 4 reading achievement within Australia, by school socioeconomic composition
Figure 2.24 shows the percentages of Year 4 students at each of the international benchmarks in reading, by school socioeconomic composition. The longer ‘tail’ in reading among students in more disadvantaged schools is evident again here, with 31 per cent of students in these schools not reaching the Intermediate benchmark, including 11 per cent who did not reach the Low benchmark. In contrast, only 5 per cent of students from neither more affluent nor more disadvantaged schools and 2 per cent from more affluent schools were performing at a level below that of the Low international benchmark.
At the other end of the performance scale, there were also stark differences associated with school-level advantage, with 24 per cent of students in more affluent schools reaching the Advanced benchmark, compared to 15 per cent of students in neither more affluent nor more disadvantaged schools and only 7 per cent of students in more disadvantaged schools.
Sixty-nine per cent of students in more disadvantaged schools were performing at or above the Intermediate benchmark (the proficient standard), compared to over 80 per cent of students in other schools.
20
14
9
11
5
2
35
30
24
27
36
41
7
15
24
More disadvantaged
Neither more af�uentnor more disadvantaged
More af�uent
Students (%) at PIRLS international benchmarks
LowBelow Low Intermediate High Advanced
FIGURE 2.24 Percentage of Australian students at the international benchmarks for Year 4 reading, by school socioeconomic composition
Year 4 reading achievement by school geographic locationResearch, including past cycles of PIRLS and TIMSS, has found that students attending schools in remote or regional areas of Australia are often at an educational disadvantage compared to students attending metropolitan schools (e.g. Panizzon & Pegg, 2007; Thomson et al, 2012, Thomson, De Bortoli & Underwood, 2017). This section presents Year 4 students’ reading performance according to the geographic location of the school. For more information about this variable, please refer to the Reader’s Guide.
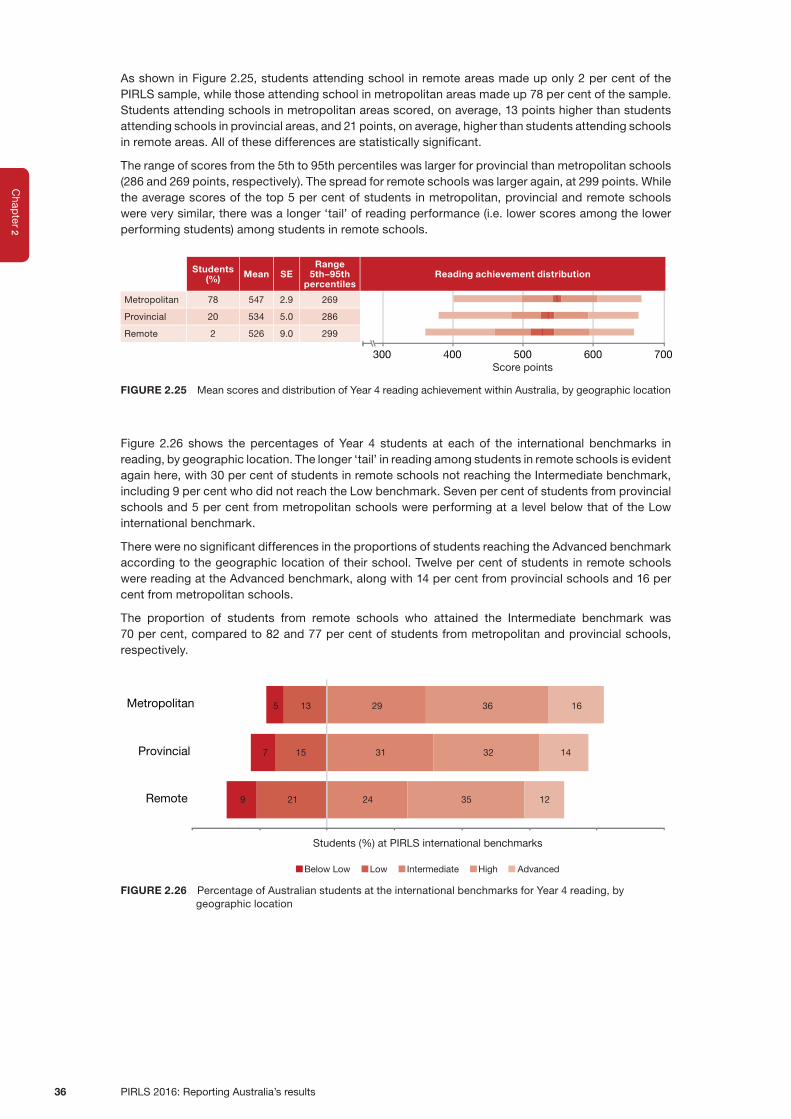
2C
hapter
PIRLS 2016: Reporting Australia’s results36
As shown in Figure 2.25, students attending school in remote areas made up only 2 per cent of the PIRLS sample, while those attending school in metropolitan areas made up 78 per cent of the sample. Students attending schools in metropolitan areas scored, on average, 13 points higher than students attending schools in provincial areas, and 21 points, on average, higher than students attending schools in remote areas. All of these differences are statistically significant.
The range of scores from the 5th to 95th percentiles was larger for provincial than metropolitan schools (286 and 269 points, respectively). The spread for remote schools was larger again, at 299 points. While the average scores of the top 5 per cent of students in metropolitan, provincial and remote schools were very similar, there was a longer ‘tail’ of reading performance (i.e. lower scores among the lower performing students) among students in remote schools.
300 400 500 600 700Score points
Students (%) Mean SE
Range 5th–95th
percentilesReading achievement distribution
Metropolitan 78 547 2.9 269
Provincial 20 534 5.0 286
Remote 2 526 9.0 299
FIGURE 2.25 Mean scores and distribution of Year 4 reading achievement within Australia, by geographic location
Figure 2.26 shows the percentages of Year 4 students at each of the international benchmarks in reading, by geographic location. The longer ‘tail’ in reading among students in remote schools is evident again here, with 30 per cent of students in remote schools not reaching the Intermediate benchmark, including 9 per cent who did not reach the Low benchmark. Seven per cent of students from provincial schools and 5 per cent from metropolitan schools were performing at a level below that of the Low international benchmark.
There were no significant differences in the proportions of students reaching the Advanced benchmark according to the geographic location of their school. Twelve per cent of students in remote schools were reading at the Advanced benchmark, along with 14 per cent from provincial schools and 16 per cent from metropolitan schools.
The proportion of students from remote schools who attained the Intermediate benchmark was 70 per cent, compared to 82 and 77 per cent of students from metropolitan and provincial schools, respectively.
21
15
13
9
7
5
24
31
29
35
32
36
12
14
16
Remote
Provincial
Metropolitan
Students (%) at PIRLS international benchmarks
LowBelow Low Intermediate High Advanced
FIGURE 2.26 Percentage of Australian students at the international benchmarks for Year 4 reading, by geographic location

2C
hap
ter
Year 4 reading results: International, national and Australian demographic groups 37
Australia’s results in the reading purposes and processesAs noted in Chapter 1, the PIRLS reading assessment can be described in terms of reading purposes and processes. These purposes (or reasons for reading) account for most of the reading done by young people at school and outside of school – for literary experience (that is, reading for interest and pleasure) and in order to acquire and use information (reading to learn). The reading processes detail the thinking processes that students need in order to respond to the assessment items, but also to interact with texts in general.
Each prompt text is categorised as either literary or informational, and the accompanying questions address that purpose – questions regarding theme, plot events, characters and setting for literary texts, and questions about the information contained in the passages for informational texts.
The processes assessed – focus on and retrieve explicitly stated information; make straightforward inferences; interpret and integrate ideas and information; and examine and evaluated content, language, and textual elements – are evaluated across both reading purposes. Each assessment question is thus categorised according to one reading purpose and one reading process. The reading processes are summarised on two scales – retrieving and inferencing (combining responses to retrieving and making straightforward inferences) and integrating (combining interpreting and integrating items with examining and evaluating items).
Overall, Australian students showed a relative strength in the Literary reading purpose, with a mean score of 547 (compared to an overall mean of 544), but no relative weakness in the Informational purpose (mean score of 543). This was different to other English-speaking comparison countries (Canada, England, New Zealand and the United States) who all displayed relative strengths in the Literary purpose accompanied by relative weaknesses in the Informational purpose. In contrast, the Russian Federation and Hong Kong both showed relative strengths in the Informational purpose. Hong Kong also had a relative weakness in the Literary purpose, while Singapore showed no difference in performance on the two purpose sub-scales.
Tables 2.3 and 2.4 present the average achievement in each of the Year 4 reading purposes and processes for Australia as a whole, for each of the Australian jurisdictions, for males and females, and for Indigenous and non-Indigenous students, while Table 2.5 presents trends for Australia in the reading purposes and processes since 2011.
The relative strength in Literary reading purposes shown at the national level was also evident in each of the Australian jurisdictions (to varying degrees), across Indigenous background and among female students. Interestingly, male students showed no relative strength in Literary texts (Table 2.3).
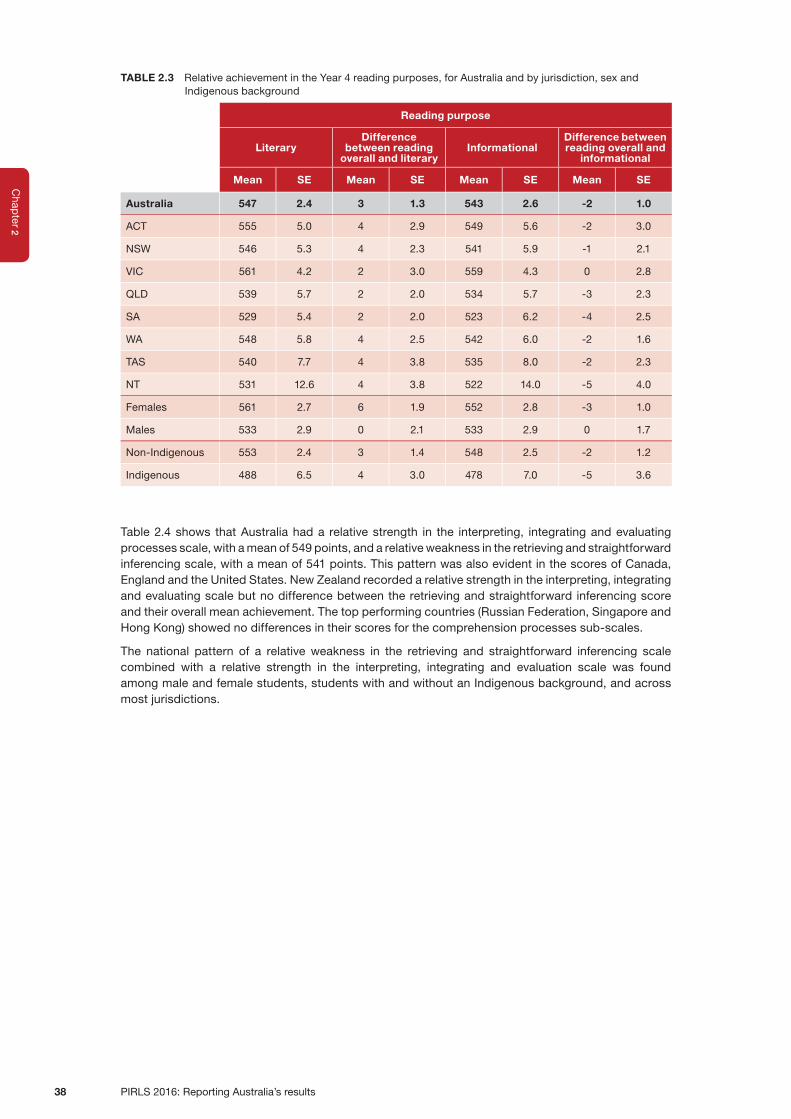
2C
hapter
PIRLS 2016: Reporting Australia’s results38
TABLE 2.3 Relative achievement in the Year 4 reading purposes, for Australia and by jurisdiction, sex and Indigenous background
Reading purpose
LiteraryDifference
between reading overall and literary
InformationalDifference between reading overall and
informational
Mean SE Mean SE Mean SE Mean SE
Australia 547 2.4 3 1.3 543 2.6 -2 1.0
ACT 555 5.0 4 2.9 549 5.6 -2 3.0
NSW 546 5.3 4 2.3 541 5.9 -1 2.1
VIC 561 4.2 2 3.0 559 4.3 0 2.8
QLD 539 5.7 2 2.0 534 5.7 -3 2.3
SA 529 5.4 2 2.0 523 6.2 -4 2.5
WA 548 5.8 4 2.5 542 6.0 -2 1.6
TAS 540 7.7 4 3.8 535 8.0 -2 2.3
NT 531 12.6 4 3.8 522 14.0 -5 4.0
Females 561 2.7 6 1.9 552 2.8 -3 1.0
Males 533 2.9 0 2.1 533 2.9 0 1.7
Non-Indigenous 553 2.4 3 1.4 548 2.5 -2 1.2
Indigenous 488 6.5 4 3.0 478 7.0 -5 3.6
Table 2.4 shows that Australia had a relative strength in the interpreting, integrating and evaluating processes scale, with a mean of 549 points, and a relative weakness in the retrieving and straightforward inferencing scale, with a mean of 541 points. This pattern was also evident in the scores of Canada, England and the United States. New Zealand recorded a relative strength in the interpreting, integrating and evaluating scale but no difference between the retrieving and straightforward inferencing score and their overall mean achievement. The top performing countries (Russian Federation, Singapore and Hong Kong) showed no differences in their scores for the comprehension processes sub-scales.
The national pattern of a relative weakness in the retrieving and straightforward inferencing scale combined with a relative strength in the interpreting, integrating and evaluation scale was found among male and female students, students with and without an Indigenous background, and across most jurisdictions.

2C
hap
ter
Year 4 reading results: International, national and Australian demographic groups 39
TABLE 2.4 Relative achievement in the Year 4 reading processes, for Australia and by jurisdiction, sex and Indigenous background
Reading processes
Retrieving and straightforward
inferencing
Difference between reading overall and
retrieving
Interpreting, integrating and
evaluating
Difference between reading overall and
interpreting
Mean SE Mean SE Mean SE Mean SE
Australia 541 2.6 -4 1.4 549 2.4 5 1.0
ACT 548 5.6 -4 3.2 556 5.2 5 3.0
NSW 539 5.6 -3 2.0 548 5.2 6 1.5
VIC 556 4.0 -3 3.0 563 4.0 4 3.0
QLD 533 5.7 -5 2.3 543 5.6 5 2.1
SA 523 5.8 -5 2.4 531 5.5 4 1.9
WA 542 5.9 -3 2.5 549 5.7 5 2.3
TAS 533 7.9 -3 2.7 542 7.8 5 2.3
NT 520 13.3 -7 2.9 529 13.8 2 2.6
Females 552 2.7 -3 1.3 561 2.6 5 1.2
Males 530 3.0 -4 1.9 538 2.7 4 1.7
Non-Indigenous 546 2.5 -4 1.4 555 2.3 5 1.1
Indigenous 480 7.0 -3 4.6 490 6.6 6 4.0
As shown in Table 2.5, in 2011, there was no difference in the reading purpose sub-scale scores for Australia overall, while there was small (but still significant) difference in the comprehension process sub-scales, which favoured the interpreting, integrating and evaluating sub-scale. As we have seen previously, this difference increased in 2016, and a difference in the purpose sub-scale also appeared. While performance in all sub-areas of PIRLS reading achievement has improved in Australia, work needs to be done particularly focussing on improving skills in the area of Informational reading, in which the top performing countries tend to excel.
TABLE 2.5 Trends in Australian achievement in the Year 4 reading purposes and processes
Reading purpose Reading processes
Literary InformationalRetrieving and
straightforward inferencing
Interpreting, integrating and
evaluating
Mean SE Mean SE Mean SE Mean SE
2011 527 2.4 528 2.3 527 2.6 529 2.2
2016 547 2.4 543 2.6 541 2.6 549 2.4
2C
hapter
PIRLS 2016: Reporting Australia’s results40
Who are Australia’s poorer readers?The results for Australian students suggest some positive changes in the average reading performance of students since PIRLS 2011, with an increase in the overall average score, and increased proportions of students reading at or above the Intermediate benchmark (the proficient standard for Australian students). However, they also highlighted the existence of a group of students for whom reading comprehension, at least as measured in PIRLS, is an area of great difficulty. Around 7 per cent of students in Year 4 did not manage to reach the Low benchmark in PIRLS 2016, and this proportion remains unchanged from PIRLS 2011.
This group of students had difficulty locating and reproducing information, actions or ideas that were explicitly stated in the texts they read (or in accompanying charts or diagrams) and making straightforward inferences about events, reasons for characters’ actions, or explanations. They were also unable to interpret story events or central ideas or give simple explanations.
Not being able to read at this minimal level places these students at great risk, particularly as this is the time when students move on from the stage of learning to read, to the stage of reading to learn. Research in the last century called the notion of ‘late blooming’ readers into question (e.g. Francis, Shaywitz, Stuebing, Shaywitz & Fletcher, 1996 and Juel, 1988) and debate reigns as to what aspects of reading can be improved with targeted interventions and when (see Torgeson & Hudson, 2006) but the fact remains that if a student is not able to glean what is required from a text, and more and more of their learning is text-based, then they are unlikely to be able to keep up with what they are supposed to be learning, regardless of the subject.
The composition of the group of students who performed below the Low international benchmark for reading was examined using logistic regression, which calculates the odds of Year 4 students with particular demographic characteristics being in the ‘poor reader’ group (that is, scoring below the Low benchmark cut-off of 400 points). Further details about interpreting odds ratios and the results of the logistic regression are presented in Appendix B.
The results of the analysis were as follows:
� Year 4 boys had two times the odds of being a poor reader than Year 4 girls (with a predicted probability of 0.10 compared to 0.05).
� Students with an Indigenous background had almost four times the odds of being a poor reader compared to non-Indigenous students (predicted probability of 0.38 compared to 0.10).
� There was no significant difference in the odds of being a poor reader for students who mainly used a language other than English at home compared to students who spoke English always or almost always (0.05 compared to 0.03).
� Students who reported having only a few books at home had over three times the odds of being a poor reader compared to students with more books at home (predicted probability of 0.27 compared to 0.08)
� Students who attended a remote school had almost three times the odds of being a poor reader compared to students in other schools (predicted probability of 0.19 compared to 0.07)
� Students who attended schools that were categorised as more disadvantaged by their principals had more than two times the odds of being a poor reader compared to students in other schools (predicted probability of 0.14 compared to 0.06).

Findings for schools and the learning environment in Australia 41
3Chapter
Findings for schools and the learning environment in Australia
Key findings
� Forty-one per cent of students attended schools in which the principal had completed a postgraduate university degree, and about 30 per cent had a principal with between 10 and 20 years of experience.
� Thirty-five per cent of students attended schools categorised by their principals as having a more affluent student population, 26 per cent as having a more disadvantaged student population and the remainder were in schools that were neither more affluent nor more disadvantaged.
� Students attending more affluent schools scored 61 points higher, on average, than students attending more disadvantaged schools.
� Students in schools whose principals indicated that 90 per cent or more of the students had English as their first language tended to have higher average achievement than students in schools whose principals indicated that less than 90 per cent of the student population had English as their first language.
� Students attending more affluent schools were more likely than those attending more disadvantaged schools to be in an environment where most students spoke English as their first language.
� In more affluent schools, achievement was high for all students, regardless of the proportion of second language learners in the school. In more disadvantaged schools, however, a higher proportion of students who spoke English as their first language conferred a benefit, with students in such schools scoring higher, on average, than students in schools with proportionally fewer English-speaking students.
� Students who attended schools where less than 25 per cent of students had literacy skills upon entry to school had significantly lower achievement, on average, than students who attended schools where more than 25 per cent of students had literacy skills upon entry to school.
3C
hapter
PIRLS 2016: Reporting Australia’s results42
� Of those students at more affluent schools, 7 per cent attended schools in which more than 75 per cent of students entered school with literacy skills, compared to none in more disadvantaged schools. In contrast, 81 per cent of students in more disadvantaged schools were in schools in which fewer than 25 per cent of students entered with literacy skills, compared to 42 per cent of students in more affluent schools.
� Sixty-four per cent of students attended schools where reading instruction was not affected by resource shortages, and average reading scores were significantly higher in these schools compared those in which instruction was affected by resource shortages.
� A greater proportion of students in more disadvantaged schools than in more affluent schools were affected by reading resource shortages (58% and 26%, respectively)
� More than half of Australian Year 4 students were categorised as having a high sense of school belonging, 33 per cent had some sense of belonging and 10 per cent had little sense of school belonging. Students with a high sense of school belonging scored 37 points higher, on average, than students with little sense of school belonging.
� There was a clear relationship between Australian students’ reading achievement and their principals’ and teachers’ reports of school emphasis on academic success, with a higher emphasis on academic success associated with higher average achievement.
� Only 4 per cent of students in more disadvantaged schools were in environments with a very high emphasis on academic success, as rated by their principals, compared to 26 per cent of students at more affluent schools.
� Job satisfaction was relatively high among Australian teachers, with only 2 per cent of Year 4 students being taught by a teacher who was less than satisfied, and 58 per cent taught by a teacher who was very satisfied. There was no difference in the average job satisfaction scores of teachers in more affluent schools and more disadvantaged schools.
� There was a clear relationship between Australian students’ reading achievement and their principals’ reports of school discipline problems – with fewer discipline problems associated with higher achievement. Students who attended more disadvantaged schools were far more likely than those in more affluent schools to face moderate to severe problems regarding school discipline.
� Higher teacher ratings on the Safe and Orderly Schools scale were associated with higher student achievement, on average. While 60 per cent of students at more disadvantaged schools and 86 per of students at more affluent schools had teachers who classified the school as being very safe and orderly, it is disturbing that 7 per cent of students in more disadvantaged schools were in environments deemed by their teachers to be less than safe and orderly.
� Nineteen per cent of Australian Year 4 students reported being bullied about weekly. Students who reported almost never being bullied had average reading scores more than 30 points higher than students who reported being bullied about weekly. Fifteen per cent of students who attended more affluent schools, compared to 23 per cent of students who attended more disadvantaged schools, reported being bullied about weekly. This difference was statistically significant, thought not as large as may have been expected.
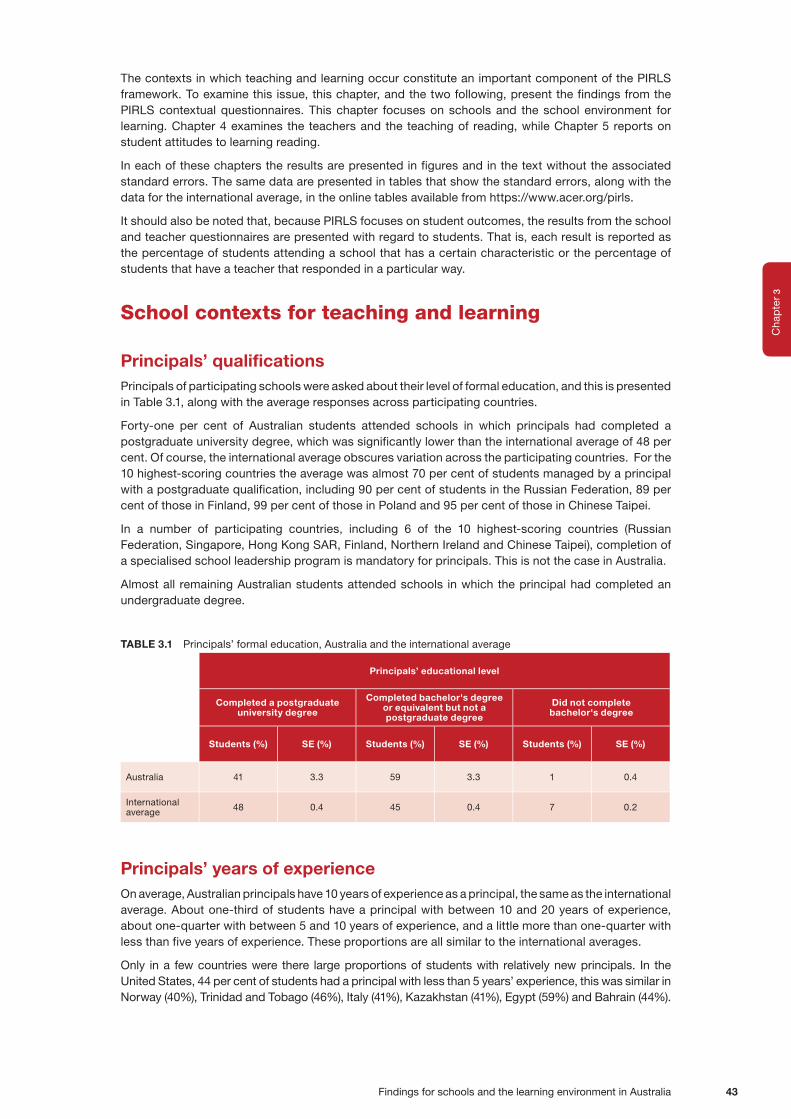
3C
hap
ter
Findings for schools and the learning environment in Australia 43
The contexts in which teaching and learning occur constitute an important component of the PIRLS framework. To examine this issue, this chapter, and the two following, present the findings from the PIRLS contextual questionnaires. This chapter focuses on schools and the school environment for learning. Chapter 4 examines the teachers and the teaching of reading, while Chapter 5 reports on student attitudes to learning reading.
In each of these chapters the results are presented in figures and in the text without the associated standard errors. The same data are presented in tables that show the standard errors, along with the data for the international average, in the online tables available from https://www.acer.org/pirls.
It should also be noted that, because PIRLS focuses on student outcomes, the results from the school and teacher questionnaires are presented with regard to students. That is, each result is reported as the percentage of students attending a school that has a certain characteristic or the percentage of students that have a teacher that responded in a particular way.
School contexts for teaching and learning
Principals’ qualifications Principals of participating schools were asked about their level of formal education, and this is presented in Table 3.1, along with the average responses across participating countries.
Forty-one per cent of Australian students attended schools in which principals had completed a postgraduate university degree, which was significantly lower than the international average of 48 per cent. Of course, the international average obscures variation across the participating countries. For the 10 highest-scoring countries the average was almost 70 per cent of students managed by a principal with a postgraduate qualification, including 90 per cent of students in the Russian Federation, 89 per cent of those in Finland, 99 per cent of those in Poland and 95 per cent of those in Chinese Taipei.
In a number of participating countries, including 6 of the 10 highest-scoring countries (Russian Federation, Singapore, Hong Kong SAR, Finland, Northern Ireland and Chinese Taipei), completion of a specialised school leadership program is mandatory for principals. This is not the case in Australia.
Almost all remaining Australian students attended schools in which the principal had completed an undergraduate degree.
TABLE 3.1 Principals’ formal education, Australia and the international average
Principals’ educational level
Completed a postgraduate university degree
Completed bachelor's degree or equivalent but not a postgraduate degree
Did not complete bachelor's degree
Students (%) SE (%) Students (%) SE (%) Students (%) SE (%)
Australia 41 3.3 59 3.3 1 0.4
International average 48 0.4 45 0.4 7 0.2
Principals’ years of experience On average, Australian principals have 10 years of experience as a principal, the same as the international average. About one-third of students have a principal with between 10 and 20 years of experience, about one-quarter with between 5 and 10 years of experience, and a little more than one-quarter with less than five years of experience. These proportions are all similar to the international averages.
Only in a few countries were there large proportions of students with relatively new principals. In the United States, 44 per cent of students had a principal with less than 5 years’ experience, this was similar in Norway (40%), Trinidad and Tobago (46%), Italy (41%), Kazakhstan (41%), Egypt (59%) and Bahrain (44%).

3C
hapter
PIRLS 2016: Reporting Australia’s results44
TABLE 3.2 Principals’ years of experience, Australia and the international average
Principals’ years of experienceAverage years
of experience as a principal
20 years or more At least
10 but less than 20 years
At least 5 but less than
10 yearsLess than 5 years
Students (%) SE (%) Students
(%) SE (%) Students (%) SE (%) Students
(%) SE (%)Average years of
experience SE
Australia 15 2.9 32 3.8 25 2.9 27 3.1 10 0.5
International average 14 0.4 31 0.5 27 0.5 28 0.5 10 0.1
School socioeconomic composition The school, as the heart of the educational system, can contribute to equity and inclusion by providing all students with the opportunity to learn and succeed. In many countries, student achievement is typically lower in schools where most students come from a disadvantaged background. Unfortunately, research identifies the primary reasons for this as the strong negative impact of the students’ own socioeconomic background on performance, exacerbated by the inability of many disadvantaged schools to counter this impact (OECD, 2012, p. 104).
While students’ own socioeconomic background has the greatest effect on their achievement, the socioeconomic composition of schools also has a substantial effect. For example, in the 2015 Australian PISA report, data were presented to show that disadvantaged students attending affluent schools (schools with a high proportion of affluent students), scored at a level almost two years higher than disadvantaged students attending disadvantaged schools (Thomson, De Bortoli & Underwood, 2017).
As presented in the Readers’ Guide and Chapter 2, Australian schools were categorised as being more affluent, more disadvantaged or neither more affluent nor more disadvantaged according to their principals’ responses to items on the school questionnaire. Figure 3.1 presents the proportions of students in schools in each of these categories, along with their average reading score.
At Year 4, 35 per cent of Australian students attended more affluent schools, 38 per cent attended schools that were neither advantaged nor disadvantaged, and 26 per cent of students attended schools that were more disadvantaged. These proportions were not different to the international averages.
As can be seen in Figure 3.1, and as seen in myriad other studies, there is a clear relationship between the composition of the student body and average achievement in reading at Year 4. A substantial gap can be seen between those students attending schools with a more affluent student body than those students attending schools with a more disadvantaged student body. This gap, 61 points on average, is larger than the gap seen between more disadvantaged and more affluent schools internationally of 43 points. In terms of the PIRLS benchmarks, the average Australian student attending a more affluent school is achieving at a clear High benchmark level, those in neither more affluent nor more disadvantaged schools at a level just under the High international benchmark, and those in more disadvantaged schools at the Intermediate international benchmark (further information about the benchmarks and school socioeconomic composition is presented in Figure 2.24 in Chapter 2).
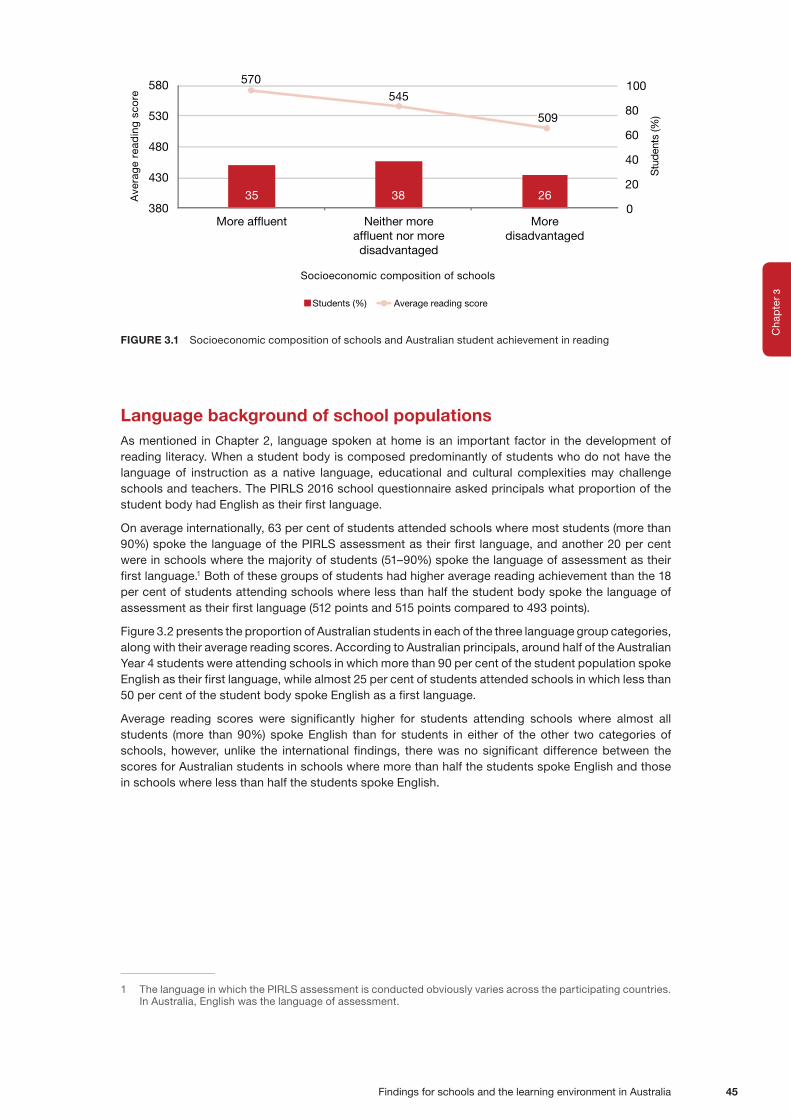
3C
hap
ter
Findings for schools and the learning environment in Australia 45
545
35 38 26
570
0
20
40
60
80
100
380
430
480
530
580
More af�uent Neither moreaf�uent nor moredisadvantaged
Moredisadvantaged
Stu
dent
s (%
)
Ave
rag
e re
adin
g s
core
509
Students (%) Average reading score
Socioeconomic composition of schools
FIGURE 3.1 Socioeconomic composition of schools and Australian student achievement in reading
Language background of school populations As mentioned in Chapter 2, language spoken at home is an important factor in the development of reading literacy. When a student body is composed predominantly of students who do not have the language of instruction as a native language, educational and cultural complexities may challenge schools and teachers. The PIRLS 2016 school questionnaire asked principals what proportion of the student body had English as their first language.
On average internationally, 63 per cent of students attended schools where most students (more than 90%) spoke the language of the PIRLS assessment as their first language, and another 20 per cent were in schools where the majority of students (51–90%) spoke the language of assessment as their first language.1 Both of these groups of students had higher average reading achievement than the 18 per cent of students attending schools where less than half the student body spoke the language of assessment as their first language (512 points and 515 points compared to 493 points).
Figure 3.2 presents the proportion of Australian students in each of the three language group categories, along with their average reading scores. According to Australian principals, around half of the Australian Year 4 students were attending schools in which more than 90 per cent of the student population spoke English as their first language, while almost 25 per cent of students attended schools in which less than 50 per cent of the student body spoke English as a first language.
Average reading scores were significantly higher for students attending schools where almost all students (more than 90%) spoke English than for students in either of the other two categories of schools, however, unlike the international findings, there was no significant difference between the scores for Australian students in schools where more than half the students spoke English and those in schools where less than half the students spoke English.
1 The language in which the PIRLS assessment is conducted obviously varies across the participating countries. In Australia, English was the language of assessment.

3C
hapter
PIRLS 2016: Reporting Australia’s results46
Stu
den
ts (%
)
Ave
rag
e re
adin
g s
core
552
50% or less of students have English as their�rst language
51-90% ofstudents have English as their�rst language
More than 90%of students have English as their�rst language
23 28 50020406080100
380
430
480
530
580 538 535
Students (%) Average reading score
Language background composition of schools
FIGURE 3.2 Language background of Australian schools’ populations and student achievement in reading
In many other countries, particularly Western countries, there are proportionally fewer students attending schools in which less than 50 per cent of the student population speaks the language of the test. For example, in Canada (19%), United States (15%), Ireland (11%) and New Zealand (16%) this group of students is smaller than in Australia. In England, however, it is slightly larger, at 27 per cent of students.
The relationship between language background of students and socioeconomic background of schools
Given the relationship between aspects of the composition of school populations and student achievement, it is important from a policy perspective to gain a better understanding of the relationship between the proportion of students at a school who do not have English as their first language and the proportion of disadvantaged students at schools.
Figure 3.3 shows the differences and similarities in enrolments by language background in more affluent and more disadvantaged schools in Australia. It shows that students attending more affluent schools are far more likely than those attending more disadvantaged schools to be in an environment where most students speak English as their first language (58% compared to 31%). However, there is no significant difference between the percentage of students attending schools in which 50% or less of the student body has English as a first language in more affluent schools and more disadvantaged schools. It could be hypothesised that this reflects the different types of students in Australian schools whose first language is other than English – international fee-paying students, many of whom may attend private fee-paying schools or higher socioeconomic background government schools, and less wealthy immigrants and refugees, who may be more likely to attend more disadvantaged government schools based on the area in which they live (Australian Bureau of Statistics, 2014).
More af�uent schools More disadvantaged schools
58%20%
22% 26%31%
43%
More than 90% of students have English as their �rst language
51-90% of students have English as their �rst language
50% or less of students have English as their �rst language
FIGURE 3.3 Language background of school Australian populations and school socioeconomic background

3C
hap
ter
Findings for schools and the learning environment in Australia 47
Figure 3.4 presents achievement scores in PIRLS for students in each of the three school language groups for more affluent schools and for more disadvantaged schools. This tends to reinforce the discussion presented for Figure 3.4. In cases where a school is classified as more affluent, the proportion of students in the school for whom English is a second language is irrelevant – achievement is high for students across each language grouping. Perhaps this is because while English is not a first language, it is a well-understood second language.
In the more disadvantaged schools, however, a higher proportion of the student body speaking English confers a benefit, with students in these schools scoring higher, on average, than students in schools with proportionally fewer English-speakers. For students who have migrated as refugees and would be more likely to be attending more disadvantaged schools, it is possible that English is still being learned and proficiency not high, and so only those students attending schools in which there are few of these students are likely to have high achievement.
460
480
500
520
540
560
580
Ave
rag
e re
adin
g s
core
50% or less of students have
English as their �rst language
51-90% of students have English as
their �rst language
More than 90% of students have
English as their �rst language
567 569 571
506 502
521
Language background composition of schools
More af�uent schools More disadvantaged schools
FIGURE 3.4 Reading achievement by language background and school socioeconomic background
Students entering school with literacy skillsLiteracy does not begin when children start school. Most children are exposed to written language in the years before they start school, through participating in language activities in the home and during pre-primary education and care. Research has proposed a number of factors that facilitate a successful transition from pre-literacy to literacy, including language development, letter and word identification and recognition and phonological awareness (Whitehurst & Lonigan, 1998).
School principals were asked to comment on the percentage of students in their school (‘more than 75 per cent’, ‘51–75 per cent’, ‘25–50 per cent’ or ‘less than 25 per cent’) who begin the first year of primary school with the six key skills:
� recognise most of the letters of the alphabet
� read some words
� read sentences
� read a story
� write letters of the alphabet
� write some words.
Principals’ responses to these items were combined to create the Schools Where Students Enter the Primary Grades with Literacy Skills scale. Students were then assigned to three groups based on their principal’s scale score.

3C
hapter
PIRLS 2016: Reporting Australia’s results48
Year 4 students who attended schools where more than 75 per cent enter with skills had a score on the scale of at least 12.6, which corresponds to principals reporting that over 75 per cent of the students have three of the skills and 51–75 per cent of the students have the other three of the skills, on average. Students who attended schools where less than 25 per cent enter with skills had a score no higher than 9.2, which corresponds to principals reporting that less than 25 per cent of the students have three of the skills and 25–50 per cent of the students have the other three skills, on average. All other students attended schools where 25 per cent to 75 per cent enter with skills.
Internationally, there was a great deal of variation in the highest category – more than 75 per cent of students entering with literacy skills – from 96 per cent in Ireland where most students start pre-primary school after they turn four, to 0 per cent in Slovak Republic, Slovenia, Czech Republic and Germany. On average, 22 per cent of students attended schools where more than 75 per cent enter with skills, and another 47 per cent attended schools where 25–75 per cent enter with skills. Both groups of students had higher average reading achievement than the 31 per cent of students attending schools where less than 25 per cent enter with skills (516 and 512 points compared to 491 points).
In Australia (Figure 3.5), only around 6 per cent of students attended a primary school where more than 75 per cent enter with skills. A further 42 per cent of students attended schools where 25–75 per cent enter with skills, and more than 50 per cent of students attended schools where less than 25 per cent enter school with skills. The average reading scores differed significantly across these groupings.
Stu
den
ts (%
)
Ave
rag
e re
adin
g s
core
School where less than 25% enter
with skills
School where 25-75% enter
with skills
School where more than 75% enter with skills
52 42 6
536550
569
0
20
40
60
80
100
380
430
480
530
580
Schools Where Students Enter the Primary Grades with Literacy Skills Scale
Students (%) More disadvantaged schools
FIGURE 3.5 Schools Where Students Enter the Primary Grades with Literacy Skills scale and Australian student achievement in reading
Obviously, not all children come to school with the same experiences, and some are equipped to develop literacy skills at school better than others. Access to materials such as books, alphabet materials, crayons and paper, local libraries, and language rich environments are important factors in literacy development (DEST, 2005). Studies that explored literacy in disadvantaged families found that such homes were often limited in their provision of these materials (Teale & Sulzby, 1986). There is a great deal of evidence showing that, on average, students from disadvantaged homes disproportionately experience reading difficulties (e.g. Australian Bureau of Statistics, 1996; Freebody & Ludwig, 1995), and that these students tend to get left behind once they do start school.
Figure 3.6 presents the proportion of students in each of the three early literacy categories for more affluent schools and more disadvantaged schools. Of those at more affluent schools, 22 per cent attend a school where more than 75 per cent enter with skills, compared to none in more disadvantaged schools. At the other end of the scale, the vast majority (96%) of students at more disadvantaged schools are in schools where less than 25 per cent enter with skills, compared to 30 per cent of those attending more affluent schools. The provision of school resources to facilitate the language development and growth of students at schools in which the majority of students have few literacy skills is critical in ensuring that all students have equal opportunities to develop their skills.

3C
hap
ter
Findings for schools and the learning environment in Australia 49
4%
96%
More af�uent schools
Schools where more than 75% enter with skills
Schools where 25–75% enter with skills
Schools where less than 25% enter with skills
More disadvantaged schools
57%
30%
22%
FIGURE 3.6 Schools Where Students Enter the Primary Grades with Literacy Skills scale and Australian school socioeconomic background
Instruction affected by reading resource shortages The extent and quality of school resources is also critical for quality instruction, and results from previous PIRLS cycles have shown that students in schools that are well resourced generally have higher levels of achievement than schools in which principals deem that shortages of resources affect the school’s capacity to provide instruction.
Principals were asked to comment on how much their school’s capacity to provide instruction (‘not at all’, ‘a little’, ‘some’ or ‘a lot’) was affected by a shortage of – or inadequacy in – the following general and reading instruction resources:
General school resources � instructional materials (e.g. textbooks)
� supplies (e.g. papers, pencils, materials)
� school buildings and grounds
� heating/cooling and lighting systems
� instructional space (e.g. classrooms)
� technologically competent staff
� audio-visual resources for delivery of instruction (e.g. interactive white boards, digital projectors)
� computer technology for teaching and learning (e.g. computers or tablets for student use).
Resources for reading instruction � teachers with a specialisation in reading
� computer software for reading instruction
� library resources (books, ebooks, magazines etc.)
� instructional materials for reading (e.g. reading series, textbooks).
Principals’ responses to these items were combined to create the Reading Resource Shortages scale. Students were then assigned to groups based on their principal’s scale score.
Students in schools where instruction was not affected by resource shortages had a score of at least 10.8, which is the point on the scale that corresponded to their principals indicating that shortages affected instruction ‘not at all’ for six of the twelve resources and ‘a little’ for the other six, on average. Students in schools where instruction was affected a lot by resource shortages had scores no higher
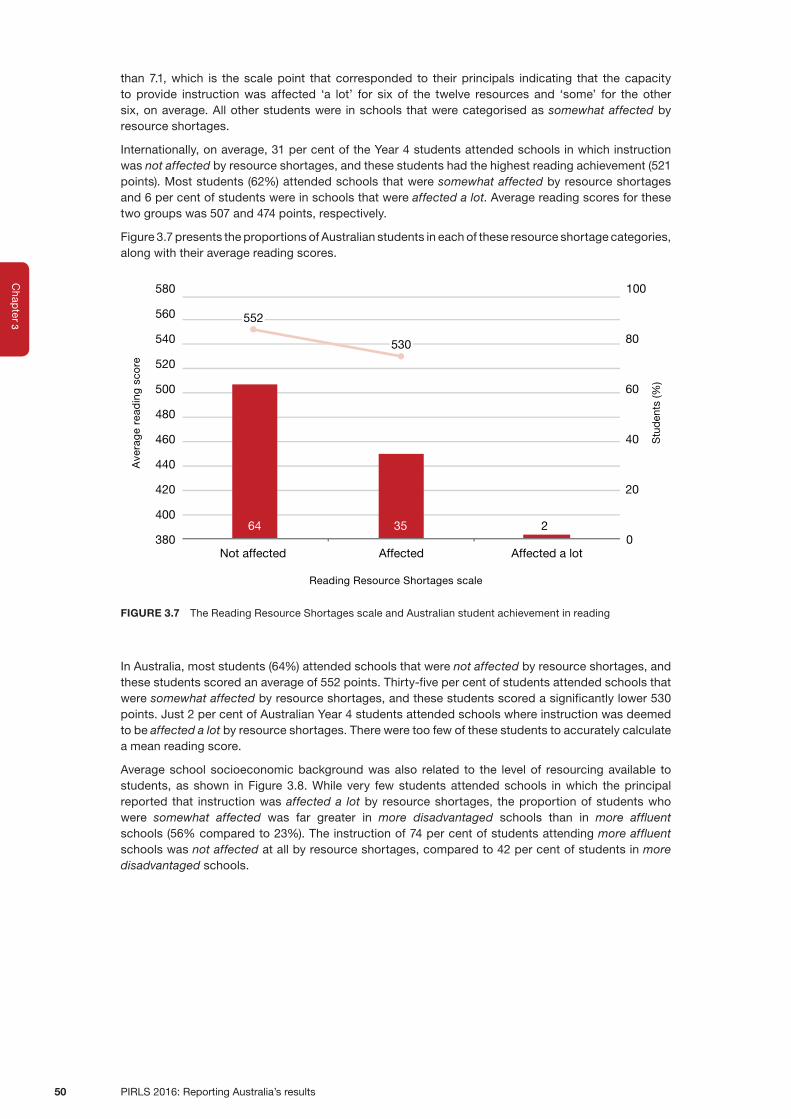
3C
hapter
PIRLS 2016: Reporting Australia’s results50
than 7.1, which is the scale point that corresponded to their principals indicating that the capacity to provide instruction was affected ‘a lot’ for six of the twelve resources and ‘some’ for the other six, on average. All other students were in schools that were categorised as somewhat affected by resource shortages.
Internationally, on average, 31 per cent of the Year 4 students attended schools in which instruction was not affected by resource shortages, and these students had the highest reading achievement (521 points). Most students (62%) attended schools that were somewhat affected by resource shortages and 6 per cent of students were in schools that were affected a lot. Average reading scores for these two groups was 507 and 474 points, respectively.
Figure 3.7 presents the proportions of Australian students in each of these resource shortage categories, along with their average reading scores.
Reading Resource Shortages scale
Students (%) Average reading score
0
20
40
60
80
100
380
400
420
440
460
480
500
520
540
560
580
Stu
den
ts (%
)
Ave
rag
e re
adin
g s
core
Not affected Affected Affected a lot
64 35 2
552
530
FIGURE 3.7 The Reading Resource Shortages scale and Australian student achievement in reading
In Australia, most students (64%) attended schools that were not affected by resource shortages, and these students scored an average of 552 points. Thirty-five per cent of students attended schools that were somewhat affected by resource shortages, and these students scored a significantly lower 530 points. Just 2 per cent of Australian Year 4 students attended schools where instruction was deemed to be affected a lot by resource shortages. There were too few of these students to accurately calculate a mean reading score.
Average school socioeconomic background was also related to the level of resourcing available to students, as shown in Figure 3.8. While very few students attended schools in which the principal reported that instruction was affected a lot by resource shortages, the proportion of students who were somewhat affected was far greater in more disadvantaged schools than in more affluent schools (56% compared to 23%). The instruction of 74 per cent of students attending more affluent schools was not affected at all by resource shortages, compared to 42 per cent of students in more disadvantaged schools.

3C
hap
ter
Findings for schools and the learning environment in Australia 51
More af�uent schools
Not affected Somewhat affected Affected a lot
More disadvantaged schools
42%
56%
2%
74%
23%
3%
FIGURE 3.8 The Reading Resource Shortages scale and school socioeconomic background
School climateAlong with the structural and physical environment of the school captured in the resourcing items, two other important aspects of the school context in which students find themselves is the emotional and academic environments. These are explored in the following sections from the perspectives of the students themselves, their teachers, and their principals.
Students’ sense of belonging Students were asked to comment on how they felt about being at school. Students indicated how much they agreed (‘agree a lot’, ‘agree a little’, ‘disagree a little’ or ‘disagree a lot’) with the following five statements:
� I like being in school.
� I feel safe when I am at school.
� I feel like I belong at this school.
� Teachers at my school are fair to me.
� I am proud to go to this school.
Responses to these items were combined to create the Students’ Sense of School Belonging scale, and scale scores were used to classify students according to three response groups. Students with a high sense of school belonging had a score on the scale of at least 9.7, which corresponds to their ‘agreeing a lot’ with three of the five statements and ‘agreeing a little’ with each of the other two statements, on average. Students with little sense of school belonging had a score no higher than 7.3, which corresponds to their ‘disagreeing a little’ with three of the five statements and ‘agreeing a little’ with each of the other two statements, on average. All other students had some sense of school belonging.
Internationally, on average, most students had a strong sense of belonging. More than half (59%) had a high sense of belonging, 33 per cent had some, and only 8 per cent of the Year 4 students had little sense of belonging. In general, a higher sense of belonging was related to higher academic achievement (518, 505 and 495 points, respectively).
Figure 3.9 presents the proportions of Australian Year 4 students in each of the three school belonging categories, along with their average reading performance.

3C
hapter
PIRLS 2016: Reporting Australia’s results52
Stu
den
ts (%
)
Ave
rag
e re
adin
g s
core
Little sense of school belonging
Some sense of school belonging
High sense of belonging
10 33 57
537554
0
20
40
60
80
100
380
430
480
530
580
517
Students’ Sense of Belonging scale
Students (%) Average reading score
FIGURE 3.9 The Students’ Sense of Belonging scale and Australian student achievement in reading
On average in Australia, more than half of the students (57%) had a high sense of school belonging, 33 per cent had some sense of belonging and only 10 per cent of the Year 4 students had little sense of belonging. These proportions were very similar to the international averages. In Australia, and internationally, a higher sense of school belonging was reflected in significantly higher than average reading achievement (554, 537 and 517 points respectively for Australian students).
There were some differences evident between more affluent and more disadvantaged schools in terms of students’ sense of belonging at their schools (see Figure 3.10). A significantly higher proportion of students at more affluent schools than at more disadvantaged schools reported a high sense of belonging, while a significantly higher proportion of students at more disadvantaged schools compared to students in more affluent schools had little sense of belonging.
More af�uent schools More disadvantaged schools
33%55%
12%
30%
61%
9%
Little sense of school belongingSome sense of school belongingHigh sense of school belonging
FIGURE 3.10 The Students’ Sense of Belonging scale by school socioeconomic background
School emphasis on academic success – principals’ reports One of the keys to the success of a school is its emphasis on academic success. Hattie (2008) suggests that expectations are essentially self-fulfilling prophesies, and that they are a powerful influence on learning. In PIRLS 2016, both principals and teachers were asked about the extent to which the school emphasises academic success.

3C
hap
ter
Findings for schools and the learning environment in Australia 53
The views of principals regarding the academic climate of their schools, that is, the degree to which a school supports and encourages academic success, were collected using principals’ ratings (of ‘very high’, ‘high’, ‘medium’, ‘low’ or ‘very low’) of the following 12 aspects:
� teachers’ understanding of the school’s curricular goals
� teachers’ degree of success in implementing the school’s curriculum
� teachers’ expectations for student achievement
� teachers’ ability to inspire students
� collaboration between school leadership and teachers to plan instruction
� parental involvement in school activities
� parental commitment to ensure that students are ready to learn
� parental expectations for student achievement
� parental support for student achievement
� students’ desire to do well in school
� students’ ability to reach school’s academic goals
� students’ respect for classmates who excel academically.
The principals’ responses were combined to create the School Emphasis on Academic Success scale. Students were then assigned to three groups based on their principal’s scale score. Students attending schools whose principals reported a very high emphasis on academic success had a score on the scale of at least 12.9, which corresponds to principals characterising six of the 12 aspects as ‘very high’ and the other six as ‘high’, on average. Students attending schools with a medium emphasis on academic success had a score no higher than 9.2, which corresponds to principals characterising six of the 12 aspects as ‘medium’ and the other six as ‘high’, on average. All other students attended schools with a high emphasis on academic success.
Internationally, around 8 per cent of Year 4 students attended schools where the principal reported a very high emphasis on academic success, 54 per cent were at schools with high emphasis, and 38 per cent of students were in schools with medium emphasis. Higher emphasis on academic success was related to higher achievement (531, 518 and 494 points, respectively).
Figure 3.11 presents the percentages and mean scores for Australian students. The findings were similar to the international results, with 14 per cent of Australian Year 4 students attending schools in which the principal rated the emphasis on academic success as very high, 49 per cent in schools with high emphasis, and 36 per cent with medium emphasis. While there was little difference between the average achievement of Australian students at high and very high academic emphasis schools, the average score for students at schools with only medium emphasis on academic success was substantially and significantly lower than for students in the other groups.
Stu
den
ts (%
)
Ave
rag
e re
adin
g s
core
Mediumemphasis
Highemphasis
Very high emphasis
36 49 14
519
556
0
20
40
60
80
100
380
400
420
440
460
480
500
520
540
560
580 567
School Emphasis on Academic Success scale (principals’ report)
Students (%) Average reading score
FIGURE 3.11 The School Emphasis on Academic Success scale (principals’ reports) and Australian student achievement in reading

3C
hapter
PIRLS 2016: Reporting Australia’s results54
Substantial differences between more affluent and more disadvantaged schools were evident on the School Emphasis on Academic Success scale (see Figure 3.12). Only 4 per cent of students attending more disadvantaged schools were in schools with a very high emphasis on academic success, compared to 26 per cent of students in more affluent schools. Conversely, just 15 per cent of students in more affluent schools and 70 per cent of students in more disadvantaged schools attended schools that had only a medium emphasis on academic success.
More af�uent schools
Very high High Medium
More disadvantaged schools
26%
70%
4%
59%
15%26%
FIGURE 3.12 The School Emphasis on Academic Success scale (principals’ reports) and school socioeconomic background
School emphasis on academic success – teachers’ reportsThe views of teachers regarding the academic climate of their schools, that is, the degree to which a school supports and encourages academic success, were collected using teachers’ ratings (of ‘very high’, ‘high’, ‘medium’, ‘low’ or ‘very low’) of the following 12 aspects:
� teachers’ understanding of the school’s curricular goals
� teachers’ degree of success in implementing the school’s curriculum
� teachers’ expectations for student achievement
� teachers’ ability to inspire students
� collaboration between school leadership and teachers to plan instruction
� parental involvement in school activities
� parental commitment to ensure that students are ready to learn
� parental expectations for student achievement
� parental support for student achievement
� students’ desire to do well in school
� students’ ability to reach school’s academic goals
� students’ respect for classmates who excel academically.
The teachers’ responses were combined to create the School Emphasis on Academic Success (teachers’ reports). Students were then assigned to three groups based on their teacher’s scale score. At Year 4, students attending schools whose teachers reported a very high emphasis on academic success had a score on the scale of at least 12.8, which corresponds to teachers characterising six of the 12 aspects as ‘very high’ and the other six as ‘high’, on average. Students attending schools with a medium emphasis on academic success had a score no higher than 9.2, which corresponds to teachers characterising six of the 12 aspects as ‘medium’ and the other six as ‘high’, on average. All other students attended schools with a high emphasis on academic success.
Fifteen per cent of Australian Year 4 students were taught by teachers that reported a very high emphasis on academic success; 59 per cent were taught by teachers that reported a high emphasis;

3C
hap
ter
Findings for schools and the learning environment in Australia 55
and 27 per cent were taught by teachers that reported a medium emphasis on academic success (see Figure 3.13). In comparison, internationally, on average, 8 per cent of students were taught by teachers that reported a very high emphasis on academic success; 55 per cent were taught by teachers that reported a high emphasis; and 37 per cent were taught by teachers that reported a medium emphasis on academic success.
As can be seen in Figure 3.13, there is a clear relationship between the achievement of Australian students and teachers’ reports of school emphasis on academic success, with a higher school emphasis on academic success generally associated with higher achievement. The difference between the average achievement of Australian students who were taught by teachers reporting a very high emphasis on academic success and the average achievement of students who were taught by teachers reporting a high emphasis on academic success was a significant and substantial 38 points, while the difference between students who were taught by teachers reporting a high emphasis on academic success and those being taught by teachers reporting a medium emphasis was also significant at 23 points.
Stu
den
ts (%
)
Ave
rag
e re
adin
g s
core
Mediumemphasis
Highemphasis
Very highemphasis
27 59 15
546
584
0
20
40
60
80
100
380
430
480
530
580
523
School Emphasis on Academic Success scale (teachers’ report)
Students (%) Average reading score
FIGURE 3.13 The School Emphasis on Academic Success scale (teachers’ reports) and Australian student achievement in reading
The responses of teachers at more affluent and those at more disadvantaged schools follow a similar pattern to that of the principals’ responses (see Figure 3.14). The teachers of 27 per cent of students at more affluent schools reported a very high emphasis on academic success compared to just 3 per cent of those who attended more disadvantaged schools. Conversely, teachers of more than 50 per cent of the students at more disadvantaged schools reported a medium emphasis on academic success compared to 13 per cent of those students at more affluent schools.
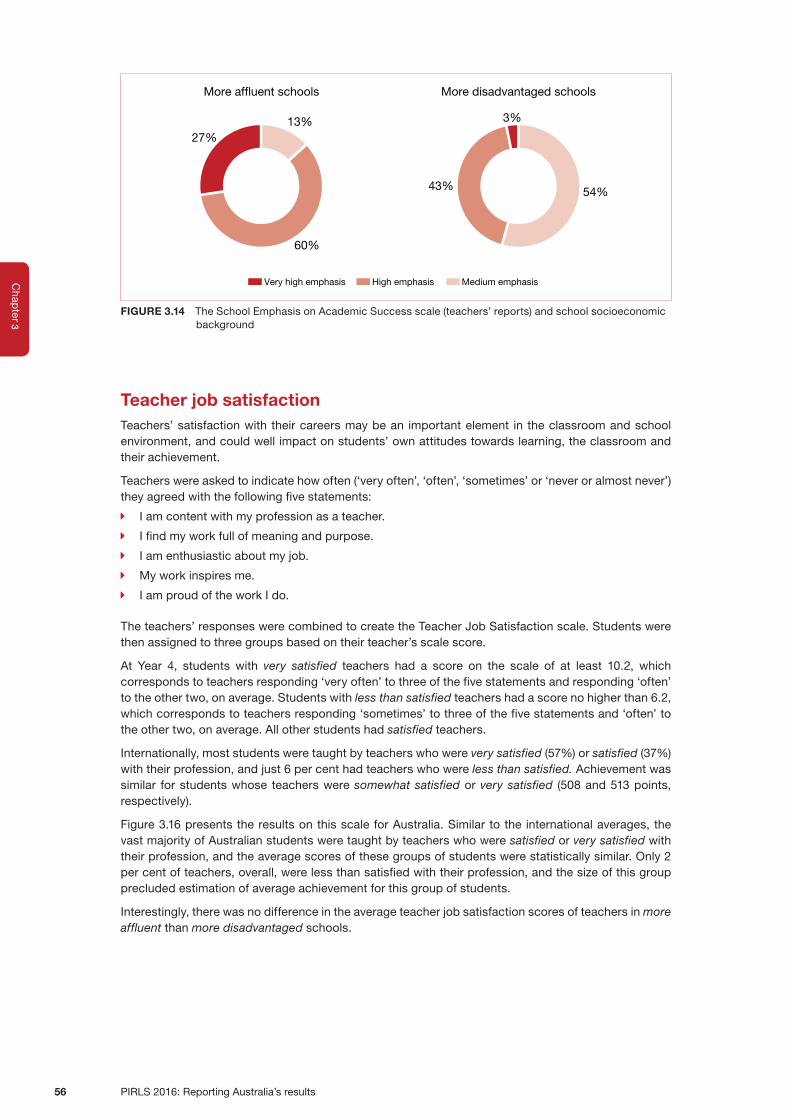
3C
hapter
PIRLS 2016: Reporting Australia’s results56
More af�uent schools
Medium emphasisHigh emphasisVery high emphasis
More disadvantaged schools
54%43%
3%
60%
27%13%
FIGURE 3.14 The School Emphasis on Academic Success scale (teachers’ reports) and school socioeconomic background
Teacher job satisfaction Teachers’ satisfaction with their careers may be an important element in the classroom and school environment, and could well impact on students’ own attitudes towards learning, the classroom and their achievement.
Teachers were asked to indicate how often (‘very often’, ‘often’, ‘sometimes’ or ‘never or almost never’) they agreed with the following five statements:
� I am content with my profession as a teacher.
� I find my work full of meaning and purpose.
� I am enthusiastic about my job.
� My work inspires me.
� I am proud of the work I do.
The teachers’ responses were combined to create the Teacher Job Satisfaction scale. Students were then assigned to three groups based on their teacher’s scale score.
At Year 4, students with very satisfied teachers had a score on the scale of at least 10.2, which corresponds to teachers responding ‘very often’ to three of the five statements and responding ‘often’ to the other two, on average. Students with less than satisfied teachers had a score no higher than 6.2, which corresponds to teachers responding ‘sometimes’ to three of the five statements and ‘often’ to the other two, on average. All other students had satisfied teachers.
Internationally, most students were taught by teachers who were very satisfied (57%) or satisfied (37%) with their profession, and just 6 per cent had teachers who were less than satisfied. Achievement was similar for students whose teachers were somewhat satisfied or very satisfied (508 and 513 points, respectively).
Figure 3.16 presents the results on this scale for Australia. Similar to the international averages, the vast majority of Australian students were taught by teachers who were satisfied or very satisfied with their profession, and the average scores of these groups of students were statistically similar. Only 2 per cent of teachers, overall, were less than satisfied with their profession, and the size of this group precluded estimation of average achievement for this group of students.
Interestingly, there was no difference in the average teacher job satisfaction scores of teachers in more affluent than more disadvantaged schools.

3C
hap
ter
Findings for schools and the learning environment in Australia 57
Stu
den
ts (%
)
Ave
rag
e re
adin
g s
core
Less than satis�ed
Satis�ed Verysatis�ed
545 546
0
20
40
60
80
100
380
430
480
530
580
2 39 58
Teacher Job Satisfaction scale
Students (%) Average reading score
FIGURE 3.15 The Teacher Job Satisfaction scale and Australian student achievement in reading
Safety and discipline A critical part of the school climate is the extent to which discipline problems in the school impede learning. A general lack of discipline, especially if teachers or students are concerned about their safety, is associated with lower levels of academic achievement.
Principals’ reports of school discipline problems
Principals were asked to indicate the degree to which (‘not a problem’, ‘minor problem’, ‘moderate problem’, or ‘serious problem’) each of the following behaviours and issues was problematic among Year 4 students in their school:
� arriving late at school
� absenteeism (i.e. unjustified absences)
� classroom disturbance
� cheating
� swearing
� vandalism
� theft
� intimidation or verbal abuse among students (including texting, emailing etc.)
� physical fights among students
� intimidation or verbal abuse of teachers or staff (including texting, emailing, etc).
The principals’ responses were combined to create the School Discipline Problems scale. Students were then assigned to three groups based on their principal’s scale score.
At Year 4, students in schools with hardly any problems had a score on the scale of at least 9.9, which corresponds to principals reporting ‘not a problem’ for five of the 10 issues and ‘minor problem’ for the other five, on average. Students in schools with moderate to severe problems had a score no higher than 7.7, which corresponds to principals reporting ‘moderate problem’ for five of the 10 issues and ‘minor problem’ for the other five, on average. All other students attended schools with minor problems.
On average internationally, 62 per cent of students attended schools whose principals reported that there were hardly any problems with school discipline, another 30 per cent attended schools in which

3C
hapter
PIRLS 2016: Reporting Australia’s results58
there were minor problems, and 8 per cent attended schools in which there were moderate to severe problems. Average reading achievement was higher for students in schools with hardly any problems than for those in schools with minor problems (518 points compared to 503 points), however, it was substantially lower – by 48 points – for students in schools with moderate to severe problems.
Figure 3.17 presents these data for Australian schools. The same pattern emerges as for the international data, however, fewer Australian students attend schools with substantial problems in these areas. More than 65 per cent of Australian students attended schools in which there were hardly any problems, while just 4 per cent attended schools with moderate to severe problems. The score differences between the groups were substantial – 31 points difference between the average reading scores of students attending schools with hardly any problems and those with minor problems, and then 50 points difference between those students in schools with minor problems and those with moderate to severe problems.
67 29 4
556
525
475
Stu
den
ts (%
)
Ave
rag
e re
adin
g s
core
Hardly any problems
Minorproblems
Moderate to severe problems
0
20
40
60
80
100
380
430
480
530
580
School Discipline Problems scale
Students (%) Average reading score
FIGURE 3.16 The School Discipline Problems scale and Australian student achievement in reading
The differences between more affluent and more disadvantaged schools on this scale were quite stark. As shown in Figure 3.18, 82 per cent of Australian Year 4 students in more affluent schools are in environments in which there are hardly any problems with school discipline, compared with 44 per cent of students attending more disadvantaged schools. At the other end of the spectrum, no principal of a more affluent school reported that their school suffered from moderate to severe problems; however, 11 per cent of students attending more disadvantaged schools had principals who rated their school as having moderate to severe problems with discipline.
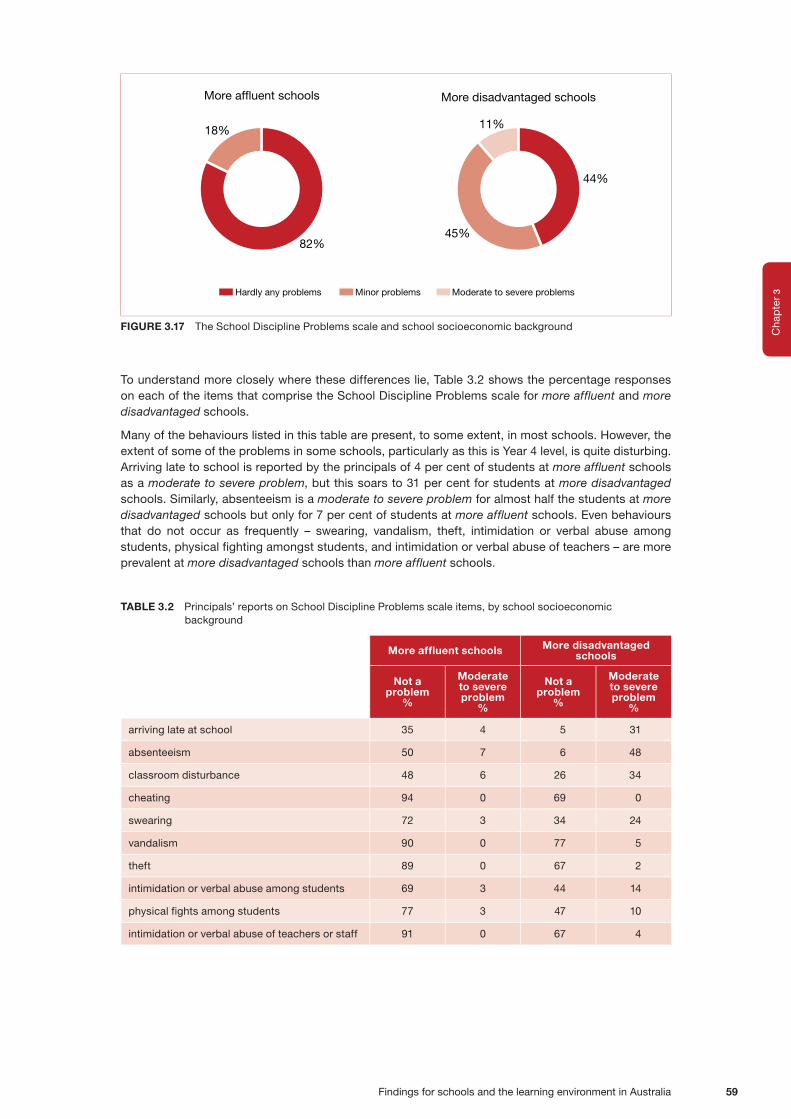
3C
hap
ter
Findings for schools and the learning environment in Australia 59
More af�uent schools
Hardly any problems Minor problems Moderate to severe problems
More disadvantaged schools
44%
45%
11%
18%
82%
FIGURE 3.17 The School Discipline Problems scale and school socioeconomic background
To understand more closely where these differences lie, Table 3.2 shows the percentage responses on each of the items that comprise the School Discipline Problems scale for more affluent and more disadvantaged schools.
Many of the behaviours listed in this table are present, to some extent, in most schools. However, the extent of some of the problems in some schools, particularly as this is Year 4 level, is quite disturbing. Arriving late to school is reported by the principals of 4 per cent of students at more affluent schools as a moderate to severe problem, but this soars to 31 per cent for students at more disadvantaged schools. Similarly, absenteeism is a moderate to severe problem for almost half the students at more disadvantaged schools but only for 7 per cent of students at more affluent schools. Even behaviours that do not occur as frequently – swearing, vandalism, theft, intimidation or verbal abuse among students, physical fighting amongst students, and intimidation or verbal abuse of teachers – are more prevalent at more disadvantaged schools than more affluent schools.
TABLE 3.2 Principals’ reports on School Discipline Problems scale items, by school socioeconomic background
More affluent schools More disadvantaged schools
Not a problem
%
Moderate to severe problem
%
Not a problem
%
Moderate to severe problem
%
arriving late at school 35 4 5 31
absenteeism 50 7 6 48
classroom disturbance 48 6 26 34
cheating 94 0 69 0
swearing 72 3 34 24
vandalism 90 0 77 5
theft 89 0 67 2
intimidation or verbal abuse among students 69 3 44 14
physical fights among students 77 3 47 10
intimidation or verbal abuse of teachers or staff 91 0 67 4

3C
hapter
PIRLS 2016: Reporting Australia’s results60
Teachers’ reports of safe and orderly schools
Teachers’ perceptions of school safety were also considered and investigated as part of the PIRLS contexts framework. Teachers were asked to indicate the extent to which they agreed (‘agree a lot’, ‘agree a little’, disagree a little’ or ‘disagree a lot’ with the following eight statements:
� This school is located in a safe neighbourhood.
� I feel safe at this school.
� This school’s security policies and practices are sufficient.
� The students behave in an orderly manner.
� The students are respectful of the teachers.
� The students respect school property.
� This school has clear rules about student conduct.
� This school’s rules are enforced in a fair and consistent manner.
Responses to these items were combined to form the Safe and Orderly School scale and scale scores were used to create three categories of responses. Students assigned to the very safe and orderly category had a scale score of at least 9.9, which corresponded to their teachers ‘agreeing a lot’ with four of the eight qualities of a safe and orderly school and ‘agreeing a little’ with the other four items, on average. The less than safe and orderly category (associated with a scale score no higher than 6.6) was formed for students whose teachers, on average, ‘disagreed a little’ with four of the eight qualities and ‘agreed a little’ with the other four, on average. All other students were assigned to the safe and orderly category.
Internationally, most (62%) Year 4 students attended schools judged by their teachers as very safe and orderly. Almost all the rest (35%) were in schools that teachers thought were safe and orderly. Only 3 per cent, on average, were attending schools felt to be less than safe and orderly. There was a direct positive relationship found between scores on the safe and orderly schools scale and average reading achievement (517, 502 and 466 points for very safe, safe and less than safe and orderly schools, respectively).
More than three-quarters (78%) of Australian Year 4 students attended schools that were judged by their teachers as very safe and orderly (Figure 3.18). A further 20 per cent attended schools their teachers judged as safe and orderly, with only 2 per cent of students in schools that were deemed less than safe and orderly. Student achievement was not estimated for the small group of students whose teachers reported that the school was less than safe and orderly, but a positive relationship was found between scores on the Safe and Orderly Schools scale and average reading achievement for Australian Year 4 students in very safe and orderly and safe and orderly schools (551 and 526 points, respectively).
Very safeand orderly
Safe andorderly
Less than safe and orderly
0
20
40
60
80
100
380
430
480
530
580
78 20 2
551
526
Stu
den
ts (%
)
Ave
rag
e re
adin
g s
core
Safe and Orderly School scale
Students (%) Average reading score
FIGURE 3.18 The Safe and Orderly School scale and Australian student achievement in reading
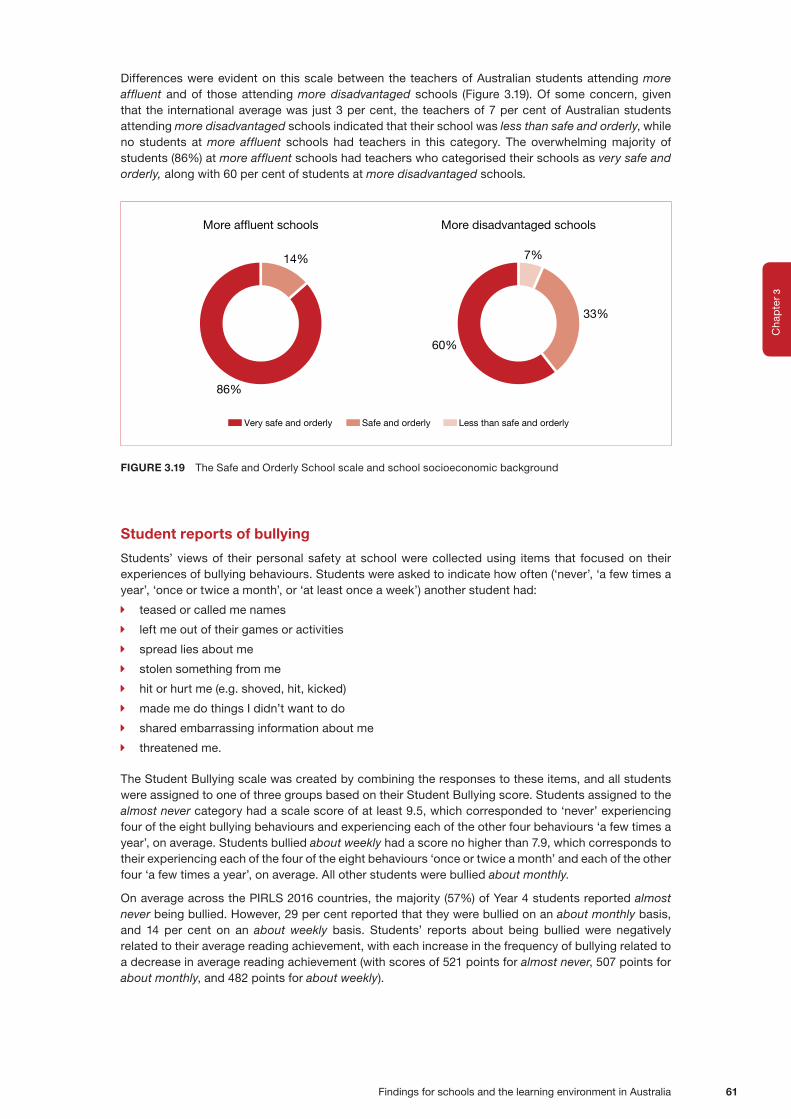
3C
hap
ter
Findings for schools and the learning environment in Australia 61
Differences were evident on this scale between the teachers of Australian students attending more affluent and of those attending more disadvantaged schools (Figure 3.19). Of some concern, given that the international average was just 3 per cent, the teachers of 7 per cent of Australian students attending more disadvantaged schools indicated that their school was less than safe and orderly, while no students at more affluent schools had teachers in this category. The overwhelming majority of students (86%) at more affluent schools had teachers who categorised their schools as very safe and orderly, along with 60 per cent of students at more disadvantaged schools.
More af�uent schools More disadvantaged schools
33%
60%
7%14%
86%
Less than safe and orderlySafe and orderlyVery safe and orderly
FIGURE 3.19 The Safe and Orderly School scale and school socioeconomic background
Student reports of bullying
Students’ views of their personal safety at school were collected using items that focused on their experiences of bullying behaviours. Students were asked to indicate how often (‘never’, ‘a few times a year’, ‘once or twice a month’, or ‘at least once a week’) another student had:
� teased or called me names
� left me out of their games or activities
� spread lies about me
� stolen something from me
� hit or hurt me (e.g. shoved, hit, kicked)
� made me do things I didn’t want to do
� shared embarrassing information about me
� threatened me.
The Student Bullying scale was created by combining the responses to these items, and all students were assigned to one of three groups based on their Student Bullying score. Students assigned to the almost never category had a scale score of at least 9.5, which corresponded to ‘never’ experiencing four of the eight bullying behaviours and experiencing each of the other four behaviours ‘a few times a year’, on average. Students bullied about weekly had a score no higher than 7.9, which corresponds to their experiencing each of the four of the eight behaviours ‘once or twice a month’ and each of the other four ‘a few times a year’, on average. All other students were bullied about monthly.
On average across the PIRLS 2016 countries, the majority (57%) of Year 4 students reported almost never being bullied. However, 29 per cent reported that they were bullied on an about monthly basis, and 14 per cent on an about weekly basis. Students’ reports about being bullied were negatively related to their average reading achievement, with each increase in the frequency of bullying related to a decrease in average reading achievement (with scores of 521 points for almost never, 507 points for about monthly, and 482 points for about weekly).

3C
hapter
PIRLS 2016: Reporting Australia’s results62
The averages for Australian Year 4 students are shown in Figure 3.21. Fewer Australian students (46%) than on average internationally reported that they are almost never bullied. Around one-third (35%) reported being bullied about monthly and almost one in five (19%) were bullied about weekly. Reading achievement scores were negatively related to bullying, with students who are bullied about weekly scoring on average 38 points lower than those who are almost never bullied.
Almostnever
Aboutmonthly
Aboutweekly
0
20
40
60
80
100
380
430
480
530
580
46 35 19
557544
Stu
den
ts (%
)
Ave
rag
e re
adin
g s
core
Student Bullying scale
Students (%) Average reading score
519
FIGURE 3.20 The Student Bullying scale and Australian student achievement in reading
It is notable that while there are differences between more advantaged and more disadvantaged schools on this measure, they are not as large as might be expected, showing that bullying is a more widespread issue than many of the others examined in this chapter. Figure 3.22 shows that half of the students attending more affluent schools said that they were almost never bullied, compared to 43 per cent of students attending more disadvantaged schools. At the other end of the scale, 15 per cent of students attending more affluent schools felt that they were bullied about weekly, compared to 23 per cent of those attending more disadvantaged schools. These differences were statistically significant.
More af�uent schools More disadvantaged schools
43%
34%
23%15%
35%
50%
Almost never About monthly About weekly
FIGURE 3.21 The Student Bullying scale and school socioeconomic background

3C
hap
ter
Findings for schools and the learning environment in Australia 63
How does bullying manifest itself in Australian schools?
Table 3.3 provides the students’ responses to each of the bullying items in order to identify the behaviours most prevalent in Australian schools. It is evident that behaviours such as teasing, leaving other students out, or spreading lies are the most commonly reported forms of bullying for these Year 4 students. Physical violence, however, is not uncommon, being reported as occurring about weekly to more than 10 per cent of students, which is of concern.
TABLE 3.3 Percentage of Australian students’ responses to items on the Student Bullying scale
Almost never
About monthly
About weekly
teased or called me names 71 12 17
left me out of their games or activities 71 16 13
spread lies about me 76 13 11
stolen something from me 85 9 6
hit or hurt me 75 14 11
made me do things I didn’t want to do 80 11 9
shared embarrassing information about me 82 10 8
threatened me 85 8 7
3C
hapter
PIRLS 2016: Reporting Australia’s results64
Findings for teachers and the teaching of reading in Australia 65
4Chapter
Findings for teachers and the teaching of reading in Australia
Key findings
� The majority of Year 4 students (84%) were taught reading by a female teacher.
� Nearly 50 per cent of students were taught reading by a teacher aged in their forties or fifties.
� Over 80 per cent of Year 4 students were being taught by a teacher with a bachelor’s degree or equivalent, with a further 12 per cent of students being taught by a teacher with a postgraduate degree.
� The relationship between the amount of time teachers reported spending in professional development and Australian student performance on the PIRLS assessments ran counter to what may have been expected – students whose teachers had spent 16 or more hours in professional development scored lower (544 points) on average than students whose teachers had spent less than six hours on professional development (556 points).
� A far greater proportion of Australian Year 4 students, compared to the international average, had computers available for use during reading lessons.
� There was a clear relationship between the reading achievement of Australian students and teachers’ reports that their teaching was limited by student needs, with fewer limitations associated with higher reading achievement.
� There was a clear relationship between the reading achievement of Australian students and the frequency of student absences, with fewer absences associated with higher reading achievement.
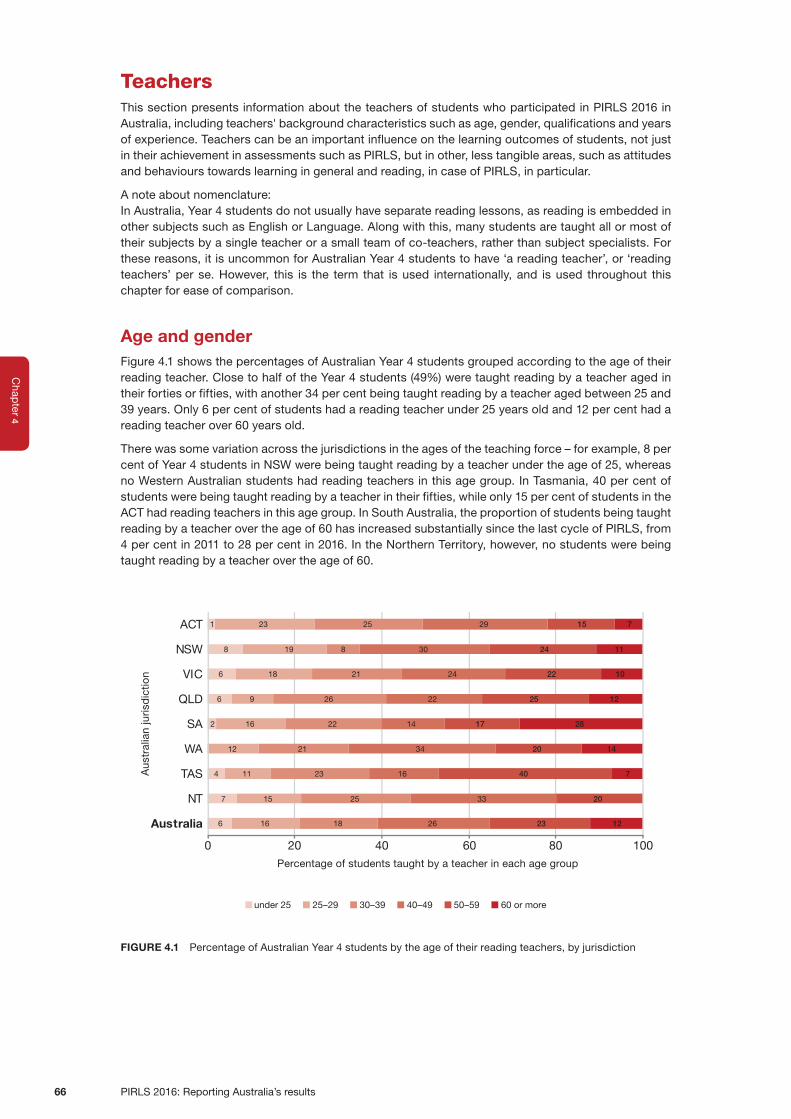
4C
hapter
PIRLS 2016: Reporting Australia’s results66
TeachersThis section presents information about the teachers of students who participated in PIRLS 2016 in Australia, including teachers' background characteristics such as age, gender, qualifications and years of experience. Teachers can be an important influence on the learning outcomes of students, not just in their achievement in assessments such as PIRLS, but in other, less tangible areas, such as attitudes and behaviours towards learning in general and reading, in case of PIRLS, in particular.
A note about nomenclature:In Australia, Year 4 students do not usually have separate reading lessons, as reading is embedded in other subjects such as English or Language. Along with this, many students are taught all or most of their subjects by a single teacher or a small team of co-teachers, rather than subject specialists. For these reasons, it is uncommon for Australian Year 4 students to have ‘a reading teacher’, or ‘reading teachers’ per se. However, this is the term that is used internationally, and is used throughout this chapter for ease of comparison.
Age and genderFigure 4.1 shows the percentages of Australian Year 4 students grouped according to the age of their reading teacher. Close to half of the Year 4 students (49%) were taught reading by a teacher aged in their forties or fifties, with another 34 per cent being taught reading by a teacher aged between 25 and 39 years. Only 6 per cent of students had a reading teacher under 25 years old and 12 per cent had a reading teacher over 60 years old.
There was some variation across the jurisdictions in the ages of the teaching force – for example, 8 per cent of Year 4 students in NSW were being taught reading by a teacher under the age of 25, whereas no Western Australian students had reading teachers in this age group. In Tasmania, 40 per cent of students were being taught reading by a teacher in their fifties, while only 15 per cent of students in the ACT had reading teachers in this age group. In South Australia, the proportion of students being taught reading by a teacher over the age of 60 has increased substantially since the last cycle of PIRLS, from 4 per cent in 2011 to 28 per cent in 2016. In the Northern Territory, however, no students were being taught reading by a teacher over the age of 60.
6
7
4
2
6
6
8
1
16
15
11
12
16
9
18
19
23
18
25
23
21
22
26
21
8
25
26
33
16
34
14
22
24
30
29
23
20
40
20
17
25
22
24
15
12
7
14
28
12
10
11
7
0 20 40 60 80 100
Percentage of students taught by a teacher in each age group
Aus
tral
ian
juris
dic
tion
under 25 25–29 30–39 40–49 50–59 60 or more
Australia
NT
TAS
WA
SA
QLD
VIC
NSW
ACT
FIGURE 4.1 Percentage of Australian Year 4 students by the age of their reading teachers, by jurisdiction

4C
hap
ter
Findings for teachers and the teaching of reading in Australia 67
Figure 4.2 shows the percentages of Year 4 students taught reading by female or male teachers. Unsurprisingly, 84 per cent were taught reading by a female teacher, which is similar to the percentage in the previous cycle of PIRLS.
There was some variation across the jurisdictions, however, with the proportion of students being taught reading by a male teacher somewhat larger in Western Australia, South Australia and Tasmania than in other jurisdictions.
8090 84 85
77 72 75
9484
2010 16 15
23 28 25
616
0
10
20
30
40
50
60
70
80
90
100
ACT NSW VIC QLD SA WA TAS NT Australia
Stu
den
ts (%
)
Australian jurisdiction
Students taught reading by a female teacher Students taught reading by a male teacher
FIGURE 4.2 Percentage of Australian Year 4 students by the sex of their reading teachers, by jurisdiction
QualificationsThe general qualifications of the Year 4 reading teachers in Australia are presented in Table 4.1, along with the averages across countries participating in PIRLS 2016.
Over 80 per cent of Year 4 students were being taught by a teacher with a bachelor’s degree or equivalent, with a further 12 per cent of students being taught by a teacher with a postgraduate degree. The proportion of Australian students who had a reading teacher with postgraduate qualifications, such as a master’s degree or a doctorate, was less than half that of the average proportion across countries participating in PIRLS – 12 per cent compared to 26 per cent.
TABLE 4.1 Qualifications held by Year 4 reading teachers, Australia and the international average
Completed a master's degree, PhD or Doctorate
Completed bachelor’s degree
or equivalent*
Completed post-secondary
education (TAFE or college diploma)
No further than upper secondary
education
Students (%) SE (%) Students
(%) SE (%) Students (%) SE (%) Students
(%) SE (%)
Australia 12 2.3 82 2.8 7 2.0 0 0.0
International average
26 0.3 60 0.4 11 0.3 3 0.1
Note: Due to rounding, totals may not add to 100% * This category includes teachers who completed a graduate diploma of education after completing an undergraduate degree.

4C
hapter
PIRLS 2016: Reporting Australia’s results68
Emphasis on language and reading areas in teachers’ formal educationTable 4.2 presents the percentages of students whose teachers had various areas of specialisation in their formal education. The proportions of students being taught reading by teachers who reported an emphasis on pedagogy, teaching reading, or reading theory were similar in Australia and across countries participating in PIRLS, on average. More Australian students had teachers who had focused on language during their studies, compared to the international average – around eight in every ten Australian students compared to seven in ten internationally.
TABLE 4.2 Emphasis on language and reading areas in teachers’ formal education, Australia and the international average
Area emphasised : Language
Students (%) SE (%)
Average achievement
Area emphasised Area not emphasised
Mean SE Mean SE
Australia 81 2.8 547 3.1 539 6.7
International average
70 0.4 512 0.5 510 1.1
Area emphasised: Pedagogy/Teaching reading
Students (%) SE (%)
Average achievement
Area emphasised Area not emphasised
Mean SE Mean SE
Australia 68 3.2 544 3.1 547 4.8
International average
64 0.5 512 0.6 509 0.9
Area emphasised: Reading theory
Students (%) SE (%)
Average achievement
Area emphasised Area not emphasised
Mean SE Mean SE
Australia 38 3.1 548 4.0 544 3.5
International average
32 0.5 511 0.8 511 0.6
In terms of Australian students’ performance in the PIRLS reading assessment, the results do not show a relationship between emphasis on these specialisations and students’ average reading achievement, as there were no significant differences between the average scores of students whose teachers had focused on the different areas in their training and those students whose teacheers had not focused on these areas in their training.

4C
hap
ter
Findings for teachers and the teaching of reading in Australia 69
Years of experienceThe years of teaching experience teachers have is, for the most part, related to their age. Given the average age of Year 4 teachers in Australia, we might expect to find that the Year 4 teaching force has quite a deal of experience. The level of experience for teachers of Year 4 reading is presented in Table 4.3.
TABLE 4.3 Year 4 reading teachers’ years of experience, Australia and the international average
Percentage of students by reading teachers’ years of experienceAverage years of experience as a teacher
20 years or more
At least 10 but less than
20 years
At least 5 but less than
10 years
Less than 5 years
Students (%) SE (%) Students
(%) SE (%) Students (%) SE (%) Students
(%) SE (%) Students (%) SE (%)
Australia 40 3.3 23 2.9 15 2.7 22 2.8 17 0.8
International average
42 0.5 30 0.5 15 0.4 13 0.3 17 0.1
At Year 4, 40 per cent of Australian students were taught reading by a teacher who had 20 years or more of experience, 23 per cent were taught by a reading teacher who had at least 10 but less than 20 years’ experience, 15 per cent were taught reading by a teacher who had at least five but less than 10 years’ experience and 22 per cent of students were taught reading by a teacher who had less than five years’ experience. On average, Australian reading teachers had 17 years of experience, which is the same as the international average.
Within Australia there were no significant differences in average reading achievement according to the years of experience of reading teachers. However, internationally, there appears to be small but statistically significant difference in favour of more experienced teachers.
Professional developmentMany education systems, including Australia’s, require registered teachers to participate in ongoing professional development – supplementary to their initial qualifications – to ensure that students receive up-to-date instruction methods and information.
Figure 4.3 shows that close to 30 per cent of Year 4 students in Australia were taught by teachers who had spent some time in the past two years in professional development focused on reading (27%), while a further 49 per cent had teachers who spent a substantial period of time (16 or more hours) in such professional development.
Interestingly, the relationship between the amount of time teachers reported spending in professional development and student performance on the PIRLS assessments ran counter to what may have been expected for Australian students. Students whose teachers had spent 16 or more hours in professional development scored lower on average than students whose teachers had spent less than six hours on professional development, 544 points compared to 556 points.
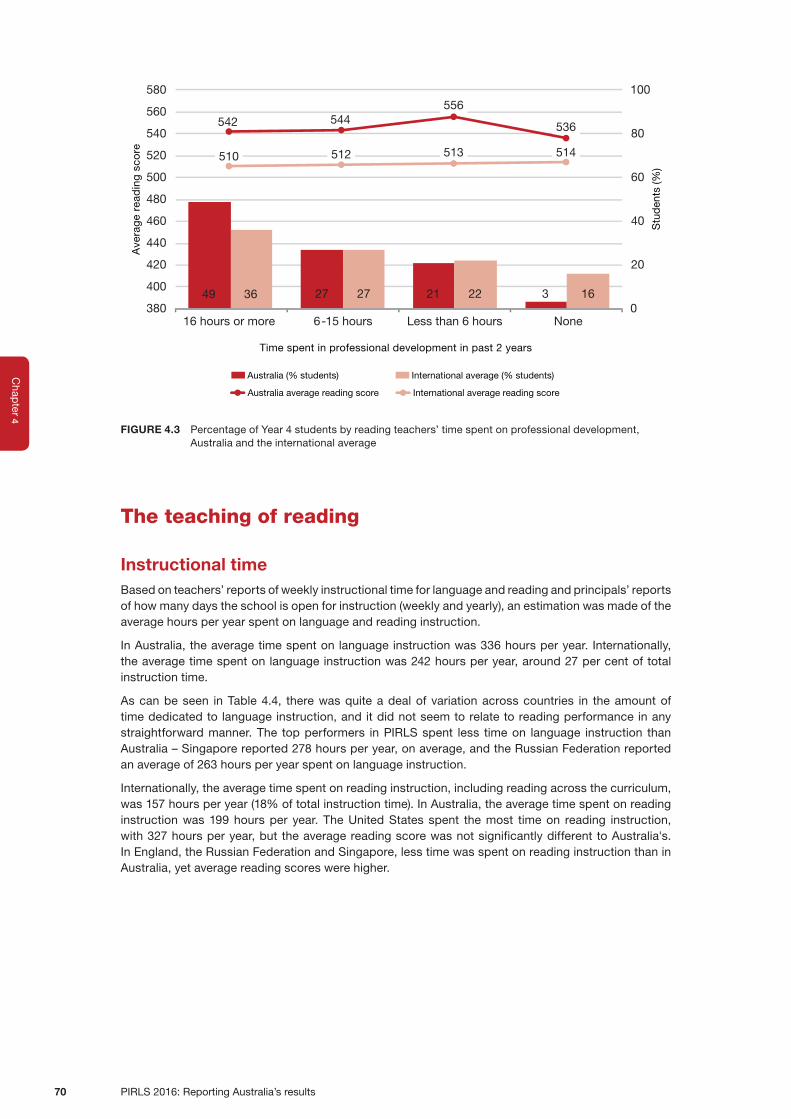
4C
hapter
PIRLS 2016: Reporting Australia’s results70
49 27 21 336 27 22 16
542 544556
536
510 512 513 514
0
20
40
60
80
100
380
400
420
440
460
480
500
520
540
560
580
16 hours or more 6-15 hours Less than 6 hours None
Stu
den
ts (%
)
Ave
rag
e re
adin
g s
core
Time spent in professional development in past 2 years
Australia (% students) International average (% students)
International average reading scoreAustralia average reading score
FIGURE 4.3 Percentage of Year 4 students by reading teachers’ time spent on professional development, Australia and the international average
The teaching of reading
Instructional time Based on teachers’ reports of weekly instructional time for language and reading and principals’ reports of how many days the school is open for instruction (weekly and yearly), an estimation was made of the average hours per year spent on language and reading instruction.
In Australia, the average time spent on language instruction was 336 hours per year. Internationally, the average time spent on language instruction was 242 hours per year, around 27 per cent of total instruction time.
As can be seen in Table 4.4, there was quite a deal of variation across countries in the amount of time dedicated to language instruction, and it did not seem to relate to reading performance in any straightforward manner. The top performers in PIRLS spent less time on language instruction than Australia – Singapore reported 278 hours per year, on average, and the Russian Federation reported an average of 263 hours per year spent on language instruction.
Internationally, the average time spent on reading instruction, including reading across the curriculum, was 157 hours per year (18% of total instruction time). In Australia, the average time spent on reading instruction was 199 hours per year. The United States spent the most time on reading instruction, with 327 hours per year, but the average reading score was not significantly different to Australia's. In England, the Russian Federation and Singapore, less time was spent on reading instruction than in Australia, yet average reading scores were higher.

4C
hap
ter
Findings for teachers and the teaching of reading in Australia 71
TABLE 4.4 Instruction time spent on language and reading, Australia and comparison countries
Country
Total instruction
hours per year
(all subjects)
Language instruction (including reading, writing,
speaking, literature and other language skills)
Reading instruction (including reading
across the curriculum)Average
PIRLS 2016 reading scoreHours
per year
% of total instruction
time
Hours per year
% of total instruction
time
Australian 1 001 336 34 199 19 544
Canadan 952 292 31 206 22 541
Englandn 993 273 28 125 12 559
New Zealandn 926 340 37 215 24 523
United Statesn 1 061 301 30 327 32 549
Russian Federation 652 263 41 171 27 581
Singapore 1 040 278 27 124 12 575
n Data are available for at least 70% but less than 85% of the students
Organisation of students for reading instructionTable 4.5 presents information about how often teachers’ use different types of grouping for reading instruction. The most commonly reported grouping method in Australia was same-ability grouping, with 34 per cent of Australian students 'always or almost always' taught this way and another 62 per cent taught this way 'often or sometimes'.
TABLE 4.5 Organisation of students for reading instruction, Australia and the international average
Teaching reading as a whole-class activity Create same-ability groups
Always or almost
always
Often or sometimes Never
Always or almost
always
Often or sometimes Never
Students (%)
SE (%)Students
(%)SE (%)
Students (%)
SE (%)Students
(%)SE (%)
Students (%)
SE (%)Students
(%)SE (%)
Australia 14 2.5 83 2.9 3 1.2 34 3.3 62 3.2 3 1.2
International average 32 0.4 65 0.5 3 0.2 11 0.3 74 0.4 15 0.2
Create mixed-ability groups Have students work independently on an assigned plan or goal
Always or almost
always
Often or sometimes Never
Always or almost
always
Often or sometimes Never
Students (%)
SE (%)Students
(%)SE (%)
Students (%)
SE (%)Students
(%)SE (%)
Students (%)
SE (%)Students
(%)SE (%)
Australia 7 1.9 87 2.5 6 1.5 13 2.4 84 2.6 2 0.9
International average 13 0.3 79 0.4 8 0.3 14 0.4 81 0.4 5 0.2

4C
hapter
PIRLS 2016: Reporting Australia’s results72
Assignment of literary texts for reading instructionAs presented in Chapter 2, most countries demonstrated a relative strength in one of the purposes for reading (literary or informational), often accompanied by a relative weakness in the other purpose. Teachers were asked how frequently they asked students to read various types of literary and informational texts.
Internationally, short stories were by far the most popular type of literary texts, assigned at least weekly for 78 per cent of students, on average (see Table 4.6). Longer fiction books with chapters were assigned to 41 per cent of the students on a weekly basis, and a few students were assigned plays (9%). In Australia, literary purpose was a relative strength, on average, and this was reflected in the types of literary texts that were most utilised (on a weekly basis) by teachers – short stories and longer fiction books with chapters – with 85 per cent and 80 per cent of students assigned these types of texts, respectively, and a further 7 per cent of students assigned plays on a weekly basis.
For Australian Year 4 students, in the process of moving from learning to read to reading to learn, there appeared to be benefit associated with the regular assignment (at least weekly) of longer fiction books with chapters. Students who were assigned such texts weekly scored a statistically significant 20 points higher, on average, than students whose teachers assigned longer books for reading less often than once a week. While this difference may not be as large as those associated with other factors, it is certainly a factor that is within the control of reading teachers.
TABLE 4.6 Types of literary texts assigned for reading instruction, Australia and the international average
Short stories
Once a week or more Less than once a week
Students (%) SE (%) Average achievement SE Students (%) SE (%) Average
achievement SE
Australia 85 2.4 544 2.9 15 2.4 553 6.7
International average 78 0.4 512 0.5 22 0.4 508 1.2
Longer fiction books with chapters
Once a week or more Less than once a week
Students (%) SE (%) Average achievement SE Students (%) SE (%) Average
achievement SE
Australia 80 2.4 549 2.8 20 2.4 529 6.5
International average 41 0.4 516 0.9 59 0.4 508 0.6
Plays
Once a week or more Less than once a week
Students (%) SE (%) Average achievement SE Students (%) SESE (%) Average
achievement SE
Australia 7 1.8 549 7.7 93 1.8 545 2.7
International average 9 0.3 501 2.0 91 0.3 512 0.4
Assignment of informational texts for reading instructionTable 4.7 shows that, internationally, nonfiction subject area books were the most commonly assigned informational texts, assigned at least weekly for 71 per cent of students. Less than half of the students were assigned nonfiction articles (39%) or longer nonfiction books with chapters (24%) at least weekly.
In Australia, 83 per cent of students were assigned nonfiction subject area books weekly, 50 per cent of students were assigned longer nonfiction books with chapters weekly, and 67 per cent were assigned
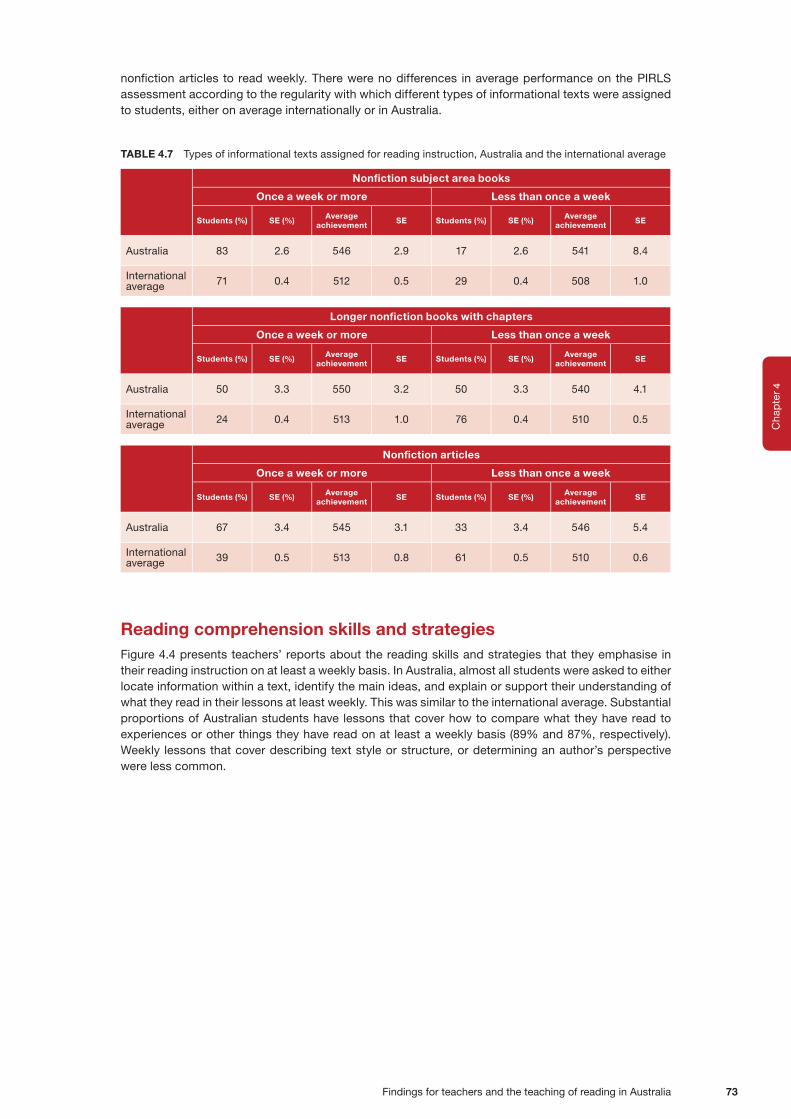
4C
hap
ter
Findings for teachers and the teaching of reading in Australia 73
nonfiction articles to read weekly. There were no differences in average performance on the PIRLS assessment according to the regularity with which different types of informational texts were assigned to students, either on average internationally or in Australia.
TABLE 4.7 Types of informational texts assigned for reading instruction, Australia and the international average
Nonfiction subject area books
Once a week or more Less than once a week
Students (%) SE (%) Average achievement SE Students (%) SE (%) Average
achievement SE
Australia 83 2.6 546 2.9 17 2.6 541 8.4
International average 71 0.4 512 0.5 29 0.4 508 1.0
Longer nonfiction books with chapters
Once a week or more Less than once a week
Students (%) SE (%) Average achievement SE Students (%) SE (%) Average
achievement SE
Australia 50 3.3 550 3.2 50 3.3 540 4.1
International average 24 0.4 513 1.0 76 0.4 510 0.5
Nonfiction articles
Once a week or more Less than once a week
Students (%) SE (%) Average achievement SE Students (%) SE (%) Average
achievement SE
Australia 67 3.4 545 3.1 33 3.4 546 5.4
International average 39 0.5 513 0.8 61 0.5 510 0.6
Reading comprehension skills and strategiesFigure 4.4 presents teachers’ reports about the reading skills and strategies that they emphasise in their reading instruction on at least a weekly basis. In Australia, almost all students were asked to either locate information within a text, identify the main ideas, and explain or support their understanding of what they read in their lessons at least weekly. This was similar to the international average. Substantial proportions of Australian students have lessons that cover how to compare what they have read to experiences or other things they have read on at least a weekly basis (89% and 87%, respectively). Weekly lessons that cover describing text style or structure, or determining an author’s perspective were less common.

4C
hapter
PIRLS 2016: Reporting Australia’s results74
98
96
98
89
87
94
93
83
83
96
94
95
83
75
77
82
69
66
40 60 80 100
Locate informationwithin a text
Identify the main ideasof what they have read
Explain or support their understandingof what they have read
Compare what they have read with experiences they have had
Compare what they have read with other things they have read
Make predictions about what will happen next in the text
Make generalisations and draw inferences
Describe the style or structure of the text
Determine the author's perspective or intention
Students (%)
Australia International average
FIGURE 4.4 Reading skills and strategies emphasised by teachers on at least a weekly basis, Australia and the international average
Access to school and classroom librariesAccording to their principals, 32 per cent of students, on average across participating countries, were in schools where the library had more than 5 000 book titles and only 13 per cent were in schools with no book titles. The average reading score in schools with the largest libraries was 525 points, compared to 494–501 points for schools with a smaller or no central library. In Australia, 57 per cent of students were in schools where the library had more than 5 000 book titles and only 1 per cent were in schools with no book titles.1
In Australia, 88 per cent of Year 4 students were in classrooms with a library, with 56 per of students in classrooms with libraries that had 50 books or more. Internationally, on average, 72 per cent of Year 4 students were in classrooms with libraries, with 33 per cent in classrooms with libraries that had 50 books or more.
Across the PIRLS countries, 61 per cent of students, on average, were given class time to use their library and 55 per cent of students had access to classroom libraries with borrowing facilities. In Australia, 87 per cent of students, on average, were given class time to use their library and 54 per cent of students had access to classroom libraries with borrowing facilities.
Access to computers and computer activities in reading lessonsA far greater proportion of Australian Year 4 students, compared to the international average, had computers available for use during reading lessons (according to their teachers). There were no significant differences in the reading performance of students who did have access to computers
1 It should be noted however, that some countries have well-resourced classroom libraries, rather than a larger central library, and vice versa.
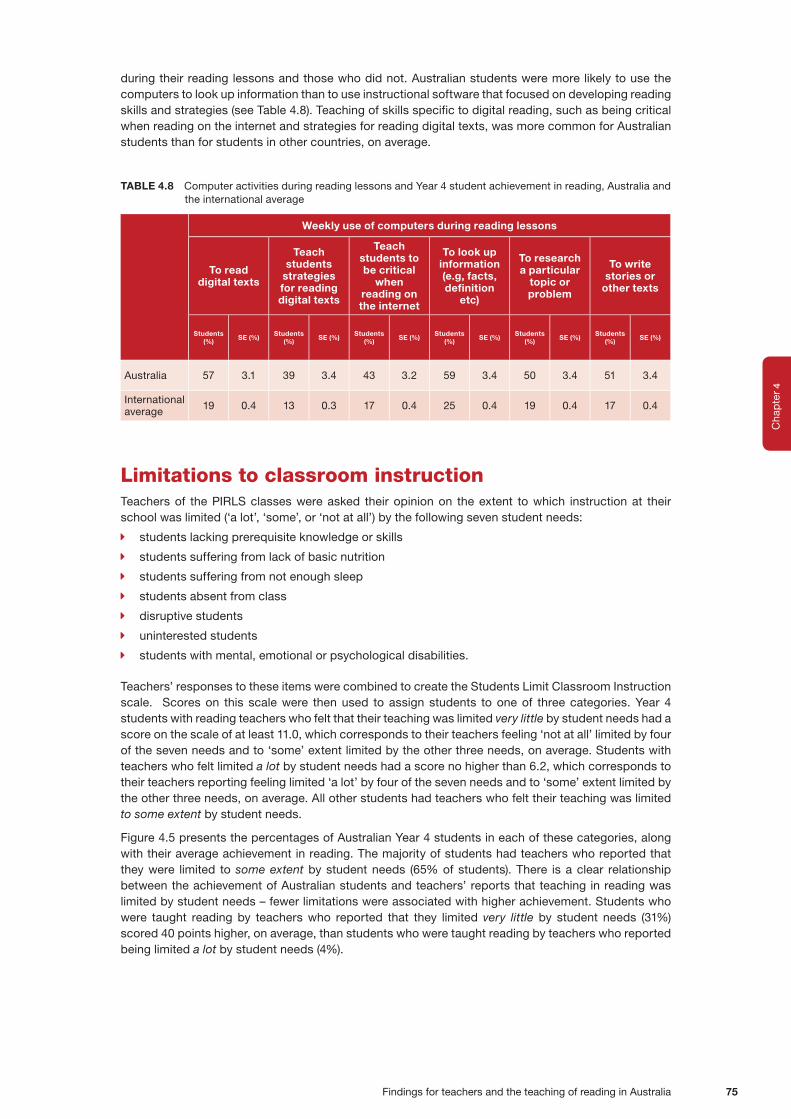
4C
hap
ter
Findings for teachers and the teaching of reading in Australia 75
during their reading lessons and those who did not. Australian students were more likely to use the computers to look up information than to use instructional software that focused on developing reading skills and strategies (see Table 4.8). Teaching of skills specific to digital reading, such as being critical when reading on the internet and strategies for reading digital texts, was more common for Australian students than for students in other countries, on average.
TABLE 4.8 Computer activities during reading lessons and Year 4 student achievement in reading, Australia and the international average
Weekly use of computers during reading lessons
To read digital texts
Teach students
strategies for reading digital texts
Teach students to be critical
when reading on the internet
To look up information (e.g, facts, definition
etc)
To research a particular
topic or problem
To write stories or
other texts
Students (%)
SE (%)Students
(%)SE (%)
Students (%)
SE (%)Students
(%)SE (%)
Students (%)
SE (%)Students
(%)SE (%)
Australia 57 3.1 39 3.4 43 3.2 59 3.4 50 3.4 51 3.4
International average 19 0.4 13 0.3 17 0.4 25 0.4 19 0.4 17 0.4
Limitations to classroom instruction Teachers of the PIRLS classes were asked their opinion on the extent to which instruction at their school was limited (‘a lot’, ‘some’, or ‘not at all’) by the following seven student needs:
� students lacking prerequisite knowledge or skills
� students suffering from lack of basic nutrition
� students suffering from not enough sleep
� students absent from class
� disruptive students
� uninterested students
� students with mental, emotional or psychological disabilities.
Teachers’ responses to these items were combined to create the Students Limit Classroom Instruction scale. Scores on this scale were then used to assign students to one of three categories. Year 4 students with reading teachers who felt that their teaching was limited very little by student needs had a score on the scale of at least 11.0, which corresponds to their teachers feeling ‘not at all’ limited by four of the seven needs and to ‘some’ extent limited by the other three needs, on average. Students with teachers who felt limited a lot by student needs had a score no higher than 6.2, which corresponds to their teachers reporting feeling limited ‘a lot’ by four of the seven needs and to ‘some’ extent limited by the other three needs, on average. All other students had teachers who felt their teaching was limited to some extent by student needs.
Figure 4.5 presents the percentages of Australian Year 4 students in each of these categories, along with their average achievement in reading. The majority of students had teachers who reported that they were limited to some extent by student needs (65% of students). There is a clear relationship between the achievement of Australian students and teachers’ reports that teaching in reading was limited by student needs – fewer limitations were associated with higher achievement. Students who were taught reading by teachers who reported that they limited very little by student needs (31%) scored 40 points higher, on average, than students who were taught reading by teachers who reported being limited a lot by student needs (4%).
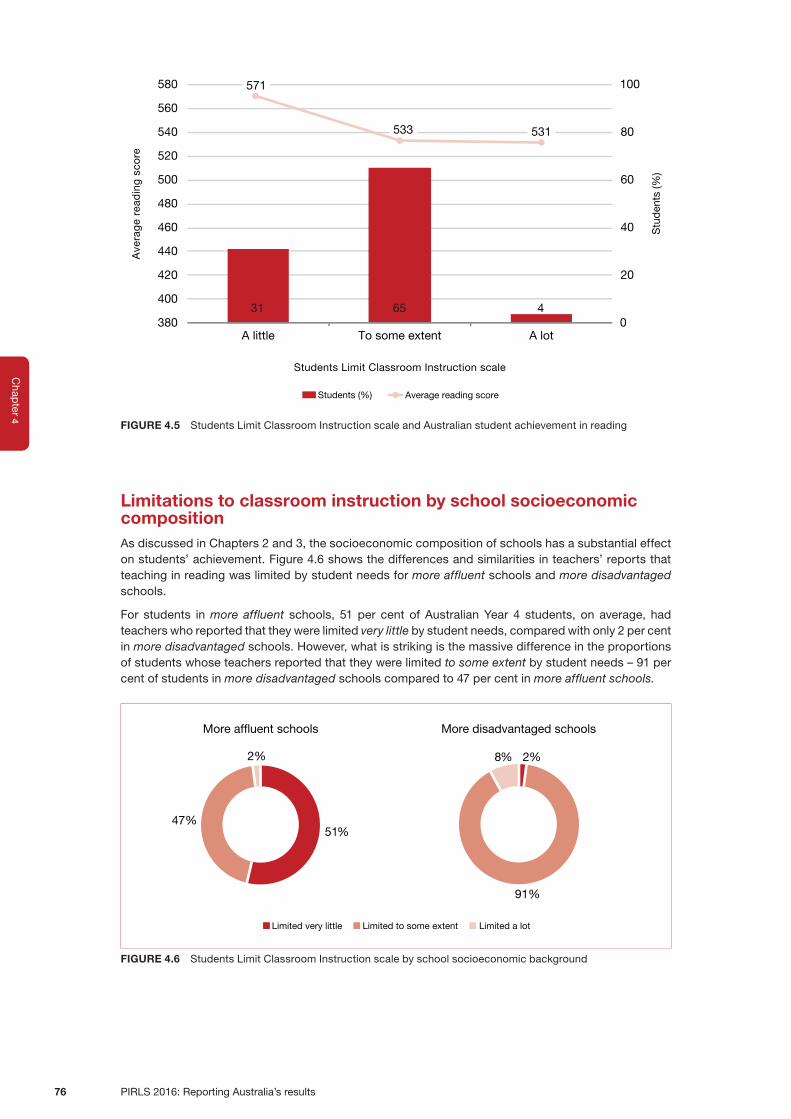
4C
hapter
PIRLS 2016: Reporting Australia’s results76
31 65 4
571
533 531
0
20
40
60
80
100
380
400
420
440
460
480
500
520
540
560
580
A little To some extent A lot
Stu
den
ts (%
)
Ave
rag
e re
adin
g s
core
Students Limit Classroom Instruction scale
Students (%) Average reading score
FIGURE 4.5 Students Limit Classroom Instruction scale and Australian student achievement in reading
Limitations to classroom instruction by school socioeconomic compositionAs discussed in Chapters 2 and 3, the socioeconomic composition of schools has a substantial effect on students’ achievement. Figure 4.6 shows the differences and similarities in teachers’ reports that teaching in reading was limited by student needs for more affluent schools and more disadvantaged schools.
For students in more affluent schools, 51 per cent of Australian Year 4 students, on average, had teachers who reported that they were limited very little by student needs, compared with only 2 per cent in more disadvantaged schools. However, what is striking is the massive difference in the proportions of students whose teachers reported that they were limited to some extent by student needs – 91 per cent of students in more disadvantaged schools compared to 47 per cent in more affluent schools.
51%47%
2%
More af�uent schools
Limited very little Limited to some extent Limited a lot
2%
91%
8%
More disadvantaged schools
FIGURE 4.6 Students Limit Classroom Instruction scale by school socioeconomic background

4C
hap
ter
Findings for teachers and the teaching of reading in Australia 77
Figure 4.7 presents achievement scores in PIRLS for students in each of the three categories of the Students Limit Classroom Instruction scale for more affluent schools and for more disadvantaged schools. The data presented in Figure 4.7 show that students in more disadvantaged schools had lower reading achievement, on average, across the Students Limit Classroom Instruction categories compared to students from more affluent schools. For example, in more disadvantaged schools, students who were taught reading by teachers who were limited to some extent by student needs scored 49 points lower than those students in more affluent schools whose teachers also were limited to some extent, a substantial and statistically significant difference.
582
541
558
509
545
516
460
480
500
520
540
560
580
600
Very little To some extent A lot
Ave
rag
e re
adin
g s
core
Students Limited Classroom Instruction scale
More disadvantaged schoolsMore af�uent schools
FIGURE 4.7 Students Limit Classroom Instruction scale and Australian student achievement in reading by school socioeconomic background
Students' reports of behaviours that could limit instruction The next sections take three of the student behaviours that could limit instruction previously presented to reading teachers – absenteeism, and arriving at school overtired or hungry – and present students’ own reports of the frequency with which these behaviours occur.
Student absenteeism
Students were asked how often they were absent from school (‘never or almost never’, ‘once a month’, ‘once every two weeks’ or ‘once a week or more’).
Figure 4.8 presents the percentages of Australian students according to how often they were absent from school, along with their average achievement in reading.

4C
hapter
PIRLS 2016: Reporting Australia’s results78
65 226 6
551 553
529
467
0
20
40
60
80
100
380
400
420
440
460
480
500
520
540
560
580
Never oralmost never
Once a month Once everytwo weeks
Once a weekor more
Stu
den
ts (%
)
Ave
rag
e re
adin
g s
core
Frequency of student absences
Students (%) Average reading score
FIGURE 4.8 Frequency of student absences and Australian student achievement in reading
Figure 4.8 shows that 65 per cent of Australian Year 4 students were never or almost never absent from school, and 6 per cent were absent once a week or more. In comparison, internationally, 68 per cent of Year 4 students were never or almost never absent from school, and 10 per cent were absent once a week or more.
As can be seen in Figure 4.8, there was a clear relationship between the achievement of Australian students and the frequency of student absences, with fewer absences being associated with higher average achievement. Australian students who were never or almost never absent scored 84 score points higher, on average, than those who were absent once a week or more. Internationally, on average, the difference between these two groups of students was around 62 score points.
Socioeconomic composition of the school and student absenteeism
Figure 4.9 shows the differences and similarities in the frequency of student absences for more affluent schools and more disadvantaged schools. Frequent absenteeism (at least once a week) was more commonly reported by students in more disadvantaged school than by students in more affluent schools – 11 per cent compared to 3 per cent of students.
Once a week Once every two weeks Once a month Never or almost never
67%
25%
5%3%
More af�uent schools More disadvantaged schools
65%
17%
7%
11%
FIGURE 4.9 Frequency of student absences, by school socioeconomic background

4C
hap
ter
Findings for teachers and the teaching of reading in Australia 79
Figure 4.10 presents achievement scores in PIRLS and the frequency for student absences for more affluent schools and for more disadvantaged schools. As previously reported, students in more disadvantaged schools had lower reading achievement, on average, than students in more affluent schools, regardless of how often the students were absent. Even among students who were frequently absent (at least once a week), those in more affluent schools scored higher than those in more disadvantaged schools, although the gap was not as great as among students who were absent less frequently.
380
430
480
530
580
Never oralmost never
Once a month Once everytwo weeks
Once a weekor more
515
574 574
533545
504
479
449
Ave
rag
e re
adin
g s
core
Frequency of student absences
More af�uent schools More disadvantaged schools
FIGURE 4.10 Frequency of student absences and Australian student achievement in reading, by school socioeconomic background
Students arrive at school feeling tired or hungry
Figure 4.11 presents students’ reports about arriving at school feeling tired or hungry. Over half of Australian Year 4 students reported being tired at school sometimes and a further 31 per cent reported arriving at school tired every day or almost every day. This was similar to the international average, but still of concern. Despite being tired, the average reading score of students who sometimes arrived at school tired was significantly higher than that of students who arrived at school tired every day or almost every day. Interestingly, those students who never arrived tired also scored lower on average than students who sometimes arrived at school tired.

4C
hapter
PIRLS 2016: Reporting Australia’s results80
563550
522
0
20
40
60
80
100
380
400
420
440
460
480
500
520
540
560
580
Never Sometimes Every dayor almostevery day
Never Sometimes Every dayor almostevery day
Students feel hungry
539553
534
Students feel tired
28 45 27 13 56 31
Stu
den
ts (%
)
Ave
rag
e re
adin
g s
core
Students (%) Average reading score
FIGURE 4.11 Students arrive at school feeling tired or hungry and Australian student achievement in reading
Unfortunately, 27 per cent of Australian students reported that they arrive at school hungry every day or almost every day. This was similar to the proportion recorded across countries, on average, but is a concerning trend given the relationship between nutrition, concentration and learning. In Australia, there was a relationship between the frequency of arriving at school hungry and average reading achievement, with students who reported arriving at school hungry every day or almost every day scoring 41 points lower, on average, than students who never arrived at school hungry.
Socioeconomic composition of the school and students arriving tired and hungry
Figure 4.12, shows that the proportions of students that arrived at school hungry for more affluent schools and more disadvantaged schools were quite similar.
48%
24% 28%
43%
29% 28%
More af�uent schools
Never Sometimes Every day or almost every day
More disadvantaged schools
FIGURE 4.12 Students arrive at school feeling hungry, by school socioeconomic background

4C
hap
ter
Findings for teachers and the teaching of reading in Australia 81
Similarly, Figure 4.13 also shows that the proportions of students that arrived at school tired did not vary greatly between more affluent schools and more disadvantaged schools.
60%
30%
10%
50%
33%
17%
More af�uent schools More disadvantaged schools
Never Sometimes Every day or almost every day
FIGURE 4.13 Students arrive at school feeling tired, by school socioeconomic background

PIRLS 2016: Reporting Australia’s results82

Student attitudes and engagement 83
5Chapter
Student attitudes and engagement
Key findings
� Students who reported enjoying reading very much scored significantly higher, on average, in reading than students who somewhat like reading, who in turn scored higher, on average, than students who do not like reading.
� Higher levels of student confidence in reading were also associated with higher scores on the PIRLS reading assessment.
� Students who were less than engaged during their reading lessons, according to their own report, scored significantly lower, on average, than other students.
� Among Indigenous students, there were no significant differences in the average reading scores of students who very much like reading and those who somewhat like reading. Students in both of these groups, however, scored higher in reading than students who do not like reading.
� There were no differences in the average reading scores of Indigenous students who were less than engaged, somewhat engaged or very engaged during their reading lessons.
� For students with a few books in the home, according to their own estimation, there were no significant differences in reading achievement associated with enjoyment of reading.
� The proportion of students with a few books in the home who were classified as not confident readers was more than twice the proportion of students with either an average number of books or many books at home who were not confident in their reading abilities.
5C
hapter
PIRLS 2016: Reporting Australia’s results84
This chapter presents information about students’ attitudes towards reading – the level of enjoyment they feel towards reading and their level of confidence with reading – and their levels of engagement in their reading lessons.
Students’ attitudes towards readingConsiderable research over many years has shown that positive attitudes and achievement are related, and that the influence runs in both directions: attitudes influence achievement and achievement reinforces (or perhaps alters) attitudes. The importance of establishing strong positive attitudes towards learning, and particularly towards reading, which underlie so much of students’ learning, is undeniable. It has also proven to be an interesting, if complicated, point for intervention. PIRLS recognises the important role of student attitudes in reading achievement by collecting responses to two attitude scales – the Students Like Reading scale (a measure of participation and enjoyment of reading), and the Students’ Confidence in Reading (a measure of their self-rated ability in reading). The average scores of Australian students on these scales are presented alongside student achievement in reading and a measure of the strength of relationship between these attitudes and achievement.
Students like reading The Students Like Reading scale summarises students’ responses to eight questions about how often they participate in and how much they enjoy reading. Students were asked to indicate their level of agreement (‘agree a lot’, ‘agree a little’, ‘disagree a little’ or ‘disagree a lot’) with each of the following eight statements:
� I like talking about what I read with other people.
� I would be happy if someone gave me a book as a present.
� I think reading is boring (reverse scored).
� I would like to have more time for reading.
� I enjoy reading.
� I learn a lot from reading.
� I like to read things that make me think.
� I like it when a book helps me imagine other words.
Students were also asked how often (‘every day or almost every day’, ‘once or twice a week’, ‘once or twice a month’ or ‘never or almost never’) they did the following activities outside of school time:
� I read for fun.
� I read to find out about things I want to learn.
Responses to these two sets of questions were combined to create the Students Like Reading scale. Students who very much like reading had a score of at least 10.3. This is the point on the scale corresponding to ‘agreeing a lot’ with four of the eight statements and ‘agreeing a little’ with the other four, as well as reporting that they read for fun and read things they choose themselves ‘every day or almost every day’, on average. Students who do not like reading had scores no higher than 8.3. This is the scale point corresponding to ‘disagreeing a little’ with four of the eight statements and ‘agreeing a little’ with the other four, as well as reporting that they read for fun and read things they choose themselves only ‘once or twice a month’, on average. All other students were assigned to the somewhat like reading category.
Figure 5.1 shows that 43 per cent of Australian students were in the very much like reading group, 41 per cent in the somewhat like reading group and 16 per cent in the do not like reading group (see Figure 5.1). The same distribution was found across all participating countries, on average. Those students who very much like reading scored significantly higher in reading, on average, than did those who somewhat like reading, who in turn scored higher on average than students who do not like reading. Despite this, the relationship between liking reading and achievement was not very strong, with a correlation of only 0.12, indicating that there are students who enjoy reading but did not perform well on the PIRLS reading assessment, and that there are students who performed very well but do not appear to enjoy reading.

5C
hap
ter
Student attitudes and engagement 85
16 41 4316 41 43
517
543
558
486
507
523
0
20
40
60
80
100
380
420
460
500
540
580
Do not like reading Somewhat like reading Very much like reading
Stu
den
ts (%
)
Ave
rag
e re
adin
g s
core
Students Like Reading scale
Australia (% students) International average (% students)
International average reading scoreAustralia average reading score
FIGURE 5.1 The Students Like Reading scale and Year 4 student achievement in reading, Australia and the international average
Figure 5.2 shows that the same pattern, of stronger reading performance by students who reported that they liked reading very much compared to their peers who like reading less, was found among
male and female students.
21 44 35
512
12 38 51
527
552564
534548
0
20
40
60
80
100
380
420
460
500
540
580
Do not like reading Somewhat like reading Very much like reading
Stu
den
ts (%
)
Ave
rag
e re
adin
g s
core
Students Like Reading scale
Males (% students) Females average (% students)
Females average reading scoreMales average reading score
FIGURE 5.2 The Students Like Reading scale and Year 4 student achievement in reading, by sex

5C
hapter
PIRLS 2016: Reporting Australia’s results86
Interestingly, the positive relationship between students’ reported level of enjoyment of reading and their performance on the PIRLS tasks was not as clear for Indigenous students as it was their non-Indigenous peers. As shown in Figure 5.3, the relationship among non-Indigenous students appeared to be linear, with average performance improving in line with levels of enjoyment of reading, such that students who liked reading very much scored higher than students who liked reading somewhat, who in turn scored higher than those students who do not like reading. Among Indigenous students, however, there was no significant difference in the average reading scores of students who very much like reading and those who somewhat like reading, although students who somewhat like reading did score significantly higher than students who did not like reading.
16 41 4319 39 42
522
547
564
459
492 487
0
20
40
60
80
100
380
420
460
500
540
580
Do not like reading Somewhat like reading Very much like reading
Stu
den
ts (%
)
Ave
rag
e re
adin
g s
core
Students Like Reading scale
Non-Indigenous (% students) Indigenous average (% students)
Indigenous average reading scoreNon-Indigenous average reading score
FIGURE 5.3 The Students Like Reading scale and Year 4 student achievement in reading, by Indigenous background
As Figure 5.4 shows, there were few students with many books at home who reported that they do not like reading (9%), the majority of these students reported that they liked reading very much. Among students with many books or an average number of books, there again appeared to be a linear relationship between how much they reported enjoying reading and their performance on the PIRLS assessment. Students who very much like reading scored higher, on average, than those who somewhat like reading, and those who liked reading somewhat scored higher, in turn, than students who do not like reading. However, among students with few reading resources at home, there were no significant differences in performance associated with enjoyment of reading. For this group of students, enjoyment of reading conferred no advantage in terms of performance. Without access to reading materials, a positive attitude alone is not sufficient for these students to develop their reading abilities.

5C
hap
ter
Student attitudes and engagement 87
494
566568
495
533 554
25 41 3415 43 429 34 57
503525
592
0
20
40
60
80
100
380
420
460
500
540
580
620
Do not like reading Somewhat like reading Very much like reading
Stu
den
ts (%
)
Ave
rag
e re
adin
g s
core
Students Like Reading scale
A few books (% students) Average no. of books (% students)
Average no. of booksaverage reading score
A few books averagereading score
Many books (% students)
Many books averagereading score
FIGURE 5.4 The Students Like Reading scale and Year 4 student achievement in reading, by number of books in the home
Student confidence with reading Students were asked to indicate their level of agreement (‘agree a lot’, ‘agree a little’, ‘disagree a little’ or ‘disagree a lot’) with each of the following six statements:
� I usually do well in reading.
� Reading is easy for me.
� I have trouble reading stories with difficult words (reverse scored).
� Reading is harder for me than for many of my classmates (reverse scored).
� Reading is harder for me than any other subject (reverse scored).
� I am just not good at reading (reverse scored).
Responses to these items were combined to create the Student Confidence in Reading scale. Students who were categorised as very confident in reading had a score of at least 10.3 on this scale, which is the point that corresponded to ‘agreeing a lot’ with the first three of the six statements and ‘agreeing a little’ with the other three, on average. Students who were not confident in reading had scores no higher than 8.2, which is the scale point corresponding to ‘disagreeing a little’ with the first three of the six statements and ‘agreeing a little’ with the other three, on average. All other students were categorised as somewhat confident in reading.
The average scale score for Australian students was 10.0, placing them in the somewhat confident in reading group. Just under 50 per cent of the students were in the very confident in reading group, with a further 34 per cent in the somewhat confident in reading group. Sixteen per cent were categorised as not confident in reading, which was similar to the proportion who do not like reading, although it is interesting to note that these two groups did not overlap perfectly. That is, there were students who were not confident in reading, but enjoyed it (somewhat or very much) while there were also students who did not enjoy reading but were at least somewhat confident in their reading abilities.
The overlap of these groups of students is presented in Figure 5.5. The majority of students who were very confident in reading liked reading very much (54%), while the proportions of students who were somewhat or not confident readers but enjoyed reading to the same extent were smaller – 35 per cent and 23 per cent, respectively. Thirty-four per cent of students who were not confident readers indicated that they did not like reading.

5C
hapter
PIRLS 2016: Reporting Australia’s results88
Students verycon�dent in reading
Students somewhatcon�dent in reading
Students notcon�dent in reading
Very much like reading Somewhat like reading Do not like reading
54%36%
10%
35%
47%
18% 23%
43%
34%
FIGURE 5.5 The Student Confidence in Reading scale, by the Students Like Reading Scale, Australian Students
As may be expected, students who were very confident in reading scored higher, on average, in the PIRLS reading assessment than did students who were somewhat confident in reading. Students who were not confident in reading scored significantly lower, on average, than other students (see Figure 5.6).
Analysis revealed a moderate linear relationship between the Student Confidence in Reading scale score and reading achievement of Australian students, with a correlation of 0.55.
503
545
16 34 4921 35 45
465
526
585
455
0
20
40
60
80
100
380
420
460
500
540
580
620
Not con�dentin reading
Somewhat con�dentin reading
Very con�dentin reading
Stu
den
ts (%
)
Ave
rag
e re
adin
g s
core
Student Con�dence in Reading scale
Australia (% students) International average (% students)
International average reading scoreAustralia average reading score
FIGURE 5.6 The Student Confidence in Reading scale and Year 4 student achievement in reading, Australia and the international average

5C
hap
ter
Student attitudes and engagement 89
The same linear pattern, with more confident students scoring higher, on average, than less confident students was found among male and female students. As Figure 5.7 shows, in each group of students, females scored higher on average than their male peers, with the difference in scores being greatest among students who were not confident in reading (26 points).
534
14 35 5219 34 47
480
590
454
519
579
380
420
460
500
540
580
Not con�dentin reading
Somewhat con�dentin reading
Very con�dentin reading
0
20
40
60
80
100620
Stu
den
ts (%
)
Ave
rag
e re
adin
g s
core
Student Con�dence in Reading scale
Males (% students) Females average (% students)
Females average reading scoreMales average reading score
FIGURE 5.7 The Student Confidence in Reading scale and Year 4 student achievement in reading, by sex
Figure 5.8 shows that just over half of the non-Indigenous students (51%) were categorised as very confident readers, compared to 28 per cent of their Indigenous peers. The relationship between confidence in reading and student performance was similar for Indigenous and non-Indigenous students, with more confident readers outperforming students who were less confident, on average.

5C
hapter
PIRLS 2016: Reporting Australia’s results90
15 33 5127 45 28
472
531
587
420
488
539
380
420
460
500
540
580
Not con�dentin reading
Somewhat con�dentin reading
Very con�dentin reading
Non-Indigenous (% students) Indigenous average (% students)
Indigenous average reading scoreNon-Indigenous average reading score
0
20
40
60
80
100620
Stu
den
ts (%
)
Ave
rag
e re
adin
g s
core
Student Con�dence in Reading scale
FIGURE 5.8 The Student Confidence in Reading scale and Year 4 student achievement in reading, by Indigenous background
Greater levels of confidence in reading were associated with stronger performance in the PIRLS assessment regardless of the number of books students reported having at home. As shown in Figure 5.9, the highest reading scores, on average, were recorded among students who were very confident in reading and who had many books at home (604 points, well above the High benchmark cut-off of 550 points) and the lowest scores, on average, were among students who were not confident in reading with only a few books at home (446 points, above the Low benchmark of 400 points).
Figure 5.9 also shows that the proportion of students with a few books who were not confident in reading was more than twice the proportion of students with either an average number of books or many books who were not confident readers. Students with many books were more likely to be very confident readers than students who reported having fewer books at home. It would seem that exposure to more books at home – whether this is representative of higher socioeconomic status, greater value placed on reading, or even modelling of reading in families – is positively related to students’ confidence in their abilities as readers.
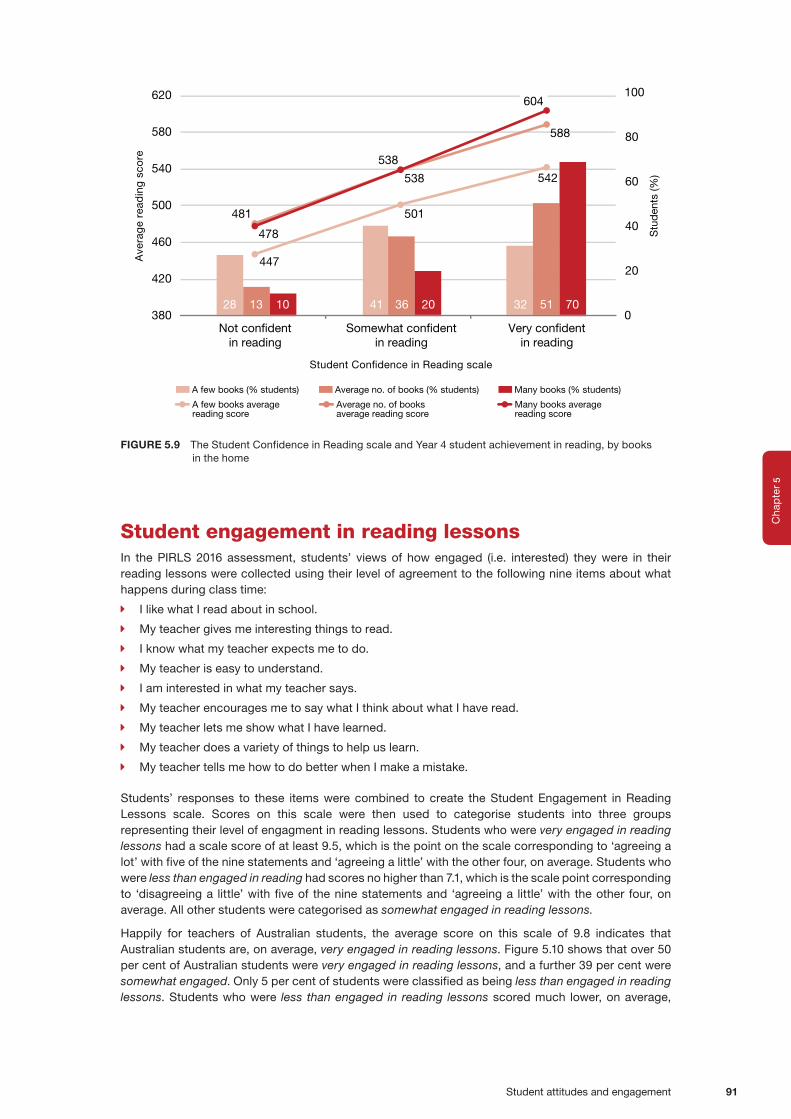
5C
hap
ter
Student attitudes and engagement 91
604
28 41 3213 36 5110 20 70
447
501
542
481
538
588
478
538
0
20
40
60
80
100
380
420
460
500
540
580
620
Not con�dentin reading
Somewhat con�dentin reading
Very con�dentin reading
Stu
den
ts (%
)
Ave
rag
e re
adin
g s
core
Student Con�dence in Reading scale
A few books (% students) Average no. of books (% students)
Average no. of booksaverage reading score
A few books averagereading score
Many books (% students)
Many books averagereading score
FIGURE 5.9 The Student Confidence in Reading scale and Year 4 student achievement in reading, by books in the home
Student engagement in reading lessonsIn the PIRLS 2016 assessment, students’ views of how engaged (i.e. interested) they were in their reading lessons were collected using their level of agreement to the following nine items about what happens during class time:
� I like what I read about in school.
� My teacher gives me interesting things to read.
� I know what my teacher expects me to do.
� My teacher is easy to understand.
� I am interested in what my teacher says.
� My teacher encourages me to say what I think about what I have read.
� My teacher lets me show what I have learned.
� My teacher does a variety of things to help us learn.
� My teacher tells me how to do better when I make a mistake.
Students’ responses to these items were combined to create the Student Engagement in Reading Lessons scale. Scores on this scale were then used to categorise students into three groups representing their level of engagment in reading lessons. Students who were very engaged in reading lessons had a scale score of at least 9.5, which is the point on the scale corresponding to ‘agreeing a lot’ with five of the nine statements and ‘agreeing a little’ with the other four, on average. Students who were less than engaged in reading had scores no higher than 7.1, which is the scale point corresponding to ‘disagreeing a little’ with five of the nine statements and ‘agreeing a little’ with the other four, on average. All other students were categorised as somewhat engaged in reading lessons.
Happily for teachers of Australian students, the average score on this scale of 9.8 indicates that Australian students are, on average, very engaged in reading lessons. Figure 5.10 shows that over 50 per cent of Australian students were very engaged in reading lessons, and a further 39 per cent were somewhat engaged. Only 5 per cent of students were classified as being less than engaged in reading lessons. Students who were less than engaged in reading lessons scored much lower, on average,
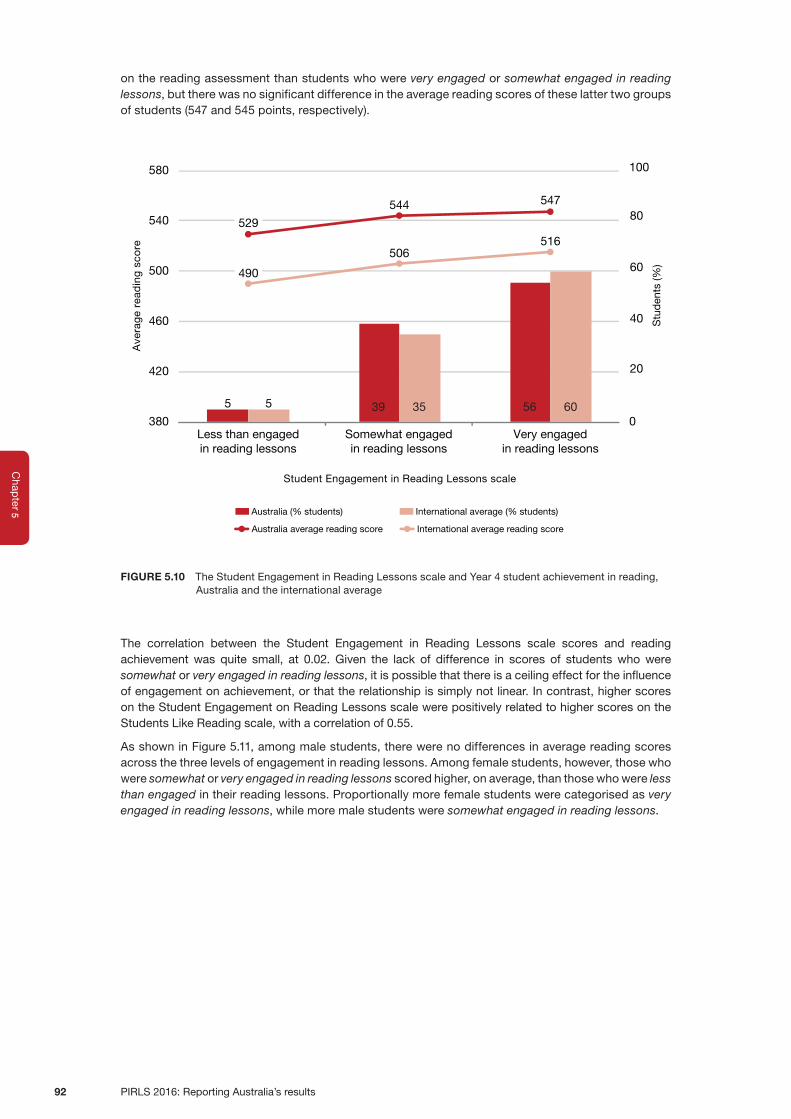
5C
hapter
PIRLS 2016: Reporting Australia’s results92
on the reading assessment than students who were very engaged or somewhat engaged in reading lessons, but there was no significant difference in the average reading scores of these latter two groups of students (547 and 545 points, respectively).
529
490
5 39 565 35 60
544 547
506516
0
20
40
60
80
100
380
420
460
500
540
580
Less than engagedin reading lessons
Somewhat engagedin reading lessons
Very engagedin reading lessons
Stu
den
ts (%
)
Ave
rag
e re
adin
g s
core
Student Engagement in Reading Lessons scale
Australia (% students) International average (% students)
International average reading scoreAustralia average reading score
FIGURE 5.10 The Student Engagement in Reading Lessons scale and Year 4 student achievement in reading, Australia and the international average
The correlation between the Student Engagement in Reading Lessons scale scores and reading achievement was quite small, at 0.02. Given the lack of difference in scores of students who were somewhat or very engaged in reading lessons, it is possible that there is a ceiling effect for the influence of engagement on achievement, or that the relationship is simply not linear. In contrast, higher scores on the Student Engagement on Reading Lessons scale were positively related to higher scores on the Students Like Reading scale, with a correlation of 0.55.
As shown in Figure 5.11, among male students, there were no differences in average reading scores across the three levels of engagement in reading lessons. Among female students, however, those who were somewhat or very engaged in reading lessons scored higher, on average, than those who were less than engaged in their reading lessons. Proportionally more female students were categorised as very engaged in reading lessons, while more male students were somewhat engaged in reading lessons.
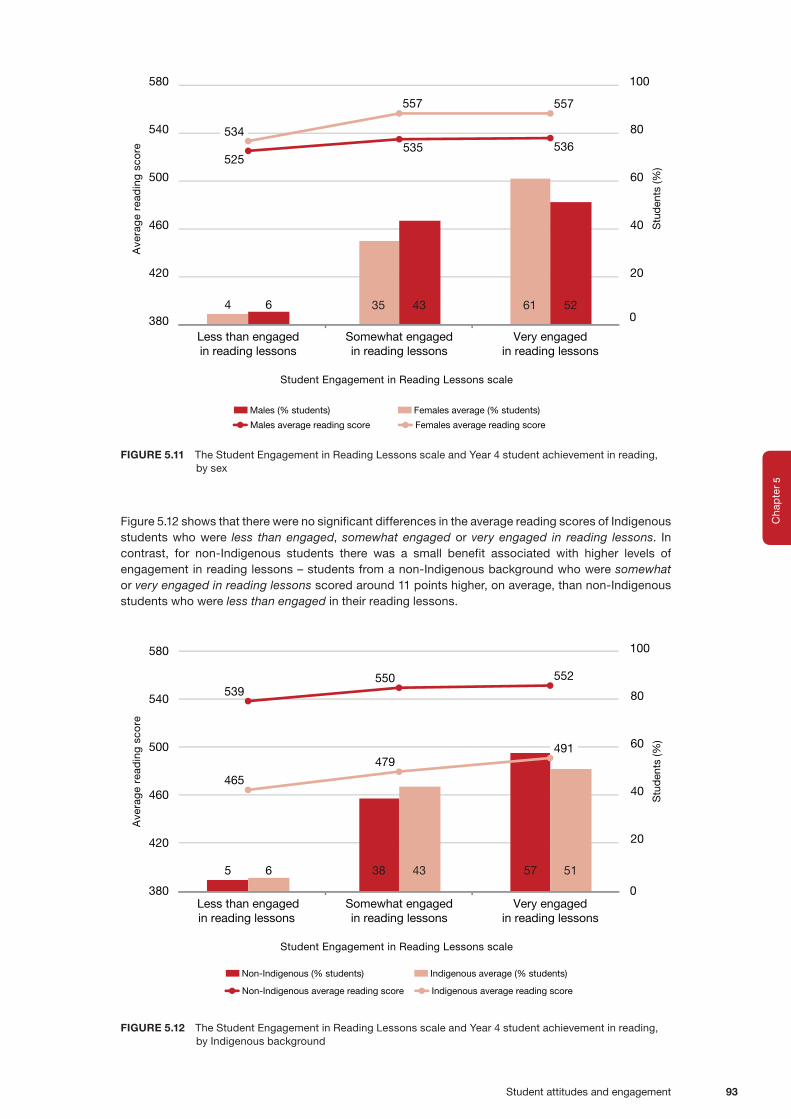
5C
hap
ter
Student attitudes and engagement 93
4 35 616 43 52
534
557 557
525535 536
0
20
40
60
80
100
380
420
460
500
540
580
Less than engagedin reading lessons
Somewhat engagedin reading lessons
Very engagedin reading lessons
Stu
den
ts (%
)
Ave
rag
e re
adin
g s
core
Student Engagement in Reading Lessons scale
Males (% students) Females average (% students)
Females average reading scoreMales average reading score
FIGURE 5.11 The Student Engagement in Reading Lessons scale and Year 4 student achievement in reading, by sex
Figure 5.12 shows that there were no significant differences in the average reading scores of Indigenous students who were less than engaged, somewhat engaged or very engaged in reading lessons. In contrast, for non-Indigenous students there was a small benefit associated with higher levels of engagement in reading lessons – students from a non-Indigenous background who were somewhat or very engaged in reading lessons scored around 11 points higher, on average, than non-Indigenous students who were less than engaged in their reading lessons.
5 38 576 43 51
539550 552
465
479491
0
20
40
60
80
100
380
420
460
500
540
580
Less than engagedin reading lessons
Somewhat engagedin reading lessons
Very engagedin reading lessons
Stu
den
ts (%
)
Ave
rag
e re
adin
g s
core
Student Engagement in Reading Lessons scale
Non-Indigenous (% students) Indigenous average (% students)
Indigenous average reading scoreNon-Indigenous average reading score
FIGURE 5.12 The Student Engagement in Reading Lessons scale and Year 4 student achievement in reading, by Indigenous background

5C
hapter
PIRLS 2016: Reporting Australia’s results94
When the relationship between scores on the PIRLS assessment and engagement in reading lessons was examined by the number of books reported at home, a benefit was found only among students who reported an average number of books at home (see Figure 5.13). For these students, being somewhat or very engaged in reading lessons was associated with higher average reading scores – similar scores, in fact, to those students with many books at home who were less than engaged in reading lessons.
For those students with only a few books and those with many books, levels of engagement in reading lessons had no influence on average reading scores. Those with a few books scored lower, on average, than other students, regardless of how engaged they were during their reading lessons.
5 40 555 38 576 37 58
499 496 502
537
557 557557
580 580
0
20
40
60
80
100
380
420
460
500
540
580
620
Less than engagedin reading lessons
Somewhat engagedin reading lessons
Very engagedin reading lessons
Stu
den
ts (%
)
Ave
rag
e re
adin
g s
core
A few books (% students) Average no. of books (% students)
Average no. of booksaverage reading score
A few books averagereading score
Many books (% students)
Many books averagereading score
Student Engagement in Reading Lessons scale
FIGURE 5.13 The Student Engagement in Reading Lessons scale and Year 4 student achievement in reading, by books in the home

References 95
References
Abedi, J. (2002). Assessment and accommodation of English language learners: Issues, concerns and recommendations. Journal of School Improvement, 3(1), 83-89.
Australian Bureau of Statistics. (1996). Aspects of literacy: Profiles and perceptions, Australia. ABS Catalogue No. 4226.0, Australian Bureau of Statistics, Canberra.
Australian Bureau of Statistics. (2014). Australian social trends. Available http://www.abs.gov.au/ausstats/[email protected]/Lookup/4102.0main+features102014.
Australian Curriculum, Assessment and Reporting Authority (2015). Measurement Framework for Schooling in Australia 2015. Sydney: ACARA. Retrieved from http://www.acara.edu.au/_resources/Measurement_Framework_for_Schooling_in_Australia_2015.pdf.
Bialystok, E. (2006). Second-language acquisition and bilingualism at an early age and the impact on early cognitive development. In R.E. Tremblay, M. Boivin, & R.D. Peters (Eds.), Encyclopedia on early childhood development [online]. Montreal, Quebec: Centre of Excellence for Early Childhood Development and the Strategic Knowledge Cluster on ECD. Retrieved from http://child-encyclopedia.com/ pages/PDF/BialystokANGxp_rev.pdf.
Department of Education, Science and Training (DEST). (2005). Literacy and numeracy: A review of the literature. Canberra, Australia.
Eunice Kennedy Shriver National Institute of Child Health and Human Development, NIH, DHHS. (2000). Report of the National Reading Panel: Teaching children to read: Reports of the Subgroups (00-4754). Washington, DC: U.S. Government Printing Office.
Francis, D. J., Shaywitz, S. E., Stuebing, K. K., Shaywitz, B. A., and Fletcher, J. M. (1996). Developmental lag versus deficit models of reading disability: A longitudinal, individual growth curves analysis. Journal of Educational Psychology, 88(1), 3-17.
Freebody, P. & Ludwig, C. (1995). Everyday literacy practices in and out of schools in low socioconomic urban communities (Vol 1). Department of Employment, Education and Training Centre for Literacy Education Research, Queensland, Australia.
Hattie, J. (2008). Visible learning. London & New York: Routledge.
Juel, C. (1988). Learning to read and write: A longitudinal study of 54 children from first to fourth grades. Journal of Educational Psychology, 80(4), 437-447.

References
PIRLS 2016: Reporting Australia’s results96
Ministerial Council for Education, Employment, Training and Youth Affairs (MCEETYA) (2008). Melbourne Declaration on Educational Goals for Young Australians. Melbourne, Curriculum Corporation. Retrieved from http://www.curriculum.edu.au/verve/_resources/National_Declaration_on_the_Educational_Goals_for_Young_Australians.pdf.
Mullis, I. V. S., Martin, M. O., Foy, P. & Hooper, M. (2017). PIRLS 2016 International Results in Reading. Retrieved from http://timssandpirls.bc.edu/pirls2016/international-results.
OECD (2010). PISA 2009 Results: What Students Know and Can Do – Student Performance in Reading, Mathematics and Science (Volume I). Paris: OECD.
OECD (2012). Equity and quality in education: Supporting disadvantaged students and schools. Paris: OECD.
Panizzon, D. & Pegg, J. (2007). Chasms in student achievement: Exploring the rural-metropolitan divide [online]. Education in Rural Australia, 17 (2), 3-20. Retrieved from: https://search.informit.com.au/fullText;dn=287612265364606;res=IELHSS accessed August 2, 2017.
Schagen, I. (2004). Multi‐level analysis of PIRLS data for England. Paper presented at the First IEA International Research Conference. May 11–13, Lefkosia: University of Cyprus
Shiel, G. & Eivers, E. (2009). International comparisons of reading literacy: What can they tell us? Cambridge Journal of Education. 69 (3), 345-360.
Teale, W. H., & Sulzby, E. (Eds.). (1986). Emergent literacy: Writing and reading. Norwood, NJ: Ablex
Thomson, S., De Bortoli, L. & Underwood, C. (2017). PISA 2015: Reporting Australia’s results. Camberwell: ACER.
Thomson, S., Hillman, K., Wernert, N., Schmid, M., Buckley, S. and Munene, A. (2012). Monitoring Australian Year 4 student achievement internationally: TIMSS and PIRLS 2011. Camberwell: ACER.
Thomson, S., Wernert, N., O’Grady, E. and Rodrigues, S. (2017). TIMSS 2015: Reporting Australia’s results. Camberwell: ACER.
Torgesen, J.K. & Hudson, R. (2006). Reading fluency: critical issues for struggling readers. In S.J. Samuels and A. Farstrup (Eds.). Reading fluency: The forgotten dimension of reading success. Newark, DE: International Reading Association.
Whitehurst G. J, & Lonigan C. J. (1998). Child development and emergent literacy. Child Development. 69, 848-72.
Appendix A 97
Appendix A
PIRLS methods and proceduresTo assist readers to understand the scope and operations of PIRLS, a brief account of some of its procedures is provided in this appendix. A thorough account is available in Methods and Procedures in PIRLS 2016 (http://timssandpirls.bc.edu/publications/timss/2015-methods.html). As most of the operational procedures have both international and national components, this appendix will provide details specific to Australia, where appropriate.
Operationalisation of PIRLSProcedures for administering the test were determined by the TIMSS & PIRLS International Study Center so that data from all students from all schools in all countries could be considered equivalent.
These were operationalised by National Centres in each country, such as ACER in Australia. School Coordinators, nominated by the principal of each participating school, assisted the National Centre with the management of PIRLS within the school. The PIRLS test and student questionnaires were administered by a Test Administrator, who, in most cases, was a teacher from the school.
The Test Administrator followed strict guidelines and was required to complete a report about any situation that constituted a deviation from these guidelines. National Quality Control Observers (employed by the National Centre) visited 10 per cent of schools to observe the test administration. An International Quality Control Observer (employed by the IEA) visited a further 15 schools as well as examining the operations of the National Centre.
SamplingThe PIRLS 2016 assessment was administered to carefully drawn random samples of students from the target population in each country. Given that the accuracy of the PIRLS results depends on the quality of the national samples, the PIRLS sampling experts worked with participating countries on all phases of sampling to ensure efficient sampling design and implementation.
National Centre staff were trained in how to select the school and student samples, and in how to use the sampling software provided by the IEA Data Processing Center. Staff from Statistics Canada reviewed the national sampling plans, sampling data, sampling frames and sample selections. The
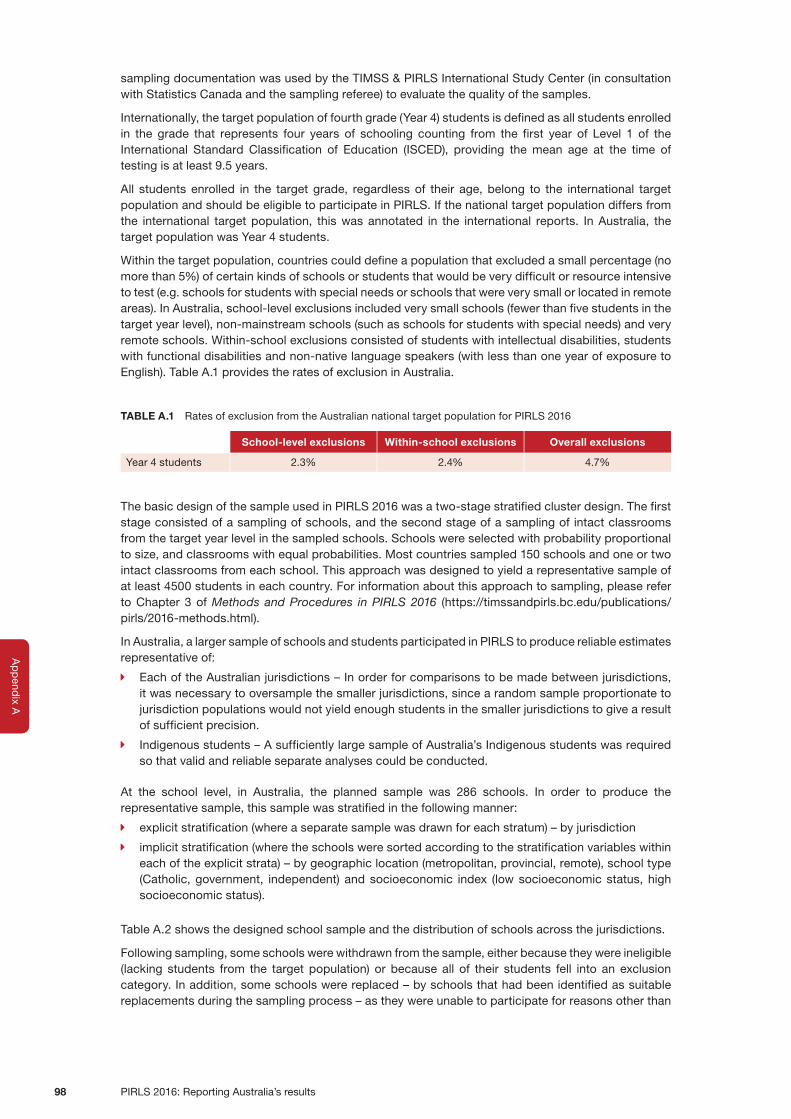
PIRLS 2016: Reporting Australia’s results98
Ap
pend
ix A
sampling documentation was used by the TIMSS & PIRLS International Study Center (in consultation with Statistics Canada and the sampling referee) to evaluate the quality of the samples.
Internationally, the target population of fourth grade (Year 4) students is defined as all students enrolled in the grade that represents four years of schooling counting from the first year of Level 1 of the International Standard Classification of Education (ISCED), providing the mean age at the time of testing is at least 9.5 years.
All students enrolled in the target grade, regardless of their age, belong to the international target population and should be eligible to participate in PIRLS. If the national target population differs from the international target population, this was annotated in the international reports. In Australia, the target population was Year 4 students.
Within the target population, countries could define a population that excluded a small percentage (no more than 5%) of certain kinds of schools or students that would be very difficult or resource intensive to test (e.g. schools for students with special needs or schools that were very small or located in remote areas). In Australia, school-level exclusions included very small schools (fewer than five students in the target year level), non-mainstream schools (such as schools for students with special needs) and very remote schools. Within-school exclusions consisted of students with intellectual disabilities, students with functional disabilities and non-native language speakers (with less than one year of exposure to English). Table A.1 provides the rates of exclusion in Australia.
TABLE A.1 Rates of exclusion from the Australian national target population for PIRLS 2016
School-level exclusions Within-school exclusions Overall exclusions
Year 4 students 2.3% 2.4% 4.7%
The basic design of the sample used in PIRLS 2016 was a two-stage stratified cluster design. The first stage consisted of a sampling of schools, and the second stage of a sampling of intact classrooms from the target year level in the sampled schools. Schools were selected with probability proportional to size, and classrooms with equal probabilities. Most countries sampled 150 schools and one or two intact classrooms from each school. This approach was designed to yield a representative sample of at least 4500 students in each country. For information about this approach to sampling, please refer to Chapter 3 of Methods and Procedures in PIRLS 2016 (https://timssandpirls.bc.edu/publications/pirls/2016-methods.html).
In Australia, a larger sample of schools and students participated in PIRLS to produce reliable estimates representative of:
� Each of the Australian jurisdictions – In order for comparisons to be made between jurisdictions, it was necessary to oversample the smaller jurisdictions, since a random sample proportionate to jurisdiction populations would not yield enough students in the smaller jurisdictions to give a result of sufficient precision.
� Indigenous students – A sufficiently large sample of Australia’s Indigenous students was required so that valid and reliable separate analyses could be conducted.
At the school level, in Australia, the planned sample was 286 schools. In order to produce the representative sample, this sample was stratified in the following manner:
� explicit stratification (where a separate sample was drawn for each stratum) – by jurisdiction
� implicit stratification (where the schools were sorted according to the stratification variables within each of the explicit strata) – by geographic location (metropolitan, provincial, remote), school type (Catholic, government, independent) and socioeconomic index (low socioeconomic status, high socioeconomic status).
Table A.2 shows the designed school sample and the distribution of schools across the jurisdictions.
Following sampling, some schools were withdrawn from the sample, either because they were ineligible (lacking students from the target population) or because all of their students fell into an exclusion category. In addition, some schools were replaced – by schools that had been identified as suitable replacements during the sampling process – as they were unable to participate for reasons other than
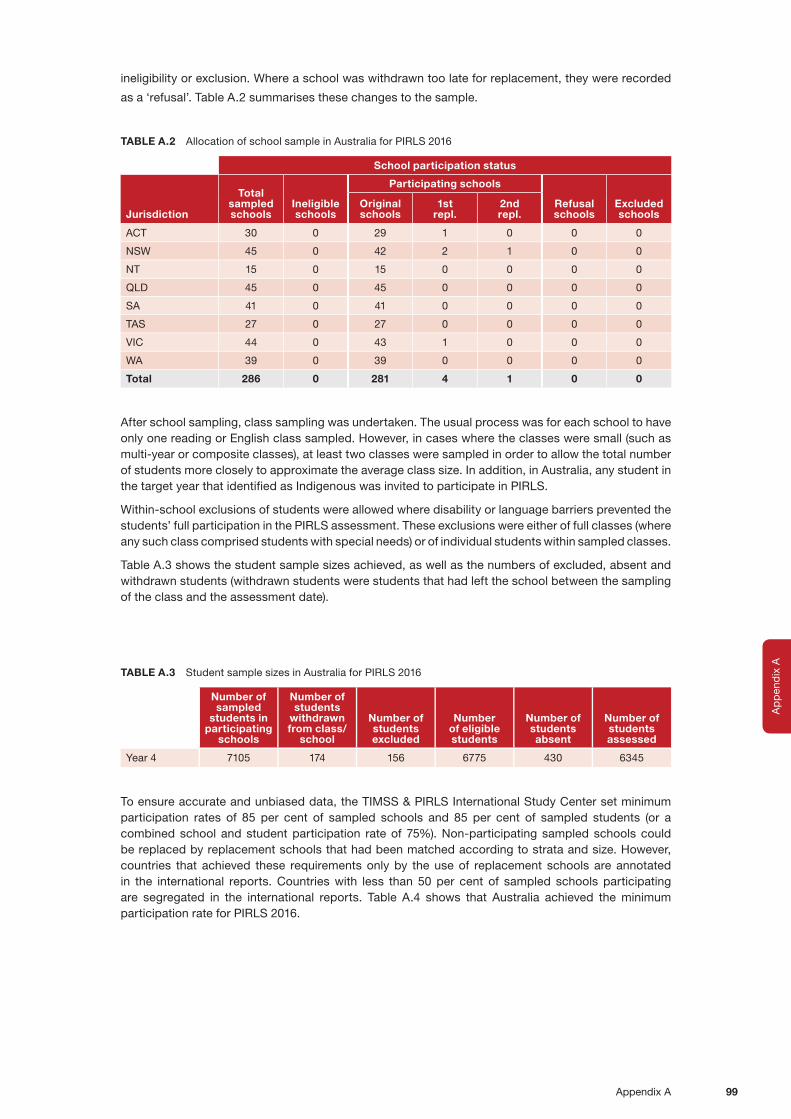
Ap
pen
dix
A
Appendix A 99
ineligibility or exclusion. Where a school was withdrawn too late for replacement, they were recorded
as a ‘refusal’. Table A.2 summarises these changes to the sample.
TABLE A.2 Allocation of school sample in Australia for PIRLS 2016
School participation status
Jurisdiction
Totalsampledschools
Ineligibleschools
Participating schools
Refusalschools
Excludedschools
Originalschools
1strepl.
2ndrepl.
ACT 30 0 29 1 0 0 0
NSW 45 0 42 2 1 0 0
NT 15 0 15 0 0 0 0
QLD 45 0 45 0 0 0 0
SA 41 0 41 0 0 0 0
TAS 27 0 27 0 0 0 0
VIC 44 0 43 1 0 0 0
WA 39 0 39 0 0 0 0
Total 286 0 281 4 1 0 0
After school sampling, class sampling was undertaken. The usual process was for each school to have only one reading or English class sampled. However, in cases where the classes were small (such as multi-year or composite classes), at least two classes were sampled in order to allow the total number of students more closely to approximate the average class size. In addition, in Australia, any student in the target year that identified as Indigenous was invited to participate in PIRLS.
Within-school exclusions of students were allowed where disability or language barriers prevented the students’ full participation in the PIRLS assessment. These exclusions were either of full classes (where any such class comprised students with special needs) or of individual students within sampled classes.
Table A.3 shows the student sample sizes achieved, as well as the numbers of excluded, absent and withdrawn students (withdrawn students were students that had left the school between the sampling of the class and the assessment date).
TABLE A.3 Student sample sizes in Australia for PIRLS 2016
Number of sampled
students in participating
schools
Number of students
withdrawn from class/
school
Number of students excluded
Number of eligible students
Number of students absent
Number of students assessed
Year 4 7105 174 156 6775 430 6345
To ensure accurate and unbiased data, the TIMSS & PIRLS International Study Center set minimum participation rates of 85 per cent of sampled schools and 85 per cent of sampled students (or a combined school and student participation rate of 75%). Non-participating sampled schools could be replaced by replacement schools that had been matched according to strata and size. However, countries that achieved these requirements only by the use of replacement schools are annotated in the international reports. Countries with less than 50 per cent of sampled schools participating are segregated in the international reports. Table A.4 shows that Australia achieved the minimum participation rate for PIRLS 2016.
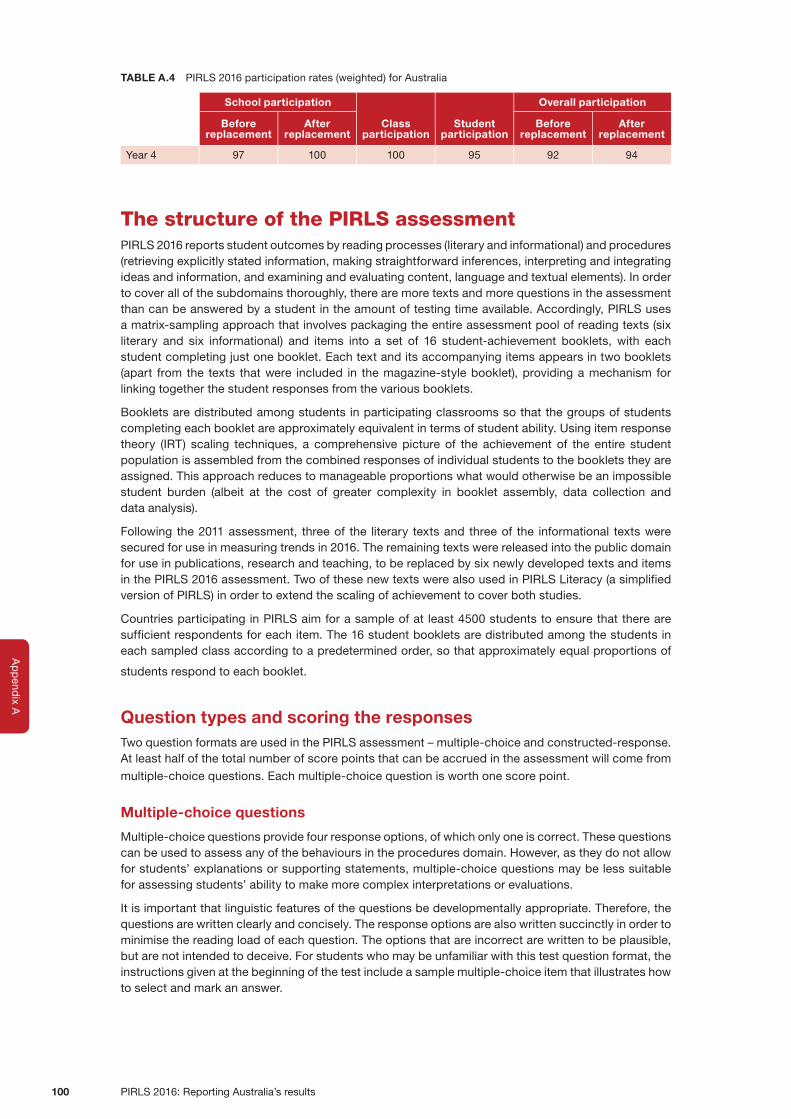
PIRLS 2016: Reporting Australia’s results100
Ap
pend
ix A
TABLE A.4 PIRLS 2016 participation rates (weighted) for Australia
School participation
Class participation
Student participation
Overall participation
Before replacement
After replacement
Before replacement
After replacement
Year 4 97 100 100 95 92 94
The structure of the PIRLS assessmentPIRLS 2016 reports student outcomes by reading processes (literary and informational) and procedures (retrieving explicitly stated information, making straightforward inferences, interpreting and integrating ideas and information, and examining and evaluating content, language and textual elements). In order to cover all of the subdomains thoroughly, there are more texts and more questions in the assessment than can be answered by a student in the amount of testing time available. Accordingly, PIRLS uses a matrix-sampling approach that involves packaging the entire assessment pool of reading texts (six literary and six informational) and items into a set of 16 student-achievement booklets, with each student completing just one booklet. Each text and its accompanying items appears in two booklets (apart from the texts that were included in the magazine-style booklet), providing a mechanism for linking together the student responses from the various booklets.
Booklets are distributed among students in participating classrooms so that the groups of students completing each booklet are approximately equivalent in terms of student ability. Using item response theory (IRT) scaling techniques, a comprehensive picture of the achievement of the entire student population is assembled from the combined responses of individual students to the booklets they are assigned. This approach reduces to manageable proportions what would otherwise be an impossible student burden (albeit at the cost of greater complexity in booklet assembly, data collection and data analysis).
Following the 2011 assessment, three of the literary texts and three of the informational texts were secured for use in measuring trends in 2016. The remaining texts were released into the public domain for use in publications, research and teaching, to be replaced by six newly developed texts and items in the PIRLS 2016 assessment. Two of these new texts were also used in PIRLS Literacy (a simplified version of PIRLS) in order to extend the scaling of achievement to cover both studies.
Countries participating in PIRLS aim for a sample of at least 4500 students to ensure that there are sufficient respondents for each item. The 16 student booklets are distributed among the students in each sampled class according to a predetermined order, so that approximately equal proportions of
students respond to each booklet.
Question types and scoring the responsesTwo question formats are used in the PIRLS assessment – multiple-choice and constructed-response. At least half of the total number of score points that can be accrued in the assessment will come from
multiple-choice questions. Each multiple-choice question is worth one score point.
Multiple-choice questions
Multiple-choice questions provide four response options, of which only one is correct. These questions can be used to assess any of the behaviours in the procedures domain. However, as they do not allow for students’ explanations or supporting statements, multiple-choice questions may be less suitable for assessing students’ ability to make more complex interpretations or evaluations.
It is important that linguistic features of the questions be developmentally appropriate. Therefore, the questions are written clearly and concisely. The response options are also written succinctly in order to minimise the reading load of each question. The options that are incorrect are written to be plausible, but are not intended to deceive. For students who may be unfamiliar with this test question format, the instructions given at the beginning of the test include a sample multiple-choice item that illustrates how to select and mark an answer.

Ap
pen
dix
A
Appendix A 101
Constructed-response questions
For this type of test item, students are required to construct a written response, rather than select a response from a set of options. Constructed-response questions require scoring by trained scorers. The scoring guide for each constructed-response question describes the essential features of appropriate and complete responses. The guides point to evidence of the type of behaviour that a given question is designed to assess. They describe evidence of partially correct and completely correct responses. In addition, sample student responses at each level of understanding provide important guidance to those who will be rating the students’ responses. In scoring students’ responses to constructed-response questions, the focus is solely on students’ achievement with respect to the reading process being assessed, not on their ability to write well. However, students need to communicate their response in a manner that will be clear to scorers.
For more information about the items and their development, please refer to Chapter 1 of Methods and Procedures in PIRLS 2016 (https://timssandpirls.bc.edu/publications/pirls/2016-methods.html).
Translation and adaptation of materialsExperts in translation procedures ensured that translated materials were as equivalent in meaning and level of complexity as possible. Translation of the assessment booklets, questionnaires and manuals involved development and implementation of extensive and rigorous processes. Materials from the TIMSS & PIRLS International Study Center were provided to countries in both English and Arabic. Countries whose principal language is neither English nor Arabic were thus required to translate the assessment materials. These translations were then reviewed for accuracy by a team of expert translators. For more information about the translation processes, please refer to Chapter 7 of Methods and Procedures in PIRLS 2016 (https://timssandpirls.bc.edu/publications/pirls/2016-methods.html). In Australia, while a full translation was not necessary, adaptation of the materials from American English to Australian English was required and was undertaken in accordance with the PIRLS translation-verification process. The assessment materials, along with all questionnaires, manuals and documentation, were adapted to suit local linguistic usages and educational circumstances.

PIRLS 2016: Reporting Australia’s results102

Appendix B 103
Appendix B
TABLE B.1 Mean scores for Year 4 reading achievement, 2011–2016 by country
2016 2011
Country Mean SE Mean SE
Australia 544 2.5 527 2.3
Austria 541 2.4 529 1.9
Azerbaijan 470 4.4 462 3.3
Belgium (Flemish) 525 1.9 ~ ~
Belgium (French) 497 2.6 506 2.9
Bulgaria 552 4.2 532 4.1
Canada 543 1.8 548 1.6
Chinese Taipei 559 2.0 553 1.8
Czech Republic 543 2.1 545 2.2
Denmark 547 2.1 554 1.7
England 559 1.9 552 2.6
Finland 566 1.8 568 1.8
France 511 2.2 520 2.7
Georgia 488 2.8 488 3.1
Germany 537 3.2 541 2.3
Hong Kong SAR 569 2.7 571 2.3
Hungary 554 2.9 539 2.8
Iran, Islamic Rep. of 428 4.0 457 2.9
Ireland 567 2.5 552 2.3
Israel 530 2.5 541 2.7
Italy 548 2.2 541 2.2
Latvia 558 1.7 ~ ~
Lithuania 550 2.8 528 2.0
Malta 452 1.8 457 1.4
Morocco 358 3.9 310 3.9
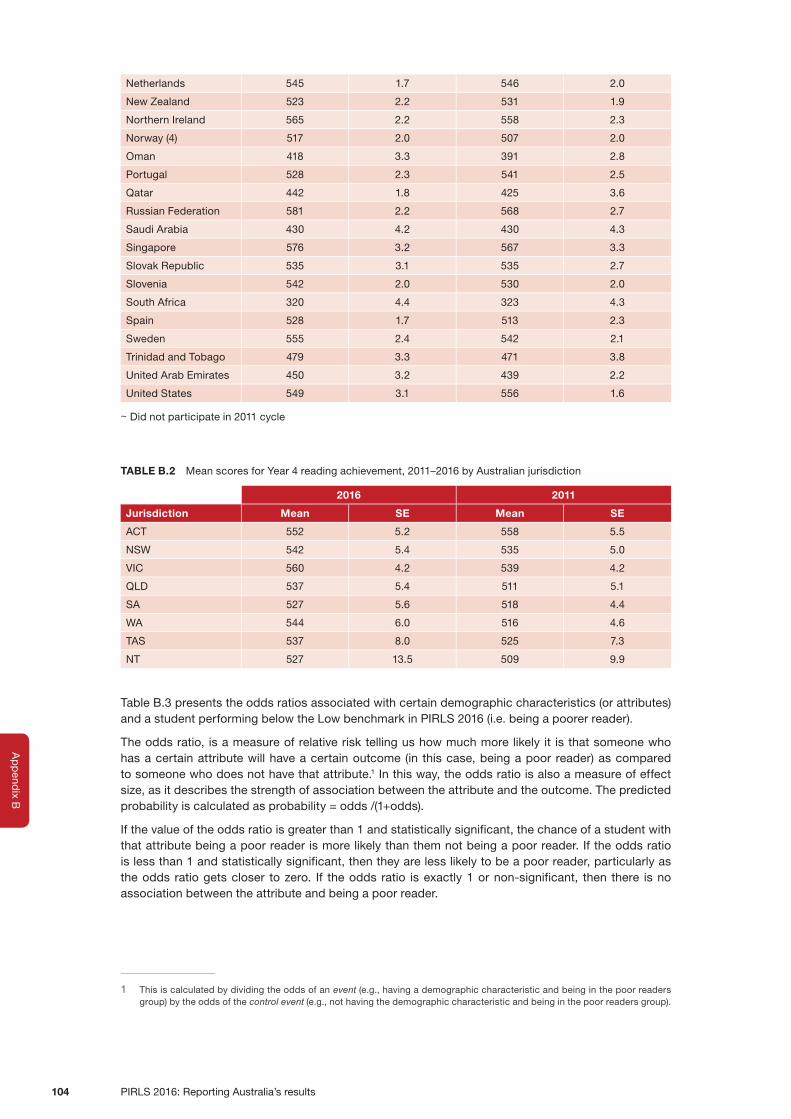
PIRLS 2016: Reporting Australia’s results104
Ap
pend
ix B
Netherlands 545 1.7 546 2.0
New Zealand 523 2.2 531 1.9
Northern Ireland 565 2.2 558 2.3
Norway (4) 517 2.0 507 2.0
Oman 418 3.3 391 2.8
Portugal 528 2.3 541 2.5
Qatar 442 1.8 425 3.6
Russian Federation 581 2.2 568 2.7
Saudi Arabia 430 4.2 430 4.3
Singapore 576 3.2 567 3.3
Slovak Republic 535 3.1 535 2.7
Slovenia 542 2.0 530 2.0
South Africa 320 4.4 323 4.3
Spain 528 1.7 513 2.3
Sweden 555 2.4 542 2.1
Trinidad and Tobago 479 3.3 471 3.8
United Arab Emirates 450 3.2 439 2.2
United States 549 3.1 556 1.6
~ Did not participate in 2011 cycle
TABLE B.2 Mean scores for Year 4 reading achievement, 2011–2016 by Australian jurisdiction
2016 2011
Jurisdiction Mean SE Mean SE
ACT 552 5.2 558 5.5
NSW 542 5.4 535 5.0
VIC 560 4.2 539 4.2
QLD 537 5.4 511 5.1
SA 527 5.6 518 4.4
WA 544 6.0 516 4.6
TAS 537 8.0 525 7.3
NT 527 13.5 509 9.9
Table B.3 presents the odds ratios associated with certain demographic characteristics (or attributes) and a student performing below the Low benchmark in PIRLS 2016 (i.e. being a poorer reader).
The odds ratio, is a measure of relative risk telling us how much more likely it is that someone who has a certain attribute will have a certain outcome (in this case, being a poor reader) as compared to someone who does not have that attribute.1 In this way, the odds ratio is also a measure of effect size, as it describes the strength of association between the attribute and the outcome. The predicted probability is calculated as probability = odds /(1+odds).
If the value of the odds ratio is greater than 1 and statistically significant, the chance of a student with that attribute being a poor reader is more likely than them not being a poor reader. If the odds ratio is less than 1 and statistically significant, then they are less likely to be a poor reader, particularly as the odds ratio gets closer to zero. If the odds ratio is exactly 1 or non-significant, then there is no association between the attribute and being a poor reader.
1 This is calculated by dividing the odds of an event (e.g., having a demographic characteristic and being in the poor readers group) by the odds of the control event (e.g., not having the demographic characteristic and being in the poor readers group).

Appendix B 105
Ap
pen
dix
B
TABLE B.3 Demographic characteristics associated with being a poorer reader for Australian students in PIRLS 2016
EqVar Beta Standard error
Wald statistic P value Odds ratio
CONSTANT -4.38 0.19 536.94 0.000 0.01
Reporting a few books at home 1.19 0.15 63.82 0.000 3.29
Attending a more disadvantaged school 0.88 0.19 21.90 0.000 2.40
Having an Indigenous background 1.36 0.20 48.22 0.000 3.89
Speaking a language other than English at home
0.32 0.17 3.61 0.057 1.37
Being male 0.67 0.16 16.70 0.000 1.95
Attending a remote school 0.96 0.47 4.13 0.042 2.61
The associations between the attributes and being a poor reader (scoring below the Low benchmark) that are summarised by the odds ratios in the table above are net of any other associations, that is, they are the association between that attribute and being a poor reader while all other associations are held constant. For example, the association between being male and being a poor reader has a B value of 0.67 and an odds ratio of 1.95, regardless of their Indigenous status or where their school is located.

Australian Council for Educational Research