piloting sustainable urban transport index (suti) in ... final report.pdf · the traditional city...
TRANSCRIPT

2017
Bhagawat Bhakta Khokhali
Urban Planner.
Kathmandu Valley Development Authority,
MoUD, GON.
11/30/2017
Final Report
on
Piloting Sustainable Urban Transport Index (SUTI) in Kathmandu Valley, Nepal.
Piloting Sustainable Urban Transport Index (SUTI) in Kathmandu Valley, Nepal.
B.B.Khokhali_Piloting SUTI in Ktm Valley. 1
Table of Contents 1.Background ......................................................................................................................... 2
2. Infrastructure : Roads ......................................................................................................... 3
2.1 Urban Transport Improvement for Kathmandu Valley. .................................................. 7
2.2 Kathmandu Sustainable Urban Transport Project (KSUTP) ......................................... 9
3. Data Collection approach for SUTI ................................................................................... 10
4. Sustainable Urban Transport Index, SUTI. ....................................................................... 11
4.01 Indicator 1: Extent to which transport plans cover public transport, intermodal
facilities and infrastructure for active ................................................................................. 12
4.02 Indicator 2: Modal share of active and public transport in commuting ...................... 13
4.03 Indicator 3: Convenient access to public transport service ....................................... 14
4.04 Indicator 4: Public transport quality and reliability ..................................................... 14
4.05 Indicator 5: Traffic fatalities per 100,000 inhabitants ................................................. 15
4.06 Indicator 6: Affordability – travel costs as part of income .......................................... 16
4.07 Indicator 7: Operational costs of the public transport system ................................... 16
4.08 Indicator 8: Investment in public transportation systems .......................................... 18
4.09 Indicator 9: Air quality (PM10) ................................................................................... 19
4.10 Indicator 10: Greenhouse gas emissions (CO2eq tons/year) ................................... 20
5. Conclusion: ...................................................................................................................... 22
Annexes: .............................................................................................................................. 24

Piloting Sustainable Urban Transport Index (SUTI) in Kathmandu Valley, Nepal.
B.B.Khokhali_Piloting SUTI in Ktm Valley. 2
1.Background Kathmandu Valley covers an area of 721.87 sq.km covering parts of Kathmandu (approx.
85%), Lalitpur (approx. 50%) and Bhaktpur districts. Geographically, the KV extents from
27o49'4" latitude, 85o11'19" longitude to 27o34'33" latitude, 85o34'57" longitude in the mid-
mount physiographic region of Nepal. The elevation ranges from approximately 833 m to 2726
m above mean sea level within Kathmandu valley. Kathmandu valley, a part of Middle
Mountain Physiographic region lies in Bagmati River Watershed and covers 677.58 sq.km
area. Bagmati River that originates from Middle Mountains is the main river system of this
watershed. The watershed is nearly circular in shape consist of 227 km stream length with a
density of 335.33 m/km2 and is surrounded by Rosi Khola, Jhikhu Khola, and Indrawati Nadi
Watersheds in the east; Tadi Khola, Kolpu Khola, Mahesh Khola, Palun Khola Watersheds in
west.
Kathmandu valley lies in Bagmati zone of central development region. KV boundary covers
whole of Kathmandu and Bhaktapur district and parts of Lalitpur district. Until October 2017,
Kathmandu Valley was administratively divided into 2 metropolitan cities and 14
municipalities. Earlier it used to be 5 municipalities and various urbanizing village
development corporations and then it was converted into 20 municipalities and 2
metropolitan cities and now recently it is reduced to 2 metropolitan cities and 14
municipalities within a year.
The Kathmandu Valley has formed a basin where the peripheral hilly area comprises low to
medium grade metamorphic rocks and intrusive rocks belonging to Lesser Himalayas as
well as sedimentary rocks equivalent to Tibetan Tethys Zone (Stocklin and Bhattarai, 1977).
Talking about the land use, the landscape of Kathmandu Valley is dominated by cultivated
land covering about 47% of the total 722 sq.km of the valley. Forested land covers about 251
sq.km i.e. about 34% of the valley area. Built-up area consisting of residential area covers
more than 14%, commercial/mixed residential and commercial has been increasing since the
previous decades and now covers about 5%.
Kathmandu Valley has been a center of economic growth since long ago and being a capital
city of the country, its growth has been booming rapidly. The Kathmandu valley like other
urban clusters within Nepal had a core urban center surrounded by hinterland of small towns
and rural areas and functions as extended urban economic regions. The development of
market infrastructures within the core center of Kathmandu valley and centralized government
functions established the core urban center as the most desired place to live in. With
increasing economic opportunities, urban facilities, better education facilities and
development of roads, the migration of people from rural areas to urban areas increased. The
urban sprawl of Kathmandu has spread away from the core urban center within Ring road as
there is almost no space for development within the Ring road and the price of land is very
high. Primarily, the residential development without sufficient utility infrastructural

Piloting Sustainable Urban Transport Index (SUTI) in Kathmandu Valley, Nepal.
B.B.Khokhali_Piloting SUTI in Ktm Valley. 3
development which has gone unnoticed and ignored, has led to these haphazard urban
sprawls.
The total population of Kathmandu Valley in the census year 2011 was 2,517,023 with the
annual growth rate of 4.63%. This represents the 9.32% of entire population of country in
mere 0.49% area of the country. The Central Bureau of statistics of Nepal has projected the
Kathmandu valley’s population to be 27,77,255 by 2016AD.
2. Infrastructure : Roads The major mobility mode of transport in Kathmandu valley is road transport. We don’t have
metro rail, mono rail, AGT system and BRT system introduced until now. Though, lots of
studies for their feasibility are already been done.
Road network in Kathmandu Valley is classified into two groups:
1. Strategic Road Network (greater than 6 m) comprising of Highways, Feeder Roads (both
major and minor) and Strategic Urban roads are the responsibility of the Department of Roads.
As per the Statistics of Strategic road network, SSRN 2016, Kathmandu district has 247.70
km of roads, Lalitpur district has 131.39 km of roads and Bhaktapur district has 115.06 km of
roads.
Figure 1 SSRN_Kathmandu

Piloting Sustainable Urban Transport Index (SUTI) in Kathmandu Valley, Nepal.
B.B.Khokhali_Piloting SUTI in Ktm Valley. 4
Figure 2 SSRN Lalitpur
Figure 3 SSRN Bhaktapur

Piloting Sustainable Urban Transport Index (SUTI) in Kathmandu Valley, Nepal.
B.B.Khokhali_Piloting SUTI in Ktm Valley. 5
2. Local Road Network (less than 8 m) comprising of District, Urban and Village roads are the
responsibility of the respective local bodies and DOLIDAR. As per the Statistics of local road
network, SLRN 2016, Kathmandu district has 1043.03 km of roads, Lalitpur district has 667.27
km of roads and Bhaktapur district has 303.79 km of roads. (Strategic road networks, urban
roads, district road core networks and village roads lie in this category)
Figure 4 SLRN Kathmandu

Piloting Sustainable Urban Transport Index (SUTI) in Kathmandu Valley, Nepal.
B.B.Khokhali_Piloting SUTI in Ktm Valley. 6
Figure 5 SLRN Lalitpur
Figure 6 SLRN Bhaktapur

Piloting Sustainable Urban Transport Index (SUTI) in Kathmandu Valley, Nepal.
B.B.Khokhali_Piloting SUTI in Ktm Valley. 7
Motorization in the Valley has been increasing by 30.41% in Fiscal year 2015/16 and 26.64%
in fiscal year 2016/17. There are approximately 10,42,856 vehicles (till fiscal year 2073/74 or
2016/17) registered in the Bagmati Zone which is almost 37.47% of the total vehicles
(27,83,428) registered in Nepal. The share of motorcycle has increased at an alarming rate
of 78.39% among registered vehicles in Bagmati zone. With the rapidly increasing population
and economic development, there are more than 8,17,473 motorcycles, 2,345 Microbuses,
2528 Tempos, 1,39,981 Car/Jeep/Vans, 23751 Bus and minibus registered in the Bagmati
Zone until 2016/ 2017.
Due to the lack of proper public transport facilities, most of the people use private vehicles
mostly motorbikes within the valley. This fact is supported by the vehicle registration within
the valley as well. Government of Nepal is investing on road transport only at the moment.
However, lot of other alternatives are being searched. Department of Railways has been
established and is performing the feasibility works at the moment.
The traditional city cores of the Kathmandu valley used to be pedestrian friendly cities.
Recently the government of Nepal has started to declare few vehicle free areas like tourist
centre of Thamel and few more areas like city cores and heritage sites are being studied for
pedestrian only zones.
There are few related similar projects going on within the valley which are as follows.
2.1 Urban Transport Improvement for Kathmandu Valley.
KVDA and Ministry of Physical Infrastructure & Transport, in collaboration with JICA, are in
the process of preparing the project on The Project on Urban Transport Improvement for
Kathmandu Valley. It builds upon the backdrop of Transport Master Plan (1993), Data
Collection Survey on Traffic Improvement in Kathmandu Valley (2012) and Detailed
Planning Survey (2013) conducted by JICA in coordination with the Government of Nepal.
The surveys mainly highlighted the urgent need to prepare a plan for urban transport
improvement for Kathmandu Valley to be implemented for the development of valley wide
transport and urban mobility. This project was developed to establish a comprehensive
Urban Transport Master Plan for Kathmandu Valley, which includes the development of
three major features:
• Proposed Urban Structure concept for Kathmandu Valley [Proposal for the
development of new urban centers with medium and high density, connected to the
Central Business District by public transport system]
• Transport Network [Development of Inner Ring Road; Promotion of mass rapid
transit and non-motorized transport in less risk sensitive areas]
• Emergency Road Network to perform smooth emergency transport in case of
disaster

Piloting Sustainable Urban Transport Index (SUTI) in Kathmandu Valley, Nepal.
B.B.Khokhali_Piloting SUTI in Ktm Valley. 8
The project further includes implementation of a pilot project along with capacity
development programs for relevant agencies to monitor, maintain and alter the Master
Plan.
As per the data collection survey on traffic improvement in Kathmandu valley done in
2011 and 2012 by JICA study team various data have been derived which are as follows.
• Total number of trips made by residents= 34,83,393. Trip generation rate is the
average number of trips made by one person.
• Trip Composition by purpose:
o To work =634461=18.5%,
o To School= 657030=19.1%,
o To Home=1649236=48%,
o To Business =153469 = 4.5% and
o others=344197 = 10%
o all total 3,438,393 trips.
• Trip Distribution: within Kathmandu and Lalitpur Metropolitans= 51.5% remaining
percent within the Kathmandu valley.
• Travel modes: Modal Split of 2011
Travel Mode Number of trips Percentage
Walk 1398378 40.7
Bicycle 52445 1.5
Motorcycle 893126 26
Car 145980 4.2
Bus 948464 27.6
Total 3438393 100
• Average trip length of motorcycles = 5 km
• Average trip length of cars = 5.4 km
• Average number of passengers per vehicles
o Motorcycle= 1.1
o Tempo = 7.8
o Car = 1.9
o Taxi= 2.0
o Light Truck = 1.8
o Heavy Truck = 1.9
o Average total = 1.4
Piloting Sustainable Urban Transport Index (SUTI) in Kathmandu Valley, Nepal.
B.B.Khokhali_Piloting SUTI in Ktm Valley. 9
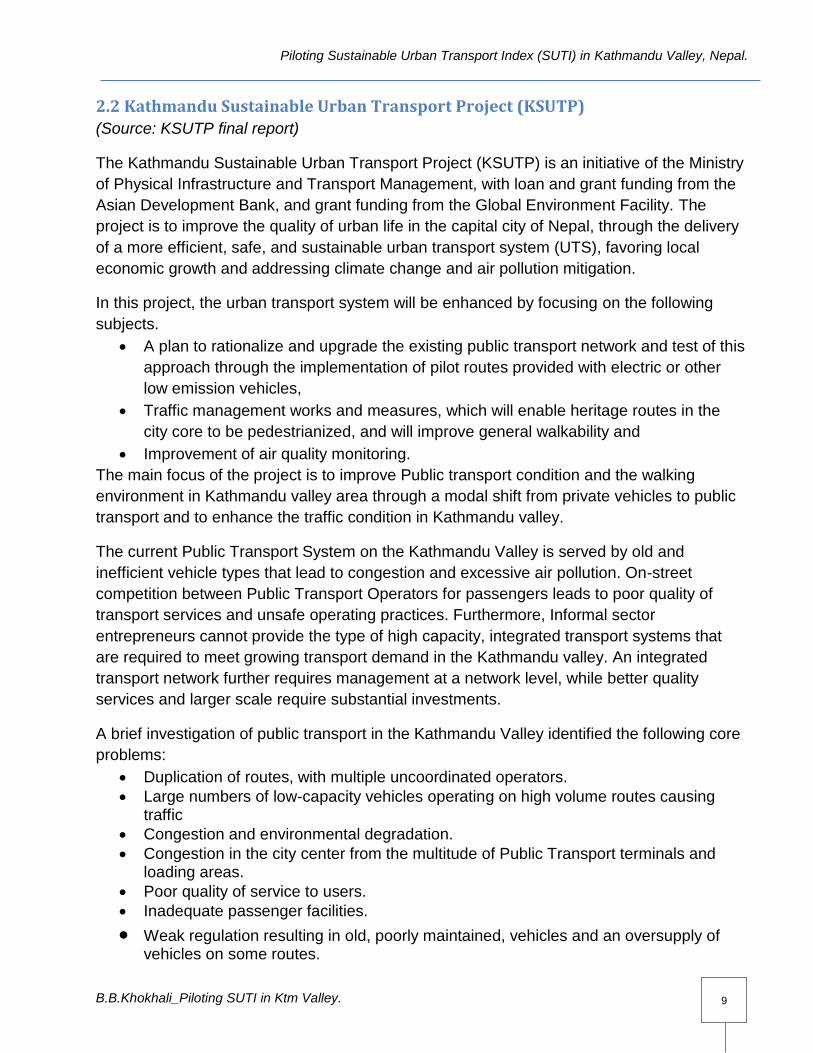
2.2 Kathmandu Sustainable Urban Transport Project (KSUTP)
(Source: KSUTP final report)
The Kathmandu Sustainable Urban Transport Project (KSUTP) is an initiative of the Ministry
of Physical Infrastructure and Transport Management, with loan and grant funding from the
Asian Development Bank, and grant funding from the Global Environment Facility. The
project is to improve the quality of urban life in the capital city of Nepal, through the delivery
of a more efficient, safe, and sustainable urban transport system (UTS), favoring local
economic growth and addressing climate change and air pollution mitigation.
In this project, the urban transport system will be enhanced by focusing on the following
subjects.
• A plan to rationalize and upgrade the existing public transport network and test of this
approach through the implementation of pilot routes provided with electric or other
low emission vehicles,
• Traffic management works and measures, which will enable heritage routes in the
city core to be pedestrianized, and will improve general walkability and
• Improvement of air quality monitoring.
The main focus of the project is to improve Public transport condition and the walking
environment in Kathmandu valley area through a modal shift from private vehicles to public
transport and to enhance the traffic condition in Kathmandu valley.
The current Public Transport System on the Kathmandu Valley is served by old and
inefficient vehicle types that lead to congestion and excessive air pollution. On-street
competition between Public Transport Operators for passengers leads to poor quality of
transport services and unsafe operating practices. Furthermore, Informal sector
entrepreneurs cannot provide the type of high capacity, integrated transport systems that
are required to meet growing transport demand in the Kathmandu valley. An integrated
transport network further requires management at a network level, while better quality
services and larger scale require substantial investments.
A brief investigation of public transport in the Kathmandu Valley identified the following core
problems:
• Duplication of routes, with multiple uncoordinated operators.
• Large numbers of low-capacity vehicles operating on high volume routes causing traffic
• Congestion and environmental degradation.
• Congestion in the city center from the multitude of Public Transport terminals and loading areas.
• Poor quality of service to users.
• Inadequate passenger facilities.
• Weak regulation resulting in old, poorly maintained, vehicles and an oversupply of vehicles on some routes.

Piloting Sustainable Urban Transport Index (SUTI) in Kathmandu Valley, Nepal.
B.B.Khokhali_Piloting SUTI in Ktm Valley. 10
3. Data Collection approach for SUTI For the data collection, the primary data collection has been the first priority and since in
some cases where primary data collection takes more time, secondary data has been used
from most recent and relevant studies mentioned above.
• The population data is taken from the CBS 2011‘s projection for 2015.
• The subjective data is derived from the expert group meeting of Kathmandu, Nepal
o Act. Secretary of Ministry of Physical Planning, Infrastructure and Transport
(MoPIT), Mr. Keshab Sharma,
o Transport Expert Er. Kamal Pande,
o Transport Expert Dr. Surya raj Acharya,
o Joint Secretary, MoPIT, Su.Er. Sushil Babu Regmi,
o Unescap’s Expert Dr. Madan Bandhu Regmi.
• Trip calculation, Modal share pattern, convenient access to public transport, working
and educational population is taken from Data Collection Survey on Traffic
Improvement in Kathmandu Valley (2012) and Detailed Planning Survey (2013)
conducted by JICA in coordination with the Government of Nepal.
• Public transport quality and reliability is done through the random surveying in three
different locations.
• Traffic fatalities and accident data is provided by Nepal Traffic Police Department.
• The mean household income is based on a single income in household with minimum
government salary. Target to lowest income groups. The data available from website
of Ministry of finance.
• Since there are 99% private investments in public road transport it was very difficult
to calculate every stakeholder companies and agencies or person’s market share and
ticket price. As the government has provided the per km fees for bus, microbus, taxi
etc, so that was taken into consideration for average trip per capita rate which was
NRs. 15 per ticket.
• For the operational cost of transport services, one semi government company’s
details have been analyzed and it was generalized with the help of meeting held in
Ministry with the presence of local transport experts.
• In case of investment in public transport, Sajha bus is one of the public transport
service provider, and as per the red book of Ministry of finance fiscal year 2072/73
i.e.2015/16 all the transport budget and expenditures within the Ministry of Physical
Planning, Infrastructure and Transport have been analyzed and data are driven from
that. The latest Red book only contains budget projection and not expenditure so it
was not used. Major road widening, road improvement, etc are focused for the
movability of the urban roads within the Kathmandu valley so it is considered as
transport system investments.
• The traffic lights, footpath renovation and upgrading data was not available at the
moment and will be included in the final report if available.

Piloting Sustainable Urban Transport Index (SUTI) in Kathmandu Valley, Nepal.
B.B.Khokhali_Piloting SUTI in Ktm Valley. 11
• It has been found that Department of Road, DOR invest 70% of Kathmandu valley
budget regarding road construction and maintenance in terms of expenditure.
• As per the WHO website and Research done by NHRC and MOH, Government of
Nepal. 2015. Situation analysis of the ambient air pollution and respiratory; Annual
Mean of PM10 is 88micro gram per cu.m in 2013 which is derived from annual mean
of PM2.5= 49microgram per cum.
• 2016 AD was the year when massive road widening, melamchi water supply pipe line
laying and construction was done within the Kathmandu valley and one random
sample study shows that the 24 hrs maximum data available for that day was 180
micro grams per cu.m.
• The recent PM10 annual average data was not available because the Department of
Environment, Nepal usually don’t calculate the annual average. It calculates 24 hrs
averages of PM1, PM2.5, PM10, TSP etc.
• The vehicle registered till date is taken from the website of Department of transport
management of Kathmandu valley.
• The greenhouse gas emission was referenced from the Nepal Second National
Communication by Ministry of Environment, Nepal.
• The consumption of petrol and diesel was taken from Nepal Oil corporation website
and personnel’s information from Thankot Depot.
4. Sustainable Urban Transport Index, SUTI. The Ten indicators of SUTI is as follows.
4.01 Indicator 1: Extent to which transport plans cover public transport, intermodal facilities
and infrastructure for active modes
4.02 Indicator 2: Modal share of active and public transport in commuting
4.03 Indicator 3: Convenient access to public transport service
4.04 Indicator 4: Public transport quality and reliability
4.05 Indicator 5: Traffic fatalities per 100,000 inhabitants
4.06 Indicator 6: Affordability – travel costs as part of income
4.07 Indicator 7: Operational costs of the public transport system
4.08 Indicator 8: Investment in public transportation systems
4.09 Indicator 9: Air quality (PM10)
4.10 Indicator 10: Greenhouse gas emissions (CO2eq tons/year)
Piloting Sustainable Urban Transport Index (SUTI) in Kathmandu Valley, Nepal.
B.B.Khokhali_Piloting SUTI in Ktm Valley. 12
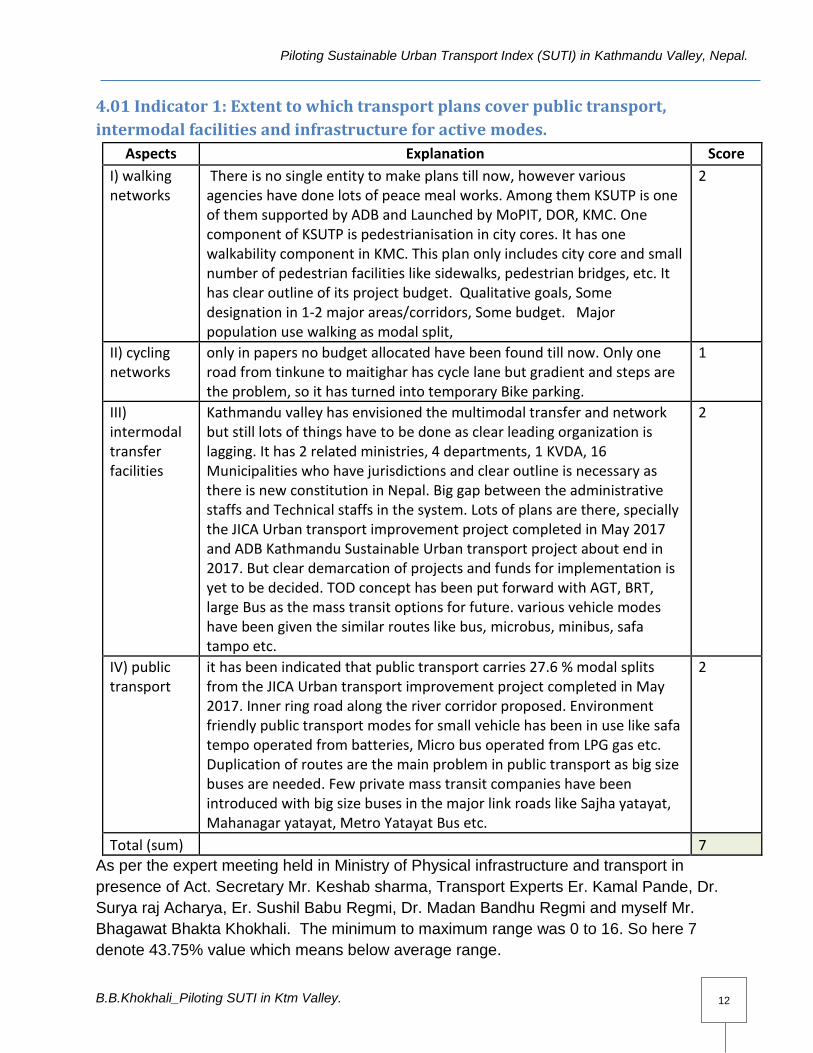
4.01 Indicator 1: Extent to which transport plans cover public transport,
intermodal facilities and infrastructure for active modes.
Aspects Explanation Score
I) walking networks
There is no single entity to make plans till now, however various agencies have done lots of peace meal works. Among them KSUTP is one of them supported by ADB and Launched by MoPIT, DOR, KMC. One component of KSUTP is pedestrianisation in city cores. It has one walkability component in KMC. This plan only includes city core and small number of pedestrian facilities like sidewalks, pedestrian bridges, etc. It has clear outline of its project budget. Qualitative goals, Some designation in 1-2 major areas/corridors, Some budget. Major population use walking as modal split,
2
II) cycling networks
only in papers no budget allocated have been found till now. Only one road from tinkune to maitighar has cycle lane but gradient and steps are the problem, so it has turned into temporary Bike parking.
1
III) intermodal transfer facilities
Kathmandu valley has envisioned the multimodal transfer and network but still lots of things have to be done as clear leading organization is lagging. It has 2 related ministries, 4 departments, 1 KVDA, 16 Municipalities who have jurisdictions and clear outline is necessary as there is new constitution in Nepal. Big gap between the administrative staffs and Technical staffs in the system. Lots of plans are there, specially the JICA Urban transport improvement project completed in May 2017 and ADB Kathmandu Sustainable Urban transport project about end in 2017. But clear demarcation of projects and funds for implementation is yet to be decided. TOD concept has been put forward with AGT, BRT, large Bus as the mass transit options for future. various vehicle modes have been given the similar routes like bus, microbus, minibus, safa tampo etc.
2
IV) public transport
it has been indicated that public transport carries 27.6 % modal splits from the JICA Urban transport improvement project completed in May 2017. Inner ring road along the river corridor proposed. Environment friendly public transport modes for small vehicle has been in use like safa tempo operated from batteries, Micro bus operated from LPG gas etc. Duplication of routes are the main problem in public transport as big size buses are needed. Few private mass transit companies have been introduced with big size buses in the major link roads like Sajha yatayat, Mahanagar yatayat, Metro Yatayat Bus etc.
2
Total (sum) 7
As per the expert meeting held in Ministry of Physical infrastructure and transport in
presence of Act. Secretary Mr. Keshab sharma, Transport Experts Er. Kamal Pande, Dr.
Surya raj Acharya, Er. Sushil Babu Regmi, Dr. Madan Bandhu Regmi and myself Mr.
Bhagawat Bhakta Khokhali. The minimum to maximum range was 0 to 16. So here 7
denote 43.75% value which means below average range.
Piloting Sustainable Urban Transport Index (SUTI) in Kathmandu Valley, Nepal.
B.B.Khokhali_Piloting SUTI in Ktm Valley. 13
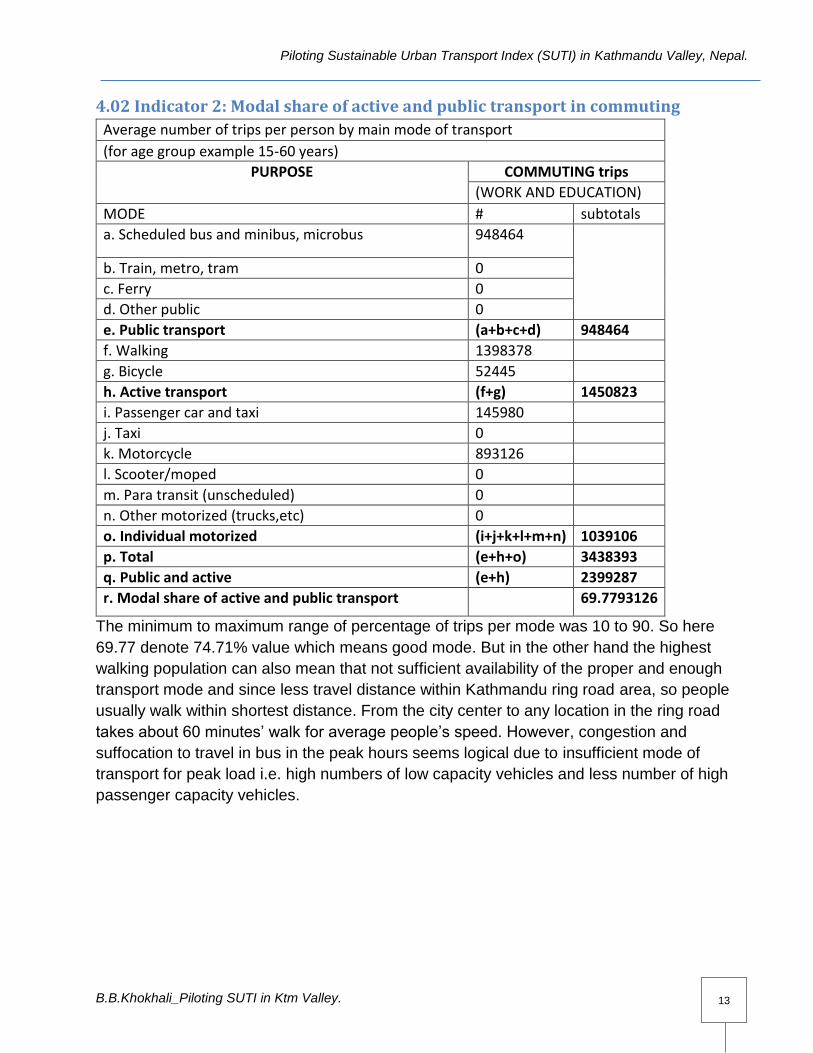
4.02 Indicator 2: Modal share of active and public transport in commuting
Average number of trips per person by main mode of transport
(for age group example 15-60 years)
PURPOSE COMMUTING trips
(WORK AND EDUCATION)
MODE # subtotals
a. Scheduled bus and minibus, microbus 948464
b. Train, metro, tram 0
c. Ferry 0
d. Other public 0
e. Public transport (a+b+c+d) 948464
f. Walking 1398378
g. Bicycle 52445
h. Active transport (f+g) 1450823
i. Passenger car and taxi 145980
j. Taxi 0
k. Motorcycle 893126
l. Scooter/moped 0
m. Para transit (unscheduled) 0
n. Other motorized (trucks,etc) 0
o. Individual motorized (i+j+k+l+m+n) 1039106
p. Total (e+h+o) 3438393
q. Public and active (e+h) 2399287
r. Modal share of active and public transport 69.7793126
The minimum to maximum range of percentage of trips per mode was 10 to 90. So here
69.77 denote 74.71% value which means good mode. But in the other hand the highest
walking population can also mean that not sufficient availability of the proper and enough
transport mode and since less travel distance within Kathmandu ring road area, so people
usually walk within shortest distance. From the city center to any location in the ring road
takes about 60 minutes’ walk for average people’s speed. However, congestion and
suffocation to travel in bus in the peak hours seems logical due to insufficient mode of
transport for peak load i.e. high numbers of low capacity vehicles and less number of high
passenger capacity vehicles.

Piloting Sustainable Urban Transport Index (SUTI) in Kathmandu Valley, Nepal.
B.B.Khokhali_Piloting SUTI in Ktm Valley. 14
4.03 Indicator 3: Convenient access to public transport service
Bus Stations are very nearby within 500m distance and multiple modes of transport use
similar stations nearby the city areas. We have identified the bus stations and stops within
the ring road are within the interval of less than 500meters and inner roads have small
vehicle routes too and they seem to stop any where the passenger wants. Hence as per the
Data Collection Survey on Traffic Improvement in Kathmandu Valley (2012) and Detailed
Planning Survey (2013) conducted by JICA in coordination with the Government of Nepal
85% of population have easy access to public transport. The minimum to maximum range of
percentage of population with easy access to public transport was 20 to 100. So here 85%
denote 81.25% value which means good accessibility.
4.04 Indicator 4: Public transport quality and reliability
Population satisfied with the public transportation is calculated with the random survey of the
public transport users and about 33.33% are only satisfied with the service provided. About
20.00% populations have average opinion and 46.67% Populations are dissatisfied with the
services one way or the other. The minimum to maximum range of satisfaction was 30 to 95.
So here 33.33 is near to the lowest range. We too have noted that the sample population for
primary survey was very low compared to sampling standard i.e. 3% of total population but
due to the time and budget constraint, it was not able to do random survey of 86,320 people
all over Kathmandu valley. Since we have no related data from the previous studies, we
chose to do the small sampling of random population.
Piloting Sustainable Urban Transport Index (SUTI) in Kathmandu Valley, Nepal.
B.B.Khokhali_Piloting SUTI in Ktm Valley. 15
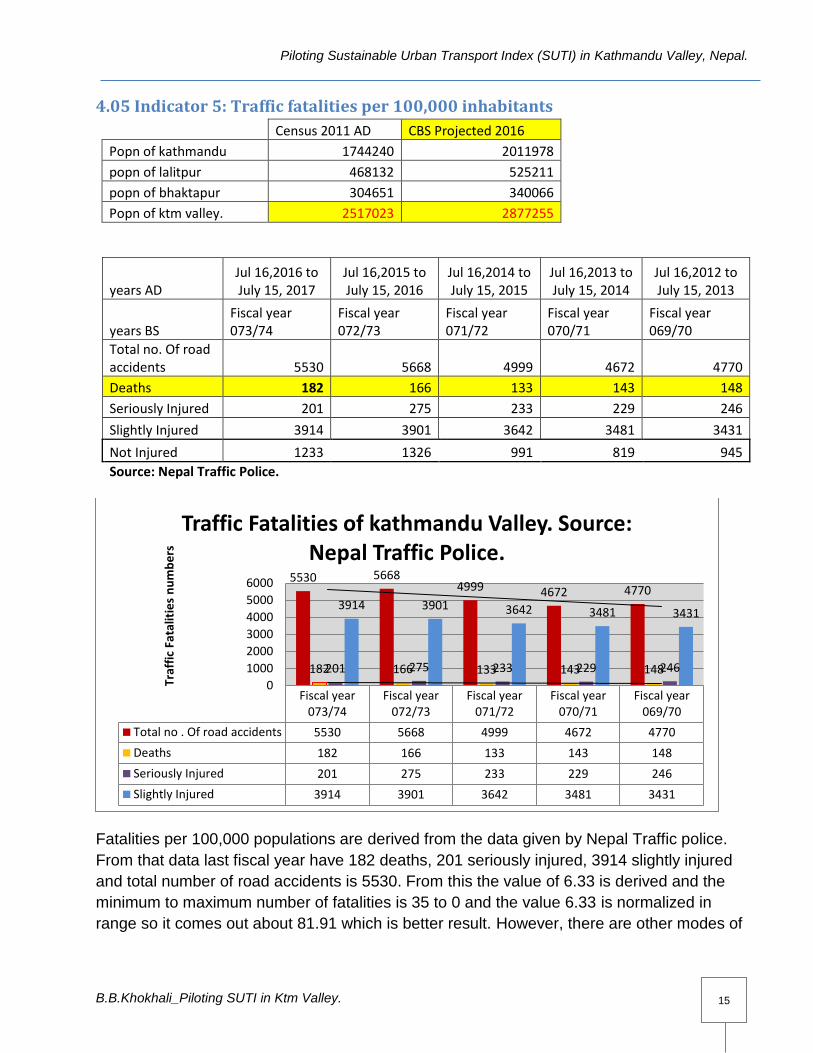
4.05 Indicator 5: Traffic fatalities per 100,000 inhabitants
Census 2011 AD CBS Projected 2016
Popn of kathmandu 1744240 2011978
popn of lalitpur 468132 525211
popn of bhaktapur 304651 340066
Popn of ktm valley. 2517023 2877255
years AD Jul 16,2016 to July 15, 2017
Jul 16,2015 to July 15, 2016
Jul 16,2014 to July 15, 2015
Jul 16,2013 to July 15, 2014
Jul 16,2012 to July 15, 2013
years BS Fiscal year 073/74
Fiscal year 072/73
Fiscal year 071/72
Fiscal year 070/71
Fiscal year 069/70
Total no. Of road accidents 5530 5668 4999 4672 4770
Deaths 182 166 133 143 148
Seriously Injured 201 275 233 229 246
Slightly Injured 3914 3901 3642 3481 3431
Not Injured 1233 1326 991 819 945
Source: Nepal Traffic Police.
Fatalities per 100,000 populations are derived from the data given by Nepal Traffic police.
From that data last fiscal year have 182 deaths, 201 seriously injured, 3914 slightly injured
and total number of road accidents is 5530. From this the value of 6.33 is derived and the
minimum to maximum number of fatalities is 35 to 0 and the value 6.33 is normalized in
range so it comes out about 81.91 which is better result. However, there are other modes of
Fiscal year073/74
Fiscal year072/73
Fiscal year071/72
Fiscal year070/71
Fiscal year069/70
Total no . Of road accidents 5530 5668 4999 4672 4770
Deaths 182 166 133 143 148
Seriously Injured 201 275 233 229 246
Slightly Injured 3914 3901 3642 3481 3431
5530 56684999 4672 4770
182 166 133 143 148201 275 233 229 246
3914 3901 3642 3481 3431
0
1000
2000
3000
4000
5000
6000
Traf
fic
Fata
litie
s n
um
be
rs
Traffic Fatalities of kathmandu Valley. Source: Nepal Traffic Police.

Piloting Sustainable Urban Transport Index (SUTI) in Kathmandu Valley, Nepal.
B.B.Khokhali_Piloting SUTI in Ktm Valley. 16
calculating this with accident per km distance covered but the availability of detail data is not
possible at the moment.
4.06 Indicator 6: Affordability – travel costs as part of income
In many cases the family with 5 numbers are prominent in Kathmandu valley with only one
person with regular income, hence national mean household income standard is not being
used. In case the mean income is based on a single income in household with minimum
government salary. (Targeted to lowest income groups.) It is calculated as per the annual
ridership from total trips and calculating with monthly ticket price with daily 4 shifts.
The interchange of vehicles are available in junctions of ring road or in the city centre so to
travel average of 5km per day usually need 1 interchange in one trip so the cost will be
different. First disjointed trip = Rs.15 and Second disjointed trip after interchange of vehicles
= Rs. 15 so the base is Rs 30 per one full trip with one interchange. so daily Rs 60 per day
is needed for public transport. since we don't have adjoining ticket system here in
Kathmandu, we have added the ticket numbers from 60 to 120 instead.
public vehicle trips 948464
min salary of govt. per month 16230
Hence the value comes out to be 11.1 which after normalizing comes out to be75.87 which
is near to maximum range.
4.07 Indicator 7: Operational costs of the public transport system
It is calculated by calculating per bus fare revenue with its transport operating costs, and
whole multiplying by number of buses. Based on the survey conducted in 2011 by JICA
study team, the number of bus routes was 220, the number of buses was 5305 the number
of operations was 32,835 within the Kathmandu valley.
Average monthly income per bus: Rs. 291,866,
Average operation cost of Rs. 2,82,266 is used in a bus which is 96.68% of ticket income
and 72.28% of total income. So, from this the farebox ratio is 102.4% which is close to
minimum range of about 52.55%.
As per the experts’ review this is the fare evaluation.

Piloting Sustainable Urban Transport Index (SUTI) in Kathmandu Valley, Nepal.
B.B.Khokhali_Piloting SUTI in Ktm Valley. 17

Piloting Sustainable Urban Transport Index (SUTI) in Kathmandu Valley, Nepal.
B.B.Khokhali_Piloting SUTI in Ktm Valley. 18
4.08 Indicator 8: Investment in public transportation systems
Only road network available in KV with 12.30% of total national transport budget invested in
Kathmandu valley. Very nominal direct investment in transport and only focused in PPP
model as 99% public road transport is done by Private parties. Data source: ministry of
finance red book 2072/73, Department of Roads.
As per the Red book of Ministry of finance FY2072/73
in thousands Budget '000 expenditures,000 estimated expenditures
Ktm Bkt road widening 1,074,334.00
897,963.02
Ktm valley road construction and dev
496,280.00
414,806.84
KV road widening project 1,159,195.00
968,892.59
KSUTP 1,201,563.00
1,004,305.13
Ringroad expansion 1,134,329.00
948,108.78
ktm- Naubise tunnel road 1,669,359.00
1,395,304.12
total road projects in KV 6,735,060.00
5,629,380.47
5,629,380.47
83.58%
Ministry (MOPIT) total national budget
48,381,835.00
45,770,262.00
94.60%
Here regarding the transport improvement expenses, KSUTP project’s annual expenses is
used to compare with Kathmandu’s total expenses.
From this the value comes out to be 17.84 which after normalizing comes out to be 35.68%
which seems pretty low to lowest margin for the government investment and priority.

Piloting Sustainable Urban Transport Index (SUTI) in Kathmandu Valley, Nepal.
B.B.Khokhali_Piloting SUTI in Ktm Valley. 19
4.09 Indicator 9: Air quality (PM10)
PM10 (Particulate Matter with Aerodynamic Diameter 10 Micron or Less)
As per the National Ambient air quality standards of Nepal, 2012; the national standards are
as follows.
Total suspended Particulates = 24 hours average = 230 microgram per cu.m.
PM10 = 24 hours average = 120 microgram per cu.m.
PM 2.5 = 24 hours average = 40 microgram per cu.m.
As per the WHO website, Annual Mean of PM10 is 88 micro grams per cu. m in 2013 which
is derived from annual mean of PM 2.5= 49microgram per cum. Research done by NHRC
and MOH, Government of Nepal. 2015. Situation analysis of the ambient air pollution and
respiratory.
Annual averages during 2003 to 2005 shows good improving trend coming down to 121
μg/m3 in 2005 from 129μg/m3 in 2004 and 134 ug/m3in 2003, although these values are
also 6 to 7 times higher than the WHO guideline.
After using PM10 as 88 μg/m3 and normalizing the data the value of 44.29 comes out which
is better than before.

Piloting Sustainable Urban Transport Index (SUTI) in Kathmandu Valley, Nepal.
B.B.Khokhali_Piloting SUTI in Ktm Valley. 20
4.10 Indicator 10: Greenhouse gas emissions (CO2eq tons/year)
Base Year 1990: The national GHG inventory (base year 1990) includes estimation of CO2
emissions from energy consumption and cement production, CH4 emission from flooded rice
cultivation, livestock farming and biomass burning and N2O emission from fertilizer. However,
the inventory does not specify GHG contribution from the LULUCF and waste sector. The
GHG emission by different end use sectors as estimated in the 1990 inventory clearly shows
that fossil fuel consumption dominated the CO2 emission. Fuel combustion =912.96 Gg =
carbon dioxide emission.
Base Year 1994: Nepal‟s Initial National Communication (INC) Report provides information
on GHG (CO2, CH4, and N2O) sources and sinks, and estimates of emission and removals for
the base year 1994/95. Emission is reported under five categories: energy, industrial
processes, agriculture, land use change and forestry (LUCF), and waste. In the 1994
inventory, using the GWP factors, the total emission of the main GHGs was estimated at
39265 Gg of CO2 equivalents. Of this, CO2, CH4, and N2O constituted 25, 51, and
24%respectively. Of the five categories included in the inventory, the LULUCF sector was the
largest contributor of CO2 followed by the energy sector. The LULUCF sector also
sequestered about 64.5% equivalent of its CO2 emission. As expected, agriculture and solid
waste sectors were found to be the main contributors to the emission of CH4 and N2O
respectively.
Base Year 2000: The 2000 inventory provides information on Nepal‟s anthropogenic emission
of direct GHGs (CO2, CH4, and N2O) and indirect GHGs (NOx, CO, NMVOC, and SO2) by
sources and removals by sinks from the sectors of energy, industrial process, agriculture,
LULUCF, and waste. Consistent with UNFCCC reporting guidelines (UNFCCC, 2006),
indirect GHGs are not included in the total GHG emission.
Transport sector= 818 Gg CO2 emission (817.6 Gg)
(1 gigagram =1000 metric ton)
It is estimated that the transport sector emitted 822.62Gg of CO2eq in 2000/01, of which
817.63Gg was emitted as CO2, 0.09 Gg as CH4 and 0.01Gg as N2O. About 83%of the
emission of CO2 was due to diesel combusted in this activity. The transport sector emitted 9
Gg, 25 Gg, 5 Gg and 1 Gg of NOx, CO, NMVOC and SO2 respectively.
It is well known that CO2 emission result from the release of carbon in the fuel during
combustion and the quantity of emission depends not only on the quantity of the fuel
combusted, but also on the carbon content of the fuel, type of the combustion technology,
age of equipment, operation and maintenance practices. Most of the carbon is emitted as
CO2 immediately during the combustion process.

Piloting Sustainable Urban Transport Index (SUTI) in Kathmandu Valley, Nepal.
B.B.Khokhali_Piloting SUTI in Ktm Valley. 21
2015 projected
Bau scenario 1714.93
MG Scenario 1739.31
HG Scenario 2095.03
Average Co2 1849.756667Gg
From this average value of CO2 as 1849.75Gg, the carbon dioxide emission per capita
indicator value comes to be 0.64.
From the fuel consumption within the Kathmandu valley, the CO2 emission is 879.277 Gg.
And the carbon dioxide emission per capita indicator value comes to be 0.31 hence this
value has been used. After normalizing this value comes to be 88.73 which is good till now.
Source: Nepal second national communication to united nations framework convention on
climate change, December 2014.
Fuel consumption in last five years within Kathmandu valley

Piloting Sustainable Urban Transport Index (SUTI) in Kathmandu Valley, Nepal.
B.B.Khokhali_Piloting SUTI in Ktm Valley. 22
Fiscal Year MS / Petrol HSD / Diesel SKO / Kerosine
2073/74 149,663,000
201,538,700
5,405,264
2072/73 93,002,000
135,228,600
4,516,057
2071/72 113,216,976
148,837,306
7,678,090
2070/71 103,262,000
135,228,600
9,004,405
2069/70 90,002,800
119,771,613
10,977,232
Source : Nepal Oil Corporation, Thankot Depot.
Note: In FY 2072/73, India border blocked so fuel shortage.
5. Conclusion: From all these indicators the Suti result comes out as follows.
INDEX Arithmetic 58.39
INDEX Arithmetic using weights
58.39
INDEX Geometric mean 47.80
0.00
20.00
40.00
60.00
80.00
100.00
Extent to which transportplans cover public
transport, intermodalfacilities and…
Modal share of active andpublic transport in
commuting
Convenient access topublic transport service
Public transport qualityand reliability
Traffic fatalities per100.000 inhabitants
Affordability – travel costs as part of income
Operational costs of thepublic transport system
Investment in publictransportation systems
Air quality (pm10)
Greenhouse gas emissionsfrom transport

Piloting Sustainable Urban Transport Index (SUTI) in Kathmandu Valley, Nepal.
B.B.Khokhali_Piloting SUTI in Ktm Valley. 23
From this data, we came to conclude that the following results.
• Firstly, the public transport quality and reliability has a biggest problem in Kathmandu
valley and this should be considered by the authority immediately.
• Secondly the Investment in public transportation system has to be revised and
updated and clear focus should be given to modes of transport and as per the trips
we came to know that major mode is walking, and wide pedestrian friendly roads
need to be built and modified. Now Vehicles are getting 1st priority, but from the
results it came to note that pedestrian should get first priority.
• Active modes of transport have to be prioritized in the city planning, our plans and
programs should be focused as per the modal shares and public transport facilities.
• Air quality needs to be improved by using environment friendly vehicles. Though here
we have considered PM10 in the indicators, the Total suspended particles in our
roads are much worse than PM10. Huge projects like Melamchi water supply pipe
line installment project, Upcoming Underground utility duct projects will ultimately
contribute to the rise in Total suspended particles in the roads while construction all
over the Kathmandu valley.
• Greenhouse gas emission is pretty satisfactory as the emission is less by vehicles
which seems that transport sector contributes around 17% of total carbon emissions
within the valley. From the various studies we came to know that carbon emission is
low in least developed countries than the developed countries.
• Though the farebox ratio of the transport sector is 102.4%, there are lots of private
companies sustaining in Kathmandu valley and they are flourishing as well. They
have reduced the expenses and maintained the profit of about 15-20% as per the
expert review discussion held in the ministry.
• In case of traffic fatalities, the data shows the good condition, however the accident
trends and growth of fatalities shows the increasing trends of last five years which is
bad.
• From the study we came to know that 85% of the population has convenient access
to public transport that means they lie within 500m of bus stops. This may be due to
repetition of multiple modes in adjoining lanes and the distance between most of the
bus stops less than 500m.
• Regarding the modal shares of the public and active transport, the result is good. But
the limitation might be the affordability of the people, mostly unemployed population
used to travel through active modes that is why the modal shares can be good.
Overall result of SUTI of Kathmandu valley is 47.80 in geometric mean and 58.39 in
arithmetic mean. This is pretty low in average. Only 2 indicators show good
performance. This data has been approved through the expert group meetings as
well.

Piloting Sustainable Urban Transport Index (SUTI) in Kathmandu Valley, Nepal.
B.B.Khokhali_Piloting SUTI in Ktm Valley. 24
In conclusion, SUTI indicators help the city authorities to do the SWOT analysis (Strength,
Weakness, Opportunities, and Threats) of the transport infrastructures and management as
well. We are ready to use it in new towns development areas by analyzing through the SUTI
indicators while urban planning. Four of the large scale new town projects are in the
pipelines. We will also submit this to the ministries and departments so that the cities of new
federal republic of Nepal would be sustainable and accommodate these indicators while
planning and implementation stage as well. We have already talked with the mayor and
deputy mayor of metropolitans of Kathmandu Metropolitan city and Lalitpur Metropolitan city
and will share this with them as well. The problem we face nowadays is the leading authority
to solely look after transport sector within the Kathmandu valley as one unit. Multiple
agencies have created the piece meal works but not all over valley level. Need for proper
level of transport planning and incorporating it with overall master plan of Kathmandu valley
is the biggest challenges that we face today.
Annexes:
• The detail analysis data sheet.
Note:
• Review and guidance by Dr. Surya Raj Acharya, Transport specialist.
• Institutional support by Dr. Bhaikaji Tiwari, Development Commissioner, Kathmandu
Valley Development Authority, Ministry of Urban Development and
• Mr. Sushil Babu Dhakal, Joint Secretary, Ministry of Physical Infrastructure and
Transport.