pilot study on the use of promise climate data in a crop model type and origin and of climate data ...
TRANSCRIPT
Pilot Study on the Use of PROMISE Climate Data in a
Crop Model
Type and origin and of climate data Daily, at 2m (Tmax, Tmin, Rs, Hum, wind, rain)
1950-79 (obs + sim), 2010-39 (sim)
Senegal (6 points sim, 13 stations obs)
Preliminary simulations with ARPEGE (MF Bordeaux)
Station data from Cirad-Agrhymet data base
H Syabuddin, JC Combres, JF Royer, M Dingkuhn

Crop Model Preliminary version of SARRA-H
Calibrated for peanut using CERAAS data (Senegal)
Photoperiodism inactivated, crop duration = f(Temp)
Sowing date sensitive to rainfall (farmer ’s criteria)
Water and Rs limited growth & yield
Rooting depth limited by wetting front
21 3
5 6 7
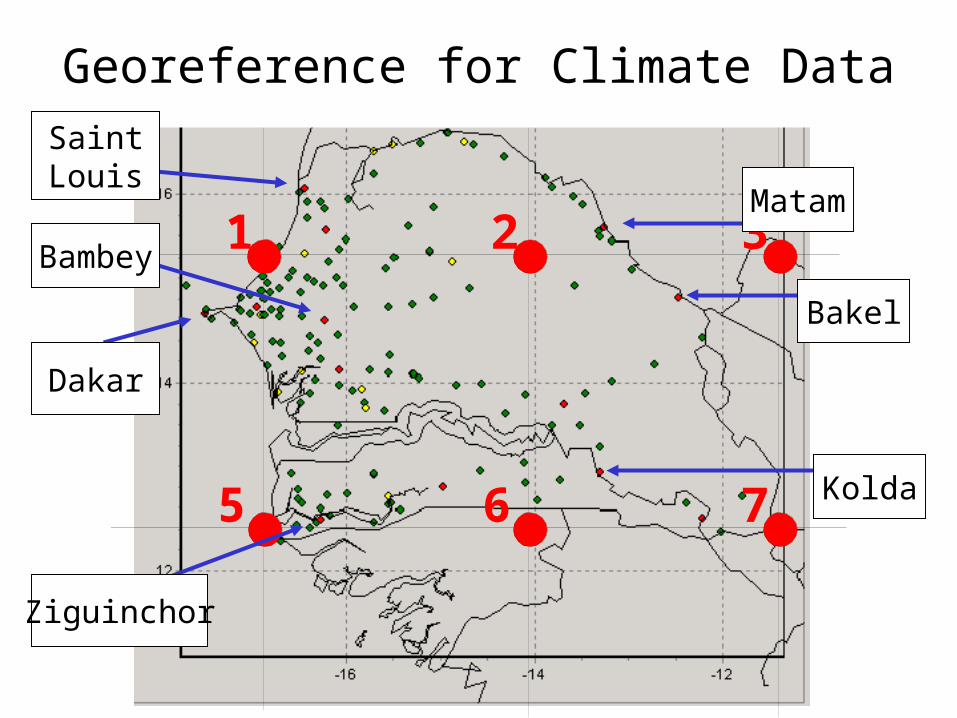
Georeference for Climate DataSaintLouis
Dakar
Ziguinchor
Bakel
Bambey
Matam
Kolda

Evaluation of ARPEGE Climate Simulations
Simulations for Senegal in 1950-79 show…
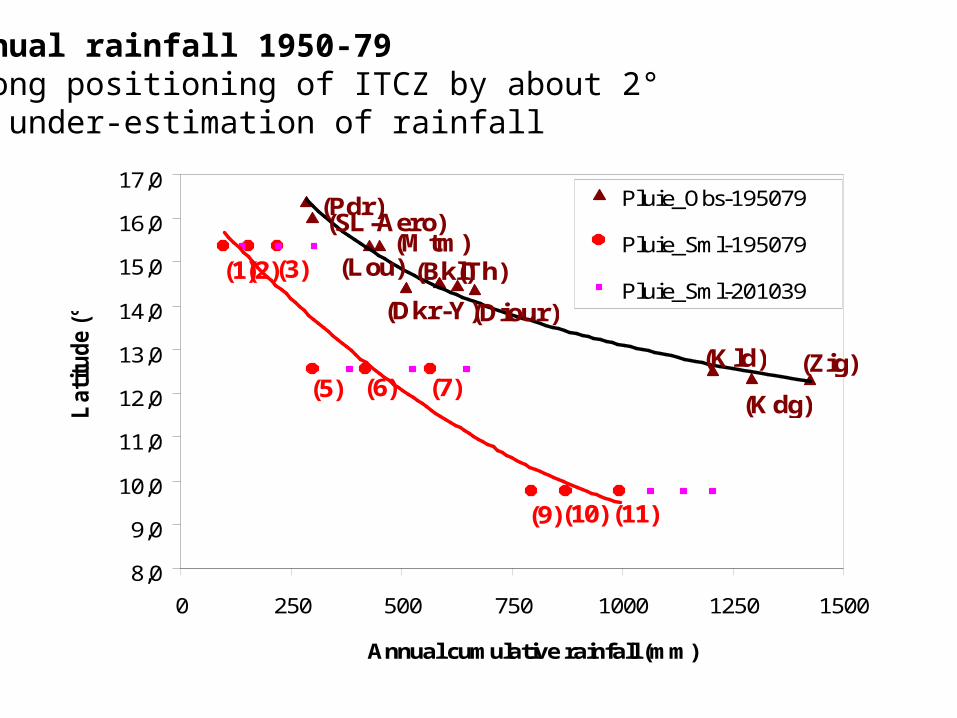
• A strong under-estimation of annual rainfall due to an inaccurate positioning of the Inter-Tropical Convergence Zone (ITCZ)
• An under-estimation of the N-S climatic gradient
• An over-estimation of the E-W climatic gradient (coast-to-continent)
• A strong under-estimation of diurnal temperature amplitudes
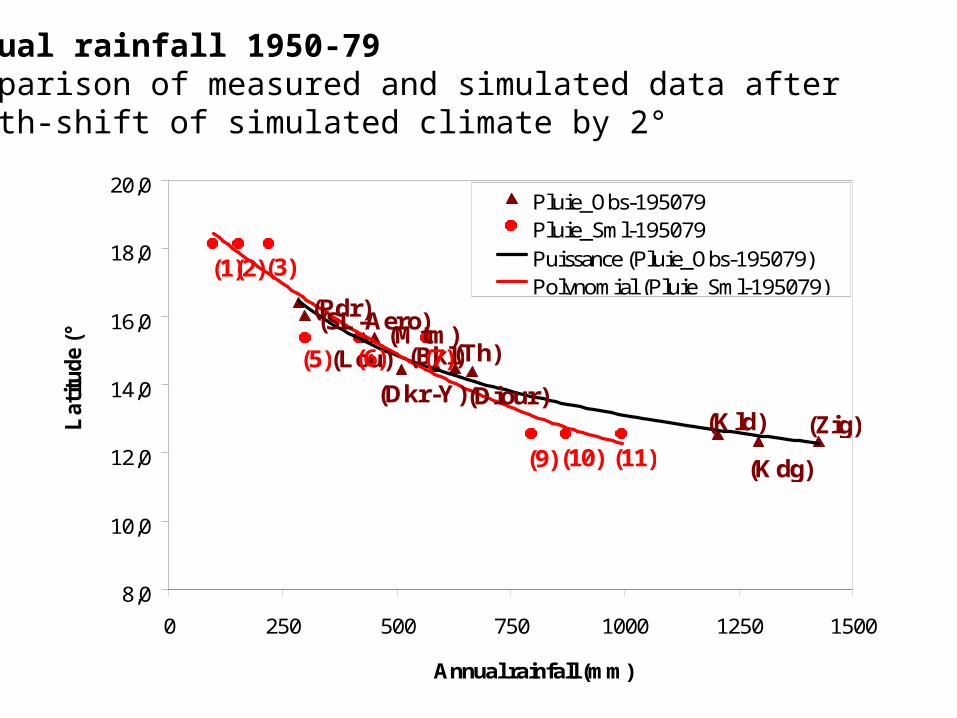
=> To permit meaningful test runs of SARRA-H, a latitudinal (north) shift of simulated climate by 2 degrees was performed
(Kld)
(Pdr)(SL-Aero)
(Mtm)(Lou)
(Dkr-Y)
(Bkl)
(Diour)
(Th)
(Kdg)
(Zig)
(11)(10)(9)
(7)(6)
(3)(2)(1)
(5)
8,0
9,0
10,0
11,0
12,0
13,0
14,0
15,0
16,0
17,0
0 250 500 750 1000 1250 1500
Annual cumulative rainfall (mm)
La
titu
de
(°)
Pluie_Obs-195079
Pluie_Sml-195079
Pluie_Sml-201039
Puissance (Pluie_Obs-195079)Polynomial(Pluie_Sml-195079)
Annual rainfall 1950-79 Wrong positioning of ITCZ by about 2° => under-estimation of rainfall
(Kld)
(Pdr)(SL-Aero)(Mtm)
(Lou)
(Dkr-Y)
(Bkl)
(Diour)
(Th)
(Kdg)
(Zig)(11)(10)(9)
(7)(6)
(3)(2)(1)
(5)
8,0
10,0
12,0
14,0
16,0
18,0
20,0
0 250 500 750 1000 1250 1500
Annual rainfall (mm)
La
titu
de
(°)
Pluie_Obs-195079Pluie_Sml-195079Puissance (Pluie_Obs-195079)Polynomial (Pluie_Sml-195079)
Annual rainfall 1950-79 Comparison of measured and simulated data after north-shift of simulated climate by 2°
Pluie décadaire observée et simuléeProbabilité humide 80 % 1950-1979
0,0
20,0
40,0
60,0
80,0
100,0
120,0
140,0
0 5 10 15 20 25 30 35 40
décade
mm
par
dé
cad
e
Bakel
Simulé PG7 80 %
Bakel(continental climate)
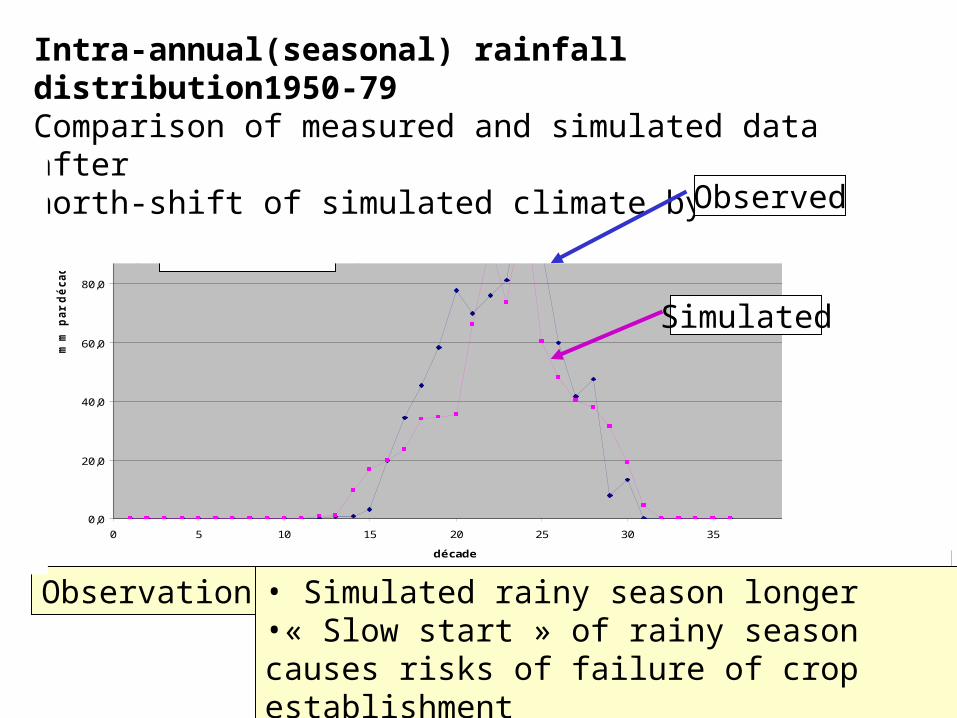
Observations: • Simulated rainy season longer•« Slow start » of rainy season causes risks of failure of crop establishment
Intra-annual(seasonal) rainfall distribution1950-79 Comparison of measured and simulated data after north-shift of simulated climate by 2°
Observed
Simulated
0
5
10
15
20
25
30
35
40
45
1 à 3 3 à 10 10 à 25 25 à 50 50 à 100 > 100
Rainfall per day (mm)
Fre
quen
cy (
%)
Obs_StLouis195079
Sml-PG5_195079
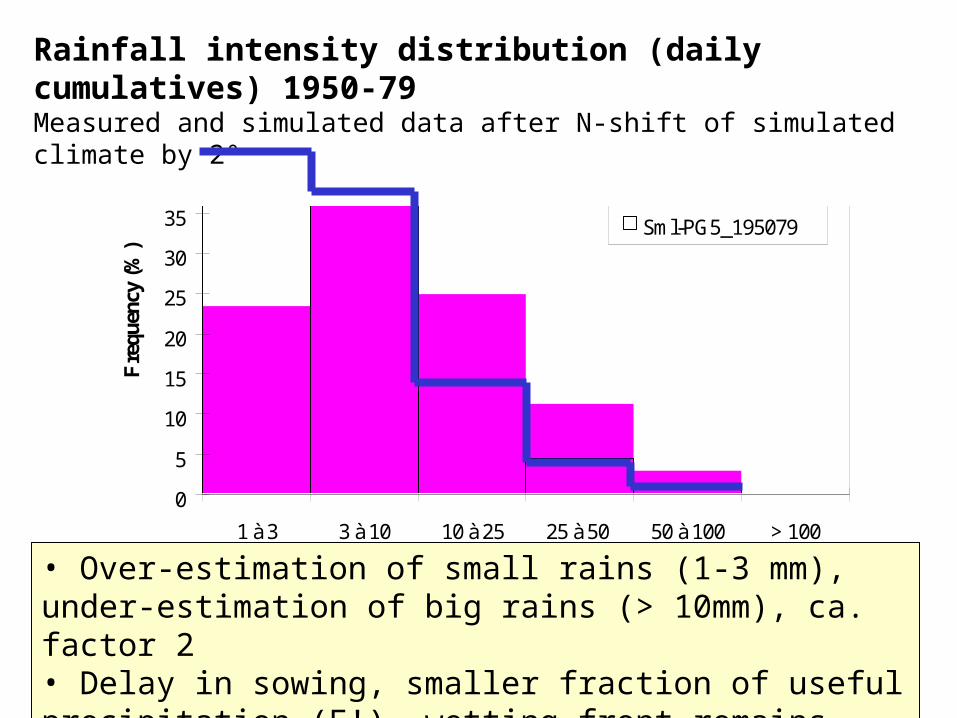
Rainfall intensity distribution (daily cumulatives) 1950-79 Measured and simulated data after N-shift of simulated climate by 2°
• Over-estimation of small rains (1-3 mm), under-estimation of big rains (> 10mm), ca. factor 2• Delay in sowing, smaller fraction of useful precipitation (E!), wetting front remains shallow (rooting depth!)

Problem: ARPEGE over-estimates rain-days by factor 1,5 to 3
Frequency of rain-days 1950-79 Measured and simulated data after N-shift of simulated climate by 2°
Pluviométrie et nombre de jours de pluie par an (moyenne 1950-1979)
No. Nom de station Pluie(mm)
Jours No. PG Pluie(mm)
Jours
1. Saint Louis AERO 298.5 34 5 300.9 61
2. Louga 427.1 36
3. Dakar YOFF 510.7 51
4. Thies 627.9 75
5. Diourbel 665.3 54
6. Matam 450.6 40 6 418.6 101
7. Podor 284.8 35
8. Bakel 585.2 45 7 566.6 133
9. Kolda 1204.2 83 9 796.1 126
10. Kedougou 1293.2 84 10 873.2 142
11. Ziguinchor 1424.8 96 11 993.8 182
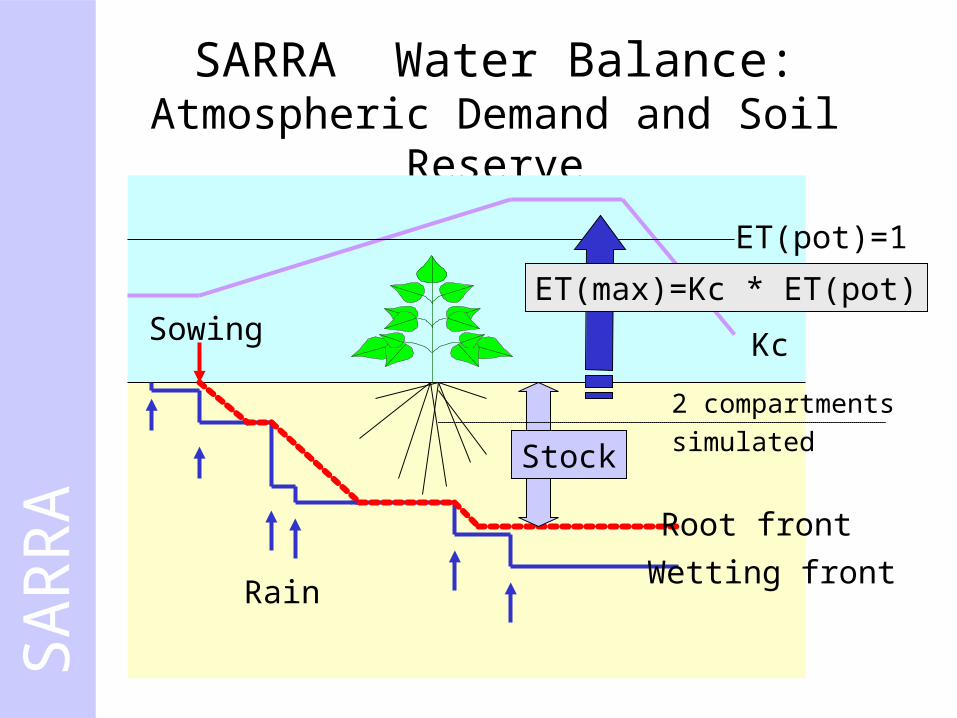
SARRA Water Balance:Atmospheric Demand and Soil Reserve
Root front
Wetting front Rain
Sowing
Stock
ET(pot)=1
Kc
2 compartments
simulated
SA
RR
A
ET(max)=Kc * ET(pot)

Rainfall
EvaporationTranspiration
Runoff
Drainage
Infiltration(=> stock)
1
2
3a
3b
4
5
Small rain event:Evaporation
Moderate rain event:Stock, Transpiration
Big rain event:Runoff, Drainage
Partitioning of Precipitation at the Plot Level
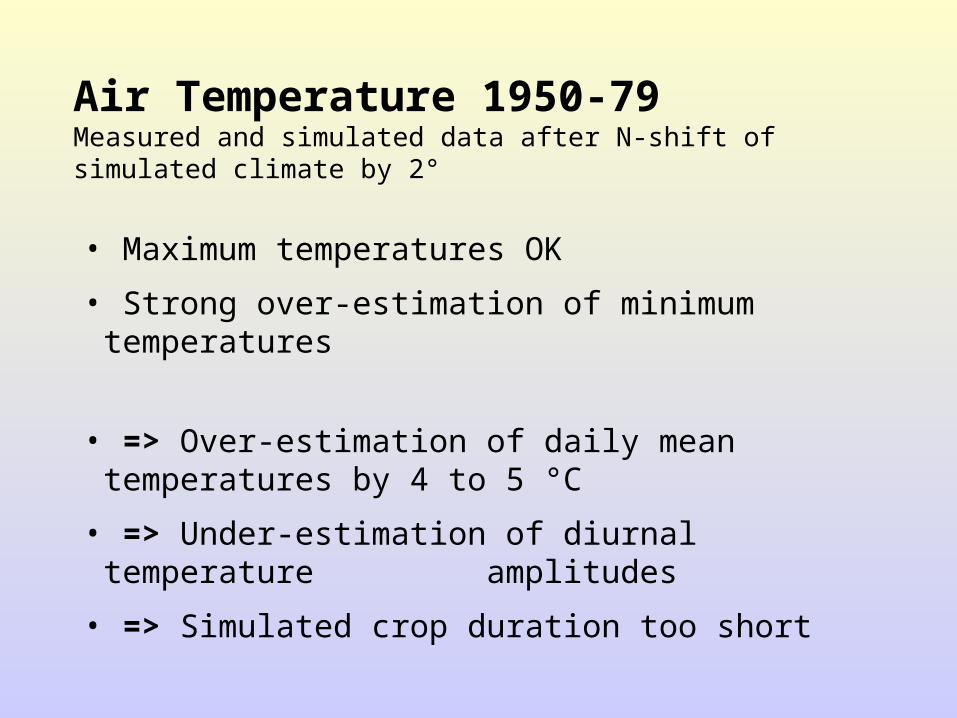
Air Temperature 1950-79 Measured and simulated data after N-shift of simulated climate by 2°
• Maximum temperatures OK
• Strong over-estimation of minimum temperatures
• => Over-estimation of daily mean temperatures by 4 to 5 °C
• => Under-estimation of diurnal temperature amplitudes
• => Simulated crop duration too short

0.0
200.0
400.0
600.0
800.0
1000.0
1200.0
1400.0
1600.0
0.2 0.5 0.8Probabilite (%)
Ren
dem
ent (
kg/h
a)
PG5_195079PG5_201039Obs-SL_195079Obs-Lou_195079Obs-Th_195079Obs-Dkr_195079
Mean simulated grain yields 1950-79 and 2010-39 (preliminary)
Thiès
DakarLougaSaint Louis
20 50 80
1950
-79
2010
-39
Probability for yields to fall below… (%)
Causes of yield under-estimation: Stress thru delayed sowing; Short crop duration (high Tmin)Causes of yield decrease: Short crop duration (rising T); Rs lower by 2-3 MJ/d in Sept/Oct
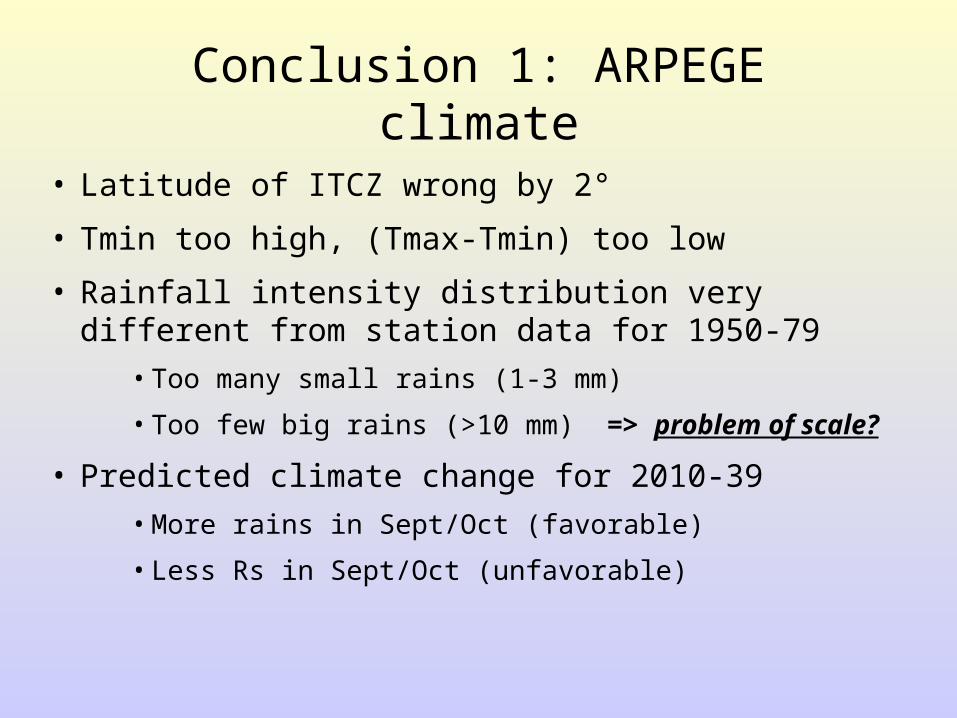
Conclusion 1: ARPEGE climate
• Latitude of ITCZ wrong by 2°
• Tmin too high, (Tmax-Tmin) too low
• Rainfall intensity distribution very different from station data for 1950-79
• Too many small rains (1-3 mm)
• Too few big rains (>10 mm) => problem of scale?
• Predicted climate change for 2010-39
• More rains in Sept/Oct (favorable)
• Less Rs in Sept/Oct (unfavorable)
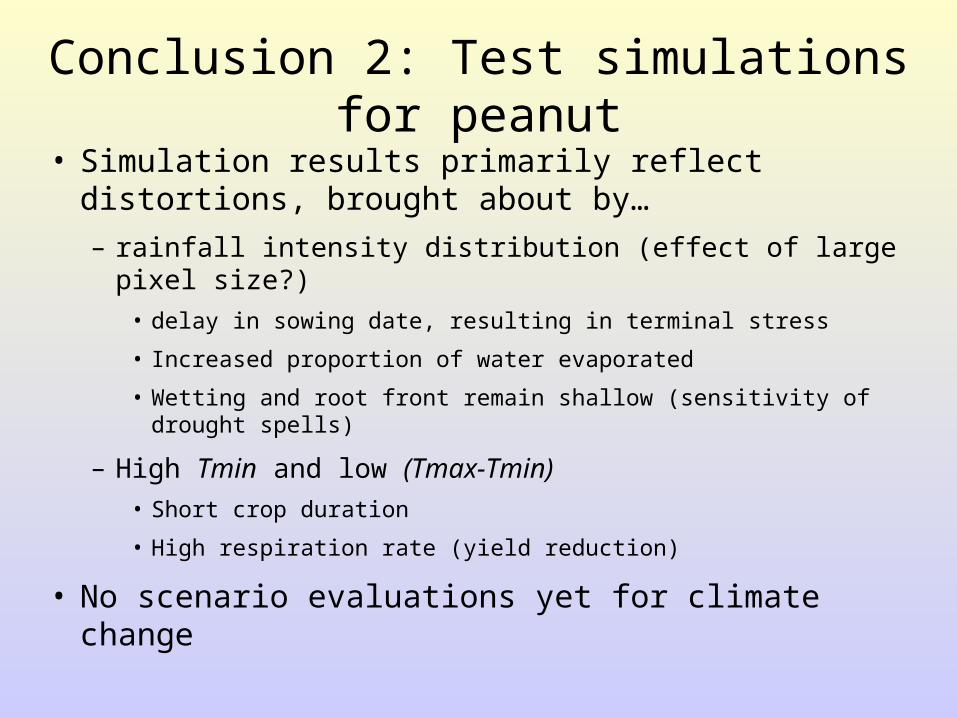
Conclusion 2: Test simulations for peanut
• Simulation results primarily reflect distortions, brought about by…
– rainfall intensity distribution (effect of large pixel size?)
• delay in sowing date, resulting in terminal stress
• Increased proportion of water evaporated
• Wetting and root front remain shallow (sensitivity of drought spells)
– High Tmin and low (Tmax-Tmin)
• Short crop duration
• High respiration rate (yield reduction)
• No scenario evaluations yet for climate change
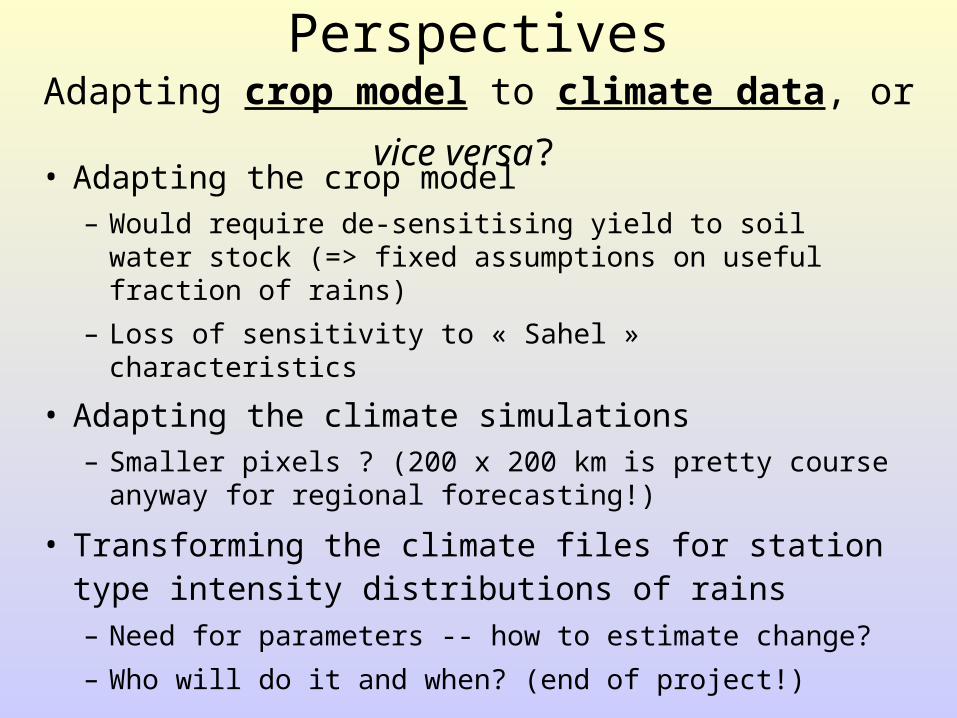
PerspectivesAdapting crop model to climate data, or vice versa? • Adapting the crop model
– Would require de-sensitising yield to soil water stock (=> fixed assumptions on useful fraction of rains)
– Loss of sensitivity to « Sahel » characteristics
• Adapting the climate simulations– Smaller pixels ? (200 x 200 km is pretty course
anyway for regional forecasting!)
• Transforming the climate files for station type intensity distributions of rains – Need for parameters -- how to estimate change?
– Who will do it and when? (end of project!)