pilot studies on performance of membrane bio … m 3 /day 40 m3/day 20 m 3 /day 40 m3 /day 40 m 3...
TRANSCRIPT

Pilot Studies on Performance of Membrane Bio-Reactor in Treating Hong Kong
Freshwater and Saline Sewage and Its Virus Rejection Ability and Mechanism
G. H. Chen and C. ShangG. H. Chen and C. ShangThe Hong Kong University of Science and Technology The Hong Kong University of Science and Technology
(HKUST)(HKUST)Clear Water Bay, Kowloon, Hong Kong Clear Water Bay, Kowloon, Hong Kong

Hong Kong University of Science & Technology

Hong Kong’s Major Concerns in Hong Kong’s Major Concerns in Wastewater Treatment Wastewater Treatment
Use of seawater in toilet flushingUse of seawater in toilet flushing →→ High and variable salinity High and variable salinity level in the sewage causing serious sludge bulking/foaming and level in the sewage causing serious sludge bulking/foaming and limiting the limiting the disinfectiondisinfection means(80% toilets by seawater, 4means(80% toilets by seawater, 4--8 g/L 8 g/L ClCl--) )
Stringent discharge requirementsStringent discharge requirements →→ High Treatment High Treatment Performance (TSS<30 mg/L, TN<10 Performance (TSS<30 mg/L, TN<10 mgNmgN/L, ammonia <2 /L, ammonia <2 mgNmgN/L, E./L, E.colicoli <1000~4000 /100mL)<1000~4000 /100mL)
Limited land availabilityLimited land availability →→ Requirement of compact/space Requirement of compact/space saving technologiessaving technologies
Water Reclamation and ReuseWater Reclamation and Reuse →→ Effective and nonEffective and non--hazardous hazardous disinfection methoddisinfection method
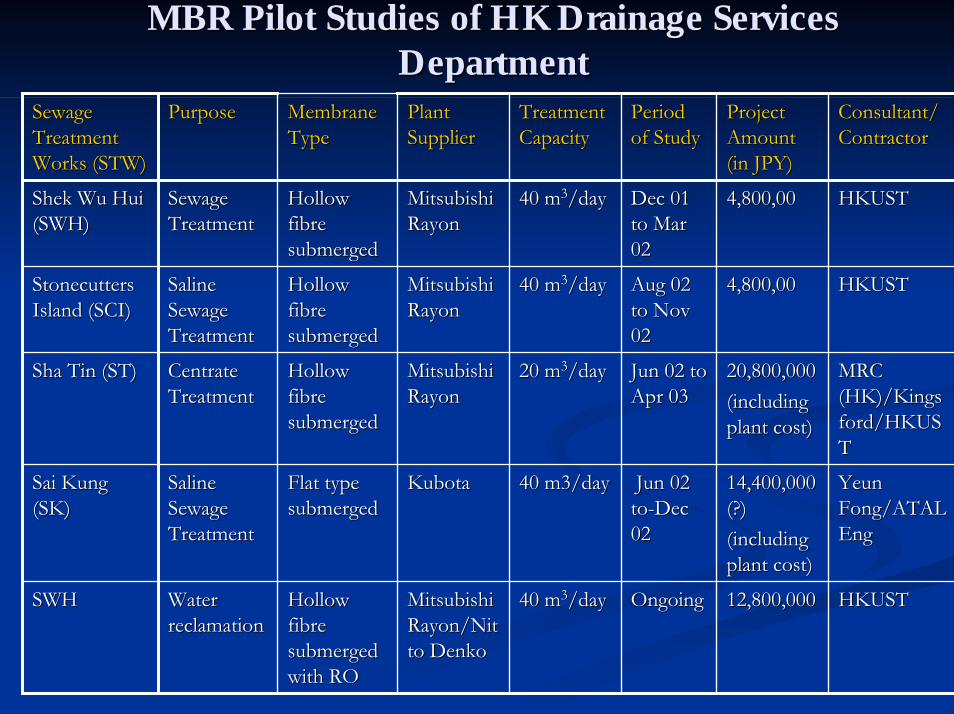
MBR Pilot Studies of HK Drainage Services MBR Pilot Studies of HK Drainage Services DepartmentDepartment
HKUSTHKUST
YeunYeunFong/ATAL Fong/ATAL EngEng
MRC MRC (HK)/Kings(HK)/Kingsford/HKUSford/HKUSTT
HKUSTHKUST
HKUSTHKUST
Consultant/Consultant/ContractorContractor
12,800,00012,800,000
14,400,000 14,400,000 (?)(?)(including (including plant cost)plant cost)
20,800,000 20,800,000 (including (including plant cost)plant cost)
4,800,004,800,00
4,800,004,800,00
Project Project Amount Amount (in JPY)(in JPY)
40 m40 m33/day/day
40 m3/day40 m3/day
20 m20 m33/day/day
40 m40 m33/day/day
40 m40 m33/day/day
Treatment Treatment CapacityCapacity
Jun 02 Jun 02 toto--Dec Dec 02 02
Kubota Kubota Flat type Flat type submergedsubmerged
Saline Saline Sewage Sewage TreatmentTreatment
SaiSai Kung Kung (SK)(SK)
Jun 02 to Jun 02 to Apr 03Apr 03
Mitsubishi Mitsubishi RayonRayon
Hollow Hollow fibre fibre submergedsubmerged
Centrate Centrate TreatmentTreatment
ShaSha Tin (ST)Tin (ST)
OngoingOngoingMitsubishi Mitsubishi Rayon/NitRayon/Nitto Denkoto Denko
Hollow Hollow fibre fibre submergedsubmergedwithwith RORO
Water Water reclamationreclamation
SWH SWH
Aug 02 Aug 02 to Nov to Nov 0202
Mitsubishi Mitsubishi RayonRayon
Hollow Hollow fibre fibre submergedsubmerged
Saline Saline Sewage Sewage TreatmentTreatment
Stonecutters Stonecutters Island (SCI)Island (SCI)
Dec 01 Dec 01 to Mar to Mar 0202
Mitsubishi Mitsubishi RayonRayon
Hollow Hollow fibre fibre submergedsubmerged
Sewage Sewage TreatmentTreatment
ShekShek Wu Wu HuiHui(SWH)(SWH)
Period Period of Studyof Study
Plant Plant SupplierSupplier
Membrane Membrane TypeType
PurposePurposeSewage Sewage Treatment Treatment Works (STW)Works (STW)

Pilot Plant LocationsPilot Plant Locations
Shek Wu Hui STW (80,000 m3/d)
Stonecutters Island STW (1,400,000 m3/d)
Shat Tin STW Shat Tin STW (240,000 m3/d)(240,000 m3/d)
SaiSai Kung STW Kung STW (10,000 m3/d)(10,000 m3/d)

Market Perspective of MBR Technology in Market Perspective of MBR Technology in HK HK
Building wastewater recycle/reuseBuilding wastewater recycle/reuse
Upgrading of sewage treatment for effluent Upgrading of sewage treatment for effluent reuse (toilet flushing) reuse (toilet flushing)
Package plant in trade wastewater treatment Package plant in trade wastewater treatment (restaurants, food processing centers, etc.) (restaurants, food processing centers, etc.)

Contents of this presentationContents of this presentation
Results of MBR Pilot TrialsResults of MBR Pilot Trials
Comparison of the performances with freshwater (Comparison of the performances with freshwater (ShekShek Wu Wu HuiHui STW) and saline sewage (Stonecutters Island STW STW) and saline sewage (Stonecutters Island STW Pilot Trials)Pilot Trials)
Treatment of Chemically Enhanced Primary Treatment Treatment of Chemically Enhanced Primary Treatment (CEPT) effluent (CEPT) effluent
Virus Rejection (Stonecutters Island STW Pilot Trial)Virus Rejection (Stonecutters Island STW Pilot Trial)
Results of MBR Laboratory StudyResults of MBR Laboratory Study
Virus removal in a bench scale MBR: Performances and Virus removal in a bench scale MBR: Performances and MechanismsMechanisms

Objectives of the MBR Pilot Trials at Objectives of the MBR Pilot Trials at SWH STW and SCI STWSWH STW and SCI STW
To determine suitability of the MBR technology for the To determine suitability of the MBR technology for the treatment of Hong Kong sewage (freshwater and saline)treatment of Hong Kong sewage (freshwater and saline)
To investigate its ability to achieve carbon removal with To investigate its ability to achieve carbon removal with full nitrification/denitrification to meet the discharge full nitrification/denitrification to meet the discharge requirementsrequirements
To evaluate the effectiveness of the MBR for the To evaluate the effectiveness of the MBR for the rejection of E. colirejection of E. coli
To determine optimal process operation parameters To determine optimal process operation parameters under field conditionsunder field conditions

MBR Pilot PlantMBR Pilot Plant
Recirculation Pump
Suction Pump
Effluent
Air
Influ
ent
Feed Pump
Agi
tatio
n P
ump
Raw Wastewater
Screen
Mem
bran
e
Equalization Tank Anoxic Tank Aerobic Tank

MBR Pilot PlantMBR Pilot Plant

MBR ConfigurationMBR Configuration
6,000 6,000 –– 12,000 mg/L12,000 mg/LBiomass ConcentrationBiomass Concentration
7 hours7 hoursHydraulic Retention TimeHydraulic Retention Time
300%300%Mixed Liquor RecycleMixed Liquor Recycle
40 m40 m33/day/dayHydraulic CapacityHydraulic Capacity
Anoxic (40%)/Aerobic (60%)Anoxic (40%)/Aerobic (60%)Process ConfigurationProcess Configuration
11.25 m11.25 m33Total Reactor VolumeTotal Reactor Volume
2.6 m 2.6 m ×× 3.0 m3.0 mFoot Print AreaFoot Print Area
13 minutes ON, 2 minutes OFF13 minutes ON, 2 minutes OFFEffluent Discharge CycleEffluent Discharge Cycle
Hollow Fibre Membrane (Hollow Fibre Membrane (SteraporeSterapore®® SUR) SUR) with pore size of 0.4 with pore size of 0.4 µµmm
MembraneMembrane
DescriptionDescriptionParametersParameters

MBR Pilot Trial at MBR Pilot Trial at ShekShek Wu Wu HuiHuiSewage Treatment Works Sewage Treatment Works
(Freshwater)(Freshwater)
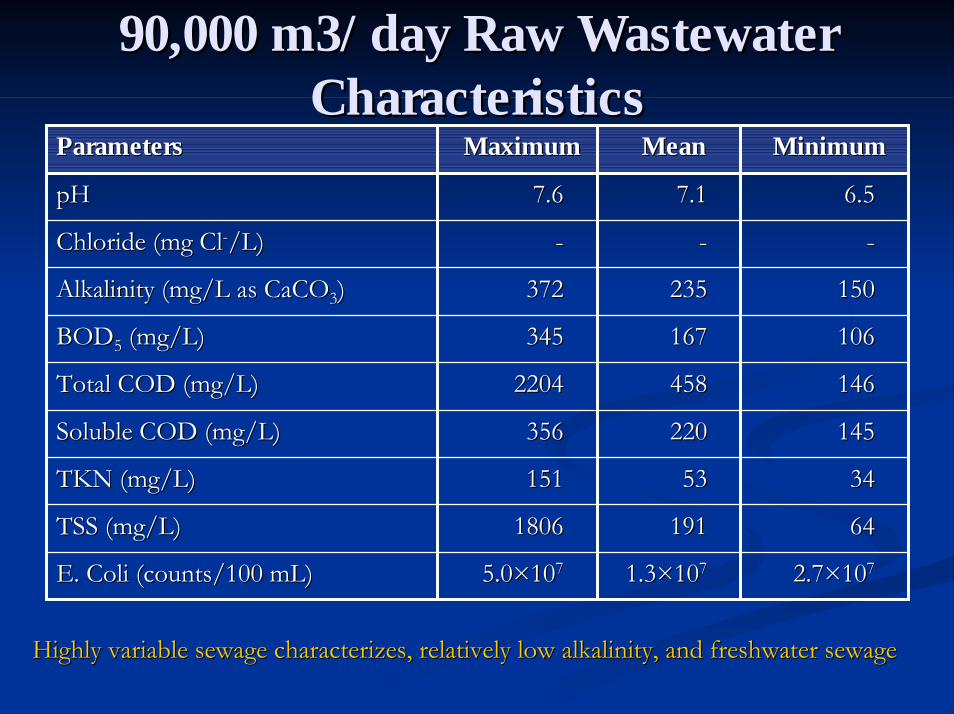
90,000 m3/day Raw Wastewater 90,000 m3/day Raw Wastewater CharacteristicsCharacteristics
150150235235372372Alkalinity (mg/L as CaCOAlkalinity (mg/L as CaCO33))
2.72.7××1010771.31.3××1010775.05.0××101077E. Coli (counts/100 E. Coli (counts/100 mLmL))
646419119118061806TSS (mg/L)TSS (mg/L)
34345353151151TKN (mg/L)TKN (mg/L)
145145220220356356Soluble COD (mg/L)Soluble COD (mg/L)
14614645845822042204Total COD (mg/L)Total COD (mg/L)
106106167167345345BODBOD55 (mg/L)(mg/L)
------Chloride (mg Chloride (mg ClCl--/L)/L)
6.56.57.17.17.67.6pHpH
MinimumMinimumMeanMeanMaximumMaximumParametersParameters
Highly variable sewage characterizes, relatively low alkalinity,Highly variable sewage characterizes, relatively low alkalinity, and freshwater sewageand freshwater sewage
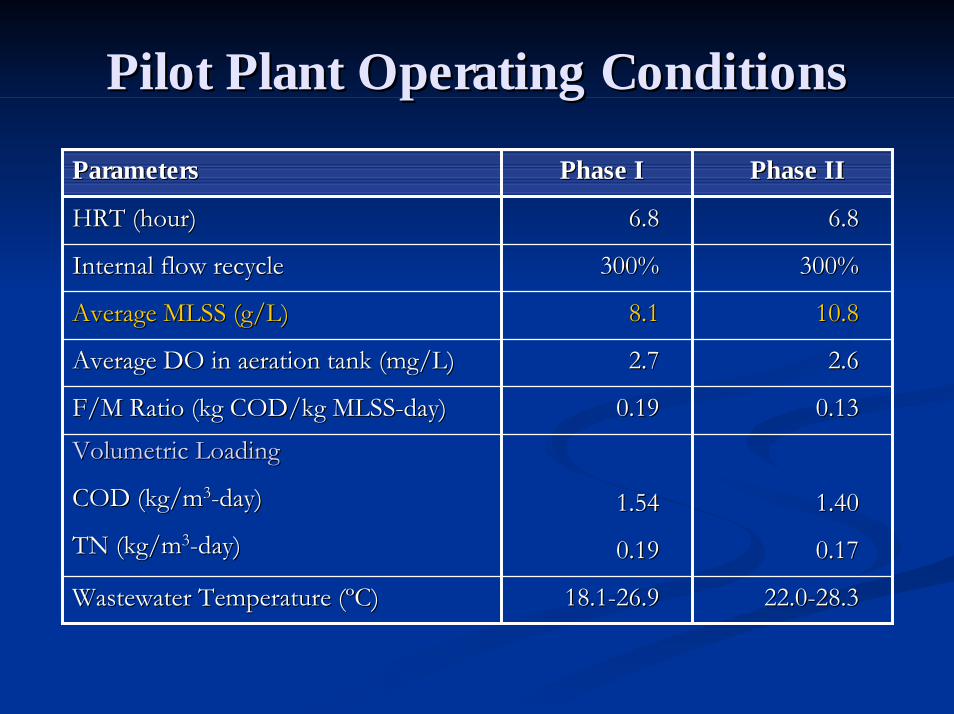
Pilot Plant Operating ConditionsPilot Plant Operating Conditions
22.022.0--28.328.318.118.1--26.926.9Wastewater Temperature (Wastewater Temperature (ººC)C)
10.810.88.18.1Average MLSS (g/L)Average MLSS (g/L)
0.170.170.190.19TN (kg/mTN (kg/m33--day)day)1.401.401.541.54COD (kg/mCOD (kg/m33--day)day)
Volumetric LoadingVolumetric Loading0.130.130.190.19F/M Ratio (kg COD/kg MLSSF/M Ratio (kg COD/kg MLSS--day)day)
2.62.62.72.7Average DO in aeration tank (mg/L)Average DO in aeration tank (mg/L)
300%300%300%300%Internal flow recycleInternal flow recycle
6.86.86.86.8HRT (hour)HRT (hour)
Phase IIPhase IIPhase IPhase IParametersParameters
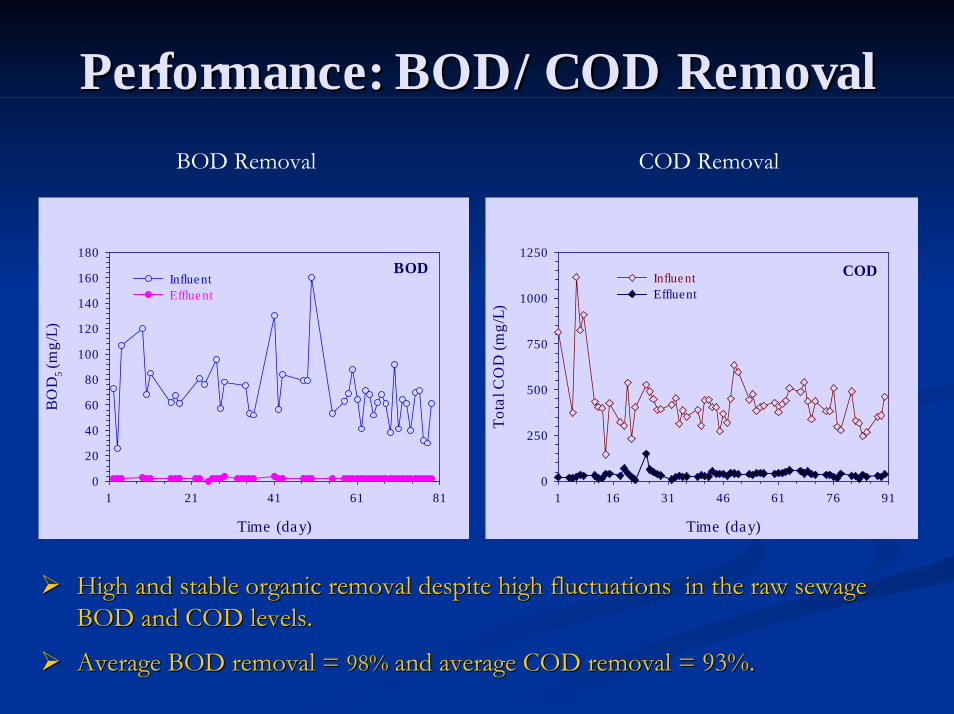
Performance: BOD/COD RemovalPerformance: BOD/COD Removal
BOD Removal COD Removal
Time (day)
1 21 41 61 81
BO
D5
(mg/
L)
0
20
40
60
80
100
120
140
160
180
InfluentEffluent
BOD
Time (day)
1 16 31 46 61 76 91To
tal C
OD
(mg/
L)0
250
500
750
1000
1250
InfluentEffluent
COD
High and stable organic removal despite high fluctuations in thHigh and stable organic removal despite high fluctuations in the raw sewage e raw sewage BOD and COD levels.BOD and COD levels.
Average BOD removal = Average BOD removal = 98%98% and average COD removal = 93%.and average COD removal = 93%.

Performance: SS and Nitrogen RemovalPerformance: SS and Nitrogen Removal
Suspended Solids Removal Nitrogen Removal
Time (day)
1 16 31 46 61 76 91
TSS
(mg/
L)
0
250
500
750
1000
InfluentEffluent
TSS
Time (day)
1 16 31 46 61 76 91To
tal N
itrog
en (m
g N
/L)
0
40
80
120
160
Influent Effluent
TN
Excellent SS and nitrogen removal.Excellent SS and nitrogen removal.
Average nitrogen removal = Average nitrogen removal = 86%86% with average effluent TN = 10 mg/L.with average effluent TN = 10 mg/L.
No additional carbon source or alkalinity adjustment required.No additional carbon source or alkalinity adjustment required.
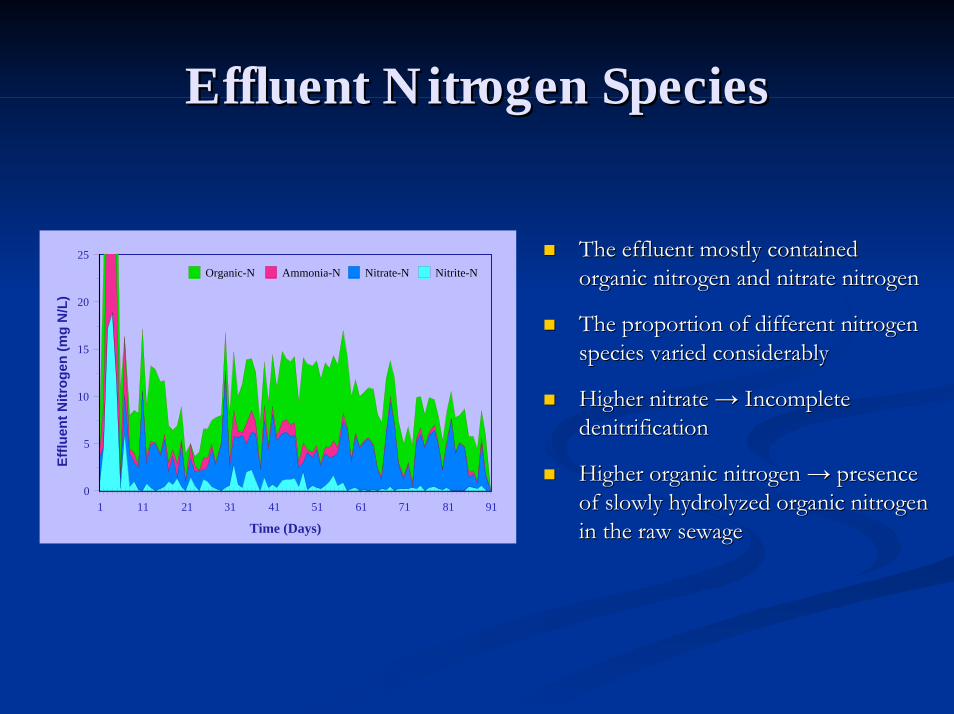
Effluent Nitrogen SpeciesEffluent Nitrogen Species
1 11 21 31 41 51 61 71 81 91
Time (Days)
0
5
10
15
20
25
Efflu
ent N
itrog
en (m
g N
/L)
Organic-N Ammonia-N Nitrate-N Nitrite-N
The effluent mostly contained The effluent mostly contained organic nitrogen and nitrate nitrogenorganic nitrogen and nitrate nitrogen
The proportion of different nitrogen The proportion of different nitrogen species varied considerablyspecies varied considerably
Higher nitrate Higher nitrate →→ Incomplete Incomplete denitrificationdenitrification
Higher organic nitrogen Higher organic nitrogen →→ presence presence of slowly hydrolyzed organic nitrogen of slowly hydrolyzed organic nitrogen in the raw sewagein the raw sewage

Transmembrane PressureTransmembrane Pressure
Time (Day)
1 16 31 46 61 76 91
Suct
ion
Pres
sure
(kP
a)
0
10
20
30
40
In-line cleaning
Slope = 0.29 Slope = 0.09
Phase I Phase II

MBR Pilot Trial at Stonecutters Island MBR Pilot Trial at Stonecutters Island Sewage Treatment Works (saline)Sewage Treatment Works (saline)

1,400,000 m3/day Raw Wastewater 1,400,000 m3/day Raw Wastewater CharacteristicsCharacteristics
114114275275576576Alkalinity (mg/L as CaCOAlkalinity (mg/L as CaCO33))
1.21.2××1010773.53.5××1010772.92.9××101088E. Coli (counts/100 E. Coli (counts/100 mLmL))
2626206206896896TSS (mg/L)TSS (mg/L)
18183838130130TKN (mg/L)TKN (mg/L)
8080280280612612Soluble COD (mg/L)Soluble COD (mg/L)
15215251551510321032Total COD (mg/L)Total COD (mg/L)
6262186186410410BODBOD55 (mg/L)(mg/L)
350035005916591678707870Chloride (mg Chloride (mg ClCl--/L)/L)
6.46.47.07.07.77.7pHpH
MinimumMinimumMeanMeanMaximumMaximumParametersParameters
Highly variable sewage characterizes, relatively low alkalinity,Highly variable sewage characterizes, relatively low alkalinity, and saline sewageand saline sewage

Pilot Plant Operating ConditionsPilot Plant Operating Conditions
24.924.9--28.828.826.326.3--28.828.8Wastewater Temperature (Wastewater Temperature (ººC)C)
12.312.38.48.4Average MLSS (g/L)Average MLSS (g/L)
0.130.130.140.14TN (kg/mTN (kg/m33--day)day)
1.721.721.931.93COD (kg/mCOD (kg/m33--day)day)
Volumetric LoadingVolumetric Loading
0.140.140.230.23F/M Ratio (kg COD/kg MLSSF/M Ratio (kg COD/kg MLSS--day)day)
2.42.42.92.9Average DO in aeration tank (mg/L)Average DO in aeration tank (mg/L)
300%300%300%300%Internal flow recycleInternal flow recycle
6.86.86.86.8HRT (hour)HRT (hour)
Phase IIPhase IIPhase IPhase IParametersParameters

Performance: BOD/COD RemovalPerformance: BOD/COD Removal
BOD Removal COD Removal
Time (day)
1 16 31 46 61 76 91 106
BO
D5 (
mg/
L)
0
100
200
300
400
500
InfluentEffluent
BOD
Time (day)
1 16 31 46 61 76 91 106To
tal C
OD
(mg/
L)
0
250
500
750
1000
1250
InfluentEffluent
COD
High and stable organic removal despite high fluctuations in thHigh and stable organic removal despite high fluctuations in the raw sewage e raw sewage BOD and COD levels.BOD and COD levels.
Average BOD removal = Average BOD removal = 98%98% and average COD removal = 93%.and average COD removal = 93%.
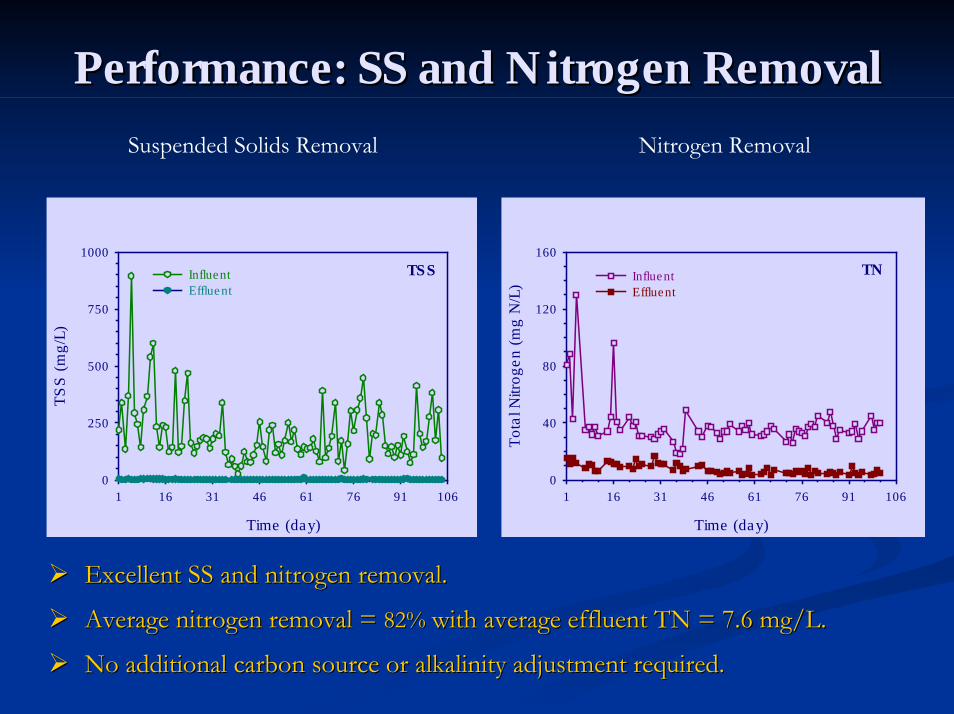
Performance: SS and Nitrogen RemovalPerformance: SS and Nitrogen Removal
Suspended Solids Removal Nitrogen Removal
Time (day)
1 16 31 46 61 76 91 106
TSS
(mg/
L)
0
250
500
750
1000
InfluentEffluent
TSS
Time (day)
1 16 31 46 61 76 91 106To
tal N
itrog
en (m
g N
/L)
0
40
80
120
160
Influent Effluent
TN
Excellent SS and nitrogen removal.Excellent SS and nitrogen removal.
Average nitrogen removal = Average nitrogen removal = 82%82% with average effluent TN = 7.6 mg/L.with average effluent TN = 7.6 mg/L.
No additional carbon source or alkalinity adjustment required.No additional carbon source or alkalinity adjustment required.
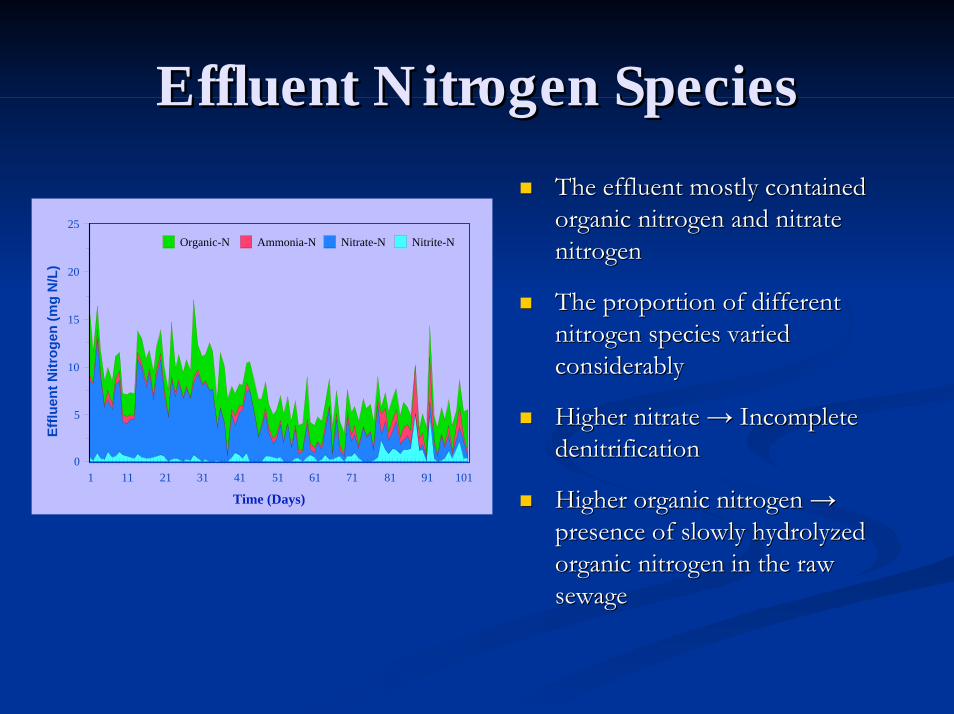
Effluent Nitrogen SpeciesEffluent Nitrogen Species
1 11 21 31 41 51 61 71 81 91 101
Time (Days)
0
5
10
15
20
25
Efflu
ent N
itrog
en (m
g N
/L)
Organic-N Ammonia-N Nitrate-N Nitrite-N
The effluent mostly contained The effluent mostly contained organic nitrogen and nitrate organic nitrogen and nitrate nitrogennitrogen
The proportion of different The proportion of different nitrogen species varied nitrogen species varied considerablyconsiderably
Higher nitrate Higher nitrate →→ Incomplete Incomplete denitrificationdenitrification
Higher organic nitrogen Higher organic nitrogen →→presence of slowly hydrolyzed presence of slowly hydrolyzed organic nitrogen in the raw organic nitrogen in the raw sewagesewage

Transmembrane PressureTransmembrane Pressure
Time (Day)
1 16 31 46 61 76 91 106
Suc
tion
Pre
ssur
e (k
Pa)
0
10
20
30
401st in-line cleaning
Slope = 0.43
Slope = 0.43
Slope = 0.30
Phase I Phase II
2nd in-line cleaning
3rd in-line cleaning

Membrane CleaningMembrane Cleaning
Fine bubble aeration was used to prevent the Fine bubble aeration was used to prevent the membrane fouling by shearing off the biofilmmembrane fouling by shearing off the biofilm
The shearing off was further facilitated by intermittent The shearing off was further facilitated by intermittent withdrawal of the effluent at a timed cycle of 13 min withdrawal of the effluent at a timed cycle of 13 min ON and 2 min OFFON and 2 min OFF
Periodic inPeriodic in--line cleaning with sodium hypochloriteline cleaning with sodium hypochlorite
OffOff--tank membrane cleaning with sodium hypochlorite tank membrane cleaning with sodium hypochlorite and sodium hydroxide solutionand sodium hydroxide solution

Effect of Loading on BOD RemovalEffect of Loading on BOD Removal
Shek Wu Hui STW (Freshwater Sewage) Stonecutters Island STW (Saline Sewage)
BOD5 Loading (kg/m3-day)
0.0 0.3 0.6 0.9 1.2 1.5
BO
D5 R
emov
al (k
g/m
3 -day
)
0.0
0.3
0.6
0.9
1.2
1.5
98% Remova l Line
BOD5 Loading (kg/m3-day)
0.0 0.3 0.6 0.9 1.2 1.5
BO
D5 R
emov
al (k
g/m
3 -day
)
0.0
0.3
0.6
0.9
1.2
1.5
98% Remova l Line
No significant difference in the performance with freshwater andNo significant difference in the performance with freshwater and saline sewage.saline sewage.
The removal capacity of the MBR was limited by the loading ratheThe removal capacity of the MBR was limited by the loading rather than the r than the bioactivity.bioactivity.

Effect of Loading on Nitrogen RemovalEffect of Loading on Nitrogen Removal
Shek Wu Hui STW (Freshwater Sewage) Stonecutters Island STW (Saline Sewage)
TKN Loading (kg N/m3-day)
0.0 0.1 0.2 0.3 0.4 0.5 0.6
Nitr
ogen
Rem
oval
(kg
N/m
3 -day
)
0.0
0.1
0.2
0.3
0.4
0.5
0.6
84% Removal Line
TKN Loading (kg N/m3-day)
0.0 0.1 0.2 0.3 0.4 0.5 0.6
Nitr
ogen
Rem
oval
(kg
N/m
3 -day
)
0.0
0.1
0.2
0.3
0.4
0.5
0.6
82% Remova l Line
No significant difference in the performance with freshwater andNo significant difference in the performance with freshwater and saline sewage.saline sewage.
The nitrogen removal capacity of the MBR was limited by the loadThe nitrogen removal capacity of the MBR was limited by the loading rather ing rather than the bioactivity.than the bioactivity.

Treatment of Freshwater and Treatment of Freshwater and Saline SewagesSaline Sewages
Comparison of PerformanceComparison of Performance

Nitrogen RemovalNitrogen RemovalShek Wu Hui STW (Freshwater Sewage) Stonecutters Island STW (Saline Sewage)
Time (day)
1 16 31 46 61 76 91 106
Tota
l Nitr
ogen
(mg
N/L
)
0
40
80
120
160
Influent Effluent
TN
Time (day)
1 16 31 46 61 76 91
Tota
l Nitr
ogen
(mg
N/L
)
0
40
80
120
160
Influent Effluent
TN
Both the pilot plant showed excellent nitrogen removal.Both the pilot plant showed excellent nitrogen removal.
The average effluent total nitrogen for Stonecutters Island STW The average effluent total nitrogen for Stonecutters Island STW MBR was lower than that for the MBR was lower than that for the ShekShek Wu Wu HuiHui STW MBR. This was possibly due to high influent TKN and a high STW MBR. This was possibly due to high influent TKN and a high TKN/COD ratio TKN/COD ratio in the former case.in the former case.
The change in biomass concentration did not show any significantThe change in biomass concentration did not show any significant effect on the nitrogen effect on the nitrogen removal performance.removal performance.

Transmembrane PressureTransmembrane PressureShek Wu Hui STW (Freshwater Sewage) Stonecutters Island STW (Saline Sewage)
Time (Day)
1 16 31 46 61 76 91 106
Suc
tion
Pre
ssur
e (k
Pa)
0
10
20
30
40
Time (Day)
1 16 31 46 61 76 91
Suc
tion
Pre
ssur
e (k
Pa)
0
10
20
30
401st in-line cleaning
Slope = 0.43
Slope = 0.43
In-line cleaning
Slope = 0.29
Slope = 0.30
Phase I Phase II
Slope = 0.09
Phase I Phase II
2nd in-line cleaning
3rd in-line cleaning
The rate of pressure buildThe rate of pressure build--up was higher for the saline sewage than the freshwater sewage.up was higher for the saline sewage than the freshwater sewage.After 3 month of operation, inAfter 3 month of operation, in--line chemical cleaning was not effective for saline sewage.line chemical cleaning was not effective for saline sewage.The treatment of saline sewage required more frequent membrane cThe treatment of saline sewage required more frequent membrane cleaning.leaning.

Sludge ProductionSludge ProductionShek Wu Hui STW (Freshwater Sewage) Stonecutters Island STW (Saline Sewage)
Time (Days)
1 16 31 46 61 76 91
Cum
ulat
ive
CO
D re
mov
al (k
g)C
umul
ativ
e sl
udge
pro
duct
ion
(kg)
0
400
800
1200
1600
COD remova l@ 15.20 kg COD/day
S ludge production @ 3.61 kg SS /day
F/M
Rat
io
(kg
CO
D/k
g S
S -d
ay)
0.0
0.1
0.2
0.3
0.4
0.5
Phase I Phase II
Time (Days)
1 16 31 46 61 76 91 106
Cum
ulat
ive
CO
D re
mov
al (k
g)C
umul
ativ
e sl
udge
pro
duct
ion
(kg)
0
400
800
1200
1600
2000
F/M
Rat
io
(kg
CO
D/k
g S
S -d
ay)
0.0
0.1
0.2
0.3
0.4
0.5
COD remova l@ 18.95 kg COD/day
S ludge production @ 3.13 kg SS /day
Phase I Phase II
Sludge Yie ld = 0.24 kg SS /kg COD Sludge Yie ld = 0.17 kg SS /kg COD
The observed sludge yields were relatively low (0.17The observed sludge yields were relatively low (0.17--0.24 kg SS/kg COD removed)0.24 kg SS/kg COD removed)

Treatment of Chemically Treatment of Chemically Enhanced Primary Enhanced Primary
Treatment (CEPT) Effluent Treatment (CEPT) Effluent of SCISTWof SCISTW
FeCl3
Raw Sewage
Chemical Flocculation MBR

Treatment of CEPT EffluentTreatment of CEPT EffluentTreatment of Raw Sewage Treatment of CEPT Effluent
Time (day)
1 16 31 46 61 76 91 106
Tota
l CO
D (m
g/L)
0
200
400
600
800
1000
InfluentEffluent
COD
Time (day)
1 21 41 61 81To
tal C
OD
(mg/
L)0
200
400
600
800
1000
InfluentEffluent
COD
The COD was much lower in the CEPT effluent than the raw sewage.The COD was much lower in the CEPT effluent than the raw sewage.
The performance of the MBR treating the CEPT effluent was betterThe performance of the MBR treating the CEPT effluent was better in terms in terms of the effluent COD. This was possibly due to the removal of a pof the effluent COD. This was possibly due to the removal of a portion of inert ortion of inert COD during the CEPT.COD during the CEPT.
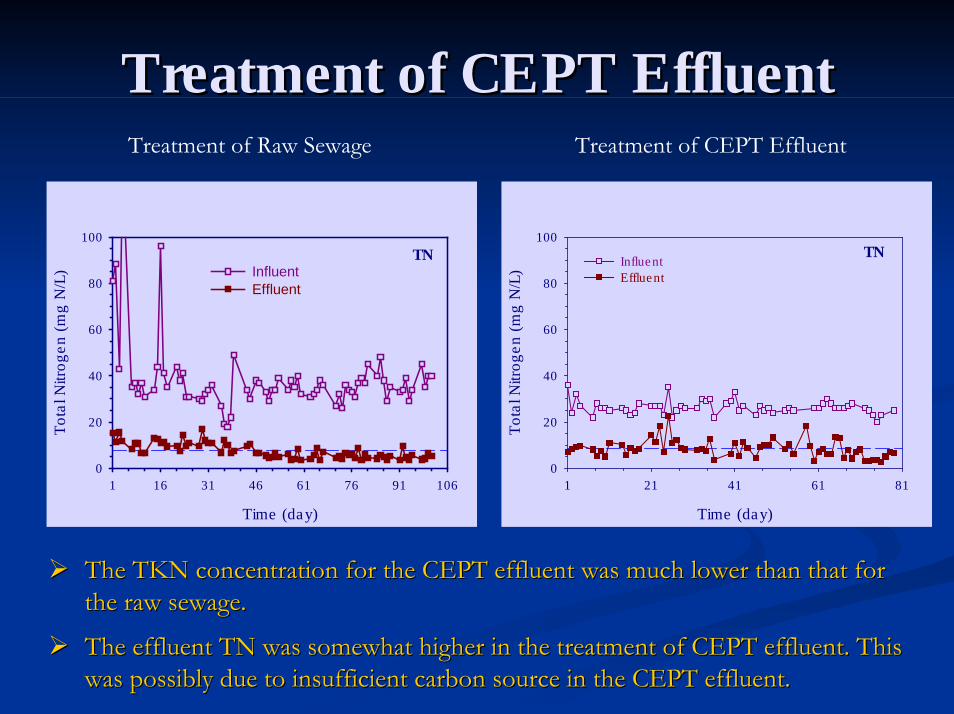
Treatment of CEPT EffluentTreatment of CEPT EffluentTreatment of Raw Sewage Treatment of CEPT Effluent
Time (day)
1 16 31 46 61 76 91 106
Tota
l Nitr
ogen
(mg
N/L
)
0
20
40
60
80
100
InfluentEffluent
TN
Time (day)
1 21 41 61 81
Tota
l Nitr
ogen
(mg
N/L
)
0
20
40
60
80
100
Influent Effluent
TN
The TKN concentration for the CEPT effluent was much lower than The TKN concentration for the CEPT effluent was much lower than that for that for the raw sewage.the raw sewage.
The effluent TN was somewhat higher in the treatment of CEPT effThe effluent TN was somewhat higher in the treatment of CEPT effluent. This luent. This was possibly due to insufficient carbon source in the CEPT effluwas possibly due to insufficient carbon source in the CEPT effluent.ent.

Membrane CleaningMembrane Cleaning
The increase in suction pressure was much faster in the The increase in suction pressure was much faster in the treatment of CEPT effluent than that for of raw sewage.treatment of CEPT effluent than that for of raw sewage.
Normal Normal NaOHNaOH + + NaOClNaOCl cleaning (offcleaning (off--tank) was not effective in tank) was not effective in this case. The membrane required frequent cleaning (every three this case. The membrane required frequent cleaning (every three weeks).weeks).
Acid cleaning followed by Acid cleaning followed by NaOHNaOH + + NaOClNaOCl cleaning was tried cleaning was tried instead and it was found effective in controlling the membrane instead and it was found effective in controlling the membrane fouling.fouling.
The results indicated that the intensity of fouling was much The results indicated that the intensity of fouling was much severe in the treatment of CEPT effluent, possibly due to the severe in the treatment of CEPT effluent, possibly due to the deposition of inorganic materials on the membrane surface.deposition of inorganic materials on the membrane surface.

SEM ResultsSEM Results
Before Cleaning After Alkali Cleaning After Acidic Cleaning
Outer Membrane Surface
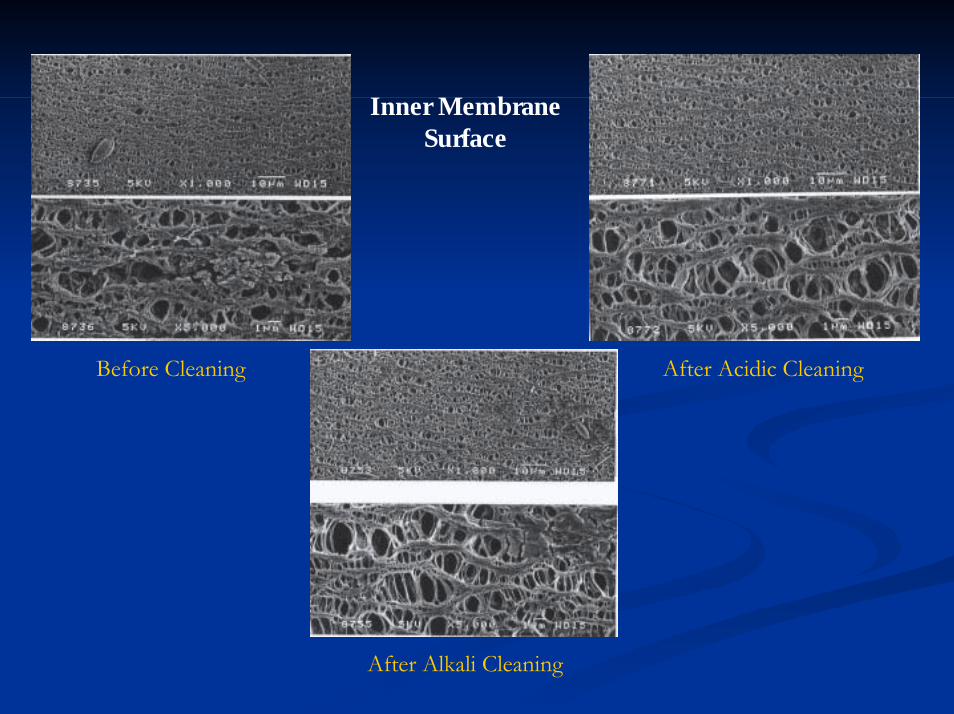
Inner Membrane Surface
Before Cleaning After Acidic Cleaning
After Alkali Cleaning
Virus Rejection Ability of Virus Rejection Ability of MBR and Its Mechanism MBR and Its Mechanism

HK Wastewater DisinfectionHK Wastewater Disinfection
Wastewater needs to be disinfected so as to inactivate Wastewater needs to be disinfected so as to inactivate or partially destruct waterborne diseaseor partially destruct waterborne disease--causing causing microorganisms (<1000 to 4000 E.microorganisms (<1000 to 4000 E.ColiColi/ml) /ml)
Chlorination is the most common method, but Chlorination is the most common method, but produces carcinogenic byproduces carcinogenic by--productsproducts
Other methods like UV radiation is being applied but Other methods like UV radiation is being applied but very expensivevery expensive
MBR may provide effective, nonMBR may provide effective, non--hazardous alternative hazardous alternative biological/physical disinfection credits for sewage, biological/physical disinfection credits for sewage, particularly for saline sewage. particularly for saline sewage.

Virus as a Pathogen IndicatorVirus as a Pathogen Indicator
Epidemiological (disease transmission) significance of viral Epidemiological (disease transmission) significance of viral pathogens pathogens
Viruses are smaller (0.02 ~ 0.3 Viruses are smaller (0.02 ~ 0.3 µµm), hard to be strained and m), hard to be strained and more resistant to disinfectants than bacteria (more resistant to disinfectants than bacteria (LeongLeong, 1983), 1983)
Using classical bacterial indicator is therefore not adequate anUsing classical bacterial indicator is therefore not adequate and d viral indicator should be appliedviral indicator should be applied
Viral Indicators: MSViral Indicators: MS--2 2 bacteriophagebacteriophage (~0.025 (~0.025 µµm) adopted in m) adopted in this study this study Viral enumeration method: Single/Double Agar Layer Method Viral enumeration method: Single/Double Agar Layer Method (Adams, 1959)(Adams, 1959)
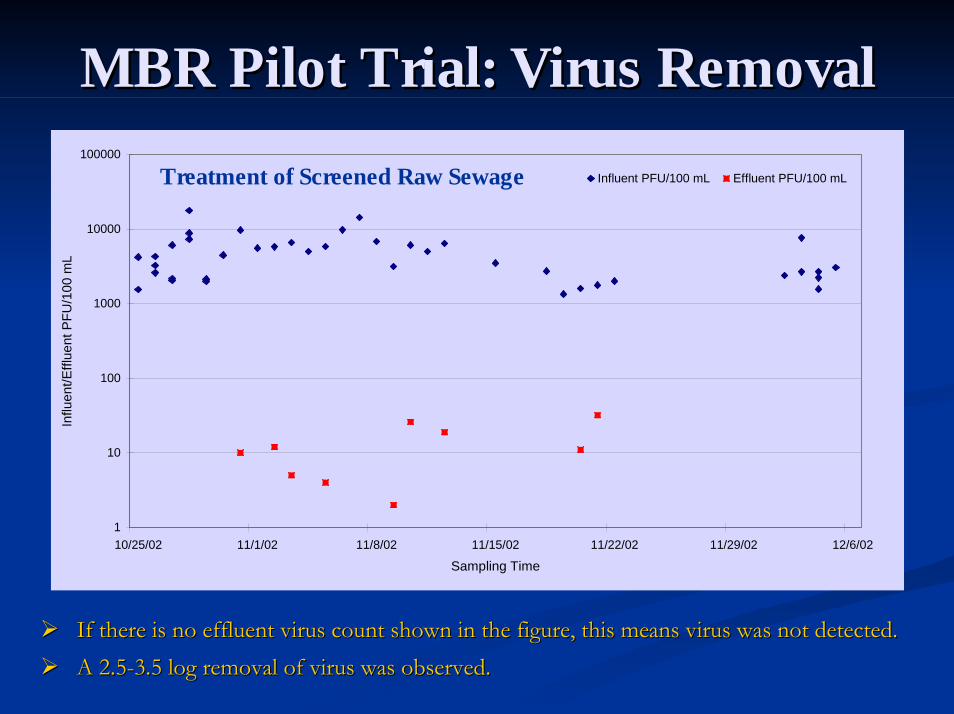
MBR Pilot Trial: Virus RemovalMBR Pilot Trial: Virus Removal
1
10
100
1000
10000
100000
10/25/02 11/1/02 11/8/02 11/15/02 11/22/02 11/29/02 12/6/02
Sampling Time
Influ
ent/E
fflue
nt P
FU/1
00 m
L
Influent PFU/100 mL Effluent PFU/100 mLTreatment of Screened Raw Sewage
If there is no effluent virus count shown in the figure, this meIf there is no effluent virus count shown in the figure, this means virus was not detected.ans virus was not detected.A 2.5A 2.5--3.5 log removal of virus was observed.3.5 log removal of virus was observed.
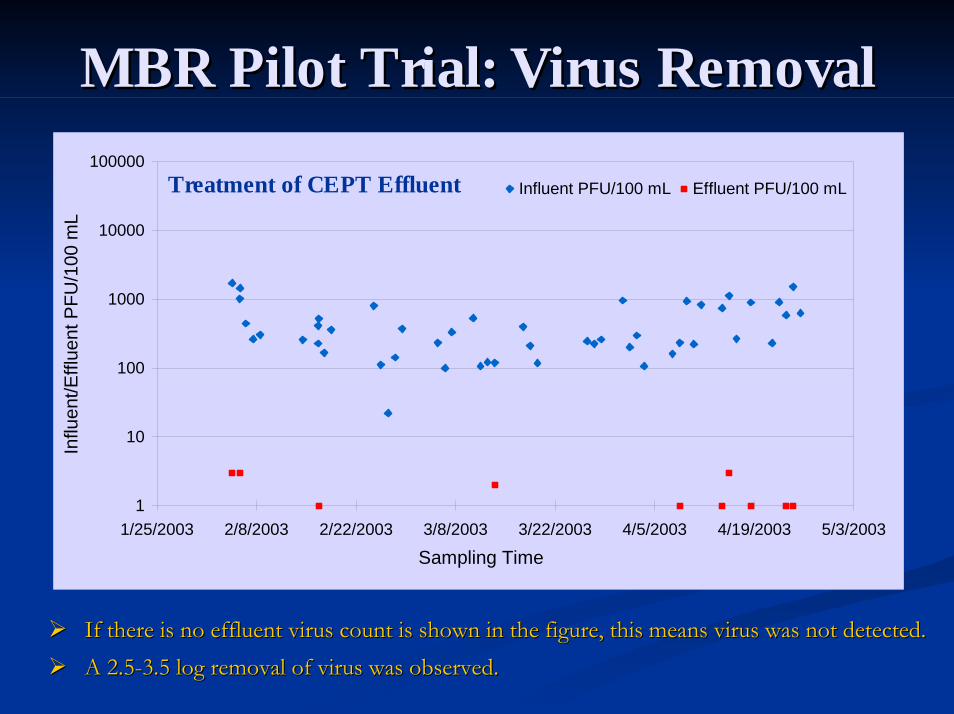
MBR Pilot Trial: Virus RemovalMBR Pilot Trial: Virus Removal
1
10
100
1000
10000
100000
1/25/2003 2/8/2003 2/22/2003 3/8/2003 3/22/2003 4/5/2003 4/19/2003 5/3/2003
Sampling Time
Influ
ent/E
fflue
nt P
FU/1
00 m
L
Influent PFU/100 mL Effluent PFU/100 mLTreatment of CEPT Effluent
If there is no effluent virus count is shown in the figure, thisIf there is no effluent virus count is shown in the figure, this means virus was not detected.means virus was not detected.A 2.5A 2.5--3.5 log removal of virus was observed.3.5 log removal of virus was observed.

Hollow Fibre Membrane Hollow Fibre Membrane
Membrane pore size = 0.40 µm, virus size = 0.02 – 0.10 µm
Almost complete rejection of viruses by MBR indicates that the physical straining is not an appropriate mechanism of virus rejection.
Objectives of the Lab Study on Viral Objectives of the Lab Study on Viral Removal of MBRRemoval of MBR
To evaluate feasibility of utilizing submerged To evaluate feasibility of utilizing submerged MBR as a preMBR as a pre--disinfection processdisinfection process
To study factors affecting the viral removalTo study factors affecting the viral removal
Factors such as MLSS concentration, sludge age, Factors such as MLSS concentration, sludge age, suction pressure, and membrane cleaning.suction pressure, and membrane cleaning.
To investigate mechanisms of the viral removalTo investigate mechanisms of the viral removal
Role of mixed liquor suspended solids and the biofilm Role of mixed liquor suspended solids and the biofilm development on the membrane surface.development on the membrane surface.

Study ApproachStudy Approach
Clean membrane + clean water + phages:Clean membrane + clean water + phages:
viral removal by sole membrane viral removal by sole membrane
Clean membrane + biomass + phages:Clean membrane + biomass + phages:
ShortShort--term operation: viral removal by membrane and term operation: viral removal by membrane and biomassbiomass
LongLong--term viral removal by membrane, biomass and term viral removal by membrane, biomass and biofilmbiofilm
The membrane was cleaned before the start of each The membrane was cleaned before the start of each cycle of operationcycle of operation
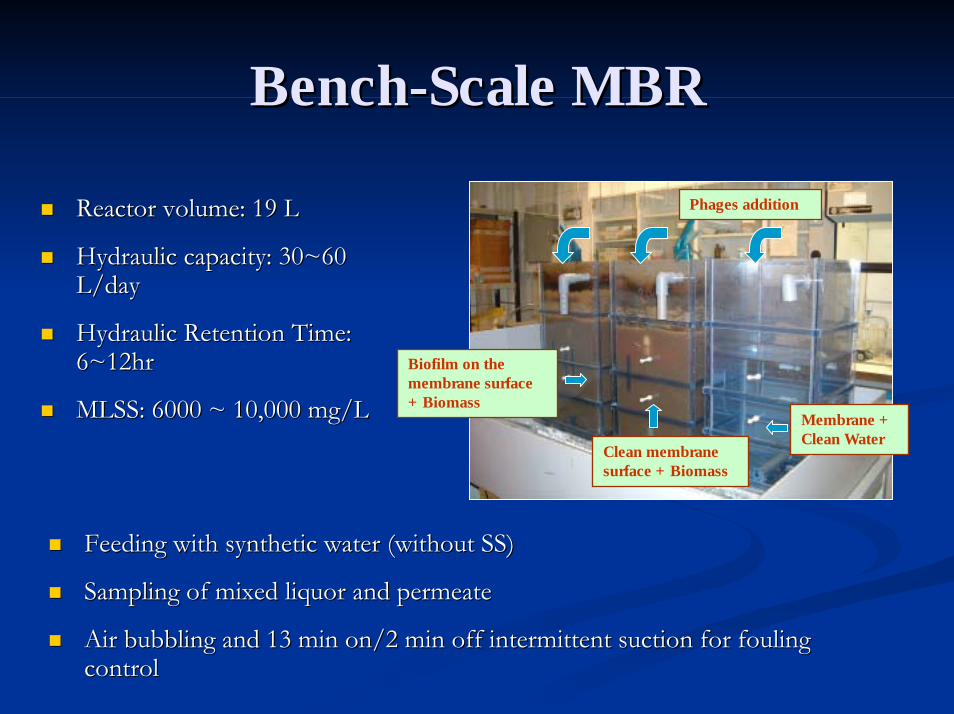
BenchBench--Scale MBRScale MBR
Biofilm on the membrane surface + Biomass
Clean membrane surface + Biomass
Membrane + Clean Water
Phages additionReactor volume: 19 L Reactor volume: 19 L
Hydraulic capacity: 30~60 Hydraulic capacity: 30~60 L/dayL/day
Hydraulic Retention Time: Hydraulic Retention Time: 6~12hr6~12hr
MLSS: 6000 ~ 10,000 mg/LMLSS: 6000 ~ 10,000 mg/L
Feeding with synthetic water (without SS)Feeding with synthetic water (without SS)
Sampling of mixed liquor and permeateSampling of mixed liquor and permeate
Air bubbling and 13 min on/2 min off intermittent suction for foAir bubbling and 13 min on/2 min off intermittent suction for fouling uling controlcontrol
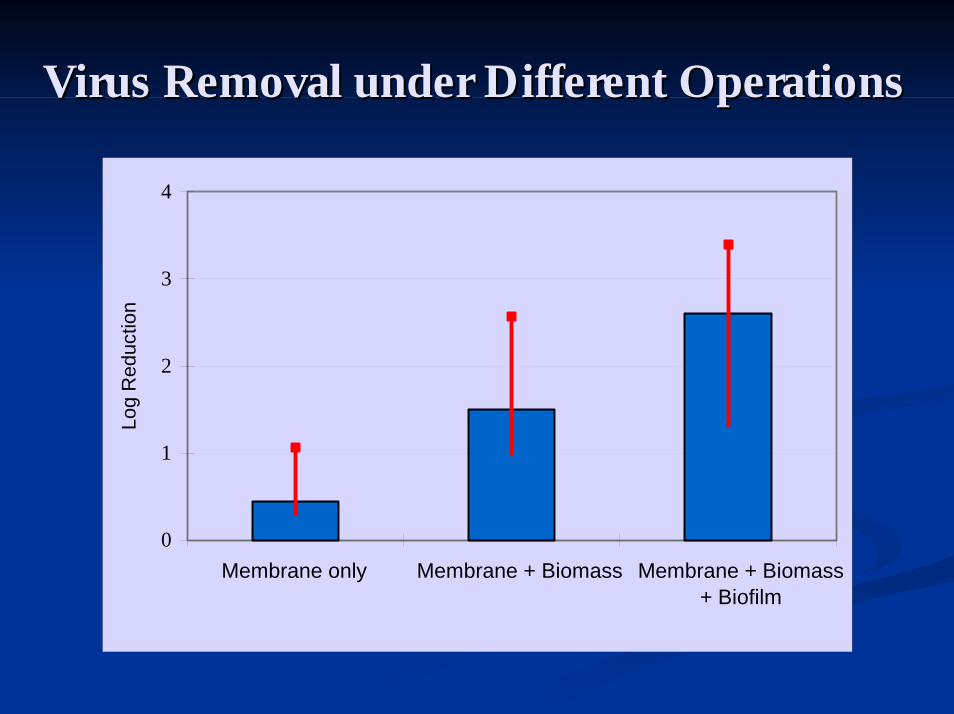
Virus Removal under Different OperationsVirus Removal under Different Operations
0
1
2
3
4
Log
Red
uctio
n
Membrane only Membrane + Biomass Membrane + Biomass + Biofilm

ResultsResults
Sole membrane only contributed to an average of 65% (0.45Sole membrane only contributed to an average of 65% (0.45--log) MSlog) MS--2 coliphage removal. This was obvious as the 2 coliphage removal. This was obvious as the membrane pore size was much larger than the coliphage size.membrane pore size was much larger than the coliphage size.
With the presence of biomass, phage removal got improved to With the presence of biomass, phage removal got improved to 1.51.5--log reduction on average. The phages in this case are log reduction on average. The phages in this case are believed to attach on the biomass flocs and then get rejected bybelieved to attach on the biomass flocs and then get rejected bythe filtration.the filtration.
With the presence of both the biomass and one monthWith the presence of both the biomass and one month--grown grown biofilm on the membrane surface, the virus removal reached to biofilm on the membrane surface, the virus removal reached to 2.62.6--log on average. This indicated the importance of biofilm on log on average. This indicated the importance of biofilm on viral rejection by the MBR.viral rejection by the MBR.

TimeTime--Dependent MSDependent MS--2 Removal2 RemovalOperating conditions:MLSS = 8000 mg/LInitial flux = 0.25 m3/m2/day
0
1
2
3
4
0 5 10 15 20
Time (day)
Log
Rem
oval
0
1
2
3
4
0 5 10 15 20 25 30 35 40 45 50
Time (hour)
Log
Rem
oval
Short-term MS-2 removal Long-term MS-2 removal
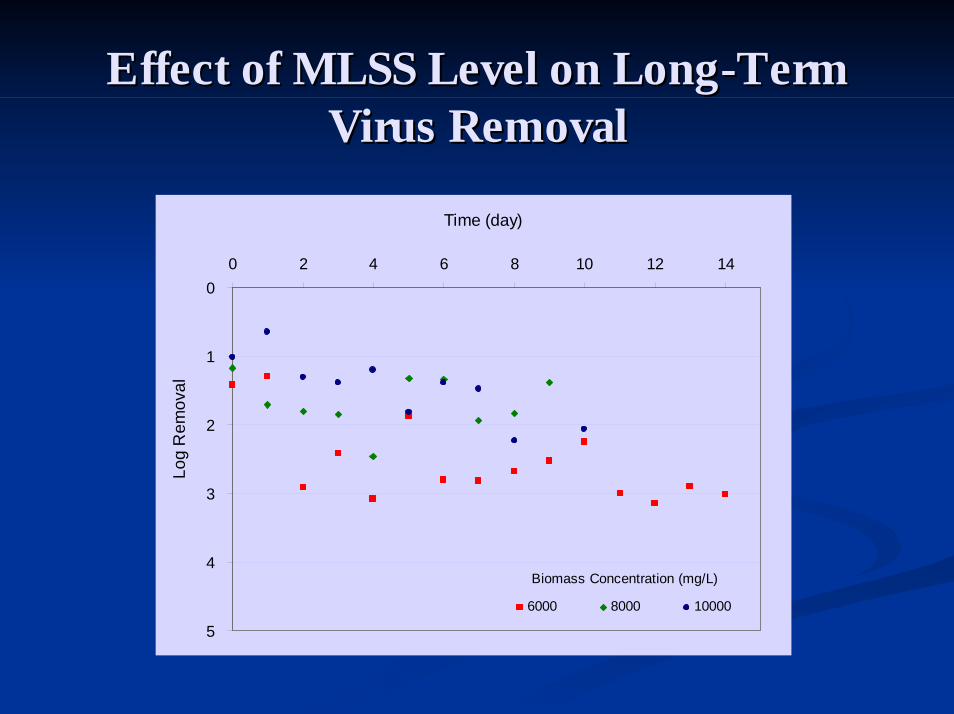
Effect of MLSS Level on LongEffect of MLSS Level on Long--Term Term Virus RemovalVirus Removal
0
1
2
3
4
5
0 2 4 6 8 10 12 14
Time (day)
Log
Rem
oval
6000 8000 10000
Biomass Concentration (mg/L)

Variations in Microbial RemovalVariations in Microbial Removal
0
2
4
6
8
10
0 1 2 3 4 5 6 7
Time elasped (hour)Lo
g R
educ
tion
MS2 rejection with clean waterMS2 rejection with biomass (MLSS=6000 mg/L)E.coli rejection with clean waterE.coli rejection with biomass (MLSS=6000 mg/L)

Effects of MLSS levelsEffects of MLSS levels
0.0
0.5
1.0
1.5
2.0
Lo
g R
emo
val
6000 mg/L 8000 mg/L 10000 mg/L
MLSS Level
Membrane only Membrane+Biomass Membrane+Biofilm+Biomass
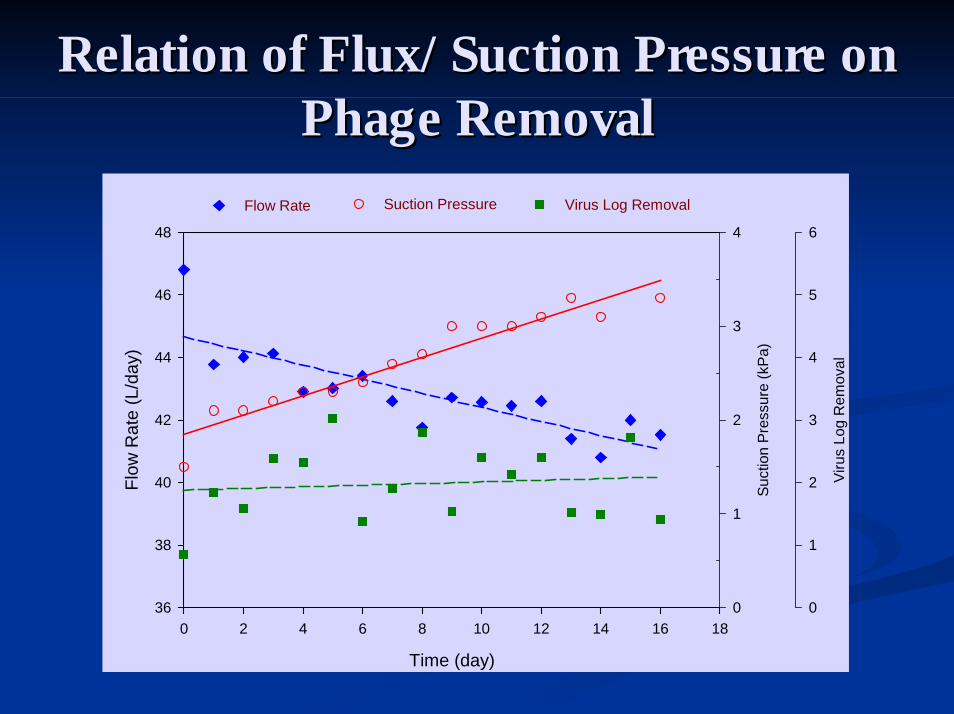
Relation of Flux/Suction Pressure on Relation of Flux/Suction Pressure on Phage RemovalPhage Removal
Time (day)
0 2 4 6 8 10 12 14 16 18
Flow
Rat
e (L
/day
)
36
38
40
42
44
46
48
Suct
ion
Pres
sure
(kPa
)
0
1
2
3
4
0
1
2
3
4
5
6
Flow Rate Suction Pressure Virus Log Removal
Viru
s Lo
g R
emov
al

Effects of Membrane CleaningEffects of Membrane Cleaning
0.0
0.5
1.0
1.5
2.0
0 1 2 3 4 5 6 7
Time (hour)
Log
Rem
oval
Initial Water-cleaned membrane Chemically-cleaned membrane

SummarySummary
Factors affecting virus removal: Factors affecting virus removal:
Presence/absence of biomass & biofilm Presence/absence of biomass & biofilm MLSS concentrations MLSS concentrations Size and surface properties of organismsSize and surface properties of organisms
Contribution of virus removal from the components:Contribution of virus removal from the components:
~ 1.5~ 1.5--log (97%)log (97%)Membrane +Membrane + BiofilmBiofilm + Biomass+ Biomass
~ 0.5~ 0.5--loglogMembrane + BiomassMembrane + Biomass
< 0.5< 0.5--log (68%)log (68%)Membrane onlyMembrane only

Biofilm plays the most important role in Biofilm plays the most important role in removing viruses, but it takes time to develop.removing viruses, but it takes time to develop.
MLSS of 6000 mg/L gives slightly higher MLSS of 6000 mg/L gives slightly higher removal among the three MLSS levels (6000, removal among the three MLSS levels (6000, 8000, and 10000 mg/L).8000, and 10000 mg/L).
E. coli may not a good indicator for an MBR E. coli may not a good indicator for an MBR system, since it is too big in size and can be system, since it is too big in size and can be easily associated with sludge flocs.easily associated with sludge flocs.

Thank You for Your Thank You for Your AttentionAttention