pillar strength and design methodology for stone … pillar strength and design methodology for...
TRANSCRIPT
Pillar Strength and Design Methodology for Stone Mines
Gabriel S. Esterhuizen, Sr. Research Engineer Dennis R. Dolinar, Lead Research Engineer
John L. Ellenberger, Lead Research Scientist NIOSH-Pittsburgh Research Laboratory
Pittsburgh, PA
ABSTRACT
Underground stone mines in the United States make use of the room-and-pillar method of mining. A prerequisite for a safe working environment is that the pillars should adequately support the overburden and the pillar ribs and rooms should remain stable during mining. At present pillar dimensions are either based on experience at neighboring mines or on strength equations that were developed for metal or non-metal mines. This paper presents a pillar design methodology that was developed from a study of pillar performance in operating stone mines. Data were collected that describe the rock mass quality, pillar conditions, mining dimensions and intact rock strength. The results showed that current mining practices have resulted in generally stable pillar layouts with no recent cases of extensive pillar collapses. However, a small number of single failed or failing pillars were observed in otherwise stable layouts. Numerical analyses were used to supplement the observations and develop a pillar strength equation that describes the stable and small number of failed pillars observed. The developed strength equation can be used to design stable pillar layouts provided the factor of safety is greater than 1.8 and the width-to-height ratio of the pillars is greater than 0.8. The paper concludes with guidelines for applying the developed equation and selecting appropriate input parameters.
INTRODUCTION
Underground stone mines in the United States use the roomand-pillar method to extract sedimentary formations that are generally flat lying. Pillar stability is one of the prerequisites for safe working conditions in a room-and-pillar mine. Unstable pillars can result in rock sloughing from the pillar ribs and can lead to the collapse of the roof if one or more pillars should fail. Fall of ground injuries from the roof and pillar ribs accounted for about 15% of lost work days in underground stone mines from 1997 to 2006 (1). About one third of these incidents were associated with rib instability.
Current research at the National Institute for Occupational Safety and Health (NIOSH) has the objective to reduce ground fall accidents in stone mines through safe pillar design. Studies of pillar performance and strength in stone mines (2, 3) highlighted the need for pillar design guidelines that specifically address pillar stability in U.S. stone mines. At present, pillar
dimensions are either based on experience at neighboring mines or on strength equations that were developed for metal or non-metal mines. This paper presents a pillar strength equation with associated design guidelines that will assist in the design of safe room-and-pillar workings in stone mines.
BACKGROUND
In a room-and-pillar mine, the pillars are required to provide global stability which can be defined as supporting the overlying strata up to the surface. In addition, local stability in the form of stable pillar ribs and roof are required to provide safe working conditions. Pillar design is typically carried out by estimating the pillar strength and the pillar stress, and then sizing the pillars so that an adequate margin exists between the expected pillar strength and stress. The factor of safety (FOS) relates the average pillar strength (S) to the average pillar stress (σp), as follows:
=FOS σ S
p (1)
When designing a system of pillars, the FOS must be selected with care, because it must compensate for the variability and uncertainty related to pillar strength and stress and mining inconsistencies. The selection of an appropriate safety factor can be based on a subjective assessment of pillar performance or statistical analysis of failed and stable cases (4, 5, 6, 7). As the FOS decreases, the probability of failure of the pillars can be expected to increase. In practical terms, if one or more pillars are observed to be failed in a layout, it is an indication that the pillar stress is approaching the average pillar strength, causing the weaker pillars to fail. The relationship between FOS and failure probability, however, depends on the uncertainty and variability of the system under consideration (8).
Pillar Strength
Pillar strength can be defined as the maximum resistance of a pillar to axial compression (9). In flat lying deposits, pillar compression is caused by the weight of the overlying rock mass. Empirical evidence suggests that pillar strength is related to both its volume and its shape (4, 6, 9). Numerous equations have been developed that can be used to estimate the strength of pillars in

coal and hard rock mines, and have been reviewed and summarized in the literature (10, 11, 12, 13). These equations are generally empirically developed and are only applicable for conditions similar to those under which they were developed. More recently, numerical model analyses combined with laboratory testing and field monitoring have contributed to the understanding of failure mechanisms and pillar strength (2, 6, 12, 14, 15, 16, 17, 18).
A pillar strength equation that captures both the pillar shape and volume effect is a power equation of the following form, where k is a parameter related to the rock strength, w and h are the pillar width and height and α and β are parameters related to the geomechanical conditions of the rock mass.
wα (2)S = k × βh
Table. 1 Uniaxial compressive strength of limestone rocks collected at mine sites.
Group Average (psi) Range (psi) Samples tested Representative limestone formations Lower Strength 12,800 6,400 – 20,800 50 Burlington, Salem, Galena-Platteville
Medium Strength 19,600 11,900 – 30,000 100 Camp Nelson, Monteagle, Plattin, Vanport, Upper Newman, Chickamauga
High Strength 31,800 22,000 – 43,700 32 Loyalhanna, Tyrone
Pillar Stress
The average pillar stress (σp), in regular layouts of pillars, can be estimated by the tributary area method as follows, where γ is the specific weight of the overlying rocks, h is the depth of cover, w is the pillar width, l is the pillar length and C1 and C2 are the heading and crosscut center distances respectively.
(C × C )σ p = γ ×h × 1 2
(w× l) (3)
This provides an upper limit of the pillar stress and does not consider the presence of barrier pillars or solid abutments that can reduce the average pillar stress. In conditions where the tributary area method is not valid, such as irregular pillars, limited extent of mining or variable depth of cover, numerical models such as Lamodel (19) can be used to estimate the average pillar stress.
Pillar Failure
Pillar failure occurs when a pillar is loaded beyond its peak resistance and load shedding, yielding, shearing or collapse occurs (9). Failure of a single pillar can result in hazardous pillar rib conditions, roof instability in the adjacent mining rooms and blockage of local access ways. Load redistribution caused by the failure of a single pillar can overload adjacent pillars, resulting in wide-area failure (20, 21). These wide-area failures can occur as a catastrophic collapse or gradual closure or “squeeze” over time. They can result in excessive convergence of the mine opening, surface subsidence and disruption of the overlying strata and may cause an air blast if the air is violently forced out of the collapsing area (21). Empirical evidence and theoretical studies suggest that as the width-to-height ratio of pillars is reduced, the potential for
catastrophic failure increases as a result of the rapid decrease in strength of a slender pillar after it has reached its peak load-bearing capacity (20).
Pillars can show signs of instability prior to failure. As the stress in a pillar increases, rock fracturing and spalling can occur at the pillar corners and perimeter. Pillars that are heavily loaded can exhibit an “hourglass” shape. Ultimately, the pillars develop open fractures and rib sloughing as the peak load-bearing capacity is exceeded (22, 23, 24, 25). These signs of failure can be used to visually assess the stability of pillars in underground workings.
PILLAR PERFORMANCE IN STONE MINES
The performance of pillars was assessed at 91 locations in 34 different operating stone mines in the Eastern and Midwestern United States (3). Mines that were likely to have unstable pillars owing to their depth of working or size of pillars were identified as targets for the survey. Data were collected that included both the intended design dimensions and the actual pillar and room dimensions in the underground workings. In older areas of mines, where the original intended design dimensions were unknown, the measured dimensions were assumed to represent the design adequately. The approximate number of pillars in each layout was recorded and the depth of cover determined from surface topography and mine maps. The Lamodel software package (19) was used to estimate of the average pillar stress in cases where the tributary area method was considered inappropriate. Data from the Norton limestone mine in Ohio, which was not visited as part of this study, has been added to the records owing to its great depth and reported stable conditions (26). At each mine, rock samples were collected to determine the uniaxial compressive strength (UCS) and the rock mass was classified using the Rock Mass Rating (RMR) system (27, 28). The UCS results were grouped into three categories based on the average strength of the various formations and are shown in table 1. It can be seen that there is considerable variation in the intact rock strength of the stone being mined. It was found that the RMR varied between 65 and 85 out of a possible 100, which indicates the relatively good rock mass conditions found in these mines.
Successful Pillar Layouts
The survey revealed that all of the 91 pillar layouts observed at the 34 different mines could be classified as successful in providing global stability by supporting the overburden load up to the ground surface. Table 2 summarizes the dimensions and cover depth of the pillar layouts that were investigated. Not all the pillar layouts were fully successful in providing local stability in the form of stable roof spans and pillar ribs. Single failed pillars
were observed that were surrounded by stable pillars. These cases of individual pillar failure are evaluated below, and do not represent failure of the layout in providing global stability.
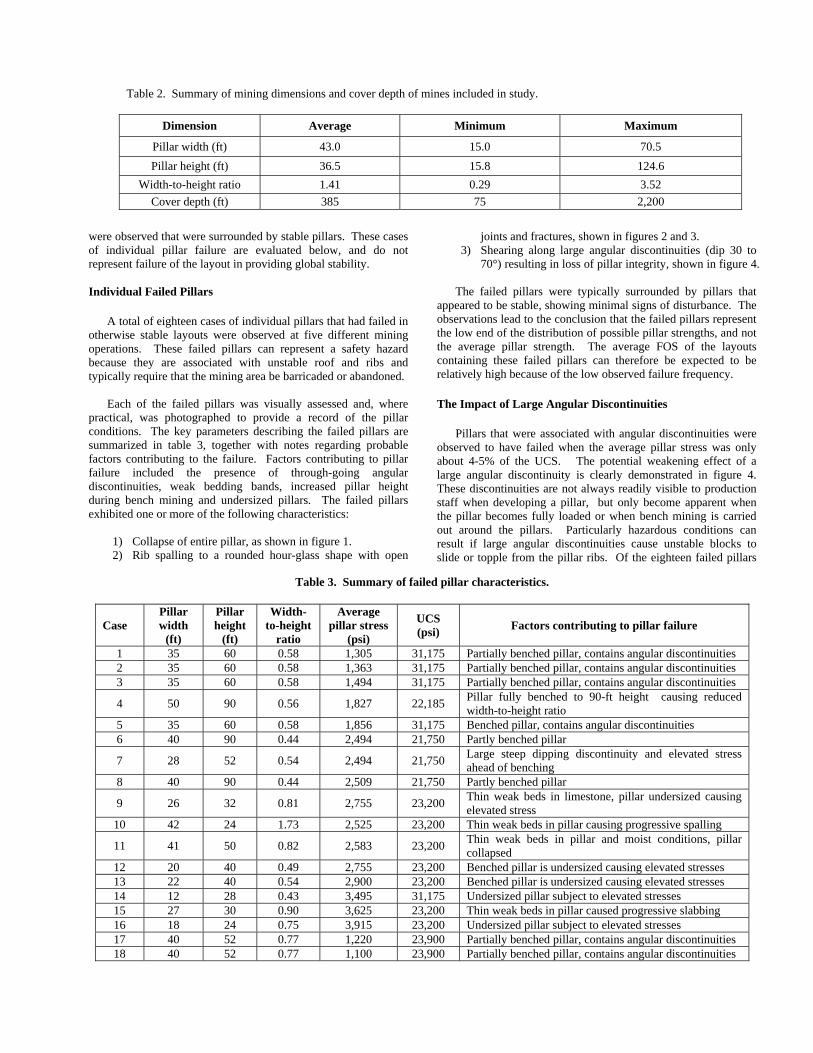
Table 2. Summary of mining dimensions and cover depth of mines included in study.
Dimension Average Minimum Maximum
Pillar width (ft) 43.0 15.0 70.5 Pillar height (ft) 36.5 15.8 124.6
Width-to-height ratio 1.41 0.29 3.52 Cover depth (ft) 385 75 2,200
Individual Failed Pillars
A total of eighteen cases of individual pillars that had failed in otherwise stable layouts were observed at five different mining operations. These failed pillars can represent a safety hazard because they are associated with unstable roof and ribs and typically require that the mining area be barricaded or abandoned.
Each of the failed pillars was visually assessed and, where practical, was photographed to provide a record of the pillar conditions. The key parameters describing the failed pillars are summarized in table 3, together with notes regarding probable factors contributing to the failure. Factors contributing to pillar failure included the presence of through-going angular discontinuities, weak bedding bands, increased pillar height during bench mining and undersized pillars. The failed pillars exhibited one or more of the following characteristics:
1) Collapse of entire pillar, as shown in figure 1. 2) Rib spalling to a rounded hour-glass shape with open
joints and fractures, shown in figures 2 and 3. 3) Shearing along large angular discontinuities (dip 30 to
70°) resulting in loss of pillar integrity, shown in figure 4.
The failed pillars were typically surrounded by pillars that appeared to be stable, showing minimal signs of disturbance. The observations lead to the conclusion that the failed pillars represent the low end of the distribution of possible pillar strengths, and not the average pillar strength. The average FOS of the layouts containing these failed pillars can therefore be expected to be relatively high because of the low observed failure frequency.
Table 3. Summary of failed pillar characteristics.
Case Pillar width
(ft)
Pillar height
(ft)
Width-to-height
ratio
Average pillar stress
(psi)
UCS (psi) Factors contributing to pillar failure
1 35 60 0.58 1,305 31,175 Partially benched pillar, contains angular discontinuities 2 35 60 0.58 1,363 31,175 Partially benched pillar, contains angular discontinuities 3 35 60 0.58 1,494 31,175 Partially benched pillar, contains angular discontinuities
4 50 90 0.56 1,827 22,185 Pillar fully benched to 90-ft height causing reduced width-to-height ratio
5 35 60 0.58 1,856 31,175 Benched pillar, contains angular discontinuities 6 40 90 0.44 2,494 21,750 Partly benched pillar
7 28 52 0.54 2,494 21,750 Large steep dipping discontinuity and elevated stress ahead of benching
8 40 90 0.44 2,509 21,750 Partly benched pillar
9 26 32 0.81 2,755 23,200 Thin weak beds in limestone, pillar undersized causing elevated stress
10 42 24 1.73 2,525 23,200 Thin weak beds in pillar causing progressive spalling
11 41 50 0.82 2,583 23,200 Thin weak beds in pillar and moist conditions, pillar collapsed
12 20 40 0.49 2,755 23,200 Benched pillar is undersized causing elevated stresses 13 22 40 0.54 2,900 23,200 Benched pillar is undersized causing elevated stresses 14 12 28 0.43 3,495 31,175 Undersized pillar subject to elevated stresses 15 27 30 0.90 3,625 23,200 Thin weak beds in pillar caused progressive slabbing 16 18 24 0.75 3,915 23,200 Undersized pillar subject to elevated stresses 17 40 52 0.77 1,220 23,900 Partially benched pillar, contains angular discontinuities 18 40 52 0.77 1,100 23,900 Partially benched pillar, contains angular discontinuities
The Impact of Large Angular Discontinuities
Pillars that were associated with angular discontinuities were observed to have failed when the average pillar stress was only about 4-5% of the UCS. The potential weakening effect of a large angular discontinuity is clearly demonstrated in figure 4. These discontinuities are not always readily visible to production staff when developing a pillar, but only become apparent when the pillar becomes fully loaded or when bench mining is carried out around the pillars. Particularly hazardous conditions can result if large angular discontinuities cause unstable blocks to slide or topple from the pillar ribs. Of the eighteen failed pillars

shown in table 3, seven were associated with large angular discontinuities.
Large discontinuities were observed to be present in 22 of the 34 stone mines surveyed. These large discontinuities can be widely spaced, extend from the roof to the floor of the workings and the strike extent can be several hundred feet. The spacing appears to follow a negative exponential distribution with 75% of the discontinuities less than 40 ft apart. The average dip was 81° with only 18% of the observations having a dip of less than 70°.
The Impact of Weak Bedding Bands within a Pillar
The presence of near-horizontal, thin weak bands within a pillar was observed to be a contributing factor in four of the failed pillar cases. A study of the effect of weak bands on pillar strength
(29) showed that extrusion of the weak material can induce tension in the surrounding rock, which promotes failure by progressive spalling at much lower stress than the compressive strength of the rock mass. A similar mechanism is described by Brady and Brown (9). The pillar shown in figure 2, listed as case 10 in table 3, is an example of a pillar that the authors believe failed by this mechanism. At present there is insufficient information to draw general conclusions regarding the conditions that might lead to this type of failure. It is not clear, for example, why only the single pillar shown in figure 2 failed while the rest of the pillars in the area did not show signs of distress, in spite of appearing to have similar weak bands.
Figure 1. Remaining stump of a collapsed pillar in an abandoned area. Thin weak beds in the pillar and moist
conditions are thought to have contributed to the failure. The width-to-height ratio was 0.82 and average pillar stress about
11% of the UCS.ws
Figure 2. Pillar that has an original width-to-height ratio of 1.7 failed by progressive spalling. Thin weak beds are thought
to have contributed to the failure. The average pillar stress was about 11% of the UCS prior to failure.
Figure 3. Partially benched pillar failing under elevated stresses at the edge of bench mining. Typical hourglass
formation indicating overloaded pillar. Width-to-height ratio is 0.44 based on full benching height. The average pillar stress
was about 12% of the UCS.
Figure 4. Partially benched pillar that failed along two angular discontinuities. Width-to-height ratio is 0.58 based on full
benching height. The average pillar stress was about 4% of the UCS.

Wide-Area Failures
Two cases of wide-area pillar failure have been reported in stone mines that are no longer operating (30). The first case was a reported collapse of a small stone mining operation that may have been the result of a sudden collapse of the pillars. The pillar dimensions were variable and insufficient information exists to evaluate this event for estimating pillar strength.
The second case was a reported failure in which an area of about 20 pillars was alleged to have failed (30). An investigation of this reported failure revealed that the pillars had not actually failed, but moisture-related yield of the weak floor may have occurred and caused the roof to collapse around the pillars (31). The pillars were seen to be intact within the collapsed area. Consequently, this case has been discarded for estimating pillar strength because the pillars had not failed. However, it does highlight the fact that the potential for floor yield should be evaluated when designing a stone mine pillar layout, e.g. by drilling into the floor during exploration.
These two case histories, while not directly useful for evaluating stone pillar strength, do emphasize the fact that wide-area failures can occur.
Pillar Rib Stability
The provision of stable pillar ribs is necessary for safe mining operations. Rib instability can be caused by unfavorable jointing in the rock mass, by rock fracturing under elevated stresses caused by undersized pillars or by poor blasting practice. Figure 5 shows an example of stress-related rib spalling at approximately 900 ft of cover. It was found in some cases that stress-related rib spalling can occur when the average pillar stress exceeds about 11-12% of the UCS. Rib supports, such as screen and bolts, are sometimes used to secure the pillar ribs.
Figure 5. Example of rib slabbing and resulting concave pillar ribs that can initiate when average pillar stress
exceeds about 11% of the UCS.
Summary of Stone Mine Pillar Observations
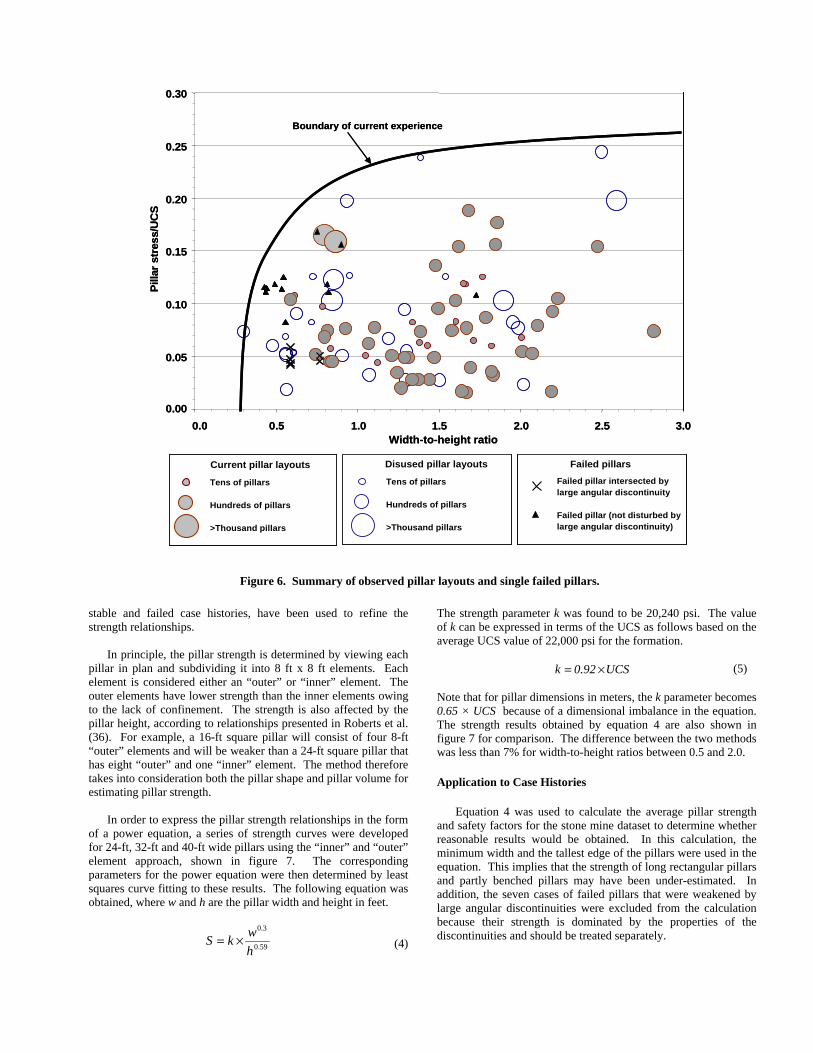
The pillar layouts that were surveyed by NIOSH are presented in figure 6 which shows the pillar stress against the width-toheight ratio. The pillar stress is normalized by the average UCS of each formation, obtained from table 3. The chart also includes
data points representing the 18 failed pillars, while failures associated with the presence of large angular discontinuities are indicated separately. Information on the approximate number of pillars in each pillar layout and layouts that are no longer in use are indicated. Layouts that are disused may have been abandoned because of stability concerns, depletion of reserves or changes in operating procedures. A bounding curve was drawn around the case histories, which represents the limit of current experience with stone pillar performance.
For the purpose of preparing this chart, the width-to-height ratio of the pillars was based on the minimum pillar width. Where pillars were partially benched, the full height of benching was used to represent the pillar height. Actual underground measurements of room and pillar dimensions were used.
All the pillar layouts shown in the chart can be considered to have been “successful” in the objective of providing global support. The results show that these “successful” pillar layouts contain many thousands of stable pillars while the single failed pillars represent only a very small part of the total population of pillars. The relatively low strength of the failed pillars that contained angular discontinuities is also clearly indicated. The chart can be used to compare a current or proposed pillar layout with past experience (32).
A PILLAR STRENGTH EQUATION FOR STONE MINES
The database on stone mine pillar performance contains information on many stable pillar systems but only eighteen individual failed pillars, which are likely to be the weakest members of the population of pillars. These data are therefore not representative of the average stone pillar strength and are not sufficient to develop a strength equation for stone mines. Consequently, information from other mining operations that are similar to stone mine room-and-pillar workings were sought to provide a basis for developing a strength equation.
Records of stable and failed pillars in the lead mines of the Viburnum Trend in Southeastern Missouri were considered to be the most appropriate for developing a strength equation for stone mines. The workings are flat-lying and room-and-pillar operations have been conducted with mostly square pillars (33) since the 1960’s. The host rock is dolomitized limestone with similar strength characteristics to limestone. The average UCS of the rock is approximately 22,000 psi (34), which falls within the upper range of limestone formation strengths. The rock mass quality was assessed at several different underground locations by the authors and found to fall within the range found in stone mines. It is recognized that the presence of mineralization within the host rock can affect the rock strength and post failure behavior. However, the stages of failure development observed underground and reported by Lane et al. (35) are very similar to those seen in stone pillars. Importantly, a wide-area pillar collapse occurred at one of these mine operations during the 1980’s, which provides valuable data on the ultimate pillar strength (30).
A well-documented pillar design procedure has been developed for these mines based on the observation of failed and stable pillars (35, 36). The design technique makes use of numerical models to estimate pillar loading while pillar strength is estimated by a set of strength relationships which are based on the confinement principle, modified after Lunder and Pakalnis (12). Direct observations of hundreds of pillars, which included both
stable and failed case histories, have been used to refine the strength relationships.
In principle, the pillar strength is determined by viewing each pillar in plan and subdividing it into 8 ft x 8 ft elements. Each element is considered either an “outer” or “inner” element. The outer elements have lower strength than the inner elements owing to the lack of confinement. The strength is also affected by the pillar height, according to relationships presented in Roberts et al. (36). For example, a 16-ft square pillar will consist of four 8-ft “outer” elements and will be weaker than a 24-ft square pillar that has eight “outer” and one “inner” element. The method therefore takes into consideration both the pillar shape and pillar volume for estimating pillar strength.
In order to express the pillar strength relationships in the form of a power equation, a series of strength curves were developed for 24-ft, 32-ft and 40-ft wide pillars using the “inner” and “outer” element approach, shown in figure 7. The corresponding parameters for the power equation were then determined by least squares curve fitting to these results. The following equation was obtained, where w and h are the pillar width and height in feet.
0.3wk ×S = 0.59 (4)h
The strength parameter k was found to be 20,240 psi. The value of k can be expressed in terms of the UCS as follows based on the average UCS value of 22,000 psi for the formation.
k = 0.92 ×UCS (5)
Note that for pillar dimensions in meters, the k parameter becomes 0.65 × UCS because of a dimensional imbalance in the equation. The strength results obtained by equation 4 are also shown in figure 7 for comparison. The difference between the two methods was less than 7% for width-to-height ratios between 0.5 and 2.0.
Tens of pillars
Hundreds of pillars
>Thousand pillars
Current pillar layoutsTens of pillars
Hundreds of pillars
>Thousand pillars
Disused pillar layouts Failed pillarsFailed pillar intersected by large angular discontinuity
Failed pillar (not disturbed by large angular discontinuity)
Tens of pillars
Hundreds of pillars
>Thousand pillars
Current pillar layouts
Tens of pillars
Hundreds of pillars
>Thousand pillars
Disused pillar layouts Failed pillarsFailed pillar intersected by large angular discontinuity
Failed pillar (not disturbed by large angular discontinuity)
0.0.3300
0.00
0.05
0.10
0.15
0.20
0.25Pi
llar s
tres
s/U
CS
Boundary of current experience
0.00
0.05
0.10
0.15
0.20
0.25 Pi
llar s
tres
s/U
CS
Boundary of current experience
0.00.0 00..55 1.1.00 1.1.55 2.2.00 2.2.55 3.3.00 WiWidth-to-hdth-to-heieighght ratiot ratio
Tens of pillars
Hundreds of pillars
>Thousand pillars
Current pillar layouts Tens of pillars
Hundreds of pillars
>Thousand pillars
Disused pillar layouts Failed pillars Failed pillar intersected by large angular discontinuity
Failed pillar (not disturbed by large angular discontinuity)
Figure 6. Summary of observed pillar layouts and single failed pillars.
Application to Case Histories
Equation 4 was used to calculate the average pillar strength and safety factors for the stone mine dataset to determine whether reasonable results would be obtained. In this calculation, the minimum width and the tallest edge of the pillars were used in the equation. This implies that the strength of long rectangular pillars and partly benched pillars may have been under-estimated. In addition, the seven cases of failed pillars that were weakened by large angular discontinuities were excluded from the calculation because their strength is dominated by the properties of the discontinuities and should be treated separately.

24 ft-wide pillar
40 ft-wide pillar
32-ft-wide pillar
Roberts et al. (36)Equation 30.0.1010
0.0.4040
0.0.5050
0.0.6060
0.00
-
-
0.00
24-ft-wide pillar
40-ft-wide pillar
32-ft-wide pillar
Roberts et al. (36) Equation 3
PPilla
r sill
ar s
ttrreess
ss/U/U
CCSS
0.0.3030
0.0.2020
0.0.0000 0.0.5050 1.1.0000 1.1.5050 22..0000
WWiidth-to-hdth-to-height ratioeight ratio
Figure 7. Comparison of predicted pillar strength using the method of Roberts et al. (36) and equation 4.
The results should show that the FOS values of the stable layouts are greater than 1.0 and greater than that of the failed cases. In addition, the failed cases can be expected to have a relatively lower average FOS. However, the average calculated FOS of the failed pillars can be expected to be somewhat greater than 1.0 because the calculation was carried out using average strength values while the failed pillars are likely to have been weaker, which contributed to their failure. The results are presented in figure 8 which shows the distribution of the FOS for the stable pillar layouts and the individual failed pillars. It can be seen that the FOS values of the successful pillar layouts are all greater than 1.0, as expected, with the largest concentration of FOS values falling in the range of 4.0 to 5.0. The minimum FOS of the successful cases was 1.5, which is considered to be reasonable, since no instances were observed in which large numbers of pillars showed signs of distress and overloading, as one might expect in cases where the average FOS approaches 1.0.
Stable Pillar Layouts
Failed Single Pillars
2525
2020 Stable Pillar Layouts
Failed Single Pillars
11 22 33 44 55 66 77 88 99 1010 1111 1122 1133 1414 1515 1616 1717 1818 1199 2200
FFaaccttoror of Saof Saffeettyy
Fre
Freq
uenc
quen
cyy
1515
1010
55
00 00
Figure 8. Distribution of factors of safety of successful pillar systems and single failed pillars using equation 4.
Failed pillars that were intersected by large angular discontinuities were excluded from the chart.
The failed pillars can be seen to fall in the FOS range of 1.0 to 4.0 with an average FOS of 2.35. The relatively high value of FOS is not unexpected, since the calculation used best estimates of rock strength and loading, which did not necessarily include local strength variations or geological structures that may have caused the individual pillars to fail at these apparently high FOS values. It was concluded that equation 4 provides a reasonable agreement with the observed stable and failed pillar performance in stone mines. However, the observations showed that large angular discontinuities can have a significant impact on pillar stability and should be incorporated explicitly in the pillar strength equation. In addition, several of the stone mines are making use of rectangular pillars to assist with roof control and ventilation control. These rectangular pillar s can be expected to be stronger than square pillars and should also be accommodated in the pillar design equation. Adjustments to equation 4 are presented below that will allow these two parameters to be included.
Adjustment for the Presence of Large Discontinuities
An adjustment for the presence of large discontinuities in pillars should account for both their inclination and spacing.
Large discontinuities can be widely spaced and do not necessarily intersect each pillar in a layout. The two-dimensional UDEC (37) program was used to assist in investigating the potential effect of a single large discontinuity on the strength of pillars with width-toheight ratios of 0.5 to 1.5. In these models the discontinuities were assumed to be smooth and planar, having a friction angle of 30 deg with little or no cohesion. The two-dimensional models simulated rib-pillars in which the strike of the discontinuities were parallel to the pillar edges, and the discontinuities were assumed to pass through the centers of the pillars, producing conservative results. Table 4 provides a summary of the results, expressed as a reduction factor that relates the strength of a pillar intersected by a single large discontinuity to the undisturbed pillar strength, and is referred to as the discontinuity dip factor (DDF). The table shows that discontinuities can have a significant impact on pillar strength and the impact is exacerbated as the width-to-height ratio decreases.
When considering the stability of a single pillar that is intersected by a large discontinuity, the DDF values shown in table 4 are applicable. However, these factors would be conservative for assessing a layout of many pillars, because the large discontinuities can be widely spaced and may not necessarily intersect every pillar. A further adjustment, called the frequency factor (FF), is suggested. The average impact of large discontinuities on the strength of pillars in a layout can then be estimated as follows, and is called the large discontinuity factor (LDF), where DDF is the discontinuity dip factor shown in table 4, and FF is the frequency factor related to the frequency of large discontinuities per pillar shown in table 5.
LDF = 1 – DDF � FF (6)
If there are no large discontinuities present, FF is equal to zero and LDF will equal 1.0, having no effect on pillar strength. The frequency of large discontinuities per pillar can easily be estimated by dividing the pillar width by the average spacing of the large discontinuities. For example, if we are designing pillars that are 30 ft wide at a width-to-height ratio of 1.0 and we want to know the impact of large discontinuities that are spaced 100 ft apart, dipping at 50 degrees, we can proceed as follows:
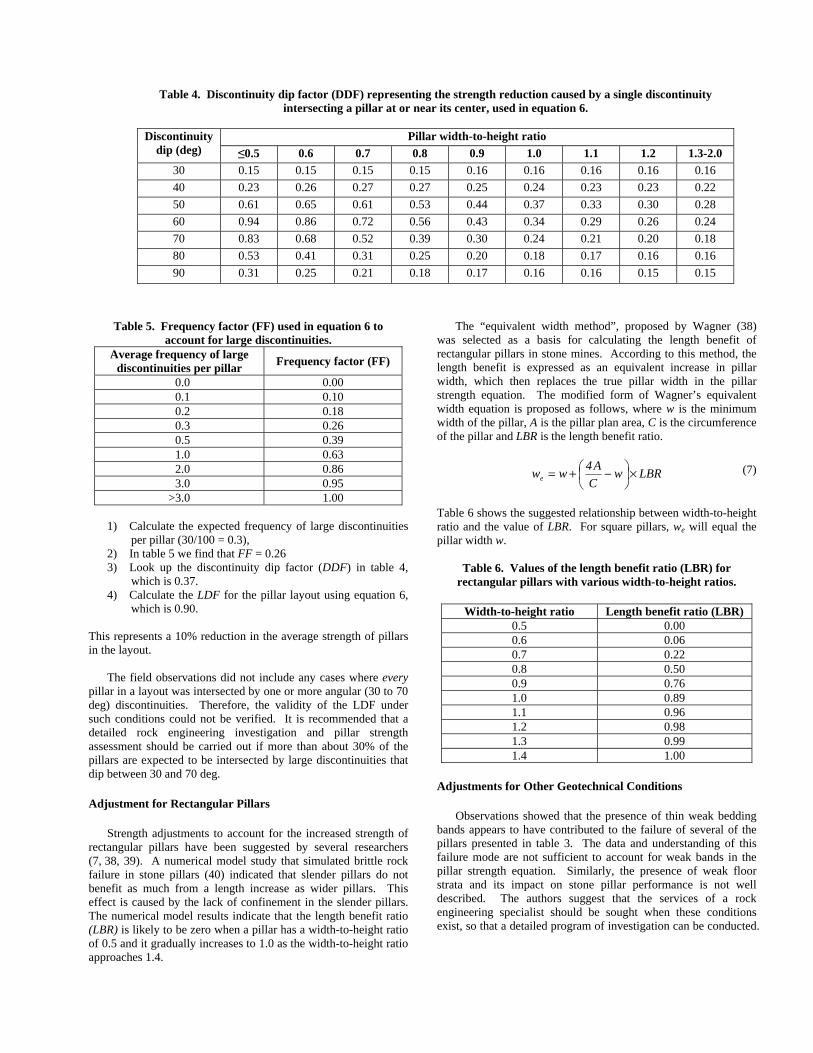
1) Calculate the expected frequency of large discontinuities per pillar (30/100 = 0.3),
2) In table 5 we find that FF = 0.26 3) Look up the discontinuity dip factor (DDF) in table 4,
which is 0.37. 4) Calculate the LDF for the pillar layout using equation 6,
which is 0.90.
This represents a 10% reduction in the average strength of pillars in the layout. The field observations did not include any cases where every pillar in a layout was intersected by one or more angular (30 to 70 deg) discontinuities. Therefore, the validity of the LDF under such conditions could not be verified. It is recommended that a detailed rock engineering investigation and pillar strength assessment should be carried out if more than about 30% of the pillars are expected to be intersected by large discontinuities that dip between 30 and 70 deg.
Table 4. Discontinuity dip factor (DDF) representing the strength reduction caused by a single discontinuity intersecting a pillar at or near its center, used in equation 6.
Discontinuity dip (deg)
Pillar width-to-height ratio ≤0.5 0.6 0.7 0.8 0.9 1.0 1.1 1.2 1.3-2.0
30 0.15 0.15 0.15 0.15 0.16 0.16 0.16 0.16 0.16 40 0.23 0.26 0.27 0.27 0.25 0.24 0.23 0.23 0.22 50 0.61 0.65 0.61 0.53 0.44 0.37 0.33 0.30 0.28 60 0.94 0.86 0.72 0.56 0.43 0.34 0.29 0.26 0.24 70 0.83 0.68 0.52 0.39 0.30 0.24 0.21 0.20 0.18 80 0.53 0.41 0.31 0.25 0.20 0.18 0.17 0.16 0.16 90 0.31 0.25 0.21 0.18 0.17 0.16 0.16 0.15 0.15
Table 5. Frequency factor (FF) used in equation 6 to account for large discontinuities.
Average frequency of large discontinuities per pillar Frequency factor (FF)
0.0 0.00 0.1 0.10 0.2 0.18 0.3 0.26 0.5 0.39 1.0 0.63 2.0 0.86 3.0 0.95
>3.0 1.00
Adjustment for Rectangular Pillars
Strength adjustments to account for the increased strength of rectangular pillars have been suggested by several researchers (7, 38, 39). A numerical model study that simulated brittle rock failure in stone pillars (40) indicated that slender pillars do not benefit as much from a length increase as wider pillars. This effect is caused by the lack of confinement in the slender pillars. The numerical model results indicate that the length benefit ratio (LBR) is likely to be zero when a pillar has a width-to-height ratio of 0.5 and it gradually increases to 1.0 as the width-to-height ratio approaches 1.4.
The “equivalent width method”, proposed by Wagner (38) was selected as a basis for calculating the length benefit of rectangular pillars in stone mines. According to this method, the length benefit is expressed as an equivalent increase in pillar width, which then replaces the true pillar width in the pillar strength equ ation. The modified form of Wagner’s equivalent width equation is proposed as follows, where w is the minimum width of the pillar, A is the pillar plan area, C is the circumference of the pillar and LBR is the length benefit ratio.
⎛ 4 A ⎞we = w + ⎜ − w ⎟× LBR (7)⎝ C ⎠
Table 6 shows the suggested relationship between width-to-height ratio and the value of LBR. For square pillars, we will equal the pillar width w.
Table 6. Values of the length benefit ratio (LBR) for rectangular pillars with various width-to-height ratios.
Width-to-height ratio Length benefit ratio (LBR) 0.5 0.00 0.6 0.06 0.7 0.22 0.8 0.50 0.9 0.76 1.0 0.89 1.1 0.96 1.2 0.98 1.3 0.99 1.4 1.00
Adjustments for Other Geotechnical Conditions
Observations showed that the presence of thin weak bedding bands appears to have contributed to the failure of several of the pillars presented in table 3. The data and understanding of this failure mode are not sufficient to account for weak bands in the pillar strength equation. Similarly, the presence of weak floor strata and its impact on stone pillar performance is not well described. The authors suggest that the services of a rock engineering specialist should be sought when these conditions exist, so that a detailed program of investigation can be conducted.
Pillar Strength Equation for Stone Mines
The strength equation for stone mine pillars with the large discontinuity and rectangular pillar adjustments can be rewritten as follows, where UCS is the uniaxial compressive strength of the intact rock, LDF is the large discontinuity factor, w and h are the pillar width and height in feet. For rectangular pillars, w is replaced by the equivalent width we, which can be calculated using equation 7. The value of LDF can be determined from equation 6. If no large discontinuities are present, LDF will equal 1.0.
w 0.3
S = 0.92 ×UCS × LDF × (8)h 0.59
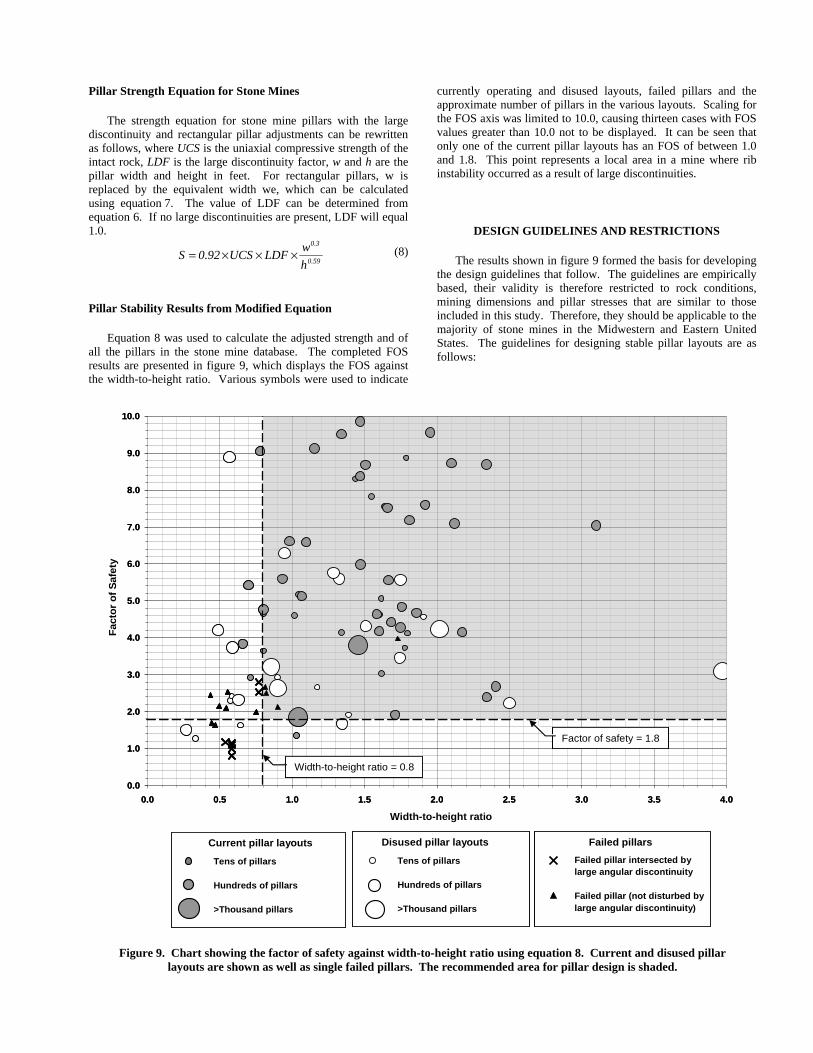
Pillar Stability Results from Modified Equation
Equation 8 was used to calculate the adjusted strength and of all the pillars in the stone mine database. The completed FOS results are presented in figure 9, which displays the FOS against the width-to-height ratio. Various symbols were used to indicate
currently operating and disused layouts, failed pillars and the approximate number of pillars in the various layouts. Scaling for the FOS axis was limited to 10.0, causing thirteen cases with FOS values greater than 10.0 not to be displayed. It can be seen that only one of the current pillar layouts has an FOS of between 1.0 and 1.8. This point represents a local area in a mine where rib instability occurred as a result of large discontinuities.
Tens of pillars
Hundreds of pillars
>Thousand pillars
Current pillar layoutsTens of pillars
Hundreds of pillars
>Thousand pillars
Disused pillar layouts Failed pillarsFailed pillar intersected by large angular discontinuity
Failed pillar (not disturbed by large angular discontinuity)
Width to height ratio = 0.8
Factor of safety = 1.8
Width to height ratio = 0.8
Factor of safety = 1.8
Fact
or o
f Saf
ety
0.0
1.0
2.0
3.0
4.0
5.0
6.0
7.0
8.0
9.0
10.0
- -
0.0
1.0
2.0
3.0
4.0
5.0
6.0
7.0
8.0
9.0
10.0
- -Width-to-height ratio = 0.8
Factor of safety = 1.8
0.0.00 00.5.5 11..00 11..55 2.2.00 22..55 3.3.00 33..55
Width-to-height ratio
Tens of pillars
Hundreds of pillars
>Thousand pillars
Current pillar layouts Tens of pillars
Hundreds of pillars
>Thousand pillars
Disused pillar layouts Failed pillars Failed pillar intersected by large angular discontinuity
Failed pillar (not disturbed by large angular discontinuity)
4.4.00
Figure 9. Chart showing the factor of safety against width-to-height ratio using equation 8. Current and disused pillar layouts are shown as well as single failed pillars. The recommended area for pillar design is shaded.
DESIGN GUIDELINES AND RESTRICTIONS
The results shown in figure 9 formed the basis for developing the design guidelines that follow. The guidelines are empirically based, their validity is therefore restricted to rock conditions, mining dimensions and pillar stresses that are similar to those included in this study. Therefore, they should be applicable to the majority of stone mines in the Midwestern and Eastern United States. The guidelines for designing stable pillar layouts are as follows:

1) Equation 8 can be used to estimate the average strength of pillars in flat-lying room-and-pillar stone mines. The equation specifically excludes cases where the floor may yield or low strength bedding bands exist that can extrude and weaken the pillars.
2) The presence of widely spaced large discontinuities that extend from the roof to the floor of the workings can be accommodated in the equation, however further investigation will be required if more than about 30% of the pillars in a layout are likely to be intersected by one or more large discontinuities that dip between dip 30 and 70 deg.
3) The final pillar height should be used when calculating pillar strength. Where floor benching will be conducted, the final benched height should therefore be used. For rectangular pillars, the pillar strength should be calculated by using the equivalent width (equation 7 and table 6).
4) The average pillar stress can be estimated by using the tributary area method ( equation 3) or by using appropriate numerical models, as discussed earlier.
5) The recommended factor of safety against pillar failure is 1.8 and can be seen in figure 9 to represent the lower bound of current experience. Since the effect of large discontinuities is accounted for in the pillar strength equation, this safety factor is equally valid for pillars that are intersected by large discontinuities.
6) Pillars having a width-to-height ratio of less than 0.8 should be avoided. Figure 9 shows that there has been a natural tendency for mines to avoid these slender pillars. Nine of the layouts that had width-to-height ratios of less than 0.8 are no longer in use for various reasons, while only four mines are currently operating with these slender pillars. In addition, this study and other investigations have shown that slender pillars are more severely affected by the presence of discontinuities than wider pillars (15, 41). Studies have also shown that as the width-to-height ratio decreases below 0.8, the confining stresses within a pillar approach zero and brittle fracturing can occur throughout the unconfined pillar core (11, 15, 42). The confining stress can be further reduced if low friction contacts exist between the pillar and the surrounding rock.
7) Inspection of figure 9 reveals that a number of stable layouts exist that have large safety factors (>3.0) and width-to-height ratios that are less than 0.8. These layouts are mostly at very shallow depths of cover, typically less than 200 ft, and it has been possible to mine with very slender pillars. These pillars were found to be either very narrow, as little as 15 ft, or very tall, up to 125 ft. The strength and loading of narrow pillars are both sensitive to small variations in the overbreak, blast damage and pillar spacing. Large tall pillars, on the other hand, have high ribs which can represent a safety hazard and the roof becomes inaccessible and poorly visible with increased severity of po tential rock fall impacts. The strength of these slender pillars is also more adversely impacted by the presence of unfavorable discontinuities than wider pillars. It is therefore not advisable to design layouts with such slender pillars, even with high calculated factors of safety.
8) Equation 8 should only be used up to average pillar stress values that are 25% of the UCS to remain within the limits of past experience, as seen in figure 6. Since the design approach is entirely based on past experience, no comments can be made about pillar stability when pillars are loaded beyond 25% of the UCS.
9) Rib spalling can initiate when the pillar stress exceeds
about 11% of the UCS, which presents a potential safety hazard. Mitigation in the form of scaling or rib support may be required. Excessive scaling should be avoided, since it will reduce the pillar size and can result in increased pillar stress, exacerbating the situation.
10) Pillar design cannot be carried out without considering roof stability. Roof spans directly impact the pillar stresses, because wider roof spans imply higher stresses in the pillars. As part of the pillar design, an evaluation of roof span stability and likely maximum stable spans should be conducted. Summaries of the experience with roof span stability in stone mines and layout considerations are provided in Esterhuizen et al. (43) and Iannacchione et al. (44).
The shaded zone in figure 9 indicates the area in which equation 8 is likely to produce stable pillar layouts and coincides with the current experience in stone mines and observations of failed pillars. Since the design recommendations are based entirely on the observed performance of stone pillars, pillars that plot outside the shaded area in figure 9 are beyond the validity of these design guidelines.
DESIGN INPUT
Obtaining appropriate input to calculate pillar strength can sometimes be a challenge. Two design scenarios are presented below and the data requirements discussed. The first is called a scoping study in which no, or limited, geotechnical data might be available and the objective is simply to assess various pillar layout options. The second scenario is a final pillar design where accurate, representative geotechnical data is required.
Data for a Scoping Study
A scoping study should be carried out using conservative estimates of any unknown parameters. If the UCS is unknown, and the name of the stone formation is listed in table 1, the lower value of the range of strengths should be used. In other cases, a conservative estimate of the UCS at 6,400 psi is suggested. If the presence and frequency of large discontinuities is unknown, a conservative value of the discontinuity frequency of 1 per pillar should be used and a discontinuity dip of 60 deg. The average pillar stress can be calculated using the tributary area method (equation 3), since it provides a conservative upper limit result. The maximum depth of cover would typically be used in such a calculation.
Data for a Final Design
Equation 8 can be used to assist in developing a final pillar design if sufficient rock strength and rock mass data are available. Data required will include:
1. A reliable determination of the average UCS of the pillar material.
2. A geotechnical description of the rock mass and determination of the RMR value. This is required to verify that the rock mass quality, as expressed by the RMR, falls within the range of 65 to 85.
3. Identification of the presence or absence of large angular discontinuities that can impact pillar strength. The average dip of the discontinuities and their average spacing should be determined.

4. Verification that weak bedding bands do not exist in the proposed pillars and the floor strata are competent.
5. The average pillar stress which can be calculated using the tributary area method (equation 3) if appropriate, or numerical models.
The required data can be obtained through standard geotechnical procedures which can include geotechnical logging of core, strength testing of rock samples in a rock mechanics laboratory, and mapping of rock exposures in outcrops and underground in the mine.
CONCLUSIONS
This study has shown that the pillars in underground stone mines are expected to perform under a wide variety of depths of cover, rock strengths and geotechnical conditions. Pillar designs should be adapted to account for these variations in conditions. This paper provides a pillar strength equation that can be used to design stable pillar layouts provided the factor of safety is greater than 1.8 and the width-to-height ratio of the pillars are greater than 0.8. Recommendations are provided for selecting appropriate input parameters when geotechnical data is limited.
The study has further shown that:
• Two cases of wide-area roof failure occurred in stone mines in the past that may have been related to pillar and floor instability. These two cases could not be used to evaluate the pillar strength.
• A total of eighteen individual failed pillars and several thousand stable pillars were observed. The failed pillars resulted in rib and roof stability hazards.
• Large angular discontinuities were observed to cause a significant reduction in pillar strength and were a contributing factor in the failure of seven of the eighteen failed pillars. The suggested pillar strength equation accounts for the weakening effect of large angular discontinuities.
• Fourteen of the eighteen failed pillars had width-to-height ratios of less than 0.8. The pillar design guidelines suggest that pillars with width-to-height ratios of less than 0.8 should be avoided.
• The upper limit of the average pillar stress of the layouts included in the study is about 25% of the UCS. The design guidelines suggest that the strength equation should not be used to design pillars when the average pillar stress will exceed 25% of the UCS.
• Rib spalling can create a rock fall hazard. In some mines, rib spalling was observed to initiate when average pillar stress exceeded about 11% of the uniaxial compressive strength of the rock.
• Rectangular pillars are increasingly used to assist in stone mine roof control and ventilation control. The suggested strength equation accounts for the strengthening effect of a rectangular pillar shape on its strength.
The design guidelines presented in this paper were developed from direct observation of actual pillar performance in US stone mines, and therefore should only be applied in rock conditions and mining geometries that are similar to those included in the study.
Disclaimer
The findings and conclusions in this paper have not been formally disseminated by the National Institute for Occupational Safety and Health and should not be construed to represent any agency determination or policy.
REFERENCES
1. Mine Safety & Health Administration, (2007). Web page: www.msha.gov/stats.
2. Iannacchione, A.T., (1999). Analysis of Pillar Design
Practices and Techniques for U.S. Limestone Mines. Trans. Instn. Min. Metall. (sect. A: Min. Industry), 108, September-December pp. A152-A160.
3. Esterhuizen, G.S., Iannacchione, A.T., Ellenberger J.L.
and Dolinar, D.R., (2006). Pillar Stability Issues Based on a Survey of Pillar Performance in Underground Limestone Mines, 25th International Conference on Ground Control in Mining, Morgantown, WV, pp. 354-361.
4. Salamon, M.D.G. and Munro, A.H., (1967). A Study of the Strength of Coal Pillars. J South African Inst. Min. Metall. 68:55-67.
5. Mark, C., (1993). Analysis of Longwall Pillar Stability
(ALPS): An Update. Proceedings of the Workshop on Coal Pillar Mechanics and Design, U.S. Bureau of Mines, Information Circular 9315, pp. 238-249.
6. Kendorski, F.S., (2007), Towards an Improved Stone Mine
Pillar Design Methodology: Observations from a Mistake, Proceedings, 26th International Conference Ground Control in Mining, Morgantown, WV, pp 298-303.
7. Salamon, M.D.G., Canbulat, I. and Ryder, J.A., (2006).
Seam-Specific Pillar Strength Formulae for South African Collieries. Proceedings of the 50th US Rock Mechanics Symposium, Golden CO, Paper 06-1154.
8. Harr, M.E., (1987). Reliability Based Design in Civil
Engineering. McGraw-Hill, New York. 9. Brady, B.H.G. and Brown, E.T., (1985). Rock Mechanics
for Underground Mining. George Allen and Unwin, London, 527 pp.
10. Mark, C., (1999). Empirical Methods for Coal Pillar Design.
Proceedings of the Second International Workshop on Coal Pillar Mechanics and Design, National Institute for Occupational Safety and Health, IC 9448, pp. 145-154.
11. Martin, C.D. and Maybee, W.G., (2000). The Strength of
Hard Rock Pillars. Int. Jnl. Rock Mechanics & Min. Sci. 37:1239-1246.
12. Lunder, P.J. and Pakalnis, R., (1997). Determining the
Strength of Hard Rock Mine Pillars. Bull. Can. Inst. Min. Metall. 90:51-55.
13. Hustrulid, W.A., (1976). A Review of Coal Pillar Strength
Formulas. Rock Mechanics and Rock Engineering 8(2), pp. 115-145.

14. Diederichs, M.S., Coulson, A., Falmagne, V., Rizkalla, N. and Simser, B., (2002). Application of Rock Damage Limits to Pillar Analysis at Brunswick Mine. NARMS-TAC 2002, Hammah Et Al. (Eds), University of Toronto, pp. 1325-1332.
15. Esterhuizen, G.S., (2006). Evaluation of the Strength of
Slender Pillars. Trans. Soc. Min. Metal. Explor. 320:69-76. 16. Gale, W.J., (1999). Experience of Field Measurement and
Computer Simulation Methods of Pillar Design.Proceedings of the Second International Workshop on Coal Pillar Mechanics and Design, National Institute for Occupational Safety and Health, IC 9448, pp. 49-61.
17. Kaiser, P.K., Diederichs, M.S., Martin, W. and Steiner,
D.C., (2000). Underground Works in Hard Rock Tunneling and Mining. Keynote Lecture, Geoeng2000, Melbourne, Australia, Technomic Publishing Co., pp. 841-926.
18. Mark, C., (1999). Introduction to the Proceedings of the
Second International Workshop on Coal Pillar Mechanics and Design, National Institute for Occupational Safety and Health, IC 9448, pp. 2-4.
19. Heasley, K.A. and Agioutantis, Z., (2001). LAMODEL - A
Boundary Element Program for Coal Mine Design. Proceedings of the 10th International Conference on Computer Methods and Advances in Geomechanics, Arizona, January 9-12.
20. Salamon M.D.G., (1970). Stability, Instability and Design
of Pillar Workings. Int. Jnl. Rock Mechanics & Mining Sciences 7:613-631.
21. Zipf, R.K. and Mark, C., (1997). Design Methods to
Control Violent Pillar Failures in Room-And-Pillar Mines. Transactions of the Institution of Mining and Metallurgy. Section A. Mining Industry 106: A124-A132.
22. Lane, W.L., Yanske, T.R. and Roberts, D.P., (1999).
Pillar Extraction and Rock Mechanics at the Doe Run Company in Missouri 1991 to 1999. Proceedings of the 37th Rock Mech. Symp. Amadei, Kranz, Scott & Smeallie (eds), Balkema Rotterdan, pp. 285 – 292.
23. Krauland, N. and Soder, P.E., (1987). Determining Pillar
Strength from Pillar Failure Observations. Eng. Min. Journal 8:34-40.
24. Lunder, P.J., (1994). Hard Rock Pillar Strength Estimation
an Applied Approach. M.A.Sc. Thesis, Dept. Mining and Mineral Process Engineering, University of British Columbia.
25. Pritchard, C.J. and Hedley, D.G.F., (1993). Progressive
Pillar Failure and Rockbursting at Denison Mine. Rockburst and Seismicity in Mines, Young (ed.), Balkema, Rotterdam.
26. Bauer, S.J. and Lee, M., (2004). CAES Monitoring to
Support RMRCT. Department of Energy, Report DE-FC2601NT40868, 18pp.
27. Bieniawski, Z.T., (1989). Engineering Rock Mass
Classifications. Wiley, New York.
28. Hoek, E., Kaiser, P.K. and Bawden, W.F., (1995). Support of Underground Excavations in Hard Rock. A.A. Balkema, Rotterdam.
29. Esterhuizen, G.S. and Ellenberger, J.L., (2007). Effects of
Weak Bands on Pillar Stability in Stone Mines: Field Observations and Numerical Model Assessment. Proceedings of the 26th International Conference on Ground Control in Mining, Morgantown, WV, pp. 336-342.
30. Zipf, R.K., (2001). Pillar Design to Prevent Collapse of
Room-and-Pillar Mines in Underground Mining Methods: Engineering Fundamentals and International Case Studies. W.A. Hustrulid, R.C. Bullock (eds.), Society for Mining Metallurgy and Exploration, pp. 493-511.
31. Zipf, R.K., (2008). Personal Communications. 32. Esterhuizen, G.S. Dolinar, D.R. and Ellenberger, J.L.,
(2008). Assessment of Stable and Failed Pillars in Underground Limestone Mines. Mining Engineering (to be published).
33. Carmack, J., Dunn B., Flach, M. and Sutton G., (2001).
The Viburnum Trend Underground. Underground Mining Methods: Engineering Fundamentals and International Case studies, W.A. Hustrulid, R.C. Bullock, (eds.), Society for Mining Metallurgy and Exploration, pp. 89-94.
34. Roberts, (2005). Personal Communications. 35. Lane W.L., Yanske, T.R., Clark, L.M. and Roberts, D.P.,
(2001). Pillar Extraction and Rock Mechanics at the Doe Run Company in Missouri 1991 to 2000. Underground Mining Methods: Engineering Fundamentals and International Case studies. W.A. Hustrulid, R.C. Bullock, (eds.), Society f or Mining Metallurgy and Exploration, pp. 89-94.
36. Roberts, D. Tolfree, D. and McIntyre H., (2007). Using
Confinement as a Means to Estimate Pillar Strength in a Room and Pillar Mine. Proceedings of the 1st Canada-US Rock Mechanics Symposium, Vancouver, eds. Eberhardt, Stead & Morrison, 2:1455-1461.
37. Anon., (2006). Universal Distinct Element Code User’s
Guide. Itasca Consulting Group, Minneapolis, MN. 38. Wagner, H., (1992). Pillar Design in South African
Collieries. Proceedings in the Workshop on Coal Pillar Mechanics and Design, U.S. Bureau of Mines, IC 9315, pp. 283-301.
39. Mark, C. and Chase, F.E., (1997). Analysis of Retreat
Mining Stability (ARMPS). Proceedings of the New technology for Ground Control in Retreat Mining, National Inst. for Occupational Safety and Health, Information Circular 9446, pp 17-34.
40. Dolinar, D.R. and Esterhuizen, G.S., (2007). Evaluation of
the Effect of Length on the Strength of Slender Pillars in Limestone Mines Using Numerical Modeling. Proceedings of the 26th International Conference on Ground Control in Mining, Morgantown, WV, pp. 304-313.

41. Esterhuizen, G.S., (2000). Jointing Effects on Pillar
Strength. Proceedings of the 19th International Conference on Ground Control in Mining, Morgantown, WV, pp. 286-290.
42. Lunder, P.J., (1994), Hard Rock Pillar Strength Estimation
an Applied Approach. M.A.Sc. Thesis, Dept. Mining and Mineral Process Engineering, University of British Columbia.
43. Esterhuizen, G.S., Dolinar, D.R., Ellenberger, J.L., Prosser, L.J. and Iannacchione, A.T., (2007). Roof Stability Issues in Underground Limestone Mines in the United States. Proceedings of the 26th International Conference on Ground Control in Mining, Morgantown, WV, pp. 320-327.
44. Iannacchione, A.T., Marshall, T.E., Burke L., Melville R.
and Litsenberger J., (2003). Safer Mine Layouts for Underground Stone Mines Subjected to Excessive Levels of Horizontal Stress. Mining Engineering, April, pp. 25-31.