pill bug exploration - loudoun county public schools · pill bug exploration day 1 day2 day 3 day 4...
TRANSCRIPT

Pill Bug Exploration

Pill Bug Exploration Day 1 Day2 Day 3 Day 4
• Observations • Develop your questions
• Design your experiment Write your hypothesis Define your variables
• Create a chart to collect data
• Perform your experiment (30 minutes) • Analyze and graph your data • Prepare for your presentation
• 3 minute group presentations • Turn in individual typed conclusions

Making Observations
• Be specific!
• Use metric units
• Make your observations without disturbing the animals (do not prod, poke, shake, etc.)

Making Observations • Record behaviors (10 minutes)
• Do the bugs prefer one area over another?
• Do they keep moving? Do they settle down? Do they move sporadically?
• Note behaviors involving 2 or more pill bugs
• Make a detailed sketch of a pill bug (5 minutes)
• Include a scale to indicate the size of the pill bug

Writing a Testable Question
• The effect of the independent variable on the dependent variable
• Independent variable (IV) – something I change
• Dependent variable (DV) – measurement or observation of the effect caused by the independent variable
The effect of __________ on ___________.

Writing Your Questions
• Must use materials provided in the lab • Approval required for additional materials
• Ensure that you are changing only 1 variable
• Experiment must be completed in 30 minutes or less
• Treat pill bugs humanely

Exit Ticket
• Write down your top 2 testable questions
• Underline the IV
• Circle the DV

Scientific Experiments
• Designed to test a hypothesis
• In a controlled experiment, only the independent variable is changed and a control group in which the variable being tested is NOT applied is used to provide a comparison
• Constant - value or condition that does not change
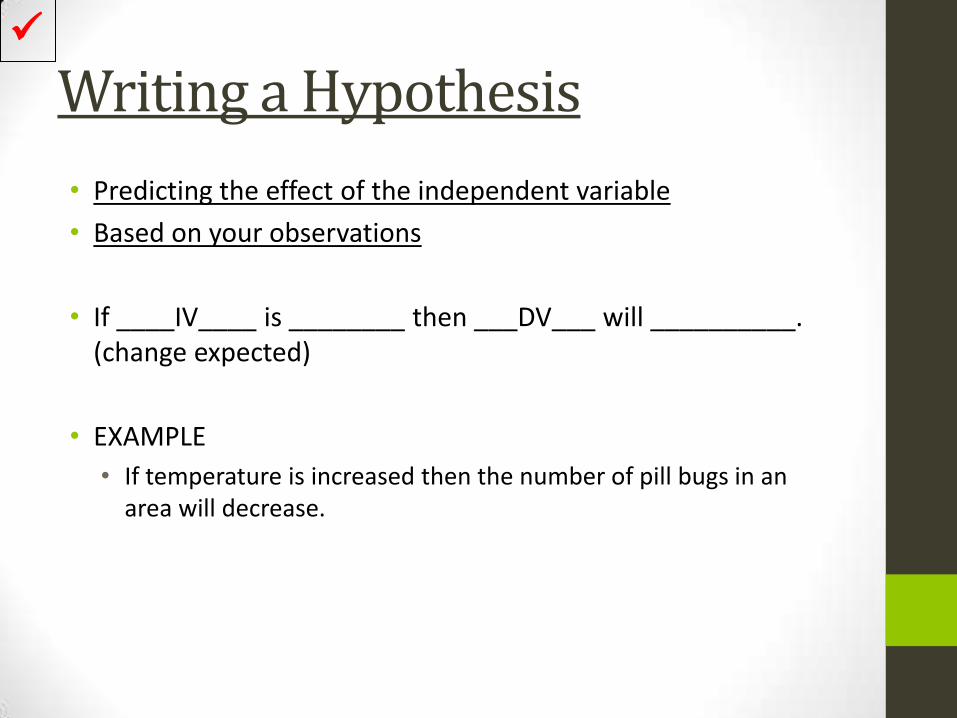
Writing a Hypothesis
• Predicting the effect of the independent variable
• Based on your observations
• If ____IV____ is ________ then ___DV___ will __________. (change expected)
• EXAMPLE
• If temperature is increased then the number of pill bugs in an area will decrease.

Writing Your Procedure
• Think about how to test your question
• Be specific!
• Another person should be able to reproduce your experiment exactly from your instructions
• One task at a time
• Aim for 3 to 5 trials in 30 minutes
• Illustrate your set up

Types of Data
Quantitative data Qualitative data
• numerical • descriptive
• can be measured • can be observed
• length, height, area, volume, temperature, time
• color, texture, smell, appearance

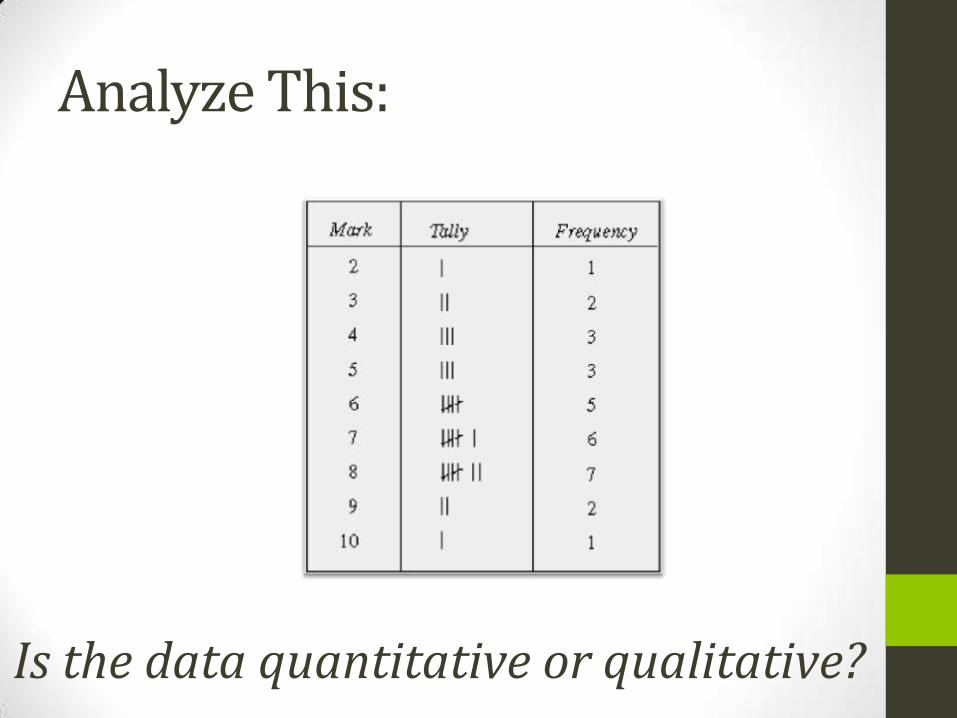
Analyze This:
Is the data quantitative or qualitative?

Analyze This:
Is the data quantitative or qualitative?
Analyze This:
Is the data quantitative or qualitative?

Analyze This:
Is the data quantitative or qualitative?

Analyze This:
Is the data quantitave or qualitative?

Analyze This:
Is the data quantitative or qualitative?

Analyze This:
Is the data quantitative or qualitative?

Data Collection Chart
• Think about your variables
• Include multiple trials
• Include space for notes about behaviors
The Number of Pill Bugs in Wet and Dry Environments
Trial # in wet environment
# in dry environment
Notes
1
2
3
4
5

Sample Sizing
• A bigger sample size gives you better averages, and more representative results (more honest, more real)! (Discuss why)
• Bigger sample sizes bring a hypothesis closer to being a theory (Discuss why)
• A sample size is the number of subjects (people, animals, etc.) in your experiment

Making Inferences
• Drawing conclusions based on evidence or observations
• EXAMPLE
• Observation: I see many students eating fresh fruit in the cafeteria.
• Inference: Students enjoy eating fresh fruit at lunch.

Statement Observation Inference
Object A is round and orange.
Object A is a basketball.
Object C is round and black and white.
Object C is larger than Object B.
Object B is smooth.
Object B is a table-tennis ball.
Each object is used in a different sport.
X
X
X
X
X
X
X
X
• Object A is a basketball.
• Object B is a table-tennis ball.
• Object C is a soccer ball.
Section 1-1
Observation and Inference
Go to
Section:
Inferences vs. Observations

ETHICS Is your experiment …
• … for the common good?
• … more costly than beneficial?
• … harmful to life?
• … worth the sacrifices (if any)?
• … useful to mankind?
• … Any other ethical questions? (Discuss)

Sources of Error
1. No control (nothing to compare)
2. Not enough trials
3. Sample size too small
4. Sample does not represent general population (if general hypothesis)
5. Human error (usually measurement accuracy)
6. Incorrect/inappropriate tools/equipment
7. Incorrect/inappropriate variables (do not test hypothesis)
Exit Ticket
• Turn in a copy of your experimental procedure

Line Graphs • Used to record individual data points
• Data points are connected by lines to show the change from point to point
0
1
2
3
4
1 2 3 4 5
The Effect of Time on the Number of Pill Bugs Migrating to a Wet Environment
Time, minutes
Nu
mb
er
of
Pill
Bu
gs
Title that includes the IV and DV
Labeled x-axis Independent variable
Labeled y-axis Dependent variable

Bar Graphs • Can be used to compare data
• Used if one variable is qualitative
0
1
2
3
4
5
6
7
Trial 1 Trial 2 Trial 3 Trial 4 Trial 5
Dry
Wet
Nu
mb
er
of
Pill
Bu
gs
The Effect of Wet and Dry Environments on the Number of Pill
Bugs Present
Trial Number
Title that includes the IV and DV
Labeled x-axis Independent variable
Labeled y-axis Dependent variable
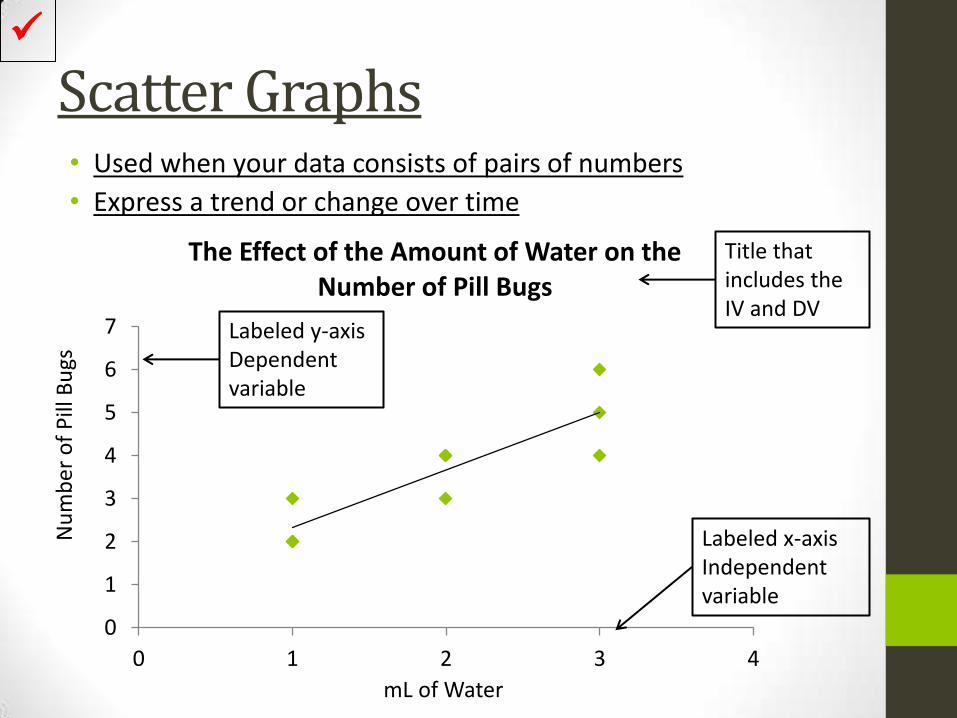
Scatter Graphs • Used when your data consists of pairs of numbers
• Express a trend or change over time
0
1
2
3
4
5
6
7
0 1 2 3 4
The Effect of the Amount of Water on the Number of Pill Bugs
mL of Water
Nu
mb
er
of
Pill
Bu
gs
Title that includes the IV and DV
Labeled x-axis Independent variable
Labeled y-axis Dependent variable

Line of Best Fit
• To show correlation (at a glance) using points …
• Scatterplot Graph with line of best fit shows
average slope
According to the graph, years of experience is ___ to income. A) Positively correlated B) Negatively correlated C) Not correlated

Reliable References
• Peer reviewed journals are best
• Try to cite a primary resource if at all possible
• Text books provide basic background information
• News Papers – find current events
• On the web
• Look at “.gov” and “.edu” sites first

Why Publish?
• Benefit the world
• Credit and funding
• Share research for feedback
• Collaboration with other experts
• Others can build on what you have learned to further mankind’s knowledge

Presenting Your Findings
• 3 minutes
• Everyone in the group must participate
• Tell us about…
• The question you investigated and your hypothesis
• The results of your experiment
• Your conclusions
Statement of the Problem ____/2
Hypothesis (WHY?-based on what
observation)
____/4
Results ____/2
Conclusion ____/4
Presentation Quality (Spoke loud and clear,
making eye contact)
____/4
Preparation Evident (Prepared to speak) ____/4
Total ____/20