pilbara tafe - parliament of western australia
TRANSCRIPT

Pilbara TAFE
ANNUAL REPORT
10

Contents
MANAGING DIRECTOR'S REPORT 4
Operational Structure 6
Training delivery areas 6
Pilbara TAFE's Governing Council 8
College Organisational Structure up to 2010 9
Performance Management Framework 11
Report on Operations 14
Training and Innovation Directorate 14
Key achievements 14
Flexible Delivery 14
Partnerships 14
Other partnerships 15
Teaching & Learning leadership 15
Commercial Delivery 15
Significant Issues Impacting the Agency 16
FINANCIAL AND ECONOMIC RESPOSIBILITY 17
Financial Disclosures 17
Governance Disclosures 17
Enabling Legislation 17
Staffing profile 17
Other Legal Requirements 17
Disability Services 18
Compliance with Public Sector Standards and Ethical Codes 19
Human Resource Management Standards 19
Codes of Ethics and Codes of Conduct (Ethical Codes) 19
Record Keeping Plans 19
Ministerial Directives 20
Occupational Safety, Health and Injury Management 20
INDEPENDENT AUDIT OPINION 23
Financial Statements 25
Certification of Key Performance Indicators 2010 46
Detailed Key Performance Indicators Information 47
STUDENT SATISFACTION RATING: EFFECTIVENESS INDICATOR 47
STUDENT OUTCOMES SURVEY 47
GRADUATES IN EMPLOYMENT 48
APPRENTICESHIP AND TRAINEESHIP TRAINING RATE 48
APPRENTICESHIP AND TRAINEESHIP COMPLETION RATE 48
2

COST PER STUDENT CURRICULUM HOUR (SCH) 48
ACHIEVEMENT OF THE 2010 COLLEGE PROFILE 49
Profile Analysis for Pilbara TAFE 49
PROFILE ACHIEVEMENT (DPA) 50
Pilbara TAFE Annual Report 2010
3
MANAGING DIRECTOR'S REPORT
This year has been one of considerable organisational change for Pilbara TAFE and, as a result,the college has a new strategic direction, with a focus on building its capacity and strengtheningits capability to respond to the educational and training needs of the region.
As a first step towards strengthening the College, an organisational realignment wasundertaken, moving from a campus-based model to an organisational structure that is builtaround three whole-of-college Directorates. This new structure also focuses on cross-campustraining delivery teams that will provide greater efficiency and effectiveness in trainingdelivery.
Another priority, again as part of developing capability, was to build on existing partnershipswith external stakeholders while developing new relationships that value-add to Pilbara TAFE'sservice provision.
Further to these achievements, Pilbara TAFE's Governing Council has been reinvigorated overthe past year with Nicole Roocke, Director with the Chamber of Minerals and Energy, appointedto the position of Chair. Other Ministerial appointments have grown the membership of theCouncil, which now has representation of major industry and community stakeholders in thePilbara region.
In the past year at the senior management level three Directors, Rob Fry, Director of Hedland,Alan Scott, Director of Pundulmurra, and Nerida Kickett, Director of Corporate Services, ceasedemployment with the college resulting in a loss of corporate knowledge, expertise andcommunity networks. These Directors had been with the organisation for twenty, twelve andfive years respectively. There was also a change of Managing Director, as Sophie Ehrenburg hadprovided leadership as Acting MD for a six-month period up to April 2010.
Despite the disruption that this level of change brings to any organisation, the training deliverytargets for the year were achieved with the exception of employment-based training. Thedifficulty in achieving employment-based training targets is, in part, an indication of the lack ofyoung people in the Pilbara to take up apprenticeships and traineeship opportunities, withcompanies taking on Fly In/ Fly Out apprentices, who do their off-the-job training with Perth-based training providers.
This situation is on the brink of change, however, with the commitment by the StateGovernment to build the Pilbara in what is being referred to as the 'Pilbara Cities' of Karrathaand Port Hedland. The ensuing population boom will present new challenges to Pilbara TAFEand the college is positioning itself to meet these demands with an effective organizationalstructure, quality delivery and enterprising service provision.
4

I would like to take this opportunity to thank the lecturers and the employees of Pilbara TAFEfor their high level of professionalism and commitment to this organization, the students andeach other.
,eLyn FarrellFarrellManaging Director
5
Outcomes Framework
Operational Structure
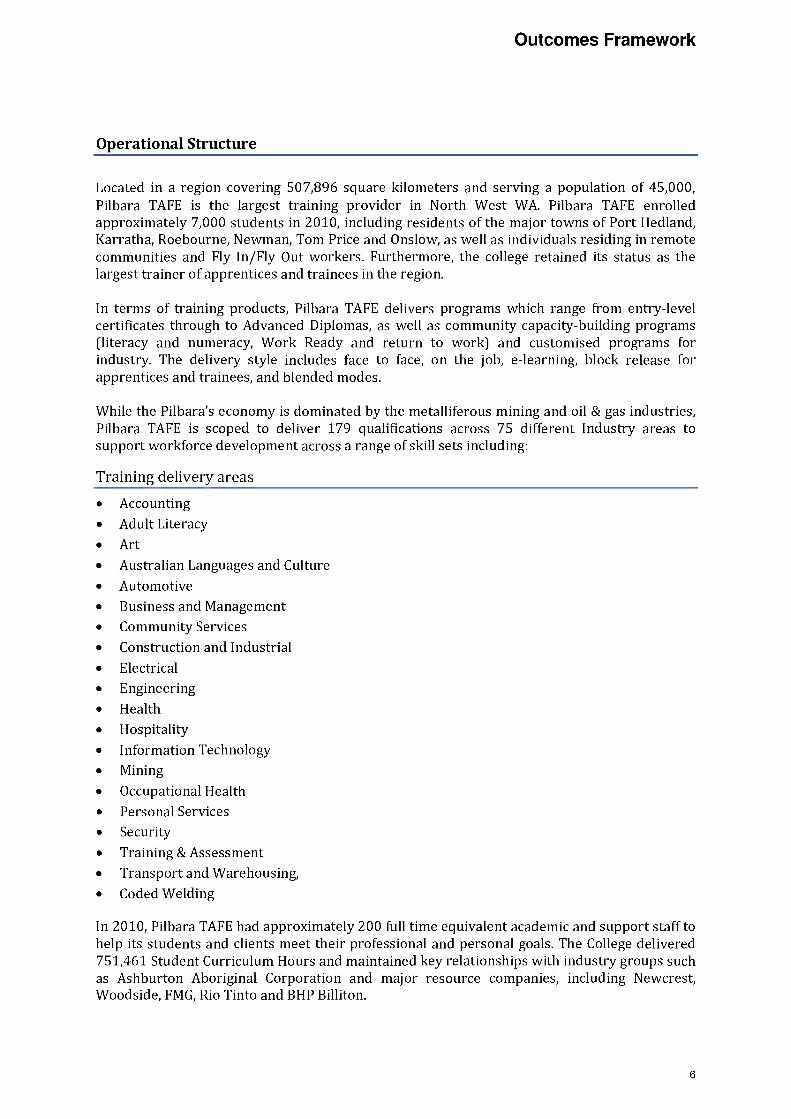
Located in a region covering 507,896 square kilometers and serving a population of 45,000,Pilbara TAFE is the largest training provider in North West WA. Pilbara TAFE enrolledapproximately 7,000 students in 2010, including residents of the major towns of Port Hedland,Karratha, Roebourne, Newman, Tom Price and Ons low, as well as individuals residing in remotecommunities and Fly In/Fly Out workers. Furthermore, the college retained its status as thelargest trainer of apprentices and trainees in the region.
In terms of training products, Pilbara TAFE delivers programs which range from entry-levelcertificates through to Advanced Diplomas, as well as community capacity-building programs(literacy and numeracy, Work Ready and return to work) and customised programs forindustry. The delivery style includes face to face, on the job, e-learning, block release forapprentices and trainees, and blended modes.
While the Pilbara's economy is dominated by the metalliferous mining and oil & gas industries,Pilbara TAFE is scoped to deliver 179 qualifications across 75 different Industry areas tosupport workforce development across a range of skill sets including:
Training delivery areas
AccountingAdult LiteracyArtAustralian Languages and CultureAutomotiveBusiness and ManagementCommunity ServicesConstruction and IndustrialElectricalEngineeringHealthHospitalityInformation TechnologyMining
Occupational HealthPersonal ServicesSecurityTraining & AssessmentTransport and Warehousing,Coded Welding
In 2010, Pilbara TAFE had approximately 200 full time equivalent academic and support staff tohelp its students and clients meet their professional and personal goals. The College delivered751,461 Student Curriculum Hours and maintained key relationships with industry groups suchas Ashburton Aboriginal Corporation and major resource companies, including Newcrest,Woodside, FMG, Rio Tinto and BHP Billiton.
6

Outcomes Framework
Mapping between the State Government Goals, the strategies contained within Training WA:Planning for the Future 2009 -2012 and the Pilbara TAFE Business Plan 2011.
STATE GOVERNMENT GOALSFocus on building, attracting and retaining a skilled workforce to meet the economic needs
of Western Australia
Training WA: Planning for the Future 2009 2018Increase the skills and participation of all Western Australians in the workforce and in the
community, driven by a flexible and innovative training system
A skilledworkforce
A contemporaryapprenticeship
system
Individualparticipationin training
Support forregional
communities
A vibrant anddiverse training
market
Training systemcapability and
capacity
i I IPilbara TAFE Business Plan 2011
Reposition the college within the market place: 6 priorities
Progressiontowards a
flexible/virtualenvironment
through the useof current and
emergingtechnology
The forging ofsustainable
partnershipswithin theresources
sector to boostaccess toindustrystandard
equipment,resources and
facilities
Theidentification ofinfrastructure
needs tomanage
strategic assetimprovement
and capitalmaster
planning
The ongoingdevelopment
of theemployment-
basedtraining
section in thecollege tosupport
apprenticeand trainee
management
Organisationaleffectiveness
Developmentof Centres of
Excellence withcorresponding
trainingproducts
IQuality provider ofAboriginal Training
Meeting the needsof regional delivery
Meeting workforceneeds of the
resource sector
Quality provider ofresponsive delivery
and assessment
OPERATIONAL PLANS
I
CAREER MANAGEMENT PLANS
7
Pilbara TAFE's Governing Council
Pilbara TAFE's Governing Council
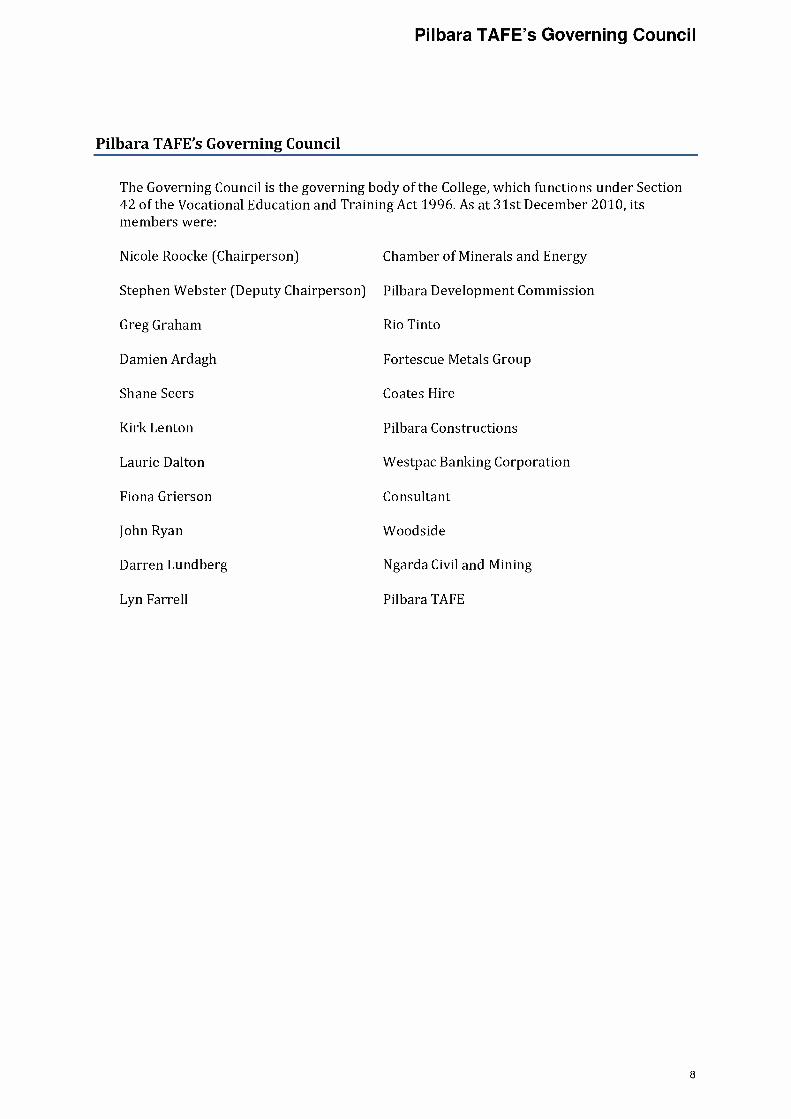
The Governing Council is the governing body of the College, which functions under Section42 of the Vocational Education and Training Act 1996. As at 31st December 2010, itsmembers were:
Nicole Roocke (Chairperson) Chamber of Minerals and Energy
Stephen Webster (Deputy Chairperson) Pilbara Development Commission
Greg Graham Rio Tinto
Damien Ardagh Fortescue Metals Group
Shane Seers Coates Hire
Kirk Lenton Pilbara Constructions
Laurie Dalton Westpac Banking Corporation
Fiona Grierson Consultant
John Ryan Woodside
Darren Lundberg Ngarda Civil and Mining
Lyn Farrell Pilbara TAFE
8
College Organisational Structure 2010
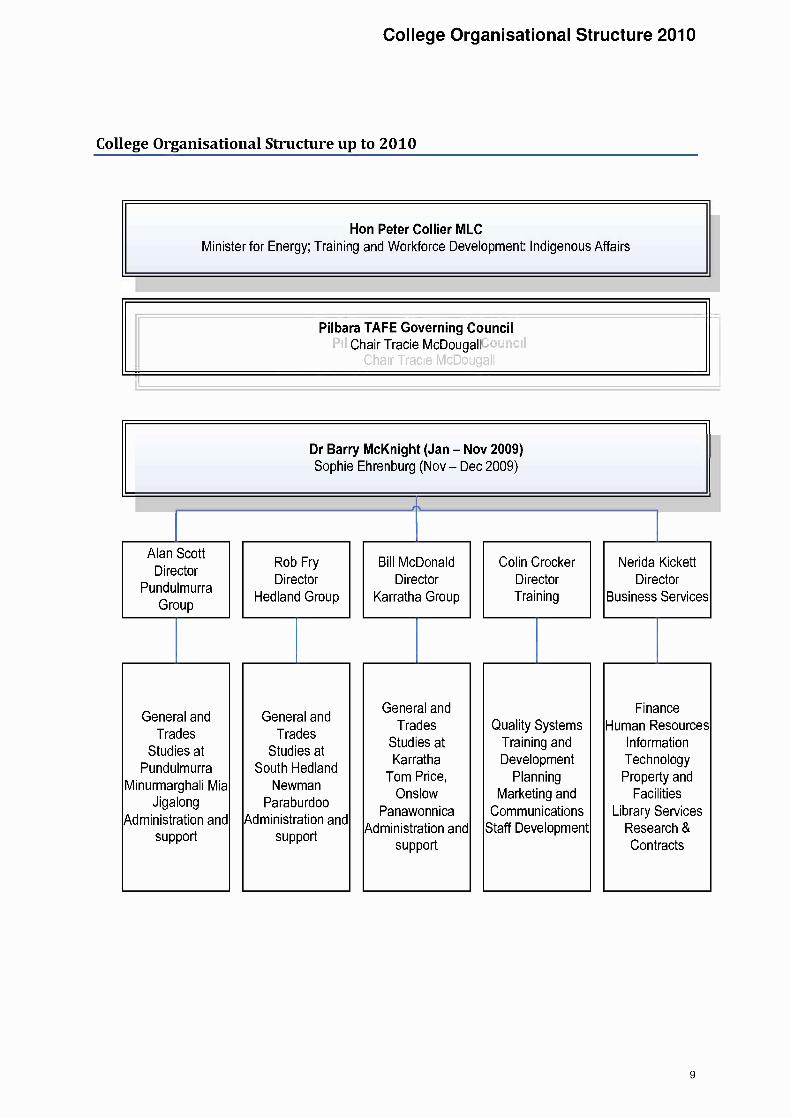
College Organisational Structure up to 2010
Hon Peter Collier MLCMinister for Energy; Training and Workforce Development: Indigenous Affairs
Pilbara TAFE Governing CouncilChair Tracie McDougall
Dr Barry McKnight (Jan Nov 2009)Sophie Ehrenburg (Nov Dec 2009)
Alan ScottDirector
PundulmurraGroup
General andTrades
Studies atPundulmurra
Minurmarghali MiaJigalong
Administration andsupport
Rob FryDirector
Hedland Group
General andTrades
Studies atSouth Hedland
NewmanParaburdoo
Administration andsupport
Bill McDonaldDirector
Karratha Group
General andTrades
Studies atKarratha
Tom Price,Ons low
PanawonnicaAdministration and
support
Colin CrockerDirectorTraining
Quality SystemsTraining andDevelopment
PlanningMarketing and
CommunicationsStaff Development
Nerida KickettDirector
Business Services
FinanceHuman Resources
InformationTechnologyProperty and
FacilitiesLibrary Services
Research &Contracts
9
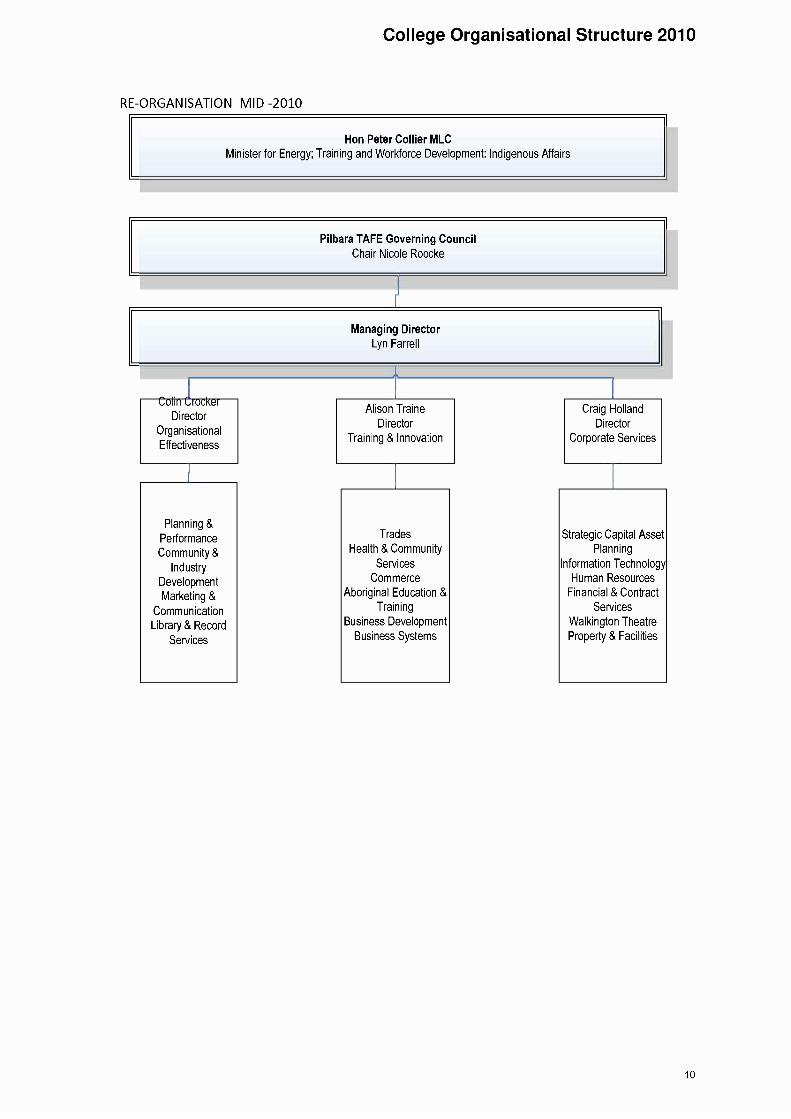
College Organisational Structure 2010
RE-ORGANISATION MID -2010
Hon Peter Collier MLCMinister for Energy; Training and Workforce Development: Indigenous Affairs
Pilbara TAFE Governing CouncilChair Nicole Roocke
Managing DirectorLyn Farrell
Olin ClockerDirector
OrganisationalEffectiveness
Planning &Performance
Community &Industry
DevelopmentMarketing &
CommunicationLibrary & Record
Services
Alison TraineDirector
Training & Innovation
Trades
Health & Community
Services
CommerceAboriginal Education &
Training
Business Development
Business Systems
Craig Holland
Director
Corporate Services
Strategic Capital AssetPlanning
Information Technology
Human ResourcesFinancial & Contract
ServicesWalkington TheatreProperty & Facilities
10

Performance Management Framework
Performance Management Framework
This subsection outlines the link between the relevant whole-of-government goals and agencylevel outcomes.
State Government Goals Pilbara TAFE Actions
State Building Major ProjectsBuilding strategic infrastructure that will In 2010 Pilbara TAFE developed andcreate jobs and underpin WA's long-term implemented a Five Year Infrastructure Plan.economic development. This plan will enable the college to execute its
resource-allocation needs according to thepriorities outlined in the strategic plan.
A Royalties for Region application wassubmitted for a multi-purpose workshop atNewman Campus to increase trainingprovision and gain valuable partnerships.
Pilbara TAFE was granted funds through thegovernment program Better TAFE Facilities($2 million dollars) to improve and maintaincampus facilities and workshops.
A new fabrication workshop was completedfor Karratha to support the Trades programs.This new facility will increase the college'sdelivery capacity.
Pilbara TAFE received funding approval of$12.19 million through the Government'sEducation Investment Fund (EIF) for theredevelopment and upgrade of PundulmurraCampus. The upgrade will significantlyimprove the college's services to Aboriginalclients and positively impact on the WorkReady program.
Financial and Economic ResponsibilityResponsibly managing the State's finances Pilbara TAFE commenced a program tothrough the efficient and effective delivery of reduce leave liability which resulted in aservices, encouraging economic activity and positive outcome for 2010, leading toreducing regulatory burdens on the privatesector.
improved financial performance.
The implementation of an organisationalrestructure resulted in income andexpenditure recorded under the delivery arearather than physical location. This reportprovides the college with targetedinformation on expenditure patterns andorganisational needs.
11
Performance Management Framework
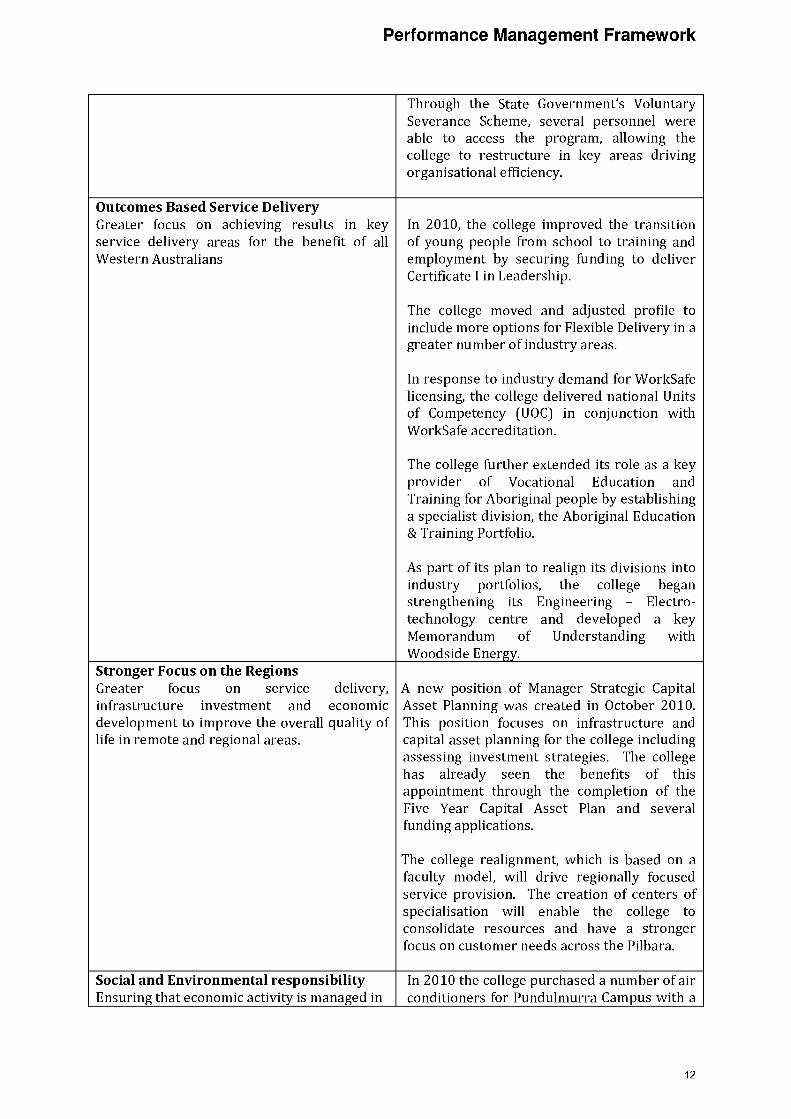
Through the State Government's VoluntarySeverance Scheme, several personnel wereable to access the program, allowing thecollege to restructure in key areas drivingorganisational efficiency.
Outcomes Based Service DeliveryGreater focus on achieving results in keyservice delivery areas for the benefit of allWestern Australians
In 2010, the college improved the transitionof young people from school to training andemployment by securing funding to deliverCertificate I in Leadership.
The college moved and adjusted profile toinclude more options for Flexible Delivery in agreater number of industry areas.
In response to industry demand for Work Safelicensing, the college delivered national Unitsof Competency (UGC) in conjunction withWork Safe accreditation.
The college further extended its role as a keyprovider of Vocational Education andTraining for Aboriginal people by establishinga specialist division, the Aboriginal Education& Training Portfolio.
As part of its plan to realign its divisions intoindustry portfolios, the college beganstrengthening its Engineering Electro-technology centre and developed a keyMemorandum of Understanding withWoodside Energy.
Stronger Focus on the RegionsGreater focus on service delivery,infrastructure investment and economicdevelopment to improve the overall quality oflife in remote and regional areas.
A new position of Manager Strategic CapitalAsset Planning was created in October 2010.This position focuses on infrastructure andcapital asset planning for the college includingassessing investment strategies. The collegehas already seen the benefits of thisappointment through the completion of theFive Year Capital Asset Plan and severalfunding applications.
The college realignment, which is based on afaculty model, will drive regionally focusedservice provision. The creation of centers ofspecialisation will enable the college toconsolidate resources and have a strongerfocus on customer needs across the Pilbara.
Social and Environmental responsibilityEnsuring that economic activity is managed in
In 2010 the college purchased a number of airconditioners for Pundulmurra Campus with a
12

Performance Management Framework
a socially and environmentally responsiblemanner for the long-term benefit of the State
high efficiency rating. These units are cleanerand greener than the old units they replaced,thus reducing their impact on theenvironment along with operating costs. Thesame strategy was used with the selection ofreplacement air conditioners at SouthHedland, Karratha and Minurmarghali Miacampus in Roebourne.
Triphosphur tubing (which is more efficientand has less impact on the environment thantraditional globes) was used in replacing alllighting across the college during theoperating year.
A new workshop was constructed at Karrathacampus which incorporated energy-savingmeasures such as raised ventilation to takeaway heat and create cross-flow ventilation toreduce the need for artificial cooling.
The college continues to monitor and reviewits energy consumption by way of both SEDO`Oscar' and Commonwealth `Sarge'greenhouse reporting. Both reports indicate areduction in energy usage throughout collegein 2010.
A review of the vehicle fleet led to a reductionin operating vehicles from 26 to 24 during2010. This result improved on the target setby the State Government.
13

Governance Disclosures
Report on Operations
Training and Innovation Directorate
The Training and Innovation Directorate was formed in July 2010. This Directorate replaced theformer Training Directorate and comprises six separate portfolio areas including Trades,Commerce, Aboriginal Education and Training, and Health & Community.
Each portfolio is responsible for specialist academic delivery and assessment across all thecampuses and includes course profiling, quality systems, student information services andcareer management.
Key achievements
Achievements across the portfolios areas include:
Increased delivery in Diploma level qualifications in Community Services.Increased delivery in employment-based training in the Building and Construction,Resource and Infrastructure and Transport and Logistics areas for Aboriginal Educationand Training.Increased delivery in Certificate III in Electrotechnology, with over 60 new apprenticesacross Karratha and South Hedland campuses. Similarly, the Fabrication and MechanicalFitting programs at Karratha & South Hedland experienced significant growth due to anincrease in the number of contractors servicing the mining industries.
Flexible Delivery
One of Pilbara TAFE's priorities was to expand the range of programs available through flexibleand mixed modes of delivery. In 2010, 95 courses were offered on line or via externalcorrespondence) delivery, which meant that more students in remote areas were able to accesstraining through online, video conferencing or telephone contact with their lecturers andthrough attendance at block sessions at TAFE.
In addition, flexible delivery incorporating web-based learning was used to assist severalstudents with a physical disability access business administration training at the South Hedlandcampus.
Partnerships
Pilbara TAFE formed many new partnerships with industry and strengthened existing onesthrough key programs such as the delivery of:
Certificate II to Certificate IV qualifications in Business to BHP Billiton's Port and RailOperations divisions.Certificate IV Front Line Management and Diploma of Management qualifications to 40employees at Conneq (formerly Bilfinger Berger) through an auspice arrangement.Certificate II in Kitchen Operations qualifications to ESS, where 90% of Aboriginalstudents gained work placements on graduation.
14
Other partnerships
Governance Disclosures
In addition, Pilbara TAFE's Nursing and Health division established an MoU with the WA HealthDepartment for the placement of student Enrolled Nurses for their practicum blocks in publichospitals.
The Aboriginal Education and Training Unit strengthened existing partnerships with a range oforganisations to deliver:
Work Ready programs for BHP Billiton and Ngarda Piraraka Indigenous MiningAcademy at the Yarrie minesite;Indigenous Mining Support Program for BHP Billiton at Pundulmurra campus as well asfor Macmahons Holdings in Newman;Mining Field Exploration Operations for Fortescue Metals Group;Pre-employment programs with Rio Tinto and Roebourne Regional Prison incorporatingdelivery on site at the prison and at DECCA station;Horticulture programs with Ngarliyarndu Bindirri Aboriginal Corporation, RoebourneRegional Prison to commence the DECCA water project.
These programs were in addition to the continuation and improvement of ongoing programsprovided for Rio Tinto, BHP, Roebourne Regional Prison, FMG mine and town operations,Woodside and Newcrest Mining.
In terms of Trades, a successful hand-skills program ran at the beginning of 2010 forApprenticeships Australia and BHP Billiton apprentices. In addition, an auspice agreement withKarratha Senior High School eventuated in an increase in the number of students completingthe Certificate I in Engineering SAL program.
Teaching & Learning Leadership
The Teaching & Learning Leadership Team was established in 2010 with the view to supportingand improving the quality of teaching and learning throughout the College. Lecturers attended a3-day Training Excellence session at a learning hub in Karratha, which addressed issues oncompliance in the Australian Quality Training Framework (AQTF), Recognition of PriorLearning (RPL) and training administration.
Commercial Delivery
Pilbara TAFE Training Solutions is the commercial arm of the college and, in 2010, this divisionrecorded income in excess of $1 million.
Courses were divided into three specific categories: Safety, Industrial High Risk Licence Skillsand Business. Each category saw a substantial growth in the past 12 months with many of theregular courses running with the maximum number of participants. Training Solutionsincreased its appeal to industry by working with the Portfolio Managers and lectures to alignprofile products with short courses. This resulted in the delivery of five-day workshops in arange of Certificate IV qualifications such as Occupational Health and Safety, Training andAssessment and Front Line Management.
15

Governance Disclosures
Significant Issues Impacting the Agency
Like all agencies and organisations in the region, Pilbara TAFE is adversely affected by thesupply of available housing. As the Pilbara region continues to attract investment for majorResource projects, infrastructure has struggled to keep pace in towns and communities. Thesupply of serviced land to meet the local demands for housing and commercial developmentcontinues to be one of the major impediments to development. This situation impacts on theagency's performance because, while Pilbara TAFE is able to provide GROH housing to amajority of its employees, there are some staff members (who are often in essentialadministration roles) who are forced to find higher paid work elsewhere so they can meet theirrental obligations. This leads to a high turnover in staffing and a lag in training and recruitment.
Furthermore, Pilbara TAFE still struggles to attract and retain quality staff in a highlycompetitive employment market. In the Pilbara, the college competes with the resource sectorwhich provides higher wages and benefits so often quality employees leave for more attractiveconditions elsewhere.
In 2010, the announcement by the State Government of the 'Pilbara Cities' project focusedattention on the housing and infrastructure challenges faced by Pilbara towns. Projections bythe Pilbara Development Commission envisage key towns will double in size in the next fewmonths. For example: the East Pilbara, which encompasses Hedland/Newman, will increase itspopulation from 21,972 to 42,769 while the West Pilbara (including Karratha/Onslow/PointSampson) will grow from 25,011 to 50,802. (These population figures exclude the Fly In/Fly Out(FIFO) workforce which is currently estimated a 30,000 and 20,000 respectively.)
To meet the challenges associated with this population boom, Pilbara TAFE has joined with theDepartment of Training and Workforce Development and the Pilbara Development Commissionto establish the Pilbara Workforce Development Alliance (PWDA). This Alliance has created a 10year workforce development plan, which will incorporate proposals for accommodation unitsfor students, along with career development, and employment and training opportunities.
In addition to this initiative, the college is finalising a business case for government funding toallow the co-location of indigenous employment-based accommodation in Newman andPundulmurra. This partnership arrangement with key resource industry organizations willallow indigenous employees to access student accommodation and campus facilities while theyundertake specific training for employment.
16

Governance Disclosures
FINANCIAL AND ECONOMIC RESPOSIBILITY
Financial Disclosures
Pricing policies on Services
Pilbara TAFE operates under the statutory and provider-based fees and charges that apply totraining and skills recognition, funded by the WA Department of Training and WorkforceDevelopment. Resource Fees are set by the College to cover materials to be used by students inthe course of instruction. Fee for Services courses are priced on a commercial basis.
Governance Disclosures
Enabling Legislation
Pilbara TAFE was established on the 1st of January 2003 as a result of the amalgamation ofEastern Pilbara College of TAFE and West Pilbara College of TAFE. It operates under theVocational Education and Training Act 1996.
At the date of reporting, other than normal contracts of employment of service, no BoardMembers or Senior Officers, or firms of which Members or Senior Officers are members, orentities in which Members or Senior Officers have substantial interests, had any interests inexisting or proposes contracts with Pilbara TAFE and Members of Senior Officers.
Staffing profile
2007 % TotalFTE
2008 % TotalFTE
2009 % TotalFTE
2010 % Total FTE
FTE for year* 230.67 228.39 211.3 *184.9AcademicDelivery
92.8 40.2% 96.63 42.3% 85.92 40.7% 85.2 46.1%
AcademicSupportServices AndCorporateServices**
137.87 59.8% 131.76 57.7% 125.38 59.3% 98.7 53.4%
UnattachedRedeployees***
1 0.5%
Workforce Data taken from Pilbara TAFE's Electronic Information Management System and Empower HRMIS * Includes unattachedand registered redeployee employees. * *Academic Support Services and Corporate Services unable to be reported on separately ***Unattached/Redeployees unable to be reported on separately NB: Information provided as at December 2009. FTE figures can varyacross the year by +/- 10% due to training demand fluctuations
Other Legal Requirements
17
Governance Disclosures
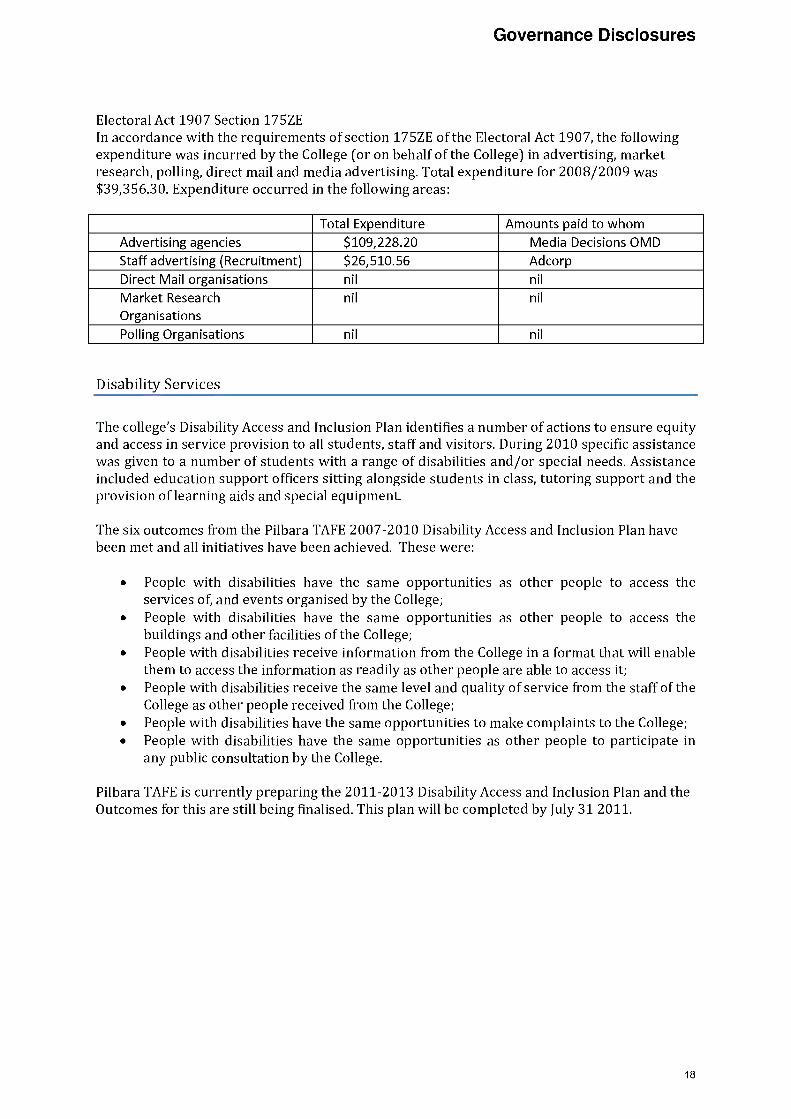
Electoral Act 1907 Section 175ZEIn accordance with the requirements of section 175ZE of the Electoral Act 1907, the followingexpenditure was incurred by the College (or on behalf of the College) in advertising, marketresearch, polling, direct mail and media advertising. Total expenditure for 2008/2009 was$39,356.30. Expenditure occurred in the following areas:
Total Expenditure Amounts paid to whomAdvertising agencies $109,228.20 Media Decisions OMDStaff advertising (Recruitment) $26,510.56 AdcorpDirect Mail organisations nil nil
Market ResearchOrganisations
nil nil
Polling Organisations nil nil
Disability Services
The college's Disability Access and Inclusion Plan identifies a number of actions to ensure equityand access in service provision to all students, staff and visitors. During 2010 specific assistancewas given to a number of students with a range of disabilities and/or special needs. Assistanceincluded education support officers sitting alongside students in class, tutoring support and theprovision of learning aids and special equipment.
The six outcomes from the Pilbara TAFE 2007-2010 Disability Access and Inclusion Plan havebeen met and all initiatives have been achieved. These were:
People with disabilities have the same opportunities as other people to access theservices of, and events organised by the College;People with disabilities have the same opportunities as other people to access thebuildings and other facilities of the College;People with disabilities receive information from the College in a format that will enablethem to access the information as readily as other people are able to access it;People with disabilities receive the same level and quality of service from the staff of theCollege as other people received from the College;People with disabilities have the same opportunities to make complaints to the College;People with disabilities have the same opportunities as other people to participate inany public consultation by the College.
Pilbara TAFE is currently preparing the 2011-2013 Disability Access and Inclusion Plan and theOutcomes for this are still being finalised. This plan will be completed by July 31 2011.
18
Compliance with Public Sector Standards and Ethical Codes
Public Sector Management Act 1994, S31 (1)
Human Resource Management Standards
In 2010, the college introduced a new online induction system which incorporated a module onWorkplace Behaviour. The module contains a number of questions and assessments forcompletion which assess the participants' understanding of the information.
Grievance and Contact Officer Training was provided to the college by the Equal OpportunityCommission in 2009 and is also planned for 2011. This training aims to minimise or preventgrievances from being formalized.
The Equity and Diversity Plan for 2011-2014 has been completed and reflects Pilbara TAFE'scommitment to providing a workplace that is free from unfair practices and all forms ofharassment.
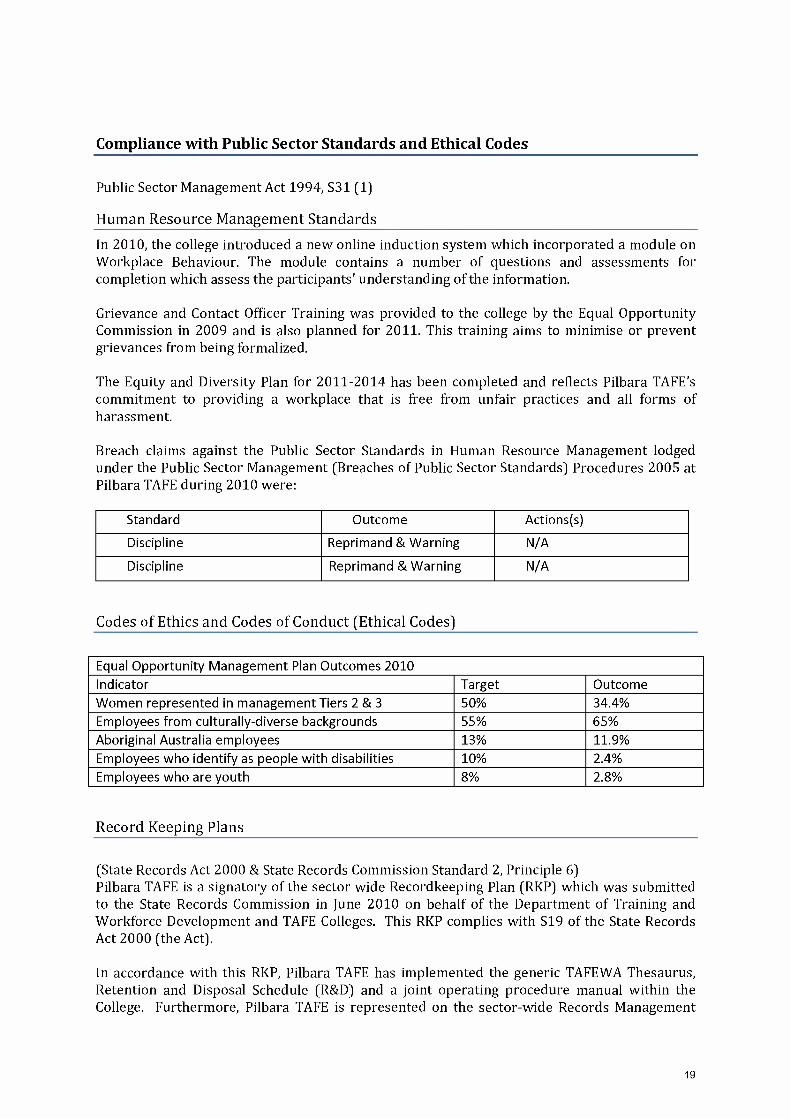
Breach claims against the Public Sector Standards in Human Resource Management lodgedunder the Public Sector Management (Breaches of Public Sector Standards) Procedures 2005 atPilbara TAFE during 2010 were:
Standard Outcome Actions(s)
Discipline Reprimand & Warning N/A
Discipline Reprimand & Warning N/A
Codes of Ethics and Codes of Conduct (Ethical Codes)
Equal Opportunity Management Plan Outcomes 2010Indicator Target OutcomeWomen represented in management Tiers 2 & 3 50% 34.4%
Employees from culturally-diverse backgrounds 55% 65%
Aboriginal Australia employees 13% 11.9%
Employees who identify as people with disabilities 10% 2.4%
Employees who are youth 8% 2.8%
Record Keeping Plans
(State Records Act 2000 & State Records Commission Standard 2, Principle 6)Pilbara TAFE is a signatory of the sector wide Recordkeeping Plan (RKP) which was submittedto the State Records Commission in June 2010 on behalf of the Department of Training andWorkforce Development and TAFE Colleges. This RKP complies with S19 of the State RecordsAct 2000 (the Act).
In accordance with this RKP, Pilbara TAFE has implemented the generic TAFEWA Thesaurus,Retention and Disposal Schedule (R&D) and a joint operating procedure manual within theCollege. Furthermore, Pilbara TAFE is represented on the sector-wide Records Management
19

Group and is working with that group to review and update the RKP which is due by October,2011.
In 2011 Pilbara TAFE anticipates migrating from our current records management system toTRIM in line with the rest of the Publicly Funded Training Providers and the Department ofTraining and Workforce Development (DTWD).
In preparation of this move, the college invested resources to ensure that appropriate recordswere archived and stored in compliance with the TAFEWA common retention and disposalschedule.
At the same time, an informal evaluation of the college's efficiency and effectiveness of thecurrent recordkeeping system has been undertaken. It is anticipated that a formal evaluationwill be undertaken as part of the TRIM implementation project.
Pilbara TAFE is currently a signatory to a Memorandum of Understanding with the Departmentof Education (DoE) which allows college staff access to Department of Education (DoE) RecordsAwareness Training System product, (RATS). As part of the TRIM implementation strategy, allstaff will be required to complete this training.
It is anticipated that an evaluation of the efficiency and effectiveness of the recordkeepingtraining program will be conducted towards the end of 2011 as part of the evaluation of themigration to TRIM project.
Pilbara TAFE currently has a number of policies and procedures regarding the responsibility ofall staff to ensure that appropriate corporate records are captured and retained according tolegislative requirements. As part of the project to migrate to TRIM, the current inductionprogram will be updated to include this information in addition to the organisationalrequirement that all staff will undertake the on-line records awareness training.
Ministerial Directives
Treasurer's Instruction 903 (12) requires the agency to disclose details of any ministerialdirectives relevant to the setting of desired outcomes or operational objectives, the achievementof desired outcomes or operational objectives, investment activities and financing activities.
No such directives were issued by the Minister during 2010.
Occupational Safety, Health and Injury Management
Pilbara TAFE is committed to creating and maintaining a safe and healthy working environmentfor staff, clients and members of the public and to maximise opportunities for continuousimprovement in safety performance.
The college utilises Occupational Safety & Health Representatives, Local OSH Committees andan Executive OSH Committee to provide a forum for the discussion of safety and health policiesand practices. It recommends measures to promote the safety and health of staff, students andvisitors at the college. Minutes for meetings are available to all employees via the Pilbara TAFEintranet.
Drawn from the Occupational Safety & Health Act 1984 Section 40 the committee facilitatesconsultation and co-operation between staff, management and students in initiating, developing
20
and implementing measures designed to ensure the health and safety of the Pilbara TAFEenvironment and staff and students at the college.
The college is committed to preventing occupational injury and illness through the provision ofa safe and healthy work environment.
Injury Management is a workplace-managed process. It involves the college, the injured worker,medical management and if required, Riskcover. The implementation of injury management isfrom the time of injury. The process facilitates, where practicable, efficient and cost-effectivemaintenance or the establishment of a return-to-work program incorporating necessary injurymanagement interventions to assist in the worker's return to work.
The aim is to assist the injured worker to return to their pre-injury job as early as possible orfacilitates access to an Approved Vocational Rehabilitation Provider to consider options for areturn to other gainful employment either with the college or with another employer.
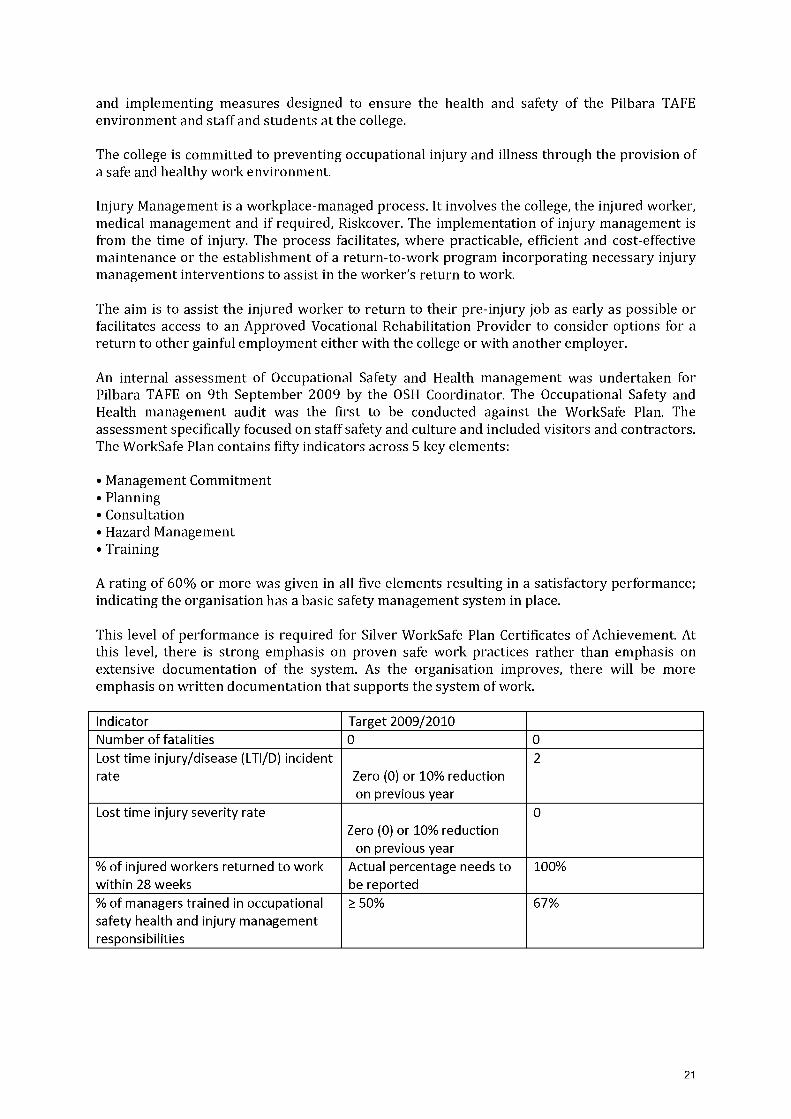
An internal assessment of Occupational Safety and Health management was undertaken forPilbara TAFE on 9th September 2009 by the OSH Coordinator. The Occupational Safety andHealth management audit was the first to be conducted against the Work Safe Plan. Theassessment specifically focused on staff safety and culture and included visitors and contractors.The Work Safe Plan contains fifty indicators across 5 key elements:
Management CommitmentPlanningConsultationHazard ManagementTraining
A rating of 60% or more was given in all five elements resulting in a satisfactory performance;indicating the organisation has a basic safety management system in place.
This level of performance is required for Silver Work Safe Plan Certificates of Achievement. Atthis level, there is strong emphasis on proven safe work practices rather than emphasis onextensive documentation of the system. As the organisation improves, there will be moreemphasis on written documentation that supports the system of work.
Indicator Target 2009/2010Number of fatalities 0 0
Lost time injury/disease (LTI/D) incidentrate Zero (0) or 10% reduction
on previous year
2
Lost time injury severity rateZero (0) or 10% reduction
on previous year
0
% of injured workers returned to workwithin 28 weeks
Actual percentage needs tobe reported
100%
% of managers trained in occupationalsafety health and injury managementresponsibilities
50% 67%
21
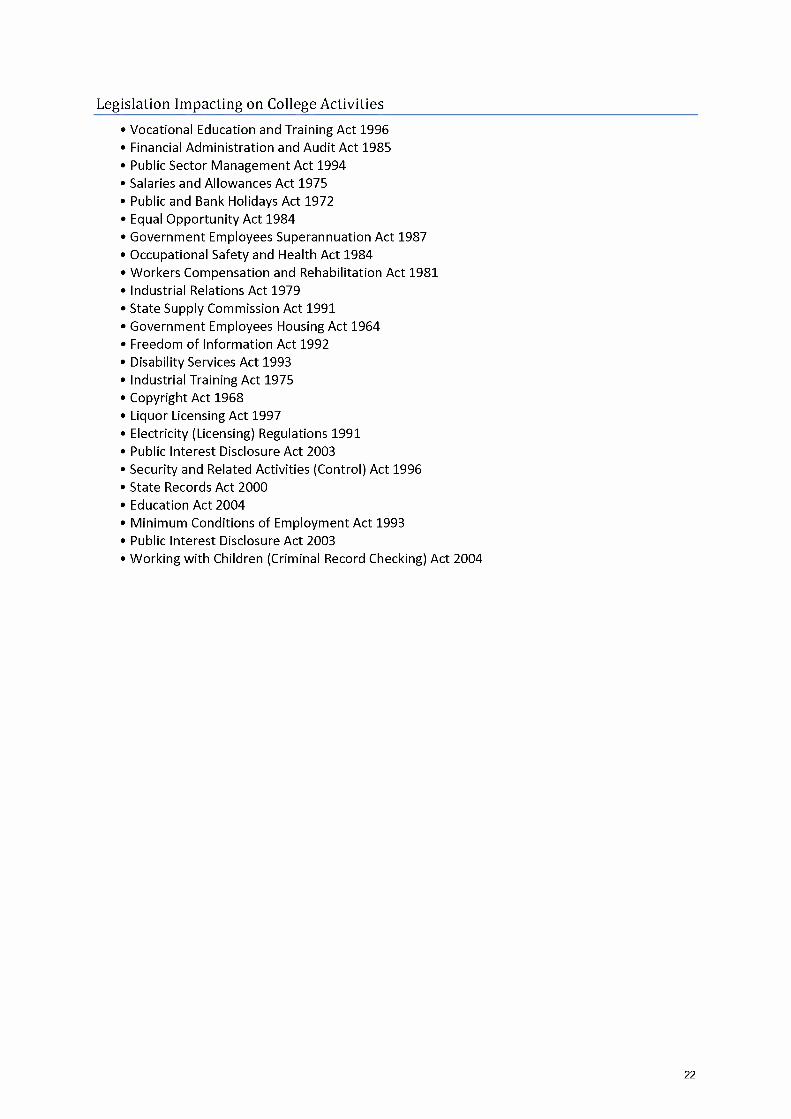
Legislation Impacting on College Activities
Vocational Education and Training Act 1996Financial Administration and Audit Act 1985Public Sector Management Act 1994Salaries and Allowances Act 1975Public and Bank Holidays Act 1972Equal Opportunity Act 1984Government Employees Superannuation Act 1987Occupational Safety and Health Act 1984Workers Compensation and Rehabilitation Act 1981Industrial Relations Act 1979State Supply Commission Act 1991Government Employees Housing Act 1964Freedom of Information Act 1992Disability Services Act 1993Industrial Training Act 1975Copyright Act 1968Liquor Licensing Act 1997Electricity (Licensing) Regulations 1991Public Interest Disclosure Act 2003Security and Related Activities (Control) Act 1996State Records Act 2000Education Act 2004Minimum Conditions of Employment Act 1993Public Interest Disclosure Act 2003Working with Children (Criminal Record Checking) Act 2004
22
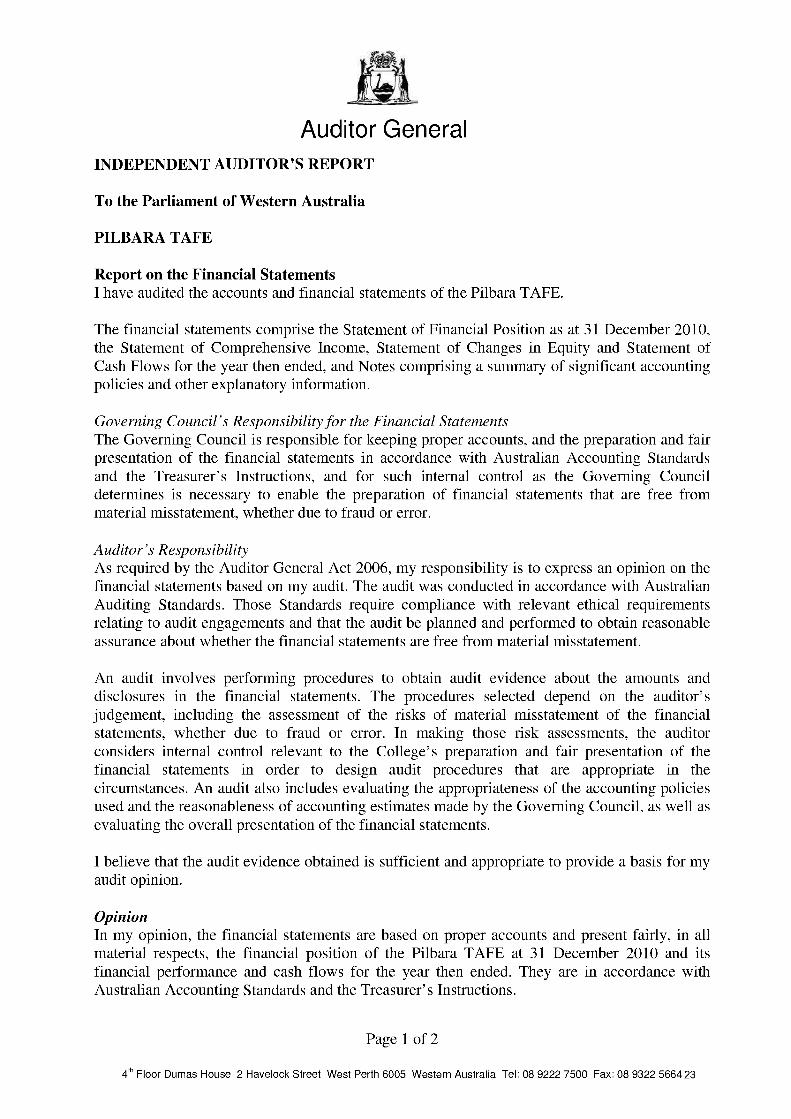
Auditor GeneralINDEPENDENT AUDITOR'S REPORT
To the Parliament of Western Australia
PILBARA TAFE
Report on the Financial StatementsI have audited the accounts and financial statements of the Pilbara TAFE.
The financial statements comprise the Statement of Financial Position as at 31 December 2010,the Statement of Comprehensive Income, Statement of Changes in Equity and Statement ofCash Flows for the year then ended, and Notes comprising a summary of significant accountingpolicies and other explanatory information.
Governing Council's Responsibility for the Financial StatementsThe Governing Council is responsible for keeping proper accounts, and the preparation and fairpresentation of the financial statements in accordance with Australian Accounting Standardsand the Treasurer's Instructions, and for such internal control as the Governing Councildetermines is necessary to enable the preparation of financial statements that are free frommaterial misstatement, whether due to fraud or error.
Auditor's ResponsibilityAs required by the Auditor General Act 2006, my responsibility is to express an opinion on thefinancial statements based on my audit. The audit was conducted in accordance with AustralianAuditing Standards. Those Standards require compliance with relevant ethical requirementsrelating to audit engagements and that the audit be planned and performed to obtain reasonableassurance about whether the financial statements are free from material misstatement.
An audit involves performing procedures to obtain audit evidence about the amounts anddisclosures in the financial statements. The procedures selected depend on the auditor'sjudgement, including the assessment of the risks of material misstatement of the financialstatements, whether due to fraud or error. In making those risk assessments, the auditorconsiders internal control relevant to the College's preparation and fair presentation of thefinancial statements in order to design audit procedures that are appropriate in thecircumstances. An audit also includes evaluating the appropriateness of the accounting policiesused and the reasonableness of accounting estimates made by the Governing Council, as well asevaluating the overall presentation of the financial statements.
I believe that the audit evidence obtained is sufficient and appropriate to provide a basis for myaudit opinion.
OpinionIn my opinion, the financial statements are based on proper accounts and present fairly, in allmaterial respects, the financial position of the Pilbara TAFE at 31 December 2010 and itsfinancial performance and cash flows for the year then ended. They are in accordance withAustralian Accounting Standards and the Treasurer's Instructions.
Page 1 of 2
4th Floor Dumas House 2 Havelock Street West Perth 6005 Western Australia Tel: 08 9222 7500 Fax: 08 9322 5664 23

Pilbara TAFE
Report on ControlsI have audited the controls exercised by the Pilbara TAFE. The Governing Council isresponsible for ensuring that adequate control is maintained over the receipt, expenditure andinvestment of money, the acquisition and disposal of public and other property, and theincurring of liabilities in accordance with the Financial Management Act 2006 and theTreasurer's Instructions, and other relevant written law.
As required by the Auditor General Act 2006, my responsibility is to express an opinion on thecontrols exercised by the Governing Council based on my audit conducted in accordance withAustralian Auditing Standards.
OpinionIn my opinion, the controls exercised by the Pilbara TAFE are sufficiently adequate to providereasonable assurance that the receipt, expenditure and investment of money, the acquisition anddisposal of property, and the incurring of liabilities have been in accordance with legislativeprovisions.
Report on the Key Performance IndicatorsI have audited the key performance indicators of the Pilbara TAFE. The Governing Council isresponsible for the preparation and fair presentation of the key performance indicators inaccordance with the Financial Management Act 2006 and the Treasurer's Instructions.
As required by the Auditor General Act 2006, my responsibility is to express an opinion on thekey performance indicators based on my audit conducted in accordance with AustralianAuditing Standards.
OpinionIn my opinion, the key performance indicators of the Pilbara TAFE are relevant and appropriateto assist users to assess the College's performance and fairly represent indicated performancefor the year ended 31 December 2010.
IndependenceIn conducting this audit, I have complied with the independence requirements of the AuditorGeneral Act 2006 and the Australian Auditing Standards, and other relevant ethicalrequirements.
COLIN MURPHYAUDITOR GENERAL15 March 2011
Page 2 of 224

PILBARA TAFE
FINANCIAL STATEMENTS
The accompanying financial statements of Pilhara TAFE
have been prepared in compliance with the provisions of
the Financial Management Act 200G from proper accounts and
records to present fairly the financial transactions for the year ending
31 December 2010 and the financial position as at 31 December 2010.
At the date of signing we are not aware of any circumstances which
would render any particulars included in the financial statements
misleading or inaccurate.
3 I IChairperson of Governing Council Dated
Managing Director Dated
(Member of Governing Council)
Alfa 2n i 1to Finance Officer Dated
25
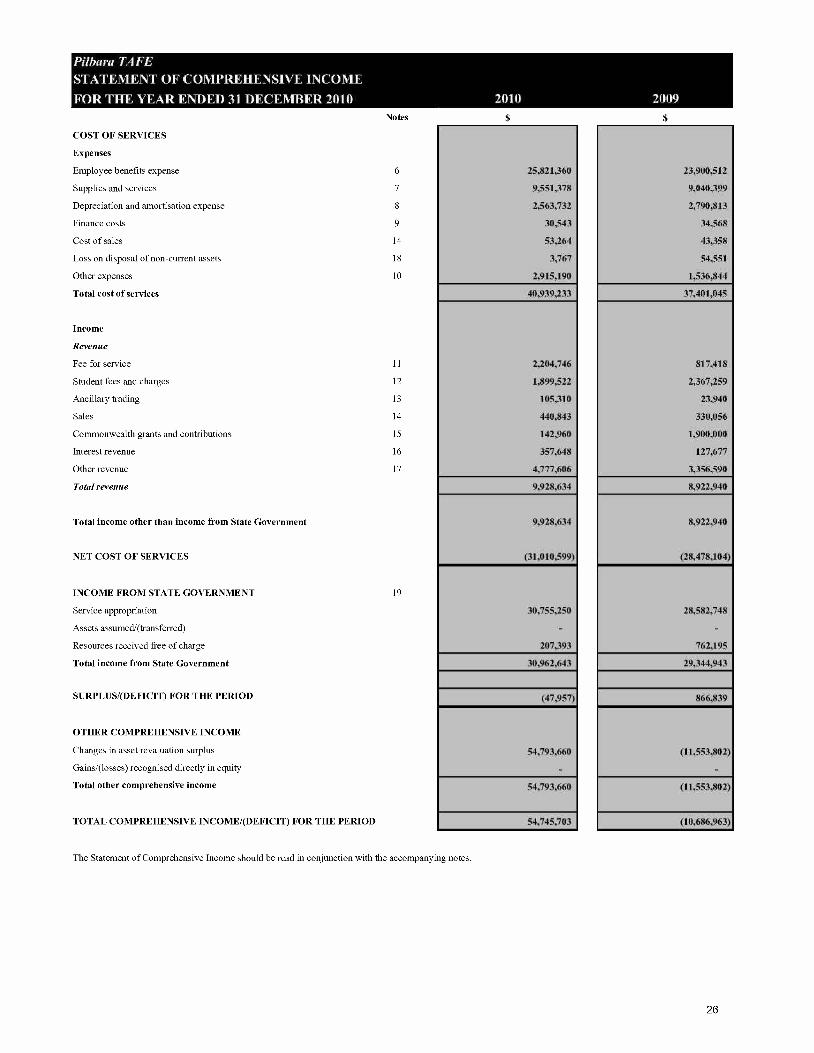
Pilbara TAFESTATEMENT OF COMPREHENSIVE INCOME
FOR THE YEAR ENDED 31 DECEMBER 2010 2010 2009
COST OF SERVICES
Expenses
Employee benefits expense
Supplies and services
Depreciation and amortisation expense
Finance costs
Cost of sales
Loss on disposal of non-current assets
Other expenses
Total cost of services
Notes
6
7
8
9
14
18
10
Income
Revenue
Fee for service 11
Student fees and charges 12
Ancillary trading 13
Sales 14
Commonwealth grants and contributions 15
Interest revenue 16
Other revenue 17
Total revenue
Total income other than income from State Government
NET COST OF SERVICES
INCOME FROM STATE GOVERNMENT
Service appropriation
Assets assumed/(transferred)
Resources received free of charge
Total income from State Government
SURPLUS/(DEFICIT) FOR THE PERIOD
OTHER COMPREHENSIVE INCOME
Changes in asset revaluation surplus
Gains/(losses) recognised directly in equity
Total other comprehensive income
TOTAL COMPREHENSIVE INCOME/(DEFICIT) FOR THE PERIOD
19
25,821,360
9,551,378
2,563,732
30,543
53,264
3,767
2,915,190
40,939,233
2,204,746
1,899,522
105,310
440,843
142,960
357,648
4,777,606
9,928,634
9,928,634
(31,010,599)
30,755,250
207,393
30,962,643
(47,957)
54,793,660
54,793,660
54,745,703
The Statement of Comprehensive Income should be read in conjunction with the accompanying notes.
23,900,512
9,040,399
2,790,813
34,568
43,358
54,551
1,536,844
37,401,045
817,418
2,367,259
23,940
330,056
1,900,000
127,677
3,356,590
8,922,940
8,922,940
(28,478,104)
28,582,748
762,195
29,344,943
866,839
(11,553,802)
(11,553,802)
(10,686,963)
26
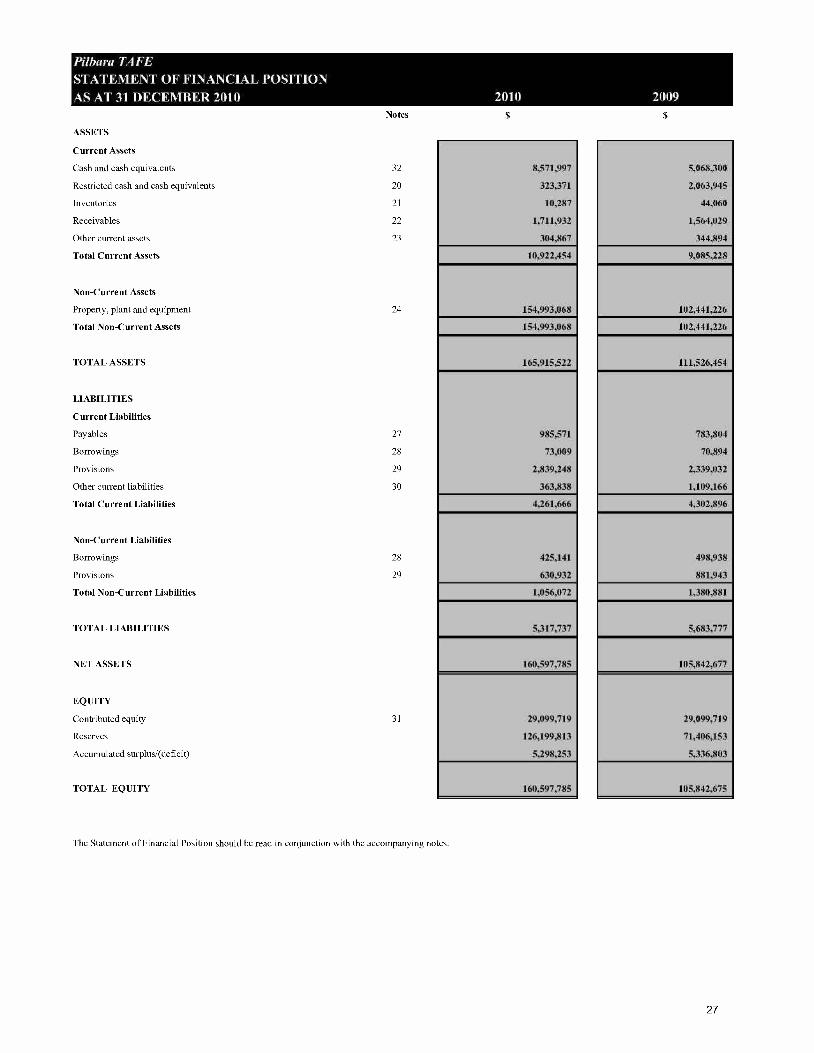
Pilbara TAFESTATEMENT OF FINANCIAL POSITIONAS AT 31 DECEMBER 2010 2010 2009
ASSETS
Current Assets
Cash and cash equivalents
Restricted cash and cash equivalents
Inventories
Receivables
Other current assets
Total Current Assets
Non-Current Assets
Property, plant and equipment
Total Non-Current Assets
TOTAL ASSETS
Notes
32
20
21
22
23
24
LIABILITIES
Current Liabilities
Payables 27
Borrowings 28
Provisions 29
Other current liabilities 30
Total Current Liabilities
Non-Current Liabilities
Borrowings
Provisions
Total Non-Current Liabilities
TOTAL LIABILITIES
NET ASSETS
EQUITY
Contributed equity
Reserves
Accumulated surplus/(deficit)
TOTAL EQUITY
28
29
31
11
8,571,997
323,371
10,287
1,711,932
304,867
10,922,454
154,993,068
154,993,068
165,915,522
985,571
73,009
2,839,248
363,838
4,261,666
425,141
630,932
1,056,072
5,317,737
160,597,785
29,099,719
126,199,813
5,298,253
1 160,597,785
The Statement of Financial Position should be read in conjunction with the accompanying notes.
5,068,300
2,063,945
44,060
1,564,029
344,894
9,085,228
102,441,226
102,441,226
111,526,454
783,804
70,894
2,339,032
1,109,166
4,302,896
498,938
881,943
1,380,881
5,683,777
105,842,677
29,099,719
71,406,153
5,336,803
105,842,675
27

I. I I I I I
Balance at 1 January 2009Changes in accounting policy or correction of prior period error.Restated balance at 1 January 2009
Total comprehensive income for the year
Transaction with owners in their capacity as owneCapital appropriationsOther contribution by ownersDistribution to ownersTotalBalance at 31 December 2009
Balance at 1 January 2010
Total comprehensive income for the yea
Transaction with owners in their capacity as owneCapital appropriationsOther contribution by ownersDistribution to ownersOther adjustmentsTotalBalance at 31 December 2010
31 28,231,057 82,959,955 4,469,964 115,660,976
28,231,057 82,959,955 4,469,964 115,660,976
(11,553,802) 866,839 (10,686,963
528,068340,594
528,068340,594
868,662 868,66229,099,719 71,406,153 5,336,803 105,842,675
29,099,719 71,406,153 5,336,803 105,842,675
54,793,660 (47,957) 54,745,703
9,407 9,40754,793,660 (38,550) 54,755,110
29,099,719 126,199,813 5,298,253 160,597,785
The Statement of Changes in Equity should be read in conjunction with the accompanying notes.
28
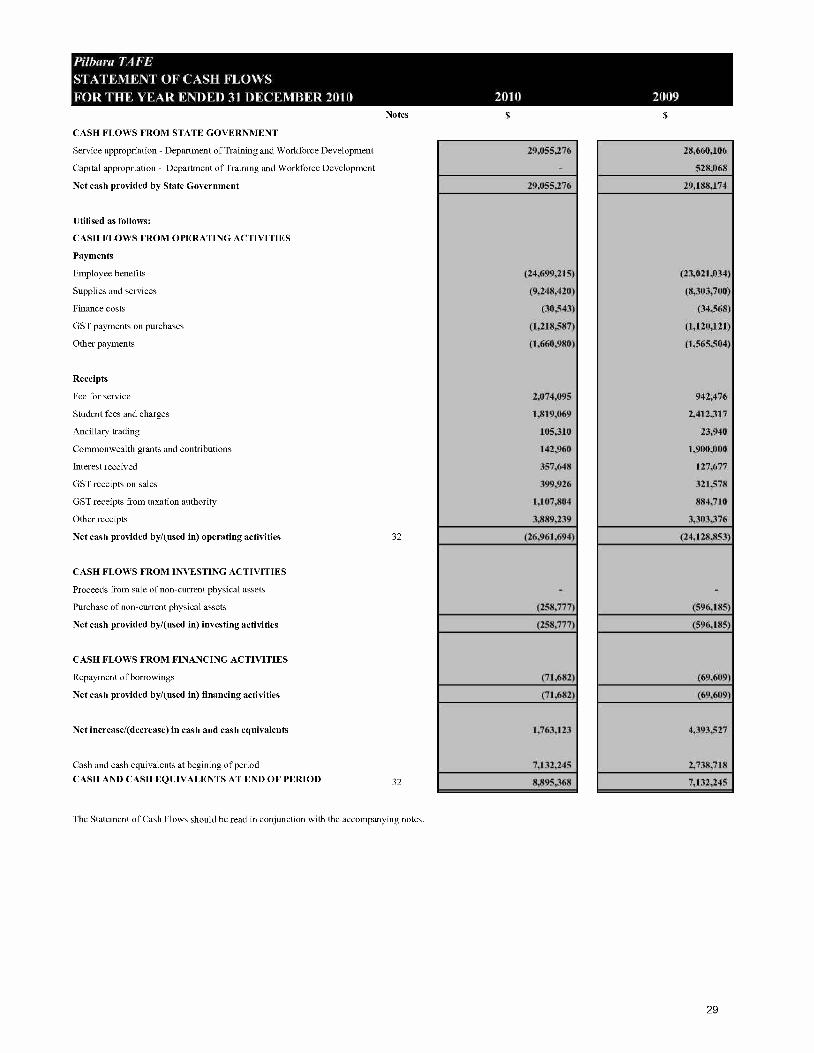
Pilbara TAFESTATEMENT OF CASH FLOWSFOR THE YEAR ENDED 31 DECEMBER 2010 2010 2009
CASH FLOWS FROM STATE GOVERNMENT
Service appropriation Department of Training and Workforce Development
Capital appropriation Department of Training and Workforce Development
Net cash provided by State Government
Utilised as follows:
CASH FLOWS FROM OPERATING ACTIVITIES
Payments
Employee benefits
Supplies and services
Finance costs
GST payments on purchases
Other payments
Receipts
Fee for service
Student fees and charges
Ancillary trading
Commonwealth grants and contributions
Interest received
GST receipts on sales
GST receipts from taxation authority
Other receipts
Net cash provided by/(used in) operating activities
CASH FLOWS FROM INVESTING ACTIVITIES
Proceeds from sale of non-current physical assets
Purchase of non-current physical assets
Net cash provided by/(used in) investing activities
CASH FLOWS FROM FINANCING ACTIVITIES
Repayment of borrowings
Net cash provided by/(used in) financing activities
Net increase/(decrease) in cash and cash equivalents
Cash and cash equivalents at begining of period
CASH AND CASH EQUIVALENTS AT END OF PERIOD
Notes
32
32
The Statement of Cash Flows should be read in conjunction with the accompanying notes.
29,055,276
29,055,276
(24,699,215)
(9,248,420)
(30,543)
(1,218,587)
(1,660,980)
2,074,095
1,819,069
105,310
142,960
357,648
399,926
1,107,804
3,889,239
(26,961,694)
(258,777)
r(258,777)
(71,682)
(71,682)
L1,763,123
7,132,245
8,895,368
28,660,106
528,068
29,188,174
(23,021,034)
(8,303,700)
(34,568)
(1,120,121)
(1,565,504)
942,476
2,412,317
23,940
1,900,000
127,677
321,578
884,710
3,303,376
(24,128,853)
(596,185)
(596,185)
(69,609)
(69,609)
4,393,527
2,738,718
7,132,245
29
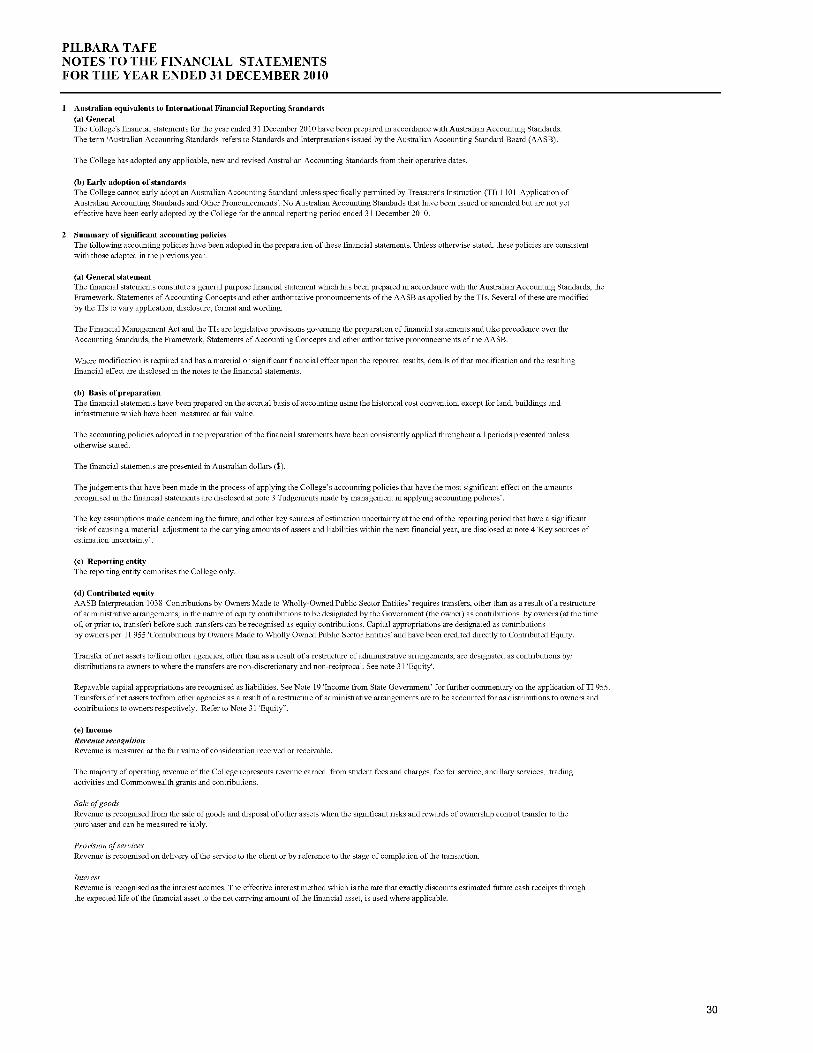
PILBARA TAFENOTES TO THE FINANCIAL STATEMENTSFOR THE YEAR ENDED 31 DECEMBER 2010
1 Australian equivalents to International Financial Reporting Standards(a) GeneralThe College's financial statements for the year ended 31 December 2010 have been prepared in accordance with Australian Accounting Standards.The term 'Australian Accounting Standards' refers to Standards and Interpretations issued by the Australian Accounting Standard Board (AASB).
The College has adopted any applicable, new and revised Australian Accounting Standards from their operative dates.
(b) Early adoption of standardsThe College cannot early adopt an Australian Accounting Standard unless specifically permitted by Treasurer's Instruction (TI) 1101 'Application ofAustralian Accounting Standards and Other Pronouncements'. No Australian Accounting Standards that have been issued or amended but are not yeteffective have been early adopted by the College for the annual reporting period ended 31 December 2010.
2 Summary of significant accounting policiesThe following accounting policies have been adopted in the preparation of these financial statements. Unless otherwise stated, these policies are consistentwith those adopted in the previous year.
(a) General statementThe fmancial statements constitute a general purpose financial statement which has been prepared in accordance with the Australian Accounting Standards, theFramework, Statements of Accounting Concepts and other authoritative pronouncements of the AASB as applied by the TIs. Several of these are modifiedby the TIs to vary application, disclosure, format and wording.
The Financial Management Act and the TIs are legislative provisions governing the preparation of fmancial statements and take precedence over theAccounting Standards, the Framework, Statements of Accounting Concepts and other authoritative pronouncements of the AASB.
Where modification is required and has a material or significant financial effect upon the reported results, details of that modification and the resulfinancial effect are disclosed in the notes to the financial statements.
(b) Basis of preparationThe fmancial statements have been prepared on the accrual basis of accounting using the historical cost convention, except for land, buildings andinfrastructure which have been measured at fair value.
The accounting policies adopted in the preparation of the financial statements have been consistently applied throughout all periods presented unlessotherwise stated.
The financial statements are presented in Australian dollars ($).
g
The judgements that have been made in the process of applying the College's accounting policies that have the most significant effect on the amountsrecognised in the financial statements are disclosed at note 3 'Judgements made by management in applying accounting policies'.
The key assumptions made concerning the future, and other key sources of estimation uncertainty at the end of the reporting period that have a significantrisk of causing a material adjustment to the carrying amounts of assets and liabilities within the next financial year, are disclosed at note 4 Rey sources ofestimation uncertainty'.
(c) Reporting entityThe reporting entity comprises the College only.
(d) Contributed equityAASB Interpretation 1038 'Contributions by Owners Made to Wholly-Owned Public Sector Entities' requires transfers, other than as a result of a restructureof administrative arrangements, in the nature of equity contributions to be designated by the Government (the owner) as contributions by owners (at the timeof, or prior to, transfer) before such transfers can be recognised as equity contributions. Capital appropriations are designated as contributionsby owners per TI 955 'Contributions by Owners Made to Wholly Owned Public Sector Entities' and have been credited directly to Contributed Equity.
Transfer of net assets to/from other agencies, other than as a result of a restructure of administrative arrangements, are designated as contributions by/distributions to owners to where the transfers are non-discretionary and non-reciprocal. See note 31 'Equity'.
Repayable capital appropriations are recognised as liabilities. See Note 19 'Income from State Government' for further commentary on the application of TI 955.Transfers of net assets to/from other agencies as a result of a restructure of administrative arrangements are to be accounted for as distributions to ownersandcontributions to owners respectively. Refer to Note 31 'Equity".
(e) IncomeRevenue recognitionRevenue is measured at the fair value of consideration received or receivable.
The majority of operating revenue of the College represents revenue earned from student fees and charges, fee for service, ancillary services, tradingactivities and Commonwealth grants and contributions.
Sale of goodsRevenue is recognised from the sale of goods and disposal of other assets when the significant risks and rewards of ownership control transfer to thepurchaser and can be measured reliably.
Provision of servicesRevenue is recognised on delivery of the service to the client or by reference to the stage of completion of the transaction.
InterestRevenue is recognised as the interest accrues. The effective interest method which is the rate that exactly discounts estimated future cash receipts throughthe expected life of the financial asset to the net carrying amount of the financial asset, is used where applicable.
30
PILBARA TAFENOTES TO THE FINANCIAL STATEMENTSFOR THE YEAR ENDED 31 DECEMBER 2010
Grants, donations, gifts and other non reciprocal contributionsRevenue is recognised at fair value when the College obtains control over the assets comprising the contributions, usually upon their eceipt.
Other non-reciprocal contributions that are not contributions by owners are recognised at their fair value. Contributions of services are only recognisedwhen a fair value can be reliably determined and the services would be purchased if not donated.
Service appropriationsService Appropriations are recognised as revenues at nominal value in the period in which the Authority gains control of the appropriated funds.The Authority gains control of appropriated funds at the time those funds are deposited to the bank account or credited to the 'Amounts receivable forservices'(holding account) held at Treasury.
State fundsThe funds received from the Department of Training and Workforce Development in respect of the delivery of services forming part of the DeliveryPerformance Agreement are included in State funds, disclosed under 'Income from State Government'. They are the result of training successfully tendered forunder competitive tendering arrangements. This revenue is recognised at nominal value in the period in which the College meets the terms of the Agreement.See note 19 'Income from State Government'.
GainsGains may be realised or unrealised and are usually recognised on a net basis. These include gains arising on the disposal of non-current assets andsomerevaluations of non-current assets.
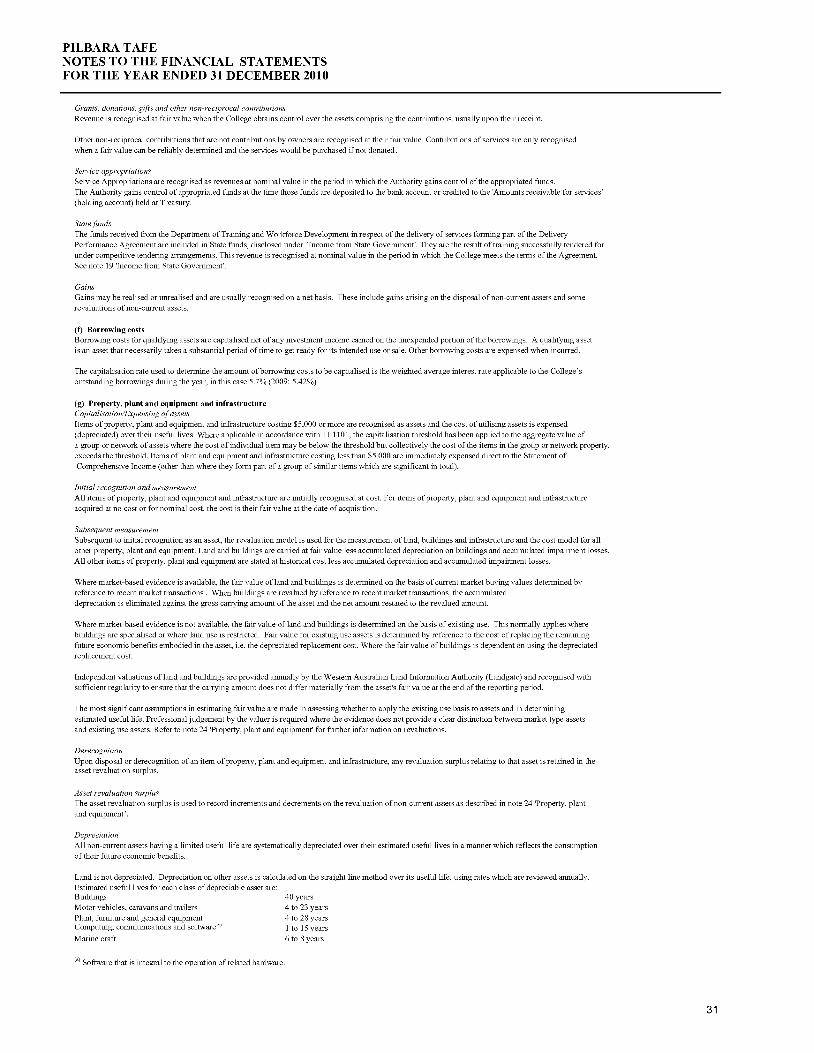
(f) Borrowing costsBorrowing costs for qualifying assets are capitalised net of any investment income earned on the unexpended portion of the borrowings. A qualifying assetis an asset that necessarily takes a substantial period of time to get ready for its intended use or sale. Other borrowing costs are expensed when incurred.
The capitalisation rate used to determine the amount of borrowing costs to be capitalised is the weighted average interest rate applicable to the College'soutstanding borrowings during the year, in this case 5.7% (2009: 5.42%)
(g) Property, plant and equipment and infrastructureCapitalisation/Expensing of assetsItems of property, plant and equipment and infrastructure costing $5,000 or more are recognised as assets and the cost of utilising assets is expensed(depreciated) over their useful lives. Where applicable in accordance with TI 1101, the capitalisation threshold has been applied to the aggregate value ofa group or network of assets where the cost of individual item may be below the threshold but collectively the cost of the items inthe group or network property,exceeds the threshold. Items of plant and equipment and infrastructure costing less than $5,000 are immediately expensed direct to the Statement ofComprehensive Income (other than where they form part of a group of similar items which are significant in total).
Initial recognition and measurementAll items of property, plant and equipment and infrastructure are initially recognised at cost. Foacquired at no cost or for nominal cost, the cost is their fair value at the date of acquisition.
ems of property, plant and equipment and infrastructure
Subsequent measurementSubsequent to initial recognition as an asset, the revaluation model is used for the measurement of land, buildings and infrastructure and the cost model for allother property, plant and equipment. Land and buildings are carried at fair value less accumulated depreciation on buildings and accumulated impairment losses.All other items of property, plant and equipment are stated at historical cost less accumulated depreciation and accumulated impairment losses.
Where market-based evidence is available, the fair value of land and buildings is determined on the basis of current market buying values determined byreference to recent market transactions . When buildings are revalued by reference to recent market transactions, the accumulateddepreciation is eliminated against the gross carrying amount of the asset and the net amount restated to the revalued amount.
Where market-based evidence is not available, the fair value of land and buildings is determined on the basis of existing use. This normally applies wherebuildings are specialised or where land use is restricted. Fair value for existing use assets is determined by reference to the cost of replacing the remainingfuture economic benefits embodied in the asset, i.e. the depreciated replacement cost. Where the fair value of buildings is dependent on using the depreciatedreplacement cost.
Independent valuations of land and buildings are provided annually by the Western Australian Land Information Authority (Landgate) and recognised withsufficient regularity to ensure that the carrying amount does not differ materially from the asset's fair value at the end of the reporting period.
The most significant assumptions in estimating fair value are made in assessing whether to apply the existing use basis to assets and in determiningestimated useful life. Professional judgement by the valuer is required where the evidence does not provide a clear distinction between market type assetsand existing use assets. Refer to note 24 Property, plant and equipment' for further information on revaluations.
DerecognitionUpon disposal or derecognition of an item of property, plant and equipment and infrastructure, any revaluation surplus relating to that asset is retained in theasset revaluation surplus.
Asset revaluation surplusThe asset revaluation surplus is used to record increments and decrements on the revaluation of non-current assets as described in note 24 Property, plantand equipment'.
DepreciationAll non-current assets having a limited useful life are systematically depreciated over their estimated useful lives in a manner which reflects the consumptionof their future economic benefits.
Land is not depreciated. Depreciation on other assets is calculated on the straight line method over its useful life, using rates which are reviewed annually.Estimated useful lives for each class of depreciable asset are:Buildings 40 yearsMotor vehicles, caravans and trailersPlant, furniture and general equipmentComputmg, communications and software'Marine craft
(l) Software that is integral to the operation of related hardware.
4 to 23 years4 to 28 years1 to 15 years6 to 8 years
31

PILBARA TAFENOTES TO THE FINANCIAL STATEMENTSFOR THE YEAR ENDED 31 DECEMBER 2010
(h) Intangible assetsCapitalisation/Expensing of assetsAcquisitions of intangible assets costing $5,000 or more and internally generated intangible assets costing $5,000 or more, are capitalised. The cost of utilising theassets is expensed (amortised) over their useful life. Costs incurred below these thresholds are recognised as an expense in the Statement of ComprehensiveIncome
All acquired and internally developed intangible assets are initially recognised at cost. For assets acquired at no cost or for nominal cost, the cost istheir fairvalue at the date of acquisition.
The cost model is applied for subsequent measurement requiring the asset to be carried at cost less any accumulated amortisation and accumulatedimpairment losses.
Amortisation for intangible assets with finite useful lives is calculated for the period of the expected benefit (estimated useful life) on the straight line basisusing rates which are reviewed annually. All intangible assets controlled by the College have a finite useful life and zero residual value. The expected usefullives for each class of intangible asset are:Licences up to 10 yearsResearch and development costs 3 to 5 yearsSoftware 3 to 5 yearsWeb site costs 3 to 5 years
(a) Software that is not integral to the operation of any related hardware.
LicencesLicences have a finite useful life and are carried at cost less accumulated amortisation and accumulated impairment losses.
Computer softwareSoftware that is an integral part of the related hardware is treated as property, plant and equipment. Software that is not an integral part ofthe relatedhardware is treated as an intangible asset. Software costing less than $5,000 is expensed in the year of acquisition.
Web site costsWeb site costs are charged as expenses when they are incurred unless they relate to the acquisition or development of an asset when they maybe capitalisedand amortised. Generally, costs in relation to feasibility studies during the planning phase of a website, and ongoing costs of maintenance during theoperating phase are expensed. Costs incurred in building or enhancing a web site, to the extent that they represent probable future economic benefits thatcan be reliably measured, are capitalised.
(i) Impairment of assetsProperty, plant and equipment, infrastructure and intangible assets are tested for any indication of impairment at the end of each reporting period. Where there isan indication of impairment, the recoverable amount is estimated. Where the recoverable amount is less than the carrying amount, the asset is considered impairedand is written down to the recoverable amount and an impairment loss is recognised. As the College is a not-for-profit entity, unless an asset hasbeen identifiedas a surplus asset, the recoverable amount is the higher of an asset's fair value less costs to sell and depreciated replacement cost.
The risk of impairment is generally limited to circumstances where an asset's depreciation is materially understated, where the replacement cost is fallingor where there is a significant change in useful life.
Each relevant class of assets is reviewed annually to verify that the accumulated depreciation/amortisation reflects the level of consumption or expirationof assets' future economic benefits and to evaluate any impairment risk from falling replacement costs or a significant change in useful life.
Intangible assets with an indefinite useful life and intangible assets not yet available for use are tested for impairment at the end of each reportingperiodirrespective of whether there is any indication of impairment.
The recoverable amount of assets identified as surplus assets is the higher of fair value less costs to sell and the present value of future cash flowsexpected to be derived from the asset. Surplus assets carried at fair value have no risk of material impairment where fair value is determined byreferenceto market-based evidence. Where fair value is determined by reference to depreciated replacement cost, surplus assets are at risk of impairment and therecoverable amount is measured. Surplus assets at cost are tested for indications of impairment at the end of each reporting period.
See note 26 'Impairment of assets' for the outcome of impairment reviews and testing. See note 2(p) 'Receivables' and note 22 Receivables' forimpairment of receivables.
(j) Non-current assets (or disposal groups) classified as held for saleNon-current assets (or disposal groups) held for sale are recognised at the lower of carrying amount and fair value less costs to sell and arepresentedseparately from other assets in the Statement of Financial Position. Assets classified as held for sale are not depreciated or amortised.
(k) LeasesAt the commencement of the lease term, finance lease rights and obligations are recognised as assets and liabilities equal in amount to the fair valueof theleased item or, if lower, the present value of the minimum lease payments, each determined at the inception of the lease. The assets are disclosed asMotor Vehicles and Multifunction Devices) , and are depreciated over the period during which the College is expected to benefit from their use.Minimum lease payments are apportioned between finance charge and reduction of the outstanding lease liability, according to the interest rate implicit
in the lease.
The College has entered into operating lease arrangements for (Motor Vehicles and Multifunction Devices). Lease payments are expensed on a straight linebasis over the lease term as this represents the pattern of benefits derived from the leased asset.
32

PILBARA TAFENOTES TO THE FINANCIAL STATEMENTSFOR THE YEAR ENDED 31 DECEMBER 2010
(I) Financial instrumentsIn addition to cash and bank overdraft, the College has two categories of financial struments:
Loans and receivables; andFinancial liabilities measured at amortised cost
These have been disaggregated into the following classes:
Financial assetscash and cash equivalents (including restricted cash and cash equivalents)receivablesloans and advances
Financial liabilitiesWATC/Bank borrowings
Initial recognition and measurement of financial instruments is at fair value. Usually the transaction cost or face value is equivalent to fair value and sub-sequent measurement is at amortised cost using the effective interest method.
The fair value of short-term receivables and payables is the transaction cost or the face value because there is no interest rate applicable and subsequentmeasurement is not required as the effect of discounting is not material.
(m) Cash and cash equivalentsFor the purpose of the Statement of Cash Flows, cash and cash equivalents include restricted cash and cash equivalents. These are comprised of cash onhandand short-term deposits with original maturities of three months or less that are readily convertible to a known amount of cash and which are subject toinsignificant risk of changes in value, and bank overdrafts. Bank overdrafts are included at note 28 Borrowings'.
(n) Accrued salariesThe accrued salaries suspense account (see note 20 Restricted cash and cash equivalents') consists of amounts paid annually into a suspense accountover a period of ten financial years to largely meet the additional cash outlay in each eleventh year when 27 pay days occur instead ofthe normal 26.No interest is received on this account.
Accrued salaries (see note 27 'Payables') represent the amount due to staff but unpaid at the end of the financial year, as the end ofthe last pay periodfor that financial year does not coincide with the end of the financial year. Accrued salaries are settled within a fortnight of the financial year end. The Collegeconsiders the canying amount of accrued salaries to be equivalent to its net fair value.
(o) InventoriesInventories are measured at the lower of cost and net realisable value. Costs are assigned by the method most appropriate to each particular class ofinventory, with the majority being valued on a first in first out basis.
Inventories not held for resale are valued at cost unless they are no longer required, in which case they are valued at net realisable value.
See note 21 'Inventories'.
(p) ReceivablesReceivables are recognised and carried at original invoice amount less an allowance for any uncollectible amounts (impairment). The collectability ofreceivables is reviewed on an ongoing basis and any receivables identified as uncollectible are written off against the allowance account. The provision foruncollectible amounts (doubtful debts) is raised when there is objective evidence that the College will not be able to collect the debts. The canying amountisequivalent to fair value as it is due for settlement within 30 days. See note 2(1) Financial instruments' and note 22 Receivables'.
A provision for impairment of receivables can only be raised if there is objective evidence of impairment.
(q) PayablesPayables are recognised at the amounts payable when the College becomes obliged to make future payments as a result of a purchase of assets orservices. The carrying amount is equivalent to fair value, as they are generally settled within 30 days. See note 2(1) Financial instruments' and note 27'Payables'.
(r) BorrowingsAll loans payable are initially recognised at cost, being the fair value of the net proceeds received. Subsequent measurement is at amortised cost using theeffective interest rate method. See note 2(1) 'Financial instruments' and note 28 Borrowings'.
(s) ProvisionsProvisions are liabilities of uncertain timing and/or amount and are recognised where there is a present legal, equitable or constructive obligation as a resultof a past event and when the outflow of resources embodying economic benefits is probable and a reliable estimate can be made of the amountof theobligation. Provisions are reviewed at the end of each reporting period. See note 29 Provisions'.
(i) Provisions - employee benefitsAll annual leave and long service leave provisions are in respect of employees' services up to the end of the reporting period.
Annual leaveThe liability for annual leave expected to be settled within twelve months after the reporting period is recognised and measured at the undiscounted amountsexpected to be paid when the liabilities are settled. Annual leave not expected to be settled within 12 months after the reporting period is recognisedand measured at the present value of amounts expected to be paid when the liabilities are settled using the remuneration rate expected to apply atthe time of settlement.
When assessing expected future payments consideration is given to expected future wage and salary levels including non-salary components such asemployer superannuation contributions, as well as the experience of employee departures and periods of service. The expected future paymentsare discounted using market yields at the end of the reporting period on national government bonds with terms to maturity that match, as closelyas possible, the estimated future cash outflows.
The provision for annual leave is classified as a current liability as the College does not have an unconditional right to the defer settlement ofthe liabilityfor at least 12 months after the reporting period.
33
PILBARA TAFENOTES TO THE FINANCIAL STATEMENTSFOR THE YEAR ENDED 31 DECEMBER 2010
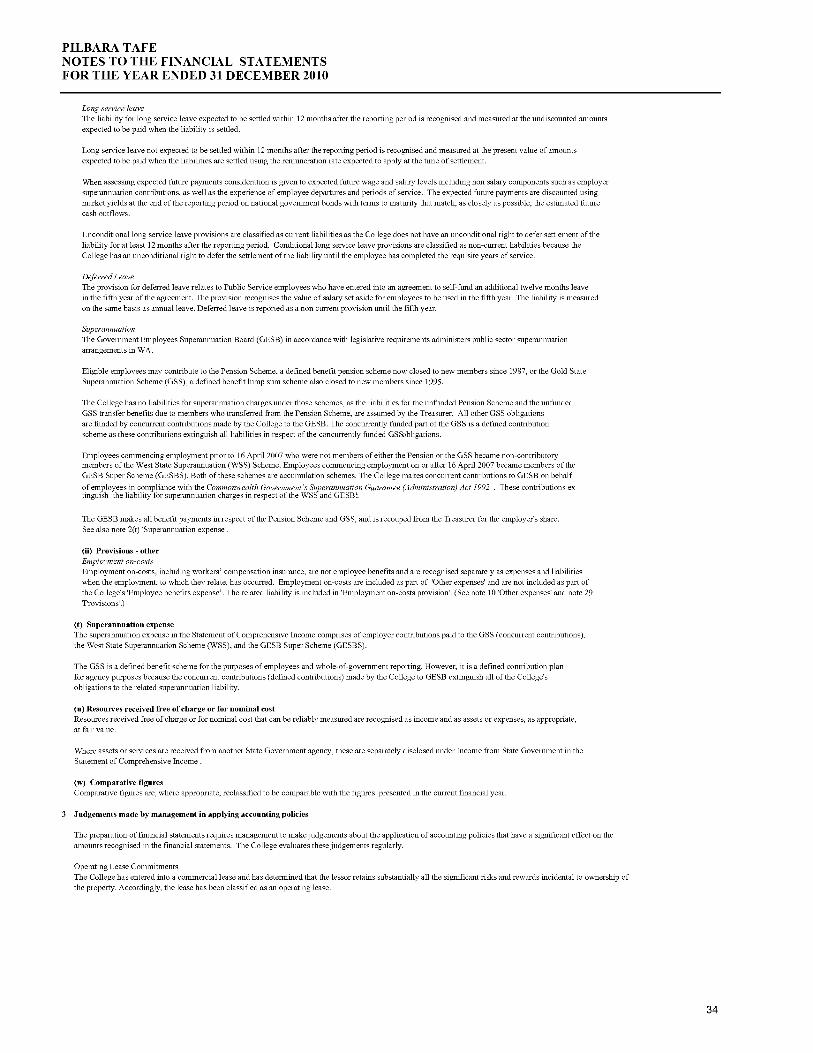
Long service leaveThe liability for long service leave expected to be settledexpected to be paid when the liability is settled.
hin 12 months after the reporting period is recognised and measured at the undiscounted amounts
Long service leave not expected to be settled within 12 months after the reporting period is recognised and measured at the present value of amountsexpected to be paid when the liabilities are settled using the remuneration rate expected to apply at the time of settlement.
When assessing expected future payments consideration is given to expected future wage and salary levels including non salary components such as employersuperannuation contributions, as well as the experience of employee departures and periods of service. The expected future payments are discounted usingmarket yields at the end of the reporting period on national government bonds with terms to maturity that match, as closely as possible, the estimatedfuturecash outflows.
Unconditional long service leave provisions are classified as current liabilities as the College does not have an unconditional right to defer settlement of theliability for at least 12 months after the reporting period. Conditional long service leave provisions are classified as non-current liabilities because theCollege has an unconditional right to defer the settlement of the liability until the employee has completed the requisite years of service.
Deferred LeaveThe provision for deferred leave relates to Public Service employees who have entered into an agreement to self -fund an additional twelve months leavein the fifth year of the agreement. The provision recognises the value of salary set aside for employees to be used in the fifth year. The liability is measuredon the same basis as annual leave. Deferred leave is reported as a non current provision until the fifth year.
SuperannuationThe Government Employees Superannuation Board (GESB) in accordance with legislative requirements administers public sector superannuationarrangements in WA.
Eligible employees may contribute to the Pension Scheme, a defined benefit pension scheme now closed to new members since 1987, or the Gold StateSuperannuation Scheme (GSS), a defined benefit lump sum scheme also closed to new members since 1995.
The College has no liabilities for superannuation charges under those schemes, as the liabilities for the unfunded Pension Scheme and the unfundedGSS transfer benefits due to members who transferred from the Pension Scheme, are assumed by the Treasurer. All other GSS obligationsare funded by concurrent contributions made by the College to the GESB. The concurrently funded part of the GSS is a defined contributionscheme as these contributions extinguish all liabilities in respect of the concurrently funded GS Sobligations.
Employees commencing employment prior to 16 April 2007 who were not members of either the Pension or the GSS became non-contributorymembers of the West State Superannuation (WSS) Scheme. Employees commencing employment on or after 16 April 2007 became members of theGESB Super Scheme (GESBS). Both of these schemes are accumulation schemes. The College makes concurrent contributions to GESB on behalf
of employees in compliance with the Commonwealth Government's Superannuation Guarantee (Administration) Act 1992 . These contributions ex-tinguish the liability for superannuation charges in respect of the WSS and GESBL
The GESB makes all benefit payments in respect of the Pension Scheme and GSS, and is recouped from the Treasurer for the employer's share.See also note 2(t) 'Superannuation expense.
(ii) Provisions - otherEmployment on-costsEmployment on-costs, including workers' compensation insurance, are not employee benefits and are recognised separately as expenses and liabilitieswhen the employment, to which they relate, has occurred. Employment on-costs are included as part of 'Other expenses' and are not included as part ofthe Colleges 'Employee benefits expense'. The related liability is included in 'Employment on-costs provision'. (See note 10 'Other expenses' and note 29Provisions')
(t) Superannuation expenseThe superannuation expense in the Statement of Comprehensive Income comprises of employer contributions paid to the GSS (concurrent contributions),the West State Superannuation Scheme (WSS), and the GESB Super Scheme (GESBS).
The GSS is a defined benefit scheme for the purposes of employees and whole-of-government reporting. However, it is a defined contribution planfor agency purposes because the concurrent contributions (defined contributions) made by the College to GESB extinguish all of the Collegesobligations to the related superannuation liability.
(u) Resources received free of charge or for nominal costResources received free of charge or for nominal cost that can be reliably measured are recognised as income and as assets or expenses, as appropriate,at fair value.
Where assets or services are received from another State Government agency, these are separately disclosed under Income from State Government in theStatement of Comprehensive Income .
(w) Comparative figuresComparative figures are, where appropriate, reclassified to be comparable with the figures presented in the current financial year.
3 Judgements made by management in applying accounting policies
The preparation of financial statements requires management to make judgements about the application of accounting policies that have a significant effect on theamounts recognised in the financial statements. The College evaluates these judgements regularly.
Operating Lease CommitmentsThe College has entered into a commercial lease and has determined that the lessor retains substantially all the significant risks and rewards incidental to ownership ofthe property. Accordingly, the lease has been classified as an operating lease.
34
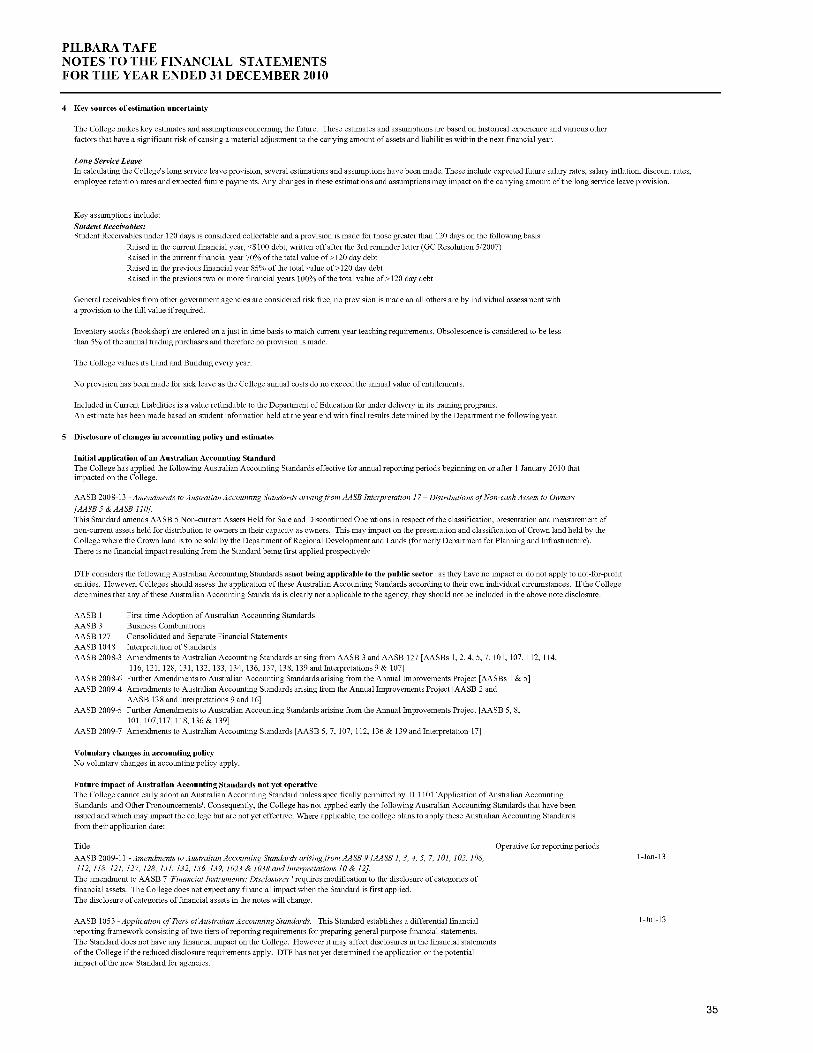
PILBARA TAFENOTES TO THE FINANCIAL STATEMENTSFOR THE YEAR ENDED 31 DECEMBER 2010
4 Key sources of estimation uncertainty
The College makes key estimates and assumptions concerning the future. These estimates and assumptions are based on historical experience and various otherfactors that have a significant risk of causing a material adjustment to the canying amount of assets and liabilities within the next financial year.
Long Service LeaveIn calculating the Colleges long service leave provision, several estimations and assumptions have been made. These include expected future salary rates, salary inflation, discount rates,employee retention rates and expected future payments. Any changes in these estimations and assumptions may impact on the carrying amount of the long service leave provision.
Key assumptions include:Student Receivables:Student Receivables under 120 days is considered collectable and a provision is made for those greater than 120 days on the following basis
Raised in the current financial year, <$100 debt, written off after the 3rd reminder letter (GC Resolution 5/2007)Raised in the current financial year 70% of the tatal value of >120 day debtRaised in the previous financial year 85% of the total value of >120 day debtRaised in the previous two or more financial years 100% of the total value of >120 day debt
General receivables from other government agencies are considered risk free, no provision is made an all others are by individual assessment witha provision to the full value if required.
Inventory stocks (bookshop) are ordered on a just in time basis to match current year teaching requirements. Obsolescence is considered to be lessthan 5% of the annual trading purchases and therefore no provision is made.
The College values its Land and Building every year.
No provision has been made for sick leave as the College annual costs do no exceed the annual value of entitlements.
Included in Current Liabilities is a value refundable to the Department of Education for under delivery in its training programs.An estimate has been made based on student information held at the year end with final results determined by the Department the following year.
5 Disclosure of changes in accounting policy and estimates
Initial application of an Australian Accounting StandardThe College has applied the following Australian Accounting Standards effective for annual repoimpacted on the College.
g periods beginning on or after 1 January 2010 that
AASB 2008-13 Amendments to Australian Accounting Standards arising]rom AASB Interpretation 17 Distributions of Non-cash Assets to Owners
[AASB 5 & AASB 110].This Standard amends AASB 5 Non-current Assets Held for Sale and Discontinued Operations in respect of the classification, presentation and measurement ofnon-current assets held for distribution to owners in their capacity as owners. This may impact on the presentation and classification of Crown land held bytheCollege where the Crown land is to be sold by the Department of Regional Development and Lands (formerly Department for Planning and Infrastructure).There is no financial impact resulting from the Standard being first applied prospectively
DTF considers the following Australian Accounting Standards asnot being applicable to the public sector as they have no impact or do not apply to not-for-profitentities. However, Colleges should assess the application of these Australian Accounting Standards according to their own individual circumstances. If the Collegedetermines that any of these Australian Accounting Standards is clearly not applicable to the agency, they should not be included in the above note disclosure.
AASB 1 First-time Adoption of Australian Accounting StandardsAASB 3 Business CombinationsAASB 127 Consolidated and Separate Financial StatementsAASB 1048 Interpretation of StandardsAASB 2008-3 Amendments to Australian Accounting Standards arising from AASB 3 and AASB 127 [AASBs 1, 2, 4, 5, 7, 101, 107, 112, 114,
116, 121, 128, 131, 132, 133, 134, 136, 137, 138, 139 and Interpretations 9 & 107]AASB 2008-6 Further Amendments to Australian Accounting Standards arising from the Annual Improvements Project [AASBs 1 & 5]AASB 2009-4 Amendments to Australian Accounting Standards arising from the Annual Improvements Project [AASB 2 and
AASB 138 and Interpretations 9 and 16]AASB 2009-5 Further Amendments to Australian Accounting Standards arising from the Annual Improvements Project [AASB 5, 8,
101, 107,117, 118, 136 & 139]AASB 2009-7 Amendments to Australian Accounting Standards [AASB 5, 7, 107, 112, 136 & 139 and Interpretation 17]
Voluntary changes in accounting policyNo voluntary changes in accounting policy apply.
Future impact of Australian Accounting Standards not yet operativeThe College cannot early adopt an Australian Accounting Standard unless specifically permitted by TI 1101 'Application of Australian AccountingStandards and Other Pronouncements'. Consequently, the College has not applied early the following Australian Accounting Standards that have beenissued and which may impact the college but are not yet effective. Where applicable, the college plans to apply these Australian Accounting Standardsfrom their application date:
Title
AASB 2009-11 Amendments to Australian Accounting- Standards arising from AASB 9 [AASB 1, 3, 4, 5, 7, 101, 102, 108,112, 118, 121, 127, 128, 131, 132, 136, 139, 1023 & 1038 and Imopretations 10 & 12].
The amendment to AASB 7 'Financial Instruments: Disclosures ' requires modification to the disclosure of categories offinancial assets. The College does not expect any financial impact when the Standard is first applied.The disclosure of categories of financial assets in the notes will change.
Operative for reporting periods
AASB 1053 Application of Tiers of Australian Accounting Standards. This Standard establishes a differential financialreporting framework consisting of two tiers of reporting requirements for preparing general purpose financial statements.The Standard does not have any financial impact on the College. However it may affect disclosures in the financial statementsof the College if the reduced disclosure requirements apply. DTF has not yet determined the application or the potentialimpact of the new Standard for agencies.
1-Jan-13
1-Jul-13
35

PILBARA TAFENOTES TO THE FINANCIAL STATEMENTSFOR THE YEAR ENDED 31 DECEMBER 2010
AASB 2010-2 Amendments to Australian Accounting Standards arising from Reduced Disclosure RequirementsThis Standard makes amendments to many Australian Accounting Standards, including Interpretations, to introduce reduceddisclosure requirements into these pronouncements for application by certain types of entities.The Standard is not expected to have any financial impact on the College. However this Standard may reduce some notedisclosures in the financial statements of the College. DTF has not yet determined the application or the potential impactof the amendments to these Standards for agencies.
1-Jul-13
DTF considers the following Australian Accounting Standards as eithernot being applicable to the public sector as they have no impact or do not apply tonot-for-profit entities. However, Colleges should assess whether these Australian Accounting Standards apply to their own specific circumstances.If the College considers any of these Australian Accounting Standards are clearly not applicable or will have no impact, they should not be included inthe above note disclosure.Title Operative for reporting periodsAASB 9 Financial Instruments 1-Jan-13AASB 124 Related Party Disclosures 1-Jan-11Int 19 Extinguishing Financial Liabilities with Equity Instruments 1-Jul-10AASB 2009-10 AASB 2009-10 Amendments to Australian Accounting Standards Classification of Rights 1-Feb-10
Issues [AASB 132]AASB 2009-12 Amendments to Australian Accounting Standards [AAS13s 5, 8, 108, 110, 111, 119, 133, 137, 139, 1-Jan-11
1013 & 1031 and Interpretations 1, 4, 16, 1039 & 1051]AASB 2009-13 Amendments to Australian Accounting Standards arising from Imp pretation 19 [AASB 1] 1-Jul-10AASB 2009-14 Amendments to Australian Interpretation Prepayments (1.,t niuunn Funding Requirement 1-Jan-11
[AASB Interpretation 14]AASB 2010-1 Amendments to the Australian Accounting Standards Limited Evemption from Comparative AASB 7 1-Jul-10
Disclosures Or First-time Adopters [AASB 1 & AASB 7]AASB 2010-3 Amendments to Australian Accounting Standards arising from the Annual Improvements Project 1-Jul-10
[AASB 3, AASB 7, AASB 121, AASB 128, AASB 131, AASB 132 and AASB 139]AASB 2010-4 Further Amendments to Australian Accounting Standards arising from the Annual Improvements 1-Jan-11
Project [AASB 1, AASB 7, AASB 101 & AASB 134 and Interpretation 13]
Changes in Accounting EstimatesNo changes in accounting estimates.
36
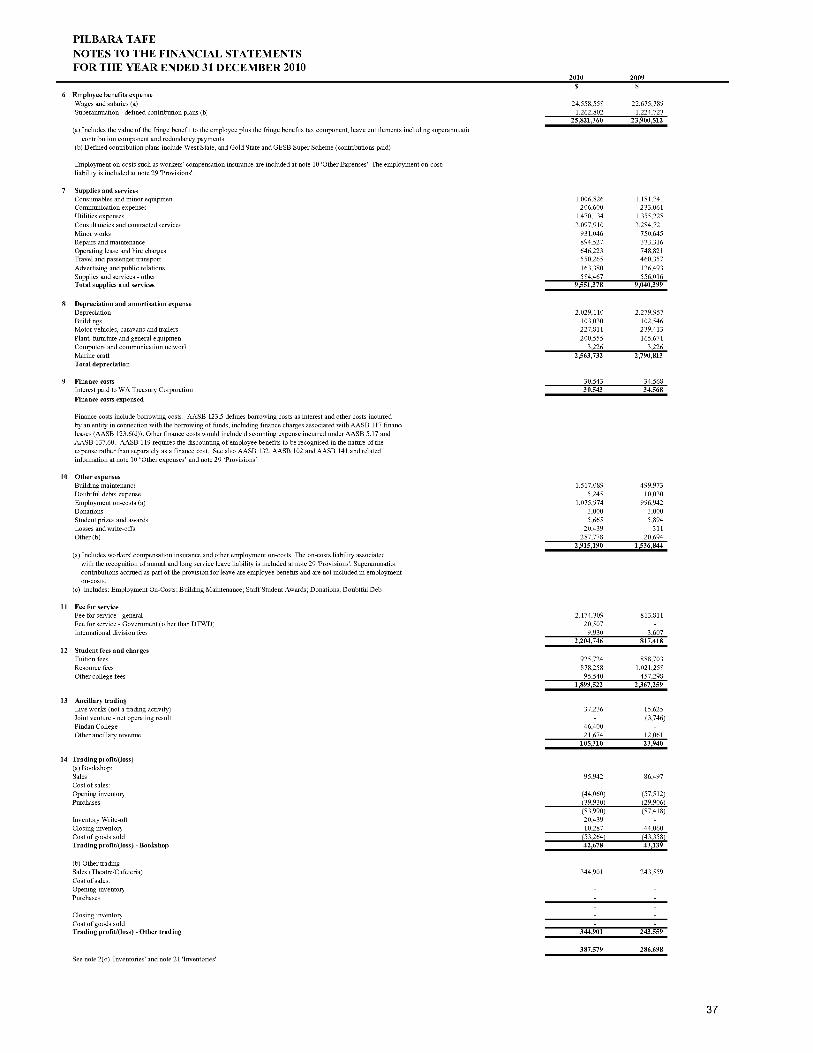
PILBARA TAFENOTES TO THE FINANCIAL STATEMENTSFOR THE YEAR ENDED 31 DECEMBER 2010
2010 2009
6 Employee benefits expenseWages and salaries (a) 24,558,558 22,675,789Superannuation - defined contribution plans (b 1,262,802 1,224,723
(a) Includes the value of the fringe benefit to the employee plus the fringe benefits tax component, leave entitlements including superannuaticcontribution component and redundancy payments
(b) Defined contribution plans include West State, and Gold State and GESB Super Scheme (contributions paid)
25,821,360 23 900 512
Employment on-costs such as workers' compensation insurance are included at note 10 'Other Expenses'. The employment on-costliability is included at note 29 'Provisions'.
7 Supplies and servicesConsumables and minor equipmen 1,006,826 1,181,741Communication expenses 206,600 233,061Utilities expenses 1,470,134 1,355,228Consultancies and contracted services 3,097,910 3,284,721Minor works 931,046 750,645Repairs and maintenance 894,527 333,316Operating lease and hire charges 646,223 748,821Travel and passenger transport 550,265 460,357Advertising and public relations 163,380 136,493Supplies and services -other 584,467 556,016Total supplies and services 9,551,378 9,040,399
8 Depreciation and amortisation expenseDepreciation 2,029,110 2,279,957Buildings 103,030 102,546Motor vehicles, caravans and trailers 227,811 239,413Plant, furniture and general equipmen 200,555 165,671Computers and communication networl 3,226 3,226Marine craft 2,563,732 2,790,813Total depreciation
9 Finance costs 30,543 34,568Interest paid to WA Treasury Corporation 30,543 34,568Finance costs expensed
Finance costs include borrowing costs. AASB 123.5 defines borrowing costs as interest and other costs incurredby an entity in connection with the borrowing of funds, including finance charges associated with AASB 117 financleases (AASB 123.6(d)). Other finance costs would include discounting expense incurred under AASB 5.17 andAASB 137.60. AASB 119 requires the discounting of employee benefits to be recognised in the nature of theexpense rather than separately as a finance cost. See also AASB 132, AASB 102 and AASB 141 and relatedinformation at note 10 'Other expenses' and note 29 'Provisions'
10 Other expensesBuilding maintenance 1,517,089 499,973Doubtful debts expense 5,245 10,030Employment on-costs (a) 1,075,974 996,942Donations 3,000 3,000Student prizes and awards 5,665 5,894Losses and write-offs 20,439 311Other (b) 287,778 20,694
(a) Includes workers' compensation insurance and other employment on-costs. The on-costs liability associatecwith the recognition of annual and long service leave liability is included at note 29 'Provisions'. Superannuatiorcontributions accrued as part of the provision for leave are employee benefits and are not included in employmenton-costs.
(c) Includes: Employment On-Costs; Building Maintenance; Staff Student Awards; Donations; Doubtful Deb
2,915,190 1,536,844
11 Fee for serviceFee for service - general 2,174,309 813,811Fee for service - Government (other than DTWD) 20,507International division fees 9,930 3,607
2,204,746 817,41812 Student fees and charges
Tuition fees 925,724 888,703Resource fees 878,258 1,021,258Other college fees 95,540 457,298
1,899,522 2,367,259
13 Ancillary tradingLive works (not a trading activity) 37,236 15,625Joint venture - net operating result (3,746)Pindan College 46,400Other ancillary revenue 21,674 12,061
105,310 23,940
14 Trading profit/(loss)(a) Bookshop:Sales 95,942 86,497Cost of sales:Opening inventory (44,060) (57,512)Purchases (39,930) (29,906)
(83,990) (87,418)Inventory Write-oft 20,439Closing inventory 10,287 44,060Cost of goods sold (53,264) (43,358)Trading profitl(loss) - Bookshop
(b) Other trading
42,678 43,139
Sales (Theatre/Cafeteria) 344,901 243,559Cost of sales:Opening inventoryPurchases
Closing inventoryCost of goods soldTrading profitl(loss) - Other trading 344,901 243,559
387,579 286,698See note 2(o) 'Inventories' and note 21 'Inventories'
37
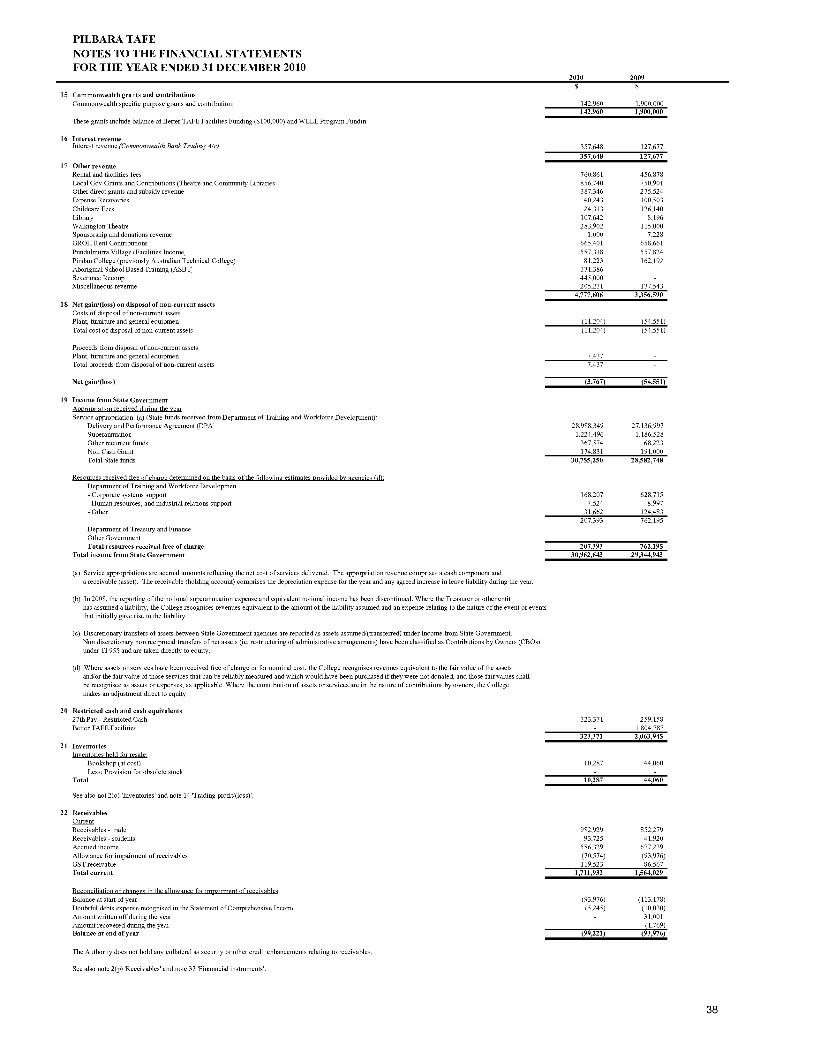
PILBARA TAFENOTES TO THE FINANCIAL STATEMENTSFOR THE YEAR ENDED 31 DECEMBER 2010
2010 2009
15 Commonwealth grants and contributionsCommonwealth specific purpose grants and contributions 142,960 1,900,000
142,960 1,900,000These grants include balance of Better TAFE Facilities Funding ($100,000) and WELL Program Fundin
16 Interest revenueInterest revenue (Commonwealth Bank Trading A/c) 357,648 127,677
357,648 127,67717 Other revenue
Rental and facilities fees 760,861 456,878Local Gov Grants and Contributions (Theatre and Community Libraries 856,740 750,901Other direct grants and subsidy revenue 387,346 275,524Expense Recoveries 40,243 100,503Childcare Fees 24,313 126,140Library 107,642 8,196Walkington Theatre 283,902 115,000Sponsorship and donations revenue 1,000 7,228GROH Rent Contributions 665,401 658,661Pundulmurra Village (Facilities Income 587,318 557,824Pindan College (previously Australian Technical College) 81,223 162,192Aboriginal School Based Training (ASB17 331,386Severance Recoup 445,000Miscellaneous revenue 205,231 137,543
4,777,606 3,356,59018 Net gain/(loss) on disposal of non-current assets
Costs of disposal of non-current assetsPlant, furniture and general equipmen (11,204) (54,551)Total cost of disposal of non-current assets (11,204) (54,551)
Proceeds from disposal of non-current assetsPlant, furniture and general equipmen 7,437Total proceeds from disposal of non-current assets 7,437
Net- gain/(loss) (3,767) (54,551)
19 Income from State GovernmentAppropriation received during the yearService appropriation (a) (State funds received from Department of Training and Workforce Development):
Delivery and Performance Agreement (DRAl 28,988,349 27,136,997Superannuation 1,224,496 1,186,528Other recurrent funds 367,574 68,223Non Cash Grant 174,831 191,000Total State funds 30,755,250 28,582,748
Resources received free of charge determined on the basis of the following estimates provided by agencies (d):Department of Training and Workforce Developmen- Corporate systems support 168,207 628,715- Human resources, and industrial relations support 7,524 8,997- Other 31,662 124,483
207,393 762,195Department of Treasury and FinanceOther GovernmentTotal resources received free of charge 207,393 762,195
Total income from State Government 30,962,643 29,344,943
(a) Service appropriations are accrual amounts reflecting the net cost of services delivered. The appropriation revenue comprises a cash component anda receivable (asset). The receivable (holding account) comprises the depreciation expense for the year and any agreed increase in leave liability during the year.
(b) In 2008, the reporting of the notional superannuation expense and equivalent notional income has been discontinued. Where the Treasurer or other entilhas assumed a liability, the College recognises revenues equivalent to the amount of the liability assumed and an expense relating to the nature of the event or eventsthat initially gave rise to the liability.
(c) Discretionary transfers of assets between State Government agencies are reported as assets assumed/(transferred) under Income from State Government.Non discretionary non reciprocal transfers of net assets (ie. restructuring of administrative arrangements) have been classified as Contributions by Owners (CBOs)under TI 955 and are taken directly to equity.
(d) Where assets or services have been received free of charge or for nominal cost, the College recognises revenues equivalent to the fair value of the assetsand/or the fair value of those services that can be reliably measured and which would have been purchased if they were not donated, and thosefair values shallbe recognised as assets or expenses, as applicable. Where the contribution of assets or services are in the nature of contributions by owners, the Collegemakes an adjustment direct to equity.
20 Restricted cash and cash equivalents27th Pay - Restricted Cash 323,371 259,158Better TAFE Facilities 1,804,787
323,371 2,063,94521 Inventories
Inventories held for resale:Bookshop (at cost) 10,287 44,060Less: Provision for obsolete stock
Total 10,287 44,060
See also not 2(o) 'Inventories' and note 14 'Trading profit/(loss)'.
22 ReceivablesCurrentReceivables - trade 982,929 852,279Receivables - students 93,725 41,920Accrued income 586,329 677,239Allowance for impairment of receivables (70,574) (93,976)GST receivable 119,523 86,567Total current 1,711,932 1,564,029
Reconciliation of changes in the allowance for impairment of receivablesBalance at start of year (93,976) (113,178)Doubtful debts expense recognised in the Statement of Comprehensive Income (5,245) (10,030)Amount written off during the yeas 31,001Amount recovered during the year (1,769)Balance at end of year (99,221) (93,976)
The Authority does not hold any collateral as security or other credit enhancements relating to receivables.
See also note 2(p) 'Receivables' and note 37 'Financial instruments'.
38

PILBARA TAFENOTES TO THE FINANCIAL STATEMENTSFOR THE YEAR ENDED 31 DECEMBER 2010
2010 2009
23 Other assetsCurrentPrepayments 250,348 285,686Other current assets (Apprentice Travel) 54,519 59,208Total current 304,867 344,894
24 Property, plant and equipmentLandAt fair value (a) 19,217,000 18,830,000Accumulated impairment losses
19,217,000 18,830,000BuildingsAt fair value (a) 133,589,550 81,160,000Accumulated depreciationAccumulated impairment losses
133,589,550 81,160,000Motor vehicles, caravans and trailersAt cost 826,149 808,149Accumulated depreciation (460,953) (357,923)Accumulated impairment losses
365,196 450,226Plant, furniture and general equipmenAt cost 2,214,506 2,049,990Accumulated depreciation (1,083,320) (866,647)Accumulated impairment losses
1,131,186 1,183,343Computer equipment. communication networlAt cost 2,260,421 2,184,160Accumulated depreciation (1,585,475) (1,384,920)Accumulated impairment losses
674,946 799,240Marine craftAt cost 41,000 41,000Accumulated depreciation (25,810) (22,583)Accumulated impairment losses
15,190 18,417154,993,068 102,441,226
(a) Freehold land and buildings were revalued as at 01 July 2010 by the Western Australian Land Information Authority (Landgate). The valuations were performerduring the year ended 31 December 2010 and recognised at 31 December 2010. The fair value of all land and buildings was determined by reference to market values.See note 2(g) 'Property, plant and equipment'.
Reconciliations of the carrying amounts of property, plant and equipment at the beginning and end of the reportingperiod are set out below.
Buildings underMotor vehicles,
caravans and Plant, furniture and
Computerequipment,
communicationLand Buildings construction trailers general equipment network Marine craft Total
2010 $ $ $ $ $ $ $ $
Carrying amount at start of year 18,830,000 81,160,000 450,226 1,183,343 799,240 18,417 102,441,226Cost Adjustment 52,000 52,000Additions 204,858 76,262 281,119Disposals (22,343) (22,343)Revaluation increments 387,000 54,406,660 54,793,660Depreciation expense (2,029,110) (103,030) (227,811) (200,555) (3,226) (2,563,733)Depreciation Write Back on Disposal 11,138 11,138Carrying amount at end of year 19,217,000 133,589,550 347,196 1,149,185 674,946 15,191 154,993,068
Buildings underMotor vehicles,
caravans and Plant, furniture and
Computerequipment,
communicationLand Buildings construction trailers general equipment network Marine craft Total
2009 $ $ $ $ $ $ $ $
Carrying amount at start of year 22,380,000 90,960,000 14,097 167,869 1,041,098 765,559 21,643 115,350,266Additions 515,594 (14,097) 384,903 436,210 199,351 1,521,961Disposals (110,000) (53,712) (163,712)Revaluation (decrements) (3,550,000) (8,035,637) (11,585,637)Depreciation expense (2,279,957) (102,546) (239,413) (165,671) (3,226) (2,790,813)Depreciation on write back of disposal 55,449 53,713 109,162Carrying amount at end of year 18,830,000 81,160,000 450,226 1,183,343 799,240 18,417 102,441,226
25 Intangible assetsComputer softwareAt cost 365,221 365,221Accumulated amortisation (365,221) (365,221)
26 Impairment of assetsThere were no indications of impairment of property plant, equipment and intangibles as at 31 December 2010
The College held no goodwill or intangible assets with indefinite useful lifes during the reporting period and at the encof the reporting period there were no intangible assets not yet available for use.
All surplus assets as at 31 December 2010 have either been classified as assets held for sale or written off.
27 PayablesCurrentTrade payables 516 495GST payable -
Accrued expenses 551,790 479,015Accrued salaries and related costs 433,265 304,294Total current 985,571 783,804
See also note 2(q) 'Payables' and note 36 'Financial Instruments'.
39

PILBARA TAFENOTES TO THE FINANCIAL STATEMENTSFOR THE YEAR ENDED 31 DECEMBER 2010
2010 2009
28 BorrowingsCurrentBorrowings from WA Treasury Corporation 73,009 70,894Total current 73,009 70,894
Non-currentBorrowings from WA Treasury Corporatior 425,141 498,938Total non-current
(a) Lease liabilities are effectively secured as the rights to the leased assets revert to the lessor in the event of default.
425,141 498,938
29 ProvisionsCurrentEmployee benefits provisionAnnual leave (a) 1,412,201 1,393,063Long service leave (b) 1,054,576 636,690
2,466,777 2,029,753Other provisionsSuperannuation 195,810 167,197Employment On-Costs (payroll tax & workers compensation; 176,661 142,082
372,471 309,279Total current 2,839,248 2,339,032
Non-currentEmployee benefits provisionLong service leave (b) 503,758 758,869Salary deferment 58,269 22,145
562,027 781,014Other provisionsSuperannuation 31,737 47,809Employment On-Costs (payroll tax & workers compensation; 37,168 53,120
68,905 100,929Total non-current
(a) Annual leave liabilities have been classified as current as there is no unconditional right to defer settlementfor at least 12 months after the reporting period. Assessments indicate that actual settlement of the liabilitieswill occur as follow:
630,932 881,943
Within 12 months of the end of the reporting perk. 1,412,201 1,393,063
(b) Long service leave liabilities have been classified as current where there is no unconditional right to defersettlement for at least 12 months after the end of the reporting period. Assessments indicate that actual settlementof the liabilities will occur as follows:
1,412,201 1,393,063
Within 12 months of the end of the reporting perk. 146,946 359,213More than 12 months after the end of the reporting perim 1,624,537 1,221,955
(c) The settlement of annual and long service leave liabilities gives rise to the payment of employment on-costsincluding workers' compensation insurance. The provision is the present value of expected future payments. Theassociated expense, apart from the unwinding of the discount (finance cost), is disclosed in note 10 'Other Expenses'
1,771,483 1,581,168
Movements in other provisionsMovements in each class of provisions during the financial year, other than employee benefits, are set out below
Employment on-cost provisiorCarrying amount at start of year 195,203 137,076Additional provisions recognised 18,627 58,127Carrying amount at end of year 213,830 195,203
30 Other liabilitiesCurrentIncome received in advance (a) 11,781 3,931Grants and advances (DPA Clawback provision) 304,497 1,041,688Money/deposits held in trust 16,752 16,752Other 30,808 46,795Total current liabilities
(a) Income received in advance comprises:
363,838 1,109,166
Department of Training and Workforce Development (Invalid Enrolment: 304,497 868,529Other Government (Commonwealth/Local 173,159Student fees and charges 11,781 3,931
316,278 1,045,619
40

PILBARA TAFENOTES TO THE FINANCIAL STATEMENTSFOR THE YEAR ENDED 31 DECEMBER 2010
2010 2009
31 EquityEquity represents the residual interest in the net assets of the College. The Government holds the equity interestin the net assets of the College. The Government holds the equity interest in the College on behalf of the communityThe asset revaluation surplus represents that portion of equity resulting from the revaluation of non-current assets.
Contributed equityBalance at start of year 29,099,719 28,231,057
Contributions by ownersCapital appropriation (a) 528,068Transfer of net assets from other agencies (b) 340,594Total contributions by owners 868,662
Balance at end of year 29,099,719 29,099,719
(a) Treasurer's instruction TI 955 'Contributions by Owners Made to Wholly Owned Public Sector Entities' designates Capital Appropriations as contributions by ownersin accordance with AASB. Interpretation 1038 'Contributions by Owners Made to Wholly-Owned Public Sector Entities'
(b).AASB 1004 'Contributions', requires transfers of net assets as a result of a restructure of administrative arrangements are to be accounted for as contributionsby owners and distributions to owners.Where activities are transferred from one agency to another agency as a result of a restructure of administrativearrangements, AASB 1004 (paragraph 57) requires the transferee agency to disclose the expenses and income attributable to the transferred activities fmthe reporting period, showing separately those expenses and income recognised by the transferor agency during the reporting period. Furthennore, AASB 100,(paragraph 58) requires disclosures by class for each material transfer of assets and liabilities in relation to a restructure of administrative arrangements,together with the name of the countoparty transferor/transferee agency. In respect of transfers that are individually immaterial, the assets and liabilitiesare to be disclosed on an aggregate basis.
TI 955 designates non-discretionary and non-reciprocal transfers of net assets between state government agencies as contributions by owners in accordancewith AASB Interpretation 1038, where the transferee agency accounts for a non-discretionary and non-reciprocal transfer of net assets as a contribution by ownersand the transferor agency accounts for the transfer as a distribution to owners.
(c) TI 955 requires non-reciprocal transfers of net assets to Government to be accounted for as distribution to owners in accordance with AASB Interpretation 1038
ReservesAsset revaluation surplusBalance at start of year 71,214,547 82,768,349Other 54,793,660 (11,553,802)Balance at end of year 126,008,207 71,214,547
Other reservesBalance at start of year 191,606 191,606Balance at end of year 191,606 191,606
126,199,813 71,406,153
Accumulated surplus/(deficit)Balance at start of year 5,336,803 4,469,964Result for the period (47,957)Other Adjustments 9,407 866,839Balance at end of year 5,298,253 5,336,803
32 Notes to the Statement of Cash Flows
Reconciliation of cashCash at the end of the financial year, as shown in the Statement of Cash Flows is reconciled to the related items inthe Statement of Financial Position as follows.
Cash on hand 5,700 6,000Cash at bank 8,889,668 7,126,245
8,895,368 7,132,245Restricted cash and cash equivalents (refer to note 20 'Restricted cash and cash equivalents' (323,371) (2,063,945)
8,571,997 5,068,300
Reconciliation of net cost of services to net cash flows provided by/(used in) operating activities
Net cost of services (31,010,599) (28,478,104)
Non-cash items:Depreciation and amortisation expense 2,563,733 2,790,813Doubtful debts expense 5,245 10,030Superannuation expense 1,224,496 1,224,723Resources received free of charge 207,393 762,195Net (gain)/loss on sale of property, plant and equipment 3,767 54,551Losses and Write offs (excludes cash shortages / thefts of money) 20,439Non Cash Grant from DTWD 174,831
(Increase) /decrease in assets:Current receivables (c) (114,947) (298,910)Current inventories 33,773 13,452Prepayments 35,338 (23,649)Other Current Assets 4,689 14,866Increase/(decrease) in liabilitiesCurrent payables (c) 201,767 (100,709)Current borrowings 2,115 2,049Current provisions 500,215 856,109Other current liabilities (745,328) (1,123,520)Non-current borrowings (73,797) (71,657)Non-current provisions (251,011) 23,368Other non-current liabilitiesNet GST receipts/(payments) (a) 289,143 86,167Change in GST in receivables/payables (b) (32,956) 129,374Net cash provided by/(used in) operating activities (26,961,694) (24,128,853)
(a) This is the net GST paid/received, i.e. cash transactions(b) This reverses out the GST in receivables and payables(c) Note that the Australian Taxation Office (ATO) receivable/payable in respect of GST and the receivable/payable
in respect of the sale/purchase of non - current assets are not included as they are not reconciling items.
At the end of the reporting period, the Authority had fully drawn on all financing facilities, details of which are disclosed in the financial statements
41
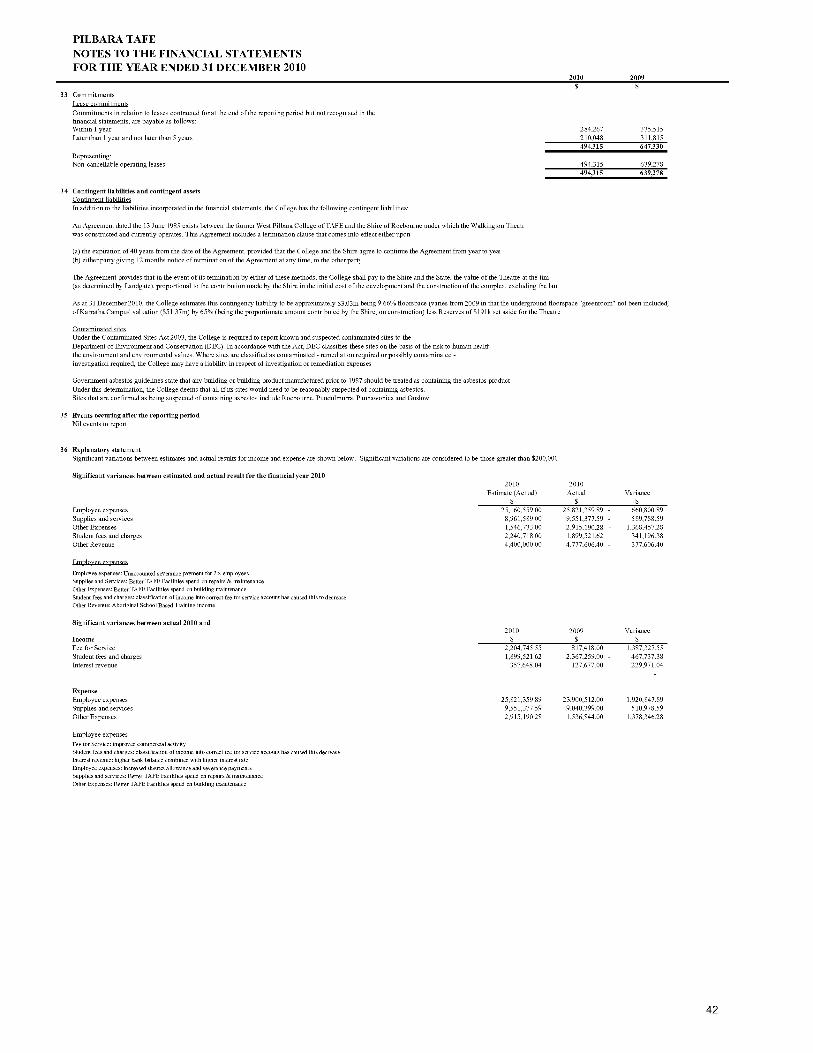
PILBARA TAFENOTES TO THE FINANCIAL STATEMENTSFOR THE YEAR ENDED 31 DECEMBER 2010
2010 2009
33 CommitmentsLease commitmentsCommitments in relation to leases contracted for at the end of the reporting period but not recognised in thefinancial statements, are payable as follows:Within 1 yearLater than 1 year and not later than 5 years
Representing:Non-cancellable operating leases
34 Contingent liabilities and contingent assetsContingent liabilitiesIn addition to the liabilities incorporated in the financial statements, the College has the following contingent liabilities:
An Agreement dated the 13 June 1985 exists between the former West Pilbara College of TAFE and the Shire of Roebourne under which the Walkington Theattwas constructed and currently operates. This Agreement includes a termination clause that comes into effect either upon
(a) the expiration of 40 years from the date of the Agreement, provided that the College and the Shire agree to continue the Agreement fromyear to yew(b) either party giving 12 months notice of tennination of the Agreement at any time, to the other part)
The Agreement provides that in the event of its termination by either of these methods, the College shall pay to the Shire and the State,the value of the Theatre at the time(as determined by Landgate), proportional to the contribution made by the Shire in the initial cost of the development and the construction of the complex,excluding the lan
284,267210,048
335,515311,815
494,315 647,330
494,315 639,278494,315 639,278
As at 31 December 2010, the College estimates this contingency liability to be approximately $3.03m being 9.66% floorspace (varies from 2009 in that the underground floorspace "greenroom" not been included;of Karratha Campus' valuation ($51.37m) by 65% (being the proportionate amount contributed by the Shire, on construction) less Reserves of $191k set aside for theTheatre
Contaminated sitesUnder the Contaminated Sites Act 2003, the College is required to report known and suspected contaminated sites to theDepartment of Environment and Conservation (DEC). In accordance with the Act, DEC classifies these sites on the basis of the risk to human healtlthe environment and environmental values. Where sites are classified as contaminated - remediation required or possibly contaminated -investigation required, the College may have a liability in respect of investigation or remediation expenses
Government asbestos guidelines state that any building or building product manufactured prior to 1987 should be treated as containing the asbestos productUnder this determination, the College deems that all if its sites would need to be reasonably suspected of containing asbestos.Sites that are confirmed as being suspected of containing asbestos include Roebourne, Punduhnurra, Pannawonica and Onslow
35 Events occuring after the reporting periodNil events to report
36 Explanatory statementSignificant variations between estimates and actual results for income and expense are shown below. Significant variations are considered to be those greater than $200,000
Significant variances between estimated and actual result for the financial year 20102010
Estimate (Actual)2010
Actual Variance
Employee expenses 25,160,559.00 25,821,359.89 - 660,800.89Supplies and services 8,961,589.00 9,551,377.59 - 589,788.59Other Expenses 1,546,733.00 2,915,190.28 - 1,368,457.28Student fees and charges 2,240,718.00 1,899,521.62 341,196.38Other Revenue 4,400,000.00 4,777,606.40 - 377,606.40
Employee expenses
Employee expenses: Unaccounted severance payment for 2 x employeesSupplies and Services: Better TAFE Facilities spend on repairs & maintenanceOther Expenses: Better TAFE Facilities spend on building maintenanceStudent fees and charges: classification of income into correct fee for service account has caused this to decreaseOther Revenue: Aboriginal School Based Training income
Significant variances between actual 2010 and2010 2009 Variance
Income $ $ $
Fee for Service 2,204,745.55 817,418.00 1,387,327.55Student fees and charges 1,899,521.62 2,367,259.00 - 467,737.38Interest revenue 357,648.04 127,677.00 229,971.04
ExpenseEmployee expenses 25,821,359.89 23,900,512.00 1,920,847.89Supplies and services 9,551,377.59 9,040,399.00 510,978.59Other Expenses 2,915,190.28 1,536,844.00 1,378,346.28
Employee expensesFee for Service: improved commercial activityStudent fees and charges: classification of income into correct fee for service account has caused this decreaseInterest revenue: higher bank balance combined with higher interest rateEmployee expenses: increased district allowance and severance paymentsSupplies and services: Better TAFE Facilities spend on repairs & maintenanceOther Expenses: Better TAFE Facilities spend on building maintenance
42
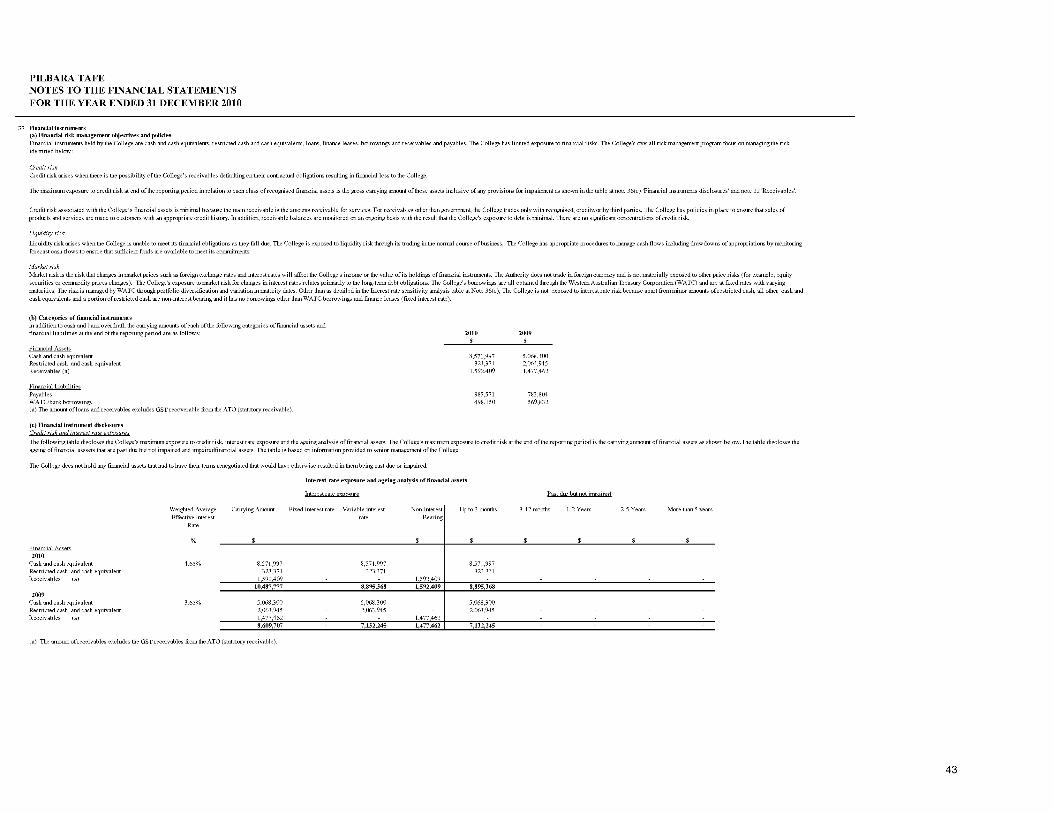
PILBARA TAFENOTES TO THE FINANCIAL STATEMENTSFOR THE YEAR ENDED 31 DECEMBER 2010
37 Financial instminents(a) Financial risk management objectives and policiesFinancial instruments held by the College are cash and cash equivalents, restricted cash and cash equivalents, loans, finance leases, borrowings and receivables and payables. The College has limited exposure to financial risks. The College's overall risk management program focus on managing the riskidentified below:
Credit riskCredit risk arises when there is the possibility of the College's receivables defaulting on their contactual obligations resulting in financial loss to the College.
The maximum exposure to credit risk at end of the reporting period in relation to each class of recognised financial assets is the gross carrying amount of those assets inclusive of any provisions for impairment as shown in the table at note 36(c) 'Financial instruments disclosures' and note 22 'Receivables'.
Credit risk associated with the College's financial assets is minimal because the main receivable is the amounts receivable for services. For receivables other than government,the College trades only with recognised, creditworthy third parties. The College has policies in place to ensure that sales ofproducts and services are made to customers with an appropriate credit history. In addition, receivable balances are monitored on an ongoing basis with the result that the College's exposure to debt is minimal. There are no significant concentrations of credit risk
Liquidity risk
Liquidity risk arises when the College is unable to meet its financial obligations as they fall due. The College is exposed to liquidity risk through its trading in the normal course of business. The College has appropriate procedures to manage cash flows including drawdowns of appropriations by monitoringforecast cash flows to ensure that sufficient funds are available to meet its commitments.
Market riskMarket risk is the risk that changes in market prices such as foreign exchange rates and interest rates will affect the College's income or the value of its holdings of financial instruments. The Authority does not trade in foreign currency and is not materially exposed to other price risks (for example, equitysecurities or commodity prices changes). The College's exposure to market risk for changes in interest rates relates primarily to the long-term debt obligations. The College's borrowings are all obtained through the Western Australian Treasury Corporation (WATC) and are at fixed rates with varyingmaturities. The risk is managed by WATC through portfolio diversification and variation in maturity dates. Other than as detailed in the Interest rate sensitivity analysis table at Note 36(c), The College is not exposed to interest rate risk because apart from minor amounts of restricted cash, all other cash andcash equivalents and a portion of restricted cash are non-interest bearing and it has no borrowings other than WATC borrowings and finance leases (fixed interest rate).
(b) Categories of financial instminentsIn addition to cash and bank overdraft, the carrying amounts of each of the following categories of financial assets andfinancial liabilities at the end of the reporting period are as follows: 2010 2009
Financial AssetsCash and cash equivalent 8,571,997 5,068,300Restricted cash and cash equivalent 323,371 2,063,945Receivables (a) 1,592,409 1,477,462
Financial LiabilitiesPayables 985,571 783,804WATC/bank borrowings(a) The amount of loans and receivables excludes GST recoverable from the ATO (statutory receivable).
498,150 569,832
() Financial instminent disclosuresCredit risk and interest rate exposures
The following table discloses the College's m.imurn exposure to credit risk, interest rate exposure and the ageing analysis of financial assets. The College's m.imurn exposure to credit risk at the end of the reporting period is the carrying anmount of financial assets as shown below.The table discloses theageing of financial asssets that are past due but not impaired and impairedfinancial assets. The table is based on information provided to senior management of the College.
The College does not hold any financial assets that had to have their tems renegotiated that would have otherwise resulted in them being past due or impaired.
Interest rate exposure and ageing analysis of financial assets
Interest rate exposure Past due but not impaired
Financial Assets
Weighted AverageEffective Interest
Rate
Carrying Amount Fixed interest rate Variable interestrate
Non-InterestBearing
Up to 3 months 3-12 months 1-2 Years 2-5 Years More than 5 years
2010Cash and cash equivalent 4.65% 8,571,997 8,571,997Restricted cash and cash equivalent 3 323,371 323,371Receivables (a) 1,592,409
10,487,777 8,895,368 1,592,409 8,895,3682009
Cash and cash equivalent 3.65% 5,06 .' :00 5,068,300 5,068,300Restricted cash and cash equivalent 2,06,.) 2,063,945 2,063,945Receivables () 1,477,462 1,477,462
8,609,707 7,132,245 1,477,462 7,132,245
(a) The amount of receivables excludes the GST receivables from the ATO (statutory receivable).
43
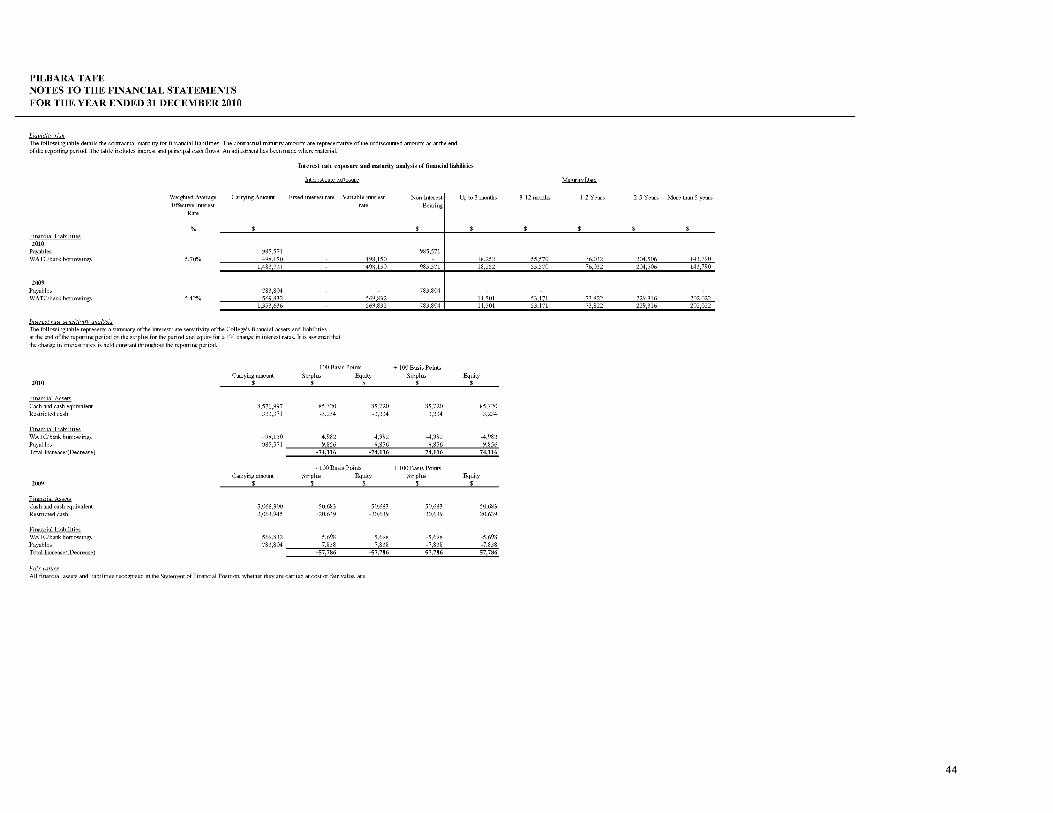
PILBARA TAFENOTES TO THE FINANCIAL STATEMENTSFOR THE YEAR ENDED 31 DECEMBER 2010
Liquidity riskThe following table details the contactual maturity for financial liabilities. The contactual maturity amounts are representative of the undiscounted amounts as at the endof the reporting period. The table includes interest and principal cash flows. An adjustment has been made where material.
Interest rate exposure and maturity analysis of financial liabilities
Interest rate exposure MattritvDate
Financial Liabilities
Weighted AverageEffective Interest
Rate
%a
Carrying Amount Fixed interest rate Variable interestrate
Non-InterestBearing
Up to 3 months 3-12 months 1-2 Years 2-5 Years More than 5 years
2010Payables 985,571 985,571WATC/bank borrowings 5.70% 498,150 498,150 18,252 55,570 76,032 204,506 143,790
1,483,721 498,150 985,571 18,252 55,570 76,032 204,506 143,790
2009Payables 783,804 783,804WATC/bank borrowings 5.42% 569,832 569,832 11,501 53,171 73,822 229,316 202,022
1,353,636 569,832 783,804 11,501 53,171 73,822 229,316 202,022
Interest rate sensitivity analysisThe following table represents a summary of the interest rate sensitivity of the College's financial assets and liabilitiesat the end of the reporting period on the surplus for the period and equity for a 1% change in interest rates. h is assumed thatthe change in interest rates is held constant tluoughout the reporting period.
2010
Financial Assets
Carrying amount-100 Basis Points
Surplus Equity+ 100 Basis Points
Surplus Fluty
Cash and cash equivalent 8,571,997 -85,720 -85,720 85,720 85,720Restricted cash 323,371 -3,234 -3,234 3,234 3,234
Financial LiabilitiesWATC/bank borrowings 498,150 4,982 4,982 -4,982 -4,982Payables 985,571 9,856 9,856 -9,856 -9,856Total Increase/(Decrease) -74,116 -74,116 74,116 74,116
2009
Financial Assets
Carrying amount-100 Basis Points
Surplus Equity+ 100 Basis Points
Surplus Equity
Cash and cash equivalent 5,068,300 -50,683 -50,683 50,683 50,683Restricted cash 2,063,945 -20,639 -20,639 20,639 20,639
Financial LiabilitiesWATC/bank borrowings 569,832 5,698 5,698 -5,698 -5,698Payables 783,804 7,838 7,838 -7,838 -7,838Total Increase/(Decrease) -57,786 -57,786 57,786 57,786
Fair valuesAll financial assets and liabilities recognised in the Statement of Financial Position, whether they are carried at cost or fair value, are
44

PILBARA TAFENOTES TO THE FINANCIAL STATEMENTSFOR THE YEAR ENDED 31 DECEMBER 2010
2010 2009
38 Remuneration of members of the College and senior officersRemuneration of members of the CollegeThe number of members of the College whose total of fees, salaries, superannuation, non-monetarybenefits and other benefits for the financial year, fall within the following bands are:
$0 - $50,000$120,001 -$130,000 0
$130,001 - $140,000 0 *1The total remuneration of the members of the College is: $187,158 $182,061
*Includes senior officers where periods of service are less than twelve months.
Total remuneration includes the superannuation expense incurred by the College in respect of members of the College
Remuneration of senior officersThe number of senior officers other than senior officers reported as members of the College, whose total of fees,salaries, superannuation, non-monetary benefits and other benefits for the financial year, fall within the followingbands are:
$0 - $50,000 0 2$50,001 - $60,000 0 0
$60,001 - $70,000 1 0
$70,001 - $80,000 1 0
$80,001 - $90,000 1 0
$90,001 - $100,000 1 1
$100,001 - $110,000 1 8
$110,001 -$120,000 2 4$120,001 -$130,000 4 2$130,001 - $140,000 1 0
$140,000-1 3 1
The total remuneration of senior officers is:
The total remuneration includes the superannuation expense incurred by the College in respect of senior officers othethan senior officers reported as members of the College.
No senior officers are members of the Pension Scheme.
39 Remuneration of auditorRemuneration payable to the Auditor General in respect to the audit for the current financial year is as follows:
Auditing the accounts, financial statements and performance indicatorThe expense is included in note 10 'Other Expenses'.
40 Supplementary financial informatior.Write-OffsInventory
$2,144,890 $1,855,842
52,000 48,500
20,439
Losses through theft, defaults and other causesLosses of public and other moneys and public and other property through theft, default or otherwise 311
41 Schedule of income and expenditure by serviceThe college provides only one service (as defined by Treasurer's Instruction 1101 (9) and that is Vocational Education and Training Delivery.
45
PILBARA TAFE
KEY PERFORMANCE INDICATORSFOR THE YEAR ENDED
31 December 2010
We hereby certify that the performance indicators are based on proper records,
are relevant and appropriate for assisting users to assess the Pilbara TAFE's perfomamce,
and faily represent the performance of the Pilbara TAFE for the
financial year ended 31 December 2010
8.3Chairperson of Governing Council Dated
3°//Managing Director Dated
(Member of Governing Council)
Chief Finance Officer
5 (3/ zooDated
46

Detailed Key Performance Indicators Information
Detailed Key Performance Indicators Information
KEY PERFORMANCE INDICATORS
DESIRED OUTCOMESThe provision of vocational education and training services to meet the community andindustry training needs.
EFFECTIVENESS INDICATORSThe effectiveness indicators measure the achievement of vocational education and training inmeeting community and industry needs via student and graduate satisfaction, labour forcestatus of graduates and profile achievement.
STUDENT SATISFACTION SURVEY
The 2010 Student Satisfaction Survey was administered on the behalf of the Department ofTraining and Workforce Development by Pattersons Market Research. The key focus was toattain an understanding of students' training requirements and to measure the quality of thedelivery of training and services provided by Pilbara TAFE. The survey was distributed viadirect mail to a random sample of students who had undertaken training, either in the first orsecond semester of the corresponding reference period. The option to complete the surveyon-line or via the use of computer assisted telephone interviewing was also provided.
STUDENT SATISFACTION RATING: EFFECTIVENESS INDICATOR
The overall student satisfaction rating expresses the number of 'satisfied' and 'very satisfied'respondents. The results provide an overall expression of how satisfied students are withvarious services provided by the College.
Table 12006 2007 2008 2009 2010
targets2010
PilbaraTAFE
84% 79% 86% 91% >85% 86.7%
WesternAustralia
86% 87% 85% 85.6% No data 86.7%
Source: (1) Department of Education and Training, TAFEWA Student Satisfaction Survey.Of the 1,869 population, where 1,054 individuals were contacted, 328 useable surveys were returned, representing a response rateof 31%. The overall student satisfaction rate for 2010 was 86.7% with a relative standard error of 1.71% at a +/-3.3% confidencelevel.
STUDENT OUTCOMES SURVEY
The Student Outcomes Survey is conducted on the behalf of National Centre for VocationalEducation Research (NCVER) by I-view Pty Ltd every two years. The aim of the survey is tomeasure vocational education and training students' employment, further study and theopinions of the training undertaken. Every two years, questionnaires are sent to a stratified(field of education, sex and age), randomly selected sample of Pilbara TAFE graduates, who havesuccessfully completed a qualification in the previous reporting period.
The graduate achievement is a key performance indicator that measures the extent to whichPilbara TAFE Graduates have wholly or partly achieved their main reason for undertaking the
47
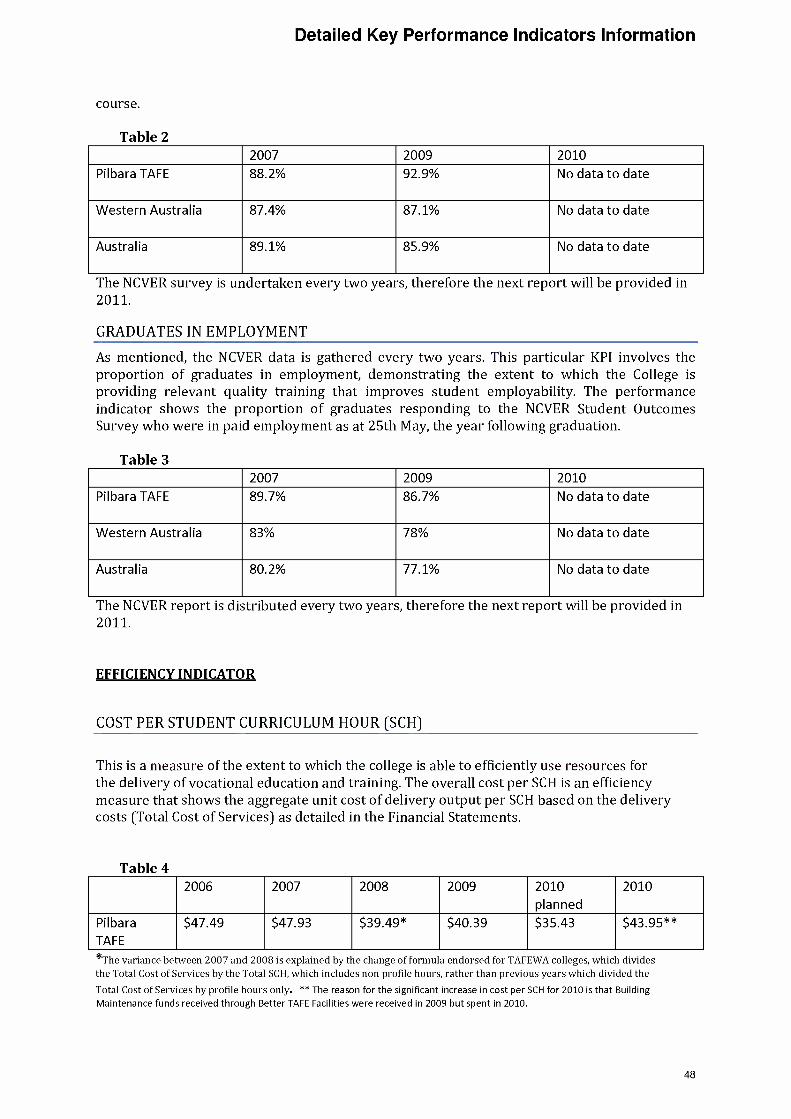
Detailed Key Performance Indicators Information
course.
Table 22007 2009 2010
Pilbara TAFE 88.2% 92.9% No data to date
Western Australia 87.4% 87.1% No data to date
Australia 89.1% 85.9% No data to date
The NCVER survey is undertaken every two years, therefore the next report will be provided in2011.
GRADUATES IN EMPLOYMENT
As mentioned, the NCVER data is gathered every two years. This particular KPI involves theproportion of graduates in employment, demonstrating the extent to which the College isproviding relevant quality training that improves student employability. The performanceindicator shows the proportion of graduates responding to the NCVER Student OutcomesSurvey who were in paid employment as at 25th May, the year following graduation.
Table 32007 2009 2010
Pilbara TAFE 89.7% 86.7% No data to date
Western Australia 83% 78% No data to date
Australia 80.2% 77.1% No data to date
The NCVER report is distributed every two years, therefore the next report will be provided in2011.
EFFICIENCY INDICATOR
COST PER STUDENT CURRICULUM HOUR (SCH)
This is a measure of the extent to which the college is able to efficiently use resources forthe delivery of vocational education and training. The overall cost per SCH is an efficiencymeasure that shows the aggregate unit cost of delivery output per SCH based on the deliverycosts (Total Cost of Services) as detailed in the Financial Statements.
Table 42006 2007 2008 2009 2010
planned2010
Pilbara $47.49 $47.93 $39.49* $40.39 $35.43 $43.95**TAFE*The variance between 2007 and 2008 is explained by the change of formula endorsed for TAFEWA colleges, which dividesthe Total Cost of Services by the Total SCH, which includes non profile hours, rather than previous years which divided the
Total Cost of Services by profile hours only. ** The reason for the significant increase in cost per SCH for 2010 is that BuildingMaintenance funds received through Better TAFE Facilities were received in 2009 but spent in 2010.
48
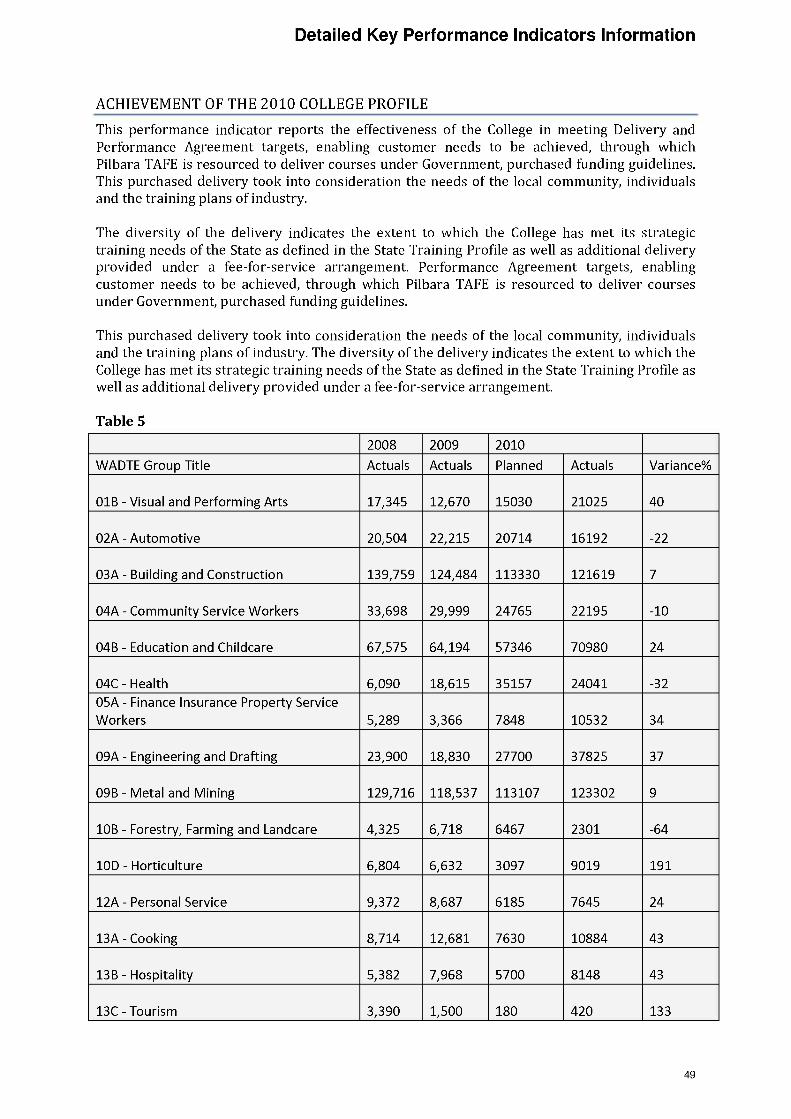
Detailed Key Performance Indicators Information
ACHIEVEMENT OF THE 2010 COLLEGE PROFILE
This performance indicator reports the effectiveness of the College in meeting Delivery andPerformance Agreement targets, enabling customer needs to be achieved, through whichPilbara TAFE is resourced to deliver courses under Government, purchased funding guidelines.This purchased delivery took into consideration the needs of the local community, individualsand the training plans of industry.
The diversity of the delivery indicates the extent to which the College has met its strategictraining needs of the State as defined in the State Training Profile as well as additional deliveryprovided under a fee-for-service arrangement. Performance Agreement targets, enablingcustomer needs to be achieved, through which Pilbara TAFE is resourced to deliver coursesunder Government, purchased funding guidelines.
This purchased delivery took into consideration the needs of the local community, individualsand the training plans of industry. The diversity of the delivery indicates the extent to which theCollege has met its strategic training needs of the State as defined in the State Training Profile aswell as additional delivery provided under a fee-for-service arrangement.
Table 5
2008 2009 2010
WADTE Group Title Actuals Actuals Planned Actuals Variance%
01B Visual and Performing Arts 17,345 12,670 15030 21025 40
02A Automotive 20,504 22,215 20714 16192 -22
03A Building and Construction 139,759 124,484 113330 121619 7
04A Community Service Workers 33,698 29,999 24765 22195 -10
04B Education and Childcare 67,575 64,194 57346 70980 24
04C Health 6,090 18,615 35157 24041 -32
05A Finance Insurance Property ServiceWorkers 5,289 3,366 7848 10532 34
09A Engineering and Drafting 23,900 18,830 27700 37825 37
09B Metal and Mining 129,716 118,537 113107 123302 9
10B Forestry, Farming and Landcare 4,325 6,718 6467 2301 -64
10D Horticulture 6,804 6,632 3097 9019 191
12A Personal Service 9,372 8,687 6185 7645 24
13A Cooking 8,714 12,681 7630 10884 43
13B Hospitality 5,382 7,968 5700 8148 43
13C Tourism 3,390 1,500 180 420 133
49

Detailed Key Performance Indicators Information
14A Transport Trades, Storage andAssociated 9,440 13,468 14345 13010 -9
15B Electrical Trades 45,727 35,364 32127 35410 10
16A Accounting and Other BusinessServices 13,890 11,830 24690 23635 -4
16B Management 37,230 28,000 34500 36180 5
16C Office and Clerical 50,295 56,135 65565 50030 -24
17A Computing 8,780 3,350 2200 740 -66
18A Science and Technical Workers 19,718 18,980 40600 27290 -33
19B Adult Literacy/ESL 31,515 43,360 29980 34525 15
19E Targeted Access and ParticipationCourses 26,585 29,404 42880 44513 4
Total Profile Delivery 725,043 696,987 731,143 7514613
Non Profile Delivery 175,168 229,013 180,234
College Total Delivery 900,211 926,000 931,695Targets have been adjusted and revised throughout the year. Current targets are based on the 3rd addendum to theDPA for 2010
Profile Analysis for Pilbara TAFE
Definition: The table indicates the quota and actual achievement of SCH in the profiledDepartment of Education and Training Industry Group categories. The classification of theseIndustry Groups is based on the occupation or outcome the course is intended to serve, andhighlights the College's performance in achieving industry delivery targets.
Derivation: DPA data represents the actual achievement of SCH in respective years. Planneddata is obtained from the DPA, and actual SCH from the College Unified Enrolments System(UE)). Non-profile delivery SCH is the actual SCH count of enrolments not funded under theDPA in UE. These are Fee-For-Service programs that are delivered to meet local industry andcommunity demands for specialised training.
Variances in delivery by more than 10% are explained by the following reasons:
1. Staff resignations due to buoyant employment conditions in the Pilbara. (WADTEGroups 2A ,4A,4C, 16C, 18A and 10B)
50

Detailed Key Performance Indicators Information
2. Demand less than expected (WADTE Groups 2A, 4A, 10B, 10D, 13B, 16A/B/C and 18A)
3. Demand greater than expected due to emerging markets (WADTE Groups 1B, 4B, SA, 9A, 10D,12A, 13A, 13B, 19B)
4. Poor planning by the College (10D)
S. Staff illness (17A,)
Planning for delivery continues to be a challenge in the Pilbara due to the strong economicdrivers and constantly changing market demands.
PROFILE ACHIEVEMENT (DPA) of 2010 PROFILE, PLANNED vs ACHIEVED SCH
This performance indicator shows the percentage of student curriculum hours (SCH)achieved for activities as contracted with the Department of Training and WorkforceDevelopment for vocational education and training delivery through the Delivery andPerformance Agreement.
Table 6
Profile Achievement = Actual Delivery and Performance Agreement SCH Achieved/Target SCHcontained within Delivery and Performance Agreement
Planned Actual %Achieved
2006 773,237 736,043 95%
2007 791,860 686991 87%
2008 782,680 725043 93%
2009 730,910 696,987 95%
2010 731,143 751,461 103%Targets have been adjusted and revised throughout the year. Current targets are based on the 3rd addendum to theDPA for 2010
Source: Pilbara TAFE Delivery and Performance Agreement (prior to any addenda) for plannedSCH and College Management Information System for Actual SCH
Note 1: Data previous to 2007 for Actual Profile (SCH) represents commencements, due to changes in reporting procedures ActualProfile )SCH) from 2007 signifies end of study. The significance of the change has been to move from recording student data from thedate they commence to recording the data to date students' study is completed. The overall shift in total value in SCH between the twomethods is minimal.
51