pik-20d wing spar web bonding - etusivu | traficom
TRANSCRIPT
PIK-20D Wing Spar Web Bonding Erkki Soinne
Traficom Research Reports
26/2019
Traficom Research Reports 26/2019
1
Date of publication
November 15th
2019
Title of publication
PIK-20D Wing Spar Web Bonding
Author(s)
Erkki Soinne
Commissioned by, date
Publication series and number
Traficom Research Reports 26/2019
ISSN (online) 2669-8781
ISBN (online) 978-952-311-358-9
URN http://urn.fi/URN:ISBN: 978-952-311-358-9
Keywords
Sailplane, composites, dimensioning, fatigue
Abstract
This document studies the bonding of the wing spar web of the PIK-20D sailplane. Analytical expressions for the shear
stress and strain distributions in the bonding adhesive are derived in the elastic range. Corrective formulas for the
corrections of the shear stress and strain distributions are derived due to plasticity. Effects of web vertical compression
on bonding line shear combined loading are investigated. Estimations of the bonding fatigue characteristics are made
based on past fatigue tests. The effects of various factors on the bonding adhesive shear stress and strain distributions
and fatigue are discussed.
Contact person
Erkki Soinne Language
English
Confidence status
Public
Pages, total
44
Distributed by Published by Traficom
Traficom Research Reports 26/2019
2
FOREWORD
This report is focused on the wing spar web bonding shear stresses and strains on
the PIK-20D sailplane, which are important factors in the dimensioning of a
composite wing structure. The impact of starting this investigation was received
when publishing the Benalla OSTIV Congress paper “PIK-20D Glider Fatigue
Review” in Technical Soaring. The present report is a complementary analysis to
the Trafi Research Report 7/2015 "PIK-20D Fatigue Evaluation”.
Helsinki, 15.11.2019
Erkki Soinne
Chief Adviser, Aeronautics
Finnish Transport and Communications Agency Traficom
Traficom Research Reports 26/2019
3
Table of Contents
Nomenclature …………………………………………………………………..………………………….....4
1 Introduction ......................................................................................................... 5
2 Lap joint in edgewise shear .................................................................................. 7
2.1 Elastic distributions ...................................................................................... 7
2.2 Effects of plasticity ..................................................................................... 10
3 Wing spar web distributions ............................................................................... 13
3.1 Web bonding configuration .......................................................................... 13
3.2 Measured shear strains ............................................................................... 15
3.3 Bonding adhesive elastic distributions .......................................................... 19
3.4 Adhesive elastic–plastic model..................................................................... 24
3.5 Bonding adhesive plastic distributions .......................................................... 26
3.6 Vertical compression loads .......................................................................... 28
4 Bonding adhesive dimensioning ......................................................................... 31
4.1 Static dimensioning .................................................................................... 31
4.2 Fatigue ..................................................................................................... 32
5 Diverse effects .................................................................................................... 37
6 Conclusions ........................................................................................................ 42
References ................................................................................................................. 43

Traficom Research Reports 26/2019
4
Nomenclature
b distance
c width of plastic zone
C1, C2 integration constants
D1, D2 integration constants
G adhesive shear modulus
G1 adherend 1 shear modulus
G2 adherend 2 shear modulus
h structural height
l lap joint bonding adhesive width; width
M bending moment
n load factor; redundancy factor
py spanwise load intensity
P point load
Py spar load
pz vertical load intensity
Pz vertical load
q shear flow intensity
q1 adherend 1 shear flow intensity
q2 adherend 2 shear flow intensity
t adhesive thickness
t1 adherend 1 thickness
t2 adherend 2 thickness
v displacement
v1 adherend 1 displacement
v2 adherend 2 displacement
x Cartesian coordinate
β angle
γ shear strain
γe elastic shear strain
γp plastic shear strain
γu ultimate shear strain
ε strain
εu ultimate strain
λ parameter
ξ Cartesian coordinate
σ stress
σu ultimate strength
τ shear stress τav average shear stress
τe elastic shear stress τILSS allowable inter laminar shear stress
τkl,Br ultimate bonding shear stress
τp plastic shear stress
τu ultimate shear strength

Traficom Research Reports 26/2019
5
1 Introduction
The airworthiness requirements for sailplanes, such as the OSTIV requirements
ref. [1] used for the original certification of the PIK-20 sailplane, have traditionally
not required fatigue analysis for composite structures. The same version of the
OSTIV requirements was used for the certification of PIK-20D. The powered
sailplane PIK-20E was certified to meet the OSTIV Airworthiness Requirements for
Sailplanes, September 1976, Utility Category, Powered Sailplanes and the
German Airworthiness Requirements, Lufttüchtigkeitsforderungen für
Segelflugzeuge und Motorsegler (LFSM), October 1975, Utility Category, Powered
Sailplanes.
In the 1980s the German airworthiness authority, Luftfahrt Bundesamt, developed
preliminary instructions for the fatigue testing of sailplanes, such as those in ref.
[2]. However, the certification of PIK-20 series sailplanes and powered sailplanes
was done in the 1970s without a requirement of fatigue analysis. Consequently
there is no lifetime prescribed in the airplane flight or service manuals. The
present European airworthiness requirements for sailplanes (CS-22 ref. [3]) do
not require fatigue analysis or testing. Paragraph CS 22.627 only says that: “The
structure must be designed, as far as practicable, to avoid points of stress
concentration where variable stresses above the fatigue limit are likely to occur in
normal service.” This is the same phrasing as in the past OSTIV requirements.
On commercial and military aircraft there are requirements of damage tolerance
to tolerate Barely Visible Impact Damage BVID, for example of dropping tools on
the wing surface. Sailplane wing spar is protected inside the wing and most of the
skin structures on the wing and fuselage are buckling critical tolerating large
damage. For sailplanes there is no requirement for damage tolerance analysis. As
fatigue and damage tolerance calculations are not required for sailplanes, the
philosophy of dimensioning bonding lines has been to use low allowables in static
dimensioning. This does not warrant too sophisticated analysis methods, such as
FEM calculations, in the analysis. Analytical methods have the advantage of giving
an understanding about the entire physical problem, whereas numerical methods
only give a numerical result. An example of this is presented in the Hitchhikers
Guide to the Galaxy (ref. [4]), in which the enormous supercomputer Deep
Thought gave the answer “42” to the Ultimate Question of Life, the Universe, and
Everything after a computation time of 7,5 million years. Numerical methods are
useful in complicated detail studies, but as Andrei Tupolev formulated it “Do only
what is necessary”.
The wing spar web bonding has traditionally been treated on composite sailplanes
by using low average values for the bonding adhesive shear stress and the
bonding has been considered as lightly loaded. For example in the fatigue testing,
made for the fatigue life extension of sailplanes (ref. [5]), only the stub wing spar
was simulated in the test, not the wing spar web bonding on the other side of the
root rib. Recently a question was raised about the bonding line fatigue in the
connection of the publication of the Benalla OSTIV Congress paper on “PIK-20D
Glider Fatigue Review”. That paper does not include the bonding line fatigue as
there is no fatigue data on the bonding adhesive. The present report intends to
investigate the bonding adhesive shear stress and strain more in detail and to
give an indication of the bonding line fatigue based on comparisons on full scale
fatigue tests.
The elastic stress and strain distributions in a lap joint have been studied in the
past by Volkersen ref. [6], Hart-Smith ref. [7] and Eppler ref. [8]. The analytical
elastic shear stress distribution is of cosh type with the highest stresses and
strains at the ends of the adhesive. Often the adhesive yield stress is reached at
ultimate load. Hart-Smith has studied the effect of plasticity on the stress and
strain distributions. He has also investigated the bonding adhesive fatigue, see
ref. [9]. In the present report the analytical equations for an edgewise shear
Traficom Research Reports 26/2019
6
loaded lap joint are derived. The elastic and plastic shear stress and strain
distributions are calculated for the critical section of thePIK-20D wing spar web.
Effects of combined loading including web compression due to wing bending are
treated. Estimation of web bonding fatigue is based on comparison data on full
scale fatigue tests.

Traficom Research Reports 26/2019
7
2 Lap joint in edgewise shear
2.1 Elastic distributions
The spar web lap joint is primarily loaded in the bonding line (tangential) direction
by an edgewise shear loading. The analytic solution equations for the elastic case
are derived here following the references by Hart-Smith [7] and Eppler [8]. Study
a lap joint shown in Figure 1. q is a shear flow intensity [N/mm] acting on the lap
joint adherends. Force balance on an element on adherend 1 gives
q� + ����� dx − q� − τdx = 0 (1)
����� − τ = 0 (2)
where τ is the local adhesive shear stress, which is assumed to be constant in the
thickness direction. Similarly
q� + ����� dx − q� + τdx = 0 (3)
����� + τ = 0 (4)
The shear strains in the adherends are
γ� = ����� = �� ��⁄
�� (5)
γ� = ����� = �� ��⁄
�� (6)
Figure 1. Lap joint notation.
t1, G1
t2, G2
t, G
q q
q q+(dq/dx)dx
dx dv
l
x
Traficom Research Reports 26/2019
8
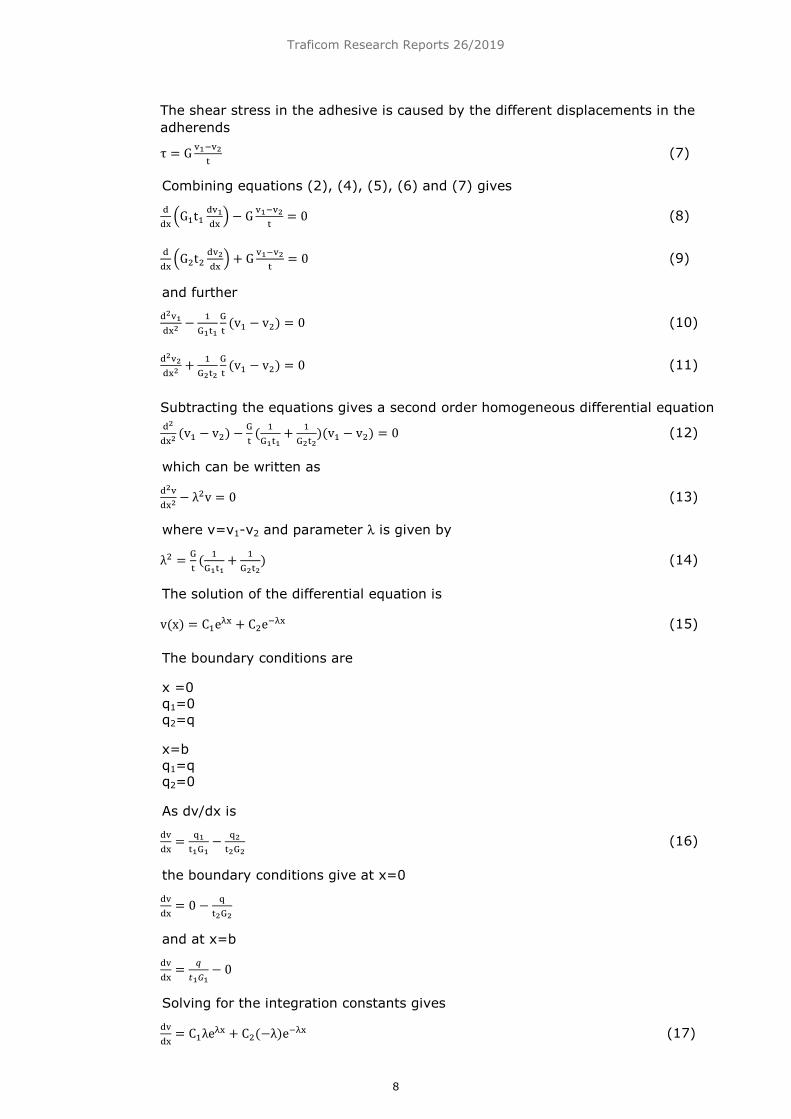
The shear stress in the adhesive is caused by the different displacements in the
adherends τ = G �����
� (7)
Combining equations (2), (4), (5), (6) and (7) gives
��� �G�t� ���
�� � − G ������ = 0 (8)
��� �G�t� ���
�� � + G ������ = 0 (9)
and further
������� − �
������ (v� − v�) = 0 (10)
������� + �
������ (v� − v�) = 0 (11)
Subtracting the equations gives a second order homogeneous differential equation
����� (v� − v�) − �
� ( ����� + �
����)(v� − v�) = 0 (12)
which can be written as
������ − λ�v = 0 (13)
where v=v1-v2 and parameter λ is given by
λ� = �� ( �
���� + �����) (14)
The solution of the differential equation is
v(x) = C�e!� + C�e�!� (15)
The boundary conditions are
x =0
q1=0
q2=q
x=b
q1=q
q2=0
As dv/dx is
���� = ��
���� − ������ (16)
the boundary conditions give at x=0
���� = 0 − �
����
and at x=b
���� = "
#�$� − 0
Solving for the integration constants gives
���� = C�λe!� + C�(−λ)e�!� (17)
Traficom Research Reports 26/2019
9
C�λe% + C�(−λ)e% = − qt�G�
C�λe!& + C�(−λ)e�!& = qt�G�
yielding
C� = �!'()*�(+)*, - �
��$� + .+)*��$�/ (18)
C� = �!'()*�(+)*, - �
���� + ()*����/ (19)
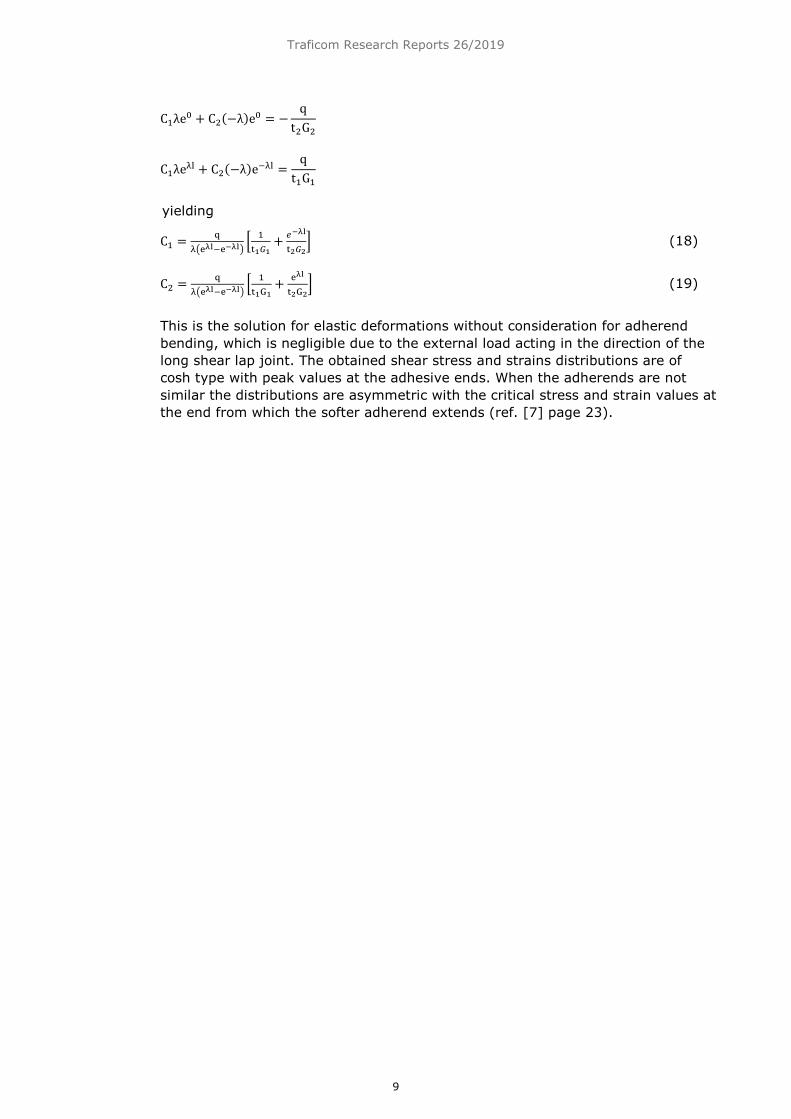
This is the solution for elastic deformations without consideration for adherend
bending, which is negligible due to the external load acting in the direction of the
long shear lap joint. The obtained shear stress and strains distributions are of
cosh type with peak values at the adhesive ends. When the adherends are not
similar the distributions are asymmetric with the critical stress and strain values at
the end from which the softer adherend extends (ref. [7] page 23).

Traficom Research Reports 26/2019
10
2.2 Effects of plasticity
When the adhesive shear stress exceeds the adhesive yield value there is local
yield and the shear strain is increased. The adhesive plasticity can be modeled
with an elastic-plastic formulation with an example shown in Figure 2. Within the
plastic zone the differential equation is not equation (13) but somewhat different
and is derived in the following. The shear strain is obtained from equation (7)
γ = ������ (20)
Taking the derivative and using equations (5) and (6)
�0�� = �
��(�����)
�� = �� � ��
���� − ������� (21)
Derivating further
��0��� = �
� � �����
����� − �
��������� � (22)
and using equations (2) and (4)
��0��� = �
� � 1���� − �1
����� (23)
��0��� = �
� � ����� + �
����� τ=�� � �
���� + ������ τ2 = !�
� τ2 = constant (24)
where τp is the shear stress in the plastic zone, assumed constant in the elastic-
plastic model. So in the plastic zone the second order differential equation is non
homogeneous.
Use coordinate ξ starting at the inner edge of the plastic zone with width c,
situated at the right end of the bonding line. Consequently:
Figure 2. Example of elastic-plastic modeling of adhesive characteristics
(ref. [10] page 6-32).

Traficom Research Reports 26/2019
11
dξ = dx
x = l-c => ξ = 0
x = l => ξ = c
The differential equation can be solved by straight forward integration
��0�3� = !�
� τ2 (25)
�0�3 = !�
� τ2ξ + D� (26)
γ(ξ) = !��� τ2ξ� + D�ξ + D� (27)
where D1 and D2 are integration constants.
Plasticity also changes the elastic zone solution so that at the interface of the
elastic and plastic zones the shear stress has the adhesive yield value τp and the
shear strain the corresponding elastic value τp/G. The elastic zone shear strain
solution is
γ(x) = �# 'C�e!� + C�e�!�, (28)
The integration constants of the elastic and plastic zone solutions are determined
from the boundary conditions. When there is a plasticity zone only at the right
end of the bonding line the boundary conditions are
γ = 16� at x=l-c and ξ=0
�0�� = �0
�3 at x=l-c ξ=0
�0�� = − 178&
����� at x=0
�0�3 = 178&
����� at ξ=c
The second condition ensures continuity in the adherend stresses. The boundary
conditions give the following equations for determining the integration constants
C1, C2, D1 and D2
�� 'C�e!(&�9) + C�e�!(&�9), = 16
� (29)
D� = 16
� (30)
�� 'C�e!(&�9) + C�e�!(&�9), = D� (31)
�� 'C�λe!% − C�λe�!%, = − 178&
����� = − ������ (32)
Constants C1 and C2 for the elastic solution are solved for using equations (29)
and (32), which give
C� =):6;
< � =;�<�(+)(*+>)
!'()(*+>)�(+)(*+>), (33)
C� =):6;
< � =;�<�()(*+>)
!'()(*+>)�(+)(*+>), (34)

Traficom Research Reports 26/2019
12
Constants D1and D2 for the plastic solution are directly obtained from equations
(30) and (31).
Based on the boundary conditions Hart-Smith ref. [7] has derived after some
manipulation the following relation (Appendix equation (A.35)) for a normal
loaded lap joint
1 + �!9� � @tanh -λ �&�9
� �/ + ��DEF-!�*+>
� �/G = tanh -λ �&�9� �/ H178
16 �!9� � ���IJK(�)
�LIJK(�)� − CTHERM(1)R
+�
�DEF-!�*+>� �/ H178
16 �!9� �R (35)
where CTHERM(1) is a term depending on different thermal expansion coefficients
on the adherends. As the layups are now the same in the adherends the term
CTHERM(1)=0. The term ETR(1) is now on a shear loaded lap joint the ratio
ETR(1) = t�G�t�G�
For long overlaps
tanh Hλ Sl − c2 WR → 1
Inserting these into relation (35) and simplifying the following equation is
obtained for the plastic zone width at one end of the bonding line
c = �16
��������L���� − �
! (36)

Traficom Research Reports 26/2019
13
3 Wing spar web distributions
3.1 Web bonding configuration
The wing spar web is laminated to the lower wing shell and the final bonding
takes place to the upper wing shell, see Figure 3. The L-shaped profiles are
supported with foam core during the bonding. The sandwich web and the L-
shaped profiles at the bonding have the form shown in Figure 4.
Figure 3. PIK-20D wing spar structure.
Figure 4. Wing spar web bonding configuration.
30
40
20
4 weaves 92125
2 weaves 92125 bonding adhesive
web

Traficom Research Reports 26/2019
14
The spar web is laminated to the root rib with four weaves of Interglas 92125
with the configuration shown in Figure 5. The connection laminates are inside the
web bonding adhesive and the connection laminates and the L-shaped profiles for
web bonding overlap. The figure shows the configuration used in the initial static
tests of PIK-20D. A third weave of 92125 was added into the type design
configuration on each web skin at the root area y=0 to 250 mm, see ref. [11]
page 27. The root rib is shown in Figure 6.
Figure 5. Wing spar web connection to the root rib.
Figure 6. Root rib structure.
web
60
20
root rib
4 weaves 92125

Traficom Research Reports 26/2019
15
3.2 Measured shear strains
The measured shear strain values of the PIK-20D wing spar web are shown at
limit load +20% in Figure 7. The values are for the maximum takeoff weight of
450 kg with the water ballast in the wings, which gives the maximum bending
moment. A lower take-off weight of 350 kg without water ballast gives the
maximum shear force for the wing, but it is only 2,5% higher than with water
ballast, ref. [12] Nyström page 8. As the difference is so small, it has been
ignored here. The total shear load is due to the air loads minus mass loads
integrated from the wing tip to the section in question and consequently shows an
increasing value. This is shown in the strain gage values of shear strain along the
neutral axis in Table 1. Wing torsion contributes to the different values at the
forward and aft sides of the web. The load case is not always the same so the
values are envelope values.
One would also expect the shear strain values to be about the same at the neutral
axis and just under the spar cap. The latter values are systematically lower, only
about half of the neutral axis values. In an I-beam one would expect almost
constant shear stress and strain in the web. A reason for the different values may
be that the strain gages just under the spar cap are bonded to the L-shaped
profiles for the web bonding. The additional thickness of the profile flange
increases the local web stiffness thus reducing the shear deformation. Check now
this hypothesis by calculating the shear flow intensity, which is constant at a wing
station.
As the exact vertical positions of the strain gages under the spar cap are not
known, it is assumed that they are placed at the middle of the 30 mm wide
flange. Also it is assumed that the flange has no effect at the outer edge, full
effect at the inner end and 50% effect at the strain gage positions. The shear flow
intensity is
q = Gγt&Y9D& (37)
At wing stations y=855 mm and 255 mm there are two weaves of Interglas
92125 at each web skin. The L-shaped profile is here made of four weaves of
92125, of which two are assumed to be effective at the strange gage positions.
The thickness of one 92125 laminate is 0,290 mm and the shear modulus for a
±45o laminate is 9400 N/mm2, see ref. [13] page 8. These values give the shear
flow values presented in Table 2. The hypothesis of half of the flange thickness
being effective seems to give reasonably accurate results, within 23% at station
y=855 mm and within 8% at station 255 mm.
Table 1. PIK-20D wing spar web shear strains at limit load (n=6,62) +20%,
see Figure 7.
Wing station
[mm]
Forward side Aft side
Gage nr γγγγxy
[%]
Gage nr γγγγxy
[%]
4735
3610
1955
855
255
21
17
13
11
7
0,210
0,233
0,294
0,336
0,555
22
18
14
12
8
-0,126
-0,285
-0,347
-0,371
-0,512

Traficom Research Reports 26/2019
16
Fig
ure 7
. P
IK-2
0D
win
g s
par
web s
hear
str
ain
s γ
yz a
t lim
it load (
n=
6,6
2)
+20%
. Rig
ht
win
g,
vie
w lookin
g a
ft.
The n
um
bers
in t
he c
ircle
s identify
:
t
op
–
dis
tance y
fro
m r
oot
rib r
efe
rence s
tation
m
iddle
– s
train
gage n
um
ber
b
ott
om
– n
um
ber
of
sta
tic t
est
The d
ashed lin
e indic
ate
s t
hat
the s
train
gage is o
n t
he a
ft s
ide o
f th
e w
eb
Ref.
Nystr
öm
[13],
Appendix
13a,
16a.
Wing station y=255
Root rib wing station y=0

Traficom Research Reports 26/2019
17
The shear strains at station y=34 mm do not follow the pattern of the other two
stations. The values would better fit the pattern of the previous stations if the
gage numbers were swapped by a mishap. This is unlikely due to the systematic
numbering of the forward and aft side gages. The measurements are very likely
correct and the reason for the odd looking values is probably the reaction from
the opposite wing spar end on the root rib just forward of the web (see Figure 6).
The reaction of the spar end gives a complicated load distribution on the root rib
with disturbances escalating to the wing spar root. Gerhard Waibel ref. [14]
commented that they have also seen a same type of disturbance at the wing root.
The higher strains at gage number 1 at the wing spar neutral axis are transferred
to the root rib and do not pass over the web bonding line.
The wing loading tests were performed on a test wing differing from the type
design wing at the web root. At the root area y=0 to 250 mm there was only two
weaves of 92125 on each side of the web core. The measured shear flow
intensities are valid for the type design configuration, but the shear strains and
stresses will be reduced due to the locally added web skin thicknesses.
The shear flow from one web skin must pass over the 30 mm wide bonding line
shown in Figure 4. At wing station y=255 mm the shear flow intensity is (more
reliable value at the neutral axis, see Table 2)
q = 30,3/1,2
= 25,3 N/mm limit load, n=6,62
At wing station y=34 mm the shear flow intensity passing over from the web to
the wing shell can be calculated using expression q = Gγt&Y9D& (37) and strain
gage nr 4 value of Figure 7
q = 9400*(0,00678/1,2)*(2+2+2)*0,290
= 92,4 N/mm limit load, n=6,62
The number of 92125 weaves is 2 in the web skin, 2 weaves taken effective at the
connection to the wing shell and 2 weaves taken effective in the connection to the
root rib, see Figure 4 and Figure 5. This is the local shear flow intensity, based on
strain gage measurement at the corner of the web on top of the laminated
connections to the root rib and the web. This shear flow intensity acts on the web
lower side whereas the web bonding is on the web upper side. There is no strain
gage measurement available close to the bonding line. The connection to the root
rib via the laminated weaves is stiffer than the load path over the bonding line.
Based on equation (7) the displacement over bonding load path is proportional to
Table 2. PIK-20D wing spar web shear flow intensities at limit load (n=6,62)
+20%.
Wing station
[mm]
Side Neutral axis Under spar cap
Gage nr q
[N/mm]
Gage nr q
[N/mm]
855
855
255
255
fwd
aft
fwd
aft
11
12
7
8
18,3
20,2
30,3
27,9
9
10
5
6
21,5
15,6
31,1
25,7

Traficom Research Reports 26/2019
18
v ≈ 1� tl (38)
where the bonding adhesive entities are: τ is shear stress, t thickness, l width and
G shear modulus. The adhesive shear stress is proportional to the external shear
flow intensity (equations (7), (15), (18) and (19))
v ≈ q �&� (39)
This means that the load path stiffness is proportional to G/(tl). For a 30 mm wide
and 1,5 mm thick bonding adhesive with Eccospheres glass micro balloons this
gives a value (ref. [13] page 15)
2200/(1,5*30) = 48,9
Load transfer in inter laminar shear over a layer of resin to a 60 mm wide
laminated connection represents an elasticity comparable to a bonding line
elasticity. Assuming the resin layer thickness to one half of the 92125 weave
thickness the stiffness value is
1250/(0,5*0,290*60) = 143,7
The bonding line would transfer a fraction of
48,9/(48,9+143,7) = 0,254
the total load. This is about 25% of the total shear flow intensity and the
laminated connection transfers about 75%. If the shear flow intensity q=92,4
N/mm would act in the web upper corner the bonding line would experience a
shear flow intensity
q = 0,254*92,4 = 23,5 N/mm limit load, n=6,62
which is less than at wing station y=255 mm. However, there are no strain gage
results in the web upper corner. The load distribution at the wing root is complex
with disturbances escalating to the web root. The local shear flow intensity could
in theory be higher than at the web lower corner. If the web bonding line could
not locally take the higher load, the connection laminate can bear it alone as it is
dimensioned for the even higher shear flow intensity at the neutral axis.

Traficom Research Reports 26/2019
19
3.3 Bonding adhesive elastic distributions
The elastic bonding line shear stress distributions are checked at wing station
y=255 mm. The additional reinforcement weave begins inboard of this station at
y=250 mm. Outboard of this station there are two weaves of 92125 on one web
skin and inboard three weaves. The outboard area is more critical due to the
larger unbalance of the adherend properties. The elastic distributions are
calculated with the expressions of chapter 2.1 and the following initial data (ref.
[13] page 35).
Adherend 1, web skin, 2*92125 ±45o
t1 = 2*0,290 = 0,580 mm
G1 = 9400 N/mm2
Adherend 2, L-profile, 4*92125 ±45o
t1 = 4*0,290 = 1,160 mm
G1 = 9400 N/mm2
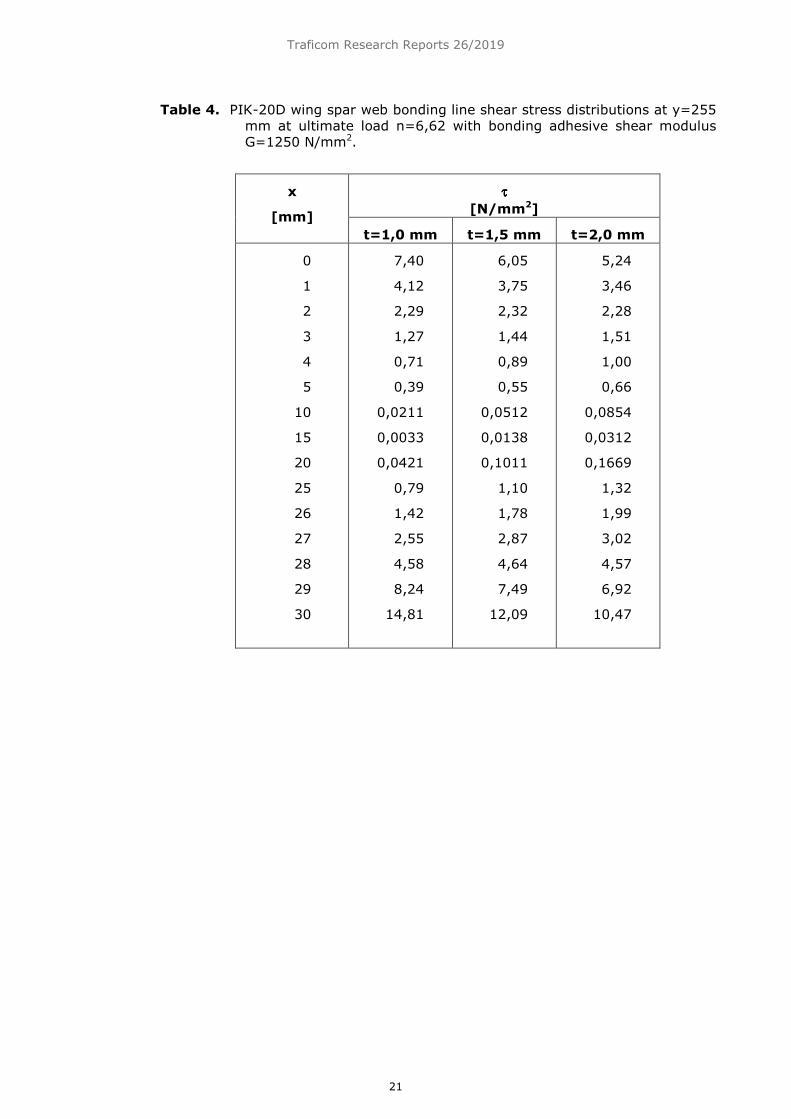
Bonding adhesive, Rütapox L02 resin filled with Eccospheres micro balloons
l=30 mm
t = 1,0, 1,5 and 2,0 mm
G = 1250 N/mm2 and 2200 N/mm2
The thickness values were chosen based on bonding thicknesses observed in cut
wing sections. The lower shear modulus is that of pure resin. The higher shear
modulus was based on a calculation of a unidirectional glass fiber laminate with
37,5% of resin (volume). It was reasoned that the unidirectional glass fibers
would fill the compound in the same way as the glass micro balloons and a
significant deformation would be only in the resin.
The acting shear flow over the bonding line is
q = 1,5*25,3 = 37,9 N/mm at ultimate load, n=6,62, ref. page 17
The results are collected into Table 3 and Table 4. The integration of the shear
flow intensity from the shear stress distribution of the case G=2200 N/mm2 and
t=1,5 mm gave a value q=40,3 N/mm. This is 6,3% higher than the external
shear flow intensity q=37,9 N/mm. Regarding the concave shear stress
distribution the result shows the expected trend and confirms a good accuracy in
the calculations.
The shear stress distributions are presented in Figure 8 and Figure 9. the
distributions are asymmetric due to the factor two different adherend properties
with very low shear stresses in a wide area in the middle of the lap joint. It is
seen that the shear stress peak value at one end of the adhesive is a factor 2
higher than at the other end. This is due to the adherend at the web face having a
factor 2 higher flexibility than at the L-profile. At the wing root y=0 to 250 mm
there is a third weave of 92125 at the web skin. With this stiffer adherend the
joint is more balanced and with the nominal adhesive thickness t=1,5 mm and
shear modulus G=2200 N/mm2 the peak shear stresses at the adhesive ends are
τ=12,1 N/mm2 and 9,09 N/mm2 compared with the corresponding values τ=16,04
N/mm2 and 8,02 N/mm2 of Table 3. A more balanced lap joint gives a more even
shear stress distribution with a lower peak value.
The peak shear stress values appear at the end from which the softer adherend
extends. This is the end which is visible inside the wing and possible to inspect.
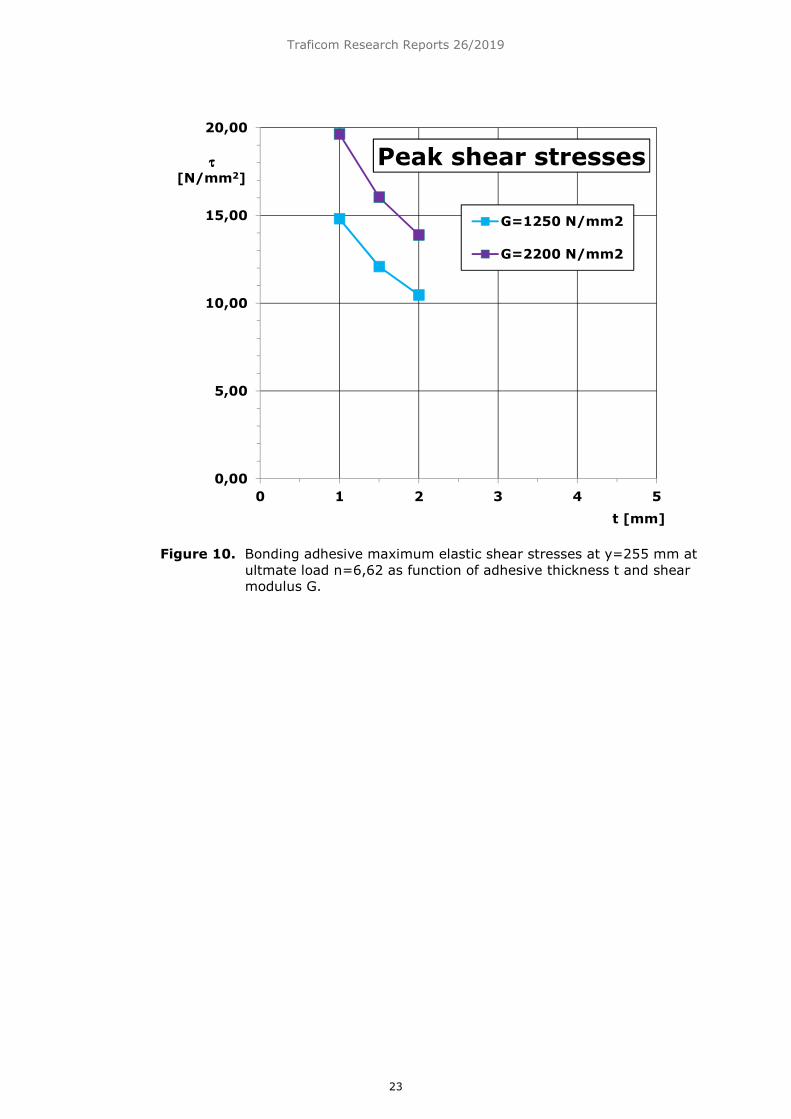
Figure 10 shows the peak shear stress values as function of adhesive thickness t
and shear modulus G. The peak values increase with increasing joint stiffness,
that is with increasing shear modulus value and decreasing adhesive thickness.
The peak shear stress value τ=16,04 N/mm2 at ultimate load corresponds to a

Traficom Research Reports 26/2019
20
peak value of τ=10,69 N/mm2 at limit load indicating a slight plasticity at limit
load. The analytical solution of the elastic shear stress distribution is based on the
assumption that the shear stress is constant across the adhesive thickness. This
assumption leads to the non-zero shear stress at the adhesive end (ref. [7] page
8). This is of course unphysical at a free surface and the analytical equations
represent an idealized solution.
Table 3. PIK-20D wing spar web bonding line shear stress distributions at y=255
mm at ultimate load n=6,62 with bonding adhesive shear modulus
G=2200 N/mm2.
x
[mm]
ττττ
[N/mm2]
t=1,0 mm t=1,5 mm t=2,0 mm
0
1
2
3
4
5
10
15
20
25
26
27
28
29
30
9,82
4,51
2,07
0,95
0,44
0,20
0,0041
0,0025
0,0082
0,40
0,87
1,90
4,14
9,02
19,64
8,02
4,25
2,25
1,19
0,63
0,33
0,0140
0,0018
0,0280
0,67
1,26
2,39
4,50
8,50
16,04
6,95
4,01
2,31
1,33
0,77
0,44
0,0286
0,0054
0,0568
0,89
1,54
2,67
4,62
8,01
13,89
Traficom Research Reports 26/2019
21
Table 4. PIK-20D wing spar web bonding line shear stress distributions at y=255
mm at ultimate load n=6,62 with bonding adhesive shear modulus
G=1250 N/mm2.
x
[mm]
ττττ
[N/mm2]
t=1,0 mm t=1,5 mm t=2,0 mm
0
1
2
3
4
5
10
15
20
25
26
27
28
29
30
7,40
4,12
2,29
1,27
0,71
0,39
0,0211
0,0033
0,0421
0,79
1,42
2,55
4,58
8,24
14,81
6,05
3,75
2,32
1,44
0,89
0,55
0,0512
0,0138
0,1011
1,10
1,78
2,87
4,64
7,49
12,09
5,24
3,46
2,28
1,51
1,00
0,66
0,0854
0,0312
0,1669
1,32
1,99
3,02
4,57
6,92
10,47

Traficom Research Reports 26/2019
22
Figure 8. Bonding adhesive elastic shear stress distribution at y=255 mm at
ultimate load n=6,62.
Figure 9. Bonding adhesive elastic shear stress distribution at y=255 mm at
ultimate load n=6,62.
0
5
10
15
20
0 5 10 15 20 25 30
ττττ[N/mm2]
x [mm]
G = 2200 N/mm2
t=1,0 mm
t=1,5 mm
t=2,0 mm
0
5
10
15
20
0 5 10 15 20 25 30
ττττ[N/mm2]
x [mm]
G = 1250 N/mm2
t=1,0 mm
t=1,5 mm
t=2,0 mm
Traficom Research Reports 26/2019
23
Figure 10. Bonding adhesive maximum elastic shear stresses at y=255 mm at
ultmate load n=6,62 as function of adhesive thickness t and shear
modulus G.
0,00
5,00
10,00
15,00
20,00
0 1 2 3 4 5
ττττ[N/mm2]
t [mm]
Peak shear stresses
G=1250 N/mm2
G=2200 N/mm2
Traficom Research Reports 26/2019
24
3.4 Adhesive elastic–plastic model
To take into account the adhesive plasticity it is needed a model for the adhesive
characteristics. An elastic-plastic model, as shown in Figure 2, is utilized here for
the compound of Rütapox L02 resin filled with Eccospheres glass micro balloons,
used on the PIK-20D sailplane. The plastic shear stress should be chosen so that
it gives equal strain energy to rupture compared with the true adhesive
characteristics. The exact characteristics of the adhesive compound are unknown,
but there are ultimate shear stress values, determined with strength tests. The
tests were performed with tension loaded lap joints with a specimen size of about
1 times 1 inch. Depending on the adhesive thickness the scatter reduced shear
strength values were the following (ref. [13] page 19)
τu = 10,0 N/mm2 t=1,0…1,5 mm
τ u = 9,0 N/mm2 t=1,5…2,5 mm
τ u = 7,0 N/mm2 t=2,5…3,5 mm
The values are average shear stresses based on ultimate force per specimen
shear area. It is acknowledged that measuring adhesive material values contains
many pitfalls and and the results are dependent on the coupon type, see ref. [15]
Hart-Smith page 19…25. For the nominal adhesive thickness of 1,5 mm the shear
stress value of τ = 9,0 N/mm2 on the low side is selected. The nominal shear
modulus for the compound was derived as G=2200 N/mm2 (see page 19).
Consequently the maximum elastic shear strain is (equation (7))
γ = τ/G = 9/2200 = 0,00409
Rütapox L02 resin has an ultimate strain εu exceeding the value 0,03, which was
registered in material tests when the strain gages ruptured. Torsion specimen of
the cured resin were used to determine the shear strain from measured strain
values in +45o and -45o directions using formula (Perälä ref. [16] page 55)
γ = [\]^�[+\]^��'[\]^L[+\]^,L� (40)
which in pure shear becomes
γ = ε`a^ − ε�`a^ = 2ε`a^ (41)
If this would apply up to rupture the shear strain at rupture would be
γ u = 2*0,03 = 0,06
However, the 0,375 volume fraction of glass would reduce the ultimate strain by
factor (1-0,375) assuming no elongation of glass micro balloons. This would give
γ u = (1-0,375)*0,06 = 0,0375
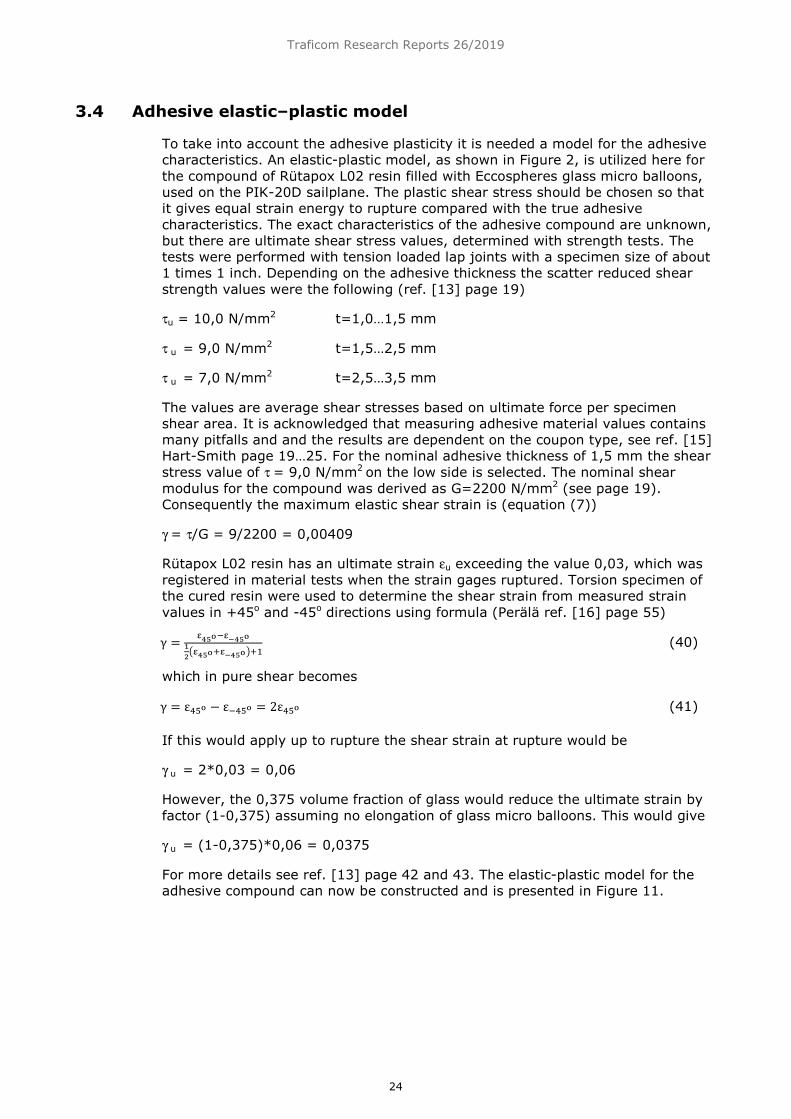
For more details see ref. [13] page 42 and 43. The elastic-plastic model for the
adhesive compound can now be constructed and is presented in Figure 11.
Traficom Research Reports 26/2019
25
Figure 11. Elastic-plastic modeling of adhesive characteristics with Rütapox L02
resin and Eccospheres glass micro balloons compound.
γ 0 0,01 0,05
0
10
ττττ [N/mm2]
Traficom Research Reports 26/2019
26
3.5 Bonding adhesive plastic distributions
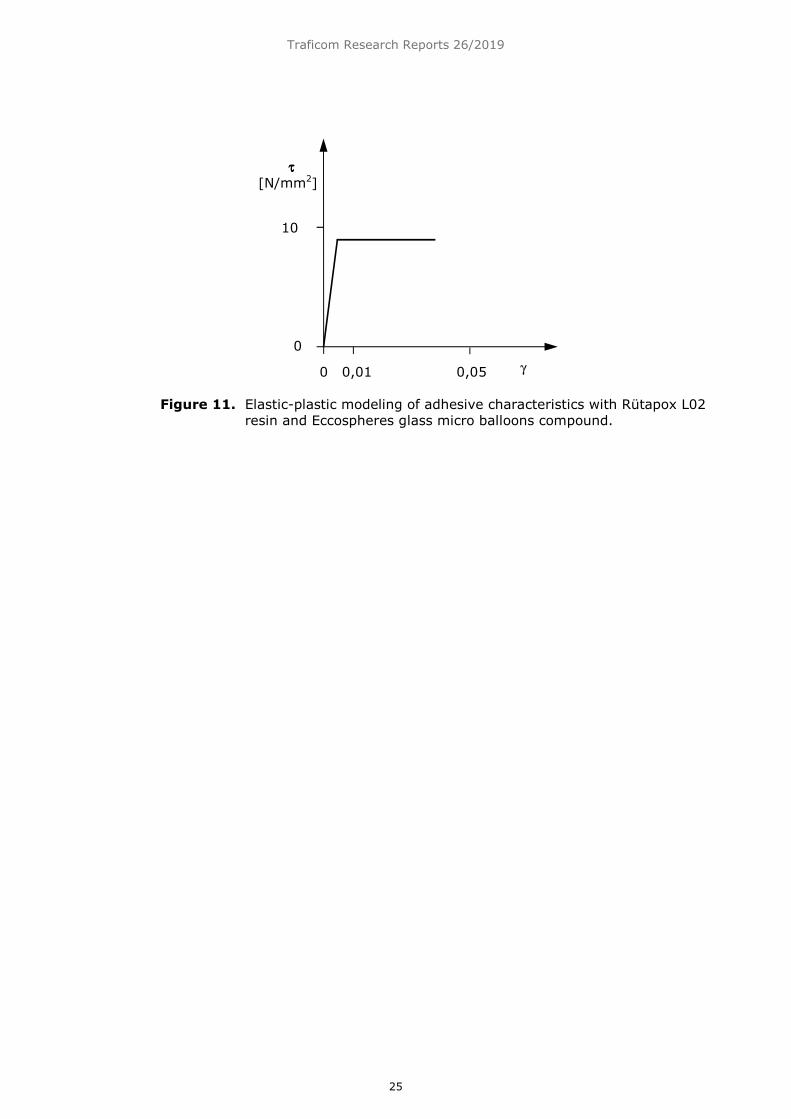
The effects of plasticity in the adhesive shear stress and strain distributions are
calculated using the equations of chapter 2.2 and the elastic-plastic model of
chapter 3.4. The amount of plasticity is determined from equation (36) which
gave a plastic zone width c=1,231 mm. In the idealized distribution the shear
stress is limited to the adhesive yield value 9,0 N/mm2 within the plastic zone. In
the idealized distribution the value τ=9,0 N/mm2 extends to the edge x=30 mm.
This is of course unphysical and in reality the shear stress goes to zero on a free
surface. The shear stress distribution is affected within a distance from the
adhesive ends, of a few times the adhesive layer thickness (ref. [7] page 8). Due
to the adhesive spreading out from the space between the web skin and the L-
profile (see Figure 4) and increasing the bonding line length the idealized solution
may represent the situation quite well. The shear strain at the beginning of the
plastic zone is
γ p = τp/G = 9/2200 = 0,00409
From this value the additional plastic shear strain γp increases the shear strain
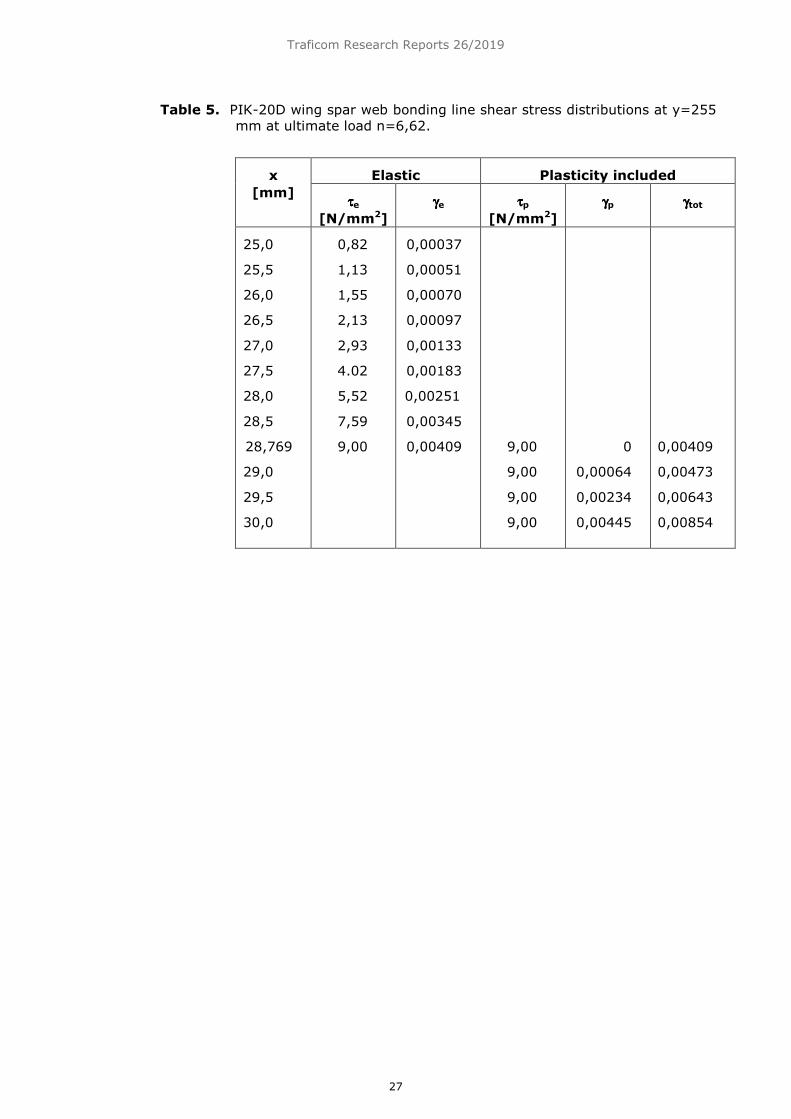
with a parabolic distribution. The distributions are presented in Table 5 and Figure
12.
Figure 12. Distributions of adhesive shear stress and strain at wing station
y=255 mm at ultimate load n=6,62.
0,000
0,005
0,010
0,015
0,020
0
5
10
15
20
25 26 27 28 29 30
ττττ[N/mm2]
x [mm]
Shear stress, elastic
Shear stress,
plasticity included
Shear strain, elastic
Shear strain, plasticity
included
Traficom Research Reports 26/2019
27
Table 5. PIK-20D wing spar web bonding line shear stress distributions at y=255
mm at ultimate load n=6,62.
x
[mm]
Elastic Plasticity included
ττττe
[N/mm2]
γγγγe ττττp
[N/mm2]
γγγγp γγγγtot
25,0
25,5
26,0
26,5
27,0
27,5
28,0
28,5
28,769
29,0
29,5
30,0
0,82
1,13
1,55
2,13
2,93
4.02
5,52
7,59
9,00
0,00037
0,00051
0,00070
0,00097
0,00133
0,00183
0,00251
0,00345
0,00409
9,00
9,00
9,00
9,00
0
0,00064
0,00234
0,00445
0,00409
0,00473
0,00643
0,00854

Traficom Research Reports 26/2019
28
3.6 Vertical compression loads
Due to wing bending one spar cap is elongated and the other one is compressed
causing a vertical side load as shown in Figure 13 (see ref. [17]). Spar cap load Py
induces a vertical side load
Pc = Pddβ (42)
Elongations in the upper and lower spar caps give
εdx − (−εdx) = hdβ
yielding
2εdx = hdβ (43)
and by substitution
Pc = fF
�[��F (44)
where M is the bending moment corresponding to the spar cap loads Py at a
distance h. The vertical normal load intensity is
pc = hi�� = �f[
F� (45)
This acts as a compression load on the wing spar web. Estimate the load at wing
station y=255 mm from the root rib, where
M = 2825 kpm limit load, W=450 kg
ε = 0,0037 limit load, W=450 kg
h = 127 mm ref. [13] page 58
These values give for one web skin a compressive normal load intensity of
Figure 13. Vertical side loads.
dββββ
h
−ε−ε−ε−ε
εεεε
Py
Py
Py
Py dββββ
Py Py
Pz
Traficom Research Reports 26/2019
29
pz = 7,4 N/mm ultimate load
to be compared with the acting shear flow intensity
q = 37,9 N/mm ultimate load
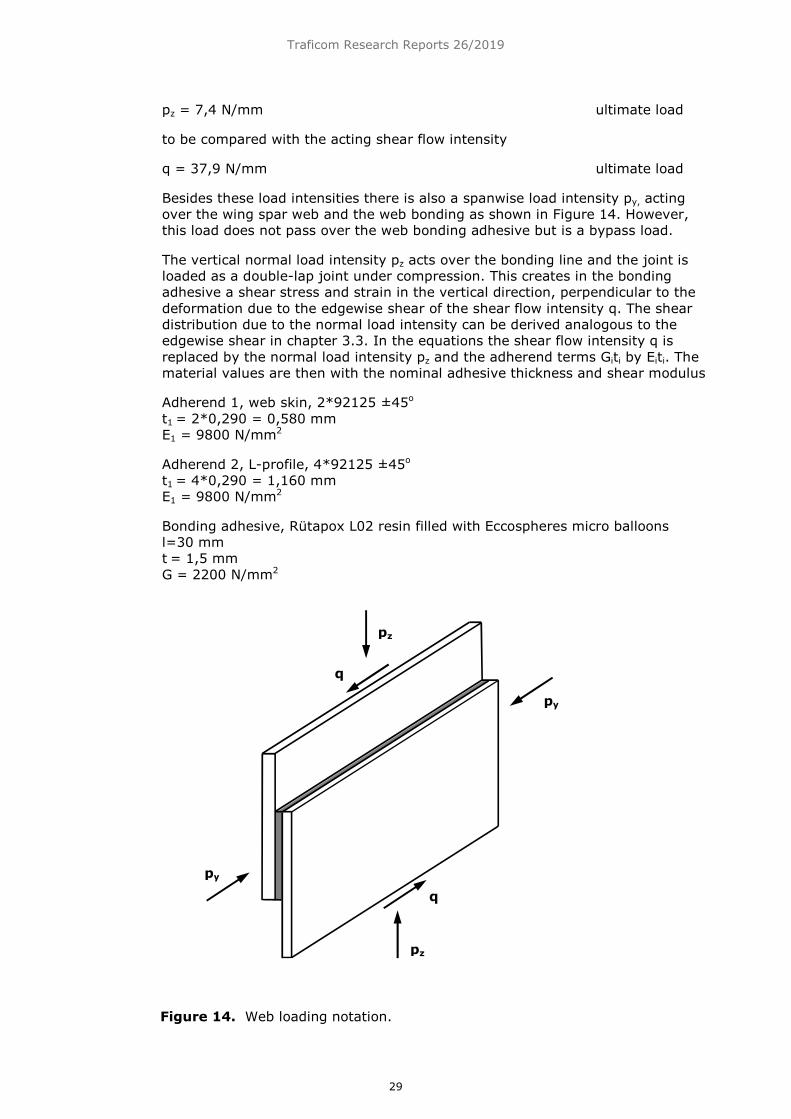
Besides these load intensities there is also a spanwise load intensity py, acting
over the wing spar web and the web bonding as shown in Figure 14. However,
this load does not pass over the web bonding adhesive but is a bypass load.
The vertical normal load intensity pz acts over the bonding line and the joint is
loaded as a double-lap joint under compression. This creates in the bonding
adhesive a shear stress and strain in the vertical direction, perpendicular to the
deformation due to the edgewise shear of the shear flow intensity q. The shear
distribution due to the normal load intensity can be derived analogous to the
edgewise shear in chapter 3.3. In the equations the shear flow intensity q is
replaced by the normal load intensity pz and the adherend terms Giti by Eiti. The
material values are then with the nominal adhesive thickness and shear modulus
Adherend 1, web skin, 2*92125 ±45o
t1 = 2*0,290 = 0,580 mm
E1 = 9800 N/mm2
Adherend 2, L-profile, 4*92125 ±45o
t1 = 4*0,290 = 1,160 mm
E1 = 9800 N/mm2
Bonding adhesive, Rütapox L02 resin filled with Eccospheres micro balloons
l=30 mm
t = 1,5 mm
G = 2200 N/mm2
Figure 14. Web loading notation.
q
q
pz
pz
py
py
Traficom Research Reports 26/2019
30
At ultimate load pz=7,4 N/mm the peak shear stress at x=30 mm is τ=3,07
N/mm2 and the corresponding shear strain is
γ=0,00140
The resultant shear strain due to the vertical normal load and edgewise shear
load intensities is
j0,00140� + 0,00854� = 0,00865
and the increase due to the vertical normal load intensity is less than 2%. Failure
will occur when the resultant exceeds the adhesive ultimate shear strain value
(ref. [7] Hart-Smith page 40)
pγd� + γc� ≥ γr (46)
The adhesive compound ultimate shear strain was conservatively estimated,
based on material tests of Perälä ref. [16], as γu=0,0375. The Margin of Safety is
MS≥100% and the bonding adhesive is lightly loaded.
The level of the bypass load intensity py may have an effect on the bonding
adhesive fracture under the resulting shear strain. The acting compression due to
py was
ε=0,00555 ultimate load
The Rütapox L02 resin has an ultimate compression strain ε>0,03 (ref. [16]
Perälä page 43). Assuming conservatively a volume fraction of 0,375 of
Eccospheres glass micro balloons (a normal value for wet layup) and the micro
balloons to be infinitely stiff, the ultimate compression strain for the adhesive
compound is estimated as
ε=(1-0,375)*0,03=0,01875 >> 0,00555
The bonding line adhesive is lightly loaded in spanwise compression and this
effect is ignored in the combined fracture.

Traficom Research Reports 26/2019
31
4 Bonding adhesive dimensioning
4.1 Static dimensioning
There are bonding shear stress allowables, approved by Luftfahrt Bundesamt LBA
for sailplane structures, Vorläufige Dimensionierungswerten für Holme von
Segelflugzeugen und Motorseglern ref. [18]. There is a value for new production
τkl,Br = 7 N/mm2
where kl refers to bonding (Klebe) and Br to ultimate static value (Bruch). So this
is a static dimensioning value based on average shear stress. However, LBA has
lost the connection to the original report and cannot say if the values are backed
up by fatigue tests also (ref. [19]). There is no specification of the bonding
material, such as resin or micro balloons, but it says that the value is valid in new
production of glass, carbon and synthetic fiber structures. Obviously the value
covers all common resins used in the 1980s, also the Epikote 162/C260.
Static strength tests, made at Helsinki University of Technology on Rütapox
L02/H91/SL66 + Eccospheres glass micro balloons, showed the following ultimate
shear strength values at varying bonding thicknesses
τ u = 10,0 N/mm2 t = 1,0…1,5 mm
τ u = 9,0 N/mm2 t = 1,5…2,5 mm
τ u = 7,0 N/mm2 t = 2,5…3,5 mm
The dimensioning values are based on average shear stress over the bonding line.
There is also a recommendation to use a safety factor n=2,0 in all bondings.
These values are somewhat higher than the LBA approved values, which can be
explained by the better resin. The recommended safety factor is explained by
general conservatism with a joint which is not analyzed in detail.
The average shear stress at wing station y=255 mm is at ultimate load
τ = �& = �,a∗t%,t/�.�
t% = 1,26 N/mm�
Based on visual observations of cut wing sections the bonding adhesive thickness
has been typically 1,0…2,0 mm with emphasis towards the lower value.
Howeverm on a 7 m long bonding line it is not possible to hold strict values and
based on a typical thickness of 1,5 mm the lower allowable of 7,0 N/mm2 is
selected. The redundancy factor is then
n = y,%�,�z = 5,6
So the margin of safety greatly exceeds MS > 100% fulfilling the recommendation
of having at least a redundancy factor of n=2,0.
There is no mention about the influence of environment in the LBA or Helsinki
University of Technology documents. The environmental factors (temperature and
humidity) should be considered in dimensioning (ref. [15] Hart-Smith page 7).
Normally the hot-wet conditions are dimensioning for composite structures. In the
Helsinki University of Technology values the recommended additional safety factor
may also cover the environmental uncertainty.
Traficom Research Reports 26/2019
32
4.2 Fatigue
Because there is not available fatigue data for the adhesive compound in an
edgewise shear loaded lap joint, the estimates are based on PIK-20D fatigue
tests. These were started with an unreinforced wing performing first about 30
static loadings at high load levels, see ref. [11] Trafi Research Reports 7/2015
page 31. 9 of the loadings were at limit load +20% at n=7,944. The 6000 FLH
Kossira-Reinke spectrum, with 12,5% aerobatic flight added, contains 10 cycles at
limit load, ref. [11] Trafi Research Reports 7/2015 page 69. Because only the
highest load cycles contribute to the cumulative fatigue sum the static loads
represent
9*6000/10 = 5400 FLH
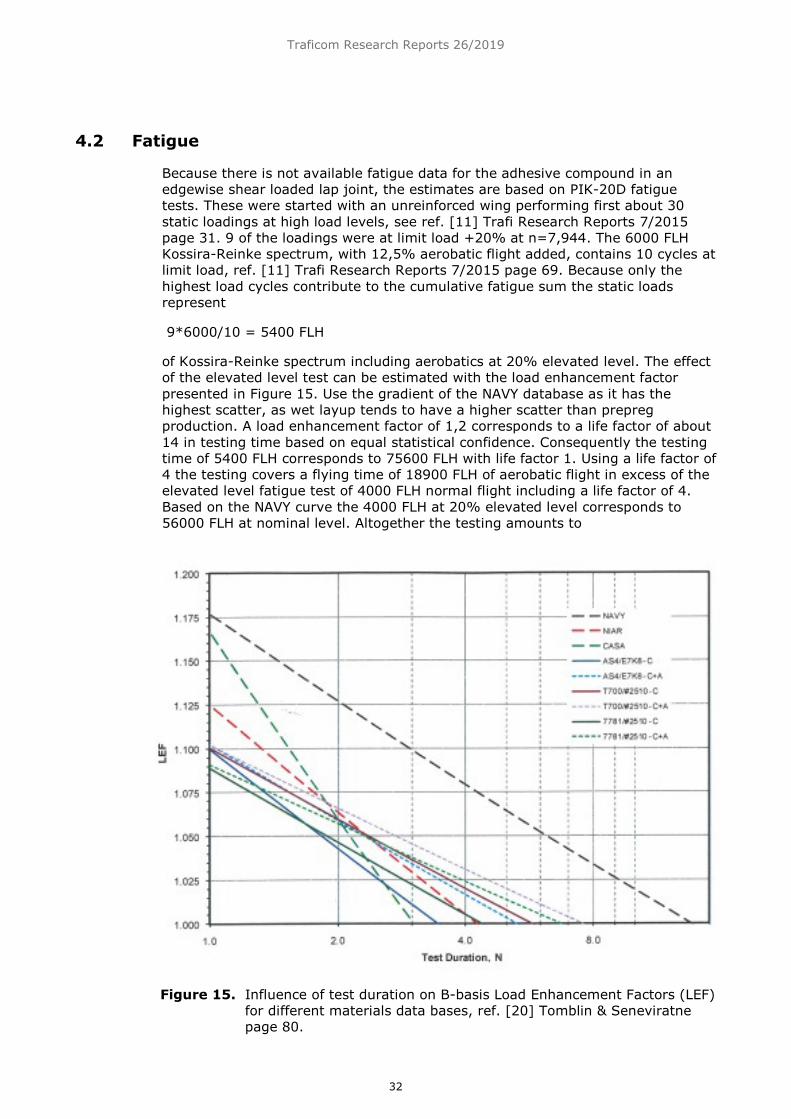
of Kossira-Reinke spectrum including aerobatics at 20% elevated level. The effect
of the elevated level test can be estimated with the load enhancement factor
presented in Figure 15. Use the gradient of the NAVY database as it has the
highest scatter, as wet layup tends to have a higher scatter than prepreg
production. A load enhancement factor of 1,2 corresponds to a life factor of about
14 in testing time based on equal statistical confidence. Consequently the testing
time of 5400 FLH corresponds to 75600 FLH with life factor 1. Using a life factor of
4 the testing covers a flying time of 18900 FLH of aerobatic flight in excess of the
elevated level fatigue test of 4000 FLH normal flight including a life factor of 4.
Based on the NAVY curve the 4000 FLH at 20% elevated level corresponds to
56000 FLH at nominal level. Altogether the testing amounts to
Figure 15. Influence of test duration on B-basis Load Enhancement Factors (LEF)
for different materials data bases, ref. [20] Tomblin & Seneviratne
page 80.
Traficom Research Reports 26/2019
33
18900 + 56000 = 74900 FLH
which the wing web bonding line has endured.
The testing was made at takeoff weight W=450 kg simulating water ballast
whereas the maximum wing shear load takes place without water ballast at
takeoff weight W=350 kg. The wing shear load is 2,5 % higher in the latter case,
ref. [12] Nyström page 8. Based on the Navy curve this corresponds to a change
of test factor 1,473 in flight time amounting to
50800 FLH
The wing spar web bonding line is covered by this amount of testing including a
life factor of 4.
Another indication of bonding line life time can be obtained based on the fatigue
tests on the Janus wing performed at the Royal Melbourne Institute of
Technology, see Patching & Wood ref. [21]. The wing was tested with a so called
Dorning spectrum including aerobatic maneuvers up to n=5,3. The spectrum
consisted of 6000 FLH and static loading up to design limit loads n=6,0 and
n=-2,5 was performed manually at every 6000 FLH. The wing endured 35482 FLH
of loading until the testing was stopped. During the testing there were fractures in
the root rib around the metal spigot bearings that were repaired, but not on the
wing spar or the spar web bonding. The two-seater Janus sailplane has a bigger
wing than the PIK-20D, but the shear flow intensities are roughly the same due to
similar wing planforms. The wing root airfoils are the same so the structural
heights are proportionally the same. As the bonding line dimensions and materials
are similar the Janus fatigue gives an indication for the PIK-20D wing web
bonding fatigue life. The Janus wing is made of Epikote C162/C260 resin/hardener
combination that has more than factor 100 shorter fatigue life than the Rütapox
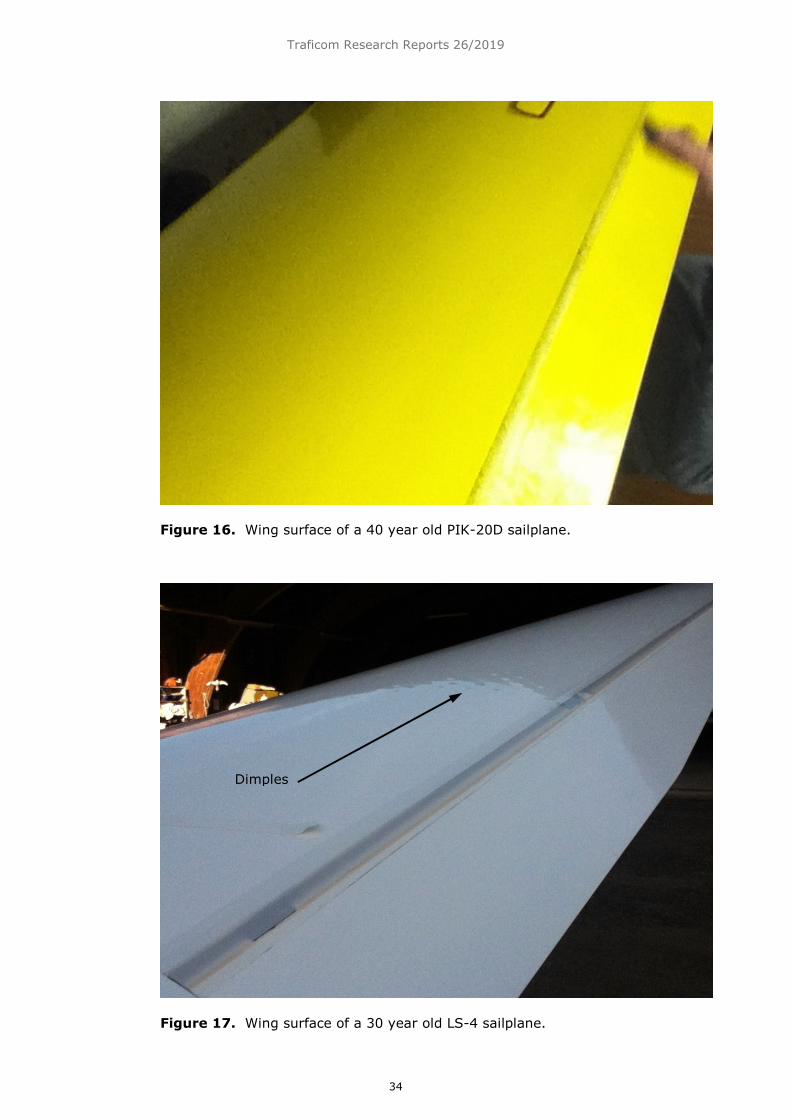
L02/SL resin system, see table Table 6. Another factor contributing to the good
fatigue properties of the PIK-20D sailplane is that the composite structure was
post cured overnight at elevated temperature (70o C for colored and 54o C for
white surfaces) giving a stable resin matrix during the service life. This is
demonstrated in the wing surfaces of PIK-20D and LS-4 sailplanes in Figure 16
and Figure 17. The dimpling pattern of the wing skin, bonded to the foam core, is
visible on the LS 4 whereas on PIK-20D there is no pattern. The bonding line
adhesive fatigue life can be scaled up indicating a fatigue life of
1000000*35482/7900/4 = 1,123*106 FLH
including a life factor or 4.
Hart-Smith (ref. [9]) has studied creep fatigue of bonded aircraft fuselages. On a
balanced lap joint, based on practical engineering experience, the Hart-Smith
Table 6. Effect of resin system on composite laminate fatigue properties,
based on Luftfahrt Bundesamt material acceptance fatigue tests
(L20/SL 19.8.1975 and GE162/C260 performed at DFVLR 4.6.1974),
ref. [22] Lumppio page 131.
Number of cycles to fracture
Probability of fracture
(Bruchwahrscheinlichkeit)
Epikote 162
& Laromin C
260
Rütapox L20
& SL
Rütapox L20
& H91
90 % 7900 106 1,2*106
Traficom Research Reports 26/2019
34
Figure 16. Wing surface of a 40 year old PIK-20D sailplane.
Figure 17. Wing surface of a 30 year old LS-4 sailplane.
Dimples

Traficom Research Reports 26/2019
35
criterion for avoidance of failure in fatigue requires that at ultimate load the
minimum of adhesive shear stress along the bond length is no-greater than one
tenth of the yield-stress. The criterion is illustrated in Figure 18. Hart-Smith
studied creep fatigue as one flight (of a length from a few minutes to a few hours)
gives one loading cycle when the fuselage is pressurized during the flight. Creep
fatigue is more critical than high frequency fatigue as shown by MIL-HDBK-17-3F
ref. [10] which quotes that when a specimen could endure 30 cycles in creep
fatigue it could take 1000 cycles in high frequency fatigue. So a lap joint, fulfilling
the Hart-Smith criterion, would be even less critical in high frequency fatigue.
For a balanced lap joint (equal adherends) an analytical equation can be derived
for the hart-Smith criterion. The shear stress distribution is symmetric
τ = Acosh(λx) (47)
with the coordinate x starting in the middle of the lap joint. At the beginning of
the plastic zone at x=d/2
Acosh �λ ��� = τ2
yielding
A = 169Y~F�!�
�� (48)
At the middle of the elastic zone at x=0
169Y~F�!�
�� cosh(λ ∗ 0) = 0,1 ∗ τ2
yielding
cosh (λ ��) = 10
Figure 18. Hart-Smith criterion for avoidance of failure in fatigue, ref. [9]
page 14.

Traficom Research Reports 26/2019
36
and further
hyp�� �cos h �λ ���� = λ �
� = 2,993 ≈ 3 (49)
which sets a requirement on the elastic zone width d. The requirement was
derived for a tension loaded lap joint, but when using expression(14) for
parameter λ the requirement is valid for a shear loaded balanced joint with equal
adherends.
Conservatively calculate the value of λ using the higher thickness of 1.16 mm for
both adherends giving a low value for the parameter λ=0,51867/mm.
Consequently the minimum length of the elastic zone is
d = 2*2,993/0,51867 = 11,5 mm
and the maximum total length of the plastic zones is
l-d = 30 – 11,5 = 18,5 mm
which is fulfilled by a large margin, see Figure 12.
It is obvious that the bonding line in the lap joint is so wide that the Hart-Smith
criterion is fulfilled and there should be no fatigue problems. The same indication
is given by the PIK-20D and the Janus wing fatigue tests, but should there be
bonding line fatigue problems one would expect those first on a sailplane with
Epikote 162/C260 resin system.
Traficom Research Reports 26/2019
37
5 Diverse effects
The following issues are treated here:
- peel stresses
- thermal expansion
- L-profile corner bending
- L-profile inter laminar shear stress
- solution accuracy at the adhesive ends
- joint adhesive thickness
- lap-joint unbalance
- joint adhesive width
- fatigue
For normal force loaded lap joints with thick adherends there is a bending loading
due to load eccentricity causing adherend cracking starting at the adhesive end
region. For thin adherends this is less of a problem. However, there is a bending
load due to the eccentricity even in a normal force loaded double-lap joints, see
ref. [7] Hart-Smith page 27…32. A double-lap joint is shown in Figure 18. The
vertical normal load intensity has the eccentricity, but the web sandwich core
supports the bonding minimizing the peel stresses due to bending. On an
edgewise shear loaded lap joint the external force is in the direction of the long
bonding line and the eccentricity bends the whole package, supported by the
sandwich core and the L-profile. Consequently the peel stresses are not
considered a problem.
Different thermal expansion in the adherends would create thermal stresses as
shown in ref. [7] Hart-Smith chapter 4. Now the layups are the same ±45o
weaves in the web skin and the L-profiles so there is no thermal mismatch. The
wing spar in unidirectional carbon fiber has though a different thermal expansion
coefficient. Between the L-profile (including the wing inner skin with
reinforcement weaves) and the spar cap there is a difference in thermal
expansion coefficients creating thermal loads. To a lesser extent these loads can
propagate further over the bonding line, but as secondary these loads are not
investigated.
The loads transferred over the bonding adhesive pass to the flange of the L-profile
and then further to the under structure, to which the L-profile other flange is
laminated. The shear load transfer is unproblematic but the secondary
compressive normal load can be thought of causing local bending on the L-profile
flange. The L-profile resembles a classical L-fitting which is connected to the
under structure with a fastener. Bending of the clamped flange is critical on the L-
fitting. On the bonded L-profile there is however no fastener and consequently no
stress concentration around the fastener head. Even if there is no radius specified
for the L-profile corner there will be some rounding in the corner. The space
between the rounded corner and the under structure is filled with the adhesive
compound or resin. Consequently there will be no significant bending of the L-
profile corner, if the adhesive compound and resin can transfer the flatwise
compressive load to the under structure. Some bending may be present due to
different elasticities and combined deformation of the structure. The acting
normal load intensity due to web compression was calculated in chapter 3.6 as

Traficom Research Reports 26/2019
38
pz=7,4 N/mm. On a 1,16 mm thick flange this gives nominally a compressive
stress
σ = 6,4 N/mm2 ultimate load
The resin ultimate strength was estimated as
σu = 25,1 N/mm2 ref. [13] Soinne page 73
and consequently the Margin of Safety exceeds 100% and the structure is lightly
loaded. In practice the flange load will spread out in about 45o angle and the
acting stress is reduced to one third. This is based on analytical plate theory
solutions. Figure 19 shows the stress distributions of an infinite plate where a
point load P is acting in the plane of the plate normal to the boundary. At a
distance b from the edge the peak normal stress is
σ = 0,637 h�� (50)
where t is the plate thickness. Assuming a constant stress over a width l it can be
written as
σ = h&� (51)
Setting the constant stress equal to the actual peak value the effective width and
half angle can be determined. It turns out that the half angle becomes a value
38o. The same result is obtained at any distance from the point load.
The L-profiles are directly laminated to the wing spar flange and wing inner skin.
This interface is not subject to the shear loading as the web bonding line, where
the shear load passes from one adhesive end to the other. The shear load from
the L-profile is transferred to the wing spar flange as in an ordinary I-Beam
without noticeable stress concentrations. The acting shear flow intensity q=37,9
N/mm2 at wing station y=255 mm at ultimate load on one L-profile is transferred
on an effective width of 19,4 mm to the wing spar flange giving a nominal shear
stress of
τ=2,0 N/mm2 ultimate load, ref. [13] page 74
Figure 19. Stress distribution on an infinitely wide plate due to a point load P
acting in the plane of the plate normal to the boundary, ref. [23]
Girkmann page 63.
Traficom Research Reports 26/2019
39
The allowable inter laminar shear stress, referred to the limit load, is estimated as
τILSS=59 N/mm2 ref. [13] page 74
The Margin of Safety MS>100% and the detail is lightly loaded. The allowable
ILSS value is considerably higher than the corresponding value for the adhesive
compound, because of the much smaller inter laminar layer thickness and the
weave layers touching each other.
The analytical solutions of the adhesive elastic shear stress and strain
distributions are based on the assumption of the shear stress being constant
across the adhesive thickness. This assumption leads to the non-zero shear stress
and strain at the adhesive ends, ref. [7] Hart-Smith page 8. This is of course not
possible on a free end surface. The estimated effect of plasticity also shows a
non-zero shear stress and strain at the adhesive end, see Figure 12. In practice
these will be equal to zero on a free surface and the distributions will be
smoothed out in some way. Due to the adhesive spreading out from the space
between the web skin and the L-profile (see Figure 4) and increasing the bonding
line length the idealized solution may represent the situation quite well.
The effect of the bonding adhesive thickness t was studied by varying the
thickness from 1 mm and 1,5 mm to 2 mm. With decreasing thickness the elastic
peak shear stress value was increasing as shown in Table 3 and Table 4.
However, the amount of plasticity would not be much increased due to the
steeper shear stress rise. The effect is also somewhat compensated by the
increase of adhesive ultimate shear strength with decreasing adhesive thickness,
see Chapter 4.1.
The lap-joint is called balanced when the adherends have the same properties. On
a balanced joint the shear distributions are symmetric and the peak shear
stresses at the adhesive ends are equal. The peak shear stresses are shown in
Table 7 indicating the effect of the lap-joint unbalance. Inboard of wing station
y=250 mm there is an additional third 92125 weave on the web skin and the peak
shear stress is reduced 25%. The higher peak values appear at the adhesive end
where the thinner adherend continues (End 1). On the PIK-20D wing spar web the
web skin is the thinner adherend. Thus the critical adherend end is visible inside
the wing and it is possible to inspect the critical adhesive end.
The bonding adhesive width l was varied for the nominal lap joint configuration
t=1,5 mm and G=2200 N/mm2 and with 2 weaves on the web skin and 4 on the
L-profile. The results are shown in Table 8. It is seen that the peak shear stress is
almost constant. In the middle of the bonding adhesive the shear stress values
Table 7. PIK-20D wing spar web adhesive elastic peak shear stress values at
ultimate load n=6,62 q=38,9 N/mm, depending on the edgewise shear
loaded lap-joint unbalance. Adhesive thickness t=1,5 mm and shear
modulus G=2200 N/mm2.
ττττ [N/mm2] Number of 92125 weaves on web skin/
L-profile
2/4 3/4 4/4
End 1 16,04 12,13 9,82
End 2 8,02 9,09 9,82
Traficom Research Reports 26/2019
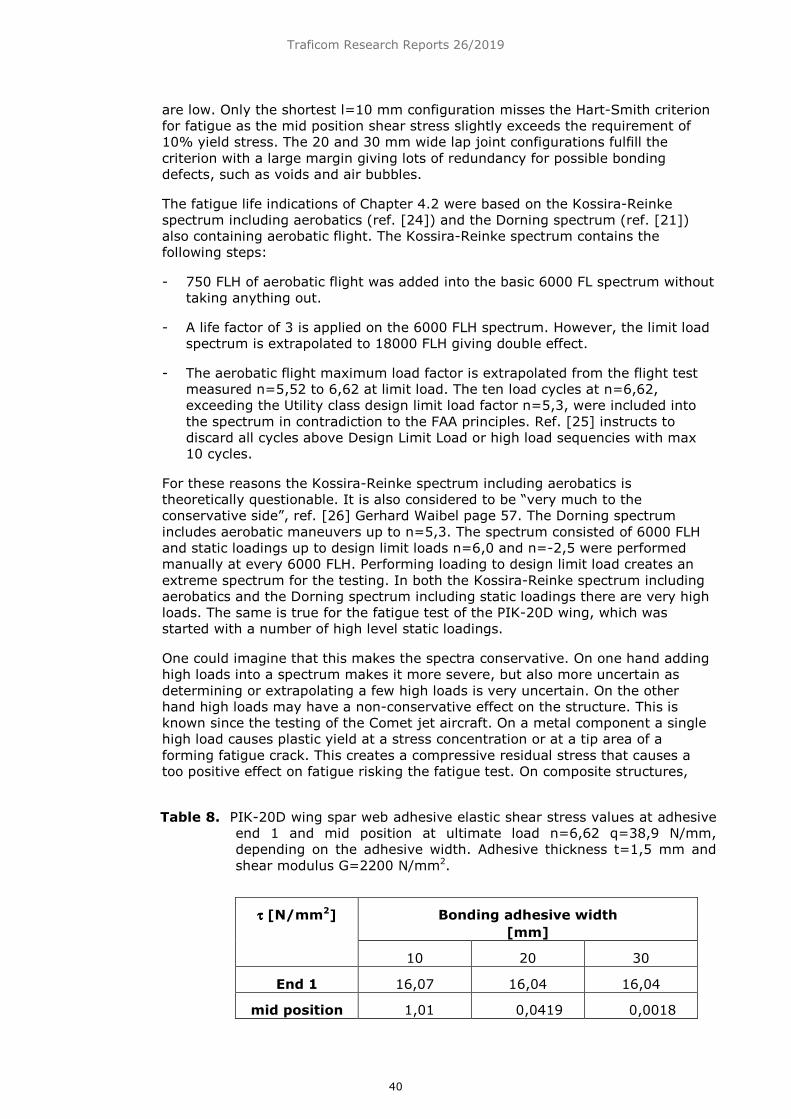
40
are low. Only the shortest l=10 mm configuration misses the Hart-Smith criterion
for fatigue as the mid position shear stress slightly exceeds the requirement of
10% yield stress. The 20 and 30 mm wide lap joint configurations fulfill the
criterion with a large margin giving lots of redundancy for possible bonding
defects, such as voids and air bubbles.
The fatigue life indications of Chapter 4.2 were based on the Kossira-Reinke
spectrum including aerobatics (ref. [24]) and the Dorning spectrum (ref. [21])
also containing aerobatic flight. The Kossira-Reinke spectrum contains the
following steps:
- 750 FLH of aerobatic flight was added into the basic 6000 FL spectrum without
taking anything out.
- A life factor of 3 is applied on the 6000 FLH spectrum. However, the limit load
spectrum is extrapolated to 18000 FLH giving double effect.
- The aerobatic flight maximum load factor is extrapolated from the flight test
measured n=5,52 to 6,62 at limit load. The ten load cycles at n=6,62,
exceeding the Utility class design limit load factor n=5,3, were included into
the spectrum in contradiction to the FAA principles. Ref. [25] instructs to
discard all cycles above Design Limit Load or high load sequencies with max
10 cycles.
For these reasons the Kossira-Reinke spectrum including aerobatics is
theoretically questionable. It is also considered to be “very much to the
conservative side”, ref. [26] Gerhard Waibel page 57. The Dorning spectrum
includes aerobatic maneuvers up to n=5,3. The spectrum consisted of 6000 FLH
and static loadings up to design limit loads n=6,0 and n=-2,5 were performed
manually at every 6000 FLH. Performing loading to design limit load creates an
extreme spectrum for the testing. In both the Kossira-Reinke spectrum including
aerobatics and the Dorning spectrum including static loadings there are very high
loads. The same is true for the fatigue test of the PIK-20D wing, which was
started with a number of high level static loadings.
One could imagine that this makes the spectra conservative. On one hand adding
high loads into a spectrum makes it more severe, but also more uncertain as
determining or extrapolating a few high loads is very uncertain. On the other
hand high loads may have a non-conservative effect on the structure. This is
known since the testing of the Comet jet aircraft. On a metal component a single
high load causes plastic yield at a stress concentration or at a tip area of a
forming fatigue crack. This creates a compressive residual stress that causes a
too positive effect on fatigue risking the fatigue test. On composite structures,
Table 8. PIK-20D wing spar web adhesive elastic shear stress values at adhesive
end 1 and mid position at ultimate load n=6,62 q=38,9 N/mm,
depending on the adhesive width. Adhesive thickness t=1,5 mm and
shear modulus G=2200 N/mm2.
ττττ [N/mm2] Bonding adhesive width
[mm]
10 20 30
End 1 16,07 16,04 16,04
mid position 1,01 0,0419 0,0018
Traficom Research Reports 26/2019
41
especially carbon fibers, the character of deformation is linear up to fracture. A
single high load in a mild stress concentration area would conservatively cause
initial damage. However, in a bolted joint there are high stress concentrations and
a crushing of fibers around the bolt holes both at low and at high level loads. This
leads to a smoothing out of the stress concentration. The crushing due to a small
number of uncertain high loads may cause a too beneficial effect on fatigue
risking the fatigue test. For these reasons it would be wise to follow the FAA
recommendations about the test spectrum.
Hart-Smith (ref. [9]) has studied creep fatigue of bonded aircraft fuselages. Hart-
Smith studied creep fatigue as one flight (of a length from a few minutes to a few
hours) gives one loading cycle when the fuselage is pressurized during the flight.
In hot-wet conditions bonded joints are subject to creep fatigue. It is more critical
than high frequency fatigue as shown by MIL-HDBK-17-3F ref. [10], which quotes
that when a specimen could endure 30 cycles at 1 cycle per hour it could take 10
million loading cycles in high frequency fatigue at 30 Hz. So a lap joint, fulfilling
the Hart-Smith criterion, would be even less critical in high frequency fatigue.

Traficom Research Reports 26/2019
42
6 Conclusions
The dimensioning of wing spar web bonding line has traditionally been based on
simple analysis and low allowables on average shear stress. Fatigue has been
confirmed in fatigue tests of an entire wing. However, it is to be noted, that the
critical loading cases for the web shear appear normally for the sailplane wing
without water ballast, complicating the fatigue testing of the spar web. It is also
to be noted, that a fatigue spectrum should not contain high load sequencies with
a maximum of 10 cycles to avoid plasticity in metal components and a crushing of
fibers due to uncertain high loads.
Analytical expressions were derived for the bonding adhesive elastic and plastic
shear stress and strain distributions. The adhesive compound elastic plastic
model, including the Eccospheres glass micro balloons, was based on material
tests of the adhesive compound and the resin. The calculations show that on PIK-
20D wing spar web the elastic shear stress and strain distributions are of cosh
type with an asymmetry due to different adherend properties. At ultimate load
there is plasticity at one end of the bonding adhesive with constant shear stress
and a parabolic distribution of shear strain. The effect of vertical compression
loads on the web due to wing bending is small compared with the web shear. The
effect was less than 2% on the adhesive shear strain.
Sensitivity analysis on the bonding line width showed, that reducing the width
from 30 mm to 20 mm brought virtually no increase in the adhesive mid or end
position shear stresses. Consequently the 30 mm bonding line is so wide that the
through in the shear distribution gives a good protection against fatigue and
redundancy for possible flaws in the adhesive. Due to the asymmetric adherends
the critical adhesive end is the one at the point where the web skin continues.
Thus the adhesive critical end is visible inside the wing and possible to inspect.
The static dimensioning of PIK-20D wing spar web bonding was based on low
allowable values and an additional safety factor of 2,0, which makes the bonding
adhesive lightly loaded. Fatigue calculations were not performed, but estimates
based on fatigue tests of PIK-20D wing, Janus wing and Hart-Smith fatigue
criterion indicate that there is a long fatigue life. Due to the superior fatigue
properties of the Rütapox L02/SL resin system one would expect fatigue problems
first with sailplanes made of Epikote 162/C260 resin system, if there would be
any.
Traficom Research Reports 26/2019
43
References
[1] OSTIV Airworthiness Requirements for Sailplanes, Organisation Scientifique et Technique
Internationale du Vol a Voile, September 1971, 68 p.
[2] Vorläufige Richtlinien zur Führung des Festigketnachweises für Bauteile aus glasfaser- und
kohlenstoffaserverstärkten Kunsstoffen von Segelflugzeugen un Motorseglern, Luftfahrt-
Bundesamt, Abt. Technick - I/3, Ausgabe Januar 1981, 9 p.
[3] Certification Specifications for Sailplanes and Powered Sailplanes CS-22, European
Aviation Safety Agency, Amendment 2, 5 March 2009.
[4] Adams D., The Hitchhikers Guide to the Galaxy, Pan Books Ltd, 1979.
[5] Kensche C. W., Proposal for a certification procedure of extended sailplane lifetime,
Technical Soaring, April 2002, p. 32...43.
[6] Volkersen O., Die Nietkraftverteilung in Zugbeanspruchten Nietverbindungen mit
Konstanten Laschen-Querschnitte, Luftfahrtforschung 15, 1938, p. 4...47.
[7] Hart-Smith L.J., Adhesive-Bonded Double-Lap Joints, NASA CR-112235, 1973, 106 p.
[8] Eppler R., Heavily Loaded Glued Joints, Technical Soaring, Volume XXII, No 3, 1998, p.
87...90.
[9] Hart-Smith L.J., Further Developments in the Design and Analysis of Adhesive-Bonded
Structural Joints, Douglas Papaer 6922, ASTM Symposium on Joining of Composite
Materials, Minneapolis, 1980, 26 p.
[10] Department of Defence Handbook, Composite Material Handbook, MIL-HDBK-17-3F, 17
June 2002.
[11] Soinne E., PIK-20D fatigue evaluation, Trafi Research Reports 7/2015 Amendment A1,
93 p.
[12] Nyström S., A static and dynamic strength test of a sailplane wing, Helsinki University of
Technology MSc Thesis, 1977, 148 p., (in Swedish).
[13] Soinne E., PIK-20D Wing spar web bonding work notes, Traficom, 20190827, 75 p + App.
[14] Waibel G., Personal communication with Gerhard Waibel at the XXXIII OSTIV Congress in
Benalla, January 2017.
[15] Hart-Smith L.J., Differences Between Adhesive Behavior in Test Coupons and Structural
Joints, Douglas Paper 7066, ASTM Aadhesives Committee D-14 Meeting, Phoenix, Arizona
March 11-13, 1981, 27 p.
[16] Perälä H., Theoretical and experimental determination of the elasticity coefficents of glass
fiber reinforced plastics, Helsinki University of Technology, MSc Thesis, 1975 (in Finnish).
[17] Dimensionieren von Bauteilen aus GFK (Glasfaservverstärkte Kunststoffe), Verein
Deutscher Ingenieure, VDI 2013 Blatt 1, Januar 1970, 20 p.
[18] Vorläufige Dimesionierungswerten für Holme von Segelflugzeugen und Motorseglern,
Luftfahrt-Bundesamt, Stand: 20.August 1981, 10 p.
[19] LBA email 5.6.2019 by Adrian Schwitalla.
[20] Tomblin J., Seneviratne W., Determining the fatigue life of composite aircraft structures
using life and load-enhancement factors, DOT/FAA/AR-10/6, 2011, 115 p.
[21] Patching C.A., Wood L.A., Further fatigue testing of a glass fiber reinforced plastic glider
wing, Technical Soaring Vol. XXI, No. 1, 1998, p. 11...16.
[22] Lumppio K., Life time and usability of a composite aircraft, Helsinki University of
Technology, MSc Thesis, 1997, 149 p. (in Finnish).
[23] Girkmann K., Flächentragwerke, Wien, Springer-Verlag, 1963, 632 p.
[24] Kossira H., Reinke W., Festigkeit von modernen GFK-Konstruktionen für Segelflugzeuge -
Bestimmung eines Belastungskollektives, IFL-IB 84-01 Technische Universität
Braunschweig, 1984, 234 pages.

Traficom Research Reports 26/2019
44
[25] AFS-120-73-2, Fatigue evaluation of wing and associated structure on small airplanes,
Engineering and Manufacturing Division, Airframe Branch, FAA, May 1973, 20 p.
[26] Waibel G., Safe life substantiation for a FRP-sailplane, Technical Soaring, Volume XXVI,
April 2002, page 56...61.

Finnish Transport and Communications Agency Traficom
P.O.Box 320 FI-00059 TRAFICOM, Finland
Tel. +358 295 345 000
traficom.fi
ISBN 000–000–000–000–0
ISSN 0000–0000 (online)