piezometric response in shallow bedrock at cb1 ...eps.berkeley.edu/~bill/papers/111.pdf · displays...
TRANSCRIPT

Piezometric response in shallow bedrock at CB1:
Implications for runoff generation and landsliding
David R. Montgomery,1 William E. Dietrich,2 and John T. Heffner3
Received 6 May 2002; revised 3 June 2002; accepted 25 June 2002; published 6 December 2002.
[1] Experimental observations comparing two steep unchanneled valleys in the OregonCoast Range, one intensively instrumented (CB1) and the other monitored for runoff butwhich produced a debris flow (CB2), shed light on the mechanisms of shallow flow inbedrock, its interaction with the vadose zone, and its role in generating landslides.Previous work at CB1 led to the proposal that during storms pulses of rainfall transmitpressure waves through the vadose zone and down to the saturated zone to create rapidpore pressure response and runoff [Torres et al., 1998]. Here, we document the associatedrapid pore pressure response in the shallow fractured bedrock that underlies thesecolluvium-mantled sites and examine its influence on the generation of storm flow,seasonal variations in base flow, and slope stability in the overlying colluvial soil. Ourobservations document rapid piezometric response in the shallow bedrock and asubstantial contribution of shallow fracture flow to both storm flow and seasonalvariations in base flow. Saturated hydraulic conductivity in the colluvial soil decreaseswith depth below the ground surface, but the conductivity of the near-surface bedrockdisplays no depth dependence and varies over five orders of magnitude. Analysis ofrunoff intensity and duration in a series of storms that did and did not trigger debris flowsin the surrounding area shows that the landslide inducing storms had the greatest intensityover durations similar to those predicted by a simple model of piezometric response.During a monitored storm in February 1992, the channel head at the base of theneighboring CB2 site failed as a debris flow. Automated piezometric measurementsdocument that the CB2 debris flow initiated several hours after peak discharge, coincidentwith localized development of upward spikes of pressure head from near-surface bedrockinto the overlying colluvial soil in CB1. Artesian flow observed exfiltrating from bedrockfractures on the failure surfaces at CB2 further implicates bedrock fracture flow in bothrunoff generation by subsurface storm flow and suggests a connection to landslideinitiation. Our observations show that the timing of shallow landslide initiation can bedelayed relative to both peak rainfall and peak runoff and support the argument that theinfluence of fracture flow on shallow landsliding helps explain the wide variability in theoccurrence of slope instability in topographically analogous locations. INDEX TERMS: 1860
Hydrology: Runoff and streamflow; 1815 Hydrology: Erosion and sedimentation; 1824 Hydrology:
Geomorphology (1625); KEYWORDS: runoff, landsliding
Citation: Montgomery, D. R., W. E. Dietrich, and J. T. Heffner, Piezometric response in shallow bedrock at CB1: Implications for
runoff generation and landsliding, Water Resour. Res., 38(12), 1274, doi:10.1029/2002WR001429, 2002.
1. Introduction
[2] Topographically controlled convergence of subsur-face flow makes hillslope hollows a focus of recurrentlandsliding in steep soil-mantled terrain [e.g., Dietrich andDunne, 1978; Dietrich et al., 1986]. Topographically drivenhydrologic models therefore provide a framework for inter-
preting field observations that shallow landslides typicallyoccur on steep convergent slopes [Reneau and Dietrich,1987; Ellen et al., 1988] and especially at channel heads[Montgomery and Dietrich, 1988]. Models of shallow land-slide initiation generally assume that slope failure occurs ata critical pore pressure or relative soil profile saturation andthe advent of geographical information system (GIS) tech-nology has spawned methods for combining hydrologic andslope stability models to predict locations susceptible todebris-flow initiation and runout using digital topography[Okimura and Ichikawa, 1985; Okimura and Nakagawa,1988; Dietrich et al., 1993, 1995, 2001; Ellen et al., 1993;Montgomery and Dietrich, 1994; Wu and Sidle, 1995;Burton and Bathurst, 1998; Montgomery et al., 1998,2000, 2001]. In most coupled hydrologic-slope stabilitymodels, subsurface storm flow is treated as developing on
1Department of Earth and Space Sciences, University of Washington,Seattle, Washington, USA.
2Department of Earth and Planetary Science, University of California,Berkeley, California, USA.
3Environmental Research, Weyerhaeuser Company, Centralia, Washing-ton, USA.
Copyright 2002 by the American Geophysical Union.0043-1397/02/2002WR001429$09.00
10 - 1
WATER RESOURCES RESEARCH, VOL. 38, NO. 12, 1274, doi:10.1029/2002WR001429, 2002

a subsurface impeding layer (typically assumed to be thesoil–bedrock boundary). This flow is assumed to traveldownslope following surface topography. Several workers,however, have suggested a significant role of shallowfracture flow on landslide initiation [Pierson, 1977; Everett,1979; Wilson and Dietrich, 1987; Mathewson et al., 1990;Montgomery et al., 1997]. A substantial influence of shal-low fracture flow on the piezometric response of colluvialsoils and on debris flow initiation would help to explain: (1)shallow landslides that occur on planar and convex hill-slopes [Reneau and Dietrich, 1987; Ellen et al., 1988]; (2)differences in the timing and occurrence of landslides intopographically similar locations; and (3) variations in thefrequency and location of landslides with bedrock type.Here we document event and seasonal dynamics of near-surface bedrock fracture flow at an experimental catchment,demonstrate the importance of shallow bedrock flow in bothstorm runoff and base flow generation, and present evidencefor an influence on debris-flow initiation.
2. Study Site and Previous Experiments
[3] The study area is located onMettman Ridge roughly 15km north of Coos Bay, Oregon (Figure 1). The MettmanRidge area consists of steep, highly dissected soil-mantledhillslopes and steep channels typical of the Oregon CoastRange. Landslides are a major geomorphic process in theCoast Range where hillslope hollows undergo a cycle of slowcolluvium accumulation and periodic landsliding [e.g., Die-trich and Dunne, 1978;Dietrich et al., 1986]. Many channelsbegin at small landslide scars [Montgomery and Dietrich,1988] and the lower part of hollows may fail more frequentlythan the upper portions [Dunne, 1991]. Highly conductivesoils overlying shallow bedrock on steep slopes of theOregon Coast Range produce rapid increases in pore pressurein topographic hollows during storms [Harr, 1977; Pierson,1980;Montgomery et al., 1997]. Intensive timber harvestingand road construction throughout the range have dramaticallyincreased rates of landsliding and sediment delivery to
downstream channels [Fredriksen, 1970;Brown and Krygier,1971; Beschta, 1978; May, 1998; Montgomery et al., 2000].[4] We instrumented two unchanneled valleys along
Mettman Ridge (Figure 2). The CB1 catchment is a 51 mlong, 860 m2 unchanneled valley with an average slope of43�. The CB2 catchment is a 3270 m2 unchanneled valleywith an average slope of 40�. Both study sites are underlainby relatively flat-lying Eocene sandstone [Beaulieu andHughes, 1975] that produces stoney sandy soils. Thecedar-hemlock forest native to the study area was clear-cut in 1987 and replanted with Douglas fir in 1988. Annualrainfall averages about 1500 mm, falling mostly during thewinter wet season. The near-surface bedrock is variablyfractured and weathered, and thin soils on topographicnoses generally increase to 1.4–2.0 m thick along thehollows [Montgomery et al., 1997] but with considerablelocal variability in soil thickness due to tree throw andanimal burrows [Schmidt, 1999; Heimsath et al., 2001]. Soilproperties are typical of those reported for Coast Rangesoils developed on sandstone [e.g., Harr and Yee, 1975;Schroeder and Alto, 1983]. A weir installed at the base ofCB2 monitored runoff from December 1989 until February1992 when it was destroyed by a debris flow.
Figure 1. Location map for the Mettman Ridge study areanear Coos Bay, Oregon.
Figure 2. Map of the CB1 and CB2 catchments onMettman Ridge; solid squares indicate the upper and lowerCB1 weirs, and the CB2 weir. A–A0 indicates location ofprofile shown in Figure 4; B–B0 indicates location of profileshown in Figure 13. Small squares represent location ofweirs. Shaded pattern in CB2 represents 1992 landslidescarp.
10 - 2 MONTGOMERY ET AL.: PIEZOMETRIC RESPONSE IN SHALLOW BEDROCK AT CB1

Figure 3. Map of CB1 showing location of bedrock piezometers; automated piezometer nests shown asopen circles, other bedrock piezometers shown as black squares, and soil piezometers as small solidcircles. Also shown are the catwalks, stairs and trails constructed at the site, as well as the location ofautomated rain gauges (open squares) and the upper CB1 weir. Contour interval = 1 m.
MONTGOMERY ET AL.: PIEZOMETRIC RESPONSE IN SHALLOW BEDROCK AT CB1 10 - 3

[5] An extensive piezometer array was installed at CB1prior to a series of applied rainfall experiments in 1990[Montgomery et al., 1997, Experiments 1 and 2], andexpanded to include a denser array in the soil, piezometersinstalled into bedrock, and a 35 m deep well on the ridge crestprior to subsequent experiments in 1992 (Figures 3 and 4).Piezometers were installed in 50.8-mm (2 inch) diameterborings and constructed of 25.4-mm (1 inch) diameter PVCpipe, of which the bottom 0.1 m was slotted using a hacksaw.Piezometers were installed on a thin (i.e., <0.01 m thick) bedof sand which was also used to backfill around the slottedsection of pipe. A bentonite cap was emplaced on top of thesand and native material was used to backfill the rest of eachboring. For the 10�3 to 10�4 m s�1 hydraulic conductivity ofthe colluvial soil atMettmanRidge [Montgomery et al., 1997],Hvorslev’s [1951] analysis indicates that the lag time requiredfor piezometers to achieve 90% response to a change inpressure head is less than the 10 to 20 minute logging intervalrecorded by data loggers for the automated piezometers.[6] Weirs installed at the base of CB1 and along the
downslope colluvial channel monitored runoff from Decem-ber 1989 until November 1996, when they too weredestroyed by a debris flow. Additional details of the experi-ments, including artificial rainfall application and discussionof the results of tracer and tensiometer studies are presented
elsewhere [Anderson et al., 1997; Montgomery et al., 1997;Torres et al., 1998]. This paper presents the first analysis ofsaturated pore pressure response to a third applied rainfallexperiment conducted in 1992.
2.1. Experiments 1 and 2
[7] Observations from these experiments and naturalstorms document that runoff generation occurs by subsur-face storm flow. The sprinkling experiments showed thatsteady state runoff began from CB1 after piezometricpotential reached steady state throughout the soil profileand that a steep soil moisture–pressure head relation allowsthe soil to transmit rapid pressure changes from pulses ofrainfall at the ground surface through the unsaturated soilprofile [Torres et al., 1998], even though the applied watermoves as vertical piston-like unsaturated flow [Anderson etal., 1997]. During typical rainfall events, matric potentialthroughout the soil profile approaches zero [Torres et al.,1998] and a narrow, discontinuous zone of positive porepressure develops at the base of the soil profile along thehollow axis [Montgomery et al., 1997], with a small areanear the channel head delivering runoff to the upper CB1weir [Anderson et al., 1997; Montgomery et al., 1997].Exfiltrating head gradients develop locally from the bedrockinto the colluvial soil in response to intense rainfall and the
Figure 4. Long profile down CB1 showing location of piezometer nests referred to in text. Profilecorresponds to A–A0 on Figure 2.
10 - 4 MONTGOMERY ET AL.: PIEZOMETRIC RESPONSE IN SHALLOW BEDROCK AT CB1

discontinuous zone of saturation during the steady staterunoff of Experiments 1 and 2 was interpreted to reflect aninterplay between flow in the colluvial soil and underlyingfractured bedrock [Montgomery et al., 1997]. Installation ofpiezometers drilled into the bedrock at CB1 after the 1990experiments allowed us to examine near-surface bedrockresponse in subsequent experiments and natural rainfall.
3. Experiment 3
[8] Experiment 3 essentially repeated the steady, low-intensity precipitation applied during Experiment 1 [seeMontgomery et al., 1997], with an applied precipitationintensity of 1.65 ± 0.20 mm hr�1 sustained from 1000 hUT on 27 May through 0815 h UT on 3 June 1992. Dirunalfluctuations in discharge and pore pressure response duringsteady precipitation reflect variations both in evapotranspira-tion and in applied precipitation delivery due to dailyvariations in wind speed. During Experiment 3, runoff fromthe upper CB1 weir collected discharge from the colluvialsoil that emerged at the channel head. Discharge that passedthrough the upper weir was routed around the lower weir.Hence, during the applied precipitation experiment the lowerCB1 weir collected only water that flowed through thefractured bedrock beneath the upper CB1 weir and emergeddownhill as spring flow. The total runoff through the twoCB1 weirs during Experiment 3 accounted for 1.06 ± 0.15mm hr�1, 64% of the applied precipitation rate. Each of theCB1 weirs accounted for approximately a third of the appliedprecipitation rate (Figure 5). At this low-intensity rate ofapplied precipitation approximately half of the net runofffrom CB1 follows a bedrock flowpath and emerges as springdischarge below the upper weir, with the remaining third ofthe applied precipitation accounted for by evapotranspirationand recharge of the local bedrock groundwater table.[9] The pattern of saturation in the colluvial soil was
nearly identical to that observed in response to the similarapplied rainfall intensity of Experiment 1 (Figure 6). As inExperiment 1 [Montgomery et al., 1997], four separatepatches of saturated response developed in the colluvialsoil during Experiment 3, and one of these areas wasdownslope and outside of the weir wings (which were
sealed to bedrock). Hence, the expanded number of soilpiezometers used in Experiment 3 document that the spatialgaps in response in the colluvial soil observed in Experiments1 and 2 arose from a discontinuous pattern of saturation alongthe hollow axis, rather than from gaps in the originalpiezometer coverage. In contrast to the discontinuous satu-ration in the colluvial soil, the bedrock piezometers show amore continuous pattern. As for the soil response, the zone ofbedrock response appears to be restricted to along the hollowaxis. Hence, a perched water table that forms within thefractured bedrock locally supports a discontinuous saturatedzone within the overlying colluvial soil. These observations,combined with tracer and solute monitoring [Anderson et al.,1997], indicate that nearly all the runoff from CB1 passesthrough the bedrock before emerging from the soil at theupper CB1 weir or directly out of the bedrock between theupper and lower weirs.[10] We conducted falling head conductivity tests on all
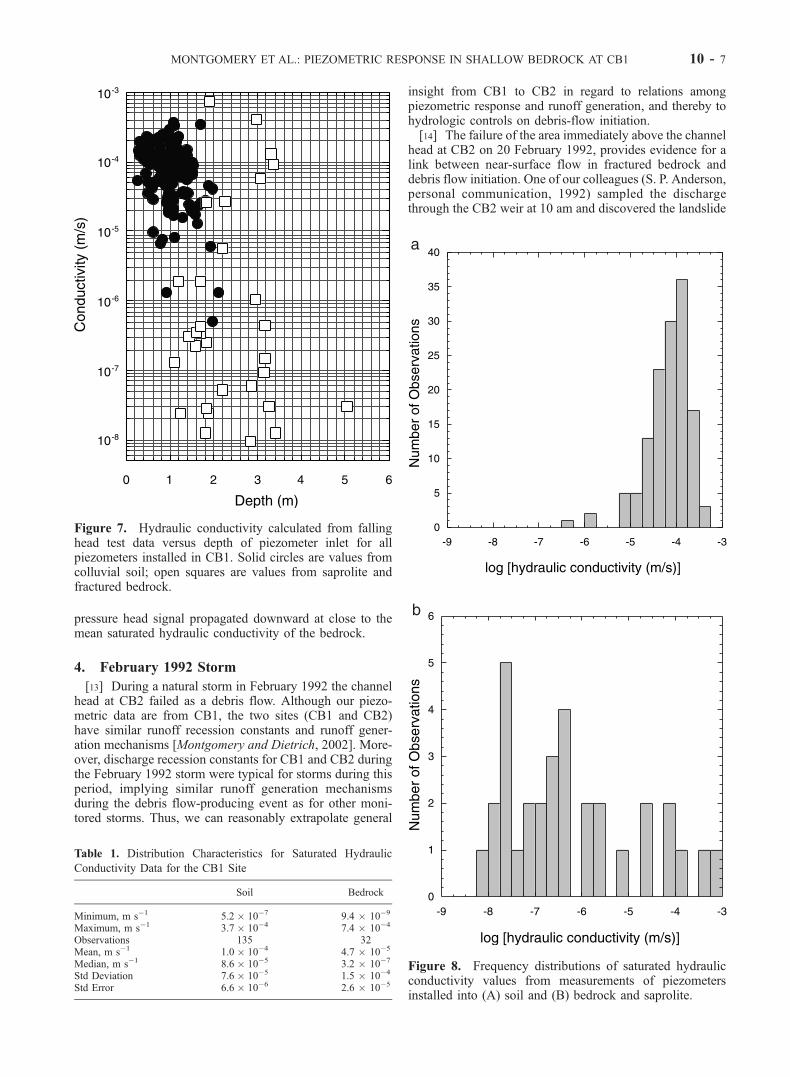
piezometers at CB1 during steady state response in thesecond half of Experiment 3 when most tensiometers on siteread close to zero pressure head [Torres et al., 1998]. Testswere conducted by filling piezometers with water andmeasuring the rate of drawdown with a pressure transducerthat recorded water level every 5 s, or by hand for slowdraining piezometers. Saturated conductivity varies widely,but there are significant differences in the trends with depthfor soil and bedrock piezometers (Figure 7). The hydraulicconductivity values for soil piezometers display an inversecorrelation with piezometer inlet depth, varying from 10�3
to 10�4 m s�1 in shallow pipes to about 10�6 m s�1 in thedeepest piezometers, with a mean value of 10�4 m s�1. Incontrast, bedrock and saprolite conductivities have a slightlylower mean value (4.7 � 10�5 m s�1), but exhibit norelation to depth over five orders of magnitude (10�3 to10�8 m s�1). There is substantial variability in hydraulicconductivity at CB1, with roughly 2 orders-of-magnitudevariation for piezometers at equal depth in the soil profile,and almost 5 orders-of-magnitude variability for bedrockpiezometers installed at the same depth. Hence, there arestrong contrasts in the variability and trend of hydraulicconductivity between the colluvial soil and near-surfacebedrock: conductivity of the colluvial soil systematicallydecreases with depth, whereas the conductivity of the nearsurface bedrock is much more variable and is not system-atically related to depth below the ground surface (Table 1).Moreover, the soil and bedrock conductivity distributionsexhibit the opposite skewness (Figure 8). The right skeweddistribution of soil conductivity implies that the colluvialsoil is highly conductive in general with a few zones of lowconductivity, whereas the left skewed distribution of bed-rock conductivity indicates that the bedrock is poorlyconductive in general with a few zones of high conductivity.Consequently, we would expect to find large spatial varia-bility in the bedrock flow component of near surfacehydrologic response with substantial flow concentration ina few areas of high conductivity.[11] Patterns of bedrock piezometer response during
Experiment 3 indicate that a variety of gradients acrossthe bedrock/colluvium contact characterized places wheresaturated zones developed in the colluvial soil. For example,the response of the piezometer nest at the upper CB1 weir(see Figure 3a for location of piezometer nests) indicates
Figure 5. Precipitation and runoff during Experiment 3from the upper CB1 weir (DW1) and the lower CB1 weir,lcoated along the downslope colluvial channel.
MONTGOMERY ET AL.: PIEZOMETRIC RESPONSE IN SHALLOW BEDROCK AT CB1 10 - 5

development of both a perched zone of saturation just abovethe colluvium–bedrock contact and deeper flow in thefractured bedrock (Figure 9a). The perched nature of thesaturation in the colluvial soil is apparent in the response ofpiezometer nest 0-1 which shows substantial response eventhough the shallowest bedrock piezometer remained dry.The response of soil nest 5-3 and bedrock nest B-13 (3 mdeeper) indicate slight exfiltrating gradients developed fromthe fractured rock into the soil until a bromide injection test[Anderson et al., 1997] in the middle of the experimentinterrupted the signal. In contrast, the response at soil nest7-6 and bedrock nest B-12 show consistent infiltratinggradients throughout the experiment (Figure 9c). Thesedifferent styles of response document the styles of soil–bedrock flow coupling inferred from the response of soilpiezometers in Experiment 1 [Montgomery et al., 1997]. Inaddition, even though flow through the sprinklers was heldat a constant application rate, most of the piezometersdisplayed diurnal pore pressure oscillations driven by var-iations both in evapotranspiration and in precipitation deliv-ery to the site due to the daily rise of afternoon winds.Hence, observations from Experiment 3 document that the
piezometric response to even low-intensity rainfall canextend well beyond the penetration depth of the appliedrainfall, as strong piezometric response was recorded inpiezometers installed meters into bedrock even though atracer included in the applied rainfall advanced only 0.2–0.3 m after its introduction during Experiment 3 [Andersonet al., 1997].[12] In addition, the deep well at the head of CB1 (Figure
2) exhibited a delayed but pronounced response to Experi-ment 3 (Figure 10). Prior to the start of Experiment 3, andduring the first several days of the experiment, the waterlevel in the well fell at a rate of 0.06 m day�1. On 1 June,however, the water level in the well began to rise, continuedto rise throughout the experiment, and then began to fallagain one to two days after the sprinklers were turned off.The 3 to 4 day lag before the onset of irrigation wasrecorded at the water table 19.5 m below the ground surfaceimplies that the signal propagated downward at a rate ofabout 5.6 � 10�5 m s�1 to 7.5 � 10�5 m s�1. The responseof the deep well shows that piezometric response at CB1extended far beyond the depth to which the applied rainfallpenetrated over the course of our experiments and that the
Figure 6. Zones of positive pore pressure response recorded in both manual and automated piezometersinstalled into (A) colluvial soil and (B) bedrock. North is to the bottom of the figure.
10 - 6 MONTGOMERY ET AL.: PIEZOMETRIC RESPONSE IN SHALLOW BEDROCK AT CB1
pressure head signal propagated downward at close to themean saturated hydraulic conductivity of the bedrock.
4. February 1992 Storm
[13] During a natural storm in February 1992 the channelhead at CB2 failed as a debris flow. Although our piezo-metric data are from CB1, the two sites (CB1 and CB2)have similar runoff recession constants and runoff gener-ation mechanisms [Montgomery and Dietrich, 2002]. More-over, discharge recession constants for CB1 and CB2 duringthe February 1992 storm were typical for storms during thisperiod, implying similar runoff generation mechanismsduring the debris flow-producing event as for other moni-tored storms. Thus, we can reasonably extrapolate general
insight from CB1 to CB2 in regard to relations amongpiezometric response and runoff generation, and thereby tohydrologic controls on debris-flow initiation.[14] The failure of the area immediately above the channel
head at CB2 on 20 February 1992, provides evidence for alink between near-surface flow in fractured bedrock anddebris flow initiation. One of our colleagues (S. P. Anderson,personal communication, 1992) sampled the dischargethrough the CB2 weir at 10 am and discovered the landslide
Figure 7. Hydraulic conductivity calculated from fallinghead test data versus depth of piezometer inlet for allpiezometers installed in CB1. Solid circles are values fromcolluvial soil; open squares are values from saprolite andfractured bedrock.
Table 1. Distribution Characteristics for Saturated Hydraulic
Conductivity Data for the CB1 Site
Soil Bedrock
Minimum, m s�1 5.2 � 10�7 9.4 � 10�9
Maximum, m s�1 3.7 � 10�4 7.4 � 10�4
Observations 135 32Mean, m s�1 1.0 � 10�4 4.7 � 10�5
Median, m s�1 8.6 � 10�5 3.2 � 10�7
Std Deviation 7.6 � 10�5 1.5 � 10�4
Std Error 6.6 � 10�6 2.6 � 10�5
a
b
Figure 8. Frequency distributions of saturated hydraulicconductivity values from measurements of piezometersinstalled into (A) soil and (B) bedrock and saprolite.
MONTGOMERY ET AL.: PIEZOMETRIC RESPONSE IN SHALLOW BEDROCK AT CB1 10 - 7

a
Figure 9. Piezometric response of three piezometer nests with pipes installed into near-surface bedrockduring Experiment 3: (A) soil nest 0-1 and bedrock nest B4; (B) soil nest 5-3 and bedrock nest B13; and(C) soil nest 7-6 and bedrock nest B12. First vertical column on right of figure shows elevation ofpiezometer inlets and the second shows the elevation of the contact between colluvial soil (Qc) andbedrock (BR). Ground surface elevation corresponds to top of each graph.
10 - 8 MONTGOMERY ET AL.: PIEZOMETRIC RESPONSE IN SHALLOW BEDROCK AT CB1

upon returning at 1540 h UT. The resulting debris flowtraversed the steep first-order bedrock channel through ahigh-angle tributary junction, and deposited behind an accu-mulation of logs incorporated in the deposits of previousdebris flows. The data logger was intact and running whenrecovered from the deposit the followingmorning, document-ing both when and at what stage the debris flow mobilized.[15] The February 1992 storm was the largest event since
continuous monitoring of the site began in late 1989. Thelandslide-inducing storm commenced with a series of low-intensity rainfall pulses that culminated in a peak intensity
of 15.5 mm hr�1 at 7 am on 20 February and ended abruptlythereafter (Figure 11). The peak discharge of 3.9 l s�1 wassustained from 1000 to 1130 h UT, from 3 to 4.5 hours afterpeak rainfall. Slope failure, as recorded by termination ofthe CB2 discharge record, occurred at 1330 h UT, 2 to 3.5hrs after the peak discharge (6.5 hours after peak rainfall)and at a discharge that the site experienced twice before inthe 3 years of discharge data from CB2. This delay betweenpeak discharge and slope failure could reflect either a timedelay between peak runoff and peak pore pressure develop-ment, or a time-dependent transition of an initial transla-
Figure 9. (continued)
Figure 10. Response of the well located at the top of CB1 to applied rainfall during Experiment 3,expressed as the height of the water table below the ground surface.
MONTGOMERY ET AL.: PIEZOMETRIC RESPONSE IN SHALLOW BEDROCK AT CB1 10 - 9

tional failure into a debris flow. The 24-hr rainfall on 20February was 53 mm and a total of 121 mm of rain fellduring the four day storm sequence. Rainfall of 53 mmday�1 has an approximately 1-year recurrence intervalbased on comparison with long-term rain gauge records atNorth Bend, Oregon. Hence, even though the storm thatcaused failure of the channel head at CB2 was the largest inthe 3 year record, it was not an extraordinary event.
4.1. CB2 Debris Flow
[16] The colluvium upslope of the CB2 channel headfailed to bedrock, leaving a scar 1 m deep, 6.5 m wide,and 15 m long. Tension cracks extending laterally outwardinto the unfailed slope on either side of the headscarpindicate the initial movement of a larger volume of collu-vium than mobilized as the debris flow. When first examinedabout 2 hours after failure, the headscarp hosted a seepageface and water gushed from bedrock fractures exposed at thebase of the scar (S.P. Anderson, personal communication).The debris flow initially traveled straight downslope andthen deposited along a steep (25�) channel after traversing anapproximately 50� planform tributary junction (Figure 12).
a
b
c
Figure 12. Topographic map of the 1992 CB2 landslidebased on field surveys conducted with a total station digitaltheodolite. Contour interaval is 1 m. Arrow from closedcircle to open circle connects initial location of CB2 weirand data logger to location in which the data logger wasrecovered after the 1992 debris flow.
Figure 11. (opposite) (A) Hourly and cumulative rainfallfor 17 through 21 February 1992, recorded at CB1. (B)Discharge record for the CB1 upper weir for 17 through 21February 1992. (C) Discharge record for CB2 for 17through 21 February 1992. Termination of the dischargerecord records initiation of the CB2 debris flow.
10 - 10 MONTGOMERY ET AL.: PIEZOMETRIC RESPONSE IN SHALLOW BEDROCK AT CB1

[17] A series of cross-sections surveyed on the day afterthe debris flow using a hand level, stadia rod and fiberglasstape reveals that the debris flow traveled rapidly oncemobilized. The edge of the debris-flow path was plainlydemarcated by mud, debris and disturbed vegetation. Theouter side of the debris flow elevated as it rounded thetributary confluence, allowing estimation of its mean veloc-ity from the elevation difference between the flow surfaceon the inside and outside of the bend following the methoddiscussed by Costa [1984]. Calculations based on fieldmeasurements of the width of the debris flow, the radiusof curvature through the bend, and the down channel slopeindicate a velocity of about 9 m s�1, implying a travel timeof roughly 2 s to the CB2 weir.[18] Charcoal samples collected from both the debris-
flow headscarp and a soil pit excavated in the upslopehollow constrain the history of previous landsliding atCB2 (Figure 13). A small sample of detrital charcoalcollected from the soil/bedrock contact at a depth of 2 myielded a 14C date of 4070 ± 90 b.p. (CAMS 160). Detritalcarbon fragments collected from the base of the colluvialsoil exposed in the headscarp of the debris flow yielded a14C date of 630 ± 110 b.p. (BETA 81760). The differentages for basal charcoal from the channel head and furtherupslope indicate that either the channel head experiencedmore recent failure than locations upslope, or the hollowprogressively filled from upslope over several thousandyears.
4.2. Piezometric Response
[19] Data recorded by automated piezometers documentthe hydrologic response of CB1 to the debris-flow producingstorm. Again, the response of pressure transducers installedin nests with piezometers in both soil and bedrock documentsubstantial response in the fractured bedrock. At some nests,return flow from bedrock influenced the generation of porepressures in excess of hydrostatic in the colluvial soil. Inother nests the near-surface bedrock acted as a drain beneath
the colluvial soil. As shown below, piezometric responseduring the February 1992 storm documents significant spatialvariations in shallow bedrock response.[20] Automated piezometer nests provide a continuous
record of piezometric response along the hollow axis atCB1. The discharge response closely tracks the pressurehead response at nest 0-1 located immediately upslope ofthe channel head and the upper weir. The correlationbetween pressure head at nest 0-1 and discharge throughthe upper weir for the period from 18 through 22 February(R2 = 0.77, n = 578) is comparable to relations fromprevious natural and applied rainfall events [Montgomeryet al., 1997]. Piezometer nest 0-1 exhibited infiltratinggradients through the storm and hydrostatic gradients duringwaning response, but discharge was greater for the samepressure head near the base of the soil during the fallinglimb of the storm hydrograph, suggesting a local bedrockflow contribution to the CB1 weir during peak dischargeand recession.[21] The deeper automated bedrock nest B4, located
downslope and outside of the sealed weir wings, respondedto the storm (Figure 14a). While the shallowest bedrockpiezometer in this nest (B-4a) did not record saturatedconditions during the storm, the deepest piezometerrecorded pressure head of roughly 1 meter prior to thestorm and increased by about a meter during the storm.During peak response on 20 February, total head in thelower piezometer exceeded the elevation of the upper, drypiezometer, documenting exfiltrating gradients indicative ofvertical upward flow from deeper bedrock toward the near-surface fractured bedrock.[22] Data from bedrock nest B13 and soil nest 5-3,
located near the center of the site, recorded the oppositerelation (Figure 14b). Here piezometric gradients indicateflow from the fractured bedrock into both the overlying soiland deeper bedrock, as the gradient between the two bed-rock piezometers was an infiltrating gradient while simulta-neously there was an exfiltrating gradient from the shallowbedrock to the overlying soil. Hence, the fractured bedrockacted like a source that delivered water from upslope to thebase of the colluvial soil. Exfiltrating gradients alsooccurred between the two deepest soil piezometers at thisnest during intense rainfall in 1990 [Montgomery et al.,1997].[23] The combined response of bedrock nest B12 and soil
nest 7-6 reveals infiltrating gradients throughout the storm(Figure 14c). Comparable spatial variability in the style ofpiezometric response along the hollow axis at CB1 occurredduring other natural storm events and applied rainfall. In all,these data from the colluvial soil, shallow fractured bedrock,and deeper rock document that the piezometric response ofnear-surface, fractured bedrock can be quite responsive andis highly variable during natural storm events.[24] The well at the top of CB1 exhibited a substantial
response to the debris flow inducing February 1992 storm(Figure 15). The well began to respond during the storm andcontinued to rise for several days after the storm, showing atotal rise of about 1.5 m in response to the storm. The timelag between peak rainfall and peak well response was again3 to 4 days, implying a pore pressure-propagation velocitycomparable to the mean hydraulic conductivity of the bed-rock. In addition, the well level dropped slowly after the
Figure 13. Surveyed longitudinal profile of CB2 showinglocation of samples collected for 14C dating of detritalcharcoal and the location of the CB2 weir. Profile runs fromB to B0 on Figure 2.
MONTGOMERY ET AL.: PIEZOMETRIC RESPONSE IN SHALLOW BEDROCK AT CB1 10 - 11

Figure 14. Piezometric response at CB1 for three piezometer nests with pipes installed into near-surfacebedrock during the debris flow producing storm in February 1992: (A) soil nest 0-1 and bedrock nest B4.Dashed line for piezometer B-4 indicates no response. (B) soil nest 5-3 and bedrock nest B13; and (C)soil nest 7-6 and bedrock nest B12. Vertical columns on right of figure show elevation of piezometerinlets and the contact between colluvial soil (Qc) and bedrock (BR). Ground surface elevationcorresponds to top of each graph.
10 - 12 MONTGOMERY ET AL.: PIEZOMETRIC RESPONSE IN SHALLOW BEDROCK AT CB1

storm, indicating a lasting influence of recharge to theshallow groundwater table due to this runoff producingevent.
4.3. Pressure Head Propagation
[25] Least squares linear regression of data from CB1during the February 1992 storm indicates that the time lag
between peak rainfall and peak piezometric response isindependent of distance upslope from the upper weir (R2 =0.02, p = 0.48) but increases with depth below the groundsurface (R2 = 0.42, p < 0.001) (Figure 16). Torres et al.[1998] showed that pressure head throughout the colluvialsoil rapidly attained values close to zero during the sprin-
Figure 14. (continued)
Figure 15. Response of the well located at the top of CB1to the February 1992 storm, expressed as the height of thewater table below the ground surface.
Figure 16. Lag time (hr) between peak rainfall and peakpiezometric response for CB1 during the debris flowproducing storm in February 1992 versus depth belowground surface, D (m). Least squares linear regressionyields: Lp = 1.171 + 1.411 D; R2 = 0.42, p < 0.001.
MONTGOMERY ET AL.: PIEZOMETRIC RESPONSE IN SHALLOW BEDROCK AT CB1 10 - 13

kling experiments, even though the volumetric water con-tent remained far from saturated. Hydraulic conductivityvaries greatly in partially saturated soil, and hence lineardiffusion models for predicting pressure head response to apulse of rain do not apply [e.g., Haneberg, 1991; Reid,1994; Baum and Reid, 1995]. The time lag between peakrainfall and peak piezometric response indicates that thetimescale of piezometric response at CB1 varies from <1 to10 hr.[26] Iverson [2000] used a linear diffusion approach to
analyze the timescales pertinent to landslide triggering byrainfall infiltration and found that the quasi-steadygroundwater response time given by the minimum time totransmit lateral pore pressures to a point can be approxi-mated by A/D0, where A is the upslope contributing area (m2)and D0 is the hydraulic diffusivity (m2 t�1) (taken as theproduct of the average saturated conductivity and soildepth). He also found that the timescale for slope-normalpropagation of pore pressures from the ground surface to adepth H is given by H2/D0. Iverson proposed using H = 1 m,A= 100 m2 and aD0 = 10�3 m2 s�1 to estimate A/D0� 1 dayand H2/D0 = 3 hr for CB1. These values predict rainfalldurations longer than 24 hours would not be expected tostrongly influence landslide initiation at this site and rainfallintensity over <3 hours duration should most stronglyinfluence landslide initiation. Rainfall intensity and durationdata from a series of four storms, two of which triggeredlandslides along Mettman Ridge in the winter of 1990[Montgomery, 1991], show that those storms with the high-est 10 minute to 2 hour rainfall intensity triggered landslideswhereas one of the two storms with the greatest intensity for>24 hours duration did not trigger debris flows (Figure 17).Hence, the general timescales predicted by Iverson [2000]agree reasonably well with those observed for Mettman
Ridge, even though the assumption about near-saturatedconditions is violated.[27] This agreement, however, is very sensitive to the
parameter values selected by Iverson for his analysis. Usingthe actual drainage area of CB1 (860 m2), a soil depth of 1 m,and the mean soil conductivity of 1 � 10�4 m s�1, yieldsestimates of A/D0 = 100 days and H2/D0 = 30 hr CB1.Moreover, as K in the colluvial soil varies from 10�3 to10�4 m2/s andH varies from 0.5 to 2.0 m, thenD0 (calculatedas K � H) varies locally at CB1 from about 2.5� 10�5 m2s�1
to 4� 10�3m2s�1; these values would imply that the range ofestimated values for A/D0 spans 2.5 to 398 days and H2/D0
ranges from 1 minute to 2 days across CB1. Hence, thevariability in soil depth and hydraulic diffusivity is highenough that the uncertainty on such predictions is greaterthan an order of magnitude, and essentially spans the entirespectrum of concern for debris flow hazard applications.Nonetheless, such analyses show that the timescale thatdominates the pore pressure response of CB1 is that forvertical propagation of pore pressure response from theground surface to the saturated zone.
5. Seasonal Response
[28] Seasonal records of piezometric response show con-sistent event-driven response in the fractured bedrock thatcan approach 1 m during relatively common storms, even inpiezometers installed several meters into bedrock. Someresponse is seen in most of the bedrock piezometers duringmost storm sequences, but exfiltrating gradients developonly in particular nests during the largest storms. Althoughour data provide only a fragmentary record of the seasonalresponse, the depth to the water surface in the well varied byover 7 m in 1992, demonstrating substantial variability inthe water depth at the ridge crest. Piezometric records fromthe top, middle, and bottom of CB1 characterize spatialdifferences in the seasonal dynamics of near-surface bed-rock response.[29] The seasonal record for the bedrock piezometer nests
shows a similar response to storm events throughout theyear (Figure 18). Most of the bedrock piezometers have a‘‘base’’ head level from which the piezometric potentialquickly rises and then returns to after storms. In addition,the total head increase is surprisingly similar for a variety ofstorms. Wilson and Dietrich [1987] observed a similartendency for pressure heads to reach common values indifferent storms for the case where saturated overland flowdrained seepage and prevented greater head development.Similarly at Coos Bay, perhaps, the water exfiltrating fromthe bedrock is drained by the highly conductive colluvialsoil, thereby preventing high heads from developing.[30] The piezometer nest at the base of the slope (Figure
18a) records development of a perched water table in thecolluvial soil, as the middle bedrock piezometer installedimmediately below the soil/bedrock contact (not shown)remained dry during the entire year, even though the deepestbedrock piezometer exhibited up to 1.5 m of pressure headresponse during winter storm events. The piezometricresponse of soil nest 5-3 and bedrock nest B-13 (Figure18b) illustrates significant seasonal variation in the cou-pling of flow in soil and underlying fractured bedrock.During midwinter storms, exfiltrating gradients developfrom the shallow bedrock into the overlying soil, whereas
Figure 17. Maximum 10-minute to 10-day rainfallintensity for four 1990 storms; solid circles are for stormsduring which debris flows occurred along Mettman Ridge(January and April), and open circles are for storms that didnot cause debris flows (February and March).
10 - 14 MONTGOMERY ET AL.: PIEZOMETRIC RESPONSE IN SHALLOW BEDROCK AT CB1

Figure 18. Piezometric response of three piezometer nests with pipes installed into near-surfacebedrock during hydrologic year from October 1992 through September 1993: (A) soil nest 0-1 andbedrock nest B4; (B) soil nest 5-3 and bedrock nest B13; and (C) soil nest 7-6 and bedrock nest B12.Vertical columns on right of figure show elevation of piezometer inlets and the contact between colluvialsoil (Qc) and bedrock (BR). Ground surface elevation corresponds to top of each graph.
MONTGOMERY ET AL.: PIEZOMETRIC RESPONSE IN SHALLOW BEDROCK AT CB1 10 - 15

the response is primarily infiltrating during the earlyseason. Although the piezometric response of soil nest 7-6 and bedrock nest B12 (Figure 18c) also shows dramaticstorm response in the bedrock piezometers, piezometricgradients remain infiltrating. These three piezometer nestsexhibit styles of piezometric response that differ from eachother but remained consistent through our sprinklingexperiments, natural storms, and seasonal variations inrainfall.
6. Discussion
[31] The great variability in saturated hydraulic conduc-tivity, and particularly the lack of any relation to depthwithin bedrock means that there will be substantial hetero-geneity to near surface hydrologic response. This lack of adepth dependence conflicts with the assumptions in TOP-MODEL [Beven and Kirkby, 1979] and most applications ofother models of hillslope hydrology [e.g., O’Loughlin,1986]. Our results indicate that assuming either a simpledepth dependent, or spatially constant hydraulic conductiv-ity could mask dynamics with significance for runoffgeneration and landsliding. If bedrock fractures controlpressure head in bedrock, as well as locally in the overlyingcolluvial soil, and knowledge of the fracture distribution andcharacteristics is practically impossible to obtain, then useof dynamic hydrologic models to predict the specificlocations of shallow landslides may prove no more insight-ful for hazard assessment than interpretation of simpletopographically driven models used to predict zones of highlandslide potential.[32] Our finding that many of the shallower bedrock
piezometers show short time delays to peak rainfall demon-
strates rapid piezometric response without full soil saturation.Such rapid response reflects a steep soil characteristic curvesuch that the conductivity increases rapidly as the moistureincreases [Torres et al., 1998]. Anderson et al. [1997] foundthat in Experiment 3, the water moved as plug flow at a rateclose to the precipitation rate (corrected for porosity) asexpected from unsaturated flow theory. Hence, our observa-tions establish that the timescale of piezometric response inshallow bedrock, and the consequent runoff generation bysubsurface storm flow, is much faster than the transit time forwater moving through the soil. The porosity correctedvelocity for propagation of precipitation into the soil (1.65mm hr�1/0.5 = 3.3 mm hr�1) is roughly 1% of the 290 mmhr�1 velocity implied by the roughly 7 hours required forpiezometric response to travel through the approximately 1 mdeep soil and another 1 m into bedrock. This rapid responseof the shallow bedrock demonstrates the rapid transmissionof pressure waves through unsaturated soil to influence thepiezometric response in the underlying fractured rock.[33] The groundwater table is very high at CB1 because of
the low conductivity and negligible storage in the deep,unweathered bedrock beneath the site. This shallow andresponsive water table interacts with the steep topographyto control the location of the channel head at the base of CB1and likely influences locations where positive pore pressuresdevelop in the colluvial soil. The position of the onset ofstreamflow at the base of CB1 remained relatively stationary,whereas the water table in the well at the ridgetop varies bymany meters over a year. This variation indicates a potentialfor interaction between the local perched water table in thecolluvial soil and the deeper groundwater table to changethrough the year as the storage in the intervening materialfills. Maximum coupling between the response in near-sur-
Figure 18. (continued)
10 - 16 MONTGOMERY ET AL.: PIEZOMETRIC RESPONSE IN SHALLOW BEDROCK AT CB1

face fractured rock and the colluvial soil would occur duringstorms when antecedent soil moisture is high and the avail-able bedrock storage is low. The seasonal changes in thewater table at the ridgetop imply that base flow at the site isnot fed by lateral unsaturated flow (as commonly assumed forsteep hillslopes) but by slow vertical unsaturated flow andlateral drainage of the near-surface bedrock.
6.1. Role of Near-Surface Fractured Bedrock in SlopeStability
[34] The variable styles of hydrologic interaction betweenfractured bedrock and colluvial soil apparent in the piezo-metric response at CB1 show that local variations in theconductivity of the underlying fractured bedrock stronglyinfluence pore pressure generation in the overlying collu-vium, as inferred previously by Pierson [1977], Wilson andDietrich [1987], and Montgomery et al. [1997]. Lateralsaturated drainage through near-surface fractured bedrockmay lead to locally elevated pressure head that triggerslandsliding, but fractured rock also promotes slope stabilityby accommodating a significant portion of storm runoff, andthereby decreasing saturation in the overlying colluvium. Onsteep slopes, horizontal exfiltration from the bedrock, aswould be expected from either a horizontal fracture day-lighting on the slope or from downslope thinning of thehydrologically active zone of near-surface bedrock, is theseepage orientation most conducive to slope failure [Iversonand Major, 1986]. The distribution and connectivity of thenear-surface bedrock fracture system, which are almostimpossible to predict, may effectively determine the specificlocations where debris flows initiate. Pierson [1983] showedthat a blocked macropore would raise the pressure head in thesurrounding soil in proportion to the head difference withinthe macropore. Similarly, the pressure head developed in asealed fracture is a function of its upslope connectivity. Theadditional pressure head added by flow exfiltrating frombedrock fractures may contribute to instability along hollowaxes where convergence-induced saturation occurs, but ele-vated pore pressures are difficult to maintain due to the highlyconductive soil. Flow exfiltrating from bedrock fractures alsocould contribute to debris-flow initiation on steep side slopesor locations where soils are thin and partial saturation of thesoil profile sufficient to induce instability does not requiresubstantial flow. The location of shallow landsliding in steepterrain therefore appears to be influenced by both topograph-ically controlled flow convergence and spatial variability inthe conductivity of near-surface fractured bedrock.
7. Conclusions
[35] The hydrologic response of CB1 shows that shallowbedrock storm flow is an important runoff generationmechanism even in an environment with massive, gentlydipping sandstone where one might expect such influences tobe minimal. We find it both surprising and interesting thatthere is seasonal and storm-scale interaction with a deeperbedrock water table on such a steep hillslope. Topographi-cally driven models of runoff generation and shallow land-slide hazards are valuable tools for use in landslide hazardassessments and models of landscape evolution, but sub-stantial uncertainty appears inevitable in basin-wide, spa-tially explicit predictions of the specific timing and locationof debris-flow initiation due to the influence of bedrock
heterogeneity on the locations of exfiltration gradients, aswell as the previously recognized influences of variations insoil properties and thickness [e.g., Dietrich et al., 1995], andin root reinforcement as influenced by vegetation species,age, and health [e.g., Schmidt et al., 2001].
[36] Acknowledgments. This project was supported by National Sci-ence Foundation grants CMS-9610269 and EAR-8917467, and the Weyer-haueser Company. Ray Torres, Suzanne Anderson, and Lee MacDonaldhelped install bedrock piezometers at CB1. Suzanne Anderson, RobertAnderson, and John Buffington provided field assistance immediately afterthe debris flow at CB2. Tamara Massong, Darryl Granger and Matt Coglonprovided field assistance for topographic surveying. Joel VanderKwaak andKeith Loague analyzed the conductivity test data. Jim Clarke and KateSullivan provided tactical and logistical support for our Coos Bay studies.Wealso thank Bill Haneberg for his useful critique of the manuscript.
ReferencesAnderson, S. P., W. E. Dietrich, D. R. Montgomery, R. Torres, M. E.Conrad, and K. Loague, Subsurface flow paths in a steep unchanneledcatchment, Water Resour. Res., 33, 2637–2653, 1997.
Baum, R. L., and M. E. Reid, Geology hydrology, and mechanics of a slow-moving, clay-rich landslide, Honolulu, Hawaii, in Clay and Shale SlopeInstability, Geol. Soc. Am. Rev. Eng. Geol., vol. 10, edited by W. C.Haneberg and S. A. Anderson, pp. 79–105, Geol. Soc. of Am., Boulder,Colo., 1995.
Beaulieu, J. D., and P. N. Hughes, Environmental geology of Western Coosand Douglas Counties, Oregon, Oregon Dep. Geol. Min. Ind. Bull., 87,148 pp., 1975.
Beschta, R. L., Long-term patterns of sediment production following roadconstruction and logging in the Oregon Coast Range,Water Resour. Res.,14, 1011–1016, 1978.
Beven, K., and M. J. Kirkby, A physically based, variable contributing areamodel of basin hydrology, Hydrol. Sci. Bull., 24, 43–69, 1979.
Brown, G. W., and J. T. Krygier, Clear-cut logging and sediment productionin the Oregon Coast Range, Water Resour. Res., 7, 1189–1198, 1971.
Burton, A., and J. C. Bathurst, Physically based modelling of shallowlandslide sediment yield at a catchment scale, Environ. Geol., 35, 89–99, 1998.
Costa, J. E., Physical geomorphology of debris flows, in Developments andApplications of Geomorphology, edited by J. E. Costa and P J. Fleisher,pp. 268–317, Springer-Verlag, New York, 1984.
Dietrich, W. E., and T. Dunne, Sediment budget for a small catchment inmountainous terrain, Z. Geomorphol., 29, 191–206(supplement), 1978.
Dietrich, W. E., C. J. Wilson, and S. L. Reneau, Hollows, colluvium, andlandslides in soil-mantled landscapes, in Hillslope Processes, edited byA. D. Abrahams, pp. 361–388, Allen and Unwin, Concord, Mass., 1986.
Dietrich, W. E., C. J. Wilson, D. R. Montgomery, and J. McKean, Analysisof erosion thresholds, channel networks and landscape morphology usinga digital terrain model, J. Geol., 101, 259–278, 1993.
Dietrich, W. E., R. Reiss, M.-L. Hsu, and D. R. Montgomery, A process-based model for colluvial soil depth and shallow landsliding using digitalelevation data, Hydrol. Proc., 9, 383–400, 1995.
Dietrich, W. E., D. Bellugi, and R. Real de Asua, Validation of the shallowlandslide model, SHALSTAB, for forest management, in Land Use andWatersheds: Human Influence on Hydrology and Geomorphology inUrban and Forest Areas, edited by M. S. Wigmosta and S. J. Burges,pp. 195–227, AGU, Washington, D. C., 2001.
Dunne, T., Stochastic aspects of the relations bewteen climate, hydrology andlandform evolution, Trans. Jpn. Geomorphol. Union, 12, 1–24, 1991.
Ellen, S. D., S. H. Cannon, and S. L. Reneau, Distribution of debris flows inMarin County, in Landslides, Floods and Marine Effects of the Storm ofJanuary 3–5, 1982, in the San Francisco Bay region, California, U.S.Geol. Surv. Prof. Pap. 1434, edited by S. D. Ellen and G. F. Wieczorek,pp. 113–131, U. S. Gov. Print. Off., Washington, D.C., 1988.
Ellen, S. D., R. K. Mark, S. H. Cannon, and D. L. Knifong, Map of debris-flow hazard in the Honolulu District of Oahu, Hawaii, U.S. Geol. Surv.Open-File Rep. 93-213, 25 pp., U. S. Gov. Print. Off., Washington D.C.,1993.
Everett, A. G., Secondary permeability as a possible factor in the origin ofdebris avalanches associated with heavy rainfall, J. Hydrol., 43, 347–354, 1979.
Fredriksen, R. L., Erosion and sedimentation following road constructionand timber harvest on unstable soils in three small western Oregon water-
MONTGOMERY ET AL.: PIEZOMETRIC RESPONSE IN SHALLOW BEDROCK AT CB1 10 - 17

sheds, Res. Pap. PNW-104, 15 pp., U.S. Dep. of Agric., For. Serv.,Portland, Oreg., 1970.
Haneberg, W. C., Pore pressure diffusion and the hydrologic response ofnearly saturated, thin landslide deposits to rainfall, J. Geol., 99, 886–892, 1991.
Harr, R. D., Water flux in soil and subsoil on a steep forested slope,J. Hydrol., 33, 37–58, 1977.
Harr, R. D., and C. S. Yee, Soil and Hydrologic Factors Affecting theStability of Natural Slopes in the Oregon Coast Range, WRRI-33, 204pp., Water Resour. Res. Inst., Oreg. State Univ., Corvallis, 1975.
Heimsath, A. M., W. E. Dietrich, K. Nishiizumi, and R. C. Finkel, Stochas-tic processes of soil production and transport: Erosion rates, topographicvariation, and cosmogenic nuclides in the Oregon Coast Range, EarthSurf. Processes Landforms, 26, 531–552, 2001.
Hvorslev, M. J., Time Lag and Soil Permeability in Groundwater Observa-tions, Bull. 36, 50 pp., U.S. Army Corps of Eng. Waterw. Exp. Stn.,Vicksburg, Miss., 1951.
Iverson, R. M., Landslide triggering by rain infiltration, Water Resour. Res.,36, 1897–1910, 2000.
Iverson, R. M., and J. J. Major, Ground-water seepage vectors and thepotential for hillslope failure and debris flow mobilization, Water Resour.Res., 22, 1543–1548, 1986.
Iverson, R. M., and J. J. Major, Rainfall, ground-water flow, and seasonalmovement at Minor Creek landslide, northwestern California: Physicalinterpretation of empirical relations, Geol. Soc. Am. Bull., 99, 579–594,1987.
Mathewson, C. C., J. R. Keaton, and P. M. Santi, Role of bedrock groundwater in the initiation of debris flows and sustained post-flow streamdischarge, Bull. Assoc. Eng. Geol., 27, 73–83, 1990.
May, C. L., Debris flow characteristics associated with forest practices inthe central Oregon Coast Range, M.S. thesis, 121 pp., Oreg. State Univ.,Corvallis, 1998.
Montgomery, D. R., Channel initiation and landscape evolution, Ph.D.dissertation, 421 pp., Univ. of Calif., Berkeley, 1991.
Montgomery, D. R., and W. E. Dietrich, Where do channels begin?, Nature,336, 232–234, 1988.
Montgomery, D. R., and W. E. Dietrich, A physically-based model for thetopographic control on shallow landsliding, Water Resour. Res., 30,1153–1171, 1994.
Montgomery, D. R., and W. E. Dietrich, Runoff generation in a steep, soil-mantled landscape, Water Resour. Res., 38(9), 1168, doi:10.1029/2001WR000822, 2002.
Montgomery, D. R., W. E. Dietrich, R. Torres, S. P. Anderson, J. T. Heffner,and K. Loague, Piezometric response of a steep unchanneled valley tonatural and applied rainfall, Water Resour. Res., 33, 91–109, 1997.
Montgomery, D. R., K. Sullivan, and H. M. Greenberg, Regional test of amodel for shallow landsliding, Hydrol. Proc., 12, 943–955, 1998.
Montgomery, D. R., K. M. Schmidt, H. Greenberg, and W. E. Dietrich,Forest clearing and regional landsliding, Geology, 28, 311–314, 2000.
Montgomery, D. R., H. M. Greenberg, W. T. Laprade, and W. D. Nasham,Sliding in Seattle: Test of a model of shallow landsliding potential in anurban environment, in Land Use and Watersheds: Human Influence on
Hydrology and Geomorphology in Urban and Forest Areas, edited by M.S. Wigmosta and S. J. Burges, pp. 59–73, AGU, Washington, D. C.,2001.
Okimura, T., and R. Ichikawa, A prediction method for surface failures bymovements of infiltrated water in a surface soil layer, Nat. Disaster Sci.,7, 41–51, 1985.
Okimura, T., and M. Nakagawa, A method for predicting surface mountainslope failure with a digital landform model, Shin-Sabo, 41, 48–56, 1988.
O’Loughlin, E. M., Prediction of surface saturation zones in natural catch-ments by topographic analysis, Water Resour. Res., 22, 794–804, 1986.
Pierson, T. C., Factors controlling debris-flow initiation on forested hill-slopes in the Oregon Coast Range, Ph.D. dissertation, 166 pp., Univ. ofWash., Seattle, 1977.
Pierson, T. C., Piezometric response to rainstorms in forested hillslopedrainage depressions, J. Hydrol. N. Z., 19, 1–10, 1980.
Pierson, T. C., Soil pipes and slope stability, Q. J. Eng. Geol., 16, 1–11,1983.
Reid, M. E., A pore-pressure diffusion model for estimating landslide-in-ducing rainfall, J. Geol., 102, 709–717, 1994.
Reneau, S. L., andW. E. Dietrich, Size and location of colluvial landslides ina steep forested landscape, in Erosion and Sedimentation in the PacificRim, Int. Assoc. Hydrol. Sci. Publ., vol. 165, edited by R. L. Beschta et al.,pp. 39–49, Int. Assoc. of Hydrol. Sci., Wallingford, U.K., 1987.
Schmidt, K. M., Root strength, colluvial soil depth, and colluvial transporton landslide-prone hillslopes, Ph.D. dissertation, Univ. of Wash., Seattle,1999.
Schmidt, K. M., J. R. Roering, J. D. Stock, W. E. Dietrich, D. R. Mon-tgomery, and T. Schaub, Root cohesion variability and shallow landslidesusceptibility in the Oregon Coast Range, Can. Geotech. J., 38, 995–1024, 2001.
Schroeder, W. L., and J. V. Alto, Soil properties for slope stability analysis;Oregon and Washington coastal mountains, Forest Sci., 29, 823–833,1983.
Torres, R., W. E. Dietrich, D. R. Montgomery, S. P. Anderson, and K.Loague, Unsaturated zone processes and the hydrologic response of asteep unchanneled catchment,Water Resour. Res., 34, 1865–1879, 1998.
Wilson, C. J., and W. E. Dietrich, The contribution of bedrock groundwaterflow to storm runoff and high pore pressure development in hollows, inErosion and Sedimentation in the Pacific Rim, IAHS Publ., vol. 165,edited by R. L. Beschta et al., pp. 49–60, Int. Assoc. of Hydrol Sci.,Wallingford, U.K., 1987.
Wu, W., and R. C. Sidle, A distributed slope stability model for steepforested basins, Water Resour. Res., 31, 2097–2110, 1995.
����������������������������W. E. Dietrich, Department of Earth and Planetary Science, University of
California, Berkeley, CA 94720, USA.J. T. Heffner, Environmental Research, Weyerhaeuser Company, 505
North Pearl Street, Centralia, WA 98531, USA.D. R. Montgomery, Department of Earth and Space Sciences, University
of Washington, Seattle, WA 98195, USA. ([email protected])
10 - 18 MONTGOMERY ET AL.: PIEZOMETRIC RESPONSE IN SHALLOW BEDROCK AT CB1