pierce transit and the seattle express (electronic version) · pdf filepierce transit and the...
TRANSCRIPT
______________________________________________________________________________
John F. Kennedy School of GovernmentHarvard University
This case study was written by Jay H. Walder, Lecturer in Public Policy, with assistance from Arnold M. Howitt,Executive Director, Taubman Center for State and Local Government, and Guy D.F. Stuart, Lecturer in PublicPolicy, John F. Kennedy School of Government, Harvard University. Larisa Benson, Cascade Center for PublicService, Graduate School of Public Affairs, University of Washington, Seattle provided research assistance. Financial support was provided by the U.S. Department of Transportation through the New England UniversityTransportation Center. Revised 6/99.
Copyright © 1999 by the President and Fellows of Harvard College.
Pierce Transit and the Seattle Express(Electronic Version)
One summer day in 1993, Tim Payne slid a spread sheet across his desk to WillyGorrissen. Payne was Pierce Transit's manager of service planning and Gorrissen was its directorof finance and administration. They were speaking intently about a decision facing their agency,which ran the bus system in the city of Tacoma and greater Pierce County in Washington State. How would it continue to operate the Seattle Express?
For nearly three years Pierce Transit had been offering commuter express bus servicefrom Tacoma to Seattle during the morning rush (and back in the evening). Pierce Transitregarded the Seattle Express as a major success. Service was convenient, dependable, andpopular. As Payne and Gorrissen well knew, however, the operating arrangements that hadnurtured the Seattle Express during its first years now needed to be rethought and altered. PierceTransit had initiated the Seattle Express service by means of a contract with Seattle Metro, thepublic transit operator in the largest city in the Puget Sound region. Metro provided buses anddrivers from its own fleet, operating under Pierce Transit's service design, marketing, andmanagement. This arrangement had worked very smoothly; but as the three-year contract wascoming to a close, Metro had indicated it did not want to continue the relationship.
Payne, Gorrissen, and other members of the Pierce Transit management team wereactively considering two alternatives: (1) bringing the service completely in-house and operatingwith their own drivers and new buses, or (2) "privatizing" Seattle Express operations by puttingthe service out for bid to private bus operators. While the choice had many dimensions, cost wasa key element. In exploring the advantages and disadvantages of each option, Tim Payne had setout to develop comparative cost projections. What would it cost Pierce Transit to operate theSeattle Express itself? Was it likely that private providers could do so at less cost?
To get an idea of what might be expected from putting the contract out to bid, Payne hadsought information from other public transit operators around the country who were offeringsimilar service through contracts with private providers. The preliminary results of theseanalyses -- and an estimate of what in-house operation would cost -- were summarized in thespread sheet he was discussing with Gorrissen. Were they sufficiently confident in their data touse them in a presentation to senior management and, ultimately the Board of Commissioners?
Pierce Transit and the Seattle Express Page 2
What did the data reveal? And, how should Pierce Transit management and its Board ofCommissioners use them to decide how to keep the Seattle Express rolling?
Background on Pierce Transit
Pierce Transit was formed in 1979, with a service area of 150 square miles and apopulation of about 350,000. During the 1980s, that service area expanded to provide publictransportation services to a population of almost 540,000 in a 275-square-mile area that includedthe cities, towns and unincorporated areas of Pierce County, Washington.1 (See map, Exhibit 1.)
As a municipal corporation under Washington State law, Pierce Transit is governed by aseven-person Board of Commissioners. Board membership reflects the geographic diversity ofthe service region: three members are drawn from the Tacoma City Council (the largest city inPierce County), two members represent Pierce County government, and individual membersrepresent the City of Puyallup and the remaining small cities and towns. Board members (whogenerally are elected officials) are not compensated and serve three-year terms. The Boardappoints an Executive Director who is responsible for the day-to-day operation of the transitsystem and implementation of policies adopted by the Board of Commissioners.
In 1992, Pierce Transit carried nearly 10 million passengers on a fleet of 183 wheelchair-accessible buses. The fixed-route system operated over 900 miles of city streets and county andstate highways. Pierce Transit maintained seven transit centers, 170 covered bus shelters, and 13park-and-ride lots. In addition to the fixed-route system, Pierce Transit provided the SHUTTLE,a demand-responsive transportation service for people with disabilities.
Like most transit systems in the United States, Pierce Transit recouped only a portion ofits operating costs from the fare box, therefore operating at a substantial deficit. Passenger andMiscellaneous Revenues (derived from farebox income and the rental of advertising space in theinteriors and exteriors of its buses) covered less than 20% of the annual $35 million operatingexpense to provide daily transit service.2 The majority of operating income, which largelycovered the operating deficit, was derived from two dedicated taxes: a 0.3% county-wide salestax and a motor-vehicle excise tax. The combined receipts from these local subsidies coveredapproximately 70% of the cost of operating the system. (See 1993 Budget Summary, Exhibit 2.)
Genesis and Design of the Seattle Express
In the mid-1980s, Board members pressed Pierce Transit managers to develop regionalservice to connect Tacoma with nearby metropolitan areas. A first foray was to initiate expressbus service in 1988 between Tacoma and the state capital in Olympia, but the larger goal was toprovide convenient public transit service between Tacoma and Seattle, the largest city in thePuget Sound area. Census figures showed that 3,000 people commuted daily from Pierce County
1Pierce Transit expanded again in 1993 to a 450-square-mile service area and a population base of 600,000.
2Exclusive of depreciation and debt service.
Pierce Transit and the Seattle Express Page 3
to Seattle, mostly by private auto on increasingly congested highways. While it was theoreticallypossible for riders to make this trip utilizing existing bus service, it required several hours ofshifting from one route and service provider to another, taking Pierce Transit to the city ofFederal Way and changing to a different bus operated by Seattle Metro. An informal surveyconducted in 1989 showed that non-stop rush hour bus service had the potential to attract 500-600 round-trip customers per day.
Although this market survey indicated the potential for success, Pierce Transit was verycautious in planning the Seattle Express. It wanted to initiate a pilot program with "the smallestlong-term financial risk we could," according to Gorrissen, but with the ability to expand easily ifthe experiment were successful.
Three service provision alternatives were considered to initiate the Tacoma/Seattleexpress service and test its viability:
• Operate the service internally, using Pierce transit coaches and drivers,• Contract with a private bus operator, which would provide buses and directly employ the
drivers,• Contract with the public transit provider in Seattle (Metro) which would supply buses and
drivers.
Since Pierce Transit had no surplus bus capacity, the first option would require asignificant capital investment for the purchase of new buses. This seemed inconsistent with thegoal of minimizing financial risk in launching the service. The second and third options had aclear advantage in this regard. But inquiries with potential private contractors in the regionindicated that none had buses that could be dedicated to the new service. It was possible that onecould purchase buses for this purpose, but the lead time for procurement was lengthy enough thatit would be hard to meet the demands from the Pierce Transit Board for rapid initiation of theservice.
Fortunately, preliminary discussions with Metro indicated it would be able to dedicatebuses from its existing fleet, if Pierce Transit assumed the costs of rehabilitation and upgrading.3Consequently, if express bus service proved unsuccessful, Pierce Transit could terminate a Metrocontract without significant closeout costs. Metro seemed an appropriate contractor for otherreasons as well. It could mount the new service quickly. It had appropriate terminal facilities andsupervisory support in downtown Seattle. And there was the potential to use the downtownTransit Tunnel at some future date. After an informal survey confirmed that no private operatorcould set up the service more economically, Pierce Transit decided to contract with metro for apilot program. Metro would be paid $3 million to operate the new Seattle Express for threeyears.
At the Tacoma end, Pierce Transit leased a large parking lot at the Tacoma Dome that
3It eventually cost Pierce Transit $643,000 to upgrade 22 buses, with Metro assuming the obligation to
reimburse Pierce Transit for any remaining value of the buses at the conclusion of the contract.
Pierce Transit and the Seattle Express Page 4
was conveniently located near Interstate 5. Frequent park-and-ride service would be offeredduring weekday rush hours (See Exhibit 3). The first bus from Tacoma would leave around 5:30a.m., and the last bus would leave about two hours later. Buses would operate at ten-minuteintervals during the "peak of the peak." The pattern would reverse itself in the afternoon, withthe first bus leaving Seattle between 3:30 and 4:00. Pierce Transit planned to charge a premiumfare for the service -- $1.75 one way or $60 for a monthly pass.4 Parking was included in theprice of the service. Fare revenues were expected to cover about 30% of the cost of providingservice, more than 50% higher than local routes.
Launching the Service
The Seattle Express began service in September 1990 -- an immediate, tremendoussuccess. According to The Morning News Tribune, the number of Day 1 passengers exceededthe 440 available seats (on ten 44-passenger buses). Metro scrambled to add a bus to themorning runs, but some passengers still stood for the 45-60 minute commute (see article, Exhibit4). Average weekday boardings grew from 772 in the first month of service to 1,154 just twomonths later. (See ridership table, Exhibit 5.) Moreover, only 30% of the riders were divertedfrom other transit services. Approximately 70% of the passengers had previously been drivingfrom Tacoma to downtown Seattle. After two months, Metro was able to supply five more busesfor the morning schedule, shortening the time between some buses to just five minutes. TheSeattle Express also began to offer limited reverse commute service departing from Seattle in themorning and Tacoma in the afternoon (Exhibit 6).
Average weekday ridership continued to grow -- up 100% by September 1992, the two-year anniversary of the new service. The Seattle Express was now operating with a fleet size of22 buses; but Metro had run out of equipment, so it had lost the flexibility to continue to increaseservice in response to greater demand.
Not only was ridership strong, but Pierce Transit also saw the Seattle Express as a firmfinancial success. Fare revenues were covering almost 40% of the cost of operation (compared toabout 17% for other Pierce Transit routes).
Rethinking the Seattle Express
With the operating agreement with Metro due to expire in September 1993, Pierce Transitbegan to consider future plans for the Seattle Express, which it wanted to expand. But by early1993 Metro was indicating that it was not interested in continuing to operate the service, in largepart because it needed to use its Seattle Express buses for its own local service. That left PierceTransit with two alternatives -- operate the service internally or contract with a private busoperator.
Federal regulations commanded special attention to the second option. Transit systems
4Pierce Transit charged $.75 for a local one-way trip and $26 for an unlimited-ride monthly pass.
Pierce Transit and the Seattle Express Page 5
in the United States receive operating and capital assistance from the Federal TransitAdministration (FTA) of the U.S. Department of Transportation.5 As required by its authorizingstatutes, FTA undertakes periodic assessments of grantee compliance with Federal requirements. In late 1991, as part of one of these "Triennial Reviews," FTA informed Pierce Transit that itregarded the procurement of the Seattle Express as out of compliance with the FTA "PrivateEnterprise Participation" policy statement, which requires grantees to assess whether "new orrestructured services" are appropriate for provision by private contractors. The FTA report didnot comment on Pierce Transit's decision-making criteria, but criticized the decision process. While FTA stated explicitly that the requirements were not intended to require that a privateprovider operate the service, it did require a competitive process in which the option ofcontracting with private providers was fairly considered. The selection of Metro as thecontractor for the Seattle Express in 1990 had not met this requirement.
Although Pierce Transit managers knew that they would have to comply with thesefederal regulations in restructuring the Seattle Express, they leaned toward in-house operation ifcosts were reasonably similar. This service was the agency's most popular -- a high visibilityoperation that set a standard for the organization -- and one that management wanted to makesure would continue to run effectively. According to Willy Gorrissen, director of finance andadministration, "We thought we could do a better job than anyone else." Second, Pierce Transitmanagement was coming under collective bargaining pressure to bring the Seattle Express in-house. During ongoing labor negotiations, Amalgamated Transit Union (ATU) Local 758, whichrepresented much of the workforce of Pierce Transit, strongly indicated that it wanted to see itsmembers operate this premier service.
As a starting point, therefore, Pierce Transit managers wanted to get a grasp on the likelycosts of different options. They recognized that whatever they ultimately recommended, costwould be a crucial factor in defending the policy publicly when Pierce Transit's Board ofCommissioners voted on a new arrangement.
Putting the service out to bid would have been one way to get this information, butmanagement wanted a provisional understanding of the relative costs of different ways ofstructuring Seattle Express operations before deciding whether to launch a formal competitivebidding process. Soliciting bids would reduce management's flexibility in bargaining with theATU. And Pierce Transit managers were concerned about the agency's long-term credibility withpotential contractors. It had recently requested bids for the Olympia Express but had ultimatelydecided to operate the service internally. Doing the same with the Seattle Express might makecontractors reluctant to go through the work of preparing future bids, concluding that PierceTransit was not serious about relationships with the private sector.
5In December 1991, Congress changed the name of the former Urban Mass Transportation Administration
(UMTA) of the Department of Transportation to the Federal Transit Administration (FTA). All references in thiscase reflect the current name.
Pierce Transit and the Seattle Express Page 6
Analysis of Service Provider Alternatives
The task of estimating the cost of alternatives for operating the Seattle Express fell to TimPayne, Pierce Transit’s manager of service planning. Payne sought to identify similar expressbus services sponsored by transit agencies in other parts of the United States. Finding the rightoperations for comparison was crucial to getting useful information. Payne felt the keycharacteristics of Seattle Express service that would make comparison valid were (1) a relativelylong-distance trip at highway speeds, and (2) operating during commuter hours with a similarpeak-period vehicle requirement.
Seven different transit properties were contacted to obtain details of their contracts withprivate bus operators. Payne found most willing to share information, although in some cases heneeded to make several calls to locate the person best able to supply the data he wanted. Notsurprisingly, each transit property handled its contracts somewhat differently. Payne’s challengewas to take the information he gathered and make it comparable to the data secured from theother providers. (The results of Payne's survey are summarized in Exhibits 7 and 8.) In general,Payne was informed that service providers charge on either a per hour or per mile basis. Somecontracts were based on revenue service -- the actual time or miles that a bus is operating on aroute and carrying passengers. Other contracts were based on platform hours, which adds boththe time before revenue service, when a bus is fueled and driven to the route initiation point, andthe time after revenue service when the bus returns to the storage depot.
Payne’s next task was to calculate what it would have cost these other carriers toduplicate current Seattle Express service. Based on experience with the Seattle Metro contract,Payne determined that the current level of service required 109.32 platform hours or 3,373.4platform miles per day. Using the information he obtained in his survey, he was able to estimatea cost per day for Seattle Express service. He then translated that into an annual cost on thebasis of 255 working days per year. In some cases, it was necessary to add the cost of fuel, whichwas billed separately from the hourly rate. A similar "translation" process was used when thecomparable cost information was expressed in revenue miles or revenue hours.
An important issue in the analysis concerned the provision of buses. Many of the transitproperties surveyed expected the private provider to purchase or lease buses and pass through thecost in their charges. The Pierce Transit Board of Commissioners, however, had recentlyadopted a policy that would move Pierce Transit to a bus fleet powered by Compressed NaturalGas (CNG), a newer fuel designed to reduce air pollution.6 Given this requirement, PierceTransit recognized that it would have to purchase the buses for the Seattle Express under anyservice alternative and it signed a contract for 25 new CNG-powered express coaches to bededicated to the Seattle Express.7 Should Pierce Transit decide to contract out this service, thesecoaches would be made available to the private contractor. In his cost analysis, Payne was
6Standard transit buses are powered by diesel engines, which emit particulates and other pollutants.
7With a lead time of about a year for the delivery of new buses, Pierce Transit needed to order them wellahead of the time it would take over the service from Metro.
Pierce Transit and the Seattle Express Page 7
careful to adjust the data he obtained from other transit properties to compensate for differenttreatment of equipment costs.
In addition to the information he received from the survey, Payne calculated expectedcosts to Pierce Transit for contract administration and CNG technical assistance. Adding all ofthese components together, Payne estimated that, based on the experience of other transitagencies, it would cost somewhere between $1.5 million to $2.2 million to contract for theSeattle Express. (See Exhibit 7.)
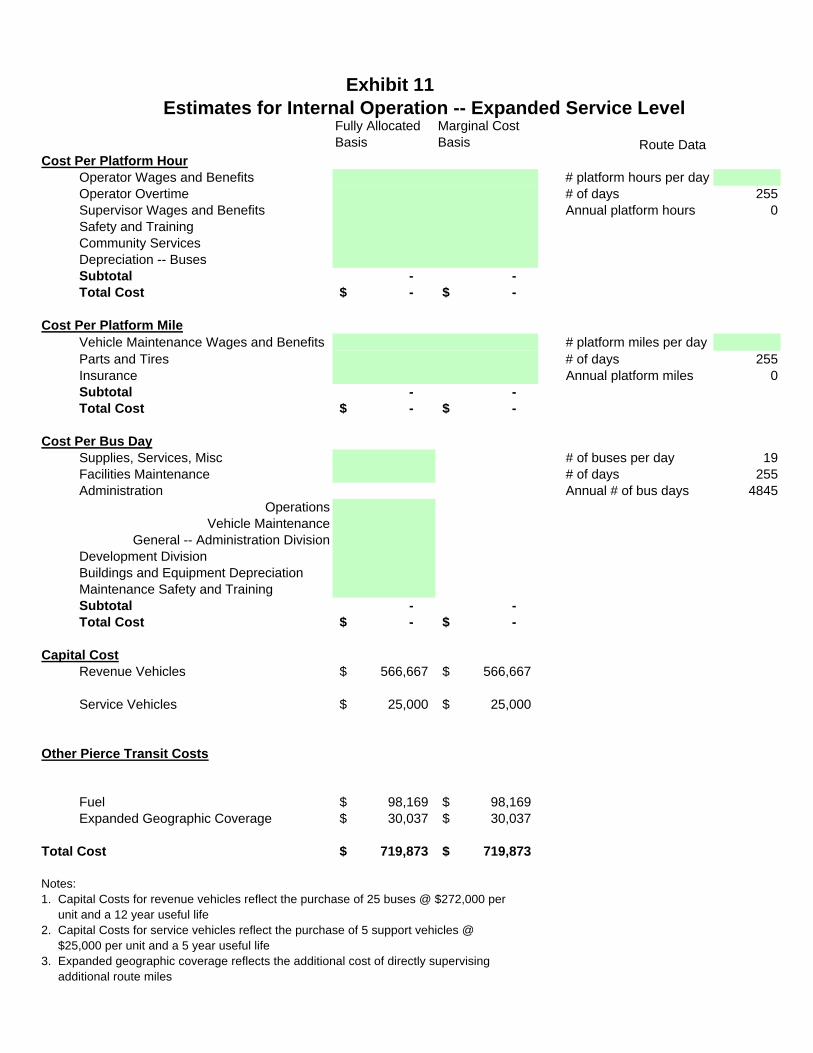
Using the same basic data, Payne also wanted to estimate the cost of expanding SeattleExpress service with an hourly mid-day bus. Expanded service would increase service hours andmiles but would not require additional buses or contract supervision. According to this analysis,annual costs of contracting for the expanded service would lie in the range of $1.7 million to $2.9million. (See Exhibit 8).
Pierce Transit Operation of the Seattle Express -- Fully Allocated or Marginal Costs?
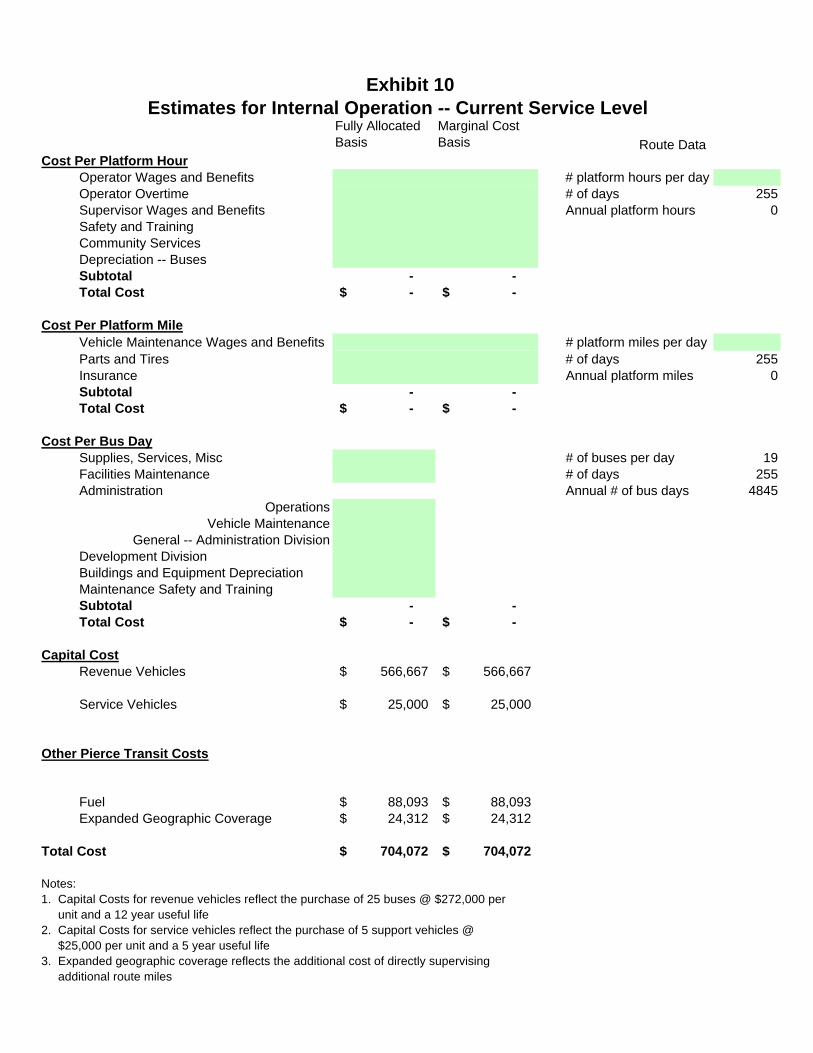
Payne needed to compare these forecasts of contracting costs to the cost of operating theSeattle Express with Pierce Transit employees. He utilized two methodologies:
• Fully Allocated CostsFTA regulations required public transit agencies to analyze the "fully allocated costs" ofservice when making comparisons to the private sector. This method assumes that allcosts of the agency should be apportioned directly to service operations. For example, afully allocated cost model for the Seattle Express includes a share of the Pierce TransitExecutive Director's salary.
• Marginal CostFTA regulations also permit a separate comparison of costs based on the marginalexpenses actually expected for adding a particular service to an existing base ofoperations. The costs used in this analysis are limited to new expenditures resulting fromoperation of the Seattle Express with Pierce Transit employees.
Payne calculated potential costs by drawing information from Pierce Transit's costaccounting system, which tracks expenses for each department/division (but not by serviceroute). The cost model used for comparison to private operators allocated expenses as a functionof three operating variables – Bus Hours Operated, Bus Miles Operated and the Number of PeakBus Days (reflecting the costs of keeping additional buses in the fleet). He used the model todetermine the hourly or mileage based costs, where those units of expenditure were appropriatefor services that had already been provided.
Pierce Transit and the Seattle Express Page 8
He then needed to consider how these costs would change with increases in service. Heconsidered three cost behaviors:
• Variable CostsSome costs vary directly with any incremental change in service and are appropriatelyclassified as variable. Driver wages and benefits, for example, vary directly with servicehours while fuel expenses, tire rental and maintenance vary directly with the milestraveled.
• Step Function CostsOther costs reflect more of a step function – they are service related but increase inrelatively small "lumps" as service increases. Operations safety and training expenses fallin this category.
• Fixed CostsFinally, some costs are fixed and do not vary with changes in service (at least in the shortrun). Facilities maintenance, for example, does not vary with the amount of serviceprovided.
Exhibit 9 contains the Pierce Transit Cost Allocation model.8
Payne combined the operating variables with the cost behaviors to "cross walk" the datain Exhibit 9 into a format that forecast costs in terms of both Fully Allocated Costs and MarginalCosts (Exhibits 10 and 11 provide templates for the final format). This process wasstraightforward for some cost factors. All variable costs implied an increase in Marginal Costsand, by definition, Full Costs and so were assigned to both columns. On the other extreme,Fixed Peak costs were only assigned to Full Costs because they would not vary, in the short run,in response to an increase in service. The more difficult factors to assign were those costs thatvaried according to a step function. Did they only belong in the Full Cost column or would theyalso induce an increase in Marginal Costs? Based on his understanding of the operations ofPierce Transit, Payne allocated the step function costs that varied with platform miles andplatform hours to both the Full Cost and Marginal Cost columns. The step function costs thatvaried with the number of bus days he allocated only to the Full Cost column.
In addition, Payne was careful to try to determine where the cost factors for the SeattleExpress might differ from the local fixed route operation. The hourly cost of an operator, forinstance, would not vary based on the type of service. The cost per mile, on the other hand,could be quite different since the number of miles traveled in each hour of express service ismore than twice the amount traveled in local operation and the sustained speeds of expressservice are much higher. Pierce Transit's maintenance managers believed that the model waspredicting a much larger increase in maintenance staffing than would be necessary, so they
8 Payne used actual results from the first half of 1993 for his cost analysis. The figures in Exhibit 9 havebeen adjusted to 1994 dollars for consistency with the external provider analysis.
Pierce Transit and the Seattle Express Page 9
rebuilt the maintenance budget from the ground up (including the costs necessary to maintain the25 buses for the Seattle Express). This resulted in lower costs for maintenance (particularlysalaries and benefits) than the factors in the cost allocation model. Payne calculated these to be$.28 per platform mile.
Payne utilized the cost factors described above and the daily service requirements toforecast Pierce Transit's cost to operate the Seattle Express. Capital costs reflected the existingcontract for the purchase of 25 CNG powered buses. Fuel costs were based on the mileageexperience of other buses in the fleet that run on natural gas – about 4.2 miles per therm. At thetime of the analysis, Payne projected a unit cost of $.36 per therm.
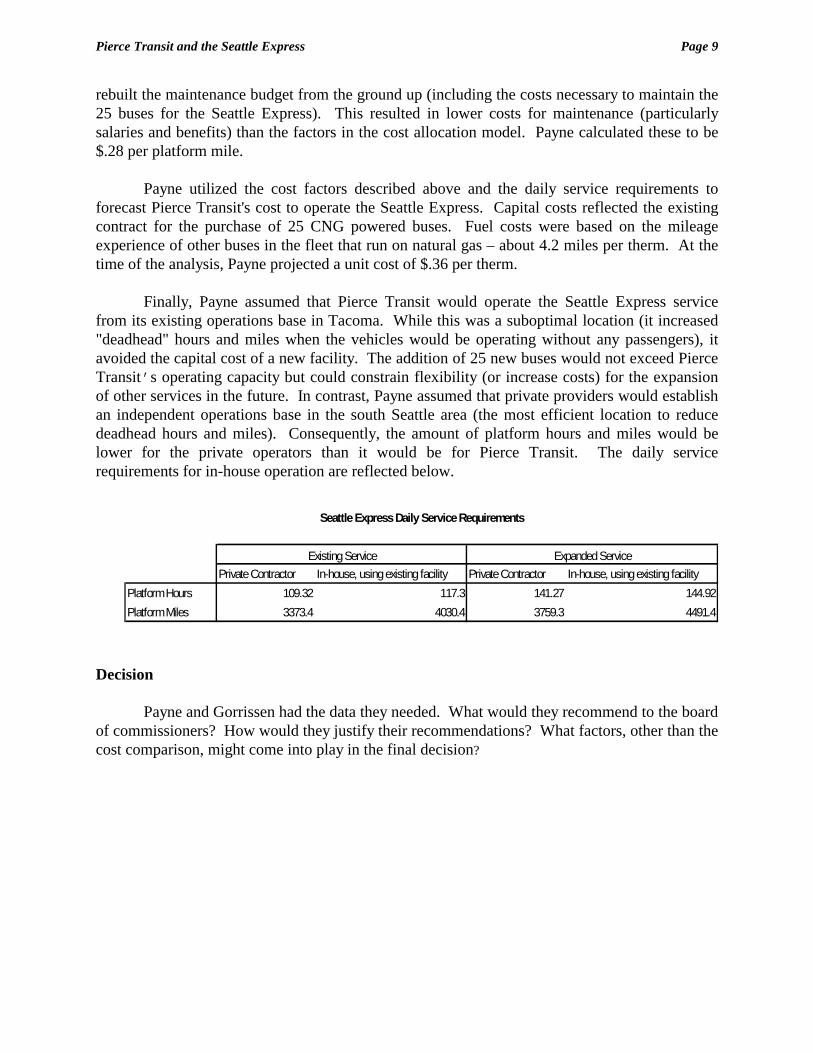
Finally, Payne assumed that Pierce Transit would operate the Seattle Express servicefrom its existing operations base in Tacoma. While this was a suboptimal location (it increased"deadhead" hours and miles when the vehicles would be operating without any passengers), itavoided the capital cost of a new facility. The addition of 25 new buses would not exceed PierceTransit’s operating capacity but could constrain flexibility (or increase costs) for the expansionof other services in the future. In contrast, Payne assumed that private providers would establishan independent operations base in the south Seattle area (the most efficient location to reducedeadhead hours and miles). Consequently, the amount of platform hours and miles would belower for the private operators than it would be for Pierce Transit. The daily servicerequirements for in-house operation are reflected below.
Decision
Payne and Gorrissen had the data they needed. What would they recommend to the boardof commissioners? How would they justify their recommendations? What factors, other than thecost comparison, might come into play in the final decision?
Private Contractor In-house, using existing facility Private Contractor In-house, using existing facilityPlatform Hours 109.32 117.3 141.27 144.92Platform Miles 3373.4 4030.4 3759.3 4491.4
Expanded ServiceExisting Service
Seattle Express Daily Service Requirements

Pierce Transit and the Seattle Express Page 10
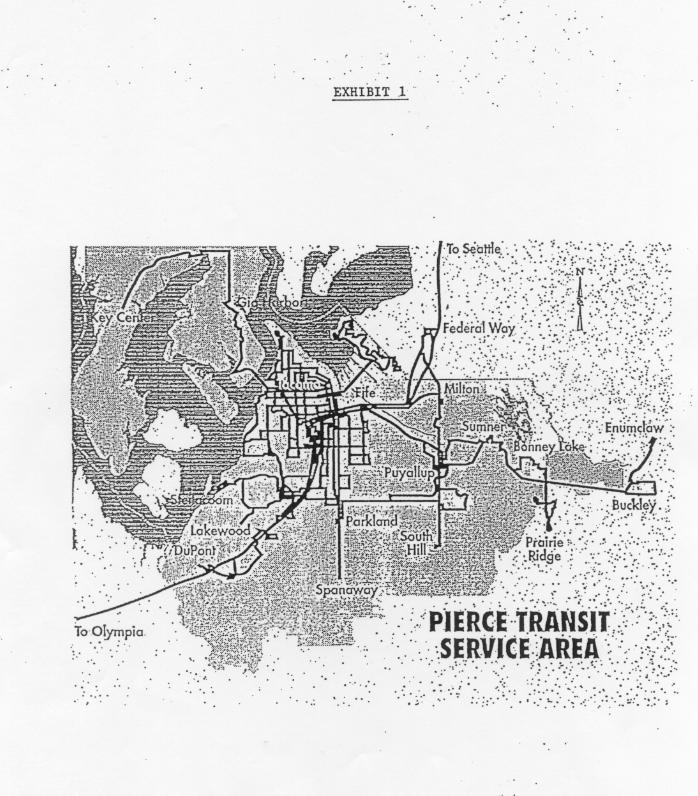
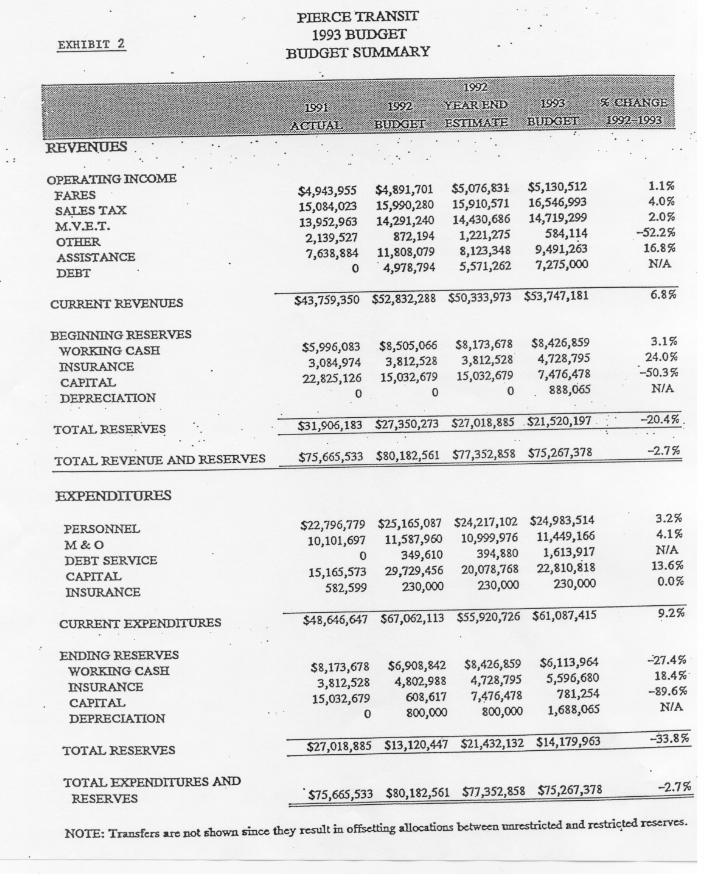
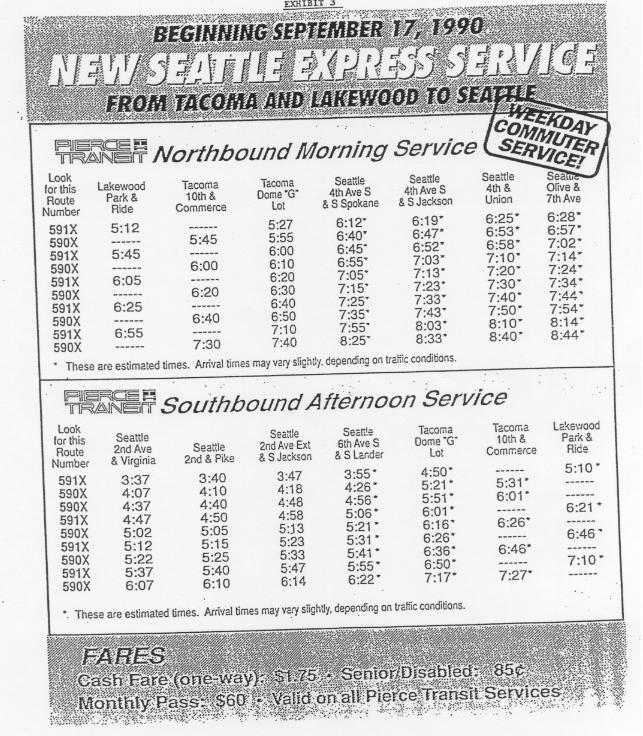
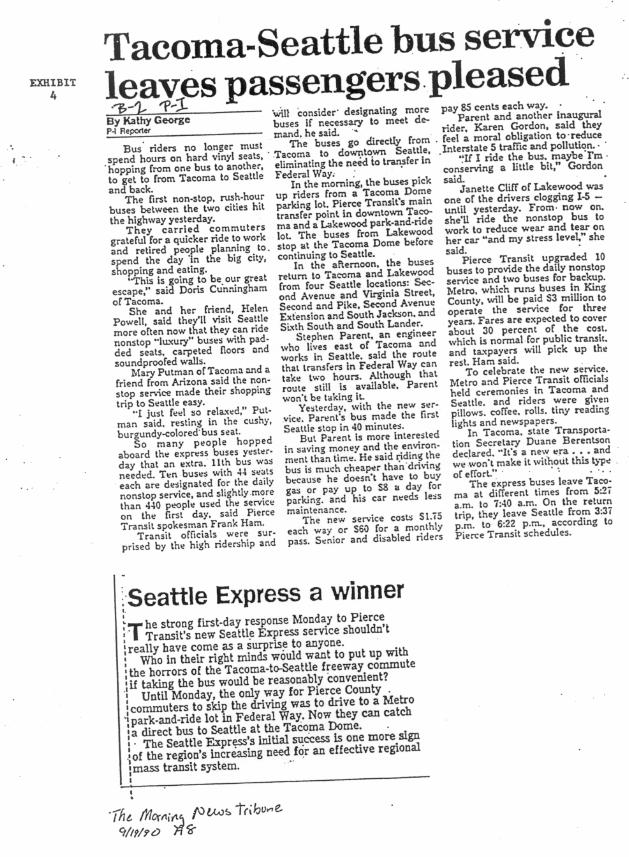

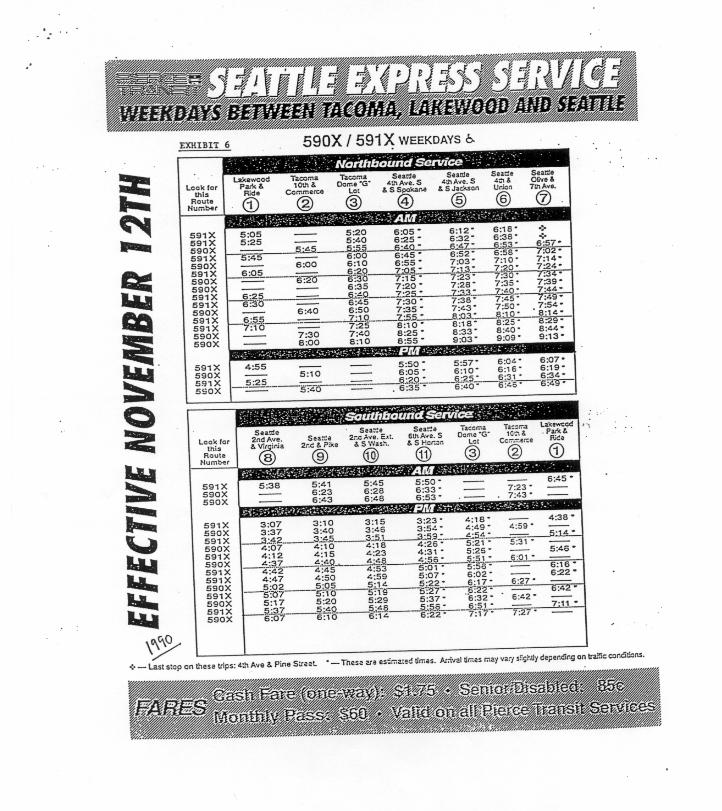
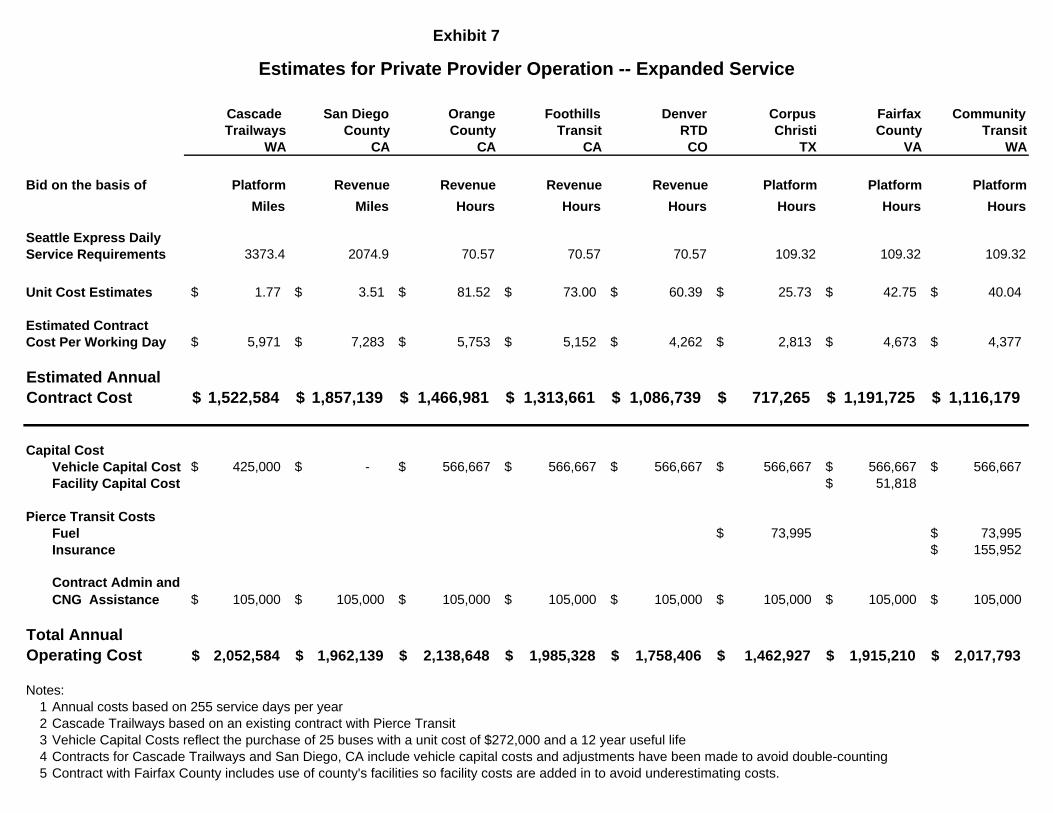
Exhibit 7
Estimates for Private Provider Operation -- Expanded Service
Cascade San Diego Orange Foothills Denver Corpus Fairfax CommunityTrailways County County Transit RTD Christi County Transit
WA CA CA CA CO TX VA WA
Bid on the basis of Platform Revenue Revenue Revenue Revenue Platform Platform PlatformMiles Miles Hours Hours Hours Hours Hours Hours
Seattle Express Daily Service Requirements 3373.4 2074.9 70.57 70.57 70.57 109.32 109.32 109.32
Unit Cost Estimates 1.77$ 3.51$ 81.52$ 73.00$ 60.39$ 25.73$ 42.75$ 40.04$
Estimated ContractCost Per Working Day 5,971$ 7,283$ 5,753$ 5,152$ 4,262$ 2,813$ 4,673$ 4,377$
Estimated Annual Contract Cost 1,522,584$ 1,857,139$ 1,466,981$ 1,313,661$ 1,086,739$ 717,265$ 1,191,725$ 1,116,179$
Capital CostVehicle Capital Cost 425,000$ -$ 566,667$ 566,667$ 566,667$ 566,667$ 566,667$ 566,667$ Facility Capital Cost 51,818$
Pierce Transit CostsFuel 73,995$ 73,995$ Insurance 155,952$
Contract Admin and CNG Assistance 105,000$ 105,000$ 105,000$ 105,000$ 105,000$ 105,000$ 105,000$ 105,000$
Total AnnualOperating Cost 2,052,584$ 1,962,139$ 2,138,648$ 1,985,328$ 1,758,406$ 1,462,927$ 1,915,210$ 2,017,793$
Notes:1 Annual costs based on 255 service days per year2 Cascade Trailways based on an existing contract with Pierce Transit3 Vehicle Capital Costs reflect the purchase of 25 buses with a unit cost of $272,000 and a 12 year useful life4 Contracts for Cascade Trailways and San Diego, CA include vehicle capital costs and adjustments have been made to avoid double-counting5 Contract with Fairfax County includes use of county's facilities so facility costs are added in to avoid underestimating costs.
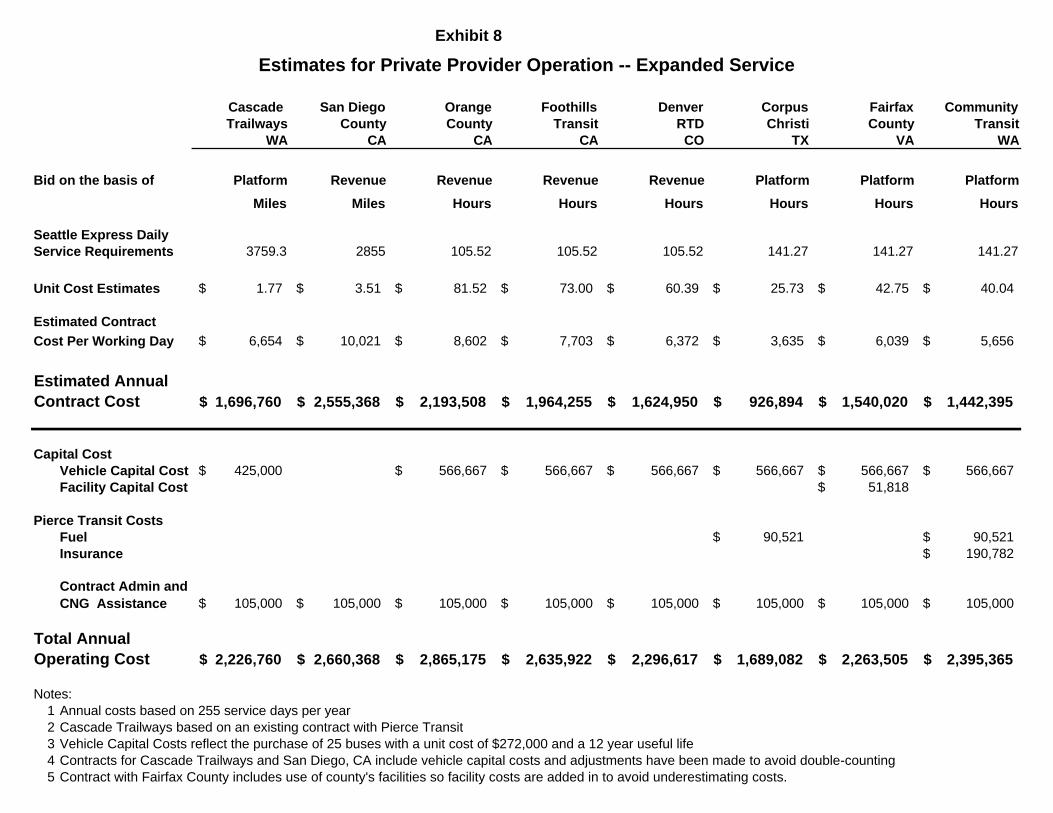
Exhibit 8
Estimates for Private Provider Operation -- Expanded Service
Cascade San Diego Orange Foothills Denver Corpus Fairfax CommunityTrailways County County Transit RTD Christi County Transit
WA CA CA CA CO TX VA WA
Bid on the basis of Platform Revenue Revenue Revenue Revenue Platform Platform PlatformMiles Miles Hours Hours Hours Hours Hours Hours
Seattle Express Daily Service Requirements 3759.3 2855 105.52 105.52 105.52 141.27 141.27 141.27
Unit Cost Estimates 1.77$ 3.51$ 81.52$ 73.00$ 60.39$ 25.73$ 42.75$ 40.04$
Estimated ContractCost Per Working Day 6,654$ 10,021$ 8,602$ 7,703$ 6,372$ 3,635$ 6,039$ 5,656$
Estimated AnnualContract Cost 1,696,760$ 2,555,368$ 2,193,508$ 1,964,255$ 1,624,950$ 926,894$ 1,540,020$ 1,442,395$
Capital CostVehicle Capital Cost 425,000$ 566,667$ 566,667$ 566,667$ 566,667$ 566,667$ 566,667$ Facility Capital Cost 51,818$
Pierce Transit CostsFuel 90,521$ 90,521$ Insurance 190,782$
Contract Admin and CNG Assistance 105,000$ 105,000$ 105,000$ 105,000$ 105,000$ 105,000$ 105,000$ 105,000$
Total AnnualOperating Cost 2,226,760$ 2,660,368$ 2,865,175$ 2,635,922$ 2,296,617$ 1,689,082$ 2,263,505$ 2,395,365$
Notes:1 Annual costs based on 255 service days per year2 Cascade Trailways based on an existing contract with Pierce Transit3 Vehicle Capital Costs reflect the purchase of 25 buses with a unit cost of $272,000 and a 12 year useful life4 Contracts for Cascade Trailways and San Diego, CA include vehicle capital costs and adjustments have been made to avoid double-counting5 Contract with Fairfax County includes use of county's facilities so facility costs are added in to avoid underestimating costs.
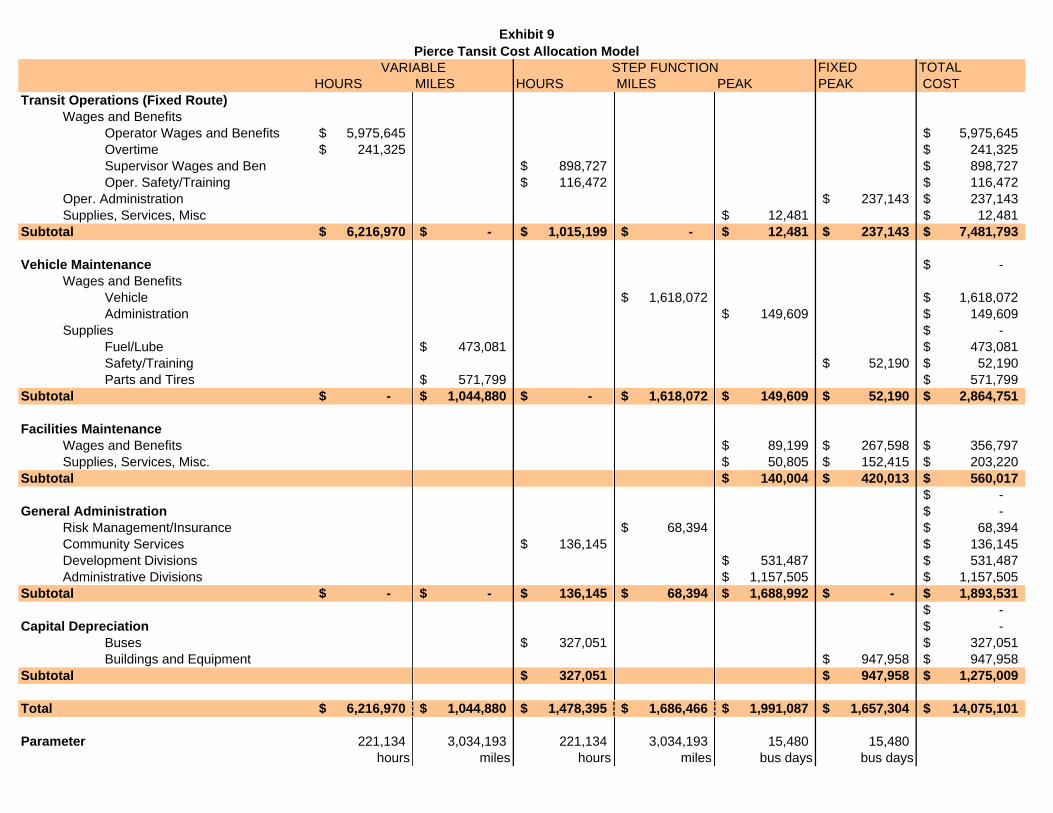
Exhibit 9Pierce Tansit Cost Allocation Model
FIXED TOTAL HOURS MILES HOURS MILES PEAK PEAK COST
Transit Operations (Fixed Route)Wages and Benefits
Operator Wages and Benefits 5,975,645$ 5,975,645$ Overtime 241,325$ 241,325$ Supervisor Wages and Ben 898,727$ 898,727$ Oper. Safety/Training 116,472$ 116,472$
Oper. Administration 237,143$ 237,143$ Supplies, Services, Misc 12,481$ 12,481$
Subtotal 6,216,970$ -$ 1,015,199$ -$ 12,481$ 237,143$ 7,481,793$
Vehicle Maintenance -$ Wages and Benefits
Vehicle 1,618,072$ 1,618,072$ Administration 149,609$ 149,609$
Supplies -$ Fuel/Lube 473,081$ 473,081$ Safety/Training 52,190$ 52,190$ Parts and Tires 571,799$ 571,799$
Subtotal -$ 1,044,880$ -$ 1,618,072$ 149,609$ 52,190$ 2,864,751$
Facilities Maintenance Wages and Benefits 89,199$ 267,598$ 356,797$ Supplies, Services, Misc. 50,805$ 152,415$ 203,220$
Subtotal 140,004$ 420,013$ 560,017$ -$
General Administration -$ Risk Management/Insurance 68,394$ 68,394$ Community Services 136,145$ 136,145$ Development Divisions 531,487$ 531,487$ Administrative Divisions 1,157,505$ 1,157,505$
Subtotal -$ -$ 136,145$ 68,394$ 1,688,992$ -$ 1,893,531$ -$
Capital Depreciation -$ Buses 327,051$ 327,051$ Buildings and Equipment 947,958$ 947,958$
Subtotal 327,051$ 947,958$ 1,275,009$
Total 6,216,970$ 1,044,880$ 1,478,395$ 1,686,466$ 1,991,087$ 1,657,304$ 14,075,101$
Parameter 221,134 3,034,193 221,134 3,034,193 15,480 15,480 hours miles hours miles bus days bus days
VARIABLE STEP FUNCTION
�����������������������������������������������������������������������������������������������������������������������������������������������������������������������������������������������������������������������������������������������
�����������������������������������������������������������������������������������������������������������������������������������������������������������������������������������������������������������������������������������������������
�����������������������������������������������������������������������������������������������������������������������������������������������������������������������������������������������������������������������������������������������
���������������������
���������������������
���������������������
Estimates for Internal Operation -- Current Service LevelFully Allocated Basis
Marginal Cost Basis
Cost Per Platform HourOperator Wages and Benefits # platform hours per dayOperator Overtime # of days 255Supervisor Wages and Benefits Annual platform hours 0Safety and TrainingCommunity ServicesDepreciation -- BusesSubtotal - - Total Cost -$ -$
Cost Per Platform MileVehicle Maintenance Wages and Benefits # platform miles per dayParts and Tires # of days 255Insurance Annual platform miles 0Subtotal - - Total Cost -$ -$
Cost Per Bus DaySupplies, Services, Misc # of buses per day 19Facilities Maintenance # of days 255Administration Annual # of bus days 4845
OperationsVehicle Maintenance
General -- Administration DivisionDevelopment DivisionBuildings and Equipment DepreciationMaintenance Safety and TrainingSubtotal - - Total Cost -$ -$
Capital CostRevenue Vehicles 566,667$ 566,667$
Service Vehicles 25,000$ 25,000$
Other Pierce Transit Costs
Fuel 88,093$ 88,093$ Expanded Geographic Coverage 24,312$ 24,312$
Total Cost 704,072$ 704,072$
Notes:1. Capital Costs for revenue vehicles reflect the purchase of 25 buses @ $272,000 per unit and a 12 year useful life2. Capital Costs for service vehicles reflect the purchase of 5 support vehicles @ $25,000 per unit and a 5 year useful life3. Expanded geographic coverage reflects the additional cost of directly supervising additional route miles
Route Data
Exhibit 10
Estimates for Internal Operation -- Expanded Service LevelFully Allocated Basis
Marginal Cost Basis
Cost Per Platform HourOperator Wages and Benefits # platform hours per dayOperator Overtime # of days 255Supervisor Wages and Benefits Annual platform hours 0Safety and TrainingCommunity ServicesDepreciation -- BusesSubtotal - - Total Cost -$ -$
Cost Per Platform MileVehicle Maintenance Wages and Benefits # platform miles per dayParts and Tires # of days 255Insurance Annual platform miles 0Subtotal - - Total Cost -$ -$
Cost Per Bus DaySupplies, Services, Misc # of buses per day 19Facilities Maintenance # of days 255Administration Annual # of bus days 4845
OperationsVehicle Maintenance
General -- Administration DivisionDevelopment DivisionBuildings and Equipment DepreciationMaintenance Safety and TrainingSubtotal - - Total Cost -$ -$
Capital CostRevenue Vehicles 566,667$ 566,667$
Service Vehicles 25,000$ 25,000$
Other Pierce Transit Costs
Fuel 98,169$ 98,169$ Expanded Geographic Coverage 30,037$ 30,037$
Total Cost 719,873$ 719,873$
Notes:1. Capital Costs for revenue vehicles reflect the purchase of 25 buses @ $272,000 per unit and a 12 year useful life2. Capital Costs for service vehicles reflect the purchase of 5 support vehicles @ $25,000 per unit and a 5 year useful life3. Expanded geographic coverage reflects the additional cost of directly supervising additional route miles
Route Data
Exhibit 11