pierce county planning and land services … · stuart glasoe, puget sound action team . ... jason...
TRANSCRIPT

PIERCE COUNTY PLANNING AND LAND SERVICES DEPARTMENT

Pierce County Shoreline Inventory and Characterization Report
June 2009 Page i
ACKNOWLEDGEMENTS
PIERCE COUNTY PLANNING AND LAND SERVICES DEPARTMENT-
Ty Booth
Ron Bridgman
Mike Erkkinen
Aaron Peterson
Carla Vincent
PIERCE COUNTY EXECUTIVE’S OFFICE
Debby Hyde
Tom Kantz
PIERCE COUNTY COUNCIL OFFICE
Mike Kruger
Hugh Taylor
PIERCE COUNTY PUBLIC WORKS & UTILITIES
Janine Redmond
PIERCE COUNTY PARKS & RECREATION
Grant Griffin
SHORELINE TECHNICAL GROUP
Bill Cleland, DOH
Jeff Davis, WDFW
Hugo Flores, WDNR
Martin Fox, Muckleshoot Tribe
Stuart Glasoe, Puget Sound
Action Team
Greg Griffith, DAHP
Dan Guy, NOAA Fisheries
Mike Middleton, Muckleshoot
Tribe
Dave Molenaar, WDFW
Travis Nelson, WDFW
Patrick Reynolds, Muckleshoot
Tribe
Steve Taylor, Muckleshoot Tribe
and
Jeffrey Thomas, Puyallup Tribe
Derrick Toba, WDNW
Karen Walters, Muckleshoot
Tribe
Scott Williams, DAHP
Wynnae Wright, DWNR
SHORELINE CITIZENS ADVISORY COMMITTEE
Marian Berejikian
Angela Butts
Wanda Coats
Ann Coon
Diane Cooper
James Depew
Bryan Flint
Tara Froode
Carole Holmaas
Larry Johnson
Krystal Kyer
Russ Ladley
Andy Markos
Iris Mohr
Ray Mohr
Michael Murphy
Leslie Ann Rose
Catherine
Rudolph
Al Schmauder
Barbara Schoos
Kirk Schuler
Tiffany Speir
Wendell Stroud
David Troutt
Richard Van Cise
Jason Walter
Norman Webster
Erika Wiksten


Pierce County Shoreline Inventory and Characterization Report
June 2009 Page iii
TABLE OF CONTENTS
Acknowledgements ........................................................................................................................................ i
Table of Contents ......................................................................................................................................... iii
List of Appendices ...................................................................................................................................... vii
List of Tables ............................................................................................................................................... ix
List of Figures .............................................................................................................................................. xi
Acronymns ................................................................................................................................................. xiii
Chapter 1 Introduction .......................................................................................................................... 1-1 1.1 Background and Purpose ............................................................................................................ 1-1 1.2 Report Organization ................................................................................................................... 1-2 1.3 Regulatory Overview ................................................................................................................. 1-2
1.3.1 Shoreline Management Act and Shoreline Guidelines ...................................................................... 1-2 1.3.2 Shoreline Jurisdiction ........................................................................................................................ 1-3 1.3.3 History of Shoreline Master Program in Pierce County .................................................................... 1-3 1.3.4 Recent Amendments .......................................................................................................................... 1-4 1.3.5 Other Pierce County Plans and Policies ............................................................................................. 1-4 1.3.6 Coordination with Local Jurisdictions ............................................................................................... 1-5
Chapter 2 Methods ................................................................................................................................ 2-1 2.1 Data Sources ............................................................................................................................... 2-1 2.2 Establishing a Planning Area Boundary ..................................................................................... 2-1
2.2.1 Potential Shorelines Not Designated by WAC 173-18 or 173-20...................................................... 2-1 2.2.2 Lineal Extent of Shoreline Jurisdiction .............................................................................................. 2-2 2.2.3 Lateral Extent of Shoreline Jurisdiction / Planning Area ................................................................... 2-3
2.3 Approach to Characterizing Ecosystem-Wide Processes and Shoreline Functions ................... 2-5 2.3.1 Nearshore Marine .............................................................................................................................. 2-5 2.3.2 Freshwater Shorelines ........................................................................................................................ 2-6
2.4 Approach to Inventory and Characterization of Regulated Shorelines ...................................... 2-9 2.4.1 GIS Analysis and Mapping ................................................................................................................ 2-9 2.4.2 Determining Reach Breaks ................................................................................................................ 2-9 2.4.3 Comparison to Other Methods ......................................................................................................... 2-13
Chapter 3 Ecosystem Profile ................................................................................................................. 3-1 3.1 Introduction ................................................................................................................................ 3-1 3.2 Overview .................................................................................................................................... 3-1
3.2.1 WRIA 10 – Puyallup-White Rivers ................................................................................................... 3-1 3.2.2 WRIA 11 – Nisqually River .............................................................................................................. 3-2 3.2.3 WRIA 12 – Chambers-Clover Creek ................................................................................................. 3-3 3.2.4 WRIA 15 – Kitsap Peninsula and Islands .......................................................................................... 3-3 3.2.5 WRIA 26 – Cowlitz River ................................................................................................................. 3-4 3.2.6 Climate, Geology and Landform ....................................................................................................... 3-5 3.2.7 Marine Shorelines and Oceanography ............................................................................................... 3-9 3.2.8 Fish and Wildlife Habitats ............................................................................................................... 3-10 3.2.9 Fish and Wildlife Species ................................................................................................................ 3-19 3.2.10 Land Use and Land Cover ............................................................................................................... 3-23
3.3 Ecosystem Processes ................................................................................................................ 3-25 3.3.1 Nearshore Marine Processes ............................................................................................................ 3-25 3.3.2 Nearshore Marine Alterations .......................................................................................................... 3-30 3.3.3 Freshwater Ecosystem Processes ..................................................................................................... 3-36 3.3.4 Assessment of Freshwater Ecosystem Shoreline Conditions ........................................................... 3-53
Chapter 4 Puyallup/White River Shoreline Planning Area (WRIA 10) ............................................... 4-1 4.1 Water Bodies in the Puyallup/White River Shoreline Planning Area ........................................ 4-1

Pierce County Shoreline Inventory and Characterization Report
Page iv June 2009
4.1.1 Alphabetical Listing of Water Bodies ................................................................................................ 4-1 4.1.2 Listing of Freshwater Bodies by Drainage Basin .............................................................................. 4-3
4.2 Marine Shorelines of Statewide Significance............................................................................. 4-5 4.2.1 Dash Point / Browns Point ................................................................................................................. 4-5
4.3 Freshwater Shorelines of Statewide Significance .................................................................... 4-10 4.3.1 Puyallup River ................................................................................................................................. 4-10 4.3.2 White River ...................................................................................................................................... 4-23 4.3.3 Lake Tapps....................................................................................................................................... 4-31
4.4 Rivers, Shorelines of the State ................................................................................................. 4-35 4.4.1 Bear Creek ....................................................................................................................................... 4-35 4.4.2 Canyon Creek Two .......................................................................................................................... 4-36 4.4.3 Carbon River .................................................................................................................................... 4-37 4.4.4 Cayada Creek ................................................................................................................................... 4-44 4.4.5 Chenuis Creek .................................................................................................................................. 4-45 4.4.6 Clarks Creek .................................................................................................................................... 4-46 4.4.7 Clearwater River .............................................................................................................................. 4-50 4.4.8 Deer Creek ....................................................................................................................................... 4-54 4.4.9 East Fork South Prairie Creek.......................................................................................................... 4-55 4.4.10 Eleanor Creek .................................................................................................................................. 4-57 4.4.11 Evans Creek ..................................................................................................................................... 4-58 4.4.12 Fennel Creek .................................................................................................................................... 4-59 4.4.13 Gale Creek ....................................................................................................................................... 4-62 4.4.14 George Creek ................................................................................................................................... 4-63 4.4.15 Goat Creek ....................................................................................................................................... 4-64 4.4.16 Greenwater River ............................................................................................................................. 4-65 4.4.17 Huckleberry Creek ........................................................................................................................... 4-70 4.4.18 Hylebos Creek ................................................................................................................................. 4-73 4.4.19 Kapowsin Creek ............................................................................................................................... 4-77 4.4.20 Kings Creek ..................................................................................................................................... 4-80 4.4.21 Lost Creek - Greenwater .................................................................................................................. 4-81 4.4.22 Lost Creek - Huckleberry ................................................................................................................ 4-82 4.4.23 Maggie Creek ................................................................................................................................... 4-83 4.4.24 Meadow Creek ................................................................................................................................. 4-84 4.4.25 Milky Creek ..................................................................................................................................... 4-86 4.4.26 Mowich River .................................................................................................................................. 4-87 4.4.27 Neisson Creek .................................................................................................................................. 4-90 4.4.28 North Puyallup River ....................................................................................................................... 4-91 4.4.29 Ohop Creek - Kapowsin .................................................................................................................. 4-93 4.4.30 Page Creek ....................................................................................................................................... 4-95 4.4.31 Pinochle Creek ................................................................................................................................. 4-96 4.4.32 Rushingwater Creek ......................................................................................................................... 4-97 4.4.33 Saint Andrews Creek ....................................................................................................................... 4-99 4.4.34 Silver Creek ................................................................................................................................... 4-100 4.4.35 South Fork South Prairie Creek ..................................................................................................... 4-101 4.4.36 South Prairie Creek ........................................................................................................................ 4-103 4.4.37 South Puyallup River ..................................................................................................................... 4-108 4.4.38 Tolmie Creek ................................................................................................................................. 4-111 4.4.39 Twenty-Eight Mile Creek .............................................................................................................. 4-112 4.4.40 Unnamed Tributary of Puyallup River........................................................................................... 4-113 4.4.41 Unnamed Tributary of South Puyallup River ................................................................................ 4-114 4.4.42 Viola Creek .................................................................................................................................... 4-115 4.4.43 Voight Creek .................................................................................................................................. 4-116 4.4.44 West Fork White River .................................................................................................................. 4-120 4.4.45 Wilkeson Creek ............................................................................................................................. 4-123
4.5 Lakes, Shorelines of the State ................................................................................................ 4-127

Pierce County Shoreline Inventory and Characterization Report
June 2009 Page v
4.5.1 Echo Lake ...................................................................................................................................... 4-127 4.5.2 Kapowsin Lake .............................................................................................................................. 4-128 4.5.3 Leaky Lake .................................................................................................................................... 4-129 4.5.4 Morgan Lake .................................................................................................................................. 4-131 4.5.5 Mud Mountain Lake ...................................................................................................................... 4-132 4.5.6 Printz Basin .................................................................................................................................... 4-134 4.5.7 Rhodes Lake .................................................................................................................................. 4-136 4.5.8 Gaps in Existing Information ......................................................................................................... 4-139
Chapter 5 Nisqually River Shoreline Planning Area (WRIA 11) ........................................................ 5-1 5.1 Water Bodies in the Nisqually River Shoreline Planning Area ................................................. 5-1
5.1.1 Alphabetical Listing of Water Bodies ................................................................................................ 5-1 5.1.2 Listing of Freshwater Bodies by Drainage Basin .............................................................................. 5-2
5.2 Marine Shorelines of Statewide Significance............................................................................. 5-4 5.2.1 Nisqually Nearshore .......................................................................................................................... 5-4
5.3 Freshwater Shorelines of Statewide Significance ...................................................................... 5-8 5.3.1 Nisqually River .................................................................................................................................. 5-8 5.3.2 Alder Lake ....................................................................................................................................... 5-17 5.3.3 Restoration Opportunities ................................................................................................................ 5-19
5.4 Rivers, Shorelines of the State ................................................................................................. 5-19 5.4.1 Beaver Creek ................................................................................................................................... 5-19 5.4.2 Busy Wild Creek .............................................................................................................................. 5-21 5.4.3 Copper Creek ................................................................................................................................... 5-22 5.4.4 Horn Creek....................................................................................................................................... 5-23 5.4.5 Little Mashel River .......................................................................................................................... 5-25 5.4.6 South Fork of the Little Mashel River ............................................................................................. 5-29 5.4.7 Lynch Creek..................................................................................................................................... 5-30 5.4.8 Mashel River .................................................................................................................................... 5-34 5.4.9 Unnamed Tributary, Mashel River .................................................................................................. 5-39 5.4.10 Midway Creek ................................................................................................................................. 5-40 5.4.11 Muck Creek ..................................................................................................................................... 5-41 5.4.12 Ohop Creek - Nisqually ................................................................................................................... 5-45 5.4.13 South Creek ..................................................................................................................................... 5-48 5.4.14 Tanwax Creek .................................................................................................................................. 5-50 5.4.15 Twenty-five Mile Creek ................................................................................................................... 5-53
5.5 Lakes, Shorelines of the State .................................................................................................. 5-55 5.5.1 Benbow Lakes ................................................................................................................................. 5-55 5.5.2 Clear Lake ........................................................................................................................................ 5-56 5.5.3 Cranberry Lake ................................................................................................................................ 5-58 5.5.4 Harts Lake ........................................................................................................................................ 5-59 5.5.5 Kreger Lake ..................................................................................................................................... 5-60 5.5.6 Little Lake ........................................................................................................................................ 5-62 5.5.7 Muck Lake ....................................................................................................................................... 5-63 5.5.8 Mud Lake ......................................................................................................................................... 5-64 5.5.9 Ohop Lake ....................................................................................................................................... 5-65 5.5.10 Rapjohn Lake ................................................................................................................................... 5-67 5.5.11 Silver Lake ....................................................................................................................................... 5-68 5.5.12 Tanwax Lake ................................................................................................................................... 5-70 5.5.13 Trout Lake ....................................................................................................................................... 5-71 5.5.14 Tule Lake ......................................................................................................................................... 5-73 5.5.15 Twenty-seven Lake .......................................................................................................................... 5-74 5.5.16 Twin Lake ........................................................................................................................................ 5-75 5.5.17 Unnamed Lake (Tanwax) ................................................................................................................ 5-76 5.5.18 Unnamed Lake (South of Roy) ........................................................................................................ 5-77 5.5.19 Whitman Lake ................................................................................................................................. 5-79 5.5.20 La Grande Reservoir ........................................................................................................................ 5-80

Pierce County Shoreline Inventory and Characterization Report
Page vi June 2009
5.5.21 Gaps in Existing Information ........................................................................................................... 5-82
Chapter 6 Chambers-Clover Shoreline Planning Area (WRIA 12) ...................................................... 6-1 6.1 Water Bodies in the Chambers-Clover Shoreline Planning Area............................................... 6-1
6.1.1 Alphabetical Listing of Water Bodies ................................................................................................ 6-1 6.1.2 Listing of Freshwater Bodies by Drainage Basin .............................................................................. 6-1
6.2 Freshwater Shorelines of Statewide Significance ...................................................................... 6-2 6.2.1 American Lake ................................................................................................................................... 6-2
6.3 Rivers, Shorelines of the State ................................................................................................... 6-4 6.3.1 Chambers Creek ................................................................................................................................. 6-4 6.3.2 Clover Creek ...................................................................................................................................... 6-8 6.3.3 Spanaway Creek .............................................................................................................................. 6-13
6.4 Lakes, Shorelines of the State .................................................................................................. 6-17 6.4.1 Spanaway Lake ................................................................................................................................ 6-17 6.4.2 Gaps in Existing Information (WRIA 12) ........................................................................................ 6-19
Chapter 7 Kitsap Peninsula Shoreline Planning Area (WRIA 15) ....................................................... 7-1 7.1 Water Bodies in the Kitsap Peninsula Shoreline Planning Area ................................................ 7-1
7.1.1 Alphabetical Listing of Water Bodies ................................................................................................ 7-1 7.1.2 Listing of Freshwater Bodies by Drainage Basin .............................................................................. 7-2
7.2 Marine Shorelines of Statewide Significance............................................................................. 7-3 7.2.1 Colvos Passage – Tacoma Narrows ................................................................................................... 7-3 7.2.2 Hale Passage – Wollochet Bay ........................................................................................................ 7-10 7.2.3 Carr Inlet – Henderson Bay ............................................................................................................. 7-16 7.2.4 South Key Peninsula and Islands ..................................................................................................... 7-28 7.2.5 Case Inlet ......................................................................................................................................... 7-39
7.3 Rivers, Shorelines of the State ................................................................................................. 7-48 7.3.1 Minter Creek .................................................................................................................................... 7-48 7.3.2 Rocky Creek .................................................................................................................................... 7-50
7.4 Lakes, Shorelines of the State .................................................................................................. 7-52 7.4.1 Bay Lake .......................................................................................................................................... 7-52 7.4.2 Butterworth Reservoir...................................................................................................................... 7-54 7.4.3 Carney Lake ..................................................................................................................................... 7-55 7.4.4 Crescent Lake .................................................................................................................................. 7-57 7.4.5 Florence Lake .................................................................................................................................. 7-59 7.4.6 Jackson Lake .................................................................................................................................... 7-61 7.4.7 Josephine Lake ................................................................................................................................. 7-62 7.4.8 Lake Minterwood ............................................................................................................................. 7-64 7.4.9 Stansberry Lake ............................................................................................................................... 7-65 7.4.10 Gaps in Existing Information for Freshwater Shorelines (for all of WRIA 15) ............................... 7-66
Chapter 8 shoreline use analysis ........................................................................................................... 8-1 8.1 Trends and Future Demand ........................................................................................................ 8-1
8.1.1 Shoreline Development Trends .......................................................................................................... 8-1 8.1.2 Demand for Water-Dependent Uses .................................................................................................. 8-5 8.1.3 Park, Recreation, & Open Space Plan................................................................................................ 8-6
8.2 Potential Use Conflicts ............................................................................................................... 8-7 8.2.1 Piers and Docks ................................................................................................................................. 8-7 8.2.2 Aquaculture and Other Shoreline Uses and Activities ....................................................................... 8-8 8.2.3 Flood Management and Habitat Restoration ................................................................................... 8-10 8.2.4 Permit Exemptions and Cumulative Impacts ................................................................................... 8-10 8.2.5 Energy Development and Marine Habitat Quality ........................................................................... 8-11
Chapter 9 Summary and recommendations .......................................................................................... 9-1 9.1 Summary of Pierce County Shorelines ...................................................................................... 9-1 9.2 Watershed Analysis Summary ................................................................................................... 9-3
9.2.1 Puyallup/White River Watershed (WRIA 10) ................................................................................... 9-3

Pierce County Shoreline Inventory and Characterization Report
June 2009 Page vii
9.2.2 Nisqually River Watershed (WRIA 11) ............................................................................................. 9-5 9.2.3 Chambers/Clover Creek Watershed (WRIA 12) ................................................................................ 9-6 9.2.4 Kitsap Peninsula Watershed (WRIA 15) ........................................................................................... 9-7
9.3 Reach Scale Analysis Summary ................................................................................................. 9-9 9.3.1 Puyallup/White River Watershed (WRIA 10) ................................................................................... 9-9 9.3.2 Nisqually River Watershed (WRIA 11) ........................................................................................... 9-10 9.3.3 Chambers/Clover Creek Watershed (WRIA 12) .............................................................................. 9-10 9.3.4 Kitsap Peninsula Watershed (WRIA 15) ......................................................................................... 9-10
9.4 Management Recommendations .............................................................................................. 9-11
Chapter 10 REFERENCES ................................................................................................................... 10-1
LIST OF APPENDICES
APPENDIX A - MAPS FOLIO
Map 1. Shorelines of the State
Map 2. City Limits and Urban Growth Areas
Map 3. Indian Reservation Lands
Map 4. Marine Shorelines
Map 5. Freshwater Shorelines
Map 6. WRIAS and Basins
Map 7. Geology
Map 8. Soils
Map 9. Topography and Hydrology
Map 10. Land Cover
Map 11. Hydrology - Important Areas
Map 12. Hydrology - Alterations
Map 13. % Impervious Surface by Basin
Map 14. Forest Cover
Map 15. Sediment - Important Areas
Map 16. Sediment - Alterations
Map 17. Water Quality - Important Areas
Map 18. Water Quality - Alterations
Map 19. Organics
Map 20. Shoreline Inventory Areas
Map 21. Marine Shoreline Reaches
Map 22. Freshwater Shoreline Reaches - East
Map 23. Freshwater Shoreline Reaches - West
Map 24. Eelgrass and Kelp Beds
Map 25. Commercial Shellfish Growing Areas

Pierce County Shoreline Inventory and Characterization Report
Page viii June 2009
Map 26. Existing Land Use Patterns
Map 27. Future Land Use
Map 28. Marine Reaches - Existing Environmental Designations
Map 29. Eastern Freshwater Reaches - Existing Environment Designations
Map 30. Western Freshwater Reaches - Existing Environment Designations
APPENDIX B - GIS DATA SOURCES
APPENDIX C – REACH SCALE TABLES
Table 1A Marine Reaches Pierce County
Table 1B. Freshwater Reaches Pierce County
Table 2. Coastal Data by Marine Reach
Table 3. Biological and Water Quality Data by Marine Reach, Pierce County
Table 4A. Wetland Area by Marine Reach
Table 4B. Wetland Area by Freshwater Reach
Table 5A. Geologic and Hazard Data by Marine Reach
Table 5B. Geologic and Hazard Data by Freshwater Reach
Table 6. Fish Species, Habitat and Water Quality by Freshwater Reach
Table 7. Contaminated Sites, Marine
Table 8 Contaminated Sites, Freshwater
Table 9A. Land Use by Marine Reach
Table 9B. Land Use by Freshwater Reach
Table 10A. Parks and Public Access by Marine Reach
Table 10B. Parks and Public Access by Freshwater Reach
Table 11. Conservation Futures by Reach
APPENDIX D – GLOSSARY
APPENDIX E - FRESHWATER RIVER FUNCTIONAL ASSESSMENT TABLES
WRIA 10 Analysis
WRIA 11 Analysis
WRIA 12 Analysis
WRIA 15 Analysis

Pierce County Shoreline Inventory and Characterization Report
June 2009 Page ix
LIST OF TABLES
Table 2-1. Shoreline Rivers within Incorporated City Limits in Pierce County, Washington ... 2-3
Table 2-2. Examples of Process-intensive Areas, Mechanisms by which they Operate, and
Alterations for Key Ecosystem Processes ............................................................................ 2-8
Table 2-3. Shoreline Summary by Type, Pierce County, Washington ..................................... 2-10
Table 3-1. Federal and State Listed Species in Pierce County ................................................. 3-20
Table 3-2. Sub-basin-scale summary of land cover data .......................................................... 3-24
Table 3-3. Parameters and ranges for assessment of alteration to ecosystem functioning for
hydrologic processes .......................................................................................................... 3-41
Table 3-4. Parameters and ranges for assessment of alterations to ecosystem functioning for
sediment processes ............................................................................................................. 3-44
Table 3-5. Parameters and ranges for assessment of alteration to ecosystem functioning for
water quality processes ...................................................................................................... 3-45
Table 3-6. Parameters and ranges for assessment of alterations to ecosystem functioning for
organic material processes ................................................................................................. 3-48
Table 3-7. Summary of Parameters by sub-basin ..................................................................... 3-49
Table 3-8. WRIA 10 Summary table listing overall assessment of alteration for each group of
ecosystem processes ........................................................................................................... 3-53
Table 3-9. WRIA 11 Summary table listing overall assessment of alteration for each group of
ecosystem processes ........................................................................................................... 3-55
Table 3-10. WRIA 12 Summary table listing overall assessment of alteration for each group of
ecosystem processes ........................................................................................................... 3-56
Table 3-11. WRIA 15 Summary table listing overall assessment of alteration for each group of
ecosystem processes ........................................................................................................... 3-56
Table 3-12. WRIA 26 Summary table listing overall assessment of alteration for each group of
ecosystem processes ........................................................................................................... 3-57
Table 4-1. WRIA 10 Freshwater Bodies by Drainage Basin ...................................................... 4-3
Table 4-2. Feeder Bluff Data for Browns Point (Pentec 2003) .................................................. 4-6
Table 4-3. Shoreline Modification Data for Browns Point (Pentec 2003). ................................ 4-8
Table 4-4. Reach assessment for the Puyallup River ................................................................ 4-21
Table 4-5. Reach assessment for the White River .................................................................... 4-29
Table 4-6. Reach summary for Lake Tapps .............................................................................. 4-34
Table 4-7. Reach Summary for Carbon River .......................................................................... 4-43
Table 4-8. Reach assessment for Clearwater River .................................................................. 4-53
Table 4-9. Reach assessment for Greenwater River ................................................................. 4-69
Table 4-10. Reach assessment for Huckleberry Creek ............................................................. 4-72
Table 4-11. Reach assessment for Kapowsin Creek. ................................................................ 4-79

Pierce County Shoreline Inventory and Characterization Report
Page x June 2009
Table 4-12. Reach assessment for the Mowich River ............................................................... 4-89
Table 4-13. Reach Assessment for South Prairie Creek ......................................................... 4-107
Table 4-14. Reach Assessment for South Puyallup River ...................................................... 4-110
Table 4-15. Reach assessment for Voight Creek .................................................................... 4-119
Table 4-16. Reach assessment for West Fork White River .................................................... 4-122
Table 4-17. Reach assessment for Wilkeson Creek ................................................................ 4-126
Table 4-18. Reach assessment for Rhodes Lake ..................................................................... 4-138
Table 4-19. Waterbody Parameters ......................................................................................... 4-139
Table 5-1. WRIA 11 Water Bodies by Drainage Basin .............................................................. 5-3
Table 5-2. Reach Assessment for the Nisqually River ............................................................. 5-16
Table 6-1. WRIA 12 Freshwater Bodies by Drainage Basin ...................................................... 6-1
Table 7-1. WRIA 15 Freshwater Bodies by Drainage Basin ...................................................... 7-2
Table 7-2. Feeder Bluff Data for Colvos Passage – Tacoma Narrows (Pentec 2003) ................ 7-3
Table 7-3. Drift Cells within Colvos Passage – Tacoma Narrows (Pentec 2003) ...................... 7-4
Table 7-4. Potential Forage Fish Habitat, Colvos Passage – Tacoma Narrows ......................... 7-5
Table 7-5. Shoreline Modification Data for Colvos Passage and Tacoma Narrows (Pentec 2003)
.............................................................................................................................................. 7-7
Table 7-6. Reach Assessment for the Colvos Passage– Tacoma Narrows Marine Management
Unit ...................................................................................................................................... 7-9
Table 7-7. Feeder Bluff Data for Hale Passage and Wollochet Bay (Pentec 2003) ................. 7-10
Table 7-8. Drift Cell Data for Hale Passage and Wollochet Bay (Pentec 2003) ...................... 7-11
Table 7-9. Forage Fish Habitat in Hale Passage and Wollochet Bay (Pentec 2003) ................ 7-12
Table 7-10. Shoreline Modification Data for Hale Passage and Wollochet Bay (Pentec 2003)
............................................................................................................................................ 7-13
Table 7-11. Reach Assessment for the Hale Passage – Wollochet Bay (HP_WB) Marine
Management Unit ............................................................................................................... 7-15
Table 7-12. Feeder Bluff Data for Carr Inlet – Henderson Bay (Pentec 2003) ........................ 7-16
Table 7-13. Carr Inlet – Henderson Bay Drift Cell Data (Pentec 2003).................................. 7-17
Table 7-14. Forage Fish Habitat in Carr Inlet – Henderson Bay (Pentec 2003) ....................... 7-19
Table 7-15. Shoreline Modifications for Carr Inlet – Henderson Bay (Pentec 2003) .............. 7-21
Table 7-16. Reach Assessment for Carr Inlet - Henderson Bay (CI_HB) Marine Management
Area .................................................................................................................................... 7-24
Table 7-17. Feeder Bluff on Anderson Island, Ketron and McNeil, and South Key Peninsula7-28
Table 7-18. Drift Cell Data for Anderson Island, Ketron and South Key Peninsula ................ 7-29
Table 7-19. Forage Fish Habitat for Anderson, Ketron and McNeil Islands, and South Key
Peninsula ............................................................................................................................ 7-31
Table 7-20. Shoreline Modifications for Anderson, Ketron, McNeil Islands and South Key
Peninsula ............................................................................................................................ 7-34
Table 7-21. Reach Assessment for South Key Peninsula and Islands Marine Unit ................. 7-36
Table 7-22. Feeder Bluff Data for Case Inlet ........................................................................... 7-39

Pierce County Shoreline Inventory and Characterization Report
June 2009 Page xi
Table 7-23. Drift Cell Data for Case Inlet ............................................................................... 7-40
Table 7-24. Potential Forage Fish Habitat on Case Inlet .......................................................... 7-41
Table 7-25. Modifications by Reach for Case Inlet (Pentec 2003) ........................................... 7-43
Table 7-26. Reach Assessment for the Case Inlet (CI) Marine Management Area .................. 7-45
Table 7-27. Waterbody Data Gaps ............................................................................................ 7-67
Table 9-1. Shorelines identified in Pierce County, Washington ................................................. 9-2
Table 9-2. Waterbodies newly identified as shorelines in Pierce County, Washington ............. 9-3
Table 9-3. Shorelines inventoried in the Puyallup/White River Watershed ............................... 9-4
Table 9-4. Shorelines inventoried in the Nisqually River Watershed ........................................ 9-6
Table 9-5. Shorelines inventoried in the Chambers/Clover Creek Watershed ........................... 9-6
Table 9-6. Shorelines inventoried in Kitsap Peninsula Watershed (WRIA 15) ......................... 9-8
LIST OF FIGURES
Figure 2-1. Delineating the Shoreline Planning Area ................................................................. 2-4
Figure 2-2. Marine Reaches ...................................................................................................... 2-11
Figure 2-3. Freshwater Reach Break Example ......................................................................... 2-12
Figure 3-1. Percent forest versus percent impervious values for each sub-basin within Pierce
County. Vertical red line at 4% impervious and horizontal red line is at 65% forest cover
(see text discussion). .......................................................................................................... 3-40
Figure 3-2. Road crossings per mile of stream, by sub-basin. .................................................. 3-43
Figure 3-3. Percent forest within sub-basin, based on CCAP data presented in 10% bins. ..... 3-47
Figure 8-1. Shoreline Permit Locations 2000-2008 (Pierce County PALS GIS) ....................... 8-3
Figure 8-2. Residential Permit Locations 2000-2007 (PSRC via Pierce County PALS GIS ..... 8-4


Pierce County Shoreline Inventory and Characterization Report
June 2009 Page xiii
ACRONYMNS
BPA Bonneville Power Administration NWI National Wetland Inventory
DPS Distinct Population Segment OHWM ordinary high water mark
cfs cubic feet per second ONP Olympic National Park
CGS Coastal Geologic Services ONF Olympic National Forest
CMZ channel migration zone PAHs polychlorinated aromatic
hydrocarbons
DEM Digital elevation model PCBs Polychlorinated biphenyls
Ecology Washington State Department of
Ecology
PHS Priority Habitats and Species
EPA U.S. Environmental Protection
Agency
PNPTC Point No Point Treaty Council
ESU Evolutionarily Significant Unit RCW Revised Code of Washington
°F degrees Fahrenheit RM river mile
FEMA Federal Emergency Management
Agency
ROS rain-on-snow
GIS Geographic Information Systems SASSI Salmon and Steelhead Inventory
HCMZ historic channel migration zones SCS Soil Conservation Service
IPCC Intergovernmental Panel on
Climate Change
SED Shoreline Environment
Designation
km kilometer SMA Shoreline Management Act
LWD Large Woody Debris SMP Shoreline Master Program
mg/L milligrams per liter SSRFB State Salmon Recovery Funding
Board
MHHW Mean Higher High Water USFS United States Forest Service
MLLW Mean Lower Low Water USGS United States Geological Survey
MRC Marine Resources Committee USFWS United States Fish and Wildlife
Service
NOSC North Olympic Salmon
Commission
WAC Washington Administrative
Code
NPDES National Pollutant Discharge
Elimination System
WDFW Washington Department of Fish
and Wildlife
NPL National Priorities List WDNR Washington Department of
Natural Resources

Pierce County Shoreline Inventory and Characterization Report
Page xiv June 2009
NRC Nodal Riparian Corridor WDOH Washington Department of
Health
NRCA Natural Resource Conservation
Area
WFPB Washington Forest Practices
Board
NRCS Natural Resources Conservation
Service
WRIA Water Resource Inventory Area
NSE Nearshore and Estuarine

Pierce County Shoreline Inventory and Characterization Report
CHAPTER 1 INTRODUCTION
1.1 Background and Purpose
Pierce County is updating its shoreline master program (SMP). According to Substitute Senate Bill (SSB) 6012, passed by the 2003 Washington State Legislature, cities and counties are required to amend their local SMPs consistent with the Shoreline Management Act (SMA), Revised Code of Washington (RCW) 90.58, and its implementing guidelines, Washington Administrative Code (WAC) 173-26.
The County is conducting its comprehensive SMP update in two phases over the next few years. The first phase is the development of an inventory and characterization of the Pierce County shorelines. This report provides the inventory and characterization study. In the second phase, the County will update its shoreline management policies and regulations.
This inventory and characterization documents current shoreline conditions and provides a basis for updating the County’s SMP goals, policies, and regulations. This characterization will help Pierce County identify existing conditions, evaluate existing functions and values of its shoreline resources, and explore opportunities for conservation and restoration of ecological functions.
This study characterizes ecosystem-wide processes and how these processes relate to shoreline functions. Processes and functions are evaluated at two different scales: (1) a watershed or landscape scale, and (2) a shoreline reach scale. The purpose of the watershed or landscape scale characterization is to identify ecosystem processes that shape shoreline conditions and to determine which processes have been altered or impaired. The intent of the shoreline reach scale inventory and characterization is to: (1) identify how existing conditions in or near the shoreline have responded to process alterations; and (2) determine the effects of the alteration on shoreline ecological functions. These findings will help provide a framework for future updates to the County’s shoreline management policies and regulations.
Pierce County Planning and Land Services (PALS) is the lead on the County’s SMP update. This study and analysis was prepared by ESA Adolfson in collaboration with PALS and with technical assistance from Parametrix, Coastal Geologic Services and Shannon & Wilson. Parametrix assisted with the biological characterization of the marine shorelines. Coastal Geologic Services analyzed coastal processes, bluffs and restoration opportunities. Shannon & Wilson provided information on landslide hazard, seismic, and geologic issues.
Pierce County and the cities within Pierce County are required to complete the SMP amendment process by the end of 2011. Funding for the Pierce County SMP update has been provided by the Washington State Department of Ecology (Ecology) through an SMA grant (Agreement No. G0700001). The state funds are provided by Budget Bill ESSB 6090 to implement local shoreline management and federal Coastal Zone Management funds. As per the requirements of the grant, the Draft Pierce County SMP is scheduled to be completed by June 30, 2009.
June 2009 Page 1-1

Pierce County Shoreline Inventory and Characterization Report
1.2 Report Organization
The information in this report is divided into nine (9) main sections. Chapter 1 – the Introduction - discusses the purpose of this report and describes the regulatory context for shoreline planning. Chapter 2 describes the methods, approach, and primary data sources used for this inventory and characterization. Chapter 3 provides a profile of the ecosystems within the County. This ecosystem profile discusses regional overview, process controls (e.g., climate, geology), and key ecosystem-wide processes and landscape analysis.
Chapters 4 through 7 provide the shoreline inventory for the four Water Resource Inventory Areas (WRIAs) within the County and the shoreline planning areas within each watershed. These are WRIA 10 - the Puyallup-White Rivers, WRIA 11- the Nisqually River watershed, WRIA 12 – the Chambers-Clover Creek watershed, and WRIA 15 - the Kitsap Peninsula. WRIA 26 – Cowlitz River extends into the southeastern corner of the County; however, this portion of the WRIA lies entirely s within Mount Rainier National Park and therefore is in federal, not County, jurisdiction. The inventory provides information regarding land use patterns and the physical and biological characterization of conditions in the vicinity of the shoreline regulatory zone (referred to as the shoreline planning area). These chapters also provide an assessment of shoreline functions, and identify potential opportunity areas for protection, enhancement, and restoration. Identified data gaps are listed at the end of each WRIA discussion.
Chapter 8 discusses shoreline use conflicts and opportunities for the County. This chapter analyzes shoreline uses, including public access, based upon future demand for water dependent uses and public access. Chapter 9 provides a summary and conclusion for this inventory and analysis. References are contained in the last section of the report.
Appendix A is a map folio that illustrates the County’s shoreline planning area and documents various biological, land uses, and physical elements at the landscape analysis scale. Appendix B identifies the GIS data sources used in development of the map folio. Appendix C includes the reach-scale analysis matrices. Appendix D is the glossary of terms used in this report. Appendix E includes the summarized shoreline functions by waterbody.
1.3 Regulatory Overview
1.3.1 Shoreline Management Act and Shoreline Guidelines
Washington’s Shoreline Management Act (SMA) was passed by the State Legislature in 1971 and adopted by the public in a referendum. The SMA was created in response to a growing concern among residents of the state that serious and permanent damage was being done to shorelines of the state by unplanned and uncoordinated development. The goal of the SMA was “to prevent the inherent harm in an uncoordinated and piecemeal development of the state’s shorelines.” While protecting shoreline resources by regulating development, the SMA is also intended to provide for appropriate shoreline use. The SMA encourages public access and use of the shoreline and provision of water-dependent uses, as well as land uses that enhance and conserve shoreline functions and values.
The primary responsibility for administering the SMA is assigned to local governments through the mechanism of local shoreline master programs, adopted under guidelines established by
Page 1-2 June 2009

Pierce County Shoreline Inventory and Characterization Report
Ecology. The guidelines (WAC 173-26) establish goals and policies that provide a framework for development standards and use regulations in the shoreline. The SMP is based on state guidelines but tailored to the specific conditions and needs of individual communities. The SMP is also meant to be a comprehensive vision of how the County’s shoreline area will be managed over time.
1.3.2 Shoreline Jurisdiction
Under the SMA, the shoreline jurisdiction includes areas that are 200 feet landward of the ordinary high water mark (OHWM) of waters that have been designated as “shorelines of statewide significance” or “shorelines of the state.” These designations were established in 1972 and are described in WAC 173-18. Generally, “shorelines of statewide significance” include portions of Puget Sound and other marine waterbodies, rivers west of the Cascade Range that have a mean annual flow of 1,000 cubic feet per second (cfs) or greater, rivers east of the Cascade Range that have a mean annual flow of 200 cfs or greater, and freshwater lakes with a surface area of 1,000 acres or more (RCW 90.58.030). “Shorelines of the state” are generally described as all marine shorelines and shorelines of all streams or rivers having a mean annual flow of 20 cfs or greater and lakes with a surface area 20 acres or greater (RCW 90.58.030).
The shoreline area to be regulated under Pierce County’s SMP must include all shorelines of statewide significance, shorelines of the state, and their adjacent shorelands, defined as the upland area within 200 feet of the OHWM, as well as any “associated wetlands” (RCW 90.58.030). “Associated wetlands” means those wetlands that are in proximity to and either influence or are influenced by tidal waters or a lake or stream subject to the SMA (WAC 173-22-030 (1)). These are typically identified as wetlands that physically extend into the shoreline jurisdiction, or wetlands that are functionally related to the shoreline jurisdiction through surface water connection and/or other factors. The specific language from the RCW describes the limits of shoreline jurisdiction as follows:
Those lands extending landward for two hundred feet in all directions as measured on a horizontal plane from the ordinary high water mark; floodways and contiguous floodplain areas landward two hundred feet from such floodways; and all associated wetlands and river deltas (RCW 90.58.030(2)(f)).
Local jurisdictions can choose to regulate development under their SMPs for all areas within the 100-year floodplain or a smaller area as defined above (RCW 90.58.030(2)(f)(i)).
Waterbodies in Pierce County regulated under the SMA and the County’s SMP include marine shorelines of Puget Sound, rivers and streams, and numerous lakes. Shorelines of statewide significance include marine waterbodies below the extreme low tidal mark; portions of the Nisqually River, Puyallup River, and White River; and Alder Lake, American Lake, and Lake Tapps (Map 1).
1.3.3 History of Shoreline Master Program in Pierce County
The original Pierce County SMP was adopted in two phases. Phase I, adopted by the Board of Pierce County Commissioners on March 4, 1974, contains the goals and policies of the program, describes the shorelines in County jurisdiction, describes the environment designations and
June 2009 Page 1-3

Pierce County Shoreline Inventory and Characterization Report
summarizes the public involvement process used by the County. It includes shoreline environment designation maps and several appendices with supporting information.
Phase II includes the Shoreline Use Regulations for Pierce County, adopted by the Board of Pierce County Commissioners on April 4, 1975. The Phase II document, which has undergone several minor updates since initial adoption, is currently found in Title 20 of the Pierce County Code. Title 20 establishes shoreline environment designations, use regulations, and permitting procedures to govern development and other activities in the County’s shorelines. Title 20 was last updated in 1992.
Local SMPs establish a system to classify shoreline areas into specific “environment designations.” The purpose of shoreline environment designations is to provide a uniform basis for applying policies and use regulations within distinctly different shoreline areas. Generally, environment designations should be based on biological and physical capabilities and limitations of the shoreline, existing and planned development patterns, and a community’s vision or objectives for its future development. The County’s 1974 SMP establishes five environment designations: Natural, Conservancy, Rural, Rural-Residential and Urban. These shoreline environment designations were assigned to the County’s shorelines based upon the results of a comprehensive inventory, which determined the quantity and quality of the County’s shoreline resources at the time.
1.3.4 Recent Amendments
The County introduced amendments to the SMP in 2006 to address aquaculture activities and the construction of new docks and piers. The amendments to regulations for aquaculture address intertidal geoduck harvest on marine shorelines and include standards for rights to harvest, access, hours of operation, visual impacts, impacts on public use of the shoreline, litter control, and harvest methods. The amendments to the regulations for docks and piers address impacts to navigation, limit visual impacts, define float lifts, prohibit the location of piers, docks and floats/float lifts in marine Conservancy shoreline environments, and prohibit covered docks, piers, and floats/float lifts in all shoreline environments.
The County Council adopted the amendments to the SMP for geoduck and aquaculture in October 2007. Required review by the Department of Ecology is pending. The proposed standards for piers and docks were tabled to be considered as part of the comprehensive SMP update process.
1.3.5 Other Pierce County Plans and Policies
A variety of other regulatory programs, plans, and policies work in concert with the County’s SMP to manage shoreline resources and regulate development near the shoreline. The County’s development standards and use regulations for environmentally critical areas (Title 18.E, Development Regulations – Critical Areas) are particularly relevant to the County’s SMP. Designated environmentally critical areas are found throughout the County’s shoreline jurisdiction, including streams, wetlands, fish and wildlife conservation areas, flood hazard areas, and geologic hazard areas.
Page 1-4 June 2009

Pierce County Shoreline Inventory and Characterization Report
June 2009 Page 1-5
Pierce County is actively engaged in developing community plans for specific regions of the County. These community plans are designed to express the interests of the local citizens in how the goals and policies of the Comprehensive Plan are carried out in specific communities. Community plans have been adopted for the following communities which contain shorelines in Pierce County: Upper Nisqually Valley, Parkland-Spanaway-Midland, Gig Harbor Peninsula, Frederickson, Mid-County, and Graham. Community plans are currently being developed for the following communities containing shorelines of the state: Key Peninsula, Alderton-McMillin, Browns Point – Dash Point, and Anderson & Ketron Islands.
1.3.6 Coordination with Local Jurisdictions
Other local cities within or adjacent to Pierce County are updating their shoreline master programs and are also conducting shoreline inventories. This report has included information from other shoreline inventories and characterizations, where appropriate, or provided citations to these other reports. Jurisdictions with shoreline inventory information used in Pierce County’s inventory and analysis include: Cities of Tacoma, Puyallup, Sumner, Auburn, and Federal Way.

Pierce County Shoreline Inventory and Characterization Report
June 2009 Page 2-1
CHAPTER 2 METHODS
2.1 Data Sources
The Department of Ecology 2003 shoreline master program guidelines state that shoreline inventory and characterizations to support local SMP amendments should be based on scientific and technical information. Inventories should use existing sources of information that are both relevant and reasonably available (WAC 173-26-201(3)(c)). Aside from reconnaissance-level field visits, no new field-based data collection efforts were performed to develop the summaries and characterization included in this document.
This report incorporates and builds on past work the County has undertaken relevant to its SMP. Most notably, the County completed a marine shoreline inventory in 2003 (Pentec Environmental, 2003). Other key sources of information include County planning documents and technical studies (including comprehensive plans and basin plans), and watershed planning documents for Water Resource Inventory Areas (WRIAs) 10 (Puyallup), 12 (Chambers-Clover), and 15 (Kitsap Peninsula). Mapping information and other studies from state agencies (including Washington Department of Fish and Wildlife, Department of Ecology, and Department of Natural Resources) and the Puyallup Tribe were also used. To analyze spatial patterns and visually display data, numerous cartographic resources were consulted and used in ArcGIS (ArcView 9.2).
A complete list of technical and scientific references is included in the last chapter (Chapter 10) of this report. The GIS map folio prepared for this SMP update is provided in Appendix A. In addition, a complete list of GIS/mapping data sources is included in Appendix B.
2.2 Establishing a Planning Area Boundary
This characterization is focused on those shorelines of the state in unincorporated portions of Pierce County, Washington. This includes approximately 180 miles of marine shoreline and 550 miles of freshwater shoreline (based on lake perimeter data and on centerline distance for rivers and streams, not counting each river bank separately). Freshwater shorelines of the state include 88 rivers and streams, and 36 lakes. Except as it pertains to characterizing ecosystem-wide processes, this inventory and characterization does not directly address designated shorelines of the state located in incorporated cities, in Mount Rainier National Park, and in federal military reservation lands (Fort Lewis and associated lands) (Maps 1 and 2). Further, lands within tribal reservations are not specifically addressed (Map 3).
2.2.1 Potential Shorelines Not Designated by WAC 173-18 or 173-20
Following the passage of the Act in the early 1970s, Ecology developed a list of all known streams and lakes meeting the criteria for shorelines of the state1. The lists, which were codified in WAC 173-18 and 173-20, had not been updated since their initial development. Recently,
1 The original U.S. Geological Survey stream flow report used by Ecology in the 1970s did not include streams above the first federal land boundary.

Pierce County Shoreline Inventory and Characterization Report
Page 2-2 June 2009
Ecology revised the list of shoreline streams using data from several regional flow studies conducted by the U.S. Geological Survey (Kresch 1998)2. The results of the USGS study showed that numerous streams that are not currently designated as shorelines of the state may actually meet the 20 cubic feet per second (cfs) mean annual flow criterion and should be regulated as state shorelines. In other cases, the USGS study relocated the upstream boundary of the 20 cfs point further upstream or downstream from its WAC-designated location. In many cases the new stream flow data show the 20 cfs points in headwaters areas on federal lands, which may or may not be subject to County SMP jurisdiction. The streams and rivers included in this inventory and characterization include all those identified by the USGS study, downstream of Mount Rainier National Park and outside of other federal lands (including the Fort Lewis Military Reservation and the Nisqually National Wildlife Refuge).
Bahls et al. (2006) initiated a similar effort to assess potential errors in state shoreline designation for lakes in Washington. The study attempted to estimate the error rate in current lake designation and develop a reliable and cost-effective method for local governments to use in identifying lakes that meet the 20-acre size threshold. The investigators used a three-phased approach to identify lakes equal to or greater than 20 acres throughout the state. The first phase involved GIS analysis, the second phase involved aerial photo interpretation, and the final phase included field assessment of a small subset of the lakes analyzed. The study identified several currently undesignated lakes in Pierce County that appear to meet the criteria for shorelines of the state. Those lakes identified as potential shorelines have been included in this inventory and characterization. However, not all lakes within the County were assessed by this study. The authors recommend that more detailed mapping and field verification should be conducted to verify the results.
2.2.2 Lineal Extent of Shoreline Jurisdiction
Once the County shorelines of the state were identified as described above, the linear extent of each shoreline was measured and quantified for marine shorelines, rivers and streams, and lakeshores. The miles of shoreline that are included in the Pierce County shoreline inventory were calculated using the Pierce County hydro centerlines shapefile (hydro_centerlines.shp) or lake perimeter data in the County GIS database. For rivers and streams, the centerline shapefile is the base for calculating the linear length for each freshwater reach. This centerline file was then overlaid with the shoreline planning areas (reaches) shapefile created by ESA Adolfson to determine the length of a given river or stream shoreline reach.
For rivers or streams that flowed though an incorporated City jurisdiction, we tabulated the linear length in a separate table (Table 2.1). This table shows the miles of shoreline rivers which lie outside of Pierce County’s shoreline jurisdiction and are therefore not specifically included in this inventory report.
2 The revised list has not been codified, but Ecology is currently in the process of revising state jurisdiction regulations to allow for incorporation of new data during the local SMP amendment process.

Pierce County Shoreline Inventory and Characterization Report
Table 2-1. Shoreline Rivers within Incorporated City Limits in Pierce County, Washington
City Jurisdictions
Name
Buc
kley
Bon
ney
Lake
Eato
nvill
e
Enum
claw
Fife
Milt
on
Ort
ing
Puya
llup
Sout
h Pr
airie
Sum
ner
Taco
ma
Uni
vers
ity P
lace
Wilk
eson
Total
Carbon River 0.59 0.59
Clarks Creek 1.65 1.65
Fennel Creek 0.12 0.12
Hylebos Creek 0.38 0.39 0.32 1.09
Lynch Creek 0.55 0.55
Mashel River 1.13 1.13
Ohop Creek 0.63 0.63
Puyallup River 2.82 1.24 1.82 0.17 0.61 6.67
South Prairie Creek 0.77 0.77
White River 2.66 0.28 4.67 7.61
Wilkeson Creek 0.85 0.85
Grand Total 2.66 0.12 2.31 0.28 3.20 0.39 1.84 3.48 0.77 4.85 0.93 0.00 0.85 21.66
For the lakes, the ordinary high water mark (OHWM) line based on the Pierce County hydro surface boundaries shapefile (hydro_surface_boundaries.shp) was used as the base for calculating the perimeter (in miles) for each waterbody feature. To determine shorelines within the County’s jurisdiction, any shoreline outside of jurisdiction was then clipped from the line file. This perimeter (OHWM) was overlaid with the shoreline planning areas (reaches) shapefile created by ESA Adolfson to determine the shoreline length for a given lake or reservoir. Rivermiles and lake perimeter miles are approximate as based upon the County GIS data.
2.2.3 Lateral Extent of Shoreline Jurisdiction / Planning Area
The approximate extent of shoreline jurisdiction within Pierce County is shown on Map 1, and referred to throughout this report as the “shoreline planning area.” In general, it includes:
• The regulated waterbody;
• 200 feet of adjacent upland extending from the mapped edge of the approximate OHWM;
• an area having 1 percent chance of flooding in any given year (also referred to as the 100-year floodplain);
June 2009 Page 2-3

Pierce County Shoreline Inventory and Characterization Report
Page 2-4 June 2009
• mapped channel migration floodways; and
• any bordering, neighboring, or contiguous mapped wetlands3 (Figure 2-1).
Figure 2-1. Delineating the Shoreline Planning Area
This approximate extent of shoreline jurisdiction should be considered useful for planning purposes only since its resolution is based on relatively coarse mapping. Site-specific delineation of wetlands, floodplains and/or OHWM could result in modifications to the extent of regulated shoreline areas. It is likely that wetlands are present in some portions of the shoreline planning area but have not yet been mapped. As described in Chapter 1 (Section 1.3.2, Shoreline Jurisdiction) local government can choose to regulate the entire floodplain under its SMP, or a 3 As used in this report, “wetlands” does not include wetland buffers (i.e., adjacent upland areas) that may be required by local critical areas ordinances.

Pierce County Shoreline Inventory and Characterization Report
smaller area. For this study, the entire mapped floodplain was included as it represents the maximum potential shoreline jurisdiction.
2.3 Approach to Characterizing Ecosystem-Wide Processes and Shoreline Functions
For purposes of this report, ecosystem-wide processes (or landscape processes) are assessed at the watershed scale according to Water Resource Inventory Area (WRIA) boundaries. In this document, the term ecosystem-wide processes refers to the dynamic physical and chemical interactions that form and maintain the landscape at the geographic scales of watersheds to basins (hundreds to thousands of square miles). These processes include the movement of water, sediment, nutrients, pathogens, toxins, and wood as they enter into, pass through, and eventually leave the watershed. The assessment approach for nearshore and freshwater processes varies slightly as outlined below.
2.3.1 Nearshore Marine
The marine nearshore is defined as the zone of interface between the subtidal marine habitats of Puget Sound, the freshwater habitats of rivers and streams and the adjacent uplands along the shore (Williams et al. 2001, Redman et al. 2005) (Map 4). The nearshore extends generally from the lower limit of light penetration in offshore waters (i.e., the photic zone, about 65 to 100 feet below MLLW) to the MHHW line along the shoreline and/or the upper limit of tidal influence in rivers and streams. Nearshore habitats also include upland and backshore areas that directly influence the adjacent aquatic habitats (e.g., marine riparian vegetation and bluffs). Nearshore habitats and the species that occupy and depend on them (including juvenile salmonid species and many species of commercially/recreationally harvestable shellfish) require that these landscape processes function properly across various spatial scales (Williams and Thom 2001; Ruckleshaus and McClure, 2007).
Several investigators have shown that the health and sustainability of nearshore environments are linked to physical processes at the watershed scale (Williams et al. 2004, Difenderfer et al., 2006). Physical processes create habitat structure, which affects habitat-related processes, which in turn influence ecological functions. Chemical and biological processes also influence nearshore environments. As an example, decomposition of beach wrack is important for food chain support functions.
This characterization examines physical, chemical, and biological factors influencing marine environments at the landscape scale including local/regional geology, fluvial systems, waves, wind and energy/exposure, and land use/human development. These factors operate via different mechanisms and exert varying degrees of influence depending upon landscape position. In general, external factors (e.g., geology, bathymetry, tides, etc.) are considered part of the Process Controls discussed in Section 3.2.
To discuss nearshore ecosystem-wide processes that result from the Process Controls identified above, three overall process groups were identified: 1) physical processes, 2) water quality processes, and 3) habitat processes. There is considerable interdependency between these processes. The distribution of nearshore habitats is often a function of physical processes that result in landforms with varying surface sediment sizes, land slopes, and at different water
June 2009 Page 2-5

Pierce County Shoreline Inventory and Characterization Report
depths. The resulting habitats are key components of the marine nearshore, and are discussed separately. Significant alterations are discussed to generally assess the scale of alteration to nearshore ecosystem functioning.
2.3.2 Freshwater Shorelines
Freshwater shorelines include freshwater rivers, streams and lakes meeting the definition of a shoreline of the state (see Map 5). The ecosystem characterization approach used for non-marine (freshwater) shorelines is based in part on the approach reported in Protecting Aquatic Ecosystems: A Guide for Puget Sound Planners to Understand Watershed Processes (Stanley et al., 2005). This approach examines specific watershed processes, including the movement of water, sediment, nutrients, pathogens, toxicants, organic matter, and energy or heat, that form and maintain aquatic resources, including shorelines, over a large geographic scale. These processes interact with landscape features to create the structure and function of aquatic resources.
The analysis uses a coarse approach for integrating watershed processes into shoreline management, restoration planning, and related land use planning efforts. Results of the characterization will help to identify areas that are important for maintaining watershed processes and whether or how much these “process-intensive” areas have been altered. This approach considers the relative degree of importance and extent of alteration so that priorities for protection and restoration can be identified. A central assumption of this approach is that the health of aquatic resources is dependent upon intact upgradient watershed processes.
While the target is to discuss and assess ecosystem-wide processes, most spatial analyses were performed at the subbasin scale (e.g., one step more refined than the WRIA scale). Several of the WRIAs within Pierce County are so large that results at the WRIA scale are too general to be useful. Using the subbasin scale allows for more even spatial analyses, and also provides an opportunity to identify broad trends within the County.
The purposes of the freshwater watershed-scale analysis are to highlight the relationship between key processes and aquatic resource functions, and to describe the effects of land use on those key processes. This approach is not intended to quantify landscape processes and functions. Rather, the goals are to: identify and map areas on the landscape important to processes that sustain shoreline resources; and determine their degree of alteration.
The approach to characterizing watershed-scale processes acting on freshwater systems consisted of several steps, which are described below (see also Stanley et al., 2005 for a complete description of the background and methods for this approach).
2.3.2.1 Step 1 – Identify Aquatic Resources and their Contributing Areas
Project analysts identified and mapped aquatic resources including rivers, lakes, and wetlands using available GIS hydrography data from various sources. Mapped areas include aquatic resources that are subject to shoreline jurisdiction (e.g., large rivers and lakes) and resources outside of shoreline jurisdiction (e.g., small streams, depressional wetlands outside floodplains, etc.). Contributing areas are defined as the surface water drainage boundaries in each WRIA.
Page 2-6 June 2009

Pierce County Shoreline Inventory and Characterization Report
June 2009 Page 2-7
Each WRIA is also divided into smaller units or basins that are referenced when discussing conditions at a more refined scale.
2.3.2.2 Step 2 – Identify Key Processes
Processes occurring at the watershed scale maintain aquatic resources to varying degrees. This analysis focuses on key processes that are fundamental to the integrity of the ecosystem and can be managed within the context of the available land use plans and regulations. In accordance with Stanley et al. (2005), analysts identified the following key processes as critical to sustaining the aquatic resources and likely to be altered by human activity:
• Hydrology
• Sediment
• Water Quality
• Organic Inputs
2.3.2.3 Step 3 – Identify and Map Important Areas
For this step, analysts used available GIS data to identify and map areas within the County that support ecosystem processes (Table 2-2). These so-called “important areas” are those areas which, when maintained in an unaltered condition, have the greatest relative influence on the dynamics of a specific process and consequently on aquatic resources4. In some cases, the important areas are areas where inputs to the processes occur (e.g., the feeder bluffs that generate sediment supply as a result of erosion). For other processes, inputs occur so broadly across the landscape that specific important input areas are difficult to identify. In those cases, the process-intensive areas are areas that facilitate movement or storage of materials such as water, sediment, or pathogens. Identifying an area such as a feeder bluff as an “important” area is not meant to suggest that the associated transport zones or depositional areas are not important; it simply focuses this coarse-scale analysis on the main trigger or generator of the net shore-drift processes (i.e., without the feeder bluff generating the sediment there is no sediment transport or deposition).
Commonly, multiple processes are present in a single area, and there are feedback loops between many of the processes. Storage areas such as depressional wetlands are a good example because they store surface water, which traps sediment and facilitates phosphorus removal and contaminant adsorption, uptake and storage. Mapping of these areas allows us to identify where each process occurs as well as areas that support multiple processes and therefore may provide valuable protection and/or restoration opportunities.
4 The use of the term “process-intensive areas” is used as a means of distinguishing, on a relative scale, areas that play a key role in how ecosystem processes operate within a watershed. This does not imply that other areas are not important for ecological functioning, land use management or other purposes.

Pierce County Shoreline Inventory and Characterization Report
2.3.2.4 Step 4 – Identify and Map Process Alterations
This step determines where land uses and/or actions associated with land use have altered naturally occurring processes. Knowing where and how processes have been altered provides information necessary to develop appropriate environment designations and standards for the type and intensity of development that shoreline segments can support while accommodating appropriate uses and achieving no net loss of shoreline functions and values. Altered areas may provide opportunities for restoration, while unaltered areas may have potential for conservation or similar protection.
Table 2-2. Examples of Process-intensive Areas, Mechanisms by which they Operate, and Alterations for Key Ecosystem Processes
Key Process Mechanism Process-intensive areas Alterations
Hydrology Infiltration/recharge Permeable deposits, depressional wetlands, Critical Aquifer Recharge Areas
Impervious area, loss of forest cover
Surface water storage
Depressional wetlands Lakes Floodplains
Lost wetlands, streams disconnected from floodplains
Surface runoff and peak flows
Rain-on-snow zones and snow-dominated zones
Loss of hydrologically mature forest cover, road density
Groundwater flow (baseflow)
Surficial aquifers Surface expression areas (lakes, wetlands, streams)
Ditched/drained areas with shallow groundwater, groundwater consumption
Sediment Surface erosion Erodible soils on steep slopes
Road crossings, road density, agriculture, developing lands
Mass wasting Landslide hazard areas Roads in landslide hazard areas, vegetation removal
Sediment storage Depressional wetlands Floodplains
Loss of wetlands, floodplain disconnection, stream channelization
Water Quality (including heat/light inputs)
Contaminant storage Nutrient storage/ denitrification Riparian canopy cover
Wetlands that denitrify groundwater Wetlands that filter surface water Riparian/Hyporheic zones particularly in headwater streams Low-order streams
Onsite septic systems, agricultural and residential fertilizer, riparian disturbance, loss of wetlands, loss of vegetation, presence of 303(d) Category 5 listed streams
Organic Inputs Large woody debris recruitment
Riparian zones Historic channel migration zones Landslide hazard areas
Loss of mature forest, bank armoring, stream channelization
Page 2-8 June 2009

Pierce County Shoreline Inventory and Characterization Report
Once the spatial scale of the alteration is mapped, simple summary statistics are used to determine relative degree of alterations within subbasins. Example summary statistics include percent forest cover, percent impervious surface, and other land cover/use classifications thought to be indicative of alteration. These analyses are highly dependent on the 2001 National Oceanic and Atmospheric Administration (NOAA) Coastal Change Analysis Program (CCAP) analysis that identified land cover classifications throughout much of the Puget Sound lowlands. These data cover all of Pierce County and therefore provide a consistent data set for the analysis.
2.4 Approach to Inventory and Characterization of Regulated Shorelines
The inventory of shorelines of the state in Pierce County at the shoreline reach scale is intended to characterize conditions in and adjacent to the regulated waterbody. The shoreline planning area roughly approximates the regulatory limits of the County’s SMP as described above. GIS data were used to inventory and characterize conditions at the reach scale. In addition, aerial photography and review of existing reports were used to qualitatively describe conditions in the shoreline planning area.
2.4.1 GIS Analysis and Mapping
In addition to ecosystem-wide process analysis and mapping described above, GIS analysis and mapping were used to characterize conditions at the reach scale. An interactive web-based mapping application was developed for use by the report authors, County staff, and the Technical Advisory Group. Data were used to visually display over 80 mapping themes (e.g., piers and docks, eelgrass distribution, flood hazards, fish distribution) related to individual shoreline reaches. In addition, GIS overlay analysis was used to quantify certain conditions (e.g., spatial extent of wetlands, land use designations) in the shoreline planning area.
Mapping the shoreline to visually discern the regulatory limits under the SMP (i.e., ~200 feet from OHWM) is referred to as “reach-scale mapping.” Given the enormity and diversity of the County’s several hundred miles of shorelines, and the many relevant mapping themes or layers, reach-scale mapping is a significant effort. A hard copy map atlas to cover the County would likely require several hundred 11x17 or 8.5x11 size map sheets. The County has determined that reach scale maps in a traditional atlas format may not be the best option to display and convey inventory mapping to the public and technical reviewers. Therefore the project team has developed an interactive desktop mapping application that provides “reach-scale” mapping and analysis tools. The mapping tool is available upon request in DVD format.
2.4.2 Determining Reach Breaks
For purposes of the inventory and characterization, shoreline planning areas were divided into reaches based on shoreline type (i.e., marine, river, or lake). The overall goal of this approach is to select reach breaks that capture both natural and political changes in the landscape that will impact shoreline form and function. The reach breaks also form a basis for the scale of inventory, and provide a mechanism for developing and applying environment designations in later phases. Reach break locations were not determined on an arbitrary basis. However, conscious effort was employed so that the scale and number of reach breaks were applied consistently between freshwater and marine shorelines. As a result, the average length of
June 2009 Page 2-9

Pierce County Shoreline Inventory and Characterization Report
shoreline per reach break is approximately 3 to 4 miles. The number of reaches by shoreline type in Pierce County is summarized below in Table 2-3.
Table 2-3. Shoreline Summary by Type, Pierce County, Washington
Waterbody Type Number of Waterbodies
Number of Reaches Total Miles
Marine Shorelines 1 46 180
Rivers and Streams 70 137 375
Lakes 39 47 145
TOTAL 110 230 700
2.4.2.1 Marine Reach Breaks
For purposes of inventorying marine shorelines, the shoreline planning area was delineated for unincorporated portions of Pierce County using GIS. The area included marine waters extending 1,000 feet offshore; 200 feet of adjacent upland; and any bordering, neighboring, or contiguous mapped wetlands. The source data depicting the marine “shoreline” were developed by Pierce County, based on LIDAR topographic mapping, and intended to represent the most detailed depiction of the shoreline. It represents the 10-foot (south of Tacoma Narrows) and 12-foot (north of Tacoma Narrows) topographic contours, which approximate the marine ordinary high water mark.
Reach breaks along the marine shoreline were developed, considering changes in geomorphic shoreform type (e.g., bluffs, bays, inlets, spits); changes in predominant drift direction; wave and tidal current exposure; and changes in predominant upland or nearshore development patterns. In addition, discussion of marine shorelines is organized around larger management units, representing different areas of South Puget Sound. Most of the marine shorelines in Pierce County are in WRIA 15 (Kitsap). The marine shorelines were organized into nine distinct management units, each unit having between 1 and 13 individual reaches (Figure 2-2). For example, the Carr Inlet management unit contains 13 individual reaches. There are 45 unique marine reaches totaling approximately 180 miles of marine shoreline in Pierce County.
Page 2-10 June 2009

Pierce County Shoreline Inventory and Characterization Report
Figure 2-2. Marine Reaches
2.4.2.2 Freshwater Reach Breaks
For purposes of inventorying freshwater shorelines, GIS was used to map the lateral extent of potential shoreline jurisdiction according to the methods described above. Reach breaks for rivers, streams, and lakes were determined based on the following criteria:
• Breaks occur at the confluence of two jurisdictional shoreline channels. The USGS/Ecology 20 cfs study was used as the basis for the upper extent of shoreline jurisdiction;
• Breaks occur at city boundaries;
• Breaks occur at the Mount Rainier National Park boundary. Shoreline jurisdictional streams that extend into the park are not included, but shorelines in the National Forest are included (to accommodate potential in-holdings subject to County regulations);
• Breaks occur at Fort Lewis. Shoreline jurisdictional streams that extend into federal military reservation land are not included; and
June 2009 Page 2-11

Pierce County Shoreline Inventory and Characterization Report
• Breaks occur at changes in Urban Growth Area (UGA) designations (e.g., from urban to rural, where the main channel of the river and all of one bank or both banks is within a distinct UGA designation).
This method resulted in a total of 183 unique freshwater reaches. This includes 46 lake reaches (covering 39 lakes inventoried) and 137 river or stream reaches (covering 70 rivers and streams inventoried). Figure 2-3 below illustrates an example near the confluence of South Prairie Creek and the Carbon River. The results were qualitatively reviewed by comparing delineated reach breaks to the working maps (e.g., geology, land use, etc.). In general, the reach breaks appear to capture the significant landscape shifts within the basin:
• Mountainous/glaciated areas in the park;
• Forest management area in the foothills;
• The foothill to alluvial valley transition; and
• The alluvial valley.
Figure 2-3. Freshwater Reach Break Example
Page 2-12 June 2009

Pierce County Shoreline Inventory and Characterization Report
June 2009 Page 2-13
Other considerations in the freshwater reach break results include:
• The confluence break method results in significantly more reach breaks in the upper watershed where junctions of lower-order streams are more common.
• Most of the breaks in the lower portions of the watershed are based on city boundaries or transitions from rural to urban growth management designations.
• The alluvial valley to foothill transition is not explicitly used as a reach break, but a city typically exists at that location (e.g., Orting).
• If only a short section of tributary was under SMA jurisdiction (e.g., Huckleberry Creek at the Park border), then it was lumped into the larger tributary.
• National Forest was not used as a break; most stream sections in the forest were short compared to the downstream reach section.
• There were several longer reach sections in the lower foothills (e.g., Voight Creek, South Puyallup, Carbon River above and below Carbonado).
2.4.3 Comparison to Other Methods
The method described above appears to achieve a middle ground between the very general subbasins identified in the Upper and Lower Puyallup Watershed Action Plans (2002 and 1995, respectively), and the very specific reaches identified and used for the Pierce County Watershed Analysis (Mobrand Biometrics, 2001).
The Watershed Action Plans identify significant subbasins (e.g., Upper Carbon, Lower Carbon, South Prairie Creek, Upper White, etc.) and provide some description of the variation within those areas. These subbasins appear to be one level more detailed than a WRIA basin designation.
The Watershed Analysis (2001) used the Ecosystem Diagnosis and Treatment (EDT) procedure to provide a comparative analysis of ecosystem functioning throughout the watershed. Under this method, reach breaks were based on, “…similarity of habitat features, drainage connectivity, and land use patterns.” For Puyallup-White watershed, 261 reaches were identified, for Chambers-Clover 31 reaches, and for Hylebos 25 reaches (Mobrand Biometrics, 2001).

Pierce County Shoreline Inventory and Characterization Report
CHAPTER 3 ECOSYSTEM PROFILE
3.1 Introduction
This ecosystem profile has been prepared to provide a basis for understanding how the County’s shorelines function within the context of their watersheds. This chapter provides an overview of the watershed conditions across the landscape and describes how ecosystem-wide processes affect the function of the County’s shorelines as required under shoreline guidelines outlined in WAC 173-26-201. This watershed-scale overview is intended to provide context for the reach-scale discussion provided in Chapters 4 through 7. For freshwater areas, the landscape analysis approach to understanding and analyzing watershed processes developed by Stanley et al. (2005) was used and adapted to complete this section of the report. Terms used in this section are defined in the document entitled Protecting Aquatic Ecosystems: A Guide for Puget Sound Planners to Understand Watershed Processes (Stanley et al., 2005). For marine nearshore systems, the landscape analysis approach of Stanley et al. (2005) was adapted to marine environments using conceptual models developed for the Puget Sound nearshore by Simenstad et al. (2006), Ruckelshaus and McClure (2007), Williams et al. (2004), and Williams et al. (2001).
Maps referred to in Chapter 3 (Maps 4 to 17) are provided in Appendix A, the Map folio. In addition, GIS base and data layers that support the following discussion are available from Pierce County Planning and Land Services.
3.2 Overview
Pierce County is located generally in the southeastern corner of the Puget Sound Basin, in Western Washington. The County is approximately 609 square miles, with elevations ranging from 14,410 feet above mean sea level (MSL) at the top of Mount Rainier to sea level along the coastline of Puget Sound. Most of the land in the County is below 2,500 feet MSL.
The County includes portions of five Water Resource Inventory Areas (WRIAs) - the White/Puyallup, Chambers/Clover, Nisqually, Cowlitz, and Kitsap Peninsula. These WRIAs encompass 30 sub-basins, as shown on Map 6.
3.2.1 WRIA 10 – Puyallup-White Rivers
WRIA 10 includes both the Puyallup River and its major tributary, the White River, which drain into Commencement Bay within the City of Tacoma. WRIA 10 encompasses approximately 673,100 acres of area in both Pierce and King Counties, Washington (Department of Ecology, 2006). Approximately 87 percent of the WRIA 10 watershed lies within Pierce County. Major population centers include the Cities of Tacoma, Sumner, Puyallup, and Orting. The eastern portion of WRIA 10 is sparsely populated, with the exception of limited development along Highway 410 around the town of Greenwater.
Surface water runoff from the western, northern, and northeastern slopes of Mount Rainier shapes a number of significant sub-basins in the WRIA’s eastern reaches, including the Upper Puyallup River, the Upper and Lower Carbon rivers, South Prairie Creek, and the Upper White
June 2009 Page 3-1

Pierce County Shoreline Inventory and Characterization Report
River. Generally, these are medium gradient river systems in “U”-shaped, glacially carved valleys. Lakes in this area include Kaposwin and Mud Mountain lakes.
Rivers and tributaries within the mountainous reaches of WRIA 10 drain primarily to the White, Carbon, and Puyallup rivers. The Carbon and White rivers both drain into the Puyallup River – northwest of Orting and at Sumner, respectively – and the Puyallup River flows into Puget Sound at Commencement Bay. Sub-basins within the western (lowland) portion of WRIA 10 include Browns/Dash Point, Tacoma, Hylebos Creek, Clear/Clark’s Creek, Mid Puyallup River, Mud Mountain, and Lower White River. Floodplains and terraces characterize much of this area, with meandering rivers and oxbow scars. Lake Tapps is the only major lake within the western reach of WRIA 10.
The WRIA 10 nearshore extends from Brown’s/Dash Point to the north, along Commencement Bay, to near the Thea Foss waterway. Most of the WRIA 10 nearshore in Pierce County is comprised of the greater Tacoma metropolitan area and has been highly altered by shoreline development, urbanization, and filling of the Puyallup estuary and Commencement Bay. Some areas with unarmored bluff shorelines and riparian vegetation occur along Dash Point and Point Defiance, but otherwise the shoreline is highly altered by armoring, fill below mean higher high water (MHHW), presence of contaminated sediments, impervious surfaces, and high rates of stormwater runoff. Loss of estuarine wetlands within the Commencement Bay/Puyallup estuary has been almost complete.
Despite the high level of alteration at the mouth of the Puyallup River, the nearshore waters still provide habitat and biotic support. Juvenile salmonids move through and use areas of Commencement Bay for physiological transition and feeding, and a variety of shellfish, marine mammals and waterfowl are found in Commencement Bay (Simenstad 2003). Surf smelt spawning occurs at a few locations along Dash Point. Pocket estuaries along the shoreline south of Point Defiance provide feeding, physiological transition, migration, and predator refuges for juvenile salmon (Redman et al. 2005).
3.2.2 WRIA 11 – Nisqually River
WRIA 11 encompasses approximately 491,300 acres within Pierce, Thurston and Lewis Counties, Washington (Department of Ecology, 2006). Approximately 58 percent of the watershed lies within Pierce County. The basin’s headwaters originate at Mt. Rainier’s Nisqually Glacier, and eventually empty into Puget Sound at the Nisqually National Wildlife Refuge. Medium gradient rivers in the upper watershed give way to very low-gradient systems in the lowlands. Elevations range from over 14,000 feet above sea level at the summit of Mount Rainier to sea level at the Nisqually River’s mouth. Population is relatively sparse in WRIA 11, with the highest densities occurring around the Cities of Eatonville, and Roy. The predominant land use within WRIA 11 – Nisqually River is forest resource and timber harvest.
The upper portion of WRIA 11 includes the Upper Nisqually River, Mashel River, and Ohop Creek sub-basins. As in WRIA 10, these are medium gradient river systems in “U”-shaped, glacier-carved valleys. Alder Lake is the only major lake within the upper watershed.
Page 3-2 June 2009

Pierce County Shoreline Inventory and Characterization Report
Sub-basins within the lowland portion of WRIA 11 include the Mid and Lower Nisqually rivers and Muck Creek. Major tributaries to the Nisqually River include: Muck Creek, Ohop Creek, and Tanwax Creek. SMA-regulated lakes in WRIA 11 include: Harts, Tule, Kreger, Silver, RapJohn, Ohop, Clear and Tanwax lakes.
Only a small portion of the WRIA 11 nearshore exists within Pierce County. This section is located within the Nisqually Delta, and includes a portion of the Nisqually Wildlife Refuge. Alterations to the nearshore include the presence of a rail line along the shore and partial constrictions from roads, bridges, and fill in tidal wetlands (Redman et al. 2005).
3.2.3 WRIA 12 – Chambers-Clover Creek
WRIA 12 encompasses approximately 115,000 acres within the Puget Lowland ecoregion of Pierce County, Washington (Ecology, 2006). Elevations throughout the basin are at or just above sea level. Streams in WRIA 12 are low gradient, with underlying topography consisting of rolling glacial outwash and till plains. Sub-basins within WRIA 12 include Clover Creek/Steilacoom, American Lake, Chambers Bay, Tacoma West, and portions of Tacoma. Spanaway and American Lakes are the major lakes within the basin.
The nearshore portion of WRIA 12 extends from approximately the Thea Foss waterway, around Point Defiance, south to the edge of the Nisqually Delta. This region is characterized by high energy currents through the relatively deep and narrow passes and is somewhat distinct from the rest of the Pierce County nearshore as this area is part of the Central Puget Sound Basin.
Although the shoreline reach from the Nisqually Delta to Point Defiance is highly urbanized and constrained by the presence of the rail line along the shore, this area does contain several small pocket estuaries. These estuaries provide some juvenile salmonid support and water quality functions. Partial constrictions from roads, bridges, and fill in tidal wetlands all affect these pocket estuaries to some extent (Redman et al. 2005).
3.2.4 WRIA 15 – Kitsap Peninsula and Islands
WRIA 15 includes Key Peninsula, the southern tip of the Gig Harbor Peninsula, Fox Island, McNeil Island, Anderson Island, Ketron and other smaller islands in the Pierce and Kitsap County portions of southern Puget Sound. WRIA 15 encompasses approximately 631,100 acres, although only 22 percent of the watershed lies within Pierce County (Ecology 2006). A large majority of the watershed is located in Kitsap County, Washington. Elevations throughout the basin are at or just above sea level.
The nearshore portion of WRIA 15 includes the eastern portion of Case Inlet, Carr Inlet, both sides of the Key Peninsula, and Fox, McNeil and Anderson Islands. Although the degree of shoreline development is high in some areas, the upland watersheds have relatively low impervious surface areas, and predominantly forest or mixed forest/pasture land cover. This area lacks the large urban/industrial developments that have altered the Puyallup estuary and Commencement Bay.
Water quality impairments exist in Gig Harbor, Carr Inlet, Henderson Bay, Wollochet Bay, and in the area between the Nisqually Delta and Anderson Island and in isolated spots off Anderson
June 2009 Page 3-3

Pierce County Shoreline Inventory and Characterization Report
and McNeil Islands. Water quality impairments are associated with areas of greater impervious surfaces, overwater structures, urban areas, agricultural land uses, wastewater treatment plants, and lack of riparian vegetation. Several prohibited or restricted shellfish growing areas occur in Wollochet Bay, Oro Bay, Burley Lagoon, and at scattered locations on the Key Peninsula (e.g., Filucy Bay). Sources of water quality impairments are exacerbated in this area by the long, narrow and shallow inlets, the lack of flushing, and the long residence times (Albertson et al. 2002). All of these factors increase this area’s susceptibility to water quality impairments. Excess inputs of nutrients, pathogens, or toxins in this region of Pierce County are more likely to result in algal blooms and low dissolved oxygen (DO) levels, buildup of pathogens in the water, sediments, and ultimately in shellfish, and accumulation of toxins in sediments.
Two open water disposal sites are located within Pierce County: one in Commencement Bay and another between Anderson and Ketron Islands. Open water disposal of dredged material is managed by the Puget Sound Dredge Disposal Program (PSDD), a multiagency program including EPA, Ecology, WDNR, and the Corps. WDNR is responsible for the management and monitoring of the Puget Sound in-water dredged materials disposal sites. Monitoring focuses on determining whether materials are disposed of within the disposal site boundaries, sediment sampling, chemical and biological testing from the dredged material, and effects on aquatic life in the vicinity of the disposal sites.
Shoreline conditions in general are relatively unarmored for most of the area. However, significant shoreline modification through armoring and overwater structures and lack of riparian vegetation occurs locally in Hale Passage, Wollochet Bay, portions of Henderson Bay, and a small area in Case Inlet around Vaughn Bay. Forage fish spawning, eelgrass, marine invertebrates and shellfish beds are relatively abundant, especially around Wollochet Bay, and in Carr Inlet/Henderson Bay and Case Inlets. Numerous marine mammal haulouts, primarily for harbor seal, occur scattered around the islands. Waterfowl concentration areas are associated with most small bays which contain mud or sand flats.
The large stretch of shoreline south of Gig Harbor along the Tacoma Narrows has relatively intact riparian vegetation, provides a source of large woody debris (LWD), and contains documented surf smelt and sand lance spawning, and potential forage fish habitat. This area also has almost no shoreline armoring or overwater structures.
3.2.5 WRIA 26 – Cowlitz River
WRIA 26 encompasses approximately 1,594,790 acres, most of which are in adjacent Lewis and Cowlitz counties (Ecology, 2006). Only a small area of the upper watershed of WRIA 26 lies within Pierce County, to the southeast of Mount Rainier. This portion of the basin includes the headwaters of the Cowlitz River and associated tributaries. In Pierce County, WRIA 26 is part of the Cascade ecoregion and contains high to medium gradient streams in glacier-carved valleys. Elevations are well above sea level and include the 14,000+ foot summit of Mount Rainier. Population density is very light in Pierce County’s WRIA 26, with no major towns. The portion of WRIA 26 in Pierce County lies entirely within Mount Rainier National Park.The Cowlitz is the only sub-basin within WRIA 26 in Pierce County, and no major lakes are found in this sub-basin. The Cowlitz and its basin within the County are entirely within National Park lands.
Page 3-4 June 2009

Pierce County Shoreline Inventory and Characterization Report
3.2.6 Climate, Geology and Landform
3.2.6.1 Climate
Pierce County’s climate is influenced by maritime patterns that define the overall climate of Western Washington. In general, climate in Western Washington is characterized by mild, wet fall to spring months, and cool dry summer months. Precipitation typically occurs as low-intensity, long-duration storms. The County spans at least two of Washington’s climatic regions identified by the National Climatic Data Center branch of NOAA, the Puget Sound Lowlands, and the western Cascades.
Annual precipitation in the Puget Sound Lowlands typically ranges from 32 to 37 inches, generally increasing with distance south. The vast majority of precipitation is distributed between October and May. Rain and snowfall quantifies generally increase with distance south of the Canadian border, and with distance away from marine waters. January temperatures typically range from lows around 30º F to highs around 43º F. July temperatures typically range from lows around 50º F to highs around 75º F (National Climatic Data Center Summary for Washington State).
The transition between the Puget Sound Lowlands and the Western Cascades occurs around 1,000 feet in elevation. Precipitation levels are higher, and temperatures are lower in the Western Cascades, as orographic lifting of marine off-shore currents occurs in the foothills and mountains. Annual precipitation ranges from 60 to more than 100 inches, with maximum precipitation exceeding 140 inches once in 10 years.
Snowfall depths also correspond to elevation in the Western Cascades. Lower elevations receive 50 to 75 inches a year on average, while elevations from 4,000 to 5,500 feet receive 400 to 600 inches on average. Snowcaps and glaciers exist on higher peaks, and snow levels typically are around 1,500 to 2,000 feet during the winter. The snow pack above 5,000 feet typically persists until July.
Hydrologic systems in the Pacific Northwest are especially sensitive to warm rain-on-snow events, when significant volumes of surface water can be released into the system at one time. The White, Carbon, Puyallup, Nisqually, and Cowlitz rivers are all snow-fed systems, and respond to the late spring snowmelt period.
Climate Change
Fluctuations in climate occur at all temporal scales ranging from thousands of years (ice ages), to decades (El Nino), to diurnal. These fluctuations in climate have, in large part, shaped the glacially and fluvially dominated landscape, especially in the low-lying portions of the County below 2,500 feet.
The Intergovernmental Panel on Climate Change (IPCC) has published several reports that indicate that there is an overall warming climate trend (for example, see IPCC, 2007). The exact implications of this trend for specific regions, such as the Puget Sound, are unclear. The climate impacts Group at the University of Washington (cses.washington.edu) has used climate models to identify some possible climate impacts in the Puget Sound:
June 2009 Page 3-5

Pierce County Shoreline Inventory and Characterization Report
• Continued warming on the order of 0.2 - 1.0ºF through 2050. The rate of change after the 2050s depends increasingly on the choice of greenhouse gas emissions scenarios.
• Possible decrease in summer precipitation and increase in winter precipitation with little change in the annual mean (Climate Impacts Group, 2008).
• Decrease in April 1 snowpack of 30 % by the 2020s to 65 % in the 2080s (Climate Impacts Group, 2009).
Taken together, these factors have the potential to influence the functioning of Puget Sound ecosystems. Warmer temperatures will influence the nature and geographic extent of the snowpack that feeds the higher elevation streams. Warmer temperatures could also result in higher summer water temperatures, having the potential to negatively impact several water quality parameters. Additional precipitation, and a broadened rain-on-snow area, has the potential to influence flow regimes.
One of the anticipated effects of climate change in the Pacific Northwest is sea-level rise. Sea-level rise will likely change coastal processes and habitats, if water elevations increase as predicted. A recent study has been published by the National Wildlife Federation (NWF) on sea-level rise and coastal habitats in the Pacific Northwest (National Wildlife Federation, July 2007). This study evaluated the Puget Sound, southwestern Washington, and northwestern Oregon coasts specifically, and identified 11 different sites within the Puget Sound for sea-level modeling. The model used a range of sea-level rise scenarios as predicted by the IPCC from 0.08 meter (3.0 inch) increase in global sea levels by 2025 to a 0.69 meter (27.3 inches) increase to 2100. Sea-level rise within this range is anticipated to affect coastal habitats and fish and wildlife dependent upon the coastal areas of the Puget Sound. Predicted habitat changes in the Puget Sound, including coastal areas of Pierce County, are loss of estuarine beach and tidal flat areas, reduction in tidal marshes, saltwater intrusion into freshwater wetlands and brackish marshes, and increased shoreline erosion (NWF, 2007).
Mote et al. (2008) recently calculated sea-level rise projections specific to the Puget Sound region. Three estimates were reported based on greenhouse gas emissions scenarios. These new scenarios report rise in sea level ranging from 3 to 22 inches by 2050, and from 6 to 50 inches by 2100.
3.2.6.2 Geology
Geologic characteristics of Pierce County are shown on Map 7 (Geology) and Map 8 (Soils). The geology of the eastern half of the County is dominantly underlain by volcanic rock with some sedimentary rock and deposits of alpine glaciers in the lower elevation foothills. The topography and near surface geology of the western half of the County is largely the product of the last glaciation to occupy the Puget Lowland. The Vashon glaciation left a layer of till and recessional sand and gravel deposits that mantle the upland plateaus. The surfaces of the drift plains were shaped by moving ice, resulting in elongate, north- to northwest-trending hills, or drumlins. These drumlins are underlain by till and are commonly partially buried by recessional sand and gravel deposits. The till and recessional deposits overlie Vashon advance outwash sand and gravel, and older glacial and nonglacial deposits.
Page 3-6 June 2009

Pierce County Shoreline Inventory and Characterization Report
The Vashon and older deposits comprise several aquifers and aquitards within the subsurface, which control subsurface water movement from the upland to the lowland as well as to the locations of streams and creeks that occupy former glacial outwash channels (Jones et al. 1999).
Lodgment till from the Vashon glaciation mantles much of the upland area but is generally absent from the steeper slopes at the edge of the upland and in the lowland. Lodgment till is an unsorted mixture of sand, gravel, silt, and clay deposited at the base of a glacier and has been compacted to a very dense state by the great weight of the overriding ice. This till has very low permeability and typically acts as an aquitard, restricting the downward flow of groundwater and reducing recharge of deeper aquifers. Till occurs at or very near the ground surface in the western portion of the County where strong north-south ridges and swales left by the passage of glacial ice cross the upland surface south of the Puyallup and White rivers. Surface runoff in the till-capped upland is likely to be rapid with very little infiltration of precipitation.
The till is commonly covered by a relatively thin layer of sediments that were deposited during retreat of the Vashon ice sheet. These recessional materials were deposited away from the ice by meltwater streams that flowed from the retreating glacier or deposited in place as the stagnant ice melted. These deposits allow infiltration and control subsurface flow and wetland formation by localizing the ponding of water on the upland surface.
Ice contact deposits were deposited during stagnation and melting of the ice sheet. These consist of variable deposits of sand and gravel and often contain lenses of very silty material, till, and lacustrine silt and clay, which impede infiltration and groundwater flow. Such ground has an irregular surface and may be marked by closed depressions. Water infiltration and subsurface flow within these deposits are variable, and water is commonly ponded in closed depressions.
The Vashon ice sheet blocked drainage of rivers and streams from the Cascades, diverting water along the ice front and forming large bodies of water between the glacier and the mountain front. As the ice sheet retreated northward, these large lakes found spillway outlets resulting in dramatic releases of large volumes of water, which eroded the uplands and deposited a layer of openwork sand, gravel, and cobbles (Steilacoom gravel) across much of the upland. Till is only present at the ground surface in these areas where localized topographic highs protrude above the flood gravel deposit. Steilacoom gravel is commonly about 20 feet thick but locally much thicker. These highly permeable deposits at or near the ground surface are significant recharge areas and are highly susceptible to contamination.
The portion of the upland plateau covered by the recessional flood deposits exhibits numerous south- and west-trending channels scoured by the meltwater streams. Present-day streams now occupy these relict or former meltwater channels. Because till is commonly present at shallow depths, groundwater is relatively shallow. These channels extend to depths that approach the groundwater surface. Because of near-surface groundwater in these channels, wetlands are commonly present along the channel bottoms and flooding may occur from a rise in groundwater during periods of heavy precipitation.
Closed depressions in the ground surface created by remnant blocks of ice following retreat of the Vashon glacier became lakes and ponds that slowly filled with fine-grained (silt and clay) soil. Organic material and peat also accumulated as these lakes turned into bogs and marshes.
June 2009 Page 3-7

Pierce County Shoreline Inventory and Characterization Report
These organic deposits are commonly associated with existing wetlands or a previous marsh environment.
The Tacoma Narrows was similarly formed by the glacial processes that created the larger Puget Sound fjord. Local topography and post-glacial faulting (e.g., along the Tacoma fault zone) have resulted in the relatively shallow sill that occurs within the Narrows. This sill influences tide-forced currents within the Sound, and forms the divide between the Main and Southern basins (Ecology, 2002).
Following the retreat of the Vashon ice sheet, marine water inundated the mouths (troughs) of the Nisqually, Puyallup, and Lower White river valleys to form arms of Puget Sound. A layer of silt and clay tens of feet thick that accumulated in the estuaries now lies at depths of up to approximately 180 feet below the ground surface (Luzier, 1969). Deltas consisting of sand and gravel developed on top of these deposits at the upstream end of these embayments. Over time, alluvial and deltaic sediment from the Nisqually, Puyallup, and White rivers gradually filled these embayments, from upstream to downstream, to form deltas at their present locations.
Filling of the marine embayments of the Puyallup, White, and Nisqually rivers is largely attributable to lahars from Mount Rainier and to fluvial deposition (Dragovich et al., 1994; Zehfuss, 2005). About 5,600 years ago, the Osceola Mudflow from Mount Rainier flowed down the White River, over a broad area of the upland plateau south of the Green River valley, and into the Green/Puyallup River embayment near Sumner (Mullineaux, 1970; Dragovich et al., 1994; Vallance and Scott, 1997). These deposits are generally poorly sorted and consist of gravel, sand, silt and clay (Dragovich et al., 1994). Because of the relatively young age and composition of lahar material, areas underlain by these deposits are relatively poorly drained.
In addition to lahar deposition, surface rupture associated with valley-parallel faulting may have altered the Puyallup River channel. Recent geologic investigations suggest that the lower Puyallup River valley may coincide with what has been called the Tacoma fault zone (Brocher et al. 2004). Uplift and ground surface rupture of the valley floor may have caused sudden avulsions (abrupt shifts in channel alignment) of the Puyallup River.
3.2.6.3 Topography
Elevations in Pierce County range from sea level along the Puget Sound coastline to the summit of Mount Rainier at approximately 14,411 feet above sea level. The County encompasses all, or part, of four major watersheds, the entire Puyallup River and Chambers/Clover Creek watersheds and portions of the White and Nisqually River watersheds (Map 9). Three principal physiographic provinces exist within the County: mountains and foothills along the eastern half of the County, glacial upland plateaus dissected by major river valleys, and broad lowland valleys of major rivers (Upper Puyallup Watershed Committee, 2002).
The upland plateau is a broad area with relatively low relief lying largely between elevations of 400 to 500 feet above sea level. The upland plateau is bounded by moderately steep to very steep slopes that descend to the river floodplains and the marine shoreline below. The upland surface comprises numerous north-trending ridges and swales, which in turn control orientations of many of the upland stream channels. The upland surface also exhibits several large
Page 3-8 June 2009

Pierce County Shoreline Inventory and Characterization Report
topographic channels and numerous closed depressions; some occupied by small lakes and poorly drained areas.
3.2.7 Marine Shorelines and Oceanography
The marine shores of Pierce County encompass 179 linear miles, including the inner shores of bays and marinas (DNR 2001a). They include a wide variety of shoreforms and habitat types, including feeder bluffs, gravel/cobble beaches, sand and mud flats, large and small estuaries, lagoons, and large and small bays. Marine shores encompass the shoreline between the northern end of Case Inlet on the west, the Tacoma Narrows and Dalco and Colvos Passages to the east, and the Nisqually Delta to the south. This marine landscape includes two large peninsulas (Key and Gig Harbor) and three large islands including Fox, McNeil and Anderson Islands. Several smaller islands include: Raft, Herron, Cutts, Eagle, Gertrude, Tanglewood and Ketron Islands.
Oceanographic processes within the tidal waters of Pierce County are characteristic of the normal mean circulation pattern in a fjordal estuary, with seaward flow at the surface and landward flow at depth. Freshwater from local rivers typically flows seaward at the surface, since these water masses are of lower salinity and warmer than incoming ocean water. Colder, more saline water originating from the Pacific Ocean flows landward along the bottom (Nightengale 2000). The combined forces of lunar influence, winds and bathymetry determine the extent to which these layers are mixed. During neap tides (the moon is in the first and last quarters) when the tidal range is least, seawater intrusions and the influx of saltier water to Puget Sound are greatest. However during spring tides (that occur with the new and full moon), higher velocity tidal currents result in increased mixing of fresh and salt water (Nightengale 2000). A temperature, salinity and density difference between freshwater runoff and nutrient upwelling from ocean water determines the extent of mixing. This is influenced strongly by the force exerted on the water surface by wind (Nightengale 2000).
3.2.7.1 Bathymetry
Glaciers and subglacial melt water scoured a complex system of channels and troughs in the marine waters offshore of Pierce County (Booth 1994). These interconnected, north-south trending basins dominate much of the marine environment of Puget Sound today. There are four major divisions in the Puget Sound between these interconnected channels, which are marked by the presence of sills or submarine ridges that constrict water flow from one basin to the next.
The northern shores of Pierce County fall within the central Main Basin of Puget Sound. The Main Basin originates at Admiralty Inlet and extends 46.6 miles, reaching its terminus at the Tacoma Narrows. The Main Basin is the largest in the region and measures 747.5 km2. Over 535.3 km of shoreline make up the Central Basin, which has a mean depth of 98.5 meters. Some of the deepest waters in the study area are found within the Main Basin, such as within Colvos Pass, north of Gig Harbor. Deep water is also found just offshore of Dash Point, near the northern entrance to Commencement Bay.
The majority of Pierce County shores are encompassed within the Southern Basin. A sill measuring 45 meters separates Main and Southern Basins at the Tacoma Narrows (Cannon 1983). The Southern Basin encompasses 618.4 km2 and 620 km of shoreline. It holds over 28
June 2009 Page 3-9

Pierce County Shoreline Inventory and Characterization Report
km3 of water, and has a mean depth of 45.1 meters. Shallower waters are typically found at the heads of the many large embayments found within the County, while deeper waters are more common from Carr Inlet to the east of McNeil and Anderson Islands.
3.2.7.2 Tides and Circulation
Pacific Ocean water enters Puget Sound through the Strait of Juan de Fuca then diverges north to the Northwest Straits and south to the inland waters of central and southern Puget Sound. Tides throughout the region are semi-diurnal, exhibiting two unequal high tides and two unequal low tides per day. Mean tidal range in the Straits and Sound increases with increasing distance from the Pacific Ocean. Pierce County has a tidal range of 7.9 to 10.5 feet and is classified within the meso-tidal (two to four meters) range (DNR 2001).
The Puget Sound tidal range is a secondary factor for site-scale shoreline morphology. Rosen (1977) demonstrated that the coastal erosion rate increases with decreasing tidal range. This is due to the focusing of wave energy at a narrow vertical band with small tidal range in comparison to the dissipation of wave energy over a large vertical band with a greater tidal range. This means that erosion will be primarily focused within the 7.9 to 10.5 feet of the beach profile exposed to tidal waters (excluding storm conditions). Therefore erosion along shores with a smaller tidal range is focused on a narrower (vertical) band of the beach profile than those with a greater tidal range.
The majority of coastal erosion in the region occurs when high wind events coincide with high tides and act directly on the backshore and bluffs (Downing 1983). The majority of coastal landsliding occurs during and following prolonged high precipitation periods in the winter (Tubbs 1974, Gerstel et al. 1997, Shipman 2001).
Tidal currents are moderate throughout the larger straits (Carr, Case and Henderson Bay), but become increasingly strong when water funnels through constrictions such as at Pitt Passage and the Tacoma Narrows. The strongest tidal currents observed in the study area are found at the Tacoma Narrows (up to 5.5 knots).
3.2.8 Fish and Wildlife Habitats
The physiographic regions in Pierce County provide many terrestrial and aquatic habitats. These habitats occur in both the marine and freshwater portions of the County. This section describes some of the key Pierce County habitats and the ecological functions they provide.
3.2.8.1 Marine Beaches
Marine beaches are generally defined as areas with unconsolidated sediments that are moved, sorted, and reworked by waves and currents. The beach area can extend landward into the zone influenced by storm waves and generally includes the upper intertidal, beach face, low-tide terraces, and offshore zone to the limit of wave action. Beaches are typically steeper than tidal flats. Beaches occur throughout Pierce County marine shorelines, especially along Colvos Passage and the Narrows, around Anderson Island, the southern portion of the Key Peninsula, the northern portion of Case Inlet near Vaughn Bay, the northern portion of Henderson Bay, Wollochet Bay, and the northern shores of Fox Island.
Page 3-10 June 2009

Pierce County Shoreline Inventory and Characterization Report
Ecological functions of beaches include (Williams and Thom 2001; Williams et al. 2004; WDFW 2004):
• Forage fish spawning substrate;
• Habitat and refuge for intertidal fish and wildlife,
• Habitat/substrate for intertidal vegetation;
• Nutrient cycling;
• Primary production; and
• Shellfish habitat.
3.2.8.2 Tidal Sand and Mud Flats/Subtidal Shoals
Tidal flats are gently sloping, intertidal or shallow subtidal areas with unconsolidated sandy or muddy substrates. Mud flats are predominantly silts and clays and are high in organic content, often experiencing anaerobic conditions below the surface (Simenstad et al. 1991). Sandflats are comprised of larger particles ranging from fine sands to gravels. Sand and mud flats are not necessarily featureless – they frequently contain a number of channels formed by hydrologic processes that transport and distribute water, sediments and organic material, and provide some refuge for fish and invertebrates, especially during low tides. Tidal flats occur waterward of beaches. In these cases, the upper extent of the tidal profile may be composed of sand and cobble, while the lower elevation portions of the beach profile, commonly referred to as the “low tide terrace,” may be a tidal flat.
Sand and mud flats typically occur at mouths of rivers and streams where relatively large supplies of sediment are deposited as currents slow, and in embayments and depositional areas where wave and current energies are low. Because these are depositional areas where sediments are retained or build up over time, toxins (e.g., heavy metals) and/or pathogens associated with sediments also are retained and can build up over time.
The shallow flats and inlets of the Pierce County nearshore, especially in the South Sound sub-basin, are highly productive habitats, supporting high primary productivity and a diverse assemblage of benthic invertebrates and fish (SPSSRG 2004). Algal production on the surface of tide flats is an important source of food for prey items of salmonids and other fish. Light levels increase earlier in shallow tidal flats than in some deeper water habitats, such as eelgrass, and algal production on tide flats is important in the production of prey items used by juvenile salmon entering the nearshore in early spring (Redman et al. 2005). The shallow flats in the Pierce County nearshore become productive earlier in the season than flats further north, due to higher light levels and warmer temperatures.
Nutrient cycling on tidal flats and particularly the exchange of inorganic nutrients between benthic sediments and benthic fauna can be an important source of nutrients for algal growth and algal based food webs (Simenstad et al. 1991). Channels in tidal flats provide habitat and refuge for fish and invertebrates, including chironomids, amphipods (both important prey for juvenile salmon), polychaetes, clams, shorecrabs, tanaids, and mysids (Dethier 1990). Tidal flats also provide habitat and foraging areas for a number of fish, including juvenile Chinook and chum
June 2009 Page 3-11

Pierce County Shoreline Inventory and Characterization Report
salmon, as well as English sole, starry flounder, sand sole, speckled sanddab, and staghorn sculpin (Simenstad et al. 1991).
In Pierce County, sand and mud flat habitats occur in lower energy environments at the head of the major bays such as Case Inlet and Carr Inlet-Henderson Bay. Sand and mud flats also occur in smaller bays and embayments scattered throughout Pierce County, including Rocky Bay, Vaughn Bay, Horsehead Bay, Filucy Bay, Wollochet Bay, Gig Harbor, and the southeastern side of Anderson Island.
3.2.8.3 Eelgrass and Kelp Beds
Eelgrass (Zostera marina) is a native marine seagrass that forms extensive meadows or beds on gravel, fine sands or mud substrates in the lower intertidal and shallow subtidal zones of protected or semi-protected shorelines (Bulthuis 1994; Thom et al. 1998). Typical locations for eelgrass have medium to fine sands, adequate light, relatively high levels of organic matter and nutrients (Simenstad 2000). Typical eelgrass locations are shallow tideflats, along channels in tideflats or estuaries, and in the shallow subtidal fringe. The eelgrass zone in Puget Sound is typically confined to areas between tidal elevations of +1 meter to -2 meters relative to mean lower low water (MLLW) (Thom et al. 2001, Simenstad 2000).
In undisturbed areas with optimal conditions, eelgrass can grow to a height of 2 meters, forming a tall, dense canopy. Eelgrass beds can be dense and continuous along a stretch of shoreline, or occur in small, discontinuous patches. On the shallow flats typical of the southern Puget Sound, eelgrass beds can form wide expanses. Eelgrass beds form narrow corridors along the shoreline in areas with steeper beaches, or where light penetration is limited by turbidity (Simenstad 2000).
Eelgrass ecosystems are highly productive, providing a source of organic matter to intertidal and shallow subtidal food webs. Eelgrass plants produce large amounts of organic carbon that is consumed directly by grazers, as well as forming the basis for complex detrital food webs (Williams and Thom 2001). Organic carbon produced by eelgrass is broken down by microbial decomposition. Particulate organic matter is also processed and consumed by a number of invertebrates, including harpaticoid copepods, gammarid amphipods and isopods, which in turn, are important prey items for juvenile salmon and other fish (Simenstad et al. 1991). Juvenile salmon, as well as a number of other animals, depend on eelgrass habitat structure for refuge from predators. Eelgrass leaves provide physical attachment sites for epiphytic algae and other organisms, and physical structure which absorbs and dampens the energy of waves and currents, providing some buffering for adjacent habitats. Pacific herring use eelgrass for spawning substrate and for protection while eggs and juveniles mature (Williams and Thom 2001).
Eelgrass occurs in several configurations in Puget Sound, defined by location and patch characteristics. Larger, solid and continuous beds are most frequently found on extensive tideflats and are sometimes referred to as “flats.” More fragmented and patchy beds are frequently found on the edges of continuous beds or along more narrow intertidal areas. Patchy eelgrass beds along shorelines with narrow intertidal areas are sometimes referred to as “fringing” eelgrass beds, as they form narrow patches of eelgrass fringing the shoreline (Bell et al. 2006; Berry et al. 2003; Dowty et al. 2005).
Page 3-12 June 2009
Pierce County Shoreline Inventory and Characterization Report
In Pierce County, fringing eelgrass beds are found in numerous locations, with the most extensive beds being found near the mouth of Wollochet Bay; around Horsehead Bay and Cutts Island to Allen Point; along the western shore of Carr Inlet from the mouth of Burley Lagoon to south of Glen Cove; and along the southwest shore of Fox Island. Additional eelgrass beds, which tend to be more scattered and sparse, include the western shore of Colvos Passage, particularly, north of Point Richmond; the north shore of Hale Passage; Henderson Bay and at the mouth of Burley Lagoon; around Van Gledern and Mayo Coves, and south of South Head; at the mouth of Vaughn Bay and at the mouth of Rocky Bay; the east shore of Anderson Island, around Otso Point, and scattered near the mouth of Oro Bay and East Oro Bay; the western half of McNeil Island along Pitt and Balch Passages; and adjacent to the Nisqually Delta.
Kelp and other macrophytic brown algae can form dense, highly productive undersea forests that support many species of fish and marine mammals. Juvenile salmon and forage fish may preferentially use kelp stands in nearshore habitats (Shaffer 2003). Dense kelp forests also dissipate wave energy and provide sheltered habitat for resting/rafting seabirds and other animals within the kelp forest or adjacent surface waters. Kelp forests are comprised primarily of bull kelp (Nereocystis luetkeana) and other large brown algae, including the introduced Sargassum (Sargassum muticum). These plants are attached to the marine bottom with holdfasts and require rocky or coarse substrates. Distribution is limited to areas with appropriate substrates, light penetration to the bottom and moderate wave/current energy.
In Pierce County kelp beds have a very limited distribution, due to the generally shallow, fine-substrate habitats typical of the southern Puget Sound marine nearshore. Canopy forming kelp (primarily bull kelp) occurs with a patchy distribution in the northern part of the Pierce County marine nearshore in the Colvos Passage and Tacoma Narrows region. In the shallower inlets further south, floating kelp is either very rare or not present, while understory kelp (primarily Laminaria spp.) occurs sporadically (DNR, 2001).
3.2.8.4 Estuaries
Estuaries are embayments (bays) or semi-enclosed inland waters with freshwater inputs that serve as transition zones between marine and freshwater environments. Estuaries include the zone at the mouth of a river or stream dominated by the discharge of freshwater, and generally extend from the head of tidal influence seaward to the point where fluvial influences no longer dominate. Within the larger Puget Sound estuary, there are many river estuaries (e.g., Skagit, Stillaguamish, Nisqually, Puyallup), numerous smaller estuaries associated with streams or bays (e.g., Chambers Bay, Rocky Bay), and localized small embayments that sometimes have freshwater discharge from either surface or groundwater sources (Beamer 2003). These smallest estuaries are sometimes referred to as ‘pocket estuaries’. Pocket estuaries usually contain emergent marsh, sand or mudflats, a channel structure, uplands and open water in close proximity. They may or may not contain surface freshwater inputs.
Estuaries are characterized by a gradient of salinities in tidally influenced wetlands, ranging from salt marshes at the marine edge to brackish wetlands where there is a greater freshwater influence, to tidally influenced but entirely freshwater emergent, shrub, and/or forested wetlands. Diking and draining of tidally influenced wetlands can result in the complete loss of brackish wetlands. Restricting tidal exchange converts areas that experienced intermediate and fluctuating
June 2009 Page 3-13

Pierce County Shoreline Inventory and Characterization Report
salinities into areas dominated by freshwater. The presence of brackish wetlands, with salinities intermediate between freshwater and saltwater, and connected by channels to salt marshes and the nearshore, is critical to providing areas for physiological adjustment for outmigrating juvenile salmonids.
Estuarine areas, and tidal channels in estuaries, can be particularly important for physiological adjustment for juvenile salmon transitioning from freshwater to saltwater (Pess et al. in Montgomery et al. 2003). Estuaries and large areas of habitat open to tidal exchange contain a wide variety of salinity levels and salinity gradients, which allow juvenile salmon to gradually adjust to saltwater. Complex tidal channel networks also provide a range of depths and velocities, which provide habitats suitable for a wide range of juvenile salmon sizes and life history types (Redman et al. 2005). Small, shallower tidal channels provide habitat suitable for fry which spend little time in freshwater and enter the estuary at small sizes, while deeper, larger channels provide habitat suitable for larger juveniles entering the estuary after some time rearing in freshwater or larger juveniles transitioning to pelagic habitats. Estuaries also provide large amounts of organic matter to support macro-detritus based food webs, which are particularly important for salmon prey items (Bottom et al. 1991). Estuaries in natal rivers, such as the Nisqually and Puyallup, are critical habitats for juveniles originating in those rivers and can support large numbers of juvenile salmon. However, small estuaries, or pocket estuaries, in streams without salmon runs may also be critical to supporting juvenile salmon, especially when pocket estuaries occur in close proximity to larger estuaries (Beamer et al. 2003).
The primary ecological functions and biological resources of estuarine shorelines include:
• Flood attenuation;
• Tidal exchange/organic matter exchange;
• Stream base-flow and groundwater support;
• Water quality improvement (nutrient retention, nutrient cycling);
• Erosion/shoreline protection;
• Food web support;
• Habitat structure;
• Habitat connectivity;
• Salinity gradients; and
• Refugia – from predators (i.e., turbid waters of tidal channels).
The Nisqually Delta is one of the few large river estuaries in Puget Sound that has not been heavily urbanized or industrialized. Direct loss of estuarine habitat is much lower in the Nisqually Delta than in other large river deltas in Puget Sound, where overall, about 70% of estuarine and other tidal wetlands have been lost (Bortleson et al. 1980). Historical reconstruction of the type and extent of estuarine wetland habitats in the Nisqually at the time of European settlement indicates that about 26% of tidal wetlands have been lost (Bortleson et al. 1980, Collins and Sheikh 2005). However, processes such as tidal exchange, water and sediment movement, LWD inputs, and connectivity have been significantly altered by land use changes.
Page 3-14 June 2009

Pierce County Shoreline Inventory and Characterization Report
These process alterations have greatly simplified the natural tidal channel network, reduced habitat diversity, and changed the natural communities that dominate the estuary. Major alterations include large areas of fill associated with the construction of Interstate 5 (I-5), extensive draining and diking of the estuary to permit agricultural uses, a lack of diverse native vegetation types, and construction of a rail line along the shore from the eastern edge of the delta north towards Tacoma.
The Nisqually River estuary is the natal estuary of the Nisqually independent Chinook population, the largest independent population in the South Sound (Redman et al. 2005). Other Puget Sound Chinook populations use the Nisqually estuary nearshore environments for feeding, growth, refuge, physiological transition, and migration. In particular, populations from the Central Sound (Puyallup, Green/Duwamish), where most estuarine functions have been lost, may depend on the Nisqually estuary and nearby pocket estuaries for critical feeding and growth, refuge, physiological transition, and migration functions (Redman et al. 2005).
In recent years, a number of restoration projects have removed dikes and restored significant areas of estuarine habitat in the Nisqually. The ongoing and planned estuarine restoration projects in the Nisqually Delta represent one of the few opportunities in Puget Sound to restore natural processes to a large, functioning river estuary.
Historically, the Puyallup Delta was one of the largest estuaries in Puget Sound. The estuary contained extensive freshwater and brackish tidal wetlands and off-channel sloughs along the meandering channel of the Puyallup River, numerous distributary channels, a dendritic tidal channel network supporting extensive salt marsh vegetation, and a broad expanse of intertidal sand and mud flats (Bortleson et al. 1980, Collins in Montgomery et al. 2003, Simenstad 2003). Land use changes in the Puyallup-White watershed (WRIA 10), as well as the development and filling of Commencement Bay, have almost completely altered the hydrological regime, sediment dynamics, nutrient/organic matter inputs, and biotic communities of the estuary (Simenstad 2003, Redman et al. 2005). Development of Commencement Bay has resulted in an estimated 98% loss of intertidal wetlands compared to historic conditions (Bortleson et al. 1980, Collins and Sheikh 2005). Sediments in Commencement Bay are some of the most contaminated in Puget Sound (PSWQAT 2002).
The Puyallup River estuary supports the White and Puyallup independent Chinook salmon populations and is a core management area for Puget Sound bull trout (Redman et al. 2005). Despite the extent of development and habitat alteration, Commencement Bay still contains some small areas of freshwater and intertidal wetlands, and provides some habitat for juvenile salmon for feeding, refuge, and migration (Simenstad 2003). Anadromous bull trout are thought to use Commencement Bay and nearshore areas in Pierce County, and development in the nearshore is likely impacting bull trout. However, use of nearshore habitats by bull trout is still poorly understood (USFWS 2004).
Non-natal Estuaries and Pocket Estuaries
In addition to the natal estuaries described above, there are tidally influenced systems that are not directly associated with larger rivers or Chinook salmon natal watersheds, but that also provide support to juvenile salmonids (Beamer 2003, Redman et al. 2005). Numerous smaller estuaries
June 2009 Page 3-15

Pierce County Shoreline Inventory and Characterization Report
and embayments (‘pocket estuaries’) occur within the Pierce County marine nearshore environment. In these areas small streams or seeps provide the freshwater inputs. Linkages or connectivity between natal estuaries, pocket estuaries, and other shallow/nearshore habitats are critical for providing an array of suitable habitats easily accessible by migrating juvenile salmonids (SPSSRG 2004).
Pocket estuaries associated with bays and smaller streams which occur in Case and Carr Inlets, and in the reach from the Nisqually Delta to the Tacoma Narrows, provide critical habitat for juvenile salmonids from the Nisqually River, as well as from other natal estuaries in the Central and South Sound (Redman et al. 2005). Key bays with estuarine and other intertidal wetland habitats include Gig Harbor, Chambers, Taylor, Oro, Amsterdam, Henderson Bay, Filucy, Wollochet, Horse head Bay, Henderson Inlet, Rocky Bay, and Vaughn Bay. More than 50 pocket estuaries have been identified in Pierce County portions of the Central, Carr-Nisqually, and South Sound sub-basins (Redman et al. 2005). Smaller pocket estuaries are also concentrated around Anderson, McNeil, and Fox Islands, the shorelines of Carr and Case Inlets, and the Gig Harbor Peninsula, with few of these smaller pocket estuaries occurring between the Nisqually Delta and Point Defiance (Redman et al. 2005).
3.2.8.5 Salt Marshes
Salt marshes and brackish marshes are habitats that occur in areas with tidal inundation. Salt marshes typically occur at elevations at and above MHHW in areas where sediment supply and accumulation are relatively high. Therefore, salt marshes can occur in bays, along sand spits sheltered from waves and currents and most commonly on river and stream deltas. Salt marsh vegetation, especially the root mats and dense stems, trap and stabilize sediments. Marshes tend to grow outwards over time as sediments entering the delta from rivers are captured and retained by salt marsh vegetation. Marshes provide complex, branching networks of tidal channels where juvenile salmonids feed and take refuge from predators, as well as providing habitat connections to riverine and marine environments (Hood 2005).
Ecological processes that are important for creating and maintaining salt marsh habitat include sediment transport and deposition and tidal exchange. Sediment transport and deposition forms the coastal landforms subject to periodic tidal inundation and exposure, which support salt marsh vegetation. Tidal exchange provides the sediment required for building marsh surfaces that are substrate for saltmarsh vegetation, and in addition, provides twice daily flushing of organic matter, nutrients, and pollutants. Organic matter from salt marsh vegetation supports macro-detritus based food webs that provide food items for forage fish and salmonids in nearshore habitats adjacent to salt marshes. Maintenance of salt marsh habitats depends in part on the balance between marsh aggradation due to the buildup of organic matter and sediment trapped in the marsh and sea level rise (Bottom et al. 2005).
The ecological functions and biological resources of salt marshes include:
• Detrital based food webs;
• In-situ production of invertebrate prey items of importance to nearshore fish and birds (e.g., salmonid prey);
Page 3-16 June 2009

Pierce County Shoreline Inventory and Characterization Report
• Tidal channels that provide refugia and foraging areas for fish and invertebrates; and
• Primary production– salt marshes are highly productive.
Salt marshes historically were extensive in both the Puyallup and Nisqually estuaries. Salt marsh vegetation has virtually disappeared from Commencement Bay, being present only in small, fragmented areas, such as the mouths of Puget and Hylebos Creeks and at some habitat restoration sites. Diking and draining of the Nisqually Delta has also reduced native salt marsh habitat.
In addition to major estuaries, salt marsh habitat in Pierce County is generally coincident with the key bays and pocket estuaries. Linkages between the major estuarine deltas and other shallow nearshore habitats such as pocket estuaries are critical for rearing and migrating juvenile salmonids (SPSSRG 2004).
3.2.8.6 Marine Riparian Vegetation
Marine riparian zones occur at the interface between upland and marine aquatic systems (Culverwell and Brennan 2003; Brennan and Culverwell 2004). Marine riparian zones occur above the area subject to tidal inundation, but may be in the area influenced by salt spray or storm waves. The type of marine riparian vegetation that occurs along the shoreline is influenced by a number of factors. The underlying geology that influences the type of shoreform, whether feeder bluff, rocky shore, or beach backshore, will influence the type of riparian vegetation present. In addition to underlying shoreform, the types of soils, steepness and height of the shoreline or bluff, annual precipitation, adjacent land uses, and surface and hillslope runoff processes, can all affect what type of vegetation is present. For example, adjacent land uses may result in presence of invasive species, or the replacement of forested riparian vegetation with ornamental landscaping, lawns, or impervious surfaces. Shorelines comprised of very steep or unstable slopes may not support vegetation except at the very top of the slope. In contrast, small bluffs or shorelines may support dense riparian vegetation that overhangs into the upper beach zone.
Healthy marine riparian areas provide a range of essential functions, including water quality protection, sediment stabilization and control, wildlife habitat, nutrient retention, microclimate regulation, insect food sources for juvenile fish, shade/cover, and woody debris to provide complex habitat structure and stabilize beaches (Brennan and Culverwell 2004). Areas with intact riparian vegetation can also help protect slopes and bluffs from erosion hazards, mitigate storm damage, and stabilize slopes. Plant root masses provide stability by holding the soil in place. In addition, evapotranspiration removes moisture from the soil and can prevent high soil moisture or saturated soil conditions, which can lead to landslides or erosion hazards (Brennan and Culverwell 2004). The extent to which riparian zones perform these functions is dependent on vegetation composition, vegetation density, and the area continuously covered with vegetation (e.g., width of buffer and length of shoreline with buffer) (Knutson and Naef 1997).
June 2009 Page 3-17

Pierce County Shoreline Inventory and Characterization Report
Brennan and Culverwell (2004) note the following characteristics of healthy nearshore riparian systems:
• Long linear shapes;
• High edge-to-area ratios;
• Microclimates distinct from those of adjacent uplands;
• Standing or flowing water present all or much of the year, or a capacity to convey or retain water;
• Periodic flooding, which results in greater natural diversity;
• Composition of native vegetation differing from upland (inland) systems (e.g., different species composition, abundance, diversity, and structure), and
• Support systems for terrestrial and aquatic biota.
Many areas of marine shoreline in Pierce County have relatively intact marine riparian vegetation, with the potential to provide water quality, shoreline stabilization, and LWD functions to the nearshore. Areas with riparian vegetation along most of the shoreline include the western side of Colvos Passage (mostly south of Gig Harbor) and the Narrows, Wollochet Bay, the south shore of Fox Island, McNeil and Anderson Islands, the southern portion of the Key Peninsula, the eastern shore of Case Inlet south of Vaughn Bay, and the northwestern portion of Henderson Bay. Areas with little or no riparian vegetation include the north shore of Vaughn Bay, the north shore of Fox Island, most of the eastern shore of Henderson Bay and the northern side of Hale Passage, and the Gig Harbor area.
3.2.8.7 Freshwater Wetlands
The state of Washington (WAC 173-22-030) defines wetlands as “those areas that are inundated or saturated by surface or ground water at a frequency and duration sufficient to support, and that under normal circumstances do support, a prevalence of vegetation typically adapted for life in saturated soil conditions.” Wetlands generally include swamps, marshes, bogs, and similar areas. Wetlands are known to play a vital role in the landscape by performing:
• Biogeochemical functions related to trapping and transforming chemicals and improving water quality in the watershed;
• Hydrologic functions related to maintaining the water regime in a watershed and reducing flooding; and
• Food web and habitat functions (Granger et al., 2005).
3.2.8.8 Freshwater Riparian Areas
Freshwater riparian areas function in many of the same ways as nearshore riparian areas. Riparian zones contribute to healthy streams by dissipating energy and inhibiting sediment input, suppressing the erosional processes that move sediment, and by mechanically filtering and/or storing upland sediments before they can enter stream channels (Knutson and Naef, 1997). Riparian areas also perform water quality functions related to pollutant removal. This occurs primarily through denitrification and trapping/storing phosphates and heavy metals that are
Page 3-18 June 2009

Pierce County Shoreline Inventory and Characterization Report
adsorbed to fine sediments. Riparian vegetation provides shading and nutrient input to adjacent water bodies.
One of the most crucial roles that riparian areas play in the ecosystem is creating habitat. Riparian zones are a major source of LWD input to streams. Approximately 70 % of the structural complexity within streams is derived from root wads, trees, and limbs that fall into the stream as a result of bank undercutting, mass slope movement, normal tree mortality, or windthrow. LWD creates complex hydraulic patterns that allow pools and side channels to form. It also creates waterfalls, enhances channel sinuosity, and instigates other physical and biochemical channel changes. The in-channel structural diversity created by LWD is essential to aquatic species in deep, low velocity areas for hiding, overwintering habitat, and juvenile rearing, in all sizes of streams and rivers (Knutson and Naef, 1997).
3.2.8.9 Terrestrial Habitats
Other habitat resources within Pierce County include terrestrial forests (including old growth), river-cut canyons, glacially eroded canyons, active glaciers, riparian areas, coastal dunes, sphagnum bogs, and grasslands. A majority of the County falls within the Cascades ecoregion, dominated by coniferous forests. Lowland forests are dominated by western hemlock, Douglas-fir, and western redcedar. Forests in the mountains are dominated by Pacific silver fir, and mountain or western hemlock. These habitats provide breeding, feeding, and migration areas for vertebrate and invertebrate grazers and seed eaters, omnivores, carnivores, and scavengers (Kruckeberg, 1991). Notable species include: black-tailed deer, elk, black bear, cougars, beavers, raccoons, and many rodents. Many of these terrestrial species relay on shoreline habitats (lakes, rivers and marine shores) for some of their life stage requirements.
3.2.9 Fish and Wildlife Species
The terrestrial and aquatic habitats in Pierce County support numerous fish and wildlife species, included species listed as threatened or endangered under the state and/or federal Endangered Species Act (Table 3-1).
3.2.9.1 Marine Mammals
A number of marine mammals occur in the nearshore and marine waters of Pierce County, including harbor seals (Phoca vitulina), California sea lions (Zalophus californianus), and Southern Resident killer whales, or Orcas (Orcinus orca). Steller sea lions (Eumatopias jubatus) may also occur occasionally in the South Sound. Orcas are not as common in the South Sound as in the northern portions of Puget Sound, in part because they tend to occur in deeper marine areas and much of the South Sound is comprised of nearshore habitats less than 20 feet deep. Marine mammal haulouts have been mapped by the Washington Department of Fish and Wildlife (WDFW) around the shores of McNeil Island and near Raft Island.
June 2009 Page 3-19

Pierce County Shoreline Inventory and Characterization Report
Table 3-1. Federal and State Listed Species in Pierce County
Common name Scientific name Federal Status State Status Critical Habitat
Bald eagle Haliaeetus leucocephalus
De-listed Threatened No
Peregrine falcon Falco peregrinus Species of Concern
State Sensitive No
Purple martin Dryocopus pileatus None Candidate No
Puget Sound/ Strait of Georgia coho salmon
Oncorhynchus kisutch
Species of Concern
None No
Puget Sound Chinook salmon
Oncorhynchus tshawytscha
Threatened Candidate Yes
Puget Sound steelhead
Oncorhynchus mykiss
Threatened None No
Coastal/Puget Sound bull trout
Salvelinus confluentus
Threatened Candidate Yes
Coastal cutthroat trout
Oncorhynchus clarkii clarkia
Species of Concern
None No
Westslope cutthroat trout
Oncorhynchus clarki lewisi
Species of Concern
None No
Southern Resident Population killer whale
Orcinus orca Endangered Endangered Proposed
Steller sea lion Eumotopias jubatus
Threatened Threatened No
Western pond turtle
Clemmys marmorata
Species of Concern
Endangered No
3.2.9.2 Seabirds and Waterfowl
Both resident and migratory seabirds and waterfowl are associated with Pierce County shorelines. Commonly occurring seabirds or waterfowl include loons (Gavia spp.), cormorants (Phalacrocorax spp.), mergansers (Mergus spp.), grebes (Aechmophorus spp.), herons and egrets (Ardeidae), geese (Branta), brants (Branta bernicla), gulls (Larinae), sandpipers (Scolopacidae), and ducks (dabbling and diving) (Buchanan 2006). In addition, a number of bird species identified as state priority wildlife species are associated with and forage along shorelines of Pierce County, including bald eagles (Haliaeetus leucocephalus), osprey (Pandion haliaetus), and great blue heron (Ardea herodias) (WDFW 2007).
Waterfowl concentrations in Pierce County are associated with bays and estuarine areas. Major areas include Commencement Bay, the Nisqually Delta area, protected coves around McNeil Island, and Vaughn Bay, and small bays and inlets associated with Raft Island in Henderson Bay.
Page 3-20 June 2009

Pierce County Shoreline Inventory and Characterization Report
3.2.9.3 Forage Fish
In Puget Sound, forage fish species constitute a significant part of the marine food web, being particularly important as prey for fish species, including salmonids, and for marine mammals and seabirds (Fresh et al. 1981; Pentilla 1995; Bargmann 1998). Three species comprise the main forage fish species: surf smelt (Hypomesius pretiosus), Pacific herring (Clupea harengus pallasi), and Pacific sand lance (Ammodytes hexapterus). Forage fish species use a range of nearshore and estuarine habitats for feeding, rearing, and spawning.
Surf smelt and Pacific sand lance both spawn within a limited range of tidal elevations in the upper intertidal zones of beaches, and have specific habitat requirements including substrate size and type (Pentilla 1978, 1995). Surf smelt spawn on coarse sand or pea gravel; gravels ranging in size from 1 to 7 millimeters. Surf smelt spawning occurs during high tides, most typically during afternoons or early evening (WDFW 2004). Pacific sand lance spawn over a wider range of substrate sizes than surf smelt, ranging from fine sand beaches to beaches with gravel up to 30 millimeters in size (Pentilla 1995; Lemberg et al. 1997). Pacific herring spawn in intertidal and shallow subtidal areas, depositing eggs on marine vegetation at elevations between 0 and -10 feet MLLW (WDFW 2000). Eelgrass beds are important spawning substrate for Pacific herring; adhesive eggs are deposited on leaf blades of eelgrass and to a lesser extent on a variety of marine algae (Lemberg et al. 1997; Pentilla 1995). Due to the spawning requirements of these species, suitable spawning habitat for forage fish is limited, and these species are particularly vulnerable to changes in beach morphology (relative depth, exposure), beach sediment characteristics (substrate size - sediment sources, transport, or deposition), and nearshore riparian vegetation cover (WDFW 2000, 2004).
Documented forage fish spawning beaches in general are not as common in the South Sound as in more northern portions of Puget Sound, and spawning areas in the South Sound tend to be smaller and more scattered than further north (WDFW 2000, 2004). However, potential forage fish spawning habitat is quite widespread in marine nearshore areas of Pierce County. The WDFW and Pentec/Pierce County have mapped and identified Pacific sand lance spawning beaches along Point Defiance, the western shore of Colvos Passage, northern shore of Fox Island, in Wollochet Bay, Horsehead Bay, scattered locations around the shores of Anderson and McNeil Islands, on the western shore of Henderson Bay near Glen Cove, along Drayton Passage and along the shore at Devil’s Head.
Surf smelt spawning areas have been identified along Colvos Passage north of Gig Harbor, in Wollochet, Horsehead and Henderson Bays, along the west shore of Carr Inlet around Glen Cove, McNeil Island/Pitt Island, at beaches along Van Geldern and Mayo Coves, along Devil’s Head, near Vaughn Bay and Rocky Bay in Case Inlet, and south of the Chambers Creek mouth in the Nisqually Reach.
Pacific herring spawning areas are limited in Pierce County nearshore waters. The only documented Pierce County occurrence is for the stock that spawns at Wollochet Bay (Stick 2005). Pre-spawn holding areas for the Wollochet Bay and the Squaxin Pass stocks occur in Hale Passage, and west of Anderson Island, respectively (Stick 2005).
June 2009 Page 3-21

Pierce County Shoreline Inventory and Characterization Report
3.2.9.4 Shellfish
Cobble to fine sand beaches and sand and mud flats are important habitat for many shellfish species. Intertidal and subtidal areas that support the native Dungeness crab (Cancer magister) occur more abundantly in the northern portions of Puget Sound, but also occur in the South Sound, often associated with estuaries and eelgrass beds (Stevens and Armstrong 1984). Geoducks (Panopea abrupta) occur offshore in fine substrates of mud or soft sand, and typically burrow up to 2-3 feet deep into the substrate. A number of hardshell clams, including butter clams (Saxidomus gigantean), native littleneck (Protothaca staminea), manila clams (Venerupis philippinarum), and horse clams (Tresus capax and T. nutallii) also inhabit the intertidal shorelines. Olympia oyster (Ostreola conchaphila) and non-native Pacific oysters (Crassostrea gigas) are common in the South Sound. Other nearshore shellfish include a number of filter feeders that remove plankton from the water column, such as cockles (Clinocardium nutallii) and softshell clams (Mya arenaria). Some nearshore shellfish such as the macoma clams (Macoma spp.) are detritivores that feed on organic detritus on the surface of sediments. Shellfish resources in Pierce County are important as the basis for commercial, recreational, and tribal harvesting, particularly for hardshell clams, oysters, and geoducks.
In Pierce County, shellfish beds and commercial and recreational harvest beaches are found along the shorelines of Anderson Island, Burley Lagoon, Drayton Passage, Filucy Bay, Fox Island, Henderson Bay, Oro Bay, Penrose Point, Rocky Bay, Vaughn Bay, West Key Peninsula, and Wykoff Shoal (WDFW 2007, DOH 2007).
The Pacific geoduck occurs in Puget Sound as both wild and cultured populations. Geoducks occur in soft substrates of low intertidal to subtidal regions. Subtidal populations are found in all parts of Puget Sound and are regularly surveyed by WDFW and Treaty Tribes (Hoffman et al. 2000); much less information is available on intertidal populations. Subtidal geoducks are subject to commercial harvest by divers, with a limit to the legal harvest set at 2.7 percent of the estimated harvestable biomass in each of six regions in the Sound (Hoffman et al. 2000).
Intertidal geoduck populations are subject to recreational harvest, and more recently, geoduck aquaculture has developed in Puget Sound. Currently, geoduck aquaculture occurs on privately owned tidelands; however, the state is initiating a program to allow geoduck aquaculture on leased state-owned tidelands (Ecology 2009). Shellfish aquaculture may provide a number of benefits, including removing nutrients and particulates from the water column, reducing the likelihood of harmful algal blooms, and increasing water clarity and light penetration. Geoduck aquaculture also has the potential to negatively affect the marine environment. Potential effects include introduction of non-native species and diseases, physical disturbance of benthic infauna and submerged aquatic vegetation, damage to birds and other animals from predator exclusion netting, increased sedimentation during harvest and effects on eelgrass, and potential genetic effects on wild populations from cultured geoducks (Strauss et al. 2008). Geoduck aquaculture may also result in conflicts among differing uses of the shoreline and nearshore areas, for example between commercial shellfish harvest and recreational use, or aesthetic enjoyment of the shoreline.
Shellfish beds perform a number of important ecological functions including nutrient cycling, stabilizing substrate, enhancing water quality (filtering and retention), creating and maintaining
Page 3-22 June 2009

Pierce County Shoreline Inventory and Characterization Report
June 2009 Page 3-23
habitat structure (e.g., oyster reefs), and providing food for a wide variety of marine invertebrates, birds, fish and mammals. As filter feeders, shellfish consume large quantities of plankton and particulate organic matter, cleaning the water column of organic matter (and any pathogens or pollutants that are present). Shellfish species occupy a range of substrate types from mud to gravels, with each species having a preferred or optimal substrate size for larval settling and adult growth (Dethier 2006). Siltation can negatively impact larval shellfish by smothering, and adult shellfish through interfering with filter feeding. Shellfish are therefore sensitive to changes in sediment dynamics, especially increased erosion and inputs of fine sediments or changes in substrate type or size (Dethier 2006). Because shellfish filter the water column, they retain and concentrate pathogens and pollutants in the water – although this helps improve water quality, contaminated shellfish can negatively impact people and other animals that eat shellfish.
3.2.10 Land Use and Land Cover
Land use and land cover in Pierce County follow the patterns of geology and topography discussed above. Forest land dominates the majority of the eastern portion of the County that lies within the Cascades and foothills. Much of the forest land is in active harvest rotation, but there are significant protected areas, including within Mount Rainier National Park. The eastern portion of the County also includes active glaciers and snowfields on Mount Rainier.
Land use and land cover vary more widely in the western portion of the County, which includes broad upland till plains, alluvial valleys, and marine shorelines. Historically, the area was likely dominated by forest and prairies (Collins and Sheikh, 2005, Collins et al., 2002).
The presence of a deepwater embayment (Commencement Bay) and vast forest resources within the upper portion of the County resulted in the early establishment of a major port (at what is now Tacoma) and other significant changes in land use and land cover over the past 150 years. These changes focus on the conversion of forest and prairie to either agricultural or urban lands. This shift in land use and cover includes the development of a transportation infrastructure that extends throughout the County.
To provide an overall summary of land cover in Pierce County, data from the National Oceanic and Atmospheric Administration (NOAA) Coastal Change Analysis Program (CCAP) project (2001) are shown on Map 10 (Land Cover) and summarized in Table 3-2. Data are collected into similar categories for the summary tables (e.g., high, medium, and low intensity are grouped into ‘Developed’).
The density of urban development generally decreases with distance away from the Sound, and cities and towns (Puyallup, Orting, etc.) are scattered along the main river valleys. Using WRIA 10 (Puyallup/White) as an example, the sub-basins in the upper watershed range between 1 (Upper White River) and 12 % (South Prairie Creek) developed, while the sub-basins in the western portion range between 39% (Mid Puyallup River) and 93% (Tacoma) developed.

Pierce County Shoreline Inventory and Characterization Report
Table 3-2. Sub-basin-scale summary of land cover data
Sub-basin Name WRIA Developed (%)
Agriculture (%)
Forest, Grassland, Bare
Land (%) Wetland (%) Open Water
(%) Snow or Ice
(%)
Browns Dash Point 10 67 0 28 2 3 0 Clear/Clark's Creek 10 70 7 21 2 0 0 Hylebos Creek 10 72 8 15 4 0 0 Lower Carbon River 10 4 3 91 3 0 0 Lower White River 10 39 14 29 4 14 0 Mid Puyallup River 10 40 13 42 4 1 0 Mud Mountain 10 12 18 59 11 1 0 South Prairie Creek 10 5 2 90 2 0 0 Tacoma 10 93 0 4 1 2 0 Upper Carbon River 10 1 0 91 1 1 6 Upper Puyallup River 10 2 0 89 2 1 6 Upper White River 10 1 0 94 1 1 4 Lower Nisqually 11 11 0 81 7 0 0 Mashel River 11 2 1 97 1 0 0 Mid Nisqually River 11 5 13 74 7 2 0 Muck Creek 11 15 19 60 6 0 0 Ohop Creek 11 4 6 88 2 1 0 Upper Nisqually River 11 1 0 83 3 3 9 American Lake 12 37 2 50 5 6 0 Chambers Bay 12 84 0 13 2 0 0 Clover Creek/Ste 12 60 4 32 3 1 0 Tacoma West 12 76 0 20 3 1 0 Burley Lagoon 15 28 1 67 4 0 0 Dumas Bay 15 93 0 7 0 0 0 Gig Harbour 15 30 1 65 4 1 0 Islands 15 9 8 71 8 4 0 Key Peninsula 15 6 2 86 6 1 0 Minter Bay 15 18 2 74 6 0 0 Water – Coastal 15 0 0 1 7 92 0 Wauna 15 27 0 69 3 1 0 Cowlitz 26 0 0 88 0 0 11
Page 3-24 June 2009

Pierce County Shoreline Inventory and Characterization Report
3.3 Ecosystem Processes
The following section describes the landscape-scale processes that shape and influence the marine and freshwater shoreline environments of Pierce County. Alterations to processes that have occurred as a result of human activity and development are also discussed. These provide a basis for understanding County-wide management issues and priorities.
3.3.1 Nearshore Marine Processes
The marine nearshore is defined as the zone of interface between the subtidal marine habitats of Puget Sound, the freshwater habitats of rivers and streams and the adjacent uplands along the shore (Williams et al. 2001, Redman et al. 2005). The nearshore extends generally from the lower limit of light penetration in offshore waters (i.e., the photic zone, about 65 to 100 feet below MLLW) to the MHHW line along the shoreline and/or the upper limit of tidal influence in rivers and streams. Nearshore habitats also include upland and backshore areas that directly influence the adjacent aquatic habitats (e.g., marine riparian vegetation and bluffs).
Process controls for Pierce County’s marine landscape include climate, geology, topography and bathymetry, oceanography, and tidal circulation. These process controls drive ecosystem processes that can be described within the broad categories of: physical morphology, and water quality.
3.3.1.1 Physical Nearshore Marine Processes
The nearshore marine portion of Pierce County’s shoreline occurs over a dynamic physical structure that spans the transition from the surrounding uplands into and through the intertidal zone. Water, sediment, and vegetation combine within the nearshore to form areas that vary in terms of slope, water depths, water quality parameters (e.g., salinity), sediment size, and seasonal variability. These structures include bluffs, beaches, mud and sand flats, and marshes.
Beaches in the Puget Sound often have two distinct foreshore components: a high-tide beach and a low-tide terrace (Downing 1983). The high-tide beach consists of a relatively steep beachface with coarse sediment and an abrupt break in slope at its waterward extent. Sand in a mixed sand and gravel beach is typically winnowed from the high-tide beach by waves (Chu 1985) and deposited on the low-tide terrace. Extending seaward from the break in slope, the low-tide terrace typically consists of a gently sloping accumulation of poorly sorted fine-grained sediment (Komar 1976, Keuler 1979). Lag deposits derived from bluff recession are also found in the low tide terrace. These deposits are typically comprised of larger rocks, ranging from cobbles to boulders.
Wind-generated wave action gradually erodes beaches and the toe of coastal bluffs, leading to landslides. These coastal bluffs are the primary source of sediment for most Puget Sound beaches, including the Pierce County study area (Keuler 1988, Downing 1983). Bluff composition and wave energy influence the composition of beach sediment. Waves sort coarse and fine sediment and large waves can transport cobbles that small waves cannot. Additionally beaches supplied by the erosion of coarse gravel bluffs will differ in composition from those fed by the erosion of sandy material. The exposed strata of the eroding bluffs in the study area are largely composed of sand, gravel, and silt (DNR 2001a, Ecology 1979). These same materials
June 2009 Page 3-25

Pierce County Shoreline Inventory and Characterization Report
dominate sediment found on the beaches, with the exception of silt (and clay), that is winnowed from the beachface and deposited in deeper water.
Wind Energy and Exposure
Within Puget Sound and the Northern Straits, fetch exhibits considerable spatial variability. The DNR Shorezone database measured and classified the exposure of all beaches in Washington State based on a combination of several open water distance measurements (DNR 2001a). Wave energy is generally limited throughout the Pierce County study area. The maximum measured fetch throughout the study area was just below 12 miles. Shores were classified as predominantly “protected” (60%). Semi-protected shores were considered the most exposed within the study area and accounted for about 21% of the study area. The remaining beaches were qualified as very protected (19%) and likely represent the sheltered embayments that are frequently observed across the study area.
Net Shore-drift
Wind-generated waves typically approach the shore at an angle, creating beach drift and longshore currents and transporting sediment by a process called littoral drift. Net shore-drift refers to the long-term, net result of littoral drift. Net shore-drift cells represent a sediment transport sector from source to deposition along a portion of the coast. Each drift cell acts as a system consisting of three components: a sediment source (erosive feature) and origin of a drift cell; a transport zone where materials are moved alongshore by wave action with minimal sediment input; and an area of deposition that acts as the drift cell terminus. Deposition of sediment occurs where wave energy is no longer sufficient to transport the sediment in the drift cell. Drift cells in the Puget Sound-Georgia Strait region range in length from 5 or more miles to just a few hundred feet.
Net shore-drift was originally mapped in Pierce County by Harp in 1983 (Volume 3: Central Puget Sound - Kitsap, Pierce, and King Counties). The mapping was compiled with other Puget Sound net shore-drift mapping and published by the Washington State Department of Ecology Shorelands Division in Schwartz et al., 1991 (Ecology Report #00-06-32). One other drift cell mapping effort was completed in the late 1970s as part of the Coastal Zone Atlas of Washington (Ecology 1974). The methods used in that study differed greatly from those applied by Schwartz et al. (1991) in that the Atlas relied exclusively on (limited) historic wind records. This method is known as wave hind-casting, where inland wind data records are used for the determination of net shore-drift, without consideration of local variations in winds or coastal morphology. Drift directions indicated in the Atlas have repeatedly been proven inaccurate.
Recently the Washington Department of Ecology digitized the compiled drift cell mapping (cited as Schwartz et al. 1991); however, the mapping was not technically reviewed and numerous errors and misinterpretations exist in the dataset. Upon initial review of the Pierce County net shore-drift digital mapping, it appears that over 21 miles of shore were mapped as “Unknown”. This is likely due to errors in interpreting the hard copy maps into digital format and could easily be resolved by hiring a geologist with experience mapping net shore-drift. Additionally it is likely that Harp performed the original mapping effort when McNeil Island was a federal prison, as it was not included in his mapping. To date, no one else has explored the net shore-drift
Page 3-26 June 2009

Pierce County Shoreline Inventory and Characterization Report
around McNeil Island, which represents a considerable gap in the net shore-drift data set. These two deficiencies in the Pierce County data cumulatively represent over 33 miles of Pierce County shoreline, or roughly 18% of the study area.
Pierce County contains all or part of 129 net shore-drift cells and 11 regions of negligible net shore-drift. Drift cells range in length from 161 feet to over 7 miles. The average cell extends just under one mile (0.9 mile). The wide range of drift cell lengths can largely be attributed to frequent changes in shoreline orientation, dividing longshore drift into numerous shorter cells (Schwartz et al. 1991).
The general pattern of littoral transport in the region largely reflects the shore orientation relative to the predominant (strongest) wind and wave conditions. Shores that are exposed to the south typically have northward net shore-drift due to predominant southerly winds. Shores exposed only to the north are within the wind and wave shadow of strong southerly wind conditions, but are exposed to lighter northerly winds, resulting in southward transport. Shores oriented east and west are similarly influenced by their shore orientation relative to direction from which the greatest fetch is derived. No appreciable net shore-drift occurs along rocky shores or with in enclosed shorelines such as the inner shores of lagoons and sub-estuaries.
Coastal Bluff Landslides
Coastal landslides typically occur during periods of high precipitation on bluffs with a combination of characteristics making the bluff more vulnerable to slope failure. These characteristics include the underlying geology of a bluff or bank, its level of exposure (fetch), and the local hydrology (groundwater and surface water). As a result, the exposed high-gradient bluffs and banks of Pierce County are more susceptible to coastal landslides relative to lower elevation and less exposed shores of the County.
Landslides are more likely to occur in areas where there is a history of landslides, or where the lower part of the bluff is composed of an unconsolidated, permeable layer (sand) and a more consolidated impermeable layer (such as dense silt or clay) (Gerstel et al. 1997). As water seeps through the permeable layer and collects above the impermeable layer, a zone of weakness or “slip-plane” is created. This pattern is a typical initiator of mass movement throughout Puget Sound and in Pierce County.
Bluffs that are exposed to greater fetch are subject to higher wave energy during storms, resulting in greater toe erosion and bluff undercutting, and thus more frequent landslides (Shipman 2004). Keuler (1988) reported that undercutting the toe of the bluff (caused by wave erosion) is the long-term driver of bluff recession in Puget Sound. Windstorms that create significant wave attack of the bluff toe often trigger bluff failures. Bulkheads reduce wave attack to bluff toes but can accelerate erosion of the beach. Storms that coincide with elevated water levels, such as a storm surge or extraordinary high-high tide, commonly initiate landslides throughout the Puget Sound region (Johannessen and Chase 2003).
The wave attack caused by a storm that occurs in conjunction with heightened water level can produce dramatic toe erosion, which then undermines and destabilizes a larger portion of the bluff that may not fail (slide) until subsequent wet weather months. Periods of high rainfall
June 2009 Page 3-27

Pierce County Shoreline Inventory and Characterization Report
intensity and duration (especially during saturated soil conditions) are the most common trigger of coastal landslides (Tubbs 1974, Thorsen 1987), such as those observed at New Year 1996-97 (Gerstel et al. 1997, Shipman 2001).
Seepage can sometimes be observed in the bluffs of Puget Sound and Pierce County. The highest volumes of groundwater observed seeping from the bluff face typically occur following prolonged periods of heavy precipitation. Surface water volumes often increase and become more concentrated as a result of development of housing and roads. Concentrated surface water can locally erode bluff crests while also saturating soils, which exacerbates natural slope stability problems along coastal bluffs and can trigger landslides (Shipman 2004). Runoff flowing down a driveway and rapidly across a lawn (which can absorb little water when wet) as sheet flow to the bluff face is an example of this process. A broken drainage pipe on a bluff face is another form of development triggering landslides. Failed drainage pipes and subsequent erosion are common in Pierce County and often contribute to and initiate coastal landslides.
Bluffs with significant modifications to both the natural drainage regime and vegetation are particularly susceptible to landsliding. Removal or lack of bluff vegetation can result in low root strength (for example, scattered ornamental plants and grass). Lower root strength can increase the likelihood of future landslides (Schmidt et al. 2001, Zeimer and Swanson 1977, Bishop and Stevens 1964). Reestablishment and maintenance of native vegetation cover, or installation of a fibrous-rooted vegetation cover along with some type of drainage control, can reduce the likelihood of bank failures (Gray and Sotir 1996, Menashe 2001, Roering et al. 2003).
The slope stability mapping in the Coastal Zone Atlas was recently digitized by the Washington State Department of Ecology (1979). The mapping was originally performed in the 1970s using aerial photograph analyses and field reconnaissance. Thirty-six historic landslides were mapped throughout the County’s marine shores, with the most falling within WRIA 15. Seventy-three “recent landslides” were mapped in the County. Distribution of these slides was largely even across Pierce County’s nearshore, with slightly more landslides occurring in WRIAs 10 and 12.
Fluvial Influences
Fluvial influences play key roles in the nearshore environment in driving estuarine circulation patterns, influencing stratification, forming and maintaining physical habitat structure in estuaries through the movement of water and sediment, influencing salinity gradients and associated water quality characteristics in estuaries, serving as migratory corridors for the movement of animals, and providing a source of sediment, nutrients and toxins, and large woody debris to nearshore systems. Major rivers, such as the Nisqually and Puyallup, have a predominant influence in the South Sound in terms of inputs of freshwater, sediment, and nutrients/pollutants (Embrey and Inkpen 1998, Ecology 2005). Freshwater inputs from smaller streams are also important in the formation and maintenance of pocket estuaries.
In Pierce County nearshore environments, the major fluvial influences are the Puyallup River and Nisqually River, with the Puyallup River contributing about 43% of the annual inflow of freshwater to the South Sound (Albertson et al. 2002). Smaller streams, such as Burley, Chambers, Rocky, and Wollochet Creeks, also contribute freshwater and sediment and influence local habitat structure and salinity gradients. Fluvial influences may also include the contribution
Page 3-28 June 2009

Pierce County Shoreline Inventory and Characterization Report
of freshwater flows from surface seeps and/or groundwater along marine shorelines. These areas, although contributing small amounts of freshwater in localized areas, can have a significant impact on the salinity gradients in pocket estuaries and can affect temperatures and moisture levels in the upper beach areas where forage fish spawn.
Changes in river flows, removal or constriction of tidal exchange, filling of floodplain or estuarine wetlands, and shoreline armoring can alter and/or remove fluvial influences from the nearshore. These changes can reduce habitat quality and quantity for nearshore plants and animals. For example, construction of tide gates or levees across estuaries that block river flows and tidal exchange not only decrease the area of tidally influenced estuarine wetland landward of the barrier, but can also greatly reduce habitat complexity and extent of tidal channel networks seaward of the barriers (Hood 2005).
3.3.1.2 Nearshore Marine Water Quality Processes
The nearshore and marine waters of Pierce County receive inputs of nutrients and organic matter from deeper ocean waters via estuarine circulation and mixing, from nearshore bottom sediments, and from adjacent uplands, streams, rivers, and groundwater seeps. In general, inputs from natural sources of nitrogen and phosphorus are several orders of magnitude greater than anthropogenic sources in Puget Sound (Harrison et al. 1994). However, a number of the South Sound’s characteristics lead to a greater contribution from terrestrial and anthropogenic sources of nutrients compared to oceanic influences (Albertson et al. 2002). The South Sound is thus relatively sensitive to eutrophication and low dissolved oxygen (DO) related to anthropogenic sources of nutrients (Newton and Reynolds 2002, in Albertson et al. 2002). Inputs of excess nutrients, toxins, and pathogens are affected by the volumes of river discharges to the Sound, land cover in the contributing watersheds of rivers discharging to the Sound, presence of agricultural land uses which concentrate manure or fertilizers, failing septic systems, fertilizers and pesticides from residential areas, contaminated sediments from industrial or commercial operations, and stormwater runoff from impervious surfaces (Embrey and Inkpen 1998).
The South Sound is characterized by protected bays and narrow inlets, relatively shallow depths, stratification of the water column, slow flushing times, and a high shoreline to water surface area ratio (Albertson et al. 2001). Under these conditions, nutrients entering the nearshore from adjacent uplands, rivers, and streams are not diluted by mixing or flushing. The shallow nature of the bays and inlets results in high productivity – given abundant nutrients and light, plankton and other algae have high growth rates (Nakata and Newton 2001). The South Sound likely experienced greater periods of low DO historically due to its physical characteristics, but these also make the region more vulnerable to increased low DO levels and eutrophication associated with rural and urban development in the adjacent uplands. The South Puget Sound area experiences a greater frequency of periods with DO levels low enough to kill marine organisms more frequently than other areas of Puget Sound (Newton et al. 1998). Areas with the highest sensitivity to elevated nutrient inputs and vulnerability to low DO include Case and Carr Inlets (Albertson et al. 2002).
Excess nutrients entering these areas can lead to water quality problems associated with eutrophication – algal blooms and low levels of dissolved oxygen (hypoxia), which can be detrimental to marine organisms. Greater phytoplankton growth or algal blooms stimulated by
June 2009 Page 3-29

Pierce County Shoreline Inventory and Characterization Report
excess nutrients reduces light levels reaching the bottom, and reduces the growth and vigor of other plants, such as eelgrass and macroalgae (Williams and Thom 2001). Eutrophication can also lead to contamination of shellfish beds from the harmful bacteria associated with some nutrient sources (i.e., fecal coliforms), and from harmful algal blooms, which are thought to contribute to Paralytic Shellfish Poisoning (PSP) and Amnesiac Shellfish Poisoning (ASP) (DOH 2005). In addition, excess nutrients can affect phytoplankton community composition and therefore, indirectly affect marine food webs that rely on phytoplankton.
Light Energy
Light entering the marine nearshore environment is a key factor controlling biological processes such as primary production from the growth of plants, reproductive cycles of marine animals, migratory movements, and predator-prey interactions (Nightingale and Simenstad 2001). For example, the growth of eelgrass is highly dependent on adequate light levels, and the foraging success of juvenile fish (or their predators) depends on adequate light levels for locating and capturing prey. Juvenile salmonid movements are affected by areas of deep shade and this in turn may affect vulnerability to predators and timing of migration from the nearshore to deeper waters (Simenstad et al. 1999, Thom and Albright 1990). Light levels also affect water temperatures in ways that directly affect the growth and productivity of marine plants. For example, light levels influence the rate at which water temperatures warm during the spring and the timing of plankton blooms. Finally, light levels affect temperatures and therefore the degree of desiccation and heat stress in upper beach areas which are important habitats for forage fish spawning.
Three types of light alteration are particularly important in the nearshore system – a decrease in daytime light levels due to artificial shading; an increase in daytime light levels (and heat/desiccation stress) due to vegetation removal and riparian vegetation/shoreline armoring; and an increase in nighttime light levels due to artificial lighting from buildings, docks, marinas, or roadways.
3.3.2 Nearshore Marine Alterations
A substantial portion of the Pierce County shoreline has been modified from its original state. Shoreline modifications observed within the County include: shoreline armoring, over-water structures, fill, aquaculture structures, and dredging for marinas and deep-water moorage. Approximately 41% of the linear shoreline has undergone such modifications, excluding filling which is not easily observed or formerly inventoried. Modified shoreline segments vary in the degree that they are modified. Shorelines that are more than 80 percent modified represent 30 percent of the County shoreline (approximately 54 miles). Approximately 1.7 percent of the marine shoreline has modifications that infringe considerably on intertidal habitats, extending approximately down to mean sea level (Pentec 2003).
3.3.2.1 Shoreline Armoring
Shoreline armoring refers broadly to structures placed in the nearshore to prevent bank erosion, control the movement of sediment, and intercept wave energy. Shoreline armoring includes breakwaters, jetties, groins, bulkheads, seawalls, and revetments (ACOE 1981). Armoring below the MHHW line has relatively greater impacts on nearshore processes and habitats than armoring
Page 3-30 June 2009

Pierce County Shoreline Inventory and Characterization Report
that is placed higher on the shore (Williams and Thom 2001). Shoreline armoring affects a number of physical (MacDonald et al. 1994) and biological (Thom and Shreffler 1994) processes in the nearshore, including:
• Loss of beach area, lowering of beach elevations, and steepening of beach profiles;
• Modification of groundwater movement; barriers to groundwater movement into upper beach areas;
• Intensification and deflection of wave energy, increased erosion adjacent to armoring, coarsening of beach substrates, and loss of accumulation areas for organic material due to higher wave energy;
• Loss of riparian vegetation, which provides shade, a source of leaf litter and insects to nearshore food webs, stabilizes shorelines, provides water quality benefits, and wildlife habitat. Shoreline armoring is often associated with the removal of existing riparian vegetation and shoreline reaches with armoring rarely have riparian vegetation present;
• Impoundment of sediment behind structures, loss of sediment sources, and changes in sediment transport patterns;
• Altering the movement of juvenile fish, moving them further offshore in the area of shoreline structures;
• Removal of shade from the upper beach area and increases in heat and moisture stress in beach sediments;
• Change in composition of beach communities from those adapted to sands/gravels (small crustaceans, eelgrass, bivalves) to those typical of hardpan, rock or coarse cobbles (barnacles, seaweeds);
• Change in or loss of freshwater inputs from surface and groundwater, and resulting change in nutrient and organic matter inputs; and
• Elimination or reduction of spawning habitat for forage fish.
Shoreline armoring is concentrated in Hale Passage, Henderson Bay (especially near Glen Harbor), Gig Harbor, Wollochet Bay, Filucy Bay, Colvos Passage, and portions of Case Inlet near Vaughn and Rocky Bays (Pentec 2003). These areas have between 50 to 100 percent of the shoreline below MHHW armored with bulkheads. Scattered areas on Anderson and McNeil Islands are localized areas with shoreline armoring. The railroad embankment adjacent to shore between the Nisqually Delta and Tacoma Narrows Bridge contributes to shoreline armoring and removal of riparian vegetation.
Shore hardening or modifications that include covering the beach and/or backshore with riprap, rockeries, revetments or bulkheads, directly impact the nearshore. The effects of shore armoring on physical and biological processes have been the subject of much concern in the Puget Sound region (for example, PSAT 2003). Macdonald, et al. (1994) completed an extensive series of studies documenting the impacts to the beach and nearshore system caused by shore armoring at a number of site-specific areas. Additional studies on impacts from shoreline armoring showed that in front of a bulkhead, the suspended sediment volume and littoral drift rate all increased substantially compared to an adjacent unarmored shore (Miles et al. 2001).
June 2009 Page 3-31

Pierce County Shoreline Inventory and Characterization Report
A bulkhead constructed near the ordinary high water mark (OHWM) in a moderate energy environment increases the reflectivity of the upper beach to waves substantially, causing backwash (outgoing water after a wave strikes shore) to be more pronounced. Increased backwash velocity removes beach sediment from the intertidal beach, thereby lowering the beach profile (Macdonald et al. 1994). A bulkhead constructed lower on the beach causes more impact. Construction of a bulkhead at or below OHWM results in coarsening of beach sediment in front of the bulkhead (Macdonald et al. 1994, Kraus 1988). Relatively fine-grain size sediment is mobilized by increased turbulence caused by the bulkhead (Miles et al. 2001), and is preferentially transported away, leaving only the coarse material on the beach. This process also leads to the removal of LWD from the upper beachface. Both of these impacts lead to changes in habitat along the armored portion of shore.
A number of local hydraulic impacts often occur in response to a bulkhead. These include the formation of a scour trough (a linear depression) directly in front of the wall probably as a result of increased reflectivity of the wave energy from the wall to the upper beach. Another hydraulic response is the formation of end scour erosion (end effects). This occurs at unprotected shores adjacent to the end of a bulkhead and is caused by wave refraction at the end of the bulkhead (Tait and Griggs 1991). Impacts during storms, where seabed fluidization and scour occur at enhanced levels, may be pronounced in front of a bulkhead, but this process is not well understood.
The groundwater regime is often modified by the construction of a seawall along the base of a bluff (Macdonald et al. 1994). An impermeable bulkhead that extends vertically above OHWM raises the groundwater table. This can cause increased pore pressure in beach sediment, leading to mobilization of beach sediment under lower energy waves, relative to natural unarmored conditions. This effect is most pronounced at locations with fine-grained beach sediment.
Of all the impacts of shore armoring in the Puget Sound area, sediment impoundment is probably the most significant negative impact (PSAT 2003, Pilkey 1988). Structures such as bulkheads, if functioning correctly, lock up bluff material that would otherwise be supplied to the shore drift system. This decreases the quantity of drift sediment available for maintenance of down-drift beaches. The negative impact of sediment impoundment is most pronounced when armoring occurs along a feeder bluff with a high sediment yield such as the southern shore of Fox Island or many of the other high elevation bluffs found throughout the study area (Johannessen et al. 2005, Macdonald et al. 1994). Additionally, cumulative impacts from several long runs of bulkheads pose significant challenges for shoreline management.
As the bluffs in the County continue to gradually recede, there will likely be an increasing desire for homeowners to build bulkheads. Added bulkheads would lead to further sediment impoundment and further reductions in the natural sediment supplied to drift cells and nearshore habitats, and would therefore constitute a significant negative impact. Without this sediment, the beaches would become starved, resulting in a reduction of the beach width (Macdonald et al. 1994). Beaches would also become more coarse-grained (Macdonald et al. 1994) as sand was winnowed out, leaving a higher percentage of gravel. This would likely negatively impact forage fish spawning and other habitat values of County beaches. This could also lead to an increase in coastal flooding and wave-induced erosion of existing low shore armoring structures and homes.
Page 3-32 June 2009

Pierce County Shoreline Inventory and Characterization Report
3.3.2.2 Overwater Structures
Overwater structures including docks, piers, moorings, and marinas are scattered throughout the Pierce County nearshore and primarily affect nearshore processes, species, and habitats by changing light conditions, wave energy, substrate size and type, and water quality (Nightingale and Simenstad 2001). Overwater structures affect the following processes and functions:
• Reduced light levels can affect photosynthesis and therefore growth and reproduction of phytoplankton and benthic vegetation such as eelgrass;
• Changes in plant species composition and abundance affect aquatic food webs, for example, loss of eelgrass also results in a loss of detritus-based food webs and a number of important salmonid prey species;
• Reduced light levels, and particularly sharp boundaries between light and shade, affect fish feeding, predator avoidance, schooling, and migration behaviors;
• Overwater structures can alter wave energy and sediment transport dynamics (e.g., scour areas), changing substrate size and stability, which in turn can affect communities of benthic animals and forage fish spawning;
• The close placement of pilings diminishes wave energy, causing finer sediments to fall out of suspension where they normally would remain in transport. Reduced wave energy associated with pilings can also prevent transport of larger sediments that require higher wave energy for transport;
• Construction of structures can disturb the substrate and increase turbidity;
• Some construction materials (e.g., creosote piles) leach contaminants into the sediments and water column, and marinas may contribute to water quality problems result from boat engine exhaust, sewage discharge, fuel spills, and stormwater runoff from adjacent parking lots;
• Increase in artificial nighttime lighting can attract predators, alter movement and migratory behavior of juvenile fish, including salmonids, and affect reproductive behavior of night-spawning forage fish.
Artificial lighting during the night, from marinas, docks, and buildings or roads adjacent to the shore, can interfere with migration of juvenile fish, including salmonids, and can affect predator-prey interactions (Simenstad et al. 1999, Rich and Longcore 2005). Bright lights at night can be an attractant, potentially exposing juvenile fish to greater levels of predation, and also have the potential to affect spawning behavior of forage fish (Simenstad et al. 1999).
Overwater structures are concentrated in the same general locations as shoreline armoring in Pierce County, being most prevalent in Hale Passage, Gig Harbor and Wollochet Bay, around Raft Island and adjacent areas of Henderson Bay, Burley Lagoon, Vaughn Bay and Rocky Bay (Pentec 2003), as well as at Horsehead Bay, Glen Cove, Mayo Cove, Filucy Bay, Vaughn Bay, Amsterdam Bay and Oro Bay on Anderson Island, and the north shore of Fox Island.
June 2009 Page 3-33

Pierce County Shoreline Inventory and Characterization Report
3.3.2.3 Dredging and Filling
Dredging and filling are primarily conducted to maintain boat access and create channels for mooring and navigation, and to create new upland areas for development. Dredging has the potential to redistribute and resuspend contaminated sediments and is regulated through both Federal and State permits. Dredging results in direct physical disturbance to benthic organisms and loss of habitat, although recolonization may occur within a few years of disturbance (Williams et al. 2001). Temporary impacts from dredging include an increase in turbidity and potential resuspension of contaminants. Some of the same impacts occur as a result of boat scour in areas where propeller wash or high boat traffic disturbs benthic sediments.
Filling also directly impacts upland and wetland habitats adjacent to the shoreline and has been responsible for much of the loss of freshwater and estuarine wetlands in Pierce County, particularly in the Puyallup estuary (Redman et al. 2005). Fill that extends into the intertidal can also result in the loss of nearshore habitats, including forage fish spawning and eelgrass beds through changing elevations, water depths, current patterns, and substrate size and type (Williams et al. 2001).
The largest area of fill in the Pierce County nearshore is associated with Commencement Bay, but smaller areas of fill are associated with concentrated shoreline armoring described above (Pentec 2003). Areas subject to dredging or boat scour are relatively uncommon in Pierce County, being found on the northwest shore of Fox Island, scattered locations on Anderson Island, and in Gig Harbor.
3.3.2.4 Water Quality Alterations - Increased Pathogen/Nutrient Inputs
Increased inputs of pathogens/toxins adversely impact shellfish populations and recreational/commercial harvests. Pollution, thermal stress, and desiccation increase mortality of forage fish on beaches (egg and larval) (Emmett et al. 1991).
Low energy, semi-enclosed habitats with significant inputs from upland areas such as river or stream deltas, and sand and mud flats are particularly vulnerable to alterations that affect water quality. Inputs may be higher in these areas, and excess nutrients, pathogens, and toxins tend to accumulate or have longer residence times in these areas. Particularly during periods of increased water stratification, nutrients or pollutants can increase to levels that impact marine organisms. Because they are sedentary and filter feeders, shellfish are particularly vulnerable to deteriorating water quality and excess nutrients or pollutants. Shellfish contaminated with fecal coliform and/or algal toxins can pose problems for people, as well as for other animals that feed on shellfish.
Water quality has been a concern in several locations within Pierce County over the last decade. A number of nearshore locations throughout the County have reached unacceptable water quality standards over the past several years. South Sound marine waters have been identified as impaired under the Clean Water Act (CWA) Section 303(d) list for DO and fecal coliform bacteria, particularly the waters in Carr Inlet and Henderson Bay, the southeastern portion of Anderson Island, near Wollochet and Chambers Bays, and Gig Harbor. Non-point sources of excess nutrient inputs (primarily nitrite/nitrates and ammonia) include the Puyallup River, and
Page 3-34 June 2009

Pierce County Shoreline Inventory and Characterization Report
Chambers/Clover, Woodard, McAllister, Rocky, Coulter, and Burley Creeks (Albertson et al. 2002). The Puyallup River discharge contributes the largest load of fecal coliforms to the South Sound, while the Nisqually and Puyallup rivers, along with the Deschutes, contribute the bulk of the total suspended solids (TSS) load to the South Sound. Important point sources identified in Albertson et al. (2002) include wastewater treatment facilities on McNeil Island, Tacoma, Chambers Creek, Gig Harbor, and some aquaculture facilities in the South Sound.
Sources of toxins in Pierce County marine waters include contaminated sediments from past industrial or commercial operations along the shoreline and from stormwater runoff that enters the Sound from roadways and other impervious surfaces. Commencement Bay is the largest area of contaminated sediments in the South Sound. Stormwater runoff from the greater Tacoma urban area also contributes toxins to the marine nearshore waters of Pierce County. For example, polycyclic aromatic hydrocarbons (PAHs) entering Thea Foss waterway from stormwater were several orders of magnitude greater than levels in other parts of Puget Sound (Ecology 2005).
3.3.2.5 Loss or Simplification of Estuarine Wetlands
Estuarine wetland habitats have decreased dramatically in the South Sound compared to the extent of wetlands prior to European settlement (Bortelson et al. 1980). The Puyallup Delta estuary in particular has been almost completely altered, with an estimated loss of 98% of intertidal wetland area. Dredging and filling of Commencement Bay, as well as the confinement of the Puyallup River channel within levees, resulted in an almost complete loss of estuarine habitat. Loss of wetland habitats in the Nisqually estuary has not been nearly as dramatic, with only about a 20% to 30% loss of estuarine wetlands. In addition, alterations in the Nisqually Delta are primarily the result of diking to protect agricultural land from tidal influence. Therefore, there are significant opportunities to restore estuarine area and function by removing dikes and restoring tidal influences to the delta.
Pocket estuaries and salt marsh habitat have also been lost and/or altered in Pierce County. An estimated 50% of the pocket estuaries identified in the Carr-Nisqually and South Sound sub-basins (Redman et al. 2005) were classified as not properly functioning for salmonids, due to shoreline armoring, dredging and filling, and loss of tidal connections. For example, roads across streams at the mouth of many pocket estuaries (e.g., Bradley Creek on McNeil Island) partially constrict tidal exchange and alter habitat areas both upstream and downstream of the road crossings. Loss of pocket estuaries affects the quality and quantity of nearshore habitat available to juvenile salmonids for feeding, physiological transition, refuge from predators, and migratory corridors. Loss of estuarine wetlands also affects the performance of sediment retention, nutrient cycling, organic matter production, native plant diversity, and provision of fish and wildlife habitat functions.
3.3.2.6 Marine Riparian Vegetation Alterations
The marine riparian zone is an important area for several nearshore processes, including water quality processes, light energy, sediment processes, and as a source of LWD and organic matter. Removal of riparian vegetation occurs as a result of shoreline armoring, construction of overwater structures, construction of roads or railroads adjacent to the shoreline, and commercial or residential development. Removal of riparian vegetation results in the following process
June 2009 Page 3-35

Pierce County Shoreline Inventory and Characterization Report
alterations and impacts to nearshore functions (Pentilla 2001, Williams et al. 2004, Brennan and Culverwell 2004):
• Loss of sediment retention and bank stabilization functions provided by vegetation (particularly root masses), increased sediment inputs and/or erosion, and higher rates of bank or bluff failure;
• Loss of nutrient cycling and pollutant retention functions and increased nutrient and pollutant inputs to the nearshore;
• Replacement of riparian vegetation with impervious surfaces (e.g., including residential lawns) resulting in increased stormwater runoff, and inputs of pollutants (including metals, pesticides, and fertilizers);
• Loss of wildlife habitat;
• Loss of inputs of LWD and other organic matter (e.g., leaf litter, insects) that are important components of nearshore food webs;
• Increased heat and drying stresses in the upper beach/intertidal area due to loss of riparian shade, decreased suitability for forage fish spawning, changes in beach faunal communities.
Increases in light levels and the associated desiccation and temperature stress are most commonly associated with the removal of riparian vegetation from the shoreline and the loss of shade to the beach from overhanging vegetation (Brennan and Culverwell 2004). The upper limit of many intertidal animals is controlled by temperature and moisture/desiccation stress associated with exposure during low tides. Removal of riparian vegetation can result in a loss of these animals from upper beach areas that are no longer shaded. The success of forage fish spawning and egg survival is also tied to suitable temperature and moisture conditions within sands and gravels in the upper beach – these conditions are negatively affected by higher light levels and reduced shade following removal of riparian vegetation (WDFW 2000).
Areas where riparian vegetation has been removed or is highly altered overlap with many of the same areas affected by shoreline armoring and include both sides of Hale Passage, the upper end of Wollochet Bay, Gig Harbor, scattered locations along Colvos and Dalco Passage north of Gig Harbor, the eastern and western shores of Henderson Bay, the north side of Vaughn Bay, and scattered locations on the east and southern shores of Anderson Island (Pentec 2003).
3.3.3 Freshwater Ecosystem Processes
Freshwater ecosystem processes focus on the movement, partitioning, and storage of water, sediment, nutrients, bacteria, pathogens, and plants within an ecosystem at multiple spatial and temporal scales. This section identifies the areas on the landscape that are most important (on a relative scale) for performing these key processes. These “important areas” (also known as process-intensive areas) are the intrinsic building blocks for ecosystem functioning. Alterations to these important areas are discussed in Sections 3.3.3.1 to 3.3.3.4.
For the purposes of this discussion, processes have been grouped under four broad headings: (1) hydrology, (2) sediment generation and transport, (3) water quality, and (4) organic materials.
Page 3-36 June 2009

Pierce County Shoreline Inventory and Characterization Report
3.3.3.1 Hydrology
Water naturally enters the watersheds of Pierce County through rain, snow, or movement of groundwater. Water moves within a watershed as surface water in rivers and streams, infiltrates and becomes groundwater, or is stored in wetlands, lakes, and floodplains. Hyporheic flow occurs as surface flow becomes shallow subsurface flow, moving down valley through alluvial sediments. Water can also flow in the subsurface as groundwater. Ground and surface waters can interact as surface water infiltrates (recharge), or as groundwater reaches the surface (discharge).
The movement and storage of groundwater within Pierce County is largely a function of the geologic setting. In the upper portions of the County, deposits of relatively impermeable rock limit, but do not eliminate, the potential for groundwater recharge. In the lower, generally western, portions of the County, the thick accumulation of glacial sediments creates a complex hydrogeologic system that includes recharge areas in the upland plain, water bearing layers in coarse deposits, and discharge areas in the margins of alluvial valleys.
Glacial deposits typically include one or more aquifers and aquitards (i.e., low permeability geologic strata that function to restrict groundwater movement). These interspersed permeable and impermeable layers control subsurface water movement from the upland to the lowlands. Water that infiltrates into the ground generally flows downward until impeded by less permeable sediment and then flows laterally to a body of water or to a slope face where it may emerge as springs or seeps on the hillside. A portion of the groundwater, however, will percolate downward through lower-permeability sediment, recharging underlying aquifers. Springs discharge along the steep slopes at the edge of the upland plateaus, primarily from recessional outwash, which overlies the till; Vashon advance outwash, which underlies the Vashon till; and a deeper, pre-Vashon outwash (Jones et al., 1999).
Consumptive use of groundwater is another factor in groundwater processes in this region, especially in the higher populations of the Lower Puyallup River. Almost 7 million gallons of groundwater were withdrawn from the Lower Puyallup valley in 1996, typically from deeper coarse-grained glacial deposits (Jones et al., 1999).
Rain and snowfall that is translated into surface runoff creates the significant surface drainage system that exists within Pierce County. Freshwater flows into the marine nearshore via the mouth of the Puyallup River and Hylebos Creek at Commencement Bay, within the Nisqually Delta, the mouth of Chambers, Minter and Rocky Creeks, and as seeps and smaller tributary streams along coastal bluffs.
The Puyallup, White, and Nisqually rivers are significantly influenced by snowmelt processes in high elevations with a long-duration peak season in May to July of each year, depending on snowpack conditions (Sumioka, 2004). Precipitation as rain and snow occurs throughout the County, with snow fall dominating above 7,000 feet elevation, transition between 7,000 and 2,000 feet elevation, and primarily as rain below 2,000 feet. Rain-on-snow events can produce significant runoff events that often result in the highest annual peak flows. This precipitation results in the development of significant drainage systems that include intermittent and perennial streams; riverine, depressional, and slope wetlands; and lake systems.
June 2009 Page 3-37

Pierce County Shoreline Inventory and Characterization Report
Hydrology Important Areas
Important areas for hydrology focus on how water that enters the watershed via precipitation moves into, through, and out of the system (see Map 11). These areas are broadly grouped into: (1) source areas, (2) storage areas, and (3) infiltration areas.
Key source areas are focused within the eastern portion of Pierce County in the snow- and rain-on-snow dominated zones. Precipitation in this zone provides the basis for much of the aquatic resources of the mainland portion of Pierce County. Hydrologic input to aquatic systems occurs throughout the watershed, but these snow-influenced zones have the potential to release significant volumes of water that support seasonal hydrologic patterns (e.g., snow melt-driven high flows).
As water moves downstream from source areas to generally broader and lower slope alluvial valleys, the potential for storage of water increases. Water storage (in natural systems) is often focused within low-slope floodplains and wetlands that provide the interface between upland and aquatic ecosystems. Stream channel to floodplain connections provide areas where specific ecological functions (e.g., flood flow retention, peak flow reductions, etc.) can occur. Areas identified as important storage areas are shown in purple on Map 11. These areas are focused on the broader alluvial valleys generally west of the Cascade foothills.
Once water enters a storage area, there is potential for recharge to an aquifer. Groundwater recharge is a key ecosystem function that: (1) reduces the amount of surface water flowing in channels, (2) supports groundwater resources, and (3) supports baseflow in streams lower in the system. To approximate areas where groundwater recharge is a key function, infiltration areas are mapped that combine low slope, mapped aquifer recharge areas, and relatively permeable surface deposits. These infiltration areas are hatched on Map 11. Within Pierce County, groundwater recharge areas are focused within floodplain deposits, and in the upland south of Tacoma. This area includes relatively coarse outwash materials that were deposited in the channels that drained large proglacial lakes. This area includes some of the larger lakes in the County, including American, Gravelly, and Spanaway Lakes.
Alterations to Hydrologic Processes in Pierce County
Alterations to hydrologic processes are generally associated with changes in land use and land cover, but also include direct structural changes to streams and wetlands. Consistent with land use patterns, the scale of hydrologic alteration in WRIAs 10, 11, and 12 increases along stream channels with proximity to the Puget Sound shoreline. In WRIA 15, the scale of hydrologic alteration is typically smaller, and is focused in limited areas along major roads, and in the urban area of Gig Harbor. Hydrologic alterations (e.g., dam installations, development in storage areas) in Pierce County are illustrated on Map 12.
The White and Puyallup rivers have experienced large scale alterations that have affected the functioning of these river systems. The course of the White River was substantially altered after a significant channel change occurred in 1906 when the White River moved south to entirely flow into the Puyallup River. This alteration initiated a series of projects intended to manage the size, location, and behavior of the Puyallup River and its tributaries (King County, 1988).
Page 3-38 June 2009

Pierce County Shoreline Inventory and Characterization Report
Between 1908 and 1917, significant relocation, armoring, and diking of the Puyallup River was completed. Much of the work was completed under the auspices of the Inter-County River Improvement District, which was formed as an organization to share costs between King and Pierce Counties to address river issues surrounding the White River’s change of alignment into the Puyallup basin (King County, 1988). The installation of Mud Mountain dam on the White River, finished in 1948, provides flood control and has significantly altered the flow regime of the White River.
The partitioning of precipitation into evapotranspiration, infiltration, surface storage, soil storage, and surface runoff is a key hydrologic process within Pierce County. Under forested conditions at elevations below 2,500 feet, 50% or more of precipitation is evapotranspirated, and 25 to 40% is available for groundwater recharge (Booth et al., 2002). Groundwater recharge is more prevalent within coarser deposits (e.g., alluvium, recessional outwash, advance outwash), as occur in the broad upland plain from Tacoma extending south past American Lake. As land uses shift, so does the partitioning of precipitation. Removal of forest cover significantly reduces evapotranspiration rates, and installation of impervious surface significantly reduces groundwater recharge. The end result of these alterations due to conversion from forest to pasture or urban uses directs more water into stream channels. Stream channels are then forced to adjust their geometry, compromising instream and riparian habitat functioning. This process has been identified throughout the more urbanized basins of Pierce County, including the middle reaches of Clear/Clarks Creek (Pierce County, 2006).
To provide an initial view of the scale of these alterations, land cover data (e.g., NOAA CCAP) are used to map potential alterations. The spatial results of this analysis are shown on Maps 12, 13, and 14.
The most notable pattern evident in these maps is the variable level of alteration between the relatively unaltered eastern half of the County, to the more altered western half. In eastern Pierce County, hydrologic alterations focus on timber harvesting, limited development, and the installation of dams and levees along major stream channels. In the western portion, developed lands and agriculture cover a significant area, and levees are more prevalent along major streams.
Methods for Ranking Hydrologic Processes by Sub-basin
To assess potential changes in hydrologic processes, impervious surface and forest cover data were summarized for hydrologic sub-basins throughout the County. These parameters are thought to generally scale to the level of hydrologic alteration. As levels of impervious surface increase, and forest cover decreases, the amount of rainfall that reaches stream channels also increases, altering in-stream and riparian conditions. Streams are forced to expand to match higher peak flows, resulting in channel erosion and instability. Less water infiltrates into the soil, reducing the amount of water that is available to support baseflows in the summer months. These altered channels typically perform habitat ecosystem functions at a lower level compared to the pre-disturbance condition.
To provide a general idea of the range of conditions throughout Pierce County, results of the impervious surface and forest cover tabulation for each sub-basin are plotted on Figure 3-1.
June 2009 Page 3-39

Pierce County Shoreline Inventory and Characterization Report
Page 3-40 June 2009
Percent forest is calculated without areas that would not naturally have been forest (e.g., open water, native grasslands, etc.).
0
10
20
30
40
50
60
70
80
90
100
0 10 20 30 40
Impervious Area (%)
Fore
st C
over
(%)
50
Figure 3-1. Percent forest versus percent impervious values for each sub-basin within Pierce County. Vertical red line at 4% impervious and horizontal red line is at 65% forest
cover (see text discussion).
These parameters, along with the number of stream-road intersections, was used to develop a relative ranking of the level of alteration to hydrologic processes for each sub-basin. Each sub-basin was assigned a ranking of high, moderate, or low for hydrologic processes relative to the other sub-basins in the County. To create this relative ranking, criteria were set for three parameters: (1) impervious surface cover, (2) forest cover, and (3) number of stream crossings per mile of stream. The number of stream crossings was included to capture the hydrologic and hydraulic routing effects of roads on streams (see for example Grant et al., 2008). As shown in Table 3-3, if these parameters were within a specific range, the sub-basin was assigned a high, medium, or low ranking. For example, a sub-basin with a small percentage of impervious surface (less than 4%), extensive forest cover (greater than 65%), and few road crossings (less than one per mile of stream) would be considered in the low range for alterations to hydrologic processes.

Pierce County Shoreline Inventory and Characterization Report
Table 3-3. Parameters and ranges for assessment of alteration to ecosystem functioning for hydrologic processes
Parameter(s) Low Range Medium Range High Range
Impervious Surface (%)
<4% Impervious AND
<4% Impervious OR
>4% Impervious AND
Forest Cover (%)
>65% Forest AND
>65% Forest OR
<65% Forest AND
Road Crossings (per mile of stream)
<1 road crossings <1 road crossings >1 road crossings
These criteria and scoring were selected to provide a relative ranking, and are based generally on values identified in past studies of ecosystem response to perturbation (e.g., Booth et al., 2002). These values are not intended to indicate hard thresholds in ecosystem response, which likely do not exist.
3.3.3.2 Sediment Generation and Transport
The processes that govern the production, storage, and transport of sediment play a significant role in shaping the morphology and functioning of freshwater ecosystems. Sediment is delivered to channels via overland flow, mass wasting (e.g., landslides, lahars), and channel migration (e.g., eroding the outside of a meander bend) (Stanley et al., 2005). The relative importance of sediment generation and transport pathways is typically a result of the interaction between climate and physical features of the landscape.
The movement of sediment into, through, and out of the freshwater shoreline ecosystem influences the form and functions of shorelines of Pierce County, including: (1) shoreline morphology, (2) hydrologic and hydraulic characteristics, (3) ability of surface and groundwater to interact, and (4) type and extent of aquatic habitat.
Sediment Important Areas
Important areas for sediment delivery and transport processes include: (1) glacier-fed streams, (2) landslide-prone areas, (3) steep slopes with erodible soils, (4) areas directly influenced by volcanic processes, and (5) alluvial river valleys (Map 15). Sediment important areas were relatively limited in scope and were focused in the upper portions of the watershed, and along major river channels.
The glaciers that feed each of the major rivers exert significant influence on sediment dynamics in the County. Glacial movement and freeze-melt cycles result in significant erosion and generation of coarse and fine sediments on the slopes of Mount Rainier. The seasonal snowmelt and melting of the glacier margins also provide the fluvial energy necessary to transport
June 2009 Page 3-41

Pierce County Shoreline Inventory and Characterization Report
sediments downstream toward the mainstems. The presence of Mount Rainier at the head of the mainstem Puyallup and the White and Carbon rivers plays a significant role in the generation of sediment within the Puyallup River watershed. The steep, glaciated hillsides generate significant coarse and fine sediment that is available for downstream transport (Kerwin, 1999). The Puyallup River transports significant sediment to Commencement Bay from glacial sources and yields an estimated 300,000 cubic yards of sediment per year (USGS, 1990). This sediment is primarily sand and finer material at the mouth of the Puyallup River (USGS, 1990).
Lahars from Mount Rainier can also generate significant sediment volumes to the lower alluvial valleys. The USGS has investigated the potential impacts of a significant lahar (mudflow) from Mount Rainier on the major river valleys that drain the mountain. This work suggests that these portions of the County could be influenced by future lahars, since they are within the area historically directly influenced by lahars (e.g., the Osceola and Electron mudflows). The area that is mapped as having the highest frequency of lahars is generally within the National Park. However, significant populations (e.g., Orting) are within the area that could be influenced by lahars with 500 to 1,000 year recurrence intervals. In lower reaches of the White and Puyallup rivers, sedimentation within the stream channels could significantly change flow patterns, increase flooding, and change channel alignments (Hoblitt et al., 1998).
Channel migration in rivers is another important source of sediment within Pierce County (GeoEngineers, 2003). As channels naturally migrate within the alluvial valley, erosion provides sediment to the channel. Channel Migration Zones (CMZs) occur along channels throughout the County, and have been mapped within the alluvial valleys of the Puyallup, Carbon and South Prairie, and Nisqually rivers (Map 15).
Alterations to Sediment Processes in Pierce County
Alterations to sediment generation and transport processes have occurred throughout the Pierce County landscape, resulting in additional sediment loading from areas that had historically produced much smaller quantities of sediment. Land uses throughout the County, including timber harvesting and associated road construction, have generally accelerated production of coarse and fine sediment throughout the watershed. The removal of forest cover increases production of fine sediment as runoff volumes and peak flows are increased. Increased flows increase in-channel erosion and channel destabilization. Further, removal of fine-root biomass increases the potential for mass-wasting, which can deliver coarse and fine sediments to stream channels (Kerwin, 1999). Increases in fine sediment loading can adversely impact aquatic habitat by filling in the interstitial spaces of channel bed gravels and reducing the exchange of water and oxygen between stream flow and the channel bed. Fine sediment can also act as a transport vector for nutrients, metals, and other pollutants.
In-channel sediment dynamics of the Lower Puyallup River have been influenced by mining and river dredging activities. As part of Inter-County River Improvements and private-party mining operations, channel sediments were removed from the Lower Puyallup River until the 1980s. This approach maintained channel capacity. In-channel gravel mining has not occurred since 1997 (GeoEngineers, 2003).
Page 3-42 June 2009

Pierce County Shoreline Inventory and Characterization Report
Alterations to sediment generation and transport processes were spatially estimated using roads intersecting streams, and road density at sub-basin scale (Map 16). These parameters are a very coarse estimate of sediment generation, and will not always be correlated to increased sediment loading. Sediment loading processes from forest roads in the upper watershed are going to be different from processes in urban areas. Past work indicates that localized conditions at the road-to-stream interface can be the controlling factor in sediment production (Luce and Black, 1999). These localized conditions are not possible to consider at the County or sub-basin scale.
Methods for Ranking Alterations to Sediment Processes by Sub-basin
The number of road crossings per mile of stream by sub-basin is shown in Figure 3-2. As stated above, the number of roads intersecting each mile of stream and the road density per square mile provide a coarse estimate of sediment generation. These two parameters were therefore used to derive the relative ranking of sediment processes for each sub-basin. As shown in Table 3-4, if these parameters were within a specific range, the sub-basin was assigned a high, medium, or low ranking for level of alteration. For example, a sub-basin with less than one road crossing per stream mile and less than 56 miles of road per square mile is considered to be in the low range for alteration to sediment processes.
0
2
4
6
8
10
12
14
16
18
20
0-0.5 0.5-1 1-1.5 1.5-2 2-2.5 2.5-3 3-3.5 3.5-4 >4
Number of road crossings per mile of stream, by subbasin
Num
ber
of s
ubba
sins
Figure 3-2. Road crossings per mile of stream, by sub-basin.
June 2009 Page 3-43

Pierce County Shoreline Inventory and Characterization Report
Table 3-4. Parameters and ranges for assessment of alterations to ecosystem functioning for sediment processes
Parameter(s) Low Range Medium Range High Range
Road crossings per mile of stream
<1 crossing/mile AND
<1 crossing/mile OR
>1 crossing/mile AND
Road Density <56 mile road/square mile
<56 mile road/square mile
>56 mile road/square mile
3.3.3.3 Water Quality
The quality of the water flowing through aquatic systems of Pierce County is the end result of the interaction of water with biota, soils, urban and rural land uses, and infrastructure. Ecosystem processes that impact the source, concentration, and transport of mineral and organic constituents are: biotic uptake (e.g., plant growth), decomposition (e.g., plant death), adsorption (e.g., chemical binding), and dissolution (e.g., chemical unbinding). In general, elements cycle between dissolved and particulate forms in water to plants, animals, and soils; and back to the water column via decomposition.
Processes that influence water quality occur over a variety of scales. As water moves through an ecosystem, it has the opportunity to cycle (deposit, uptake, entrain, and/or transport) mineral and organic constituents that can affect water quality. The longer water is able to contact soil and vegetation, the more cycling can occur. Longer water contact times typically occur in low gradient areas in the landscape such as riverine and depressional wetland systems. Water contact time is shorter in areas where rivers have been channelized, and the floodplain filled and paved.
Water Quality Important Areas
Water quality important areas are shown on Map 17, and include streams, floodplains, lakes, wetlands, and riparian areas. These areas provide the longest water contact time and are therefore considered important areas for water quality in Pierce County.
Alterations to Water Quality Processes in Pierce County
Alterations to water quality processes have occurred throughout Pierce County. These alterations span a range of activities, and include point sources (e.g., focused discharge from a wastewater treatment plant), and non-point sources (e.g., diffuse discharge from fields).
Within urban areas of the County, water quality processes have been altered by the installation of impervious surfaces and stormwater conveyance infrastructure, which can bypass natural hydrologic pathways that include infiltration and percolation through soils. Constituents that can negatively impact water quality (e.g., metals, oils and grease, nutrients, bacteria) can build up on impervious surfaces, to be washed off during storm events.
Page 3-44 June 2009

Pierce County Shoreline Inventory and Characterization Report
A series of wastewater treatment plants discharge to the Puyallup River. These discharges have the potential to degrade water quality, particularly during the low flow period at the end of summer and early fall. Water quality within the Puyallup has, at times, not met state water quality standards for ammonia and biochemical oxygen demand (BOD), necessitating the development of a Total Maximum Daily Load (TMDL) (Pelletier, 1994).
Water quality can also be significantly modified by agricultural land uses. The use of fertilizers and pasturing of animals can both result in excess nutrient and pathogen loading to water bodies. The removal of streamside vegetation and installation of above-ground stormwater ponds can increase water temperatures. Water temperature is a key parameter in the level of dissolved oxygen in flowing water, and in bacteria populations and loading.
To broadly assess alterations to water quality ecosystem processes, land uses (e.g., urban and agriculture) from the NOAA CCAP data are mapped, along with Category 5 listings on Ecology’s 303(d) list (Map 18). These listings indicate that water quality within a specific water body does not meet one or more specific state water quality standards. Listing a water body as Category 5 on the 303(d) list means that a clean up plan, including a TMDL, must be developed to identify current sources, limit future sources, and ultimately bring the water body into compliance with water quality standards. Other data are mapped, but were not believed to be representative of existing conditions, and were not used in the assessment. Please note that this mapping does not include the 303(d) sediment listings in the Upper White River watershed.
Methods for Ranking Alterations to Water Quality Processes by Sub-basin
As stated above, the Category 5 listings provide an indication of water quality within sub-basins. Therefore this parameter was used, along with the proportion of land within the sub-basin assumed to be on septic systems, to derive the relative ranking of water quality processes for each sub-basin. Given the uncertainties in the septic system dataset, this parameter was set up as a ‘yes’ or ‘no’ question, with the percentage set at 10 percent. This results in approximately one-third of the sub-basins with significant areas being served by septic systems. As shown in Table 3-5, if these parameters were within a specific range, the sub-basin was assigned a high, medium, or low ranking. For example, a sub-basin with no water bodies on the Category 5 list and less than 10% of the land area assumed to be on septic is considered in the low range for alterations to water quality processes.
Table 3-5. Parameters and ranges for assessment of alteration to ecosystem functioning for water quality processes
Parameter(s) Low Range Medium Range High Range
Includes reach within Category 5 of the 303(d) list
Not listed on 303(d) list
Not listed on 303(d) list
Listed on 303(d) list
AND OR AND % land with assumed on-site septic system
<10% area has septic system
<10% area has septic system
>10% area has septic system
June 2009 Page 3-45

Pierce County Shoreline Inventory and Characterization Report
3.3.3.4 Organic Materials
Large wood or LWD significantly influences the geomorphic form and ecological functioning of riverine ecosystems in the Pacific Northwest (Maser et al., 1988; Nakamura and Swanson, 1993; Collins and Montgomery, 2002; Abbe and Montgomery, 1996; Collins et al., 2002; Montgomery and Bolton et al., 2003; Montgomery and Masson et al., 2003). LWD consists of logs or trees that have fallen into a river or stream. In a natural system, LWD provides organic material to aquatic ecosystems and is considered a principal factor in forming stream structure and associated habitat characteristics (e.g., pools and riffles). Riparian vegetation is the key source of LWD. LWD is primarily delivered to rivers, streams, or wetlands by mass wasting (landslide events that carry trees and vegetation as well as sediment), windthrow (trees, branches, or vegetation blown into a stream or river), or bank erosion (Stanley et al., 2005).
The presence, movement, and storage of LWD influence shoreline functions as follows:
• Delivery of wood and organics affects vegetation and habitat functions such as instream habitat structure (pools and riffles) and species diversity; and
• Riparian vegetation and LWD provide habitat in the form of nesting, perching, and roosting as well as thermal protection, nutrients, and sources of food (terrestrial insects) to a variety of fish and wildlife species.
Investigations into historical conditions in the White River valley and the Nisqually basin areas indicate that LWD, including riparian forests and in-channel wood, was present as a significant structural element of the floodplain and delta ecosystem, prior to the major land use changes of the late 19th and 20th centuries (Collins and Sheikh, 2005, Collins et al., 2002). Urbanization, and the construction of levees and revetments, has reduced the density of LWD in river channels within Pierce County. In areas along established levees, trees are often removed to protect levee stability and function.
Organic Matter Important Areas
Important areas for organic debris inputs to the shoreline (including LWD) generally include riparian areas within 150 to 200 feet of stream channels. Channel migration zones (CMZs) and areas of mass wasting also deliver LWD to streams (Map 19).
Alterations to Organic Matter Processes in Pierce County
Significant land use changes throughout Pierce County have reduced the source and potential contribution of LWD from the riparian area to the channel. Installation of dams in the upper watersheds has broken the transport patterns of wood from the upper to lower reaches. Timber harvesting, agriculture, and development of the alluvial valley have all significantly reduced the abundance and source of LWD as compared to historic conditions.
Construction of levees and other shoreline modifications have limited the availability of riparian cover and LWD recruitment potential. Further, levee maintenance typically results in the removal of trees to protect the structural stability of the levee structure. Dams alter the delivery patterns of LWD to downstream reaches.
Page 3-46 June 2009

Pierce County Shoreline Inventory and Characterization Report
To assess the degree of alteration for organic materials ecosystem processes, NOAA CCAP data were used to calculate the percentage of each sub-basin that is currently in any sort of forest land (e.g., deciduous, evergreen, wetland forest, scrub-shrub). This should include managed forest land where the forest will be harvested periodically. The results from this analysis are shown in Figure 3-3.
The results are distributed from 11% in the Chambers Creek – Leach Creek sub-basin to nearly 100% in sub-basins within Mount Rainier National Park. The majority (37 of 72) of sub-basins had greater than 90% forest. A similar pattern to the previous analyses is shown here, with relatively less forest cover in the vicinity of Tacoma and the Lower Puyallup valley than in the upper portions of the County, and west of the Sound. Several sub-basins were not included in this grouping, as reaches used for the analysis spanned several sub-basins.
0
5
10
15
20
25
30
35
40
0-10 10-20 20-30 30-40 40-50 50-60 60-70 70-80 80-90 90-100
Percent Forest Cover in 10 percent bins
Num
ber
of S
ubba
sins
Figure 3-3. Percent forest within sub-basin, based on CCAP data presented in 10% bins.
Methods for Ranking Alterations to Organic Material Processes by Sub-basin
As stated above, the percent of a sub-basin within forest land provides an indicator of organic material availability. Therefore this parameter was used to derive the relative ranking of alterations to organic material processes for each sub-basin. As shown in Table 3-6, if this parameter was within a specific range, the sub-basin was assigned a high, medium, or low ranking. This analysis has considerable uncertainty, and, similar to the other analyses, is completely dependant on the CCAP data set. Given this uncertainty, the relative scoring was made to capture only broad differences between sub-basins.
June 2009 Page 3-47

Pierce County Shoreline Inventory and Characterization Report
Page 3-48 June 2009
Table 3-6. Parameters and ranges for assessment of alterations to ecosystem functioning for organic material processes
Parameter(s) Low Range Medium Range High Range
% forest in sub-basin
>90% Forest 50 to 90% Forest <50% Forest
3.3.3.5 Summary of Ecosystem Processes by Sub-basin
Table 3-7 provides the tabular data for the parameters discussed above, for each sub-basin in Pierce County. This detailed information will be used to provide an overall assessment of the level of alteration to ecosystem processes in Section 3.3.4.

Pierce County Shoreline Inventory and Characterization Report
Table 3-7. Summary of Parameters by sub-basin
WRIA Total Area (acres)
Total length of stream (miles) % Forest % Impervious
Surface Road density (Road Length/Basin Size)
Number Road crossings
Number Road crossings/ mile of stream
303(d) List?
% with assumed on-site septic
Boise Creek-White River 10 11,176 90 94.52 1.29 3.15 70 1 yes 0 Clarks Creek 10 6,898 30 19.41 28.82 10.55 95 3 yes 32 Clearwater River 10 24,386 150 99.05 0.57 2.80 246 2 yes 0 Fennel Creek-Puyallup River 10 17,264 54 42.79 15.16 5.60 89 2 19 Fiske Creek-Puyallup River 10 17,785 88 74.16 5.34 4.49 103 1 yes 17 Headwaters Puyallup River 10 30,747 382 99.04 0.49 2.66 686 2 0 Headwaters White River 10 39,386 168 99.15 0.32 0.55 26 0 0 Huckleberry Creek 10 23,961 80 99.66 0.28 1.38 29 0 0 Hylebos Creek-Frontal Commencement Bay 10 13,845 46 13.77 39.45 8.94 132 3 yes 4 Kapowsin Creek 10 18,005 123 91.08 1.80 4.38 210 2 8 Kings Creek-Puyallup River 10 22,833 244 98.74 0.67 3.41 372 2 yes 0 Lower Carbon River 10 18,278 78 87.37 2.69 4.86 80 1 7 Lower Greenwater River 10 14,378 82 98.69 0.93 4.93 131 2 yes 0 Lower West Fork White River 10 21,355 89 99.11 0.83 3.93 144 2 0 Middle Carbon River 10 23,558 246 99.74 0.27 2.26 286 1 yes 1 Miller Creek-Frontal East Passage 10 1,429 4 27.93 31.75 12.10 4 1 12 Mowich River 10 27,853 256 99.43 0.27 1.47 155 1 0 Puyallup River - Potholes 10 6,669 3 20.33 31.00 7.61 9 3 52 Puyallup Shaw Road Upper 10 6,375 15 18.21 34.28 10.63 28 2 yes 8 Silver Creek-White River 10 32,605 159 98.90 0.63 2.37 165 1 1 South Prairie Creek - Lower 10 8,567 35 97.15 8.53 5.92 61 2 yes 22 South Prairie Creek - Upper 10 31,066 188 60.09 0.68 3.01 187 1 3 Swan Clear Creeks 10 11,880 64 17.50 24.28 10.62 162 3 yes 35 Twin Creek-White River 10 12,381 121 98.53 0.86 4.58 206 2 0 Upper Carbon River 10 24,985 121 99.92 0.05 0.17 11 0 0 Upper Greenwater River 10 16,061 44 99.93 0.03 0.06 1 0 yes 0 Upper West Fork White River 10 20,985 65 99.95 0.03 0.23 3 0 0 Voight Creek 10 21,539 144 96.57 1.02 4.12 254 2 3 White River 10 25,835 124 37.83 14.05 5.48 127 1 yes 19 Wilkeson Creek 10 18,581 140 94.99 1.48 3.92 125 1 5
Alder Reservoir-Nisqually River 11 7,104 64 89.93 1.89 5.13 130 2 10 Beaver Creek 11 6,958 62 99.42 0.41 3.83 77 1 0 Berg Creek 11 5,747 54 92.99 2.29 4.87 84 2 2 Busy Wild Creek 11 10,204 131 99.13 0.62 5.58 397 3 0 Clear Creek 11 12,886 16 98.19 0.44 6.43 23 1 yes 0 Copper Creek-Nisqually River 11 9,370 109 98.77 0.71 3.04 136 1 3 Headwaters Nisqually River 11 10,093 83 99.38 0.28 1.23 12 0 0
June 2009 Page 3-49

Pierce County Shoreline Inventory and Characterization Report
June 2009 Page 3-51
WRIA Total Area (acres)
Total length of stream (miles) % Forest % Impervious
Surface Road density (Road Length/Basin Size)
Number Road crossings
Number Road crossings/ mile of stream
303(d) List?
% with assumed on-site septic
Horn Creek-Nisqually River 11 9,434 46 87.63 1.78 5.62 60 1 yes 18 Kautz Creek 11 8,598 54 99.97 0.02 0.07 5 0 0 Lacamas Creek 11 10,741 44 63.06 1.53 4.03 73 2 22 Little Mashel River 11 15,426 122 97.41 0.48 4.04 167 1 6 Lynch Creek 11 4,848 61 99.01 0.86 4.89 126 2 0 Mashel River - Lower 11 9,836 80 93.39 2.65 6.54 186 2 4 Mashel River - Upper 11 11,985 185 98.73 1.01 5.31 501 3 yes 0 Murray Creek-Nisqually River 11 15,555 82 65.45 2.43 3.98 77 1 22 Nisqually River-Frontal Puget Sound - upper 11 11,443 27 80.12 7.57 6.20 3 0 1 Nisqually River-Frontal Puget Sound lower 11 7,562 23 76.92 8.61 9.14 27 1 yes 0 Ohop Creek 11 10,530 60 77.58 2.03 5.55 78 1 yes 14 Powell Creek-Nisqually River 11 9,107 54 80.86 1.65 5.24 60 1 11 Reese Creek-Nisqually River 11 12,767 121 98.06 0.79 4.63 153 1 9 Tahoma Creek 11 9,951 109 99.83 0.10 0.49 41 0 0 Tanwax Creek - lower 11 7,039 22 95.96 0.88 6.29 37 2 1 Tanwax Creek - upper 11 10,979 65 76.95 2.31 5.43 113 2 24 Twentyfive Mile Creek 11 6,214 56 98.11 0.77 4.20 91 2 0
Chambers Creek - Leach Creek 12 16,449 21 11.41 43.43 16.14 70 3 yes 0 City of Tacoma-Frontal Commencement Bay 12 14,715 19 11.97 46.30 20.04 100 5 yes 0 Clover Creek - Lower 12 10,645 18 14.15 41.03 14.41 72 4 yes 2 Clover Creek - North Fork 12 4,908 23 19.56 24.09 9.39 56 2 yes 38 Clover Creek - Upper 12 19,454 40 29.69 21.92 6.10 96 2 yes 38 Muck Creek - Lower 12 13,998 26 85.84 1.61 5.67 35 1 3 Muck Creek - Upper 12 13,009 31 50.57 9.17 4.40 56 2 31 South Creek - Lower 12 13,389 81 55.23 3.84 4.80 120 1 33 South Creek - Upper 12 9,809 70 51.65 4.97 4.17 123 2 37 Spanaway Creek 12 13,964 16 50.73 14.70 6.35 40 2 yes 26
Anderson Island 15 12,622 35 78.76 3.51 7.16 102 3 yes 23 Burley Creek-Frontal Carr Inlet 15 18,609 46 67.67 9.99 6.83 130 3 49 Curley Creek-Frontal Colvos Passage 15 9,244 11 66.26 12.43 7.72 35 3 yes 34 Key Peninsula-Frontal Carr Inlet 15 17,477 70 92.79 3.98 6.23 165 2 yes 33 Key Peninsula-Frontal Case Inlet 15 20,473 82 84.15 1.90 5.70 158 2 yes 25 Sequalitchew Creek-Frontal Cormorant Passage 15 26,148 23 53.70 15.76 11.50 52 2 yes 1
Muddy Fork Cowlitz River 26 11,704 80 100.00 0.00 0.00 0 0 Ohanapecosh River 26 28,510 94 99.46 0.27 0.27 11 0 0
*NA indicates that sub-basin-wide percent forest cover was used for the ranking

Pierce County Shoreline Inventory and Characterization Report
3.3.4 Assessment of Freshwater Ecosystem Shoreline Conditions
The ecosystem processes that occur within the freshwater shorelines of Pierce County are all sensitive to alteration. Variation in process controls (e.g., climate fluctuations), the interdependency between each process, and the limited resolution of County-wide data sets make it challenging to assess overall levels of alteration. However, it is important to understand, at least in a relative sense, the level of alteration to the system. It is this understanding that allows for the formulation of management techniques that will preserve, protect, and restore freshwater ecosystem processes within Pierce County.
To provide a first-order assessment of the level of alteration to the freshwater ecosystems within Pierce County, the information in the previous section on the processes within each basin (hydrology, sediment, etc.) was used to provide a high, medium, or low ranking for the level of alteration within each sub-basin (Tables 3-8 to 3-12). In this section, a “high” ranking indicates that ecological functions are highly altered (i.e., a high level of alteration to processes). A “low” ranking indicates less altered processes and a high level of ecosystem function.
Using these relationships to develop relative rankings is a coarse method for assessing ecosystem function for Pierce County at the sub-basin scale. The quality of the analysis is limited by the type and quality of the spatial data, and is complicated by the interdependencies between each process group. Best professional judgment is used for the water quality and organics processes because limited data are available for this assessment.
Table 3-8. WRIA 10 Summary table listing overall assessment of alteration for each group of ecosystem processes
Sub-basin Hydrology Sediment
Generation and Transport
Water Quality Organic Material
Boise Creek-White River low low medium low
Clarks Creek high high high high
Clearwater River medium medium medium low Fennel Creek-Puyallup River high medium medium high Fiske Creek-Puyallup River medium medium high medium Headwaters Puyallup River medium medium low low Headwaters White River low low low low
Huckleberry Creek low low low low Hylebos Creek-Frontal Commencement Bay high high medium high
June 2009 Page 3-53

Pierce County Shoreline Inventory and Characterization Report
Page 3-54 June 2009
Sub-basin Hydrology Sediment
Generation and Transport
Water Quality Organic Material
Kapowsin Creek medium medium low low Kings Creek-Puyallup River medium medium medium low
Lower Carbon River medium medium low medium Lower Greenwater River medium medium medium low Lower West Fork White River medium medium low low Middle Carbon River medium medium medium low Miller Creek-Frontal East Passage medium medium medium high
Mowich River low low low low Puyallup River - Potholes high high medium high Puyallup Shaw Road Upper high high medium high Silver Creek-White River medium medium low low South Prairie Creek - Lower medium medium high low South Prairie Creek - Upper medium low low medium
Swan Clear Creeks high high high high Twin Creek-White River medium medium low low
Upper Carbon River low low low low Upper Greenwater River low low medium low Upper West Fork White River low low low low
Voight Creek medium medium low low
White River high medium high high
Wilkeson Creek low low low low

Pierce County Shoreline Inventory and Characterization Report
Table 3-9. WRIA 11 Summary table listing overall assessment of alteration for each group of ecosystem processes
Sub-basin Hydrology Sediment
Generation and Transport
Water Quality Organic Materials
Alder Reservoir-Nisqually River medium medium medium medium Beaver Creek medium medium low low Berg Creek medium medium low low Busy Wild Creek medium medium low low Clear Creek medium medium medium low Copper Creek-Nisqually River medium medium low low Headwaters Nisqually River low low low low Horn Creek-Nisqually River medium medium high medium Kautz Creek low low low low Lacamas Creek medium medium medium medium Little Mashel River medium medium low low Lynch Creek medium medium low low Mashel River - Lower medium medium low low Mashel River - Upper medium medium medium low Murray Creek-Nisqually River low low medium medium Nisqually River-Frontal Puget Sound - upper medium low low medium Nisqually River-Frontal Puget Sound lower medium high medium medium Ohop Creek medium medium high medium Powell Creek-Nisqually River medium medium medium medium Reese Creek-Nisqually River medium medium low low Tahoma Creek low low low low Tanwax Creek - lower medium medium low low Tanwax Creek - upper medium medium medium medium Twentyfive Mile Creek medium medium low low
June 2009 Page 3-55

Pierce County Shoreline Inventory and Characterization Report
Table 3-10. WRIA 12 Summary table listing overall assessment of alteration for each group of ecosystem processes
Sub-basin Hydrology Sediment
Generation and
Transport
Water Quality
Organic Materials
Chambers Creek - Leach Creek high high medium high City of Tacoma-Frontal Commencement Bay high high medium high Clover Creek - Lower high high medium high Clover Creek - North Fork high high high high Clover Creek - Upper high medium high high Muck Creek - Lower medium medium low medium Muck Creek - Upper high medium medium medium South Creek - Lower medium medium medium medium South Creek - Upper high medium medium medium Spanaway Creek high medium high medium
Table 3-11. WRIA 15 Summary table listing overall assessment of alteration for each group of ecosystem processes
Sub-basin Hydrology Sediment
Generation and
Transport
Water Quality
Organic Materials
Anderson Island medium high high medium Burley Creek-Frontal Carr Inlet medium medium medium medium Curley Creek-Frontal Colvos Passage medium high high medium Key Peninsula-Frontal Carr Inlet medium medium high low Key Peninsula-Frontal Case Inlet medium medium high medium Sequalitchew Creek-Frontal Cormorant Passage high high medium medium
Page 3-56 June 2009
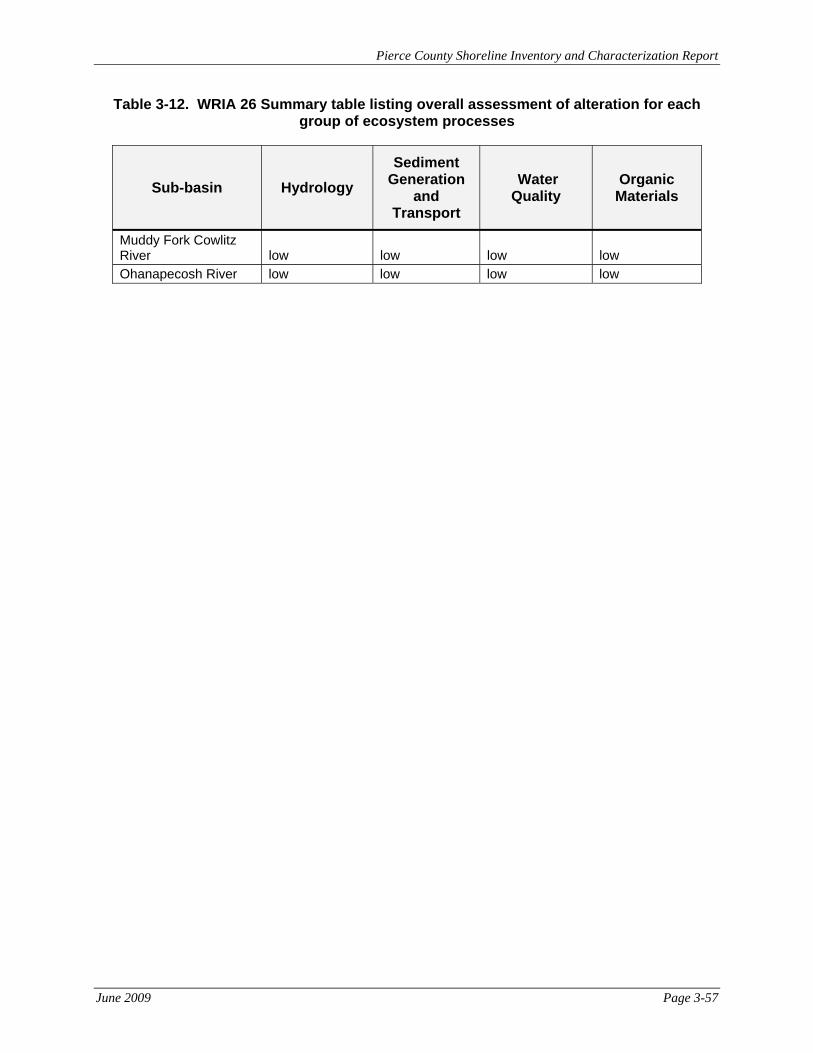
Pierce County Shoreline Inventory and Characterization Report
June 2009 Page 3-57
Table 3-12. WRIA 26 Summary table listing overall assessment of alteration for each group of ecosystem processes
Sub-basin Hydrology Sediment
Generation and
Transport
Water Quality
Organic Materials
Muddy Fork Cowlitz River low low low low Ohanapecosh River low low low low

Pierce County Shoreline Inventory and Characterization Report
CHAPTER 4 PUYALLUP/WHITE RIVER SHORELINE PLANNING AREA (WRIA 10)
4.1 Water Bodies in the Puyallup/White River Shoreline Planning Area
This chapter provides inventory information for the waterbodies in the Puyallup/White River shoreline planning area that meet the jurisdiction of shoreline of the state or shoreline of statewide significance. In total there is one marine shoreline, two rivers, and one freshwater lake considered shorelines of statewide significance. There are 46 streams and 7 lakes meeting the definition of shorelines of the state.
Inventory information in this chapter is presented by waterbody and described at both the waterbody and the reach scale levels for shorelines in the Puyallup/White River shoreline planning area (WRIA 10). Maps illustrating the GIS information available by WRIA and the extent of shoreline reaches are provided in Appendix A. Map 20 illustrates the shoreline inventory areas countywide. Marine shoreline reaches (Map 21) and freshwater reaches (Maps 22 and 23) are shown on additional GIS figures. GIS data sources used are listed in Appendix B. Shoreline reaches within each waterbody type have been established based upon methods outlined in Chapter 2. Data by reach is summarized in tables found in Appendix C. GIS mapping and data available at Pierce County provide for reach-scale maps in WRIA 10. An analysis of shoreline functions for freshwater rivers is provided in Appendix D.
For ease of reference, this chapter describes these water bodies in alphabetical order, as shown in the numbered list below. Following the alphabetical list, Table 4-1 shows the freshwater bodies organized by drainage basin. The drainage basin table provides a cross reference to where each freshwater body is discussed in the chapter text.
4.1.1 Alphabetical Listing of Water Bodies
Marine Shorelines of Statewide Significance –
Mainland Marine – Dash Point/Browns Point (seaward of extreme low tide)
Freshwater Shorelines of Statewide Significance –
1. Puyallup River - (downstream from the point where mean annual flow = 1,000 cfs; upstream is a shoreline of the state)
2. White River - (downstream from the point where mean annual flow = 1,000 cfs; upstream is a shoreline of the state)
3. Lake Tapps - (2,433 acres)
Rivers, Shorelines of the State –
1. Bear Creek 2. Canyon Creek Two 3. Carbon River 4. Cayada Creek
June 2009 Page 4-1

Pierce County Shoreline Inventory and Characterization Report
5. Chenuis Creek 6. Clarks Creek 7. Clearwater River 8. Deer Creek 9. East Fork South Prairie Creek 10. Eleanor Creek 11. Evans Creek 12. Fennel Creek 13. Gale Creek 14. George Creek 15. Goat Creek 16. Greenwater River 17. Huckleberry Creek 18. Hylebos Creek 19. Kapowsin Creek 20. Kings Creek 21. Lost Creek – Greenwater 22. Lost Creek - Huckleberry 23. Maggie Creek 24. Meadow Creek 25. Milky Creek 26. Mowich River 27. Unnamed Tributary, Mowich River 28. Neisson Creek 29. North Puyallup River 30. South Puyallup River 31. Unnamed Tributary, Puyallup River 32. Ohop Creek 33. Page Creek 34. Pinochle Creek 35. Rushingwater Creek 36. Saint Andrews Creek 37. Silver Creek 38. South Prairie Creek 39. S. Fork South Prairie Creek 40. E. Fork South Prairie Creek 41. Tolmie Creek 42. Twentyeight Mile Creek 43. Viola Creek 44. Voight Creek 45. West Fork White River 46. Wilkeson Creek
Lakes, Shorelines of the State –
1. Echo Lake 2. Kapowsin Lake
Page 4-2 June 2009

Pierce County Shoreline Inventory and Characterization Report
3. Leaky Lake 4. Morgan Lake 5. Printz Basin 6. Mud Mountain Lake 7. Rhode Lake
4.1.2 Listing of Freshwater Bodies by Drainage Basin
Table 4-1 lists the freshwater bodies within shoreline jurisdiction by drainage basin. The first column lists the basin name, the second column the main stream (river) in that basin. The third column lists the tributaries that flow into the river (e.g., Fennel Creek is a tributary of the Puyallup River). The last column lists any small streams or lakes that drain to the tributaries (e.g., Rhodes Lake drains to Fennel Creek).
Table 4-1. WRIA 10 Freshwater Bodies by Drainage Basin
Basin Main Stream Tributaries to Main Stream
SmallerStreams/Lakes
Feeding into Tributaries
Hylebos Creek Basin
Clear/Clarks Creek Basin
Mid Puyallup River Basin
Upper Puyallup River Basin
Hylebos Creek
Clarks Creek
Mid Puyallup River Fennel Creek Rhodes Lake
White River
Carbon River
Upper Puyallup River
Kapowsin Creek Kapowsin Lake
Ohop Creek
Morgan Lake
Kings Creek
Unnamed Tributary
Neisson Creek
Mowich River Rushingwater Creek
June 2009 Page 4-3

Pierce County Shoreline Inventory and Characterization Report
Page 4-4 June 2009
Basin Main Stream Tributaries to Main Stream
SmallerStreams/Lakes
Feeding into Tributaries
Meadow Creek
Deer Creek
North Puyallup River
South Puyallup River Saint Andrews Creek
Unnamed Tributary
Lower White River Basin
White River Lake Tapps Printz Basin
Leaky Lake
Mud Mountain Basin
White River
Upper White River Basin
White River Mud Mountain Lake
Canyon Creek Two
Clearwater River Milky Creek
West Fork White River Pinochle Creek
Viola Creek
Huckleberry Creek Eleanor Creek
Lost Creek
Silver Creek Goat Creek
Greenwater River Twenty-eight Mile Creek
George Creek
Lost Creek
Maggie Creek
Echo Lake
South Prairie Creek Basin
South Prairie Creek Wilkeson Creek Gale Creek
Page Creek

Pierce County Shoreline Inventory and Characterization Report
June 2009 Page 4-5
Basin Main Stream Tributaries to Main Stream
SmallerStreams/Lakes
Feeding into Tributaries
Lower Carbon River Basin
Upper Carbon River Basin
East Fork South Prairie Creek
South Fork South Prairie Creek
Carbon River Voight Creek Bear Creek
Carbon River South Prairie Creek
Evans Creek
Tolmie Creek
Chenuis Creek
Cayada Creek
4.2 Marine Shorelines of Statewide Significance
4.2.1 Dash Point / Browns Point
Marine shoreline areas in the Dash Point/Browns Point area are identified as shorelines of statewide significance only below the extreme low tide line. While intertidal areas and adjacent uplands within SMA jurisdiction are not shorelines of statewide significance, all shoreline areas in Dash Point/Browns Point are discussed together here.
4.2.1.1 Physical and Biological Characterization
Drainage Basin, Tributary Streams and Associated Wetlands
Dash Point and Browns Point are headlands in Puget Sound, which form the northeastern side of Commencement Bay in the City of Tacoma (Map 21). This area lies west of Federal Way and north and west of the City of Tacoma. These headlands lie in drainage basins where water flows from uphill areas to the marine, nearshore environment. The Dash Point and Browns Point drains either directly to Commencement Bay or north to Caledonia Creek. The Dash Point/Browns Point marine shoreline is mapped as 3.21 miles long.

Pierce County Shoreline Inventory and Characterization Report
There are no mapped wetlands in the Dash Point/Browns Point area of the County’s marine shoreline planning area. Most of the estuarine habitat provided in the marine shoreline is un-vegetated mudflat, sandy beach or rocky shore, which are not considered wetlands by definition.
Beach, Backshore and Drift Cells
The Dash Point marine management area extends from the Pierce/King County border, located just under a mile east of Dash Point, south around Browns Point to northwest of the Hylebos Waterway, the northernmost finger of Commencement Bay.
The character of the Dash Point marine management area is generally comprised of a mix of low-moderate bank shores with mixed sand and gravel beaches, with some higher bluff areas located just south of Dash Point and southeast of Browns Point near the southern end of the management area. The Caledonia Creek estuary delivers fluvially-derived sediment to the nearshore, enabling broader intertidal and backshore areas to form on the adjacent shores. DNR classifies these shores as semi-protected (DNR 2001a), with relatively low (on the order of 7 miles) exposure to both the north and south. Four drift cells are located within the management area (see table below). Two cells converge and form the prograding cuspate foreland at Dash Point, and another two cells converge at Browns Point. Littoral sediment from down-drift bluffs feed and sustain these accretion shoreforms and the numerous habitats found therein.
Table 4-2. Feeder Bluff Data for Browns Point (Pentec 2003)
SMP Reach Name Feeder Bluffs # Drift Cells Drift Cell Names
Browns Point estimated from SZ data ~21% 4 PI-1-3, PI-1-2, PI-1-4, PI-1-1
Critical or Priority Habitat and Species Use
Several species listed under the ESA are known to occur or could potentially occur within the marine nearshore areas of Commencement Bay and Puget Sound in the Browns Point/Dash Point area. Federally listed species that have been documented within the shoreline jurisdiction include Puget Sound Evolutionarily Significant Unit (ESU) Chinook salmon and Coastal/Puget Sound Distinct Population Segment (DPS) bull trout. In August of 2005, NOAA Fisheries designated “critical habitat” for Puget Sound ESU Chinook salmon including the entire reaches of Puyallup River and Hylebos Creek as well as the marine nearshore areas (NOAA Fisheries, 2005a). In September of 2005, the U.S. Fish and Wildlife Service designated “critical habitat” for the Coastal/Puget Sound bull trout. The entire lengths of the Puyallup River and the marine shoreline were designated as critical habitat for bull trout (Federal Register, Vol. 69, No. 122).
The Southern Resident Population killer whale and Steller sea lion also have the potential to occur within this marine area. Killer whales have been periodically sighted in the Commencement Bay area. Critical habitat has been proposed for killer whale (orca), which includes all Puget Sound marine waters deeper than 20 feet or 6.1 meters (Federal Register, 2006b). No critical habitat for Steller sea lion has been designated in the Puget Sound.
Page 4-6 June 2009

Pierce County Shoreline Inventory and Characterization Report
In 2006, NOAA Fisheries also proposed federal listing of the Puget Sound ESU steelhead. Steelhead occur along the shoreline in the vicinity of Commencement Bay. A final decision regarding the listing of Puget Sound ESU steelhead is expected in 2007.
Bald eagle, although known to be present in the vicinity of Dash Point State Park, has been de-listed by the federal government. Bald eagle and eagle nests continue to be protected under Washington state law.
Priority habitats and species within the Browns Point/Dash Point area include designated Urban Natural Open Space, Chinook salmon, chum salmon, pink salmon, sockeye, steelhead, bald eagle, purple martin, and harbor seal/California sea lion haulouts. Patchy eelgrass (see Map 24) is found along the intertidal areas, along with habitat for forage fish such as sand lance and smelt (GeoEngineers 2004).
Shellfish
Documented shellfish resources in WRIA 10 include Dungeness crab, prevalent throughout Commencement Bay, and geoduck clams, documented to the north of Browns Point (WDFW Marine Resource Species, 2006). Washington Department of Natural Resources’ Nearshore Habitat Program has been monitoring intertidal biological communities in south and central Puget Sound since 1997, and has sampled three sites near Browns Point as part of its overall effort (DNR, 2002). Shellfish discovered include macoma clams, clams (Protothaca staminea), butter clams (Saxidomus giganteus), gaper clams (Tresus capax), soft shell clams (Mya arenaria), rock oysters (Pododesmus cepio), blue mussels (Mytilus trossulus), black-clawed crab (Lophopanopeus bellus bellus), green shore crab (Hemigrapsus oregonensis), hermit crab (Pagurus spp.), chiton (Mopalia lignose and Tonicella lineate), and numerous gastropods.
Commencement Bay is part of WDFW’s Marine Catch Area (MCA) 11, which includes the waters north of the Tacoma Narrows Bridge and south of a line that extends from Point Southward to Brace Point. The recreational harvest of Dungeness crab in MCA 11 was 54,575 pounds during the 2004-2005 season and 37,465 pounds during the 2005-2006 season (Cain, personal communication, 2006, as cited in Adolfson, 2006a). Commercial and recreational shellfish growing areas are based upon data from WDOH for 2007 (Map 25).
WDOH has closed Commencement Bay – encompassing all marine shorelines of WRIA 10, from north of Dash Point to Ruston – to shellfish harvesting due to a combination of marine biotoxins and pollution. The closure includes all of Commencement Bay and extends slightly westward of the Bay’s waters. WDOH conducts an ongoing assessment of pollution and conditions related to shellfish harvesting. The update in March 2006 maintained the closure of Commencement Bay to shellfish harvesting (DOH, 2007).
4.2.1.2 Shoreline Use Patterns
Existing Land and Shoreline Use
Land use near the Dash Point/Browns Point shoreline area is dominated by moderate density single family residential (Residential 4 to R6), with all buildable parcels developed with primary residential structures and associated outbuildings (garages and beach front structures). Existing
June 2009 Page 4-7

Pierce County Shoreline Inventory and Characterization Report
land use patterns (Map 26) and future land uses (Map 27) are illustrated on countywide GIS maps in Appendix A.
Shoreline Modifications
Shoreline modifications associated with residential and parkland uses are prevalent in the Dash Point/Browns Point shoreline area (see table below). Analysis of 2006 aerial photography shows that the majority of residences have concrete bulkheads along the marine shore. Many of the residential parcels have developed the area immediately landward of their respective bulkheads with accessory structures and garages. Residential homes on pilings are also found on the beach. Docks and abandoned pilings are present.
Table 4-3. Shoreline Modification Data for Browns Point (Pentec 2003).
SMP Reach Riparian Shorezone MOD%
Modifications MHW
Modifications MSL
Browns Point estimate from SZ data ~12% 80% No data No data
Shoreline Environment Designations, Zoning, and Other Applicable Regulations
The current Shoreline Environment Designation of the Dash Point/Browns Point shoreline is Urban, except Browns Point County Park is designated Shoreline Conservancy Environment (Map 28). The Pierce County Comprehensive Plan identifies the entire Dash Point/Browns Point area along the shoreline as a Moderate Density Single Family (MSF) land use designation, with an implementing zone of MSF. The predominant use allowed in this designation and zone is single family residential development at a density of 4-6 dwelling units per acre.
Existing and Potential Public Access Areas
There are two parks that provide public access to the Dash Point shoreline: Browns Point Lighthouse Park and Dash Point Park. Existing amenities at Browns Point Lighthouse Park, owned and operated by the City of Tacoma, include picnic areas and restroom facilities. Dash Point Park is also owned and operated by the City of Tacoma, and includes picnic areas and restroom facilities. Both parks provide beach access, fishing and open space. A fishing pier is located at Dash Point Park.
Historic and Cultural Resources
Dash Point/Browns Point lies within the reservation lands of the Puyallup Tribe. No cultural resources are inventoried within the Dash Point/Browns Point area. However seasonal activity, including gathering of shellfish and use of seasonal camps by the Puyallup Tribe, could have occurred in the area, and as such there is some potential for the presence of cultural resources.
Page 4-8 June 2009

Pierce County Shoreline Inventory and Characterization Report
There are a series of historical structures within the Dash Point/Browns Point area that are registered on the National Registry of Historic Places including Browns Point Lighthouse, Keepers Cottage, a boat house, a pump house, and an oil house. Browns Point Lighthouse was first constructed in 1887, although the existing structure seen today was built in 1933. The lighthouse was automated in 1963.
Areas of Special Interest
According to Ecology guidelines, areas of special interest to be inventoried include priority habitats, eroding shorelines, developing or redeveloping harbors or waterfronts, dredge disposal sites, and toxic or hazardous waste clean-up sites (WAC 173-26-201(3)(c)(iv)). Priority habitats are discussed above in Section 4.2.1.1. Eroding shorelines are described in the context of regulated geological hazard areas above. Other elements are described below.
This shoreline has not been specifically designated by the City of Tacoma as a rapidly developing harbor or waterfront. The Department of Ecology maintains a statewide GIS database of facilities with suspected or confirmed contaminants. The database was reviewed to identify any know sites within 200 feet of the marine shoreline area. No suspected or confirmed contaminated or hazardous waste sites are identified by Ecology in this reach (Appendix C).
4.2.1.3 Reach Scale Assessment
The marine nearshore of WRIA 10 has one (1) reach including both Dash Point and Browns Point within unincorporated Pierce County. This reach lies within the urban growth boundary of the City of Tacoma. The reach name is DP_01 and is 3.21 miles long.
4.2.1.4 Restoration Opportunities
The City of Tacoma is currently identifying nearshore restoration opportunities within Commencement Bay along with partners, Citizens for Healthy Bay, Tahoma Audubon Society, Port of Seattle, the Puyallup Tribe, and others. Tacoma has summarized restoration opportunities for the bay in its recent Draft City of Tacoma Shoreline Restoration Plan (ESA Adolfson, November 2008). Partnering with the City of Tacoma and other stakeholders will be important for restoration opportunities within the Browns Point/Dash Point shorelines in Pierce County jurisdiction.
Restoration in the nearshore marine environment of Commencement Bay has occurred over the past 15 to 20 years through the remediation efforts under the Commencement Bay Natural Resource Damage Assessment (CB/NRDA) program. These efforts are part of the implementation of the Commencement Bay Conceptual Restoration Plan (June 1997), which details the restoration components outlined in the preferred alternative – the Integrated Approach – as described in the programmatic Environmental Impact Statement (EIS) prepared for the Commencement Bay cleanup plan.
Restoration opportunities for Browns Point/Dash Point nearshore shoreline include: 1) remove intertidal fill, contaminated sediments, creosote contaminated logs, pilings and debris; 2) bulkhead removal or softening; 3) restoration of stream estuaries; and 4) riparian enhancement to improve large woody debris (LWD) recruitment and habitat conditions.
June 2009 Page 4-9

Pierce County Shoreline Inventory and Characterization Report
4.3 Freshwater Shorelines of Statewide Significance
4.3.1 Puyallup River
The Puyallup River is a Shoreline of Statewide Significance (Map 22) downstream from the point where the mean annual flow reaches 1,000 cubic feet per second. Upstream of this point, the river is a Shoreline of the State; however the entire river length is discussed here.
4.3.1.1 Physical and Biological Characterization
Processes and Channel Modifications
Lower Puyallup River
Major process and channel modifications exist throughout the Upper and Lower Puyallup River basins (2002 upper, 1998 lower). Broad categories of modification include:
• Land conversion from forest to harvested forest, pasture, or urban;
• Installation of levees and revetments;
• Channel avulsion of the White River into the Puyallup River, potentially doubling flow and sediment load in the Lower Puyallup (Kerwin, 1999a, King County, 2006);
• Relocation of the main channel, resulting in an approximately 15% reduction in channel length between the mouth and confluence with the White River (Kerwin, 1999a);
• Historical in-channel sediment removal;
• Installation of the Mud Mountain Dam on the White River in 1942, which changed the timing and volume of flows;
• Decreasing low flows in the Lower Puyallup over time (Marks et al, 2008); and
• Discharges from wastewater treatment plants (Pelletier, 1994).
The degree of modification generally increases with distance downstream. The mouth of the Puyallup at Commencement Bay is markedly different than it was 150 years ago. An estimated 97 % of the wetlands and streams that had existed in the Puyallup delta have been filled (Corps, 1980). The Puyallup River flows through a highly modified straight channel through industrial lands.
The remainder of the Lower Puyallup flows through leveed agricultural and urban lands upstream of Tacoma to the confluence with the Carbon River at Orting. Installation of levees has resulted in modified hydrology, water quality, habitat, and organic processes. High flows that had engaged a broad floodplain through riparian and floodplain forests now are trapped within a hardened channel cross-section typically dominated by non-native invasive weed species. In addition, over the past 20 years, there has been a documented trend of decreasing low flows in the Puyallup (Sumoika 2004).
The lack of connection to the floodplain, coupled with significant coarse sediment loading from the White and Carbon rivers, has resulted in overall channel aggradation in portions of the Lower
Page 4-10 June 2009

Pierce County Shoreline Inventory and Characterization Report
Puyallup. This process had historically been offset by in-channel gravel removal. Gravel removal has not been allowed since 1997, so the channel capacity within the levees will be reduced over time (GeoEngineers, 2003). Floodplain management issues within the Lower Puyallup valley are currently being investigated by Pierce County as part of the Lower Puyallup River Flood Protection Investigation.
Upper Puyallup River
Key modifications include:
• Land cover conversion from forest to harvested forest, pasture, or urban land uses;
• Installation of the Mud Mountain Dam on the White River in 1942, which changed the timing and volume of flows;
• Installation of the Electron Dam on the Puyallup River in 1904, which changed the timing of flows; and
• Increased demands on groundwater, which have reduced summer low flows within the Puyallup (Kerwin, 1999a).
Drainage Basin, Tributary Streams and Associated Wetlands
The Puyallup River begins at glaciers (North Mowich, South Mowich, Edmunds, Puyallup, and Tahoma glaciers) on the west and northwest slopes of Mount Rainier and flows north and west into Puget Sound at Commencement Bay in Tacoma, Washington. The Puyallup River watershed comprises 438 square miles. The Puyallup River flows westward for over 54 miles from Mount Rainier to Commencement Bay (Berger and Williamson 2005). The Puyallup-White River watershed drains approximately 1,300 river miles (RM) over about 670,000 acres and receives an average of 65 inches of rainfall per year. The upper portion of the watershed is located in the Cascades ecoregion and the lower portion of the watershed is in the Puget Lowlands.
Tributary drainages of the Puyallup River include: the White River; the Carbon River; and South Prairie Creek. Identified tributaries of the Puyallup River include: Fennel Creek; Kapowsin Creek Drainage; Kings Creek; Deer Creek; Neisson Creek; Mowich River Drainage; North Puyallup River; Saint Andrews Creek; South Puyallup River; and an Unnamed Tributary of the Puyallup River. The Carbon River enters the Puyallup River northwest of Orting, at RM 10.3, and the White River enters the Puyallup River along the west side of Sumner at RM 17.8.
Approximately 368 acres of wetland are mapped in the Puyallup River shoreline planning area downstream of Fox Creek (the lower eight reaches of the river). These wetlands constitute approximately 8 percent of the shoreline planning area along this lower portion of the river. No mapped wetlands are present in the shoreline planning area upstream of approximately the Fox Creek confluence.
Several large wetlands are present in agricultural and forested areas within the floodplain of the Lower Puyallup River. These wetlands are located along Clear Creek and its tributaries. The
June 2009 Page 4-11

Pierce County Shoreline Inventory and Characterization Report
wetland at the confluence of Squally Creek and Clear Creek is noted as a large, complex wetland system providing a variety of habitat types (Pierce County, 2006a).
Upstream of the SR 512 crossing, there are scattered riparian wetlands along the river. Several large wetlands are mapped in portions of the river floodplain, such as near Alderton, Canyonfalls Creek, Orting, Fiske Creek, and Fox Creek.
Wetland restoration efforts are underway along portions of the Puyallup River in the vicinity of the shoreline planning areas. For example, the Sha Dadx restoration site is located on the north side of the river just upstream of the Clear Creek confluence. The Sha Dadx site contains existing wetlands and a meander section of the former channel of the Puyallup River that was abandoned when levees were constructed. Planned restoration of this area includes creation of off-channel habitat for juvenile salmonids (Ridolfi, 2007).
Geologic Hazards
The Puyallup River traverses alpine glacial deposits, lahar deposits, Quaternary alluvium, landslide deposits, and discrete areas of volcanic rock. Hazards identified along the Puyallup River include seismic, flood, volcanic, and landslide. Areas with steep slopes and erosion potential are also identified.
In the lower reaches, the valley floor of the Puyallup River consists of younger alluvium overlying mudflow deposits from eruptions of Mount Rainier, and the steeply sloping valley sidewalls expose continental glacial soils. Southeast of Orting, the Puyallup River has exposed localized areas of intrusive and extrusive igneous rock along the river valley sidewalls below continental glacial soils. The old glacial outwash channel margin crosses the Puyallup River in the area of the electron reservoir, east of Kapowsin Lake. Southeast of the old glacial outwash channel margin, the Puyallup River exposes alpine glacial drift and sedimentary rock. East of the confluence with the Mowich River, the geology is dominated by volcanic-derived rock.
Flood Hazards
Lower Puyallup River
Flood Hazards within the Lower Puyallup are focused along the mainstem of the river, and along major tributaries such as Clarks Creek. FEMA and Pierce County floodplain zones are shown in Pierce County GIS data layers. These estimates of flood inundation have recently been revised to show a significantly wider one percent chance area (i.e., 100-year floodplain) upstream of the City of Tacoma (FEMA). The increase in area is due in large part to the lack of freeboard (i.e., a depth above the predicted flood elevation that provides a factor of safety) provided by the existing levees along the Puyallup and the flooding that can result if they were overtopped or breached. Therefore, updated mapping was performed under the assumption that no levees exist along the banks. These maps are preliminary, pending final approval and distribution by FEMA. The Corps of Engineers has flood facility jurisdiction on the Puyallup from RM 3.0 to the mouth. Pierce County has flood jurisdiction from RM 3.0 to 27.
Pierce County is currently undertaking a feasibility study to develop and analyze alternatives to address potential flooding in the Lower Puyallup valley. This study is currently under review.
Page 4-12 June 2009

Pierce County Shoreline Inventory and Characterization Report
Upper Puyallup River
Flood hazards exist along stream channels in the mainstem Puyallup and its tributaries. The FEMA floodplain is illustrated on the online mapping tool. Notable floodplain areas in the Upper Puyallup include the broad floodplain upstream of the confluence with the Carbon River near Orting.
Flooding in this area could also occur associated with a lahar from the slopes of Mount Rainier. Small to moderate lahars have the potential to follow the river courses. The flowing lahar materials have the potential to displace water into the overbank area. The inundation area is anticipated to be similar to the FEMA floodplain, but the occurrence would not be tied to the snowmelt period or to significant rainfall.
In general, the resolution of flood mapping reduces with distance upstream, especially in the smaller tributary streams. Site-specific investigation would be necessary to better establish flooding regimes in the upper watershed.
Critical or Priority Habitat and Species Use
The Puyallup River supports spring and fall Chinook, sockeye, bull trout/Dolly Varden, coho, fall chum, pink salmon, coastal cutthroat trout, and winter steelhead. Fish distribution maps (WDFW, 2007b) indicate that the Puyallup River provides rearing habitat for spring Chinook between Puget Sound and Sumner. Sockeye are documented as occurring in the Puyallup River from Puget Sound to Sumner, and bull trout/Dolly Varden are documented as occurring throughout the Puyallup River. The Puyallup River provides spawning and rearing habitat for coho, pink salmon, and winter steelhead. Fall chum have a documented presence within the Puyallup River from the Puget Sound upstream to the junction with Kapowsin Creek (WDFW, 2007b). The Puyallup River provides rearing habitat for fall Chinook. Critical habitat for these species is discussed below.
Critical habitat for the Puget Sound DPS steelhead has not yet been designated. The Puget Sound/Strait of Georgia ESU coho salmon is a species of concern, and therefore, does not have critical habitat designated. Puget Sound ESU Chinook salmon and bull trout have critical habitat designated within the Puyallup River (Federal Register, 2005a; 2005b). The even and odd year ESU pink salmon do not have ESA critical habitat (NOAA, 2007). The Puget Sound/Strait of Georgia ESU chum salmon does not warrant an ESA listing and therefore, does not have critical habitat (NOAA Northwest Region, 2007).
In 1999, the Puyallup Tribe and WDFW created a joint fall Chinook recovery plan in order to maintain natural fall Chinook production while evaluating system production potential and current stock status (Berger et al., 2005).
June 2009 Page 4-13

Pierce County Shoreline Inventory and Characterization Report
There are multiple priority habitats associated with the Puyallup River. These habitats are listed below (WDFW, 2007a):
• Small and large waterfowl concentration areas;
• Urban natural open space, including candidate open space areas, Carbon River open space areas, Puyallup steep slopes, and Puyallup parks;
• Lower Puyallup riparian zones;
• Lower Puyallup River valley wetlands;
• Infirmary Creek wetlands, a vast wetland complex;
• Little Puyallup riparian zone habitat;
• Carbon River riparian zone habitat;
• Upper Puyallup River wetlands;
• White River elk range;
• Kapowsin Creek riparian habitat; and
• Historical observation of breeding harlequin ducks near the Electron Dam.
In addition, two bald eagle nests have been recorded approximately 4,000 feet west of the river, and great blue heron and northern goshawk sites have been recorded along the river.
Instream and Riparian Habitats
Historic riparian conditions along the Puyallup River were characterized by dynamic floodplain habitat associated with the formation and destruction of off-channel habitat and oxbows along with accumulations of LWD. In contrast, less than 5% of the Lower Puyallup River mainstem (Commencement Bay to Puget Sound Energy’s [PSE] Electron powerhouse about RM 31) currently contains high quality riparian habitat and what little is present is only in small segments separated by over one mile (Kerwin 1999a). The Lower Puyallup River mainstem is currently confined by levees, lacks habitat complexity, and provides an insufficient gravel substrate for spawning salmon in many areas. Riparian vegetation is generally a combination of black cottonwood and willow species, and is generally confined to a narrow band.
Upstream from PSE’s powerhouse, the Upper Puyallup River mainstem flows through a deep, narrow canyon dominated by Douglas-fir and western hemlock plantation forest (Marks et al. 2005). Current regulations for levees in Pierce County allow for the removal of any vegetation in excess of six inches diameter at breast height (dbh), restricting LWD recruitment and opportunities for shade cover in affected areas (Kerwin 1999a). In 1999, a levee setback project in the town of Orting (near RM 23) added over 100 acres of floodplain habitat along this reach. Several side channels have since formed in the area and spawning gravel has been accumulating to provide salmonid habitat (Marks et al. 2005). Off-channel habitats have been constructed within the lower reaches of the Puyallup River and include the Gog-le-hi-te wetland complex and the Puyallup River Side Channel habitat. These areas provide habitat primarily for rearing juvenile salmonids.
Page 4-14 June 2009

Pierce County Shoreline Inventory and Characterization Report
Channelization, levee installation, dredging, and urbanization along the Puyallup River have impacted riparian and instream habitat quality and functions. The construction of levees and revetments and the maintenance thereof has resulted in a loss of riparian vegetation and a reduction in LWD recruitment in some reaches. Channelization and levees result in increased water velocity, streambank scouring, and high bedload (sediment) transport. This also relates to a reduction in both pool habitat and side channels used by salmonids (Kerwin 1999a).
Water Quality
According to the 2004 Washington State Water Quality Assessment (Ecology, 2004b), the Puyallup River has two 303(d) listings (Category 5 listings) for impaired water quality: fecal coliform and mercury. In addition, the river has one Category 4C listing for instream flow; six Category 2 listings: copper, dissolved oxygen, lead, mercury, temperature, and turbidity; and thirteen Category 1 listings: ammonia-N, arsenic, cadmium, chromium, copper, dissolved oxygen, fecal coliform, lead, mercury, nickel, pH, temperature, and zinc (Ecology, 2004b).
The Clean Water Act Section 305(b) Report published by Ecology in 1992 indicated that the Puyallup River, along with the White River and Hylebos Creek, had water quality impairments due to high fecal coliform counts. One of the sources for this water quality impairment was discharge by municipalities and industries (Ecology, et al., 1995b). There are a total of 44 individual NPDES permits that discharge to the watershed, and in addition to these, there are 28 general permits that allow discharge to surface water within the larger watershed. Additional sources of impairment listed in the report include pasture and animal-management areas, manure lagoons and channelization (, et al., 1995b).
In 2006, the Department of Ecology released a Quality Assurance Project Plan, which describes the technical study that will develop fecal coliform bacteria TMDLs for the Puyallup River and its tributaries. The potential sources of fecal coliform bacteria identified in the 2006 Project Plan are similar to those identified in the 1992 report. The Puyallup River serves as a receiving water for three municipal wastewater treatment plants. In addition, wildlife and background sources serve to increase fecal coliform levels. Nonpoint sources including range and pastured livestock with access to streams and stormwater also contribute to elevated bacteria levels (Ecology, 2006a).
Ecology produced a TMDL for biochemical oxygen demand (BOD) and ammonia in the Puyallup River in 1993, amended in 1994 (Pelletier, 1993; Pelletier, 1994). USEPA accepted the Lower Puyallup River TMDL in 1994. The intent of the TMDL was to address low levels of dissolved oxygen (DO) within the Puyallup River, by limiting BOD and ammonia loading to the river. In addition, the establishment of a TMDL supported the development of a framework to allocate the remaining assimilative capacity (reserve capacity) within the river for BOD and ammonia.
The Lower Puyallup River TMDL sets a maximum load for BOD5 (5-day BOD) at 20,322 lbs/day, and a maximum load for ammonia at 3,350 lbs/day. The load is allocated among permitted dischargers to the Puyallup River. In addition, the TMDL set an initial reserve capacity of 3,670 lbs/day of BOD5, and 1,200 lbs/day of ammonia. The reserve capacity is that portion of the loading that is set aside for future permitted discharge, and is the amount of
June 2009 Page 4-15

Pierce County Shoreline Inventory and Characterization Report
loading capacity that the river can take without exceeding water quality standards. Currently, there is a moratorium on utilizing this reserve capacity.
4.3.1.2 Shoreline Use Patterns
Existing Land and Shoreline Use
The Lower Puyallup River (Reaches 1 through 3) passes in and out of the boundaries of incorporated municipalities, including the cities of Tacoma, Fife, Edgewood, Sumner, and Puyallup. The lowest 2.7 miles of the river are located entirely within Tacoma. The shoreline planning area surrounding the Lower Puyallup, within Reaches 1 through 4, is characterized by a mix of urban development and urbanizing rural development, with a combination of single family, multi family, and commercial development, as well as significant areas of remaining resource land (largely agricultural uses) and vacant land.
The Middle Puyallup River (Reaches 4 through 7) passes through rural and agricultural areas within the Puyallup valley. The shoreline planning area surrounding the Middle Puyallup is characterized largely by rural and agricultural development patterns, with areas of low to moderate density residential development occurring near incorporated areas (Puyallup to the NW and Orting to the SE). Significant areas of County owned Open Space occur within the Reach 4 planning area, and are developed for moderate human use with walking, biking, and BMX trails.
The Upper Puyallup River (Reaches 8 through 13) passes through the Cascade foothills to the west of Mount Rainier as the Puyallup valley narrows. The shoreline planning area surrounding the Upper Puyallup is characterized by largely by rural development patterns and forestry resource land use. Reaches 12 and 13 of the Upper Puyallup are completely surrounded by forestry land use.
Shoreline modifications
Major arterials and highways are common near the Lower Puyallup River. Roads paralleling the River include the 5 lane River Road East (SR 167), and roadway bridge crossings of the river include the 66th Ave. E bridge, the Milwaukee Ave E Bridge, and the dual-span SR 512 bridge.
Levees are mapped throughout the majority of the Lower Puyallup River, although not along the unincorporated side of the river in Reach 3.
Roadways frequently parallel the Puyallup River, and several roadway bridge and major utility crossings occur. Roads paralleling the River include McCutcheon Rd E, 153rd Ave. E., South Fork Rd E, and Leech Rd E. Roadway bridge crossings of the river include the 128th St. E bridge and the Pioneer Way (SR 162) bridge. A significant pipeline crossing occurs immediately upstream of the Pioneer Way bridge, and major overhead power lines cross the river in Reach 7. Levees are mapped throughout the majority of the Middle Puyallup River, although they are only continuous within Reaches 5 and 6.
There are no paved roadways within the shoreline planning area of the Upper Puyallup, however the network of forest and timber roads is extensive and commonly passes within proximity of the
Page 4-16 June 2009

Pierce County Shoreline Inventory and Characterization Report
river. No levees or other significant shoreline modifications are mapped within the Upper Puyallup River.
Shoreline Environment Designations, Zoning, and Other Applicable Regulations
The existing Shoreline Environment Designations of the Lower Puyallup River include Urban and Rural areas, as well as Conservancy designated shoreline within Reach 3. Comprehensive Plan designations and implementing zones largely follow existing land use patterns, and include Moderate Density Single Family Residential (76% of Reach 2, 29% of Reach 3), Employment Center (71% of Reach 3), Rural Designations (53% of Reach 1), as well as Agricultural Resource Lands (42% of Reach 1). Areas of commercial and higher density residential zoning do occur predominantly within the Reach 1 and 2 planning areas. The Lower Puyallup is largely within the County’s Comprehensive Urban Growth Area (UGA); however the majority of Reach 1 is outside the UGA.
The existing Shoreline Environment Designations of the Middle Puyallup River include Conservancy and Rural in Reach 4, and Rural in Reaches 5 through 7. County zoning and Comprehensive Plan designations largely follow existing land use patterns, and are dominated by Rural 10 (greater than 50% in all reaches), Agricultural Resource Land and Rural 20 (Reach 7) designations. The Middle Puyallup is mostly outside the UGA, however the majority of Reach 6 is inside the UGA as it borders the Orting city limits.
The existing Shoreline Environment Designation of the Upper Puyallup River includes Conservancy in Reach 8 through the lower portion of Reach 12, at which point the 1992 County designations stop. County zoning and Comprehensive Plan designations largely follow existing land use patterns, and are dominated by Rural 20 (60 to 80% in Reaches 8 through 11) and Designated Forest Land. The Upper Puyallup is entirely outside the UGA.
Existing and Potential Public Access Areas
Publicly-owned park and open space lands do not occur on the Lower Puyallup River. As such, no apparent public access, beyond view points from roadways and bridge crossings, is present or potentially available within the Lower Puyallup.
As noted above, significant areas of County owned Open Space occur within the Reach 4 planning area, and are developed for moderate human use with walking, biking, and BMX trails. The largest area is Riverfront Park, with access at Riverside Rd. and 78th St. Court (see County web page listing parks facilities at: http://www.co.pierce.wa.us/pc/services/recreate/fac-list.htm). In addition, within Reach 6, a large privately owned golf course, the High Cedars Golf Club, is directly adjacent to the east shore of the river.
Historic and Cultural Resources
Cultural resources within the Lower Puyallup River shoreline planning area include recorded pre-contact materials and campsites. Native American use of the Lower Puyallup area, by the Puyallup Tribe, included seasonal hunting and gathering campsites near the Puyallup, with concentrated use occurring at the convergences of tributary streams with the river. Recorded artifacts include lithic scatters, charcoal deposits, and calcined bones (DAHP, 2007).
June 2009 Page 4-17

Pierce County Shoreline Inventory and Characterization Report
Subsistence harvest of anadromous fish (salmon and trout) and supplemental hunting of upland mammals occurred along the Lower Puyallup and throughout the watershed (DAHP, 2007).
Cultural resources within the Middle Puyallup River shoreline planning area include recorded pre-contact materials and campsites. Native American use of the Middle Puyallup area, by the Puyallup Tribe, included seasonal hunting and gathering campsites near the Puyallup, with the same use patterns seen as described in the Lower Puyallup description. Recorded artifacts include lithic scatters, charcoal deposits, and calcined bones (DAHP, 2007). Subsistence harvest of anadromous fish (salmon and trout) and supplemental hunting of upland mammals occurred along the Middle Puyallup and throughout the watershed (DAHP, 2007).
Cultural resources within the Upper Puyallup River shoreline planning area include recorded pre-contact materials and campsites; however use of the Upper Puyallup area was less regular than in areas surrounding the Middle and Lower Puyallup. Native American use of the Upper Puyallup area, by the Puyallup Tribe, likely was limited to seasonal hunting the Puyallup. Recorded artifacts include lithic scatters, charcoal deposits, and calcined bones, however far fewer artifacts have been recorded in the upper portions of the Puyallup WRIA than in lower portions (DAHP, 2007).
4.3.1.3 Reach Scale Assessment
Thirteen (13) reaches have been identified on the Puyallup River. The total length of shoreline for the Puyallup River is 38.5 miles. Beginning from the lower river and moving upstream, these reaches are labeled as PUYA_RV_01 through PUYA_RV_13 (Table 4-4).
4.3.1.4 Restoration Opportunities
Pierce County is the lead entity for salmon recovery planning in the Puyallup/White River watershed (WRIA 10). The Salmon Habitat Protection and Restoration Strategy for WRIAs 10 and 12 (Pierce County Lead Entity, 2008b) prioritizes both near-term and long-term actions for salmon habitat recovery projects. High-priority areas include the Puyallup River from its mouth to the upstream extent of the levee system (approximately RM 24.5). Near-term (five to 10 years) high-priority projects focus on the protection and restoration of presently functional salmon streams in the system. Long-term (10 plus years) high-priority projects on the Puyallup River in WRIA 10 include:
• Construction of levee setbacks for floodplain reconnection and habitat restoration between RMs 6 and 22;
• Restoration of off-channel estuarine habitat between RMs 0 and 6; and • Screening the Electron hydroelectric diversion canal from juvenile salmonids migrating
downstream. Levee setbacks are an important restoration opportunity for the Puyallup River to minimize flooding, allow for channel migration, increase connectivity between aquatic and upland areas, and increase off-channel habitat. Levee setbacks are currently being considered in the Puyallup River Flood Management planning. A levee setback feasibility study funded by Pierce County and the Salmon Recovery Funding Board is examining potential setback sites at 32 locations on
Page 4-18 June 2009

Pierce County Shoreline Inventory and Characterization Report
the Puyallup, Carbon, and White rivers (PRWC, 2007a). Reforestation of riparian areas, even behind the levees, would contribute to enhancement of riparian habitats.
Pierce County Public Works and Utilities has recently constructed a new setback levee on the Puyallup River. This is referred to as the Soldier’s Home Setback Levee Project, completed in 2006, which involved construction of a new 5,150-foot-long setback levee. The existing levee was removed to allow for natural channel migration and to expand the floodplain area. The Soldier’s Home Levee project restored about 67 acres of floodplain to historic conditions for fish and wildlife habitat (PRWC, 2007a).
In addition, levee repairs using biostabilization techniques are also being designed by Pierce County Public Works and Utilities. For example, repairs planned along North Levee Road will include installation of large woody debris and other biostabilization methods to soften the armoring of the river shoreline. Through the basin planning process, Pierce County Public Works has also planned for stream corridor restoration along the lower part of Clear Creek within the Puyallup River shoreline planning area (Pierce County, 2006a).
The Puyallup Tribe has entered into a levee management agreement with both Pierce County and the Corps of Engineers to restore vegetation. The agreement was structured to revise levee management practices and minimize impacts to in-stream habitat during levee maintenance (Marks et al., 2008). Efforts are being made to retain native vegetation near the revetment structures wherever possible so that riparian functions and shade can be provided.
The City of Puyallup Draft Shoreline Restoration Plan (ESA Adolfson, 2007) identified several restoration opportunities along the Lower Puyallup River near SR 512, including areas within the City’s UGA. Types of potential projects include revegetating riparian areas and reconnecting floodplain wetlands and oxbow areas to provide off-channel fish habitat.
The Puyallup Tribe of Indians monitors juvenile salmonids at a trap located on the Puyallup River near the White River confluence. The Tribe compiles annual salmon, steelhead, and char spawning reports that provide detailed information on anadromous fish distribution and abundance (Puyallup Tribe, undated).
Shared Strategy for Puget Sound reported: “Access to the best remaining habitat, in the upper reaches of the Puyallup-White system, is hampered by levees, culverts and other barriers. For example, of the 357 known culverts in the Puyallup, approximately 70% are partial or complete barriers to salmon. A comprehensive survey of passage barriers and a habitat assessment have been completed and are used to guide selection of strategic protection and restoration projects. Improving access to high-quality up river habitat remains a major focus and opportunity for progress.” (SSPS, undated)
The Puyallup River Watershed Council is one of several watershed councils in Pierce County. It is composed of citizens, local governments, business, elected officials, and environmental agency representatives who coordinate their efforts to restore and protect the watershed. The Puyallup River Watershed Council developed two watershed plans that detail the activities necessary to reduce nonpoint source pollution: the Lower Puyallup Watershed Action Plan and the Upper Puyallup Watershed Action Plan. The Council’s action plan for 2007 through 2011
June 2009 Page 4-19

Pierce County Shoreline Inventory and Characterization Report
Page 4-20 June 2009
includes the protection and restoration of aquatic and terrestrial habitats, as well as riparian revegetation (PRWC, 2007b).
Restoring forested riparian habitat along the river would protect in-stream habitat, reduce streambank erosion, and provide large woody debris to the river system. Planting of trees along the river is limited by the placement of the levees and the desire to maintain these levees as structural entities that are not compromised by the growth of woody vegetation. Restoration of forested habitats behind the levees may accomplish some of these goals, although not all. Increasing forested cover would increase the recruitment of LWD and increase in-stream habitat complexity.

Pierce County Shoreline Inventory and Characterization Report
Table 4-4. Reach assessment for the Puyallup River
Reach Number Reach Location Reach Length (miles)
Land Use Descriptions Modifications Unique Features Riparian Zones
PUYA_RV_01 Upstream of City of Tacoma, south of I-5 to Clarks Creek confluence
1.00 Residential and agricultural areas in Puyallup Tribal reservation. North Levee Road runs on northeast river bank. River Road East runs along southwest bank.
Ditching, draining, 100 % levee
Large floodplain expanse associated with river. Floodplain extends to south of river and includes the mouths of four tributaries one of which is Swan Creek.
Riparian zones lacking forested cover.
PUYA_RV_02 Area adjacent to Puyallup to White River confluence; upstream of Clark’s Creek confluence
2.00 Commercial and residential uses, in Puyallup UGA; includes north river bank at SR 512 crossing.
100 % levee Channel is confined. Riparian zones are narrow. Trees grow waterward of the levee
PUYA_RV_03 White River to UGA of Sumner
1.07 Sumner UGA. Agricultural and residential land uses; includes south river bank.
25% of reach is levied
Narrow forested riparian zone.
PUYA_RV_04 Sumner UGA to Fennel Creek confluence
3.91 Rural residential and agricultural uses; including SR 162 (Pioneer Way) bridge crossing. Pierce County Riverside Park is located in this reach with 50-acres of undeveloped land and BMX trails. 96th Street East bridge crossing. McCutcheon Road parallels river on east side.
60% levee Much of shoreline area in Reach 4 is public park. Large historic oxbow channels lie to the W of Puyallup and E of SR 162. Wide floodplain.
Narrow forested riparian zone.
PUYA_RV_05 Fennel Creek to Carbon River confluence
2.24 Rural residential. 128th Street E bridge crosses in this reach.
82% levee Wide floodplain both sides of river.
Riparian forested cover varies.
PUYA_RV_06 Carbon River to Orting
4.07 In UGA of Orting, Rural residential, East Pioneer Way (SR 162) crosses river (Puyallup River Bridge). High Cedars Golf course on east river bank. Calistoga Street W. crosses river.
100 % levee Large floodplain area west of Orting city limits.
Riparian cover varies. Trees lacking in residential areas.
June 2009 Page 4-21

Pierce County Shoreline Inventory and Characterization Report
Page 4-22 June 2009
Reach Number Reach Location Reach Length (miles)
Land Use Descriptions Modifications Unique Features Riparian Zones
PUYA_RV_07 Orting to Kapowsin Creek confluence
3.57 Rural residential, agricultural and forest resource lands. Oroville Road East parallels the east river bank then crosses the river at Fiske Creek. Transmission lines cross Puyallup just downstream.
100 % levee Active channel of river widens.
Riparian zones are mostly forested.
PUYA_RV_08 Kapowsin Creek to Kings Creek
4.33 Forest resource lands, with rural residential. Electron powerhouse in Reach 8 just downstream of King’s creek confluence.
No levees mapped Wide floodplain area Riparian zones are mostly forested.
PUYA_RV_09 Kings Creek Confluence to Unnamed Trib to Puyallup
8.01 Rural residential, managed forest resource lands.
No levees mapped Electron Flume runs parallel to river on south side.
Riparian zones lacking forested Riparian zones are mostly forested.
PUYA_RV_10 Unnamed Trib to the Puyallup to Neisson Creek
1.73 Managed Forest resource lands No levees mapped Unknown.
PUYA_RV_11 Neisson Creek to Mowich River confluence
1.35 Forest resource land uses No levees mapped Unknown.
PUYA_RV_12 Mowich River confluence to Deer Creek confluence
3.71 Forest resource land uses No levees mapped Unknown.
PUYA_RV_13 Deer Creek upstream to North and South tributaries
1.51 Forest resource land uses No levees mapped Unknown.
Pierce County Shoreline Inventory and Characterization Report
4.3.2 White River
The White River is a Shoreline of Statewide Significance within Pierce County downstream of the point where 1,000 cfs is measured. Upstream the White River is considered a Shoreline of the State. A total of 54 miles of White River shoreline lie with unincorporated Pierce County, not including the linear length of Mud Mountain Lake.
4.3.2.1 Physical and Biological Characterization
Processes and Channel Modifications
Key modifications include:
• Land cover conversion from forest to harvested forest, pasture, or urban land uses;
• Installation of the Mud Mountain Dam on the White River in 1942, which changed the timing and volume of flows;
• Installation of the PSE diversion to Lake Tapps which reduces streamflow between the diversion and the discharge channel in the City of Sumner;
• Increased demands on groundwater, which has reduced summer low flows within the Puyallup (Kerwin, 1999a); and
• Changes in land use which have resulted in increased fine sediment loading.
Historical channel change includes the avulsion of the White River channel to the south during a destructive flood in 1906 (Crandell, 1963). Prior to that date, the White River split into two branches on the south side of Auburn. The main branch of the river flowed northward to the Lower Green River. The smaller branch flowed southward as the Stuck River, which joined the Puyallup River. The White River was permanently diverted southward with the construction of diversion levees completed in 1914. Changes in channel morphology have included the straightening, channelizing, installation of levees and revetments, and construction of bridges and other river crossings. These levees were typically installed more than 50 years ago, and these levees would not meet current engineering standards (King County, 2006).
The natural flow regime of the White River was altered in 1912 with the construction of the White River Hydroelectric Project at approximately RM 24.3, in which approximately 64% of the flow was diverted via canals and flumes to what would become Lake Tapps (Upper Puyallup Watershed Committee, 2002). The withdrawal is managed to preserve flows of at least 130 cfs in the White River at RM 15.7 (Pelletier, 1993, 1994).
Lake Tapps was created by raising the level of four small, pre-existing lakes by construction of embankments and the diversion of White River flow at the town of Buckley, upstream of Auburn (Crandell, 1963). The water returns to the White River, downstream of Auburn, through the hydroelectric power facility at Dieringer, west of Lake Tapps. This bypass reduces river flow within the Auburn PAA. The construction of embankments to create Lake Tapps also altered the flow of tributary streams that formerly flowed northwesterly from the vicinity of Lake Tapps to the White River. Puget Sound Energy (PSE) is in the process of abandoning the power facility.
June 2009 Page 4-23

Pierce County Shoreline Inventory and Characterization Report
The hydrology of the White River has also been modified with the initial installation of the Mud Mountain Dam in 1942. The Mud Mountain Dam was installed at RM 29, primarily for flood control purposes. Mud Mountain is a ‘run of the river’ dam, and often has no water behind it. Sediment that reaches the reservoir is delayed in passing through when the reservoir pool is active, but will re-mobilize and move downstream when the pool is drained. Current practice for Mud Mountain Dam is to limit downstream flows to 12,000 cfs when feasible (Pierce County, 2007e).
Timber harvesting, agriculture, and urban land uses have changed the amount and timing of runoff in response to rainfall and snowmelt events. In general, the reduction of mature forest has resulted in greater runoff volumes with a faster time to peak flow. This pattern is often most pronounced in urban areas where rainfall on impervious surfaces is conveyed directly to receiving waters via a pipe or ditch system.
Drainage Basin, Tributary Streams and Associated Wetlands
The White River sub-basin occupies 468 square miles, covering the northern half of the WRIA (Ecology, et al., 1995b). The headwaters of the White River are located at the Emmons Glacier on the north side of Mount Rainier. From here the White River flows 66 miles before joining the Lower Puyallup River at Sumner (Ecology, et al., 1995b). The White River has 35 tributaries. The White River carries a tremendous amount of bedload material that is glacially derived. This contributes to the dynamic nature of the river system and the high sediment loads are responsible for the braided channel morphology characteristic of the river valley (Marks et al., 2008).
Approximately 185 acres of wetlands are mapped within the floodplain of the Lower White River. Based on aerial photography, these wetlands contain forested and agricultural habitats. For example, wetlands have been identified in Reaches 2 and 3, where they make up 13percentor more of the shoreline planning area. Wetlands are likely present but have not been mapped within the White River shoreline planning area upstream of the SR 410 crossing at Buckley.
Geologic Hazards
The White River drains the northeast flank of Mount Rainier. Initially, the river flows though a bedrock valley. At the margin of the Puget Sound lowland, the river flows westward through a gorge incised into glacial drift deposits. Eventually, the river exits the gorge at the City of Auburn and flows southward to Tacoma. The river flows over a wide range of geologic terrain, including volcanic and volcaniclastic rocks, deposits of alpine glaciers and continental ice sheets, lahar deposits, landslide deposits, and alluvium. Seismic, flood, and volcanic hazards exist along nearly the entire length of the White River. Landslide hazards are mapped along the slopes that form the walls of the White River gorge. Landslide hazards may exist outside of the mapped areas, particularly in those locations where recent landslide deposits are present, such as upstream of the White River gorge (Pierce County GIS, 2007). In a number of locations, the White River passes within a few hundred feet of areas that have been mapped as having erosion potential.
Page 4-24 June 2009

Pierce County Shoreline Inventory and Characterization Report
Flood Hazards
Flood hazards along the White are primarily a result of streamflow along the river. Flood hazards are partly mitigated as higher flows are retained in Mud Mountain Dam. The Federal Emergency Management Agency (FEMA) has prepared Flood Insurance Rate Maps (FIRMs) that include the lower portions of the White River. Much of the river below the City of Auburn to the confluence with the Puyallup has been leveed as part of past river management.
In general, the resolution of flood mapping reduces with distance upstream, especially in the smaller tributary streams. Site-specific investigation would be necessary to better establish flooding regimes in the upper watershed.
Critical or Priority Habitat and Species Use
The White River supports spring Chinook, sockeye, bull trout/Dolly Varden, coho, fall chum, pink salmon, and winter steelhead. Fish distribution maps (WDFW, 2007b) indicate that the White River provides rearing habitat for spring Chinook. The White River provides spawning and rearing habitat for coho and winter steelhead. The White River provides spawning habitat for fall chum in a segment near Pacific, and east of Buckley, the presence of fall chum changes to a potential presence. Sockeye, bull trout/Dolly Varden, and pink salmon have a documented presence within the White River. In addition, fall Chinook have a documented presence from Sumner upstream to Buckley (WDFW, 2007b). Critical habitat is discussed below.
Critical habitat for the Puget Sound DPS steelhead has not yet been designated but is currently under review. Puget Sound ESU Chinook salmon and bull trout have critical habitat designated within the White River (Federal Register 2005a; 2005b).
In addition, there are multiple state priority habitats associated with the White River. These habitats include: the Lower White River agricultural wetlands; small and large waterfowl concentration areas; Murray Creek wetland habitat; Lake Tapps plateau wetlands; White River riparian corridor habitat; the White River elk range and the White River elk winter area; Green River-White River harlequin duck breeding areas; and White River wetland habitat (WDFW, 2007a). Two great blue heron colonies have been recorded adjacent to the river, and a spotted owl was recorded 1,500 feet from the river, in proximity to Goat Creek.
Instream and Riparian Habitats
The mainstem White River is generally unconfined and contains braided, complex channels abundant in salmon spawning gravels. However, from approximately RM 11 downstream the mainstem channel is confined by levees on both sides of the river and spawning habitat is limited. LWD is generally abundant but small in size along the mainstem White River. Riparian vegetation is typically second growth coniferous or hardwood forest except for Mount Rainier National Park, which consists of mostly old growth forest (Marks et al. 2005). Mature forest is present along the White River at Federation Forest State Park, and on some U.S. Forest Service lands upstream of Greenwater. On U.S. Forest Service lands, mature forest is also located along portions of some tributaries to the White River, including the Clearwater River, Greenwater River, and West Fork White River.
June 2009 Page 4-25

Pierce County Shoreline Inventory and Characterization Report
Land use in the lower eight miles of the White River sub-basin is mixed commercial/residential and the primary land use in the Upper White River sub-basin is commercial forest production. Logging has been active along the White River since the 1940’s and has resulted in restricted recruitment of LWD in the White River mainstem. In some cases, logging has increased erosion in steep slope habitat. Construction of the Mud Mountain Dam (1942) has limited LWD recruitment and sediment deposition along the mainstem. However, LWD from old growth habitat in Mount Rainier National Park has provided opportunities for flow regulation, sediment retention, and structural habitat in the Upper White River mainstem (Kerwin 1999a).
Water Quality
According to the 2004 Washington State Water Quality Assessment (Ecology, 2004b), the White River has three 303(d) listings (Category 5 listings) for impaired water quality: fecal coliform, pH, and temperature. In addition, the White River also has Category 2 listings for fecal coliform, pH, temperature and dissolved oxygen (DO). The White river also has 7 Category 1 listings: ammonia-N, arsenic, DO, fecal coliform, mercury, pH, and temperature (Ecology, 2004b).
During 2002-2003, Ecology prepared and completed a TMDL for sediment and temperature for the Upper White River watershed, which included the Upper White River and the Greenwater River. In 2006, Ecology completed a detailed implementation plan to carry out the actions called for in the TMDL.
The Clean Water Act Section 305(b) Report published by Ecology in 1992 indicated that the White River, along with the Puyallup River and Hylebos Creek, had water quality impairments due to high fecal coliform counts. One of the sources for this water quality impairment was discharge by municipalities and industries (Ecology, et al., 1995b). There are a total of 44 individual NPDES permits that discharge to the watershed, and in addition to these, there are 28 general permits that allow discharge to surface water within the larger watershed. Additional sources of impairment listed in the report include pasture lands, animal-management areas, manure lagoons, removal of riparian corridors, and channelization (Ecology, et al., 1995b).
4.3.2.2 Shoreline Use Patterns
Existing Land and Shoreline Use
White River Reach 1 occurs directly at and above the convergence of the White River with the Puyallup River, in a developed area characterized by low to moderate density residential development. Reach 2 of the White River, where the river flows from the north, out of King County, is characterized by commercial and office development. Above the point where the White River forms the north-eastern boundary of Pierce County (Reaches 3 through 11), the shoreline planning area transitions from Rural land use (dominant in Reach 3) to timber lands.
Roadway infrastructure creates high impervious coverage in Reaches 1 and 2; however, impervious surfaces are minimal in all other White River reaches. State Routes 167 and 410 interchange directly north of the mouth of the White River, and several other surface arterials cross over the river. From Reach 3 and above, Highway 410 and several USFS and unimproved logging roads occur near the river and its tributaries. A river crossing is located at Enumclaw-Buckley Rd. SE.
Page 4-26 June 2009

Pierce County Shoreline Inventory and Characterization Report
Shoreline modifications
Levees are mapped throughout the White River in Reaches 1 and 2. Levees and revetments exist within certain sections of the White River and its tributaries located upstream of Buckley, but their locations have not yet been mapped.
Shoreline Environment Designations, Zoning, and Other Applicable Regulations
The existing SMP Shoreline Environment Designation of White River Reaches 1 and 3 through 9 is Conservancy. The designation of Reach 2 is Rural. Existing shoreline environment designations for freshwater reaches are illustrated on Map 29 (Eastern) and Map 30 (Western). County zoning and Comprehensive Plan designations largely follow existing land use patterns, and are dominated by: Moderate Density Single Family Residential in Reach 1, Employment Center in Reach 2, Rural 10 to Rural 20 (greater than 50%) in Reaches 3 and 4, and Designated Forest Land (greater than 65% in all reaches) in Reaches 5 through 11. Reaches 1 through 3 are within the UGA, and all other White River reaches are outside of the UGA.
Existing and Potential Public Access Areas
There are no County-owned parks within the White River planning area. However, extensive public access is provided to the White River and some of its tributaries on publicly owned lands outside the planning area (e.g., Mt Rainier National Park, U.S. Forest Service lands, Mud Mountain Dam Park and Recreational Facility, Federation Forest State Park, and city parks).
Historic and Cultural Resources
Cultural resources within the White River shoreline planning area include recorded pre-contact materials and campsites. Native American use of the Puyallup and Green/Duwamish basins, by the Puyallup and Duwamish Tribes, included seasonal hunting and gathering campsites near the White, with villages and camps frequently occurring at convergences with smaller tributary streams. Recorded artifacts include lithic scatters, charcoal deposits, and calcined bones (DAHP, 2007). Subsistence harvest of anadromous fish (salmon and trout) and supplemental hunting of game occurred along the Middle Puyallup and throughout the watershed (DAHP, 2007).
4.3.2.3 Reach Scale Assessment
Eleven (11) reaches have been identified within the White River shoreline planning area. These reaches are labeled WHIT_RV_O1 through WHIT_RV_11 moving from the Lower White River to the upper headwaters in Mount Rainier National Park (Table 4-5). Approximately 54 miles of White River shoreline (not including Mud Mountain Lake) lie within Pierce County.
June 2009 Page 4-27

Pierce County Shoreline Inventory and Characterization Report
Page 4-28 June 2009
4.3.2.4 Restoration Opportunities
The White River Basin Plan (Pierce County, 2007e) identified several types of restoration opportunities on the river mainstem, including pulling back levees to allow for channel migration, installing engineered logjams, planting riparian vegetation, providing better detention and treatment for stormwater runoff, and reconnecting side channel habitat. The decommissioning of forest roads in the upper watershed and the acquisition of important riparian habitats near Buckley have also been identified as opportunities through the WRIA 10/12 salmon recovery planning process (Pierce County Lead Entity, 2008a, 2008b).

Pierce County Shoreline Inventory and Characterization Report
Table 4-5. Reach assessment for the White River
Reach Number Reach Location Reach Length (miles)
Land Use Descriptions Modifications Unique Features Riparian Zones
WHIT_RV_01 Confluence with the Puyallup River to the city limits of Sumner
3.32 Residential and commercial uses, immediately east of major intersection of SR167 and SR 410; includes SR 410 bridge over River.
75% of reach has levees
Roads parallel river on both sides.
Riparian forested cover is limited. Trees line the river in a band 50 to 75 feet wide.
WHIT_RV_02 unincorporated land near Pacific (8th Street East) to northern Pierce County line
0.56 Commercial development on east bank. Agricultural uses to the east near County line.
77% of reach has levees
Large wetland along east bank of river that extends north of the Pierce County line into Auburn. Wetland is 600 feet wide and extends to A Street SE.
Riparian forested cover is limited due to commercial and agricultural uses.
WHIT_RV_03 Pierce County line to Buckley city limits
8.99 Agricultural uses, rural residential. County jurisdiction and Muckleshoot Tribal jurisdiction occurs in this vicinity. Includes forested lands between River and Electron Flume in Buckley.
No levees documented.
Very wide floodplain on White River with multiple channels and wide channel migration zone. Wetland observed in sloughs and off-channel habitat.
Riparian forested cover is good, provided by trees in the channel migration zone.
WHIT_RV_04 Buckley to Mud Mountain Lake
4.22 Reach 4 begins 0.5 miles upstream of Electron Flume, which diverts water to Lake Tapps. Agricultural and forestry uses. Major overhead transmission line crossing.
Unknown. Narrower floodplain. Riparian forested cover varies.
WHIT_RV_05 Mud Mountain Lake - This is MUDM_LK_01. Forest resource lands. Mud Mountain Lake road to the north. Mud Mountain Park provides pubic access.
Unknown. Reservoir Forest cover varies.
WHIT_RV_06 Mud Mountain to Clearwater River
1.42 Forest resource land uses Unconfined. Large island present in this reach.
Forest cover generally present.
June 2009 Page 4-29

Pierce County Shoreline Inventory and Characterization Report
Page 4-30 June 2009
Reach Number Reach Location Reach Length (miles)
Land Use Descriptions Modifications Unique Features Riparian Zones
WHIT_RV_07 Clearwater River to Pierce County line
10.49 Forest resource land uses Confined to the east end of the reach by SR 410 near Town of Greenwater.
Oxbow channels present, in-channel islands, wide CMZ. Extensive damage from recent floods.
Forest cover present in shoreline jurisdiction.
WHIT_RV_08 Confluence with the Greenwater River to the confluence with the West Fork White River.
3.53 Forest resource land uses. Town of Greenwater with residential uses.
Confined by SR 410 in some locations.
Extensive flood damage and channel migration.
Forest cover varies.
WHIT_RV_09 West Fork White River to Huckleberry Creek
4.67 Forest resource land uses, enters National Forest lands at east of reach. Crystal River Ranch Road bridge.
Unconfined. Extensive CMZ. Forest cover varies.
WHIT_RV_10 To Goat Creek 14.61 Forest resource land uses, National Forest
Partially confined to the east by SR 410.
Extensive CMZ. Forest cover varies.
WHIT_RV_11 Upstream from Goat Creek confluence
2.15 Forest resource land uses, National Forest
Partially confined by SR 410.
Extensive CMZ. Forest cover varies.

Pierce County Shoreline Inventory and Characterization Report
4.3.3 Lake Tapps
4.3.3.1 Physical and Biological Characterization
Processes and Channel Modifications
Lake Tapps is a man-made reservoir created in 1911 and maintained by Puget Sound Energy (PSE). Cascade Water Alliance, an eastside water utility, is in the process of purchasing Lake Tapps from PSE. Cascade intends to use Lake Tapps as a municipal water supply reservoir. To create the reservoir, a diversion dam was constructed on the White River, near Buckley, Washington, which routed water into a flume directed to the east side of Lake Tapps. On the west side of the lake water was routed to the "Dieringer Powerhouse" to generate hydroelectricity. The water is then returned to the White River, about 20 miles downstream from the diversion dam. The level of the lake is controlled by PSE and is lowered from September to May for flood control purposes. However, the lowered lake elevation reduces recreational opportunities for the lakeshore residents.
At the Buckley diversion dam on the White River there is a fish trap that catches salmon as they migrate upstream. The fish are transported by truck and released upriver of Mud Mountain Dam, which blocks salmon migration. In June of 2008, Cascade Water Alliance entered into an agreement with the Muckleshoot and Puyallup Tribes to determine minimum flow regimes on the White River and set millions of dollars of mitigation fees for salmonid recovery (see web page at: http://www.cascadewater.org/lk_tapps_tribal_agreements.php).
Drainage Basin, Tributary Streams and Associated Wetlands
Lake Tapps is located within the White River sub-basin (Map 6) and is one of the primary surface water bodies of the sub-basin, covering 2,296 acres and holding 46,660 acre-feet of water (Ecology, et al., 1995b). Lake Tapps is about 4.5 square miles in surface area and has about 45 miles of shoreline. The shape of the shoreline is complex with many inlets, peninsulas, and islands. Before the reservoir was created there were several smaller lakes, including one called Lake Tapps. The reservoir is held in place by dikes.
Approximately 297 acres of wetland is mapped around the fringes of Lake Tapps. Wetlands cover 8% of the lake’s shoreline planning area.
Geologic and Flood Hazards
Lake Tapps is situated on an upland glacial drift plain to the east of the City of Puyallup. The lake is bounded by volcanic mudflow and continental ice-sheet deposits. Hazards identified for Lake Tapps include, flood, seismic, and landslide. The slopes which form its margin are also identified as steep slopes with the potential for erosion.
Critical or Priority Habitat and Species Use
There are several priority habitat areas associated with Lake Tapps. Small waterfowl concentration areas have been designated at Lake Tapps, in addition to the Lake Tapps
June 2009 Page 4-31

Pierce County Shoreline Inventory and Characterization Report
Waterfowl Area. Lake Tapps Plateau wetland habitats and White River wetland habitat have also been designated. Several parks and open space areas are also associated with Lake Tapps (WDFW, 2007a). There is a bald eagle nest at the southeast corner of the lake and a second nest is located over 2,000 feet from the southeast corner of the lake.
Instream and Riparian Habitats
Lake Tapps was originally created as an impoundment in 1911 and was used explicitly as a source of hydroelectric power. Today, the Lake Tapps shoreline is currently developed for residential use and the lake is used extensively for recreation. Road density is relatively high for access to residential homes and various points of access are available for boat launches. High levels of development and human use in the lake area have impacted the natural vegetation and character of the lake.
Water Quality
According to the 2004 Washington State Water Quality Assessment (Ecology, 2004b), Tapps Lake has one Category 4C listing for invasive exotic species and one Category 1 listing for total phosphorus.
4.3.3.2 Shoreline Use Patterns
Existing Land and Shoreline Use
Lake Tapps, which is fed from diverted flows from the White River, is surrounded predominantly with moderate to high density single-family residential land use. Lake Tapps has several islands, most of which are also developed with single family homes. Some developments are associated with golf courses, which in areas border the shoreline.
Shoreline modifications
Shoreline modifications associated with residential uses are prevalent throughout the Lake Tapps shoreline area. Analysis of 2006 aerial photography shows that the majority of residential parcels along the lake shoreline have bulkheading, predominantly made of concrete, and many of these parcels have private use docks. Additionally, islands within Lake Tapps are linked to each other and the surrounding shoreline via a series of roads, bridges and causeways. Causeways are typically constructed on top of rip rap berms.
Shoreline Environment Designations, Zoning, and Other Applicable Regulations
The existing Shoreline Environment Designations of Lake Tapps are Rural Residential and Conservancy. Reach 5 is Rural/Residential and Conservancy. The designation of the remaining reaches (1 through 4 and 6) is Rural/Residential. Zoning and Comprehensive Plan designations largely follow existing land use and are dominated by Moderate Density Single Family (88% or higher in Reaches 1 through 4 and 6) and Rural 10 (99.5% in Reach 5) zoning.
Page 4-32 June 2009

Pierce County Shoreline Inventory and Characterization Report
June 2009 Page 4-33
Existing and Potential Public Access Areas
Three public parks are located on the Lake Tapps shoreline: Lake Tapps North Park, Jenks Park and Tapps Island Golf Course. North Lake Tapps Park is an 80-acre park with approximately 10,000 feet of waterfront access to Lake Tapps. The park includes a popular swimming beach, seasonal concessions, a public boat launch, restrooms, and 3 miles of natural surface trails within the park. Recent improvements to the park facilities include an improved boat trailer parking area, two boat landing docks, and a boat wash off area. Jenks Park is located on the southwestern side of Lake Tapps and is a small county park.
Historic and Cultural Resources
Cultural resources within the Lake Tapps shoreline planning area include recorded pre-contact materials. Recorded artifacts include lithic scatters and charcoal deposits (DAHP, 2007). Subsistence harvest of anadromous fish (salmon and trout) and supplemental hunting of upland mammals occurred along nearby rivers and streams (DAHP, 2007).
Areas of Special Interest
Three suspected or confirmed hazardous waste facility sites are listed for Lake Tapps. Two underground storage tanks (UST) are listed for Reach 5 – one for a grocery and one for Lake Tapps County Park. Also a hazardous waste generator is listed for the Pierce County Fire District 22 in this shoreline in Reach 1.
4.3.3.3 Reach Scale Assessment
Lake Tapps has been divided into six (6) reaches for this assessment. The six reaches are labeled TAPP_LK_01 through TAPP_LK_06 in the GIS database. The total shoreline miles of Lake Tapps within Pierce County jurisdiction is 35.9. Reaches are described in Table 4-6.
4.3.3.4 Restoration Opportunities
Cascade Water Alliance (CWA) and Puget Sound Energy have reached agreement on CWA’s purchase of Lake Tapps for recreation and water supply. The final purchase agreement was approved in March 2008. Lake Tapps will be the single largest component of the Cascade water supply system. The program will also provide for improved river flows in the White River to enhance habitat for endangered fisheries. Pierce County has entered into a memorandum of understanding with Cascade Water Alliance in August 2005. One action item in the MOU is to protect and preserve the lake’s water quality from impacts from stormwater or other non-point pollution sources. Web site: http://www.cascadewater.org/pro_tapps.html
Restoration opportunities may exist in parks and public lands such as Lake Tapps North Park. Due to the presence of undeveloped lands in this county park, revegetation and restoration of shoreline riparian habitat may be possible.

Pierce County Shoreline Inventory and Characterization Report
Table 4-6. Reach summary for Lake Tapps
Reach Number Reach Location Reach Length (miles)
Land Use Description Modifications Unique Features Riparian
TAPP_LK_01 Western lake shore, from Bonney Lake city limits to Sumner-Tapps Highway
0.27 Rural Residential, residential docks on almost every parcel; undeveloped land off of 45th Street to Banker’s Island.
Residential docks, boat slips
Includes Bankers Island
Forested riparian cover is lacking,
TAPP_LK_02 Northwestern shore 2.15 Rural Residential Residential docks boat slips
Includes Island Twenty-one and Deer Island; Dieringer Flume
Forested riparian cover is lacking
TAPP_LK_03 Northwestern shore 6.93 Rural Residential Residential docks, boat slips
Includes Tacoma Point.
Forested riparian cover is lacking
TAPP_LK_04 Northern shore 0.28 Rural Residential Residential docks, boat slips
Forested riparian cover is lacking
TAPP_LK_05 Eastern shore 25.65 Rural Residential; Park lands Residential docks; transmission line crossing; Dike Road along eastern shore
Includes County Park
Includes Island A and Island B and Scout Island
Forested riparian cover is lacking, except in County park.
TAPP_LK_06 Southern shore 0.62 Rural Residential Residential docks Near Printz Basin Forested riparian cover available in area.
Page 4-34 June 2009

Pierce County Shoreline Inventory and Characterization Report
4.4 Rivers, Shorelines of the State
4.4.1 Bear Creek
4.4.1.1 Physical and Biological Characterization
Drainage Basin, Tributary Streams and Associated Wetlands
Bear Creek lies within the Lower Carbon River basin (Basin 16 of the Pierce County Basin Plan). Bear Creek is a three mile long tributary of Voight Creek and enters Voight Creek on the Left Bank (LB) at RM 6.6. Approximately 0.6 mile of Bear Creek qualifies as a Shoreline of the State. A large wetland is identified in the Pierce County database at the confluence of Bear Creek and Voight Creek. Based upon soils mapping, this associated wetland is possibly a peat-dominated wetland that has developed in the alluvial floodplain of Bear Creek.
Geologic and Flood Hazards
Bear Creek drains the north side of Cowling Ridge and flows north to Voight Creek. Bear Creek crosses alpine glacial deposits, volcaniclastic rocks and deposits, and Quaternary landslide and peat deposits. A seismic hazard is associated with landslide deposits along the lower portion of the creek. Flood hazards are identified for Bear Creek. Landslide hazards are unmapped for the creek, but may exist given the presence of recent landslide deposits. Erosion potential exists in the area of peat deposits near the confluence with Voight Creek. A notable cliff feature lies to the west of Bear Creek as viewed from 2006 aerial photographs.
Critical or Priority Habitat and Species Use
Fish distribution maps (WDFW, 2007b) indicate that Bear Creek does not provide habitat for any salmonid species. Critical habitat for bull trout has been designated within Bear Creek (Federal Register, 2005b). Priority habitats within or along Bear Creek include the Carbon River riparian zones and the White River elk range. Anadromous fish passage into Bear Creek is not possible due to impassable cascades located at RM 4.1 on Voight’s Creek.
Water Quality
According to the 2004 Washington State Water Quality Assessment (Ecology, 2004b), Bear Creek is not listed for any water quality impairments.
4.4.1.2 Shoreline Use Patterns
Bear Creek (1 reach) lies within forest resource lands outside of the Mount Baker-Snoqualmie National Forest. The shoreline planning area surrounding the stream is characterized by forestry resource land use owned in part by Hancock Forest Management. Gravel timber roads lie within close proximity to Bear Creek and its associated peat wetlands. No levees or other significant shoreline modifications are mapped.
The existing Shoreline Environment Designation of Bear Creek is Conservancy. County zoning and Comprehensive Plan designations show existing land use as 100% Designated Forest Land.
June 2009 Page 4-35

Pierce County Shoreline Inventory and Characterization Report
No existing or proposed points of public access occur along the stream. Cultural resources have not been inventoried within the Bear Creek area. No areas of special interest within the Bear Creek shoreline planning have been identified.
4.4.1.3 Reach Scale Assessment
Bear Creek is represented by one (1) shoreline reach – BEAR_CR_01. This reach is 0.6 mile long, encompassing a short section at its confluence with Voight Creek.
4.4.1.4 Restoration Opportunities
Restoration opportunities include removal of gravel timber roads within the shoreline jurisdiction and restoration of riparian areas along Bear Creek and its associated wetlands. No information is available regarding the value of the associated peat wetland system or other restoration opportunities needed to sustain wetland functions.
4.4.2 Canyon Creek Two
4.4.2.1 Physical and Biological Characterization
Drainage Basin, Tributary Streams and Associated Wetlands
Canyon Creek Two lies within the Upper White River basin (Basin 21). Canyon Creek flows from Cedar Lake north and enters the White River west of the confluence with the Clearwater River. There are no mapped wetlands associated with Canyon Creek Two.
Geologic and Flood Hazards
The geology in the drainage is dominated by volcanic and volcaniclastic rocks. The lower portion of Canyon Creek crosses continental glacial soils. Hazards identified along Canyon Creek include seismic and flood. Volcanic hazards are likely where the creek joins the White River. Erosion potential exists near the creek headwaters.
Critical or Priority Habitat and Species Use
Fish distribution maps (WDFW, 2007b) indicate that Canyon Creek has a documented presence of coho and winter steelhead in the lower reaches of the stream. Little stream complexity exists within Canyon Creek and the seasonal flows within the creek are inadequate to allow access for Chinook or steelhead to spawn (Marks et al., 2005). There are approximately 160 yards of suitable spawning habitat in Canyon Creek.
There is one state priority habitat associated with Canyon Creek Two: the White River elk range (WDFW, 2007a).
Water Quality
According to the 2004 Washington State Water Quality Assessment (Ecology, 2004b), Canyon Creek Two is not listed for any water quality impairments.
Page 4-36 June 2009

Pierce County Shoreline Inventory and Characterization Report
4.4.2.2 Shoreline Use Patterns
Canyon Creek Two lies outside of the Mount Baker-Snoqualmie National Forest in unincorporated County forest resource lands. Gravel timber roads lie within close proximity to the stream. No levees or other significant shoreline modifications are mapped along Canyon Creek Two.
The County SMP does not provide a Shoreline Environment Designation for Canyon Creek Two. County zoning and Comprehensive Plan designations show existing land use as 100% Designated Forest Land. Due to the forest resource land use, no existing or proposed points of public access occur along the stream. Cultural resources have not been inventoried within the shoreline planning area.
4.4.2.3 Reach Scale Assessment
Canyon Creek Two is characterized by one (1) shoreline reach – CANY_CR_01. This reach is similar in use and function to other streams in the Cascade foothills that are currently in forest resource lands.
4.4.2.4 Restoration Opportunities
Restoration opportunities for Canyon Creek Two include riparian planting and reforestation, and decommissioning or repair of logging roads to prevent sedimentation into the stream.
4.4.3 Carbon River
Carbon River lies within both the Lower Carbon River (Basin 16) and the Upper Carbon River basins (Basin 24). The Carbon River is a major tributary to the Puyallup.
4.4.3.1 Physical and Biological Characterization
Processes and Channel Modifications
In general, the more remote and higher elevation Carbon River basin is less modified than its neighboring river basins in WRIA 10. Key modifications include:
• Land cover conversion from forest to harvested forest, pasture, or limited urban land uses which can changed timing, volume, and quality of runoff;
• Installation of roads to support Mount Rainier National Park and environs (Kerwin, 1999a);
• Installation of levees in the broad valley in the lower 8 miles of the Carbon; and
• Installation of forest roads with associated culvert crossings over streams.
June 2009 Page 4-37

Pierce County Shoreline Inventory and Characterization Report
Drainage Basin, Tributary Streams and Associated Wetlands
The Carbon River sub-basin covers 230 square miles. The Carbon River is a glacial fed tributary of the Puyallup River basin that contributes approximately 30% of the Puyallup River flow (Kerwin, 1999a). The Carbon River flows for about 32 miles, from the Carbon and Russell glaciers on Mount Rainier. It has 19 tributary streams and is thought to represent the largest and most productive habitat available for natural salmonid production in the entire Puyallup River basin (Kerwin, 1999a).
The river is divided into two sub-basins: the Upper Carbon River sub-basin and the Lower Carbon River sub-basin. The Upper Carbon River reach is the segment of the river upstream of 177th Street East (RM 8.5) to the headwaters. The Lower Carbon River reach is the segment of the river downstream of 177th Street East to the confluence with the Puyallup River.
Approximately 2.4 acres of wetlands are mapped within the floodplain of the Carbon River. Most of the mapped wetlands are small and scattered and are located near the confluence of the Carbon and Puyallup rivers. Wetlands mapped within the sub-basin make up less than 1% of the Carbon River shoreline planning area.
Geologic Hazards
The Carbon River flows from the Carbon Glacier on the northwest slope of Mount Rainier to its confluence with the Puyallup River northwest of Orting, Washington. The Carbon River flows through a wide range of geologic terrains. In its steep upper reaches, it flows over dominantly volcanic and volcaniclastic rocks as well as deposits of alpine glaciers and debris flows. It then courses through low-lying valleys principally composed of volcanic mudflow, ice-sheet, and recent river deposits. Hazards identified along the Carbon River include seismic, flooding, landslide and volcanic. Discrete areas of erosion potential and steep slopes are also identified.
Flood Hazards
The Federal Emergency Management Agency (FEMA) has prepared Flood Insurance Rate Maps (FIRMs) that include the Carbon and its main tributaries. For much of the higher gradient portions of the Upper Carbon, it appears that flooding width will be limited by the relatively narrow valley morphology. There are areas where a wider alluvial valley has formed in lower slope reaches. The floodplain is typically wider in these reaches, including the broad valley directly upstream from Orting.
Significant flooding occurred in the Upper Carbon basin in the national park during November 2006. Flooding has damaged significant areas of roads, trails, and other park infrastructure. The park service estimated that approximately $36 million worth of damage occurred as a result of flooding (National Park Service Press Release January 12, 2007).
A USGS study suggested that the Lower Carbon River levee system will not be able to withstand flows near the 100 year recurrence interval flow (Prych, 1988). Failure of the levee system would have significant flooding consequences for the City of Orting.
Page 4-38 June 2009

Pierce County Shoreline Inventory and Characterization Report
In general, the resolution of flood mapping reduces with distance upstream, especially in the smaller tributary streams. Site specific investigation would be necessary to better establish flooding regimes in the upper watershed.
Critical or Priority Habitat and Species Use
The Carbon River supports bull trout/Dolly Varden, winter steelhead, fall Chinook, fall chum, cutthroat trout, and coho. Fish distribution maps (WDFW, 2007b) indicate that bull trout/Dolly Varden has a documented presence throughout the river, with small segments of spawning habitat that can be found between Evans Creek (to the west) and Spukwush Creek (to the east). Winter steelhead also have a documented presence within the Carbon River, with segments of spawning habitat from Orting east to near Carbonado, and another segment within the vicinity of Evans and Tolmie Creeks (WDFW, 2007b). The Carbon River also has a documented presence of fall Chinook, with a small spawning area near Orting, and a documented presence of coho with spawning areas near Orting and east of Carbonado, as well as areas of rearing habitat. Fall chum are supported by spawning and rearing habitat within the river. Pink salmon have rearing habitat designated within the river. Critical habitat for these species is discussed below.
Critical habitat for the Puget Sound DPS steelhead has not yet been designated. The Puget Sound/Strait of Georgia ESU coho salmon is a species of concern, and therefore, does not have critical habitat designated. Puget Sound ESU Chinook salmon and bull trout have critical habitat designated within the Carbon River (Federal Register, 2005a; 2005b).
The Carbon River provides excellent spawning and rearing opportunities for salmon and steelhead, and the majority of the spawning for all species takes places within the lower 11 miles of the river (Marks et al., 2005).
There are several priority habitats and species associated with the Carbon River. These habitats include the following: Carbon River bald eagle wintering areas; Carbon River riparian habitat; open space (UNOS), including Puyallup steep slopes and candidate open space areas; the Little Puyallup riparian zone; Carbon River wetland areas; the White River elk range; elk damage areas; the Carbon River riparian zone; and several Carbon River harlequin duck breeding areas (WDFW, 2007a).
Instream and Riparian Habitats
The discussion of instream and riparian habitats for the Carbon River will be divided into the Upper Carbon River and the Lower Carbon River.
Upper Carbon River
The majority of the Upper Carbon River is comprised of unstable, braided channels with bedload consisting of large rubble, boulders, and pockets of fine-sorted materials. Hardwoods dominate the riparian corridors, and there is an overall lack of large woody debris (LWD) within the upper river. This lack of LWD is thought to be a limiting factor in providing channel stability and habitat needed for successful salmonid production (Kerwin, 1999a). The reach above South Prairie Creek (RM 6.0 to RM 8.5) is constrained by both dikes and bluffs on the north side (Marks et al., 2005). Above RM 8.5, the river flows through a narrow canyon before becoming
June 2009 Page 4-39

Pierce County Shoreline Inventory and Characterization Report
freely flowing outside the boundary of Mount Rainier National Park. Within this reach, both Chinook and steelhead spawning occur.
Lower Carbon River
The lower 3 miles of the river are constrained by earthen dikes, and the channel varies greatly in width. The channel within this section is characterized as being only moderately diverse with a pool riffle character (Marks et al., 2005). There is a lack of LWD in the lower reaches of the Carbon River.
Water Quality
According to the 2004 Washington State Water Quality Assessment (Ecology, 2004b), the Carbon River has six Category 1 listings for water quality impairment: ammonia-N, arsenic, dissolved oxygen, fecal coliform, pH, and temperature.
The only known water quality issue for the Upper Carbon River is the Carbonado wastewater sewage treatment plant, which has undergone system upgrades to address violations (Kerwin, 1999a).
4.4.3.2 Shoreline Use Patterns
Existing Land and Shoreline Use
Carbon River (Reaches 1 through 8) passes through rural and agricultural areas in the lower reaches, and active timberland in the upper reaches. Reach 2 passes through the City of Orting with associated urban residential development. The shoreline planning area surrounding the Carbon River is characterized by rural, vacant (unused), and agricultural development patterns in the lower reaches, with forest resource uses occurring predominantly from Reach 5 and upstream.
Portions of roadways parallel the Carbon River, and several roadway bridge and major utility crossings occur. Major overhead powerlines cross the river in Reach 2.
Shoreline modifications
Levees are mapped within Carbon River Reaches 1 and 2, as the river is in close proximity to the City of Orting and surrounding residential development. Above the City of Orting, levees are not mapped within Reaches 3, 4, 6, 7 and 8. Within Reach 4, as the river passes through Carbonado, levees are intermittently mapped along the river, primarily on the northeast bank.
Levee repair was required in November 2008 on the Carbon River within several sections of Pierce County. Pierce County Surface Water Management crews worked on damaged levees south of Orting and to protect the Foothills Trail to repair damage from November storms (http://www.thenewstribune.com/news/local/story/542564.html).
Page 4-40 June 2009

Pierce County Shoreline Inventory and Characterization Report
Shoreline Environment Designations, Zoning, and Other Applicable Regulations
The existing Shoreline Environment Designation of the Carbon River includes Rural in Reach 1, Conservancy in Reach 2, a mix of Rural and Conservancy in Reaches 3 and 4, and a mix of Rural, Conservancy, and Natural in Reach 5. The portion of Reach 6 that is mapped has a Shoreline Environment Designation of Conservancy. Reaches 7 and 8 do not have a Shoreline Environment Designation. County zoning and Comprehensive Plan designations largely follow existing land use patterns, and are dominated by Rural 10 and Designated Forest Land (100% in Reach 7 and 8). Reach 2 is dominated by Employment Based Planned Community zoning. The Carbon River passes outside the UGA, however the majority of Reach 1 is inside the UGA.
Existing and Potential Public Access Areas
The Carbon River is a popular destination for white-water river rafting. Several sections of the river are rated from Class II to V and are used by kayakers and rafts. The Carbon River Road is a main entrance to the Mount Rainier National Park and to access Mowich Lake. This road sustained heavy damage during the November 2006 floods and is currently being repaired.
The Pierce County Parks Foothills Trail also provides public access to the Lower Carbon River. The Foothills Trail is 15 miles long from Meeker through McMillin and Orting to South Prairie. The McMillin Trailhead is a popular starting spot for bikers, skaters and walkers. This 2.3 mile section is parallel to SR 162 and runs through Orting. The McMillin trailhead is located near the confluence of the Puyallup and Carbon rivers. The trail also crosses the Carbon via a trestle in the Orting to South Prairie section.
Pierce County Parks recently purchased 700 acres of potential park land along the Carbon River in two sections. One property is 500 acres just upstream from the Town of Carbanado. The second property is a 200 acre piece farther upstream on the Carbon near Mount Rainier National Park. Pierce County bought the parcels from Plum Creek Timber and Cascade Land Conservancy. Feasibility studies on the parcels are expected to occur in 2007.
Historic and Cultural Resources
Cultural resources within the Carbon River shoreline planning area include recorded pre-contact materials and campsites. Native American use of the Middle Puyallup area, by the Puyallup Tribe, included seasonal hunting and gathering campsites near the Puyallup, with the same use patterns seen as described in the Lower Puyallup description. Recorded artifacts include lithic scatters, charcoal deposits, and calcined bones (DAHP, 2007). Subsistence harvest of anadromous fish (salmon and trout) and supplemental hunting of upland mammals occurred along the Middle Puyallup and throughout the watershed (DAHP, 2007).
Areas of Special Interest
Several suspected or confirmed contaminant sites have been identified by Ecology along the Carbon River and within its shoreline planning area. In Reach 2, an underground storage tank (UST) is listed associated with a bus garage. In Reach 3, an emergency and hazardous chemical report was filed for the Orting Wastewater Treatment Plant. In Reach 4, two inactive hazardous
June 2009 Page 4-41

Pierce County Shoreline Inventory and Characterization Report
Page 4-42 June 2009
waste generators are listed near Orting. Also in Reach 4, the Washington Ecology Drug Lab has an active listing for a waste generator. In Reach 5, an old landfill referred to as the Carbonado dump is located on the top of the steep bluff above the river near Carbonado (TPCHD, 2006). This closed landfill has the potential for release of leachate into the river.
4.4.3.3 Reach Scale Assessment
Carbon River has been divided into eight (8) shoreline reaches (see Table 4-7). This results in a total of 26.3 miles of Carbon River shoreline within County jurisdiction. Reaches are labeled CARB_RV_01 through CARB_RV_08 beginning in the Lower Carbon and moving upstream to its headwaters at the Mount Baker Snoqualmie National Forest. Sections of Carbon River within the Mount Rainier National Park are not included in this inventory.
4.4.3.4 Restoration Opportunities
Restoration opportunities for the Carbon River include actions in the upper river watershed such as: 1) reforestation of riparian areas along the tributaries where timber harvest has removed trees and replanting has not occurred, and 2) decommissioning unused timber roads and culvert removal. Pierce County has applied for funding from the Washington Wildlife and Recreation Coalition to complete acquisition of conservation easements on riparian habitat between Orting and South Prairie (WWRP, 2008).
In 2006, Pierce County purchased 700 acres along the Carbon River to protect a three-mile stretch of old-growth forest and pristine fish and wildlife habitat (Tacoma News Tribune, 2006).
Opportunities in the lower river watershed include: 1) planting of trees in non-vegetated riparian areas, and 2) softening of levees or levee setback projects. The main opportunity for the Carbon River is protection of the existing channel migration zone, in-stream habitat, and water quality.

Pierce County Shoreline Inventory and Characterization Report
Table 4-7. Reach Summary for Carbon River
Reach Number Reach Location
Reach Length (miles)
Land Use Descriptions Modifications Unique Features Riparian Zone
CARB_RV_01 Puyallup River confluence to Orting
0.95 Rural residential, with agricultural lands on the east bank. McCutcheon Road E runs parallel on the east bank.
100% of reach has levees
Active channel is 180 to 230 ft wide.
Riparian Zone is 40 to 100 ft wide.
CARB_RV_02 Orting area 0.73 Mix, urban areas. East river bank is undeveloped, west bank is urban.
20% of reach has levees
Active channel is 220 to 260 ft wide. Orting WWTP lies in this reach.
East slope has 200 ft wide riparian zone. West bank has 50 to 100 ft zone.
CARB_RV_03 Orting to Voight Creek confluence
1.46 Rural residential; East river slope is undeveloped. Foot Hills Trail enters Shoreline in Reach 3.
79% of reach has levees
Active channel is 160 to 560 ft wide (upstream of Bridge Street SE).
East slope has 200 ft wide riparian zone. West is narrower.
CARB_RV_04 From Voight Creek to South Prairie Creek confluence
1.75 Rural residential. Foot Hills Trail along Reach 4. SR 162 crosses Carbon River just upstream of South Prairie Creek confluence.
90% of reach has levees
Active channel varies from 150 to 690 ft wide. Gravel bars and vegetated islands.
Riparian zone is forested both sides.
CARB_RV_05 South Prairie Creek to Evans Creek confluence
12.85 Forest Resource lands. Town of Carbonado. Fairfax Bridge and SR165 (Mowich Lake Road).
17% of reach has levees
High channel sinuosity, channel up to 600 ft wide in lower reach. River enters steep ravine and narrows to 80 ft wide near Carbonado.
Riparian zone is forested on both sides. No cut zone of 200 to 300 feet.
CARB_RV_06 Evans to Tolmie Creek confluence
3.66 Forest resource land uses No levees No aerial photo data.
CARB_RV_07 Tolmie to Cayada Creek 3.86 Forest resource land uses, partly in National Forest land
No levees Carbon River Road runs parallel to river, provides access the National Park
No data.
CARB_RV_08 Upstream of Cayada to National Park
1.02 Forest resource land uses, partly in National Forest land
No levees No data.
June 2009 Page 4-43

Pierce County Shoreline Inventory and Characterization Report
4.4.4 Cayada Creek
4.4.4.1 Physical and Biological Characterization
Drainage Basin, Tributary Streams and Associated Wetlands
Cayada Creek lies within the Upper Carbon River basin (Basin 24). Cayada Creek is a 3.7 mile long tributary to the Carbon River, entering on the right bank (RB) at RM 25.6. There are no mapped wetlands in this shoreline planning area.
Geologic and Flood Hazards
Cayada Creek has its headwaters at Copay Lake, north of the Carbon River, and enters the north side of the Carbon River west of Chenuis Falls. Cayada Creek has steep valley walls that expose intrusive igneous rock. Local deposits of alpine glacial soils are present in the upper portion of Cayada Creek. Flood hazards are currently unmapped for Cayada Creek, but are possible given the creek’s mountainous catchment area. The creek enters an area of identified volcanic hazards near its confluence with the Carbon River.
Critical or Priority Habitat and Species Use
Fish distribution maps (WDFW, 2007b) indicate that Cayada Creek does not provide habitat for any salmonid species. There are no priority habitats associated with Cayada Creek.
Water Quality
According to the 2004 Washington State Water Quality Assessment (Ecology, 2004b), Cayada Creek is not listed for any water quality impairments.
4.4.4.2 Shoreline Use Patterns
Cayada Creek (1 reach) lies outside of the Mount Baker-Snoqualmie National Forest within two County in-holding sections. The creek flows from the Cascade foothills to the north of Mount Rainier. The shoreline planning area surrounding the stream is characterized by forestry resource land use. Gravel timber roads lie within close proximity to the stream. No levees or other significant shoreline modifications are mapped along Cayada Creek.
The County SMP does not provide a Shoreline Environment Designation for Cayada Creek. County zoning and Comprehensive Plan designations show existing land use as 100% Designated Forest Land. Trails within the National Forest provide recreational access to the shoreline. Cultural resources have not been inventoried within the Cayada Creek area.
4.4.4.3 Reach Scale Assessment
Cayada Creek is represented by one (1) reach – CAYA_CR_01. This reach is 1.68-miles long. This stream lies in checkerboard private timber lands internal to the National Forest.
Page 4-44 June 2009

Pierce County Shoreline Inventory and Characterization Report
4.4.4.4 Restoration Opportunities
Restoration opportunities for Cayada Creek include reforestation of riparian areas and decommissioning of gravel timber roads. Also, removal or replacement of failing culverts would serve to protect water quality in the creek.
4.4.5 Chenuis Creek
4.4.5.1 Physical and Biological Characterization
Drainage Basin, Tributary Streams and Associated Wetlands
Chenuis Creek lies within the Upper Carbon River basin and entirely within the Mount Baker- Snoqualmie National Forest. Chenuis Creek is a 6.9-mile long tributary to the Carbon River that enters the Carbon on the RB at RM 27.2. There are no mapped wetlands associated with Chenuis Creek.
Geologic and Flood Hazards
Chenuis Creek flows north through a narrow valley from Chenuis Mountain, and then turns west before joining the Carbon River at Chenuis Falls. Chenuis Creek has steep valley walls that expose both intrusive and extrusive igneous rock. The creek crosses at least one area of Quaternary alluvium. A seismic hazard is associated with the alluvial deposits. Flood hazards are currently unmapped for Chenuis Creek, but are possible given the river’s mountainous catchment area. The creek enters an area of identified volcanic hazards near its confluence with the Carbon River.
Critical or Priority Habitat and Species Use
Fish distribution maps (WDFW, 2007b) indicate that Chenuis Creek does not provide habitat for any salmonid species. Critical habitat has been designated for bull trout within Chenuis Creek (Federal Register, 2005b). According to PHS data, there is no record of priority habitats associated with Chenius Creek (WDFW, 2007a).
Water Quality
According to the 2004 Washington State Water Quality Assessment (Ecology, 2004b), Chenius Creek is not listed for any water quality impairments.
4.4.5.2 Shoreline Use Patterns
Chenuis Creek (1 reach) lies within the Mount Baker-Snoqualmie National Forest. The shoreline planning area surrounding the stream is characterized by forestry resource land use. Gravel timber roads lie within close proximity to the stream. No levees or other significant shoreline modifications are mapped along Chenuis Creek.
June 2009 Page 4-45

Pierce County Shoreline Inventory and Characterization Report
The County SMP does not provide a Shoreline Environment Designation for Chenuis Creek. County zoning and Comprehensive Plan designations show existing land use as 100% Designated Forest Land.
No existing or proposed points of public access occur along the stream; however, trails within the National Forest may provide access. Cultural resources have not been inventoried within the Chenuis Creek planning area.
4.4.5.3 Reach Scale Assessment
Chenuis Creek contains one (1) reach (CHEN_CR_01) that is 6.9 miles long. Chenuis Creek lies entirely within forest resource lands of the National Forest.
4.4.5.4 Restoration Opportunities
Restoration opportunities for Chenuis Creek include reforestation of riparian areas and decommissioning of gravel timber roads. Also, removal or replacement of failing culverts would serve to protect water quality in the creek.
4.4.6 Clarks Creek
4.4.6.1 Physical and Biological Characterization
Drainage Basin, Tributary Streams and Associated Wetlands
Clarks Creek is a tributary to the Puyallup River that lies within the Clear/Clarks Creek basin (Basin 3 in the County Basin Plan). The Clarks Creek basin drains approximately 6.5 square miles, and 39% of the basin lies within the City of Puyallup. Clarks Creek originates in wetlands located south of 96th Street and east of Fruitland Avenue East, and is fed largely by Maplewood Springs. Clarks Creek flows in a generally northwestern direction from Maplewood Springs in the City of Puyallup, through a steep canyon to the Puyallup River floodplain where it passes through the WDFW fish hatchery. Once it has reached the Puyallup River floodplain, Clarks Creek continues north until it joins the Puyallup River at river mile (RM) 5.8 (Pierce County, 2006a).
The major tributaries to Clarks Creek include: Rody Creek, Meeker Ditch, Diru Creek, and Woodland Creek (Pierce County, 2006a). The Rody Creek drainage area is approximately 1.2 square miles and the creek is used by a few coho and steelhead, as well as a large number of chum spawners (Pierce County, 2006a). Meeker Ditch flows within the City of Puyallup and joins Clarks Creek above the developed portion of DeCoursey Park. Diru Creek has a drainage area of 1.3 square miles and the Puyallup Tribe maintains a fish hatchery at the mouth of Diro Creek. It joins with Clarks Creek north of Pioneer Way. The Woodland Creek drainage area is approximately 1.8 acres in size and the majority of the upper channel is a roadside drainage ditch, and other sections of the stream are channelized and piped (Pierce County, 2006a). Woodland Creek joins with Clarks Creek near DeCoursey Park.
Page 4-46 June 2009

Pierce County Shoreline Inventory and Characterization Report
Riparian wetland habitat is mapped along Clarks Creek, upstream of the Burlington Northern railroad crossing. These wetlands are associated with Clarks Creek and cover approximately 3% of the stream’s shoreline planning area.
Geologic and Flood Hazards
Clarks Creek drains northward over a glacial drift plain west of Tacoma, drops down to the flood plain of the Puyallup River, and crosses flat-lying alluvial deposits until connecting with the Puyallup River. The creek passes through areas identified as having landslide, flood, seismic, and volcanic hazards, as well as erosion potential and steep slopes. Clarks Creek lies within an aquifer recharge area.
Flooding occurs frequently within the Clarks Creek basin and has been a concern to the City of Puyallup. One reason for the flooding is the reduced conveyance in the creek channel caused by the non-native, invasive aquatic plant Elodea. There is an annual weed removal program for this species.
Critical or Priority Habitat and Species Use
Clarks Creek provides habitat for coho, fall chum, pink salmon, winter steelhead, and fall Chinook. Fish distribution maps (WDFW, 2007b) indicate that Clarks Creek provides rearing habitat for coho. Fall chum and fall Chinook are supported by a small area of rearing habitat and a large segment of spawning habitat that spans nearly the entire length of the creek (WDFW, 2007b). Pink salmon have a documented presence within Clarks Creek and winter steelhead are supported by spawning habitat within the creek. Critical habitat for these species is discussed below.
Critical habitat for the Puget Sound DPS steelhead has not yet been designated. The Puget Sound/Strait of Georgia ESU coho salmon is a species of concern, and therefore, does not have critical habitat designated. Puget Sound ESU Chinook salmon has critical habitat designated within Clarks Creek (Federal Register, 2005a). The even and odd year ESU pink salmon do not have ESA critical habitat (NOAA, 2007). The Puget Sound/Strait of Georgia ESU chum salmon does not warrant an ESA listing and therefore, does not have critical habitat (NOAA, 2007).
The Clarks Creek basin supports Chinook, coho, and chum salmon; as well as steelhead and cutthroat trout. The Clarks Creek mainstem contains almost the entire spawning and rearing habitat in the basin (Pierce County, 2006a). Excellent spawning and rearing conditions classified as fair to good exist within the 0.5-mile-long reach between Maplewood Springs and Meeker Ditch. Between 1,000 to3,000 chum, 300 to 500 coho, 300 Chinook, and 100 steelhead spawn in this stretch of the stream (Pierce County, 2006a).
There are several hatcheries located on Clarks Creek and its tributaries. The Puyallup Tribe Hatchery is located on Diru Creek near Pioneer Way and produces 400,000 Chinook sub-yearling smolts, 200,000 of which are released into Diru Creek (Pierce County, 2006a). The Puyallup Tribe of Indians Clarks Creek Salmon Hatchery is located at RM 1.0 on Clarks Creek and one of its focus areas is to create an independent and self-sustaining fall and spring Chinook program (Marks et al., 2005). The Puyallup Tribe is constructing another rearing facility on Clarks Creek near its existing hatchery located about a half mile from the mouth of Clarks Creek.
June 2009 Page 4-47

Pierce County Shoreline Inventory and Characterization Report
WDFW also has a hatchery at Maplewood Springs on Clarks Creek. This hatchery primarily raises catchable-size rainbow trout, but also raises Chinook. In addition, about 400,000 to 500,000 steelhead smolts are reared at the WDFW hatchery (Pierce County, 2006a).
Clarks Creek flows through the Lower Puyallup riparian zone, a priority habitat, which provides protection of trout and steelhead habitat.
Instream and Riparian Habitats
Clarks Creek has a narrow riparian corridor within the ravine areas of the basin. Riparian vegetation is dominated by salmonberry, maple and alder (Marks et al., 2005). Downstream of DeCoursey Park in the City of Puyallup, there is hardly any riparian corridor present.
Suitable spawning gravels are present in a 1,600-foot-long section adjacent and below the WDFW Hatchery. This short reach has high quality spawning habitat and thousands of salmon are known to use this area for spawning each year (Pierce County Public Works & Utilities, 2006b). Approximately 3,300 feet of Clarks Creek is classified as pool habitat, and the majority of the stream downstream of the WDFW hatchery is classified as glide habitat (Pierce County, 2006a). Approximately seven pieces of large woody debris (LWD) has been recorded per mile.
Water Quality
According to the 2004 Washington State Water Quality Assessment (Ecology, 2004b), Clarks Creek has two 303(d) listings (Category 5) for water quality impairment: fecal coliform and pH. In addition, Clarks Creek also has one Category 2 listing for dissolved oxygen, and one Category 1 listing for temperature (Ecology, 2004b).
Clarks Creek is overly acidic, a condition caused by excess nutrients. There are three primary potential sources of nutrients: 1) groundwater sources of the base flow for the creek; 2) WDFW Puyallup Hatchery; and 3) the decay of aquatic vegetation (Pierce County, 2006a).
High levels of nitrogen are found in Clarks Creek due to high nitrogen levels present in the groundwater that feeds the creek. The upper reaches of Clarks Creek have been found to have relatively low fecal coliform counts, while the downstream areas (through DeCoursey Park in Puyallup) were found to have a very high level of fecal coliform. The large population of wildlife comprised of ducks and geese in this area are a likely source of the fecal coliform (Pierce County, 2006a). The City of Puyallup has sponsored a pollution reduction study that will lead to a fecal coliform TMDL for the Clarks Creek basin and an associated cleanup action plan.
Ecology and the local advisory group developed a draft TMDL water quality improvement report (WQIR), which was approved by EPA in June 2008 (Hoffman et al., 2008). The implementation strategy section of the WQIR includes a list of items that the advisory committee identified to reduce fecal coliform bacteria and improve water quality. A detailed implementation plan is currently underway.
The Department of Ecology rates Clarks Creek as fishable, but not swimmable, and lists nutrients and pathogen indicators are likely causes of non-attainment (Pierce County, 2006a).
Page 4-48 June 2009

Pierce County Shoreline Inventory and Characterization Report
4.4.6.2 Shoreline Use Patterns
Existing Land and Shoreline Use
Clarks Creek flows generally to the southeast for approximately 2.3 miles, above its confluence with the Puyallup River (in Puyallup River Reach 1). The lower two-thirds of the creek pass through areas with predominantly moderate density single-family residential land use. A vegetated riparian buffer around Clarks Creek is largely maintained throughout the residential areas. The upper third passes through agricultural lands. There are two bridges over Clarks Creek and two lane surface roads parallel portions of the stream.
Shoreline Environment Designations, Zoning, and Other Applicable Regulations
The existing SMP Shoreline Environment Designation of Clarks Creek is rural. Zoning and Comprehensive Plan designations largely follow existing land use and are dominated by Moderate Density Single Family and Agricultural Resource Land.
Existing and Potential Public Access Areas
No parks are provided within the Clarks Creek shoreline in unincorporated Pierce County. A city-owned park, Clarks Creek Park, is located within the city of Puyallup at the upper reaches of the creek. More information on this park can be found in the City of Puyallup Shoreline Inventory & Characterization (ESA Adolfson, 2007).
Historic and Cultural Resources
Cultural resources within the Clarks Creek shoreline planning area include recorded pre-contact materials and campsites. Native American use of the Clarks Creek area, by the Puyallup Tribe, included seasonal hunting and gathering campsites near Clarks Creek. Recorded artifacts include lithic scatters, charcoal deposits, and calcined bones (DAHP, 2007).
Areas of Special Interest
One suspected site of contamination is noted in Clarks Creek. There is an emergency and hazardous chemical report listed for the Amerigas Company in Puyallup.
4.4.6.3 Reach Scale Assessment
Clarks Creek is represented by one (1) reach – CLAR_CR_01. This reach lies immediately outside of the City of Puyallup’s urban growth boundary. This reach is 2.36-miles long.
4.4.6.4 Restoration Opportunities
Restoration of Clarks Creek includes reduction of nutrient input and non-point source pollutants in order to restore water quality in the creek. The Water Quality Improvement Report published by Ecology in 2008 provides implementation measures for restoring water quality in Clarks Creek. In addition, removal of invasive aquatic plants should continue to improve and maintain in-channel habitat.
June 2009 Page 4-49

Pierce County Shoreline Inventory and Characterization Report
Placement of log weirs and in-stream restoration has occurred in the past using U.S. Fish and Wildlife Service grant funds. Partners in the Clarks Creek stream restoration included: Pierce Conservation District, South Puget Sound Salmon Enhancement Group, U.S. Fish and Wildlife Service, City of Puyallup, Puyallup Tribe, and Washington Department of Fish and Wildlife (http://wdfw.wa.gov/fish/chum/viewingchum_clark.htm). The Clarks Creek Initiative Partnership has also focused on restoration of riparian habitat and water quality on the creek. Tree planting and invasive removal has been conducted in the past. In 2009, approximately 100 feet of Woodland Creek will be day-lighted and riparian plantings installed near its confluence with Clarks Creek. A more comprehensive stream restoration project is planned by Pierce County in 2011.
4.4.7 Clearwater River
4.4.7.1 Physical and Biological Characterization
Drainage Basin, Tributary Streams and Associated Wetlands
The Clearwater River is located in the Upper White River basin. The Clearwater River is a large tributary to the White River, and has its origins on Bear Head Mountain. After leaving Bear Head Mountain, the river flows for approximately 10.5 miles until its confluence with the White River at RM 35.3. The upper 5 miles of the river flow through the Mount Baker-Snoqualmie National Forest, and the lower 5.8 miles flow through the White River tree farm which has affected the natural channel morphology of the river, due to timber harvesting and logging roads (Marks et al., 2008). There are several tributaries to the Clearwater River, including Fall, Mineral, Bryon, Lyle and Milky Creeks.
There are no wetlands mapped associated with Clearwater River and this shoreline planning area.
Geologic and Flood Hazards
The Clearwater River flows north from its headwaters north of Frog Mountain, and connects with the White River east of Mud Mountain Lake. The drainage extends through zones of volcanic and volcaniclastic rock, alpine glacial deposits, lahar deposits, and Quaternary talus and alluvium. A seismic hazard is associated with alluvial deposits along the Clearwater River. Flood hazards are identified for approximately the lower half of the river. The river enters an area of identified volcanic hazards near its confluence with the White River.
Critical or Priority Habitat and Species Use
The Clearwater River supports spring Chinook, bull trout/Dolly Varden, coho, pink salmon, and winter steelhead. Fall chum have a potential presence within the river. Fish distribution maps (WDFW, 2007b) indicate that spring Chinook spawning habitat designated within the river. Bull trout/Dolly Varden have a documented presence in the upstream portion of the river where it meets the White River, and a presumed/undetected presence in the lower portion. The Clearwater River provides spawning habitat for coho. Coho and winter steelhead have spawning and rearing habitat designated within the Clearwater River. Critical habitat for these species is discussed below.
Page 4-50 June 2009

Pierce County Shoreline Inventory and Characterization Report
Puget Sound ESU Chinook salmon and the Dolly Varden/bull trout have critical habitat designated within the Clearwater River (Federal Register, 2005a; 2005b).
There are a series of cascades located at RM 4.5 that may serve to impede further upstream migration of the spawning species present within the river. The majority of the spawning within the river occurs in the lower 2 miles (Marks et al., 2005).
The priority habitats present within or along the Clearwater River include the White River elk range and the White River elk winter area, the White River riparian zone, and the Green River-White River harlequin habitat (WDFW, 2007a). In addition, there is one spotted owl site within the river, and another one within 1,400 feet from the river. Two marbled murrelet sites were documented over 2,000 feet from the Clearwater River.
Instream and Riparian Habitats
As stated above, the upper five miles of the Clearwater River pass through the Mount Baker -Snoqualmie National Forest and the lower 5.8 miles flow through the White River tree farm. Logging activities and construction of logging roads have altered the natural morphology of the mainstem along the lower reaches. Riparian vegetation in this area is typically second-growth coniferous forest with active timber harvesting (clearcutting). The upper reaches are characterized by coniferous mid-seral forest. LWD recruitment is overall undersized and hardwood in origin, but present along the mainstem. Channel substrate in the Clearwater River is a combination of cobbles and flat angular stone, with smaller gravel in riffles and side channels (Marks et al. 2005).
Water Quality
According to the 2004 Washington State Water Quality Assessment (Ecology, 2004b), the Clearwater River has one 303(d) listing (Category 5 listing) for water quality impairment for temperature. In addition, the Clearwater River has one Category 2 listing for bioassessment (Ecology, 2004b).
4.4.7.2 Shoreline Use Patterns
The Clearwater River (1 reach) lies both within and outside of the Mount Baker-Snoqualmie National Forest. The shoreline planning area surrounding the stream is characterized by forestry resource land use. There are no paved roadways within the shoreline planning area; although gravel timber roads lie within close proximity to the stream. No levees or other significant shoreline modifications are mapped.
The existing Shoreline Environment Designation of the Clearwater River is Conservancy, where it is mapped. County zoning and Comprehensive Plan designations show existing land use as 100% Designated Forest Land. Public access to the Clearwater River is provided through recreational trails within the National Forest. Trails are also located within the Clearwater Wilderness Area.
June 2009 Page 4-51

Pierce County Shoreline Inventory and Characterization Report
Page 4-52 June 2009
4.4.7.3 Reach Scale Assessment
Clearwater River has been assessed using two designated reaches – CLEA_RV_01 and CLEA_RV_02 for a total of 9.6 miles of shoreline (Table 4-8). Both reaches lie with forest resource land; however, Reach 2 lies almost entirely within National Forest, whereas Reach 1 is within unincorporated Pierce County.
4.4.7.4 Restoration Opportunities
Restoration opportunities for the Clearwater River include placing large wood in the stream, removing forest roads, and re-planting riparian zones where logging has occurred.

Pierce County Shoreline Inventory and Characterization Report
Table 4-8. Reach assessment for Clearwater River
Reach Number Reach Location Reach Length (miles)
Land Use Description Modifications Unique Features Riparian Zone
CLEA_RV_01 Upstream from White River to Milk Creek Confluence
5.33 Forest resource lands, White River tree farm
Logging, sediment transport from logging roads
High channel sinuosity
Riparian zone is forested based upon 2006 aerial photos.
CLEA_RV_02 Upstream from Milk Creek
4.31 Forest resource lands with notable clearcuts and logging in the basin; National Forest lands and partially in Clearwater Wilderness Area.
same Clearcuts and timber harvest in the upper watershed.
Forested riparian zone varies in width due to logging.
June 2009 Page 4-53

Pierce County Shoreline Inventory and Characterization Report
4.4.8 Deer Creek
4.4.8.1 Physical and Biological Characterization
Drainage Basin, Tributary Streams and Associated Wetlands
Deer Creek lies within the Upper Puyallup River basin, which is Basin 22 in the countywide basin plan. Deer Creek is a tributary of the Upper Puyallup River (RM 45.7), located approximately 0.6 miles below Swift Creek. Almost the entire creek flows within the Rainier Timber-Kapowsin tree farm, at which logging roads and timber harvesting have historically impacted portions of the stream (Marks et al., 2005).
No wetlands are mapped in the Deer Creek shoreline planning area.
Geologic and Flood Hazards
Deer Creek flows from a mountainous area west of the South Puyallup River, and connects with the Puyallup River north of its confluence with Swift Creek. Most of the drainage exposes sedimentary rock on steep valley walls. At the confluence with the Puyallup River, the valley floor of Deer Creek consists of alpine glacial and landslide deposits. A seismic hazard is associated with the landslide deposits. Flood hazards are identified for Bear Creek. The creek enters an area of identified volcanic hazards near its confluence with the Puyallup River.
Critical or Priority Habitat and Species Use
Fish distribution maps (WDFW, 2007b) indicate that Deer Creek has a documented presence of fall Chinook and coho. Fall Chinook have spawning habitat designated in Deer Creek. In addition, Dolly Varden/bull trout are supported within the stream. The Puyallup Tribal Fisheries indicate that Deer Creek is part of the surplus adult Chinook and coho planting program and is one of the few streams in late summer and early fall that contains adequate flow to plant adult Chinook (Marks et al., 2005). Surplus adult Chinook are planted in late summer to early fall, and when available, coho is planted in late fall. Deer Creek is listed as having critical habitat for bull trout and Puget Sound ESU Chinook.
In terms of priority habitats, Deer Creek flows through a harlequin duck breeding site toward the middle of the stream. The northern segment of the stream flows into the White River elk range.
Instream and Riparian Habitats
A vegetated buffer zone currently exists along the majority of the creek. The creek is confined by moderate to steep walls and there is a falls located at RM 2.7 which impedes passage (Marks et al., 2005). The lower 1.5 miles of stream has a moderate gradient with numerous pools and substrate that provides for spawning.
Water Quality
According to the 2004 Washington State Water Quality Assessment (Ecology, 2004b), Deer Creek is not listed for any water quality impairments.
Page 4-54 June 2009

Pierce County Shoreline Inventory and Characterization Report
4.4.8.2 Shoreline Use Patterns
Deer Creek lies west of Mount Rainier National Park and outside of the National Forest in County forest resource lands. There are no paved roadways within the shoreline planning area; although gravel timber roads lie within close proximity to the stream. No levees or other significant shoreline modifications are mapped.
The County SMP does not currently provide a Shoreline Environment Designation for Deer Creek. County zoning and Comprehensive Plan designations show existing land use as 100% Designated Forest Land. Trails within the National Forest may provide public access and recreational opportunities.
4.4.8.3 Reach Scale Assessment
Deer Creek has one (1) reach identified – DEER_CR_01. This reach is similar in use and function to other creeks within County forest resource lands.
4.4.8.4 Restoration Opportunities
Restoration opportunities for Deer Creek include decommissioning or repairing logging roads to prevent sedimentation into the stream, planting trees in the riparian zones, and removing failing culverts.
4.4.9 East Fork South Prairie Creek
4.4.9.1 Physical and Biological Characterization
Drainage Basin, Tributary Streams and Associated Wetlands
East Fork South Prairie Creek lies within the South Prairie basin (Basin 7). The East Fork of South Prairie Creek originates from commercial timber lands and the Clearwater National Wilderness Area controlled by the USFS. East Fork is a tributary to South Prairie Creek in its upper watershed. No wetlands are mapped in this shoreline planning area.
Geologic and Flood Hazards
East Fork South Prairie Creek extends from the north side of Pitcher Mountain to its confluence with South Prairie Creek. The drainage is established in dominantly volcanic rock from Mount Rainier. Alluvium and Quaternary landslide deposits occupy the valley floors and localized alpine glacial soils may be present on the ridge tops. A seismic hazard is associated with landslide deposits along the creek. Flood hazards are currently unmapped for the creek, but are possible given the creek’s mountainous catchment area. Landslide hazards are also unmapped, but may exist given the presence of recent landslide deposits. The creek crosses several areas mapped as having erosion potential.
Low-lying wet areas present in the valley floor in the upper reach of East Fork South Prairie Creek indicate possible zones with low infiltration rates and high runoff potential.
June 2009 Page 4-55

Pierce County Shoreline Inventory and Characterization Report
Critical or Priority Habitat and Species Use
Fish distribution maps (WDFW, 2007b) indicate that the East Fork South Prairie Creek does not provide spawning habitat for any salmonid species. The western half of the East Fork of South Prairie Creek flows through the White River elk range, a priority habitat.
Instream and Riparian Habitats
The headwaters of East Fork South Prairie Creek are located on commercial timber lands owned by Weyerhauser, Plum Creek, and Champion Pacific as well as the Clearwater National Wilderness Area regulated by the USFS. Timber harvesting has removed much of the riparian vegetation along the stream corridor and therefore opportunities for substantial LWD recruitment are limited (Kerwin 1999a).
Water Quality
Water quality data specific to the East Fork South Prairie is not available. However water quality information for South Prairie Creek is provided in Section 4.4.36.
4.4.9.2 Shoreline Use Patterns
East Fork South Prairie Creek lies largely within unincorporated County lands, just outside the Mount Baker-Snoqualmie National Forest. Private timber lands are the dominant land use type. There are no paved roadways within the shoreline planning area; although gravel timber roads lie within close proximity to the stream. No levees or other significant shoreline modifications are mapped along the Creek. However, numerous clearcuts are visible on aerial photographs of the basin, indicating that timber harvest has affected sediment transport and infiltration in the basin.
The County SMP does not provide a Shoreline Environment Designation for East Fork South Prairie Creek. Comprehensive Plan designations show existing land use as 100% Designated Forest Land. No public access is provided to East Fork South Prairie Creek.
4.4.9.3 Reach Scale Assessment
East Fork South Prairie Creek is represented by one (1) reach – EFSP_CR_01. This reach is 3.41 miles long.
4.4.9.4 Restoration Opportunities
Decommissioning or repairing logging roads to prevent sedimentation is the primary restoration opportunity for East Fork South Prairie Creek.
Page 4-56 June 2009

Pierce County Shoreline Inventory and Characterization Report
4.4.10 Eleanor Creek
4.4.10.1 Physical and Biological Characterization
Drainage Basin, Tributary Streams and Associated Wetlands
Eleanor Creek is located in the upper reaches of the Upper White River basin within National Forest Lands. Eleanor Creek is a 4.1-mile long tributary to Huckleberry Creek, entering Huckleberry Creek on the LB at RM 3.2.
There are no wetlands mapped in this shoreline planning area.
Geologic and Flood Hazards
Eleanor Creek drains Eleanor Lake on the north side of Mount Rainier and is a tributary of Huckleberry Creek. The creek passes over alpine glacial deposits, Quaternary alluvium, and volcanic rocks. A seismic hazard is associated with the alluvial deposits. Flood hazards are currently unmapped for Eleanor Creek, but are possible given the river’s mountainous catchment area.
Critical or Priority Habitat and Species Use
Fish distribution maps (WDFW, 2007b) indicate that bull trout/Dolly Varden have an undetected presence within the uppermost segment of Eleanor Creek. Critical habitat has not been designated within Eleanor Creek. Anadromous fish are precluded from Eleanor Creek by impassable cascades located near the confluence with Huckleberry Creek.
There are no state priority habitats located within or along Eleanor Creek. There is one spotted owl site located over one mile east of the creek.
Water Quality
According to the 2004 Washington State Water Quality Assessment (Ecology, 2004b), Eleanor Creek has one Category 4A listing for coarse sediment.
4.4.10.2 Shoreline Use Patterns
Eleanor Creek lies entirely within the Mount Baker-Snoqualmie National Forest. The shoreline planning area surrounding the stream is characterized by forestry resource land use. There are no paved roadways within the shoreline planning area; although gravel timber roads lie within close proximity to the stream. No levees or other significant shoreline modifications are mapped.
Due to its location in National Forest lands, the County SMP does not provide a Shoreline Environment Designation for Eleanor Creek. County zoning and Comprehensive Plan designations show existing land use as 100% Designated Forest Land. Trails within the National Forest may provide public access and recreational opportunities to Eleanor Creek.
June 2009 Page 4-57
Pierce County Shoreline Inventory and Characterization Report
4.4.10.3 Reach Scale Assessment
Eleanor Creek is represented by one (1) reach – ELEA_CR_01. This reach is 0.77 miles long. The shoreline reach is generally in natural conditions with minor alterations to shoreline function.
4.4.10.4 Restoration Opportunities
Restoration opportunities identified for Eleanor Creek include decommissioning or repair of logging roads and re-vegetation of riparian zones.
4.4.11 Evans Creek
4.4.11.1 Physical and Biological Characterization
Drainage Basin, Tributary Streams and Associated Wetlands
Evans Creek lies within the Upper Carbon River basin. Evans Creek has its headwaters at the west side of August Peak, and enters the south side of the Carbon River at Upper Fairfax (left bank at RM 18.4). There are no wetlands mapped in this shoreline planning area.
Geologic and Flood Hazards
Evans Creek forms steep valley walls and exposed sedimentary rock in the lower reaches, and intrusive igneous and volcanic rock and volcaniclastic deposits in the upper reaches. Alluvium coats the valley floor, and local alpine glacial deposits are found in the upper reaches. Areas with erosion potential are mapped near the headwaters of the creek. Volcanic hazards and flood hazards are mapped along the lower portion of Evans Creek where it enters the Carbon River valley.
Critical or Priority Habitat and Species Use
Fish distribution maps (WDFW, 2007b) indicate that Evans Creek supports coho. Evans Creek is documented as containing spawning habitat for coho salmon within its lower reach. With respect to priority habitats, Evans Creek flows within the White River elk range, and the northernmost segment of the creek flows within the Carbon River riparian zones.
Instream and Riparian Habitats
Evans Creek flows within the upper reaches of the Carbon River sub-basin (RM 8.5 to the headwaters). Upland land use consists of commercial forestry along this stream, which passes through the Champion Pacific tree farm. Logging roads, erosion, and large storm events have caused impacts to the stream channel (Kerwin 1999a).
Water Quality
According to the 2004 Washington State Water Quality Assessment (Ecology, 2004b), Evans Creek is not listed for any water quality impairments.
Page 4-58 June 2009

Pierce County Shoreline Inventory and Characterization Report
4.4.11.2 Shoreline Use Patterns
Evans Creek lies largely within unincorporated County lands, with only the most upper portion of the creek in the Mount Baker-Snoqualmie National Forest. The shoreline planning area surrounding the stream is characterized by forestry resource land use. There are no paved roadways within the shoreline planning area. No levees or other significant shoreline modifications are mapped along Evans Creek.
The existing Shoreline Environment Designation of Evans Creek is Conservancy, where it is mapped. County zoning and Comprehensive Plan designations show existing land use as 100% Designated Forest Land.
. The U.S. Forest Service currently operates a small campground and picnic area at Evans Creek, with bicycle and motorbike trails. The campground is off SR 165 on Forest Road 7930. The area surrounding Evans Creek within the National Forest area is proposed for an off-road vehicle (ORV) area management plan. An environmental assessment and finding of no significance were completed in March 2009 by the Mount Baker-Snoqualmie National Forest (http://www.fs.fed.us/r6/mbs/projects/evans-creek/index.shtml). This ORV area would include rehabilitation of the existing campground on either side of Evans Creek.
4.4.11.3 Reach Scale Assessment
Evans Creek is represented by one (1) reach – EVAN_CR_01. Evans Creek is 5.70-miles long and is generally in a natural condition with minor alteration to shoreline function.
4.4.11.4 Restoration Opportunities
Restoration opportunities identified for Evans Creek include decommissioning or repair of logging roads and re-vegetation of riparian zones.
4.4.12 Fennel Creek
4.4.12.1 Physical and Biological Characterization
Drainage Basin, Tributary Streams and Associated Wetlands
Fennel Creek is located within the Mid-Puyallup basin, referred to as Basin 23 in the Pierce County Basin Plan. Fennel Creek extends west and south from its headwaters east of the town of Bonney Lake, Washington, and enters the Puyallup River north of the town of McMillin, Washington. Fennel Creek flows for nearly eight miles to its convergence with the Puyallup River at RM 15.5. Victor Falls, a 100-foot high falls, is located at RM 1.9.
Fennel Creek is reported to have the largest network of wetlands in the mid-Puyallup basin, including several large headwater wetlands (Pierce County, 2005b). Within the shoreline planning area, a large riparian wetland system is mapped along the middle portion of Fennel Creek, around the crossing of Rhodes Lake Road East. Aerial photos show this wetland contains forested and pasture areas. Mapped wetlands cover approximately 31 acres (24%) of the Fennel Creek shoreline planning area.
June 2009 Page 4-59

Pierce County Shoreline Inventory and Characterization Report
Fennel Creek is known to have reduced summer baseflows and is listed by the Puget Sound Partnership as a tributary to the Puyallup with low flow issues. This adversely affects salmonid habitat.
Geologic and Flood Hazards
Fennel Creek principally flows across Quaternary lahar deposits, but also crosses alluvium and undifferentiated sedimentary rocks and deposits. Fennel Creek passes through areas with seismic, flood, and volcanic hazards. Steep slope and landslide hazards are associated with the walls of Fennel Creek valley.
Critical or Priority Habitat and Species Use
Fennel Creek supports fall Chinook, coho, fall chum, pink salmon, cutthroat trout and winter steelhead. Fish distribution maps (WDFW, 2007b) indicate that Fennel Creek provides spawning habitat for fall Chinook, coho, fall chum, winter steelhead, and pink salmon. Fennel Creek provides rearing habitat for coho and steelhead. Critical habitat for these species is discussed below.
Critical habitat for the Puget Sound DPS steelhead has not yet been designated. The Puget Sound/Strait of Georgia coho salmon is a species of concern and does not have designated critical habitat. The Puget Sound/Strait of Georgia ESU chum salmon does not warrant an ESA listing and therefore, does not have critical habitat (NOAA Northwest Region, 2007).
The Puyallup Tribal Fisheries indicate that Fennel Creek has approximately two miles of anadromous usage with suitable habitat for Chinook, coho, pink, chum, and steelhead (Marks et al., 2008). Anadromous and migratory fish spawn up to Victor Falls (at RM 1.9). This creek has one of the strongest runs of chum salmon in the Puyallup basin (Pierce County, 2005b). However, steelhead escapement has dropped precipitously over the past decade (Marks et al., 2008). Victor Falls, at RM 1.9, blocks any upstream passage of anadromous fish.
The priority habitats located within or along Fennel Creek include small waterfowl concentration areas; Carbon River open space (UNOS); the Lower Puyallup River riparian zones; and Fennel Creek wetland areas, comprised of an assortment of wetland types (WDFW, 2007a).
Instream and Riparian Habitats
The upper reach of Fennel Creek has pool and riffle habitat as it flows through a broad valley. Abundant LWD can be found within the channel in this reach as well as spawning gravel and deep resting pools. Around Victor Falls, the stream flows through a forested area that consists of a mature hardwood forest with a dense understory of salmonberry and vine maple (Marks et al., 2005). This forested area riparian corridor continues to the confluence with the Puyallup River (Pierce County, 2005b).
Water Quality
The primary water quality issues in the Mid-Puyallup basin are sediment from erosion, elevated temperatures from the lack of riparian vegetation, pollutant discharges from dairy farms, and
Page 4-60 June 2009

Pierce County Shoreline Inventory and Characterization Report
cattle access to the creek (Pierce County, 2005b). Nonpoint pollution results primarily from urban and agricultural runoff. Urban runoff from roadways and areas under construction carry suspended sediments, and residential runoff can carry fecal coliform and nutrients. Runoff from agricultural areas can also carry nutrients and sediments, from soil erosion and fertilizers.
Fennel Creek has had elevated levels of copper in its upper reaches in the past that has exceeded Washington State water quality standards. One potential source of this contamination is algaecide that has been applied to Debra Jane Lake (Pierce County 2005b). Agricultural impacts have also been listed for Fennel Creek. According to the 2004 Washington State Water Quality Assessment (Ecology, 2004b), Fennel Creek is not listed for any water quality impairments.
4.4.12.2 Shoreline Use Patterns
Fennel Creek passes through predominantly rural and agricultural areas. The shoreline planning area surrounding Fennel Creek is characterized largely by rural and agricultural development patterns.
In 2008, the City of Bonney Lake adopted a plan for a future trail along Fennel Creek. The Fennel Creek Trail Plan includes a 6.3-mile multi-use trail running parallel to Fennel Creek within both the city limits of Bonney Lake and in unincorporated Pierce County. This trail would extend from Allan Yorke Park in Bonney Lake to the Foothills Trail in development by Pierce County (City of Bonney Lake, Fennel Creek Trail Plan Final EIS, 2007; http://www.citybonneylake.org/UserFiles/File/Community_Downloads/FennelCreekFEIS031507Final.pdf).
The County SMP does not currently provide a Shoreline Environment Designation for Fennel Creek. Comprehensive Plan designations and implementing zones follow existing land use and include Rural 10, Reserve 5, and Agricultural Resource Lands.
No cultural resources are inventoried within the Fennel Creek area. However seasonal hunting by the Puyallup Tribe could have occurred in the area, and as such there is some potential for the presence of cultural resources.
4.4.12.3 Reach Scale Assessment
Fennel Creek, a tributary to the Puyallup River in the mid-Puyallup basin, is represented by one (1) reach – FEN_CR_01. This 2.41-mile long reach is primarily agricultural in land use. Alterations to water quality and riparian habitat have occurred within this shoreline reach. Large areas of wetland are associated with the Fennel Creek reach.
4.4.12.4 Restoration Opportunities
In 2005, Fennel Creek was considered a medium high priority for restoration projects in the Mid-Puyallup River Basin Plan (Pierce County, 2005b). Existing undersized culverts were replaced with box-culverts in 2007 to reduce flooding at the Sumner-Buckley highway. The restoration project also included wetland enhancement and detention. The Fennel Creek Preservation Group organizes volunteers and collaborates with both Pierce County and the City of Bonney Lake to install native plants in the riparian corridor (http://www.fennelcreek.org/currentnewsletter.pdf).
June 2009 Page 4-61

Pierce County Shoreline Inventory and Characterization Report
4.4.13 Gale Creek
4.4.13.1 Physical and Biological Characterization
Drainage Basin, Tributary Streams and Associated Wetlands
Gale Creek is located in the South Prairie Creek basin (Basin 7). Gale Creek flows northwest from Burnt Mountain and eventually intersects with Wilkeson Creek. Gale Creek is a tributary to Wilkeson Creek with two forks: a West and South Fork. Wilkeson Creek, which flows through the Town of Wilkeson, is sometimes referred to as “Gale Creek” although in this document Gale Creek is considered a 4.8-mile long tributary only.
There are no wetlands mapped in this shoreline planning area.
Geologic and Flood Hazards
The creek crosses over granitic, sedimentary, volcanic, and volcaniclastic rocks, volcaniclastic deposits, alpine glacial deposits, and Quaternary landslide and alluvial deposits. Seismic hazards are associated with isolated landslide and alluvial deposits. Flood hazards are mapped for the lower portion of the drainage. Landslide hazards are also unmapped for the creek, but may exist given the presence of recent landslide deposits. Gale Creek crosses at least one area near its headwaters that is mapped as having erosion potential.
Critical or Priority Habitat and Species Use
Fish distribution maps (WDFW, 2007b) indicate that coho, pink salmon, and winter steelhead have a presumed presence within Gale Creek. Gale Creek flows through several priority habitats, the White River elk range, and the northern reach of the creek, near the fork with Wilkeson Creek, flows within the South Prairie Creek riparian zone.
Water Quality
According to the 2004 Washington State Water Quality Assessment (Ecology, 2004b), Gale Creek is not listed for any water quality impairments.
4.4.13.2 Shoreline Use Patterns
Gale Creek lies in private forest lands outside of the Mount Baker-Snoqualmie National Forest. The shoreline planning area surrounding the stream is characterized by forestry resource land use. No levees or other significant shoreline modifications are mapped along Gale Creek.
The existing Shoreline Environment Designation of Gale Creek is Conservancy, where it is mapped. County zoning and Comprehensive Plan designations show existing land use as 100% Designated Forest Land. The Foothills Trail crosses Gale Creek and provides limited public access to this shoreline planning area. The trail section crosses Gale Creek in the Wilkeson to Carbanado section.
Page 4-62 June 2009

Pierce County Shoreline Inventory and Characterization Report
Cultural resources have not been inventoried within the Gale Creek planning area. No areas of special interest within the shoreline planning have been identified.
4.4.13.3 Reach Scale Assessment
Gale Creek is represented by one (1) reach, labeled GALE_CR_01. This reach is 4.78-miles long and is currently in active timber resource lands.
4.4.13.4 Restoration Opportunities
Restoration opportunities identified for Gale Creek include decommissioning or repair of logging roads to prevent sedimentation into the stream.
4.4.14 George Creek
4.4.14.1 Physical and Biological Characterization
Drainage Basin, Tributary Streams and Associated Wetlands
George Creek lies within the Upper White River basin and is a tributary to the Greenwater River. George Creek drains the north side of Mutton Mountain, flows through a narrow mountain valley, and empties into the Greenwater River. There are no wetlands mapped in this shoreline planning area.
Geologic and Flood Hazards
The creek flows over landslide deposits, alpine glacial deposits, and volcanic rocks. A seismic hazard is associated with landslide deposits along the upper portion of the creek. Flood hazards are currently unmapped for George Creek, but are possible given the creek’s mountainous catchment area. Landslide hazards are also unmapped for the creek, but may exist given the presence of recent landslide deposits.
Critical or Priority Habitat and Species Use
George Creek supports a presence of coho and winter steelhead. In addition, there is an undetected presence of Dolly Varden/bull trout within the stream. Coho have designated spawning within George Creek. Critical habitat for these species is discussed below.
The Puget Sound/Strait of Georgia coho salmon is a species of concern and does not have designated critical habitat. Dolly Varden/bull trout do not have critical habitat designated within George Creek. There are no priority habitats within or along George Creek. There is one spotted owl site approximately 800 feet to the west of the creek.
Water Quality
According to the 2004 Washington State Water Quality Assessment (Ecology, 2004b), George Creek is not listed for any water quality impairments.
June 2009 Page 4-63

Pierce County Shoreline Inventory and Characterization Report
4.4.14.2 Shoreline Use Patterns
George Creek lies largely entirely within the Mount Baker-Snoqualmie National Forest. The shoreline planning area surrounding the stream is characterized by forestry resource land use and recreation. There are no paved roadways, levees or other structures within the shoreline planning area. Gravel timber roads are present.
Due to its location within the National Forest, the County SMP does not currently provide a Shoreline Environment Designation for George Creek. County zoning and Comprehensive Plan designations show existing land use as 100% Designated Forest Land.
No existing or proposed points of public access occur along the stream; however, recreational trails within the National Forest do occur along the Greenwater River. Cultural resources have not been inventoried within the George Creek planning area.
4.4.14.3 Reach Scale Assessment
George Creek, a tributary to the Greenwater River, is represented by one (1) reach – GEOR_CR_01. This 1.33 mile reach is similar to other shoreline stream reaches with the Mount Baker-Snoqualmie Forest that are impaired by timber harvest and logging roads.
4.4.14.4 Restoration Opportunities
Restoration opportunities identified for George Creek include decommissioning or repair of logging roads to prevent sedimentation into the stream, and re-vegetation of riparian areas.
4.4.15 Goat Creek
4.4.15.1 Physical and Biological Characterization
Drainage Basin, Tributary Streams and Associated Wetlands
Goat Creek lies within the Upper White River basin. Goat Creek is a tributary to Silver Creek, which in turn contributes flow to the headwaters of the White River within the Mount Baker –Snoqualmie National Forest. There are no wetlands mapped in this shoreline planning area.
Geologic and Flood Hazards
Goat Creek flows westward from Barnard Saddle northeast of Mount Rainier, and eventually intersects with the White River. The creek flows principally over volcaniclastic rocks until it enters the White River valley where it crosses over Quaternary lahar deposits. Volcanic hazards and flood hazards are identified along the lower reach of Goat Creek approximately 0.5 miles upstream of where it intersects with the White River.
Critical or Priority Habitat and Species Use
Fish distribution maps (WDFW, 2007b) indicate that Goat Creek does not support any salmonid species. There are no priority habitats found within or along Goat Creek, with the exception of
Page 4-64 June 2009

Pierce County Shoreline Inventory and Characterization Report
the White River elk range which is located approximately 800 feet north of the western edge of the creek.
Water Quality
According to the 2004 Washington State Water Quality Assessment (Ecology, 2004b), Goat Creek is not listed for any water quality impairments.
4.4.15.2 Shoreline Use Patterns
Goat Creek lies entirely within the Mount Baker-Snoqualmie National Forest. The shoreline planning area surrounding the stream is characterized by forestry resource land use. There are no paved roadways within the shoreline planning area. No levees or other significant shoreline modifications are mapped.
The County SMP does not currently provide a Shoreline Environment Designation for Goat Creek. County zoning and Comprehensive Plan designations show existing land use as 100% Designated Forest Land.
Recreational opportunities such as hiking are found in the Goat Creek vicinity. Cultural resources have not been inventoried within the Evans Creek planning area. No areas of special interest within the shoreline planning have been identified.
4.4.15.3 Reach Scale Assessment
Goat Creek, a tributary to Silver Creek and the headwaters of the White River, is represented by one (1) reach – GOAT_CR_01. This 1.2 mile stream lies within the Mount Baker-Snoqualmie National Forest and is generally a natural condition.
4.4.15.4 Restoration Opportunities
Restoration opportunities identified for Goat Creek include decommissioning or repair of logging roads to prevent sedimentation into the stream, and revegetation of riparian areas.
4.4.16 Greenwater River
4.4.16.1 Physical and Biological Characterization
Drainage Basin, Tributary Streams and Associated Wetlands
The Greenwater River, a tributary to the White River, has its headwaters on the north side of Castle Mountain and extends to its confluence with the White River west of the town of Greenwater. The Greenwater River flows into the White River at RM 46.
There are no wetlands mapped in this shoreline planning area.
June 2009 Page 4-65

Pierce County Shoreline Inventory and Characterization Report
Geologic and Flood Hazards
The Greenwater River passes through terrain that consists of volcanic and volcaniclastic rocks, volcanic mudflow deposits, landslide deposits, talus, alluvium, and isolated areas of alpine glacial deposits. A seismic hazard is associated with landslide deposits along the upper portion of the river. Flood hazards are identified for the Greenwater River. Landslide hazards are also unmapped for the creek, but may exist given the presence of recent landslide deposits. Volcanic hazards are identified along the lower reach of the Greenwater River approximately four miles upstream of where it intersects with the White River.
Critical or Priority Habitat and Species Use
Greenwater River supports rainbow trout and Dolly Varden/bull trout. In addition, the stream supports a transported presence of spring Chinook, coho, pink salmon, and winter steelhead. Fall chum have a potential presence within the stream. Fish distribution maps (WDFW, 2007b) indicate that Greenwater River provides spawning habitat for spring Chinook and winter steelhead. Dolly Varden/bull trout have a documented presence throughout Greenwater River and fall chum have a potential presence within the river. Coho are supported by spawning and rearing habitat within the river. Critical habitat for these species is discussed below.
Critical habitat for the Puget Sound DPS steelhead has not yet been designated. The Puget Sound/Strait of Georgia coho salmon is a species of concern and does not have designated critical habitat. The even and odd year ESU pink salmon do not have ESA critical habitat. The Puget Sound/Strait of Georgia ESU chum salmon does not warrant an ESA listing and therefore, does not have critical habitat (NOAA, 2007). Puget Sound ESU Chinook salmon and the Dolly Varden/bull trout have critical habitat designated within the Greenwater River (Federal Register, 2005a; 2005b).
The Greenwater River flows through several priority habitats: the White River elk range and the White River elk winter area, the White River riparian corridor, and Green River-White River harlequin duck breeding areas (WDFW, 2007a).
Instream and Riparian Habitats
Most of the lands adjacent to the Greenwater River are USFS owned and are characterized by second-growth coniferous and deciduous forest. The stream is of a low-gradient with an abundant high quality gravel substrate for salmonids. LWD recruitment is low but the woody material that is present is generally mature to old growth (Marks et al., 2005).
Water Quality
According to the 2004 Washington State Water Quality Assessment (Ecology, 2004b), Greenwater River has one Category 4C listing for fish habitat; three Category 4A listing for coarse sediment, fine sediment, and temperature; and two Category 1 listings for dissolved oxygen and pH.
Page 4-66 June 2009

Pierce County Shoreline Inventory and Characterization Report
4.4.16.2 Shoreline Use Patterns
Existing Land and Shoreline Use
The Greenwater River (including five reaches) flows from the Cascade foothills to the west of Mount Rainier to its convergence with the White River. The shoreline planning area surrounding the Greenwater River is characterized largely by forestry resource land use and National Forest. Reaches 4 and 5 of the Upper Puyallup are completely surrounded by forestry land use.
There are minimal paved roadways within the shoreline planning area of the Greenwater River, however the network of forest and timber roads is extensive and commonly passes within proximity of the river.
Shoreline modifications
No levees or other significant shoreline modifications are mapped on the Greenwater River.
Shoreline Environment Designations, Zoning, and Other Applicable Regulations
The existing SMP Shoreline Environment Designation of the Greenwater River is Conservancy, where it is mapped. County zoning and Comprehensive Plan designations largely follow existing land use patterns, and are dominated by Designated Forest Land and National Forest (shown as unknown). The Greenwater River is entirely outside the UGA.
Existing and Potential Public Access Areas
Trails within the Mount Baker-Snoqualmie National Forest provide public access and recreational opportunities on the Greenwater River. Trails to Echo Lake run adjacent to Greenwater River.
Historic and Cultural Resources
Cultural resources within the Greenwater River shoreline planning area include recorded pre-contact materials and campsites; however use of the Greenwater area was less regular than in areas surrounding the Lower Puyallup River basin. Native American use of the Greenwater area, by the Puyallup Tribe, likely was limited to seasonal hunting. Recorded artifacts include lithic scatters, charcoal deposits, and calcined bones, however far fewer artifacts have been recorded in the upper portions of the Puyallup WRIA than in lower portions (DAHP, 2007).
4.4.16.3 Reach Scale Assessment
The Greenwater River, a major tributary to the White River, is represented by five (5) shoreline reaches. These 5 reaches are labeled GREE_RV_01 through GREE_RV_05 in the GIS map folio and are described in Table 4-9. A total of 18.5 miles of river shoreline lies within the County.
June 2009 Page 4-67

Pierce County Shoreline Inventory and Characterization Report
Page 4-68 June 2009
4.4.16.4 Restoration Opportunities
The South Puget Sound Salmon Enhancement Group (SPSSEG) is planning to install LWD on the Greenwater River in 2009 (SPSSEG, 2008). In addition to placement of wood in the river, the Puget Sound Partnership’s Action Agenda also identified removal and decommissioning of USFS roads and floodplain restoration along the Greenwater River as a restoration priority (PSP, 2009).

Pierce County Shoreline Inventory and Characterization Report
Table 4-9. Reach assessment for Greenwater River
Reach Number Reach Location Reach Length (miles)
Land Use Description Modifications Unique Features Riparian Zone
GREE_RV_01 From White River to 28 Mile Creek confluence
4.71 Located in County forest resource lands and National Forest.
Timber harvest and sedimentation from logging roads
Numerous forest roads and road crossings.
No data
GREE_RV_02 From 28 Mile Creek to George Creek confluence
5.07 National Forest Timber harvest and sedimentation from logging roads
Numerous forest roads and road crossings.
No data
GREE_RV_03 From George Creek upstream to Lost Creek
2.59 National Forest Timber harvest and sedimentation from logging roads
Forest riparian zone.
GREE_RV_04 From Lost Creek to Echo Lake
0.81 National Forest Timber harvest and sedimentation from logging roads
Echo Lake is located between Reaches 4 and 5.
Forested riparian zone
GREE_RV_05 Upstream of Echo Lake
5.28 National Forest Timber harvest and sedimentation from logging roads
Upstream of Echo Lake to small lake upstream
Forested riparian zone
June 2009 Page 4-69

Pierce County Shoreline Inventory and Characterization Report
4.4.17 Huckleberry Creek
4.4.17.1 Physical and Biological Characterization
Drainage Basin, Tributary Streams and Associated Wetlands
Huckleberry Creek is a tributary to the Upper White River. It originates from the Huckleberry basin along the north slope of Mount Rainier (Marks et al., 2005). Huckleberry Creek flows through Mount Rainier National Park and Snoqualmie National Forest before flowing into the West Fork of the White River at RM 53.1.
There are no wetlands mapped in this shoreline planning area.
Geologic and Flood Hazards
Huckleberry Creek and its identified tributaries extend from their headwaters north of Sunrise Lodge on Mount Rainier, north to the confluence with the White River. The geology of the drainage is dominated by volcanic-derived rocks. Localized areas of intrusive igneous rocks and alpine glacial soils may be found in the upper reaches. Quaternary alluvium and lahar deposits are identified in the middle and lower reaches of Huckleberry Creek. A seismic hazard is associated with the alluvial deposits. Flood hazards are currently unmapped for Huckleberry Creek. Volcanic hazards are identified along the lower reach of Huckleberry just upstream of where it intersects with the White River.
Critical or Priority Habitat and Species Use
Huckleberry Creek supports coho, spring Chinook, and winter steelhead. These three species have a documented presence within the stream. Huckleberry Creek is presumed to support Dolly Varden/bull trout and fall chum have a potential presence within the stream. Fish distribution maps (WDFW, 2007b) indicate that Huckleberry Creek provides rearing habitat for spring Chinook. Coho and winter steelhead have spawning habitat designated within the stream. Critical habitat has been designated for bull trout within Huckleberry Creek (Federal Register, 2005b). The Puget Sound/Strait of Georgia coho salmon is a species of concern and does not have designated critical habitat.
The Puyallup Tribe operates two ponds for acclimating spring Chinook along the stream. These Chinook are planted in March and released in May or early June (Marks et al., 2005).
In terms of priority habitats, Huckleberry Creek flows through the Green River-White River harlequin habitat, the White River elk range, and the White River elk winter area (WDFW, 2007a).
Instream and Riparian Habitats
The lower 0.3 miles of the stream consist of a somewhat braided channel with a conifer and mixed deciduous riparian zone. This lower reach contains excellent spawning gravel, which consistently supports the highest densities of spawners each year (Marks et al., 2005). From RM 0.5 to 1.5, the riparian zone consists of old growth conifers.
Page 4-70 June 2009

Pierce County Shoreline Inventory and Characterization Report
June 2009 Page 4-71
Water Quality
According to the 2004 Washington State Water Quality Assessment (Ecology, 2004b), Huckleberry Creek has two Category 1 listings for bioassessment and temperature.
4.4.17.2 Shoreline Use Patterns
Huckleberry Creek lies entirely within the Mount Baker-Snoqualmie National Forest. The shoreline planning area surrounding the stream is characterized by forestry resource land use and recreation. There are no paved roadways, levees, or other significant structures within the shoreline planning area.
Because it is in National Forest, the County SMP does not currently provide a Shoreline Environment Designation for Huckleberry Creek. County zoning and Comprehensive Plan designations show existing land use as 100% Designated Forest Land.
Trails in the National Forest occur along Huckleberry Creek providing recreational access. Cultural resources have not been inventoried within the Huckleberry Creek planning area. No areas of special interest within the shoreline planning have been identified.
4.4.17.3 Reach Scale Assessment
Huckleberry Creek, a tributary to the White River, lies entirely within National Forest. This creek is represented by three (3) reaches – HUCK_CR_01 through HUCK_CR_03. These three reaches, which total 7.3 miles of shoreline, are described in Table 4-10.
4.4.17.4 Restoration Opportunities
Restoration opportunities for the shoreline of Huckleberry Creek include decommissioning or repairing logging roads and replanting the riparian zone with native trees. Road decommissioning in the Huckleberry Creek floodplain has been identified as a priority project for WRIA 10 salmon recovery planning (Pierce County Lead Entity, 2008a, 2008b).

Pierce County Shoreline Inventory and Characterization Report
Table 4-10. Reach assessment for Huckleberry Creek
Reach Number Reach Location Reach Length (miles)
Land Use Description Modifications Unique Features Riparian Zone
HUCK_CR_01 Confluence with White River upstream to Eleanor Creek
3.66 National Forest Lands Timber harvest, culverts and logging roads
Unknown Forested cover in the riparian zone varies with timber harvest.
HUCK_CR_02 Eleanor Creek to Lost Creek confluence
2.70 National Forest Lands same same Forested cover in the riparian zone varies with timber harvest.
HUCK_CR_03 Upstream of Lost Creek
0.92 National Forest Lands same same No data
Page 4-72 June 2009

Pierce County Shoreline Inventory and Characterization Report
4.4.18 Hylebos Creek
4.4.18.1 Physical and Biological Characterization
Processes and Channel Modifications
Process modifications to Hylebos Creek have been extensive. Modifications are primarily associated with rapid and significant urbanization throughout the drainage basin and the conversion of the mouth of the Hylebos into the Hylebos Waterway (Kerwin, 1999a). Key modifications to riverine processes within Hylebos Creek include:
• Significant increase in flow volume and decrease in time to peak of flows (i.e., precipitation is conveyed to channels more quickly) due to increases in impervious surface and decrease in wetland area;
• Physical modification to the channel, including installation of culverts or other potential barriers;
• Removal of in-channel LWD;
• Removal of floodplain forest;
• Industrial land uses, including land fills have likely reduced water quality; and
• Filling of tide flats, restricting the estuarine portion of the system to within a constructed waterway.
Drainage Basin, Tributary Streams and Associated Wetlands
The Hylebos Creek sub-basin consists of approximately 18,361 acres of land, 25 miles of streams, 11 named lakes and numerous wetlands. Hylebos Creek flows directly into the Hylebos Waterway in Commencement Bay. The two major tributaries of Hylebos Creek, the West and East Forks, originate in King County. The two forks are on the west and east sides of Interstate 5 and join together south of the King/Pierce County border, east of I-5 (Pierce County, 2006c).
Approximately 62 acres (34%) of the Hylebos Creek shoreline planning area is mapped as wetland. A large wetland is present immediately upstream of the I-5 crossing of Hylebos Creek. The County’s basin plan describes this as a large floodplain wetland that was rated as a Category 2 wetland under the County’s old critical areas regulations. Category 2 wetlands under the old regulations were typically those with significant habitat and diverse vegetation classes (Pierce County, 2006c). This large wetland is formed in historic pasturelands that are now covered with reed canarygrass. This area is important for stormwater storage and floods up to several feet deep during the wet winter months.
Wetland restoration efforts are ongoing along several reaches of Hylebos Creek near the Pierce County shoreline planning areas. For example, estuarine wetland restoration is occurring at the Mowitch site, located where the stream enters Hylebos Waterway after crossing under Marine View Drive. The Spring Valley restoration project, which includes wetland and stream channel restoration, is ongoing farther upstream, where South 373rd Street crosses Hylebos Creek.
June 2009 Page 4-73

Pierce County Shoreline Inventory and Characterization Report
Geologic Hazards
Hylebos Creek drains southward over a glacial drift plain west of Tacoma, drops down to the flood plain of the Puyallup River, and crosses flat-lying alluvial and peat deposits until connecting with the Puyallup River. The creek passes through areas identified as having landslide, flood, seismic, and volcanic hazards, as well as erosion potential and steep slopes. Hylebos Creek is within an aquifer recharge area.
Flood Hazards
The Federal Emergency Management Agency (FEMA) has prepared Flood Insurance Rate Maps (FIRMs) that include Hylebos Creek. These maps were adopted on December 1, 1983 (Community Mapping Series 530148). These maps indicate that an elevation of 9.0 (feet NGVD 29) has been established for flooding in the waterway, and in the portion of Hylebos Creek in the City of Tacoma. In general, this elevation does not extend outside the banks of the creek. The same elevation is also used within the waterways. However, in the revised FEMA maps currently being developed and reviewed, this reach of Hylebos Creek is included within the area with the 1% chance flow associated with the Puyallup River (NHC, 2005).
Other flooding in the Hylebos has been described in the Hylebos Browns-Dash Point Basin Plan (Pierce County, 2006c). These issues appear to be primarily associated with urban runoff and undersized culverts, or other physical channel modifications.
Critical or Priority Habitat and Species Use
Hylebos Creek supports coho, fall chum, winter steelhead, and fall Chinook, and is presumed to support pink salmon. Chinook, chum, coho, pink salmon, and steelhead have all been observed spawning within Hylebos Creek (Marks et al., 2005); however, fish distribution data does not indicate that spawning habitat has been designated for these species (WDFW, 2007b). Critical habitat for these species is discussed below.
Critical habitat for the Puget Sound DPS steelhead has not yet been designated. The Puget Sound/Strait of Georgia coho salmon is a species of concern and does not have designated critical habitat. The even and odd year ESU pink salmon do not have ESA critical habitat. The Puget Sound/Strait of Georgia ESU chum salmon does not warrant an ESA listing and therefore, does not have critical habitat (NOAA, 2007). Puget Sound ESU Chinook salmon has designated critical habitat within Hylebos Creek (Federal Register, 2005a).
The Puyallup Tribe releases between 10 and 20 thousand juvenile fall Chinook into the creek and fish are planted in a large man-made pond located on the north fork of the creek (Marks et al., 2005).
Hylebos Creek flows within the Lower Puyallup riparian zone, a priority habitat, and through the Commencement Bay tributary wetlands. In addition, the stream flows through the urban natural open space, comprised of the Hylebos waterway bluff area, an area of steep slopes and bluffs overlooking Commencement Bay (WDFW, 2007a).
Page 4-74 June 2009

Pierce County Shoreline Inventory and Characterization Report
Instream and Riparian Habitats
The stream channel above and below the bridge at 373rd Street is somewhat incised and the riparian vegetation consists of turf grass, reed canary grass, and alder (Marks et al., 2005). The substrate is very compacted with large amounts of fine material and some areas of smaller gravel.
Habitat conditions along lower Hylebos Creek have been described as generally degraded due to the loss of natural floodplain because of channel confinement and encroachment by adjacent land uses and by revetments and levees (Pierce County, 2006c). There are no known major impediments to fish passage within the reaches of the stream within unincorporated Pierce County. There is an almost total lack of functional LWD within the Hylebos Creek system. Since the 1990’s, the non-profit group Friends of the Hylebos has completed several restoration projects along Hylebos Creek (as well as the associated Hylebos wetlands) to improve habitat and revegetate riparian habitat with native species (Friends of the Hylebos 2007).
Water Quality
According to the 2004 Washington State Water Quality Assessment (Ecology, 2004b), Hylebos Creek has one 303(d) listing (Category 5 listing) for impaired water quality for fecal coliform. In addition, Hylebos Creek has one Category 2 listing for dissolved oxygen and the West Fork has one Category 1 listing for temperature.
There is little additional information available to speak to water quality within the larger Hylebos Browns-Dash Point basin. The most recent available data is from a study conducted in 1991-1993 by the Tacoma-Pierce County Health Department, which found that samples within Hylebos Creek exceeded “action limits” for copper, zinc, lead and arsenic (Pierce County, 2006c).
The Clean Water Act Section 305(b) Report published by Ecology in 1992 indicated that Hylebos Creek, along with the White and Puyallup rivers, had water quality impairments due to high fecal coliform counts. One of the sources for this water quality impairment was discharge by municipalities and industries (Ecology, et al., 1995b). There are a total of 44 individual NPDES permits that discharge to the watershed, and in addition to these, there are 28 general permits that allow discharge to surface water within the larger watershed. Additional sources of impairment listed in the report include pasture lands, animal-management areas, manure lagoons and removal of riparian corridors (Ecology, et al., 1995b).
4.4.18.2 Shoreline Use Patterns
Existing Land and Shoreline Use
Land use near Hylebos Creek shoreline area is dominated by moderate density single family residential and vacant parcels. A small area of commercial development occurs at the southeast extent of the reach. This reach is broken by a small area within the City of Fife.
June 2009 Page 4-75

Pierce County Shoreline Inventory and Characterization Report
Shoreline modifications
Shoreline modifications associated with residential uses are prevalent in the Hylebos Creek reach shoreline area. Analysis of 2006 aerial photography shows that the reach has been channelized throughout the majority of its length within the reach, with several single lane bridges providing access to private residences.
Shoreline Environment Designations, Zoning, and Other Applicable Regulations
Currently, there is no Shoreline Environment Designation for Hylebos Creek within unincorporated Pierce County. Zoning and Comprehensive Plan designations reflect existing land use, with Moderate Single Family the primary zoning. The reach is within the UGA.
Existing and Potential Public Access Areas
There is one park that provides public access to the Hylebos Creek shoreline near the planning area: the Lower Hylebos Nature Park. Existing amenities at the Lower Hylebos Nature Park, owned and operated by the City of Fife and located adjacent to the stream’s shoreline planning area within the County, include passive nature and wildlife viewing opportunities. The City of Fife is in the process of completing restoration activity within the park, however upon completion will provide access, via walking trails, to the stream.
Historic and Cultural Resources
No cultural resources are inventoried within the Hylebos Creek area. However seasonal activity, including gathering of shellfish and use of seasonal camps, by the Puyallup Tribe could have occurred in the area, and as such there is some potential for the presence of cultural resources. The century long history of land use and development within the Lower Hylebos area has likely disturbed or buried cultural resources that exist, however activities that excavate below levels of previous disturbance could encounter cultural resources.
4.4.18.3 Reach Scale Assessment
Hylebos Creek, a tributary to draining directly to Commencement Bay, is represented by one reach (HYLE_CR_01) in unincorporated Pierce County.
4.4.18.4 Restoration Opportunities
Many restoration projects have been undertaken in the Hylebos watershed. The Friends of the Hylebos Wetlands, Pierce Conservation District, NOAA, and local governments have performed invasive vegetation control, planting of native species, culvert replacement, and placement of log structures at several locations. The Lower Hylebos Marsh Project is located downstream of the Pierce County shoreline planning reach; it involved creating new off-channel marsh habitat on an abandoned log sorting yard (Friends of Hylebos Wetlands, undated).
The Hylebos -Browns-Dash Point Basin Plan (Pierce County, 2006c) includes restoration of the Hylebos Creek stream channel and floodplain as a high priority.
Page 4-76 June 2009

Pierce County Shoreline Inventory and Characterization Report
4.4.19 Kapowsin Creek
4.4.19.1 Physical and Biological Characterization
Drainage Basin, Tributary Streams and Associated Wetlands
Kapowsin Creek is a tributary to the Puyallup River. This creek flows into and out of Kapowsin Lake, approximately 3.2 miles upstream from its confluence with the Puyallup River. Kapowsin Creek Reach 1 is downstream of Kapowsin Lake and Reach 2 is upstream of the lake.
Approximately 22 acres (12%) of the Kapowsin Creek shoreline planning area is mapped as wetland. Several riparian wetlands, containing forested and disturbed habitats, are mapped along Kapowsin Creek downstream of Kapowsin Lake. A large, mostly forested wetland complex is present along the stream just north of the lake. This wetland system extends along the lake shore (see discussion of Lake Kapowsin below). Based upon aerial photographs, it appears that wetlands also occur upstream of the lake within the Kapowsin Creek shoreline planning area.
Geologic and Flood Hazards
Kapowsin Creek flows north out of the north end of Kapowsin Lake to its confluence with the Puyallup River southwest of the Forest Lake area. The creek flows through terrain that principally consists of alluvium, volcanic mudflow, and glacial deposits. Locally, intrusive igneous and sedimentary bedrock are found exposed along the river valley sidewalls below the glacial soils. The creek passes through areas identified as having flood, seismic, and volcanic hazards, as well as erosion potential.
Critical or Priority Habitat and Species Use
Kapowsin Creek supports coho, fall Chinook, fall chum, pink salmon, and winter steelhead. In addition, it is presumed to support bull trout/Dolly Varden. Fish distribution maps (WDFW, 2007b) indicate that Kapowsin Creek provides spawning habitat for fall Chinook, fall chum, coho, and winter steelhead. The stream also provides rearing habitat for coho and pink salmon. Critical habitat for these species is discussed below. Priority habitats located within or along Kapowsin Creek include the Kapowsin Creek riparian corridor; the Upper Puyallup River wetlands, a mix of riverine, scrub-shrub, emergent and forested wetlands associated with the creek; the Little Puyallup River riparian zone; the White River elk range; the Kapowsin Lake wetlands; small and large waterfowl concentration areas; and open space (WDFW, 2007a).
Instream and Riparian Habitats
There is suitable spawning gravel throughout the entire stretch of the creek; however, much of it is patchy in nature (Marks et al., 2005). There is an abundance of downed trees within the stream channel along with several logjams which serve to create complexity. Cattle have access to the stream near RM 1.7 and there are homes and outbuildings within 20 to 40 feet of the banks of the creek (Marks et al., 2005). The majority of the stream has a dense riparian zone characterized by firs, alders and salmonberry.
June 2009 Page 4-77

Pierce County Shoreline Inventory and Characterization Report
Page 4-78 June 2009
Water Quality
According to the 2004 Washington State Water Quality Assessment (Ecology, 2004b), Kapowsin Creek is not listed for any water quality impairments.
4.4.19.2 Shoreline Use Patterns
Existing Land and Shoreline Use
Kapowsin Creek (Reaches 1 and 2) passes through predominantly rural, agricultural areas, and forestry resource lands. . There are no bridges over Kapowsin Creek; however two lane surface roads do parallel portions of the stream. Orville Road East runs to the west of Kapowsin Creek and Kapowsin Lake.
The existing SMP Shoreline Environment Designation of Kapowsin Creek is Rural, Conservancy, and Natural for Reach 1 and Conservancy for Reach 2. Zoning and Comprehensive Plan designations largely follow existing land use and are dominated by Rural 10 and Rural 20, Agricultural Resource Land, and Designated Forest Land.
No cultural resources are inventoried within the Kapowsin Creek area. However seasonal hunting by the Puyallup Tribe could have occurred in the area, and as such there is some potential for the presence of cultural resources associated with Kapowsin Lake.
4.4.19.3 Reach Scale Assessment
Kapowsin Creek, a tributary to the Puyallup River in the mid-Puyallup basin, is represented by two (2) reaches – KAPO_CR_01 and KAPO_CR_02. The reaches are described in Table 4-11. A total of 3.95 miles of shoreline lies within the County.
4.4.19.4 Restoration Opportunities
Restoration opportunities for Kapowsin Creek include fencing livestock areas to prevent access to the stream, and revegetating riparian areas.

Pierce County Shoreline Inventory and Characterization Report
Table 4-11. Reach assessment for Kapowsin Creek.
Reach Number Reach Location Reach Length (miles)
Land Use Description Modifications Unique Features Riparian Zone
KAPO_CR_01 From Puyallup River upstream to Lake Kapowsin
3.34 Rural, agricultural, forestry. Passes under Orville Road E. Outlet of Kapowsin Lake.
No levees, alterations from timber harvest
Near Electron Facility, PSE transmission lines cross this reach.
Dense forested riparian zone; some previously logged
KAPO_CR_02 Upstream of Lake Kapowsin
0.61 Rural, agricultural, forestry resource lands; Kapowsin Camp No.7 Market Road runs along north bank of creek in managed forest lands.
Alterations from culvert crossings and clearcut harvest
Upper extent of WRIA 10 watershed
Dense forested riparian zone to previously logged.
June 2009 Page 4-79

Pierce County Shoreline Inventory and Characterization Report
4.4.20 Kings Creek
4.4.20.1 Physical and Biological Characterization
Drainage Basin, Tributary Streams and Associated Wetlands
Kings Creek lies within the Mid-Puyallup basin. Kings Creek is a small tributary of the Puyallup River, flowing from the area west of Cowling Ridge and entering the Puyallup north of the Electron Reservoir. There are no wetlands mapped in this shoreline planning area.
Geologic and Flood Hazards
Kings Creek flows from Cowling Ridge above, down the glacial outwash channel margin, across a channel terrace before entering the Puyallup. Volcaniclastic rock is exposed along the steep sided glacial channel margin, and alpine and continental glacial soils are present in the channel terrace. The creek crosses over Quaternary alluvium near its confluence with the Puyallup River. Much of Kings Creek is within a flood hazard area. Discrete portions of the creek are within areas identified as having erosion potential. Seismic and volcanic hazards are identified for the creek near its confluence with the Puyallup River.
Critical or Priority Habitat and Species Use
Kings Creek supports coho salmon. Fish distribution maps (WDFW, 2007b) indicate that coho have a documented presence within Kings Creek. The Puget Sound/Strait of Georgia coho salmon is a species of concern and does not have designated critical habitat.
Kings Creek flows through two priority habitats: the larger White River elk range and the Little Puyallup River riparian zone. In addition, there are two bald eagle nests and a wetland located approximately 4,000 feet southwest of the creek.
Instream and Riparian Habitats
There is no information available on in-stream and riparian habitats for Kings Creek.
Water Quality
According to the 2004 Washington State Water Quality Assessment (Ecology, 2004b), King Creek has one 303(d) listing (Category 5 listing) for temperature.
4.4.20.2 Shoreline Use Patterns
Kings Creek lies within forest resource lands of unincorporated Pierce County. There are no paved roadways within the shoreline planning area. No levees or other significant shoreline modifications are mapped.
The County SMP does not currently provide a Shoreline Environment Designation for Kings Creek. County zoning and Comprehensive Plan designations show existing land use as 100% Designated Forest Land. The stream’s planning area is entirely outside the UGA.
Page 4-80 June 2009

Pierce County Shoreline Inventory and Characterization Report
No existing or proposed points of public access occur along the stream. Cultural resources have not been inventoried within the Kings Creek planning area.
4.4.20.3 Reach Scale Assessment
Kings Creek, a minor tributary to the Puyallup River, is presented as one (1) reach. This reach is labeled KING_CR_01.
4.4.20.4 Restoration Opportunities
Restoration opportunities for Kings Creek include decommissioning or repairing logging roads to prevent sedimentation, replanting riparian areas with native trees, and removing failing culverts.
4.4.21 Lost Creek - Greenwater
4.4.21.1 Physical and Biological Characterization
Drainage Basin, Tributary Streams and Associated Wetlands
Lost Creek lies within the Upper White River basin. Lost Creek (Greenwater) drains Quinn Lake to the northeast of Mutton Mountain, flows through a narrow mountain valley, and empties into the Greenwater River. There are no wetlands mapped in this shoreline planning area.
Geologic and Flood Hazards
Lost Creek (Greenwater) flows principally over volcanic rocks; however, Quaternary landside deposits are also identified in its upper reaches. A seismic hazard is associated with landslide deposits along the creek. Flood hazards are currently unmapped for Lost Creek, but are possible given the creek’s mountainous catchment area. Landslide hazards are also unmapped for the creek, but may exist given the presence of recent landslide deposits.
Critical or Priority Habitat and Species Use
Fish distribution maps (WDFW, 2007b) indicate an undetected presence of Dolly Varden/bull trout along the Greenwater River up to the confluence with Lost Creek (Greenwater). There are no priority habitats within or along Lost Creek (Greenwater); however, there is a northern goshawk site located approximately 275 feet northwest of the lower end of the stream.
Water Quality
According to the 2004 Washington State Water Quality Assessment (Ecology, 2004b), Lost Creek (Greenwater) is not listed for any water quality impairments.
4.4.21.2 Shoreline Use Patterns
Lost Creek (Greenwater) lies entirely within the Mount Baker-Snoqualmie National Forest. The shoreline planning area surrounding the stream is characterized by forestry resource land use.
June 2009 Page 4-81

Pierce County Shoreline Inventory and Characterization Report
There are no paved roadways within the shoreline planning area; however, gravel timber roads are present. No levees or other significant shoreline modifications are mapped along Lost Creek.
The County SMP does not provide a Shoreline Environment Designation for Lost Creek (Greenwater). County zoning and Comprehensive Plan designations show existing land use as 100% Designated Forest Land.
Recreational trails within the National Forest provide access to Lost Creek. Cultural resources have not been inventoried within the Lost Creek (Greenwater) planning area. No areas of special interest within the shoreline planning have been identified.
4.4.21.3 Reach Scale Assessment
Lost Creek (Greenwater), a tributary to Greenwater River, lies entirely within National Forest. This creek is 2.38 miles long and is represented by one (1) reach – LOST_GR_CR_01). This reach is generally in natural condition, except for timber harvest.
4.4.21.4 Restoration Opportunities
Restoration opportunities for Lost Creek (Greenwater) include decommissioning or repairing logging roads to prevent sedimentation, and replanting riparian areas with native trees.
4.4.22 Lost Creek - Huckleberry
4.4.22.1 Physical and Biological Characterization
Drainage Basin, Tributary Streams and Associated Wetlands
Lost Creek (Huckleberry) also lies within the Upper White River basin. Lost Creek (Huckleberry) drains Lower Palisades Lake on the north side of Mount Rainier and is a tributary of Huckleberry Creek. There are no wetlands mapped in this shoreline planning area.
Geologic and Flood Hazards
Lost Creek (Huckleberry) passes over granitic and volcanic rocks, landslide deposits, and Quaternary alluvium. A seismic hazard is associated with the landslide deposits. Flood hazards are currently unmapped for Lost Creek, but are possible given the river’s mountainous catchment area. Landslide hazards are also unmapped for the creek, but may exist given the presence of recent landslide deposits.
Critical or Priority Habitat and Species Use
Fish distribution maps (WDFW, 2007b) indicate that Lost Creek has an undocumented presence of Dolly Varden/bull trout. The adjacent Huckleberry Creek has a documented presence of Dolly Varden/bull trout. Huckleberry Creek also provides habitat for spawning coho as far as the confluence with Lost Creek.
Page 4-82 June 2009

Pierce County Shoreline Inventory and Characterization Report
There are no priority habitats within or along Lost Creek. The White River elk range extends along a portion of Huckleberry Creek from the White River, located to the east. This priority habitat ends before the confluence of Huckleberry Creek and Lost Creek.
Water Quality
According to the 2004 Washington State Water Quality Assessment (Ecology, 2004b), Lost Creek (Huckleberry) is not listed for any water quality impairments.
4.4.22.2 Shoreline Use Patterns
Lost Creek-Huckleberry lies entirely within the Mount Baker-Snoqualmie National Forest. The shoreline planning area surrounding the stream is characterized by forestry resource land use. There are no paved roadways, levees, or other modifications.
The County SMP does not provide a Shoreline Environment Designation for Lost Creek-Huckleberry. County zoning and Comprehensive Plan designations show existing land use as 100% Designated Forest Land.
Trails within the National Forest may provide recreational access to the public. Cultural resources have not been inventoried within the planning area. No areas of special interest within the shoreline planning have been identified.
4.4.22.3 Reach Scale Assessment
Lost Creek-Huckleberry, a tributary to Huckleberry Creek, lies entirely within National Forest. This creek is represented by one (1) reach – LOST_HC_CR_01). This reach is generally in natural condition.
4.4.22.4 Restoration Opportunities
Restoration opportunities for Lost Creek (Huckleberry) include decommissioning or repairing logging roads to prevent sedimentation, and replanting riparian areas with native trees.
4.4.23 Maggie Creek
4.4.23.1 Physical and Biological Characterization
Drainage Basin, Tributary Streams and Associated Wetlands
Maggie Creek lies within the Upper White River basin. Maggie Creek is a tributary of the Greenwater River. There are no wetlands mapped in this shoreline planning area.
Geologic and Flood Hazards
Maggie Creek drains the steep slopes north of Louisiana Saddle, courses through a narrow mountain valley, and empties into the Greenwater River. The creek flows over volcaniclastic and volcanic rocks, as well as minor alluvial deposits. A seismic hazard is identified for the alluvial deposits situated in the upper reach of Maggie Creek. The creek is not currently
June 2009 Page 4-83

Pierce County Shoreline Inventory and Characterization Report
identified as a flood hazard area, but flooding is possible given the creek’s mountainous catchment area.
Critical or Priority Habitat and Species Use
Fish distribution maps (WDFW, 2007b) indicate that Maggie Creek does not support any salmonid species. No priority habitats are located along or within Maggie Creek.
Water Quality
According to the 2004 Washington State Water Quality Assessment (Ecology, 2004b), Maggie Creek is not listed for any water quality impairments.
4.4.23.2 Shoreline Use Patterns
Maggie Creek lies entirely within the Mount Baker-Snoqualmie National Forest and the Norse Peak Wilderness. Trails within the Norse Peak Wilderness provide public access to Maggie Creek. The shoreline planning area surrounding the stream is characterized by forestry resource land use. There are no paved roadways or other structures within the shoreline planning area.
The County SMP does not provide a Shoreline Environment Designation for Maggie Creek. County zoning and Comprehensive Plan designations show existing land use as Designated Forest Land.
4.4.23.3 Reach Scale Assessment
Maggie Creek, a minor tributary to the Greenwater River, is represented by one (1) reach – MAGG_CR_01. This 0.44 mile reach is generally in a natural condition.
4.4.23.4 Restoration Opportunities
Restoration opportunities for Maggie Creek include decommissioning or repairing logging roads to prevent sedimentation, and replanting riparian areas with native trees.
4.4.24 Meadow Creek
4.4.24.1 Physical and Biological Characterization
Drainage Basin, Tributary Streams and Associated Wetlands
Meadow Creek lies within the Upper Puyallup basin. Meadow Creek is a tributary to the Mowich River, where it enters at RM 3.9. Meadow Creek is 4.6 miles in length and originates from Eunice Lake, located within Mount Rainier National Park (Marks et al., 2005). The creek has one tributary, Hayden Creek, at RM 2.5. There are no wetlands mapped in this shoreline planning area.
Page 4-84 June 2009

Pierce County Shoreline Inventory and Characterization Report
Geologic and Flood Hazards
Meadow Creek drains the slopes southwest of Virginia Peak and connects with the Mowich River. The creek flows over volcanic and volcaniclastic rocks and deposits, alpine glacial deposits, and Quaternary alluvium. The creek crosses though areas identified as having flood, volcanic, and seismic hazards. Erosion potential is identified along the upper portion of the creek.
Critical or Priority Habitat and Species Use
Fish distribution maps (WDFW, 2007b) indicate that Meadow Creek supports coho with a documented, transported presence. The creek is located above the Electron diversion dam, which has prevented salmon and steelhead from accessing the stream (Marks et al., 2005).
The western portion of Meadow Creek flows through the White River elk range, a priority habitat. A northern goshawk site has been recorded approximately 2,000 feet south of the stream.
Instream and Riparian Habitats
The lower mile of the creek has a low to moderate gradient, with pools and riffles present, as well as abundant spawning gravel, LWD, and riparian cover along the entire length of the stream. Several pieces of LWD as well as log jams have created significant complexity through the lower reach of the stream (Marks et al., 2005).
Water Quality
According to the 2004 Washington State Water Quality Assessment (Ecology, 2004b), Meadow Creek is not listed for any water quality impairments.
4.4.24.2 Shoreline Use Patterns
Meadow Creek lies entirely within the Mount Baker-Snoqualmie National Forest. The shoreline planning area surrounding the stream is characterized by forestry resource land use and recreation. The County SMP does not provide a Shoreline Environment Designation for Meadow Creek. County zoning and Comprehensive Plan designations show existing land use as 100% Designated Forest Land. Trails within the National Forest may provide recreational opportunities on Meadow Creek. Cultural resources have not been inventoried within the Meadow Creek planning area.
4.4.24.3 Reach Scale Assessment
Meadow Creek, a tributary to the Greenwater River, is represented by one (1) reach.
4.4.24.4 Restoration Opportunities
Restoration opportunities for Meadow Creek include decommissioning or repairing logging roads to prevent sedimentation, replanting riparian areas with native trees, and removing failing culverts.
June 2009 Page 4-85

Pierce County Shoreline Inventory and Characterization Report
4.4.25 Milky Creek
4.4.25.1 Physical and Biological Characterization
Drainage Basin, Tributary Streams and Associated Wetlands
Milky Creek lies within the Upper White River basin. Milky Creek is a tributary of the Clearwater River. There are no wetlands mapped in this shoreline planning area.
Geologic and Flood Hazards
Milky Creek flows northwards from the north flank of Frog Mountain and connects with the Clearwater River. The creek flows principally over volcanic rock, but also traverses an area of alpine glacial deposits. The creek is not currently identified as a flood hazard area, but flooding is possible given the creek’s mountainous catchment area.
Critical or Priority Habitat and Species Use
Fish distribution maps (WDFW, 2007b) indicate that Milky Creek does not support any salmonid species. Milky Creek flows through the White River elk range, a priority habitat.
Water Quality
According to the 2004 Washington State Water Quality Assessment (Ecology, 2004b), Milky Creek has one 303(d) listing (Category 5 listing) for temperature.
4.4.25.2 Shoreline Use Patterns
Milky Creek is located outside and to the north of the Mount Baker-Snoqualmie National Forest. The shoreline planning area surrounding the stream is characterized by forestry resource land use and recreation. The existing Shoreline Environment Designation of Milky Creek is Conservancy. County zoning and Comprehensive Plan designations show existing land use as 100% Designated Forest Land.
No existing or proposed points of public access occur along the stream. Cultural resources have not been inventoried within the Milky Creek planning area.
4.4.25.3 Reach Scale Assessment
Milky Creek, a tributary to Clearwater Creek, is represented by one (1) reach – MILK_CR_01.
4.4.25.4 Restoration Opportunities
Restoration opportunities for Milky Creek include decommissioning or repairing logging roads to prevent sedimentation, and replanting riparian areas with native trees.
Page 4-86 June 2009

Pierce County Shoreline Inventory and Characterization Report
4.4.26 Mowich River
4.4.26.1 Physical and Biological Characterization
Drainage Basin, Tributary Streams and Associated Wetlands
The Mowich River lies within the Upper Puyallup basin and joins the Puyallup River at RM 42.3. The Mowich River originates in glacier headwaters from the Edmunds, and the North and South Mowich glaciers on the west slope of Mount Rainier (Marks et al., 2005). The north and south Mowich forks flow through Mount Rainier National Park and converge at RM 7.5 to form the mainstem of the Mowich River. Major tributaries to Mowich River include Crater, Spray, Meadow, and Rushingwater Creeks (Marks et al., 2005). There are no wetlands mapped in this shoreline planning area.
Geologic and Flood Hazards
The Mowich River extends from the west flank of Mount Rainier and flows generally westward to its confluence with the Puyallup River. The upper reaches of the Mowich River drainage cross over volcanic and volcaniclastic rock. Sedimentary rock, alpine glacial deposits, and lahar deposits are exposed in the lower reaches. Alluvial deposits occupy the Mowich River valley floor. Flood, volcanic, and seismic hazards are identified along the Mowich River.
Critical or Priority Habitat and Species Use
The Mowich River supports bull trout/Dolly Varden, coho, and fall Chinook. Fish distribution maps (WDFW, 2007b) indicate that bull trout/Dolly Varden and coho have a documented presence within Mowich River. The Mowich River provides a small segment of spawning habitat for fall Chinook, near the Rushingwater Creek fork (WDFW, 2007b). Critical habitat for these species is discussed below.
The Puget Sound/Strait of Georgia coho salmon is a species of concern and does not have designated critical habitat. Puget Sound ESU Chinook salmon and the Dolly Varden/bull trout have critical habitat designated within the Mowich River (Federal Register, 2005a; 2005b). A fish ladder, the Electron fish ladder, located at RM 41.7 was completed in the fall of 2000 and has restored anadromous fish passage through the river. There is also a natural acclimation pond on the Mowich River, located at RM 1.0, which is used for rearing fall Chinook (Marks et al., 2005). The first spawning of naturally returning Chinook in 97 years was documented by the Puyallup Tribe in September 2001 (Marks et al., 2008).
The Mowich River flows through the White River elk range, a priority habitat.
Instream and Riparian Habitats
The upper four to five miles of the Mowich River flow along steep and moderate gradients with a channel substrate characterized by large cobble and boulders. The riparian vegetation along the active reaches of the Mowich River generally consists of mixed coniferous-deciduous forest. The central reach flows through the Snoqualmie National Forest (RM 6.5 to 3.1) where the stream gradient decreases and more spawning gravel substrate is available. The lower three
June 2009 Page 4-87

Pierce County Shoreline Inventory and Characterization Report
Page 4-88 June 2009
miles of the river pass through the Rainier Timber-Kapowsin tree farm (Campbell Group LLC). The riparian corridor becomes confined along this reach, although spawning substrate remains present (Marks et al., 2005).
Water Quality
According to the 2004 Washington State Water Quality Assessment (Ecology, 2004b), the Mowich River is not listed for any water quality impairments.
4.4.26.2 Shoreline Use Patterns
Mowich River is located outside of the National Forest and to the west of the Mount Rainier National Park. The shoreline planning area surrounding the stream is characterized by forestry resource land use and recreation. There are no paved roadways within the shoreline planning area; however, gravel timber roads are present.
The existing SMP Shoreline Environment Designation of the Mowich River is Conservancy, where mapped. Reach 1 and the lower portion of Reach 2 are designated as Conservancy, while the upper portions of Reach 2 (and all of Reach 3) have not been designated. County zoning and Comprehensive Plan designations show existing land use as 100% Designated Forest Land. This creek is entirely outside of the County’s UGA.
No existing or proposed points of public access occur along the stream. Cultural resources have not been inventoried within the Mowich River planning area.
4.4.26.3 Reach Scale Assessment
Mowich River, a tributary to the Puyallup, in the Upper Puyallup basin, is divided into three (3) shoreline reaches for a total of 6.7 miles. The reaches are named MOW_RV_01 through MOW_RV_03 and are described in Table 4-12.
4.4.26.4 Restoration Opportunities
Restoration priorities for the Mowich River include improvements to in-stream habitat and recovery of salmonid populations. The tribal restoration goal for the Mowich River and Puyallup basin is to rebuild depressed stocks of Chinook and recover historic levels of this species. Due to its location on forest resource lands, restoration opportunities along the river specifically include decommissioning or repairing logging roads to prevent sedimentation, replanting riparian areas with native trees, and removing failing culverts.

Pierce County Shoreline Inventory and Characterization Report
Table 4-12. Reach assessment for the Mowich River
Reach Number Reach Location Reach Length (miles)
Land Use Descriptions Modifications Unique Features Riparian Zone
MOW_RV_01 From the Upper Puyallup to Rushingwater Creek confluence
0.89 Forest resource lands, commercial timber harvest
Timber cutting, logging road increase sediment transport
Not visible on aerial photographs; riparian zones appear to have been logged
MOW_RV_02 From Rushingwater Creek confluence to Meadow Creek
4.33 Forest resource lands, commercial timber harvest. Mowich Lake Road lies 0.6 mile to the north.
same Mt. Baker Snoqualmie National Forest on north bank.
Clear-cuts visible in aerial photos indicating recent logging
MOW_RV_03 Upstream of Meadow Creek to Mt. Rainier National Park Boundary
1.47 Forest resource lands, commercial timber harvest
same Second growth forest in this reach.
June 2009 Page 4-89

Pierce County Shoreline Inventory and Characterization Report
4.4.27 Neisson Creek
4.4.27.1 Physical and Biological Characterization
Drainage Basin, Tributary Streams and Associated Wetlands
Neisson Creek is a tributary to the Upper Puyallup River. Neisson Creek flows north from a mountainous area west of Deer Creek, and enters the Puyallup River north of the confluence with the Mowich River. There are no wetlands mapped in this shoreline planning area.
Geologic and Flood Hazards
The upper reach of Neisson Creek flows through steep-walled exposures of faulted and folded sedimentary bedrock, with localized exposures of intrusive igneous rock. The valley floor in the lower reach of Neisson Creek consists of alpine glacial soils overlain by lahar deposits. Steep valley walls expose sedimentary rock. Seismic and volcanic hazards are identified near the confluence of Neisson Creek with the Puyallup River. The creek is not currently identified as a flood hazard area, but flooding is possible given the creek’s mountainous catchment area. Areas of erosion potential occur within a few hundred feet of the creek.
Low-lying wet areas present in the valley floor in the upper reach of Neisson Creek indicate possible zones with low infiltration rates and high runoff potential.
Critical or Priority Habitat and Species Use
Neisson Creek supports bull trout/Dolly Varden, coho, winter steelhead, coho, and fall Chinook. Fish distribution maps (WDFW, 2007b) indicate that upper section of Neisson Creek, near its junction with the Puyallup River, has a documented presence of bull trout/Dolly Varden and the lower section has a presumed presence. Spawning habitat within the upper section of the creek supports coho and winter steelhead. Fall Chinook have a small area of spawning habitat within Neisson Creek (WDFW, 2007b). Critical habitat for these species is discussed below.
Critical habitat for the Puget Sound DPS steelhead has not yet been designated. The Puget Sound/Strait of Georgia coho salmon is a species of concern and does not have designated critical habitat. Puget Sound ESU Chinook salmon and the Dolly Varden/bull trout do not have critical habitat designated within Neisson Creek (Federal Register 2005a; 2005b).
Steelhead have been observed spawning within the creek, and naturally returning coho have been observed as well. The natural returns are a result of live adult plantings and juvenile acclimation projects carried out by the Puyallup Tribal Fisheries Department (Marks et al., 2005).
There are is one priority habitat within proximity to Neisson Creek: the White River elk range (WDFW, 2007a).
Page 4-90 June 2009

Pierce County Shoreline Inventory and Characterization Report
Instream and Riparian Habitats
The stream contains pool and riffle habitat as well as excellent spawning gravel. The riparian zone consists of conifers and alders with moderate amounts of woody debris (Marks et al., 2005). Due to timber harvest activities, the riparian zone has been reduced to the state-required minimum along several stretches of the lower creek.
Water Quality
According to the 2004 Washington State Water Quality Assessment (Ecology, 2004b), Neisson Creek is not listed for any water quality impairments.
4.4.27.2 Shoreline Use Patterns
Neisson Creek is located outside of the National Forest and to the west of the Mount Rainier National Park. The shoreline planning area surrounding the stream is characterized by forestry resource land use. There are no paved roadways within the shoreline planning area; however, gravel timber roads are present. No levees or other significant shoreline modifications are mapped.
The existing SMP Shoreline Environment Designation of Neisson Creek is Conservancy, where it is mapped. County zoning and Comprehensive Plan designations follow existing land use patterns (93% Designated Forest Land).
No existing or proposed points of public access occur along the stream.
4.4.27.3 Reach Scale Assessment
Neisson Creek, a tributary to the Puyallup River, in its upper basin, is represented by one (1) shoreline reach – NEIS_CR_01.
4.4.27.4 Restoration Opportunities
Restoration opportunities for Neisson Creek include decommissioning or repairing logging roads to prevent sedimentation, replanting riparian areas with native trees, and removing failing culverts.
4.4.28 North Puyallup River
4.4.28.1 Physical and Biological Characterization
Drainage Basin, Tributary Streams and Associated Wetlands
The North Puyallup River lies within the Upper Puyallup River basin. The North Puyallup River drains the Puyallup Glacier on Mount Rainier and flows generally west approximately five miles before its confluence with the South Puyallup River. There are no wetlands mapped in this shoreline planning area.
June 2009 Page 4-91

Pierce County Shoreline Inventory and Characterization Report
Geologic and Flood Hazards
The North Puyallup River traverses volcanic rocks, lahar deposits, alpine glacial deposits, and Quaternary alluvium. Hazards identified for the river include seismic, flood, and volcanic.
Critical or Priority Habitat and Species Use
Fish distribution maps (WDFW, 2007b) indicate that the North Puyallup River has the potential to support bull trout/Dolly Varden. Critical habitat has been designated for bull trout within the Puyallup River (Federal Register, 2005b). The western end of the North Puyallup River flows through the White River elk range, a priority habitat.
Instream and Riparian Habitats
The North Puyallup River is in the Upper Puyallup River sub-basin, which is upstream of the PSE Electron Powerhouse (near RM 31). Land ownership along this reach is typically that of private commercial timber companies and U.S. Forest Service. Timber harvesting is active in the second-growth forests of the private timber properties adjacent to the North Puyallup River. Road construction associated with logging has significantly affected this portion of the river, with little recruitment of LWD. A portion of the North Puyallup River flows through Mount Rainer National Park and is bordered by old growth forest. This reach receives some old growth LWD but high stream gradients and boulders generally break these into smaller fragments which decrease their function for stream and wildlife habitat. The majority of the riparian forested habitat is a plantation type consisting of Douglas-fir and western hemlock with hardwoods along the streambanks. Channel substrate is generally cobbles and boulders with limited pockets of spawning gravel for salmonids. Although this portion of the Puyallup River is not directly impacted by residential development, sediment and runoff from road construction and maintenance activities associated with logging continue to be of concern (Kerwin 1999a).
Water Quality
According to the 2004 Washington State Water Quality Assessment (Ecology, 2004b), the North Puyallup River is not listed for any water quality impairments.
4.4.28.2 Shoreline Use Patterns
North Puyallup River lies largely within unincorporated County lands, just outside the Mount Baker-Snoqualmie National Forest. Private timber lands are the dominant land use type. There are no paved roadways within the shoreline planning area; although gravel timber roads lie within close proximity to the stream. No levees or other significant shoreline modifications are mapped along the river.
There is no existing current Shoreline Environment Designation in the County’s SMP for the North Puyallup River. County zoning and Comprehensive Plan designations follow existing land use patterns (100% Designated Forest Land).
Page 4-92 June 2009

Pierce County Shoreline Inventory and Characterization Report
Due to the forest resource land use in private timber, no existing or proposed points of public access occur along the stream. Cultural resources have not been inventoried within the river planning area.
4.4.28.3 Reach Scale Assessment
North Puyallup River, a tributary to the upper reaches of the Puyallup River, is represented by one (1) shoreline reach – NOPU_RV_01.
4.4.28.4 Restoration Opportunities
Restoration opportunities for the North Puyallup River include decommissioning or repairing logging roads to prevent sedimentation, replanting riparian areas with native trees, and removing failing culverts.
4.4.29 Ohop Creek - Kapowsin
4.4.29.1 Physical and Biological Characterization
Drainage Basin, Tributary Streams and Associated Wetlands
Ohop Creek- Kapowsin is the main feeder stream to Lake Kapowsin. The creek flows west then turns to the north to Lake Kapowsin. This creek lies in WRIA 10 (Puyallup) at the southwestern boundary of the watershed. Ohop Lake and Ohop Creek (Nisqually) while physically located nearby to the south/southwest are actually within another watershed – WRIA 11 (Nisqually River). The watershed divide occurs between the two creeks named Ohop.
There are no wetlands mapped in this shoreline planning area.
Geologic and Flood Hazards
Ohop Creek extends from its headwaters east of Ohop, Washington, west and north to the south side of Kapowsin Lake. The creek then flows southwest from Kapowsin Lake to the Nisqually River. Ohop Creek passes over volcaniclastic rocks and sediments, alpine glacial and continental ice-sheet deposits, lahar deposits and Quaternary peat and alluvium. Identified hazards include flood, seismic, and volcanic. Areas with erosion potential are also identified.
Critical or Priority Habitat and Species Use
Ohop Creek supports coho and is presumed to support winter steelhead. Fish distribution maps (WDFW, 2007b) indicate that Ohop Creek provides spawning habitat for coho. Coho are the only species surveyed for on a consistent basis. Steelhead have not been observed in several years (Marks et al., 2005). Critical habitat for these species is discussed below.
Critical habitat for the Puget Sound DPS steelhead has not yet been designated. The Puget Sound/Strait of Georgia coho salmon is a species of concern and does not have designated critical habitat.
June 2009 Page 4-93

Pierce County Shoreline Inventory and Characterization Report
Ohop Creek is located within several priority habitat areas: the Kapowsin Creek riparian corridor, a small waterfowl concentration area, the Kapowsin Lake wetlands; and the White River elk range.
Instream and Riparian Habitats
From RM 6.5 to 7.0, the stream is a low gradient pool-riffle system containing excellent spawning gravel, as well as several deep pools and moderate amounts of instream woody debris. The overstory riparian vegetation is dense and consists of cedar, fir, alder, and maple along the lower 1.5 miles of the stream. The upper reaches of Ohop Creek flow through a portion of the Rainier Timber-Kapowsin tree farm (Campbell Group LLC), where logging roads and timber harvesting have caused impacts to the stream (Marks et al. 2005).
Water Quality
According to the 2004 Washington State Water Quality Assessment (Ecology, 2004b), Ohop Creek is not listed for any water quality impairments.
4.4.29.2 Shoreline Use Patterns
Ohop Creek - Kapowsin lies largely within unincorporated County lands in forest resource use. There are no paved roadways within the shoreline planning area; although gravel timber roads lie within close proximity to the stream. No levees or other significant shoreline modifications are mapped along the creek.
The existing SMP Shoreline Environment designation of Ohop Creek is Conservancy. County zoning and Comprehensive Plan designations follow existing land use patterns (99% Designated Forest Land). The creek’s planning area is entirely outside the UGA.
Due to the forest resource land use in private timber, no existing or proposed points of public access occur along the stream. Cultural resources have not been inventoried within the creek’s planning area. However, seasonal hunting by the Puyallup Tribe could have occurred in the area, and as such there is limited potential for the presence of cultural resources. No areas of special interest within planning area have been identified.
4.4.29.3 Reach Scale Assessment
Ohop Creek – Kapowsin is a tributary to Kapowsin Lake. This shoreline is represented by one (1) reach labeled OHOP_KAP_CR_01.
4.4.29.4 Restoration Opportunities
Restoration opportunities for Ohop Creek – Kapowsin include decommissioning or repairing logging roads to prevent sedimentation, replanting riparian areas with native trees, and removing failing culverts.
Page 4-94 June 2009

Pierce County Shoreline Inventory and Characterization Report
4.4.30 Page Creek
4.4.30.1 Physical and Biological Characterization
Drainage Basin, Tributary Streams and Associated Wetlands
Page Creek is an approximately two-mile long tributary to South Prairie Creek. There are no wetlands mapped in this shoreline planning area. The creek lies within active timber lands outside of the National Forest.
Geologic and Flood Hazards
Page Creek extends from its headwaters south of Long Mountain to its confluence with South Prairie Creek. Mudflow deposits are present in the valley floor. Sedimentary and volcaniclastic rocks are exposed on the valley sidewalls, and are overlain by alpine glacial deposits. Flood hazards are identified for the full extent of Page Creek. Erosion potential exists along about a 0.7-mile stretch in the middle portion of Page Creek.
Low-lying wet areas present in the valley floor in the upper reach of Page Creek indicate possible zones with low infiltration rates and high runoff potential.
Critical or Priority Habitat and Species Use
Fish distribution maps (WDFW, 2007b) indicate that Page Creek supports coho and winter steelhead. Coho has spawning habitat designated within the stream.
There are two priority habitats associated with Page Creek: the White River elk range, and the South Prairie Creek riparian corridor.
Water Quality
According to the 2004 Washington State Water Quality Assessment (Ecology, 2004b), Page Creek is not listed for any water quality impairments.
4.4.30.2 Shoreline Use Patterns
Page Creek lies within unincorporated County lands in forest resource and rural uses. No levees or other significant shoreline modifications are mapped along the creek. However, several logging roads cross the creek including Grand Coulee Maintenance Road. Also BPA transmission lines parallel and cross the stream near its confluence with South Prairie Creek.
The existing Shoreline Environment Designation of Page Creek is Conservancy. County zoning and Comprehensive Plan designations follow existing land use patterns (95% Designated Forest Land). The stream’s planning area is entirely outside the UGA.
No existing or proposed points of public access occur along the stream. Cultural resources have not been inventoried within the creek’s planning area. However, seasonal hunting by the Puyallup Tribe could have occurred in the area, and as such there is limited potential for the
June 2009 Page 4-95

Pierce County Shoreline Inventory and Characterization Report
presence of cultural resources. No areas of special interest within planning area have been identified.
4.4.30.3 Reach Scale Assessment
Page Creek, a tributary to South Prairie Creek, is represented by one (1) reach – PAGE_CR_01. Little information is known about this creek.
4.4.30.4 Restoration Opportunities
Restoration opportunities for Page Creek are to decommission or repair logging roads to prevent sedimentation into the stream.
4.4.31 Pinochle Creek
4.4.31.1 Physical and Biological Characterization
Drainage Basin, Tributary Streams and Associated Wetlands
Pinochle Creek is a tributary of the West Fork of the White River. Pinochle Creek originates from the mountainous terrain north of Mount Rainier. The Creek has two small tributary streams: Wrong and Cripple Creeks. There are no wetlands mapped in this shoreline planning area.
Geologic and Flood Hazards
Pinochle Creek drains the slopes adjacent to Frog Mountain north of Mount Rainier and eventually intersects with Viola Creek. The creek passes over undifferentiated volcaniclastic rocks and deposits. No hazards are currently identified for Pinochle Creek; however flood hazards probably exist given the creek’s mountainous catchment.
Critical or Priority Habitat and Species Use
Fish distribution maps (WDFW, 2007b) indicate that Pinochle Creek supports spring Chinook, coho, and winter steelhead. In addition, the stream has a presumed presence of Dolly Varden/bull trout. Both spring Chinook and coho have spawning habitat designated within the stream, and winter steelhead have rearing habitat designated. Critical habitat has been designated for Puget Sound ESU Chinook salmon. The Puyallup Tribal Fisheries report that large numbers of coho are observed each season in two large pools just below the confluence with Cripple and Wrong Creeks. There is an acclimation pond on Cripple Creek and returning Chinook are likely a result of the pond (Marks et al., 2005).
The eastern half of Pinochle Creek flows through the White River elk range, a state priority habitat area.
Page 4-96 June 2009

Pierce County Shoreline Inventory and Characterization Report
Instream and Riparian Habitats
The stream is characterized as low gradient and unconfined with abundant woody debris from the surrounding old growth forest (Marks et al., 2005). There is a falls located within the stream that blocks upstream migration, and below it, there is excellent spawning and rearing habitat.
Water Quality
According to the 2004 Washington State Water Quality Assessment (Ecology, 2004b), Pinochle Creek is not listed for any water quality impairments.
4.4.31.2 Shoreline Use Patterns
Pinochle Creek lies entirely within the Mount Baker-Snoqualmie National Forest. There are no paved roadways within the shoreline planning area; although gravel timber roads lie within close proximity to the stream. No levees or other significant shoreline modifications are mapped along the creek.
There are no Shoreline Environment Designations for Pinochle Creek in the County’s SMP. County zoning and Comprehensive Plan designations follow existing land use patterns (100% Designated Forest Land).
Recreational trails within the National Forest provide public access to this area. Cultural resources have not been inventoried within the creek’s planning area.
4.4.31.3 Reach Scale Assessment
Pinochle Creek, a tributary to West Fork White River, is represented by one (1) reach – PINO_CR_01. This reach has few alterations and is generally in natural condition.
4.4.31.4 Restoration Opportunities
Restoration opportunities for Pinochle Creek include decommissioning or repairing logging roads to prevent sedimentation, and replanting riparian areas with native trees.
4.4.32 Rushingwater Creek
4.4.32.1 Physical and Biological Characterization
Processes and Channel Modifications
Drainage Basin, Tributary Streams and Associated Wetlands
Rushingwater Creek originates from the Golden Lakes in Mount Rainier National Park, and flows over 5 miles to its confluence with the Mowich River at RM 0.6 (Marks et al., 2005). The majority of the stream flows through the Rainier Timber-Kapowsin tree farm, which has impacted several sections of the stream.
There are no wetlands mapped in this shoreline planning area.
June 2009 Page 4-97
Pierce County Shoreline Inventory and Characterization Report
Geologic and Flood Hazards
Rushingwater Creek enters the Mowich River east of the confluence with the Puyallup River. Rushingwater Creek flows west from Golden Lakes to its confluence with the Mowich River, east of the Puyallup River. The creek passes over volcanic and sedimentary rocks, alpine glacial drift, and minor alluvium. Identified hazards along the creek include seismic and volcanic. Areas of erosion potential are also present. The creek is not currently identified as a flood hazard area, but flooding is possible given the creek’s mountainous catchment area.
Critical or Priority Habitat and Species Use
Rushingwater Creek supports coho and fall Chinook. Fish distribution maps indicate that fall Chinook spawning habitat is provided in the segment closest to the fork with the Mowich River. Critical habitat for these species is discussed below.
The Puget Sound/Strait of Georgia coho salmon is a species of concern and does not have designated critical habitat. The Puget Sound ESU Chinook has critical habitat designated within Rushingwater Creek. There is an acclimation pond located just off the main channel of Rushingwater Creek at RM 0.6, and there are 40,000 to 100,000 coho yearlings released from Rushingwater each year (Marks et al., 2005).
With respect to priority habitats and species use along or within the stream, the western half of Rushingwater Creek flows through the White River elk range, a priority habitat, and approximately 2,000 feet south of the creek, a northern goshawk has been sighted.
Instream and Riparian Habitats
The stream’s upper reach has pool and glide habitat, with fine and medium-sized substrate. There is abundant instream woody debris and moderate to dense canopy cover throughout the majority of the upper reach (Marks et al., 2005). In addition, there are many beaver structures present in this reach. The lower reach of the stream, approximately 1.0 mile in length, consists of a riffle-pool complex, and the substrate is dominated by large gravel, cobble and boulders (Marks et al., 2005). Lands adjacent to Rushingwater Creek belong to the Rainier Timber-Kapowsin tree farm (Cambpell Group LLC). Logging roads and timber harvesting activities have impacted several areas of the stream (Marks et al., 2005).
Water Quality
According to the 2004 Washington State Water Quality Assessment (Ecology, 2004b), Rushingwater Creek is not listed for any water quality impairments.
4.4.32.2 Shoreline Use Patterns
Rushingwater Creek lies within unincorporated County lands in forest resource uses. No levees or other significant shoreline modifications are mapped along the creek.
The existing Shoreline Environment Designation of Rushingwater Creek is Conservancy, where it is mapped. The upstream portion of the planning areas has not been designated by the County.
Page 4-98 June 2009

Pierce County Shoreline Inventory and Characterization Report
County zoning and Comprehensive Plan designations follow existing land use patterns (100% Designated Forest Land). No existing or proposed points of public access occur along the stream. Rushingwater Creek joins Mowich River just outside of the National Park boundaries.
4.4.32.3 Reach Scale Assessment
Rushingwater Creek, a tributary to Mowich River, is represented by one (1) reach. This reach is labeled RUSH_CR_01.
4.4.32.4 Restoration Opportunities
Restoration opportunities for Rushingwater Creek include decommissioning or repairing logging roads to prevent sedimentation, replanting riparian areas with native trees, and removing failing culverts.
4.4.33 Saint Andrews Creek
4.4.33.1 Physical and Biological Characterization
Drainage Basin, Tributary Streams and Associated Wetlands
Saint Andrews Creek is a small tributary stream to the South Puyallup River. There are no wetlands mapped in this shoreline planning area.
Geologic and Flood Hazards
Saint Andrews Creek west flows along the south side of Klapatche Ridge, from the area between the Puyallup and Tahoma Glaciers on Mount Rainier. It eventually connects with the South Puyallup River. Saint Andrews Creek crosses volcanic rocks, volcaniclastic sediments and rocks, and Quaternary alluvium. Identified hazards along the creek include seismic and volcanic. Areas of erosion potential are also present. The creek is not currently identified as a flood hazard area, but flooding is possible given the creek’s mountainous catchment area.
Critical or Priority Habitat and Species Use
Fish distribution maps (WDFW, 2007b) indicate that there is a documented presence of bull trout/Dolly Varden within Saint Andrews Creek. Critical habitat has been designated within Saint Andrews Creek for bull trout (Federal Register, 2005b).
There are no priority habitats associated with Saint Andrews Creek; however, there was one spotted owl site recorded approximately 2,000 feet to the southeast of the creek.
Water Quality
According to the 2004 Washington State Water Quality Assessment (Ecology, 2004b), Saint Andrews Creek is not listed for any water quality impairments.
June 2009 Page 4-99

Pierce County Shoreline Inventory and Characterization Report
4.4.33.2 Shoreline Use Patterns
Saint Andrews Creek lies within unincorporated County lands in forest resource uses. No levees or other significant shoreline modifications are mapped along the creek.
There is no existing SMP Shoreline Environment Designation for Saint Andrews Creek. County zoning and Comprehensive Plan designations follow existing land use patterns (100% Designated Forest Land). The stream’s planning area is entirely outside the UGA.
4.4.33.3 Reach Scale Assessment
Saint Andrews Creek, a tributary to South Puyallup River, lies at the western boundary of Mount Rainier National Park. This creek is represented by one (1) reach labeled STAN_CR_01.
4.4.33.4 Restoration Opportunities
Restoration opportunities for Saint Andrews Creek include decommissioning or repairing logging roads to prevent sedimentation, replanting riparian areas with native trees, and removing failing culverts.
4.4.34 Silver Creek
4.4.34.1 Physical and Biological Characterization
Drainage Basin, Tributary Streams and Associated Wetlands
Silver Creek is a tributary to the White River. Silver Creek has one tributary stream: Elizabeth Creek. There are no wetlands mapped in this shoreline planning area.
Geologic and Flood Hazards
Silver Creek flows from headwaters in the area east of Crystal Mountain north to its confluence with the White River. The drainage crosses over terrain consisting of volcanic and volcaniclastic rocks, Quaternary lahar deposits, and landslide deposits. Seismic hazards are associated with landslide deposits along Silver Creek. Flood hazards are identified along the creek. Volcanic hazards are identified along the lower reach of Goat Creek approximately 0.5 miles upstream of where it intersects with the White River. Landslide hazards are also unmapped for the creek, but may exist given the presence of recent landslide deposits.
Critical or Priority Habitat and Species Use
Fish distribution maps (WDFW, 2007b) indicate that Silver Creek supports Dolly Varden/bull trout. There is a small stretch of Silver Creek in which rearing habitat exists for this species. Critical habitat has been designated for bull trout within Silver Creek (Federal Register, 2005b).
Water Quality
According to the 2004 Washington State Water Quality Assessment (Ecology, 2004b), Silver Creek is not listed for any water quality impairments.
Page 4-100 June 2009

Pierce County Shoreline Inventory and Characterization Report
4.4.34.2 Shoreline Use Patterns
Silver Creek lies entirely within the Mount Baker-Snoqualmie National Forest. The shoreline planning area surrounding the stream is characterized by forestry resource land use and recreation. There are no paved roadways within the shoreline planning area; however, gravel timber roads are present. No levees or other significant shoreline modifications are mapped.
The County SMP does not provide a Shoreline Environment Designation for Silver Creek. County zoning and Comprehensive Plan designations show existing land use as 100% Designated Forest Land.
Trails along Silver Creek within the National Forest provide public access. Winter access and cross-country skiing occur in the vicinity of Silver Creek. Cultural resources have not been inventoried within the Silver Creek planning area.
4.4.34.3 Reach Scale Assessment
Silver Creek, a tributary to the Upper White River, is located to the northeast of Mount Rainier National Park. Silver Creek is represented by one (1) reach – SILV_CR_01.
4.4.34.4 Restoration Opportunities
Removal of a dam on Silver Creek was undertaken by the South Puget Sound Salmon Enhancement Group (SPSSEG). The project was expected to improve upstream fish passage to prime salmon and bull trout spawning habitat (SPSSEG, 2007). Other opportunities for Silver Creek include decommissioning or repairing logging roads to prevent sedimentation, and replanting riparian areas with native trees.
4.4.35 South Fork South Prairie Creek
4.4.35.1 Physical and Biological Characterization
Drainage Basin, Tributary Streams and Associated Wetlands
South Fork South Prairie Creek flows northward from Old Baldy Mountain to its confluence with East Fork South Prairie Creek. Together, these creeks form South Prairie Creek. There are no wetlands mapped in this shoreline planning area.
Geologic and Flood Hazards
The creek is established in dominantly volcanic rock from Mount Rainier. Alluvium and Quaternary landslide deposits occupy the valley floors and localized alpine glacial soils may be present on the ridge tops. A seismic hazard is associated with landslide deposits along the creek. Flood hazards are currently unmapped for the creek. Landslide hazards are also unmapped, but may exist given the presence of recent landslide deposits. The creek crosses several areas mapped as having erosion potential.
June 2009 Page 4-101

Pierce County Shoreline Inventory and Characterization Report
Critical or Priority Habitat and Species Use
South Fork South Prairie Creek supports coho, fall chum, pink salmon, winter steelhead, and fall Chinook. In addition, it is presumed to support bull trout/Dolly Varden. Fish distribution maps (WDFW, 2007b) indicate that South Fork South Prairie Creek provides spawning habitat for coho, fall chum, pink salmon, winter steelhead, and fall Chinook. Critical habitat for these species is discussed below. There is one priority habitat, the White River elk range, associated with the South Fork of South Prairie Creek.
Instream and Riparian Habitats
No information specific to South Fork South Prairie Creek was found so the general data for South Prairie Creek has been included below. South Fork South Prairie Creek lies within active commercial timber resource lands. Most of the timber in the riparian zone has been harvested.
The upper canyon reach flows through a commercial forest and riparian vegetation consists of second growth fir and alder (Marks et al., 2005). From the canyon to RM 6.0, the riparian zone is relatively intact, consisting of mature hardwoods with some firs interspersed. Occasional residential development exists along this stretch of the stream. The lower reach flows through active agricultural land and the riparian zone is less extensive.
Water Quality
According to the 2004 Washington State Water Quality Assessment (Ecology, 2004b), South Fork South Prairie Creek is not listed for any water quality impairments. However, the mainstem of South Prairie Creek has multiple listings (see Section 4.4.36).
4.4.35.2 Shoreline Use Patterns
South Fork South Prairie Creek lies largely within unincorporated County lands, just outside the Mount Baker-Snoqualmie National Forest. Private timber lands are the dominant land use type. Gravel timber roads lie within close proximity to the stream. No levees or other significant shoreline modifications are mapped. However, numerous clearcuts are visible on aerial photographs of the basin, indicating that timber harvest has affected sediment transport and reduced infiltration. The County SMP does not provide a environment designation for South Fork South Prairie Creek; the land use is 100% Designated Forest Land. Due to the forest resource land use in private timber, no existing or proposed points of public access occur along the stream.
4.4.35.3 Reach Scale Assessment
South Fork South Prairie Creek is a tributary to South Prairie Creek. This creek is presented as one (1) reach – SFSP_CR_01.
4.4.35.4 Restoration Opportunities
Decommissioning or repairing logging roads would prevent sedimentation into the South Fork South Prairie Creek.
Page 4-102 June 2009

Pierce County Shoreline Inventory and Characterization Report
4.4.36 South Prairie Creek
4.4.36.1 Physical and Biological Characterization
Processes and Channel Modifications
South Prairie Creek lies with the South Prairie basin. Key modifications include:
• Land cover conversion from forest to harvested forest, pasture, or limited urban land uses which can changed timing, volume, and quality of runoff;
• Installation of a diversion dam for the City of Buckley on South Prairie Creek (Kerwin, 1999a);
• Installation of levees along Lower South Prairie Creek, and along the towns of South Prairie and Wilkeson;
• Installation of bridge crossings associated with highways;
• Historical in-stream gravel mining;
• Removal of native riparian vegetation communities; and
• Development in the historical floodplain in the lower 5 miles of South Prairie Creek.
Drainage Basin, Tributary Streams and Associated Wetlands
The South Prairie Creek watershed covers 146 square miles. South Prairie Creek is a major tributary to the Carbon River, and flows 21.6 miles from its headwaters within the Mount Baker-Snoqualmie National Forest near the northwest corner of Mount Rainier National Park to its confluence with the Carbon River. South Prairie Creek has several tributaries, of which Wilkeson Creek is the largest (Ecology, 2006b).
Several large wetlands covering approximately 200 acres are mapped within the floodplain of South Prairie Creek. Based on aerial photographs, these wetlands encompass forested, shrub, and emergent habitats as well as disturbed areas. Mapped wetlands cover approximately 14% of the South Prairie Creek shoreline planning area.
Geologic Hazards
South Prairie Creek extends generally westward from the confluence of East Fork South Prairie Creek and South Fork South Prairie Creek. The creek flows through a valley incised into sedimentary rock and volcanic and volcaniclastic rock and sediments. It then turns southwestward to flow through a gorge cut into volcanic mudflow and glacial drift deposits. The creek eventually joins the Carbon River. Seismic hazards are associated with alluvial, landslide, and lahar deposits along South Prairie Creek. Landslide hazards and steep slopes are mapped along the wall of the gorge near the intersection of South Prairie Creek and the Carbon River. Volcanic hazards are identified along the lower portion of the creek. The majority of South Prairie Creek is subject to flood hazards. Scattered areas with erosion potential are identified near the junction with the Carbon River.
June 2009 Page 4-103

Pierce County Shoreline Inventory and Characterization Report
Flood Hazards
The Federal Emergency Management Agency (FEMA) has prepared Flood Insurance Rate Maps (FIRMs) that include South Prairie Creek and its main tributaries. For much of the higher gradient portions of the basin, it appears that flooding width will be limited by the relatively narrow valley morphology. There are areas where a wider alluvial valley has formed in lower slope reaches. The floodplain is typically wider in these reaches, including the broad valley directly upstream from Orting.
A USGS study suggested that the Lower Carbon River and South Prairie Creek levee system will not be able to withstand flows near the 100 year recurrence interval flow (Prych, 1988). Failure of the levee system would have significant consequences for the City of Orting. In general, the resolution of flood mapping reduces with distance upstream, especially in the smaller tributary streams. Site specific investigation would be necessary to better establish flooding regimes in the upper watershed.
Critical or Priority Habitat and Species Use
South Prairie Creek supports coho, fall chum, pink salmon, winter steelhead, and fall Chinook. In addition, it is presumed to support bull trout/Dolly Varden. Fish distribution maps (WDFW, 2007b) indicate that South Prairie Creek provides spawning habitat for coho, fall chum, pink salmon, winter steelhead, and fall Chinook. Critical habitat for these species is discussed below.
Critical habitat for the Puget Sound DPS steelhead has not yet been designated. The Puget Sound/Strait of Georgia coho salmon is a species of concern and does not have designated critical habitat. The even and odd year ESU pink salmon do not have ESA critical habitat. The Puget Sound/Strait of Georgia ESU chum salmon does not warrant an ESA listing and therefore, does not have critical habitat. Puget Sound ESU Chinook salmon has critical habitat designated in South Prairie Creek; however bull trout do not (Federal Register, 2005a; 2005b).
South Prairie Creek is considered one of the most productive streams in the Puyallup/White River watershed, and is one of the index streams that the WDFW surveys for Chinook, pink salmon, and steelhead (Marks et al., 2005). South Prairie Creek produces almost half of all of the wild steelhead in the Puyallup River system, and has the only significant run of pink salmon in the Puyallup River. The stream also has healthy returns of Chinook, coho and chum salmon, and sea-run cutthroat trout (Kerwin, 1999a). Chinook spawning occurs primarily in the lower 8 miles and coho usage occurs in the middle to upper sections of the stream (Marks et al., 2005).
There are several priority habitats associated with South Prairie Creek: the South Prairie Creek riparian corridor; South Prairie Creek wetlands, an assortment of forested, emergent marsh, riparian and agricultural wetlands; urban natural open space, including steep slopes; a small elk damage area; the White River elk range; the Carbon River riparian zone; small waterfowl concentration areas; and Carbon River open space (WDFW, 2007a).
Instream and Riparian Habitats
The lower 5 miles of South Prairie Creek has been channelized and contained within constricting levees or revetments that prevent the stream from occupying historical floodplain areas.
Page 4-104 June 2009

Pierce County Shoreline Inventory and Characterization Report
The stream has many deep pools and several cascades as well excellent spawning gravel from RM 0.0 to RM 12.6. The riparian zone evidences significant changes over the 15-mile stretch of South Prairie Creek. The upper canyon reach flows through a commercial forest and riparian vegetation consists of second growth fir and alder (Marks et al., 2005). From the canyon to RM 6.0, the riparian zone is relatively intact, consisting of mature hardwoods with some firs interspersed. Occasional residential development exists along this stretch of the stream. The lower reach flows through active agricultural land and the riparian zone is less extensive.
Water Quality
According to the 2004 Washington State Water Quality Assessment (Ecology, 2004b), South Prairie Creek has two Category 4A listings for fecal coliform and temperature. In addition, the creek also has one Category 2 listing for pH, as well as five Category 1 listings: ammonia-N, dissolved oxygen, fecal coliform, pH, and temperature (Ecology, 2004b).
In 2003 Ecology completed a Total Maximum Daily Load (TMDL) process to address temperature and fecal coliform bacteria impairments in South Prairie Creek. Point sources of fecal coliform and temperature include the Wilkeson wastewater treatment plant and the South Prairie wastewater treatment plant. Nonpoint sources include septic systems, dairy operations, domestic animals, wildlife, and riparian vegetation removal (Ecology, 2003). In 2006, a Detailed Implementation Plan was completed for implementation actions to achieve reductions in temperature and the amounts of fecal coliform found within the stream.
4.4.36.2 Shoreline Use Patterns
Existing Land and Shoreline Use
South Prairie Creek (Reaches 1 through 4) passes through rural and agricultural areas, and eventually into timber land. The shoreline planning area surrounding South Prairie Creek is characterized largely by rural and agricultural development patterns in the lower reaches, with areas of forestry occurring predominantly in Reaches 3 and 4.
Portions of roadways parallel South Prairie Creek, and several roadway bridge and major utility crossings occur. Major overhead powerlines cross the river in Reach 2.
Shoreline modifications
No levees or other significant shoreline modifications are mapped along South Prairie Creek. However, levees are documented by other sources in Lower South Prairie Creek, and along the towns of South Prairie and Wilkeson.
Shoreline Environment Designations, Zoning, and Other Applicable Regulations
The existing SMP Shoreline Environment Designation of South Prairie Creek is Conservancy, where it is mapped. County zoning and Comprehensive Plan designations are primarily Agricultural Resource Land and Rural 10 in Reach 1, Rural 10 (greater than 40% in Reaches 1 through 3), Designated Forest Land (88% in Reach 4) and Rural 20. The majority of Reach 1 lies inside the UGA.
June 2009 Page 4-105

Pierce County Shoreline Inventory and Characterization Report
Page 4-106 June 2009
Existing and Potential Public Access Areas
The Foothills Trail, a multi-purpose regional trail, follows portions of South Prairie Creek and provides public access and recreation. The Trail goes from Buckley to McMillin as part of a rails-to-trails conversion.
Historic and Cultural Resources
Cultural resources within the South Prairie Creek shoreline planning area include recorded pre-contact materials and campsites. Native American use of the Middle Puyallup area, by the Puyallup Tribe, included seasonal hunting and gathering campsites near the Puyallup, with the same use patterns seen as described in the Lower Puyallup description. Recorded artifacts include lithic scatters, charcoal deposits, and calcined bones (DAHP, 2007). Subsistence harvest of anadromous fish (salmon and trout) and supplemental hunting of upland mammals occurred along the Middle Puyallup and throughout the watershed (DAHP, 2007).
4.4.36.3 Reach Scale Assessment
South Prairie Creek is a tributary to the Carbon River with a total of 17.3 miles of shoreline. This creek is divided into four (4) shoreline reaches from SOPR_CR_01 to SOPR_CR_04; reaches are described in Table 4-13.
4.4.36.4 Restoration Opportunities
Pierce County ranked South Prairie Creek as one of its top priorities for habitat protection in WRIA 10/12 in an effort to restore habitat for salmonids. Pierce County, the Cascade Land Conservancy, the Boeing Company, and the Pierce Conservation District acquired the 107-acre South Prairie Creek Preserve, adjacent to South Prairie Creek. This acquisition was considered key in reducing bacterial pollution by eliminating direct livestock access to South Prairie Creek (Ecology, 2006b). A follow-up study confirmed that fecal coliform bacteria concentrations downstream from the property did in fact decline significantly after livestock were removed (Brown and Caldwell, 2008).
The Pierce Conservation District Stream Team has worked over several years to install thousands of native plants at the South Prairie Creek Preserve (PCD, 2008). The Washington Water Trust is working with the conservation district to allocate water that was formerly used to irrigate the land for salmon in South Prairie Creek (WWT, 2009).
The South Prairie Creek/South Silver Springs Tributary restoration project is another project that will reconnect floodplain habitat and restore off-channel areas. Additional acquisition of important salmon spawning habitat, further revegetation of riparian areas, restoration of wetlands and floodplain connections to the channel, and addition of channel structure are other general opportunities along this stream.

Pierce County Shoreline Inventory and Characterization Report
Table 4-13. Reach Assessment for South Prairie Creek
Reach Number Reach Location Reach Length (miles)
Land Use Descriptions Modifications Unique Features Riparian Zone
SOPR_CR_01 Carbon River upstream to Town of South Prairie
5.58 Agricultural and residential uses, inside the City UGA; SR 162 runs parallel to the creek. Foothills Trail runs along the east side of SR 162. SR 162 crosses South Prairie Creek four times via bridges in Reach 1.
Ditching, draining of associated wetlands. Conversion of native shrub and trees to pasture.
Man-made water ski pond to the east of Foothills Trail.
Forested riparian zone varies from 50 feet to 200 feet.
SOPR_CR_02 South Prairie to Wilkeson Creek confluence
0.49 Residential land uses; roads run on north and south sides of creek. SR 162 crosses creek once in Reach 2.
Possible levees, confinement through town between roads
Riparian zone is narrow through Town of South Prairie.
SOPR_CR_03 Wilkeson Creek to Page Creek confluence
4.57 Forest Resource lands. Same Large wetland at the confluence of South Prairie and Wilkeson Creeks (south of Lower Burnett Road E).
Riparian zone is forested.
SOPR_CR_04 Page Creek Confluence to East and South Forks.
6.67 Forest Resource Lands Logging. No data.
June 2009 Page 4-107

Pierce County Shoreline Inventory and Characterization Report
4.4.37 South Puyallup River
4.4.37.1 Physical and Biological Characterization
Drainage Basin, Tributary Streams and Associated Wetlands
The South Puyallup River lies within the Upper Puyallup River basin. The South Puyallup River has one small tributary stream: Saint Andrews Creek. There are no wetlands mapped in this shoreline planning area.
Geologic and Flood Hazards
The South Puyallup River drains the Tahoma Glacier on Mount Rainier and flows generally west and northwest approximately seven miles before connecting with the North Puyallup River. The river traverses volcanic rocks, lahar deposits, alpine glacial deposits, and Quaternary alluvium. Hazards identified for the river include seismic, flood, and volcanic.
Critical or Priority Habitat and Species Use
Fish distribution maps (WDFW, 2007b) indicate that South Puyallup River has a documented presence of bull trout/Dolly Varden. Critical habitat for bull trout has been designated within the South Puyallup River (Federal Register, 2005b).
There are two state priority habitat areas associated with the South Puyallup River. The stream flows through a harlequin duck area where two breeding ducks were recorded. In addition, the northernmost section of the stream flows through the White River elk range.
Instream and Riparian Habitats
Land use adjacent to the South Puyallup River is predominately commercial forest resources. The only significant mid-seral forest stand along the stream is located adjacent to the Champion tree farm immediately downstream of RM26.3. Because riparian vegetation is limited along many reaches of this stream, LWD recruitment is essentially absent. The riparian habitat along the South Puyallup River overall is disconnected and not properly functioning (Kerwin 1999a).
Water Quality
According to the 2004 Washington State Water Quality Assessment (Ecology, 2004b), the South Puyallup River is not listed for any water quality impairments.
4.4.37.2 Shoreline Use Patterns
South Puyallup River is located entirely in forest resource use lands within unincorporated Pierce County. Land uses for South Puyallup River are identical to those in North Puyallup River described above in Section 4.4.28.2.
Page 4-108 June 2009

Pierce County Shoreline Inventory and Characterization Report
June 2009 Page 4-109
4.4.37.3 Reach Scale Assessment
South Puyallup River, a tributary to the Puyallup River, is divided into two (2) reaches – one above its confluence with Saint Andrews Creek (SOPU_RV_02) and one below (SOPU_RV_01). The total length of shoreline is 3.5 miles. Table 4-14 summarizes the reach assessment for South Puyallup River.
4.4.37.4 Restoration Opportunities
Restoration opportunities for the South Puyallup River include decommissioning or repairing logging roads to prevent sedimentation, replanting riparian areas with native trees, and removing failing culverts.

Pierce County Shoreline Inventory and Characterization Report
Table 4-14. Reach Assessment for South Puyallup River
Reach Number Reach Location Reach Length (miles)
Land Use Descriptions Modification Unique Features Riparian Zone
SOPU_RV_01 From N. Puyallup River to St. Andrews Creek confluence
2.47 Forest resource lands, timber harvest Logging and culvert for timber road crossings have altered stream channel.
Steep terrain No aerial photographs for this area.
SOPU_RV_02 Upstream of St. Andrews
1.06 Forest resource lands, timber harvest Same Steep terrain No data
Page 4-110 June 2009

Pierce County Shoreline Inventory and Characterization Report
4.4.38 Tolmie Creek
4.4.38.1 Physical and Biological Characterization
Drainage Basin, Tributary Streams and Associated Wetlands
Tolmie Creek lies within the Upper Carbon River basin. Tolmie Creek is a 1.71 mile long tributary to the Carbon River. There are no wetlands mapped in this shoreline planning area.
Geologic and Flood Hazards
Tolmie Creek extends northwestward from its headwaters west of Tolmie Peak and eventually connects with the Carbon River. Tolmie Creek has steep valley walls that expose volcanic and volcaniclastic rock. Localized deposits of alluvium may be found in the valley floor. Flood hazards are identified along the lower half of Tolmie Creek. Volcanic and seismic hazards are identified for the creek where it enters the Carbon River valley. The creek crosses at least one area that is mapped as having erosion potential.
Critical or Priority Habitat and Species Use
Fish distribution maps (WDFW, 2007b) indicate that Tolmie Creek does have a presumed presence of Dolly Varden/bull trout. PHS data indicates that there are no priority habitats associated with Tolmie Creek.
Water Quality
According to the 2004 Washington State Water Quality Assessment (Ecology, 2004b), Tolmie Creek is not listed for any water quality impairments.
4.4.38.2 Shoreline Use Patterns
Tolmie Creek lies almost entirely within the Mount Baker-Snoqualmie National Forest. Land uses are forestry and recreation related. Shoreline uses for Tolmie Creek are identical to those described for Chenuis Creek (Section 4.4.5.2).
4.4.38.3 Reach Scale Assessment
Tolmie Creek, a tributary to the Carbon River, is represented by one (1) reach – TOLM_CR_01.
4.4.38.4 Restoration Opportunities
Restoration opportunities for Tolmie Creek include decommissioning or repairing logging roads to prevent sedimentation, and replanting riparian areas with native trees.
June 2009 Page 4-111

Pierce County Shoreline Inventory and Characterization Report
4.4.39 Twenty-Eight Mile Creek
4.4.39.1 Physical and Biological Characterization
Drainage Basin, Tributary Streams and Associated Wetlands
Twenty-Eight Mile Creek lies within the Upper White River basin and is a tributary of the Greenwater River. The southern end of the stream flows through Twenty-Eight Mile Lake. There are no wetlands mapped in this shoreline planning area.
Geologic and Flood Hazards
Twenty-Eight Mile Creek flows north from Twenty-Eight Mile River west of Noble Knob, and eventually connects with the Greenwater River. The creek flows over volcanic rocks, volcaniclastic sediments and rocks, Quaternary landslide deposits, and alluvium. Identified hazards along the creek include seismic and flood. Erosion potential exists at the headwaters of the creek. Landslide hazards are unmapped for the creek, but may exist given the presence of recent landslide deposits.
Critical or Priority Habitat and Species Use
Fish distribution maps (WDFW, 2007b) indicate that Twenty-Eight Mile Creek supports spring Chinook, coho, Dolly Varden/bull trout, and winter steelhead. Spring Chinook and Dolly Varden/bull trout have a presumed presence in the stream. Coho has spawning habitat documented within the stream. There are two priority habitats associated with Twenty-Eight mile Creek: the White River elk range and winter area.
Water Quality
According to the 2004 Washington State Water Quality Assessment (Ecology, 2004b), Twenty-Eight Mile Creek is not listed for any water quality impairments.
4.4.39.2 Shoreline Use Patterns
Twenty-Eight Mile Creek lies entirely within the Mount Baker-Snoqualmie National Forest. Land uses are forestry and recreation related. Shoreline uses for this creek are identical to those described for Greenwater Creek (Section 4.4.16.2). There are no Shoreline Environment Designations for Twenty-Eight Mile Creek in the County’s SMP.
4.4.39.3 Reach Scale Assessment
Twenty-Eight Mile Creek is a tributary to Greenwater Creek. This creek is represented by one (1) reach – 28MI_CR_01.
4.4.39.4 Restoration Opportunities
Restoration opportunities for Twenty-Eight Mile Creek include decommissioning or repairing logging roads to prevent sedimentation, and replanting riparian areas with native trees.
Page 4-112 June 2009

Pierce County Shoreline Inventory and Characterization Report
4.4.40 Unnamed Tributary of Puyallup River
4.4.40.1 Physical and Biological Characterization
Drainage Basin, Tributary Streams and Associated Wetlands
The Unnamed Tributary of the Puyallup River is located downstream of the confluence of Neisson Creek and the Puyallup in the Upper Puyallup River basin. This tributary meets shoreline requirements for 0.42 mile. No wetlands are mapped for this shoreline area.
Geologic and Flood Hazards
The river traverses volcanic rocks, lahar deposits, alpine glacial deposits, and Quaternary alluvium. Hazards identified for the river include seismic, flood, and volcanic.
Critical or Priority Habitat and Species Use
Fish distribution maps (WDFW, 2007b) indicate that South Puyallup River has a documented presence of bull trout/Dolly Varden. Critical habitat for bull trout has been designated within the South Puyallup River (Federal Register, 2005b).
4.4.40.2 Shoreline Use Patterns
The Unnamed Tributary to the Puyallup River converges with the Puyallup River to the south of Orting. The shoreline planning area surrounding the stream is characterized by Rural Residential land use.
There is no existing SMP Shoreline Environment Designation for the unnamed tributary. County zoning and Comprehensive Plan designations follow existing land use patterns (94% designated Rural 20). The stream’s planning area is entirely outside the UGA.
There are no paved roadways within the shoreline planning area. No existing or proposed points of public access occur along the stream. No levees or other significant shoreline modifications are mapped.
No cultural resources are inventoried within the unnamed tributary area. However, seasonal hunting by the Puyallup Tribe could have occurred in the area, and as such there is some potential for the presence of cultural resources.
4.4.40.3 Reach Scale Assessment
The Unnamed Tributary to the Puyallup is referenced as UTPU_CR_01.
4.4.40.4 Restoration Opportunities
Restoration opportunities for the Unnamed Tributary to the Puyallup include decommissioning or repairing logging roads to prevent sedimentation, replanting riparian areas with native trees, and removing failing culverts.
June 2009 Page 4-113

Pierce County Shoreline Inventory and Characterization Report
4.4.41 Unnamed Tributary of South Puyallup River
4.4.41.1 Physical and Biological Characterization
Drainage Basin, Tributary Streams and Associated Wetlands
The Unnamed Tributary to South Puyallup River is located at the headwaters of the Puyallup River basin in National Forest lands. There are no wetlands mapped in this shoreline planning area.
Geologic and Flood Hazards
Geologic and flood hazard areas for the Unnamed Tributary of South Puyallup River are identical to those described under the South Puyallup River (Section 4.4.37.1).
Critical or Priority Habitat and Species Use
There is one priority habitat associated with the Unnamed Tributary of the south Puyallup River: the White River elk range (WDFW, 2007a).
Water Quality
Water quality information is not available for this tributary; however, data described in Section 4.4.37.1 for the South Puyallup River is provided.
4.4.41.2 Shoreline Use Patterns
Shoreline use patterns for the Unnamed Tributary of South Puyallup River are identical to those described under the South Puyallup River (Section 4.4.37.2). This area lies largely within the Mount Baker-Snoqualmie National Forest and does not have a Shoreline Environment Designation in the current County SMP.
4.4.41.3 Reach Scale Assessment
The Unnamed Tributary to South Puyallup River is represented by one (1) reach – UTSP_CR_01.
4.4.41.4 Restoration Opportunities
Restoration opportunities for the Unnamed Tributary to the South Puyallup include decommissioning or repairing logging roads to prevent sedimentation, replanting riparian areas with native trees, and removing failing culverts.
Page 4-114 June 2009

Pierce County Shoreline Inventory and Characterization Report
4.4.42 Viola Creek
4.4.42.1 Physical and Biological Characterization
Drainage Basin, Tributary Streams and Associated Wetlands
Viola Creek lies within the Upper White River basin. Viola Creek is a tributary of Pinochle Creek, which then flows into the West Fork of the White River. There are no wetlands mapped in this shoreline planning area.
Geologic and Flood Hazards
Viola Creek drains the slopes adjacent to Clear West Peak north of Mount Rainier and eventually intersects with the West Fork White River. The creek passes over undifferentiated volcaniclastic rocks and deposits, Quaternary talus and alluvium, and alpine glacial deposits. A seismic hazard is associated with alluvium in the lower portion of the creek. Volcanic hazards are identified in the lower portion of Viola Creek where is enters the West Fork White River valley. No flood hazards are currently identified for Pinochle Creek; however flood hazards probably exist given the creek’s mountainous catchment.
Critical or Priority Habitat and Species Use
Fish distribution maps (WDFW, 2007b) indicate that Viola Creek supports coho and Dolly Varden/bull trout, although Dolly Varden/bull trout have a presumed presence within the stream.
There are no priority habitats associated with Viola Creek; however, within 800 feet of the creek is a recorded spotted owl site.
Water Quality
According to the 2004 Washington State Water Quality Assessment (Ecology, 2004b), Viola Creek is not listed for any water quality impairments.
4.4.42.2 Shoreline Use Patterns
Viola Creek is located entirely within the Mount Baker-Snoqualmie National Forest. Land uses for Voila Creek are identical to those described in Section 4.4.31.2 for Pinochle Creek.
4.4.42.3 Reach Scale Assessment
Viola Creek, a tributary to Pinochle Creek, flowing then to the West Fork of the White River, is represented by one (1) reach – VIOL_CR_01.
4.4.42.4 Restoration Opportunities
Restoration opportunities for Viola Creek include decommissioning or repairing logging roads to prevent sedimentation, and replanting riparian areas with native trees.
June 2009 Page 4-115

Pierce County Shoreline Inventory and Characterization Report
4.4.43 Voight Creek
4.4.43.1 Physical and Biological Characterization
Drainage Basin, Tributary Streams and Associated Wetlands
Voight Creek lies within the Lower Carbon River basin. Voight Creek is a 15.8-mile tributary to the Carbon River, entering at RM 4.0. Voight Creek extends west from its headwaters in the area west of Martin Peak to its confluence with the Carbon River east of Orting, Washington. Mapped wetland covers less than 1% of the Voight Creek shoreline planning area. One wetland totaling 4 acres is mapped just south of Lower Voight Creek, near the confluence with Copler Creek.
Geologic and Flood Hazards
In its upper reaches, Voight Creek exposes volcanic and volcaniclastic rock in the valley floor and lower sidewalls, with alpine glacial deposits on the ridge. Sedimentary rock is exposed locally. The valley floor of Voight Creek contains alluvium, landslide deposits, and lahar deposits. Continental glacial deposits are exposed on the valley sidewalls. A seismic hazard is associated with alluvium found along the lower to middle portions of the creek. Volcanic hazards are mapped in the lower portion of the creek where is enters the Carbon River valley. The majority of Voight Creek is mapped as having a flood hazard. Landslide hazards are identified along the lower portion of Voight Creek. The creek passes within a few hundred feet of areas that have been mapped as having erosion potential.
Critical or Priority Habitat and Species Use
Fish distribution maps (WDFW, 2007b) indicate that Voight Creek supports fall Chinook, fall chum, coho, and winter steelhead. All of these species have a documented presence within the stream and fall Chinook and coho have rearing habitat within the stream. Winter steelhead have spawning habitat designated within the stream.
The Puyallup Tribal Fisheries (Marks et al., 2005) reports that there are just under 4 miles of anadromous habitat available in Voight Creek, as there is an impassable falls at RM 3.9 that blocks any further upstream migration. Steelhead are often observed spawning throughout the creek, and during higher fall flows, coho and sometimes Chinook bypass the hatchery and spawn through the creek up to the falls (Marks et al., 2005). Critical habitat has been designated for Puget Sound ESU Chinook salmon in Voight Creek (Federal Register, 2005a).
WDFW operates the Orting Salmon Hatchery on Voight Creek. The Voight Creek Hatchery rears fall coho, winter steelhead, and fall Chinook (Bergerand Williamson, 2005).
There are several priority habitat areas associated with Voight Creek. Voight Creek flows through the White River elk range and several elk damage areas, the Carbon River riparian corridor, the Carbon River wetlands, and the Carbon River bald eagle winter area (WDFW, 2007a).
Page 4-116 June 2009

Pierce County Shoreline Inventory and Characterization Report
Instream and Riparian Habitats
The stream channel varies in complexity, ranging from wide, braided channels, to narrow, confined gorges. Almost the entire stretch of stream (3.9 miles) below the falls contains excellent gravel with a moderate stream gradient (Marks et al., 2005). The riparian zone is comprised of second growth conifer and deciduous trees and there is a small amount of small and medium woody debris.
Water Quality
According to the 2004 Washington State Water Quality Assessment (Ecology, 2004b), Voight Creek has two Category 2 listings for water quality impairment: pH and temperature. WDFW operates the Orting Salmon Hatchery on Voight Creek under a general NPDES permit. The hatchery effluent is discharged into the creek and in the past, has met all standards in the discharge permit (Kerwin, 1999a). In the past, Voight Creek had been listed on the 303(d) list for exceeding water temperature in the vicinity of the hatchery.
4.4.43.2 Shoreline Use Patterns
Existing Land and Shoreline Use
Voight Creek (Reaches 1 and 2) passes through rural and agricultural areas, and eventually into timber land. The shoreline planning area surrounding Voight Creek is characterized largely by rural and agricultural development patterns in the lower reach, with areas of forestry occurring in Reach 2. Portions of roadways parallel Voight Creek, and one roadway bridge crosses the creek in Reach 1.
Shoreline modifications
No levees or other significant shoreline modifications are mapped along Voight Creek.
Shoreline Environment Designations, Zoning, and Other Applicable Regulations
The existing SMP Shoreline Environment Designation of Voight Creek includes Rural and Conservancy in Reach 1 and Conservancy in Reach 2, where it is mapped. County zoning and Comprehensive Plan designations largely follow existing land use patterns, and are dominated by Agricultural Resource Land, Rural 10, and Rural 20 in Reach 1, and Designated Forest Land (24% in Reach 1, 100% in Reach 2). Voight Creek is outside of the UGA.
Existing and Potential Public Access Areas
The Foothills Trail crosses Voight Creek in the section between Orting and South Prairie.
Historic and Cultural Resources
Cultural resources within the Voight Creek shoreline planning area include recorded pre-contact materials and campsites. Native American use of the Middle Puyallup area, by the Puyallup Tribe, included seasonal hunting and gathering campsites near the Puyallup, with the same use
June 2009 Page 4-117

Pierce County Shoreline Inventory and Characterization Report
Page 4-118 June 2009
patterns seen as described in the Lower Puyallup description. Recorded artifacts include lithic scatters, charcoal deposits, and calcined bones (DAHP, 2007). Subsistence harvest of anadromous fish (salmon and trout) and supplemental hunting of upland mammals occurred along the Middle Puyallup and throughout the watershed (DAHP, 2007).
4.4.43.3 Reach Scale Assessment
Voight Creek is located in the middle Puyallup basin and is a tributary to the Carbon River. This creek is divided into two (2) reaches labeled VOIG_CR_01 and VOIG_CR_02. Reaches are described in Table 4-15 and represent a total of 15.8 miles of shoreline.
4.4.43.4 Restoration Opportunities
Restoration opportunities for Voight Creek include revegetating riparian areas.

Pierce County Shoreline Inventory and Characterization Report
Table 4-15. Reach assessment for Voight Creek
Reach Number Reach Location Reach Length (miles)
Land Use Description Modifications Unique Features Riparian Zones
VOIG_CR_01 From the Carbon River to Bear Creek confluence
6.73 Rural residential and agriculture; forest resource lands are found east of SR 162 creek crossing.
No levees Impassable natural falls that block fish migration at RM 4. Extensive floodplain extending upstream on Waterhole Creek.
Second growth forest in riparian zone. Trees lacking at SR 162 crossing and near confluence with Carbon.
VOIG_CR_02 Upstream of Bear Creek
9.09 Rural residential and forestry. No levees Large scale clear-cuts in upper watershed.
Mature forest maintaining within 100 feet of creek. Remainder of riparian zone is clearcut.
June 2009 Page 4-119

Pierce County Shoreline Inventory and Characterization Report
4.4.44 West Fork White River
4.4.44.1 Physical and Biological Characterization
Drainage Basin, Tributary Streams and Associated Wetlands
The West Fork of the White River has multiple tributary streams, including Hazzard Creek, Thirsty Creek, Nosedive Creek, Pinochle Creek, Jim Creek, as well as four additional smaller streams near the southern end of the river. West Fork White River originates from the Winthrop Glacier on Mount Rainier, the second largest glacier on the mountain.
There are no wetlands mapped in this shoreline planning area. However, the river passes through a wide floodplain that could support wetlands within the channel migration zone.
Geologic and Flood Hazards
The West Fork White River flows from the Winthrop Glacier on the north slope of Mount Rainer to its confluence with the White River south of the town of Greenwater. The West Fork White River passes over alpine glacial deposits, Quaternary alluvium, and lahar deposits. Landslide deposits are present within a few hundred feet of the river. Valley sidewalls expose volcanic and volcaniclastic rocks. Intrusive igneous rocks are exposed on the valley sidewalls locally. A seismic hazard is associated with alluvium and landslide deposits along the river. Flood hazards are identified for the West Fork White River. Landslide hazards are unmapped for the river, but may exist given the proximity of recent landslide deposits to the river. Volcanic hazards are identified along West Fork White River.
Critical or Priority Habitat and Species Use
The West Fork of the White River supports spring Chinook, bull trout/Dolly Varden, coho, winter steelhead, and a potential presence of fall chum. Fish distribution maps (WDFW, 2007b) indicate that spring Chinook have a documented presence in the West Fork as well as spawning and rearing areas. The West Fork White River also has a documented presence of bull trout/Dolly Varden. Rearing habitat for coho and winter steelhead is provided along the West Fork (WDFW, 2007b). Critical habitat for these species is discussed below.
Critical habitat for the Puget Sound DPS steelhead has not yet been designated. The Puget Sound/Strait of Georgia coho salmon is a species of concern and does not have designated critical habitat. The Puget Sound/Strait of Georgia ESU chum salmon does not warrant an ESA listing and therefore, does not have critical habitat (NOAA, 2007). Puget Sound ESU Chinook salmon and bull trout have critical habitat designated in the West Fork White River (Federal Register, 2005a; 2005b).
There are several priority habitat areas associated with the West Fork of the White River. The west fork flows through the White River elk range and winter area, the Green River-White River harlequin duck breeding areas (WDFW, 2007a). In addition, spotted owls have been recorded to the east and west of the West Fork, greater than 3,000 feet from the river.
Page 4-120 June 2009

Pierce County Shoreline Inventory and Characterization Report
June 2009 Page 4-121
Water Quality
According to the 2004 Washington State Water Quality Assessment (Ecology, 2004b), the West Fork of the White River has one Category 4A listing for coarse sediment, and one Category 1 listing for temperature.
4.4.44.2 Shoreline Use Patterns
West Fork White River lies both within and just outside of the Mount Baker-Snoqualmie National Forest, north of Mount Rainier National Park. Forestry is the dominant land use. There are no paved roadways within the shoreline planning area; although numerous gravel timber roads lie within close proximity to the stream. No levees are mapped along the river.
The existing SMP Shoreline Environment Designation of the West Fork White River is Conservancy, where it is mapped. County zoning and Comprehensive Plan designations show existing land use as 100% Designated Forest Land.
National Forest roads #7550 and #7410 parallel the river on both sides. These roads provide informal access to the river. A bridge crossing the West Fork White occurs just upstream of the confluence of Pinochle Creek. Crystal River Ranch Road provides road access from SR 410.
4.4.44.3 Reach Scale Assessment
West Fork White River is a major tributary to the White River. West Fork has been divided into two (2) shoreline reaches – WFWR_RV_01 and WFWR_RV_02. Reach 2 is located above the confluence of the West Fork and Pinochle Creek. Reach 2 has a much wider floodplain zone than Reach 1. Table 4-16 summarizes the information by reach for the West Fork White River, and represents 11.4 miles of shoreline.
4.4.44.4 Restoration Opportunities
Restoration opportunities for West Fork White River include removing and de-commissioning forest roads, replacing culverts on tributaries, replanting logged and clearcut areas with native trees, and stabilizing slopes where landslides have occurred. Road decommissioning in the West Fork White River floodplain has been identified as a priority project for WRIA 10 salmon recovery planning (Pierce County Lead Entity, 2008a, 2008b).

Pierce County Shoreline Inventory and Characterization Report
Table 4-16. Reach assessment for West Fork White River
Reach Number Reach Location Reach Length (miles)
Land Use Description Modifications Unique Features Riparian Zone
WFWR_RV_01 White River to Pinocle Creek confluence
6.94 Located in forest resource lands and National forest
Large clearcut areas near confluence with White River. Private roads and timber roads.
Channel migration zone is active and about 500 ft. wide.
Forest in riparian zone varies from 100 feet to much wider, depending upon logging.
WFWR_RV_012 Upstream of Pinocle Creek
4.49 In National Forest, contains wide floodplain in upper reach.
Previous logging. Forest roads paralleling river on both sides.
Very wide floodplain in otherwise mountainous terrain. Channel migration zone is 1,500 to 2,000 ft. wide.
Second growth forest in riparian zone.
Page 4-122 June 2009

Pierce County Shoreline Inventory and Characterization Report
4.4.45 Wilkeson Creek
4.4.45.1 Physical and Biological Characterization
Drainage Basin, Tributary Streams and Associated Wetlands
Wilkeson Creek is a large tributary to South Prairie Creek and enters it at RM 6.8. Wilkeson Creek drains a watershed of 28 square miles.
Wetlands constitute approximately 43 acres (11%) of the Wilkeson Creek shoreline planning area. Scattered riparian wetlands are present along the lower and middle portions of Wilkeson Creek. These wetlands contain a mixture of forested and disturbed habitats, based on aerial photographs.
Geologic and Flood Hazards
Wilkeson Creek extends from its headwaters north of Burnt Mountain to its confluence with South Prairie Creek, east of the town of South Prairie.. The geology along Wilkeson Creek is dominated by continental glacial deposits, with localized exposures of igneous and sedimentary rock. In the lower reach of Wilkeson Creek, the valley floor consists of recent alluvium overlying lahar deposits. Valley sidewalls consist of relatively steeply sloping continental glacial deposits. Geology in the upper reaches of Wilkeson Creek consists mostly of volcanic and volcaniclastic rocks and alpine glacial deposits. A seismic hazard is associated with alluvium along the creek. Approximately the lower half of Wilkeson Creek is mapped as having volcanic and flood hazards. Wilkeson Creek passes near several areas that have been mapped as having erosion potential. In one location, the creek lies less than 100 feet from such an area.
Critical or Priority Habitat and Species Use
Wilkeson Creek supports fall Chinook, fall chum, winter steelhead, coho, and pink salmon. Fish distribution maps (WDFW, 2007b) indicate that the creek provides spawning habitat for all of these species. Bulltrout utilization is unknown (Marks et al., 2008). The Puget Sound/Strait of Georgia coho salmon is a species of concern and does not have designated critical habitat.
Wilkeson Creek provides fish access for the lower half of the stream until it reaches a set of natural falls at RM 6.2. These falls serve as a natural barrier to anadromous fish passage. It is considered to be a productive stream, especially for chum and pink salmon, and has somewhat limited Chinook usage due to extremely low flows during late summer (Marks et al., 2008). Above the falls, the creek supports primarily resident cutthroat populations, and downstream of the falls, the creek contains coho, Chinook, steelhead and sea-run cutthroat trout (Kerwin, 1999a).
Wilkeson Creek has two priority habitats associated with it. The stream flows through the South Prairie Creek riparian corridor and the White River elk range.
June 2009 Page 4-123

Pierce County Shoreline Inventory and Characterization Report
Instream and Riparian Habitats
Wilkeson is a pool-riffle stream with a gravel/cobble substrate and abundant spawning gravel. The riparian zone is comprised of hardwoods and conifers with an understory of various native shrubs and vegetation (Marks et al., 2005). Instream woody debris is numerous and the lower 3 miles of the stream are very natural, with a heavily wooded riparian zone and debris jams, providing good instream habitat.
There is a 1 mile segment of Wilkeson Creek through the Town of Wilkeson that has been channelized with banks that are riprapped and confined. These containments serve to hinder the stream’s occupation of significant portions of historical floodplain within this reach (Kerwin, 1999a; Marks et al., 2008).
Riparian habitat along Wilkeson Creek varies. Lower reaches of the stream are forested with hardwoods and conifers and native shrubs. However, large areas of invasive shrubs particularly Japanese knotweed are present (Marks et al., 2008). Riparian habitat is lacking through developed areas, like the Town of Wilkeson.
Water Quality
According to the 2004 Washington State Water Quality Assessment (Ecology, 2004b), Wilkeson Creek has one Category 4A listing for water quality impairment: temperature. In addition, the creek also has four Category 1 listings: copper, fecal coliform, pH, and temperature (Ecology, 2004b).
4.4.45.2 Shoreline Use Patterns
Existing Land and Shoreline Use
Wilkeson Creek (Reaches 1 through 4) passes through rural areas, and eventually into timber land. The shoreline planning area surrounding Wilkeson Creek is characterized largely by rural development patterns in the lower reaches, with private timber harvest occurring in Reaches 3 and 4.
Shoreline modifications
No levees or other significant shoreline modifications are mapped along Wilkeson Creek. However, riprapping and shoreline stabilization have occurred in and around the Town of Wilkeson. As a result, the channel is deeply entrenched and the banks are confined in this area (Reach 2) (Marks et al., 2008). There are also numerous bridge crossings. SR 162 crosses Wilkeson Creek three times within the vicinity of town.
Shoreline Environment Designations, Zoning, and Other Applicable Regulations
The existing SMP Shoreline Environment Designation of Wilkeson Creek is Conservancy in Reaches 1 through 3. Reach 4 does not have a Shoreline Environment Designation. County zoning and Comprehensive Plan designations largely follow existing land use patterns, and are dominated by Agricultural Resource Land in Reach 1, Rural 10 in Reaches 1 through 3, Rural 20
Page 4-124 June 2009

Pierce County Shoreline Inventory and Characterization Report
June 2009 Page 4-125
in Reach 3, and Designated Forest Land in Reach 4 (100%). Wilkeson Creek is outside of the UGA.
Existing and Potential Public Access Areas
The Foothills Trail follows Wilkeson Creek for some of its length. This multi-purpose regional trail provide pubic access to the shoreline planning area of Wilkeson Creek.
Historic and Cultural Resources
Cultural resources within the Wilkeson Creek shoreline planning area include recorded pre-contact materials and campsites. Native American use of the Middle Puyallup area, by the Puyallup Tribe, included seasonal hunting and gathering campsites near the Puyallup, with the same use patterns seen as described in the Lower Puyallup description. Recorded artifacts include lithic scatters, charcoal deposits, and calcined bones (DAHP, 2007). Subsistence harvest of anadromous fish (salmon and trout) and supplemental hunting of upland mammals occurred along the Middle Puyallup and throughout the watershed (DAHP, 2007).
4.4.45.3 Reach Scale Assessment
Wilkeson Creek, a tributary to South Prairie Creek, is represented by four (4) shoreline reaches. These reaches are described in Table 4-17. A total of 7.8 miles of Wilkeson Creek are designated as shorelines of the state.
4.4.45.4 Restoration Opportunities
Restoration opportunities for Wilkeson Creek include replanting of trees in the riparian zone through developed sections of the creek. Trees are lacking in the Town of Wilkeson and in other areas of rural residential development. Also, removal of invasive species in both the aquatic and riparian zone would improve habitat conditions. Other opportunities include removal of forest logging roads, repair of culverts and replanting in timber lands.

Pierce County Shoreline Inventory and Characterization Report
Table 4-17. Reach assessment for Wilkeson Creek
Reach Location Reach Length (miles)
Land Use Descriptions Modifications Unique Features Riparian Zones Reach Number
WILK_CR_01 South Prairie Creek to Town of Wilkeson
4.16 Rural residential and agricultural uses; roads through out reach. Tubbs Road parallels this reach on the south side of the creek. Wilkeson Creek County park.
No data on levees. Roads parallel this shoreline reach for residential areas.
Large wetland to the east of the confluence of Wilkeson and South Prairie Creek (Reach 2).
Riparian zone is forested with second growth timber.
WILK_CR_02 Reach through Town of Wilkeson
0.25 Rural residential and agricultural; Reach 2 runs through town. SR 165 (Wilkeson-Spiketon Road) crosses creek twice in this reach.
Bridges over creek. Banks are rip-rapped and shoreline stabilization measures in place.
Constrained reach through town.
Very limited in this reach. Houses and yards within 50 feet of creek.
WILK_CR_03 Wilkeson to Gale Creek confluence
2.08 Rural residential and agricultural; SR 165 crosses the creek at the downstream end of this reach, just outside of Town of Wilkeson. Private timbers lands,
Private timber roads and logging.
Wetland and open water to east of Snell Lake Road.
Varies, second growth timber.
WILK_CR_04 Upstream from Gale Creek
1.33 Forest resource uses. Private timber lands and managed forests. Three tributaries come together; eastern most is Wilkeson, central tributary is Gale Creek.
Clearcuts, forest timber roads, culverts, logging
Steep terrain. Varies, second growth timber, logging in riparian zone.
Page 4-126 June 2009

Pierce County Shoreline Inventory and Characterization Report
4.5 Lakes, Shorelines of the State
4.5.1 Echo Lake
4.5.1.1 Physical and Biological Characterization
Drainage Basin, Tributary Streams and Associated Wetlands
Echo Lake is a naturally-formed lake located within the Mount Baker-Snoqualmie National Forest. Echo Lake lies on the valley floor of the Greenwater River west of Arch Rock. There are no mapped wetlands in this shoreline planning area.
Geologic and Flood Hazards
The lake is bounded by volcanic and volcaniclastic rocks, glacial till, and Quaternary landslide deposits. A seismic hazard is associated with landslide deposits along the margin of the lake. Flood hazards are currently unmapped for Echo Lake, but are possible given the lake’s mountainous catchment area. Landslide hazards are also unmapped for the lake, but may exist given the presence of recent landslide deposits.
Critical or Priority Habitat and Species Use
No information is available on critical habitats or species use for Echo Lake.
Water Quality
No information is available for water quality characteristics of Echo Lake.
4.5.1.2 Shoreline Use Patterns
Echo Lake lies entirely within the Mount Baker-Snoqualmie National Forest. Land use patterns described for the Greenwater River in Section 4.4.16.2 also describe land use for Echo Lake. There is no existing SMP Shoreline Environment Designation for Echo Lake. Recreational trails in the National Forest allow for public access and camping at Echo Lake.
4.5.1.3 Reach Scale Assessment
Echo Lake, a natural lake located within the Greenwater River (Reach 5), is described as ECHO_LK_01.
4.5.1.4 Restoration Opportunities
Restoration opportunities for the shoreline of Echo Lake include decommissioning or repairing logging roads to prevent sedimentation, and replanting riparian areas with native trees.
June 2009 Page 4-127

Pierce County Shoreline Inventory and Characterization Report
4.5.2 Kapowsin Lake
4.5.2.1 Physical and Biological Characterization
Drainage Basin, Tributary Streams and Associated Wetlands
Kapowsin Lake is 512 acres in size. A large wetland (approximately 196 acres or 20% of the lake’s shoreline planning area) is mapped along the lake shoreline. Extensive wetland areas are visible on aerial photographs to the northeast and southwest ends of the lake. Ohop Creek flows into Kapowsin Lake from the south and Kapowsin Creek flows out of the lake to the north, ultimately flowing into the Puyallup River.
Geologic and Flood Hazards
Kapowsin Lake is situated east and southeast of the town of Kapowsin, Washington. The lake is bounded principally by continental ice-sheet deposits and Quaternary alluvium. The lake lies in an area identified as having flood, seismic, and volcanic hazards, as well as erosion potential.
Critical or Priority Habitat and Species Use
There are several priority habitats associated with Kapowsin Lake. These habitats include: the Kapowsin Lake wetlands; small and large waterfowl concentration areas; open space areas; Kapowsin Creek riparian corridor habitat; White River elk range habitat; and Pierce County island habitat (WDFW, 2007a). Bald eagle nests have been recorded close to one mile east of the lake and approximately 3,000 feet south of the lake.
Water Quality
According to the 2004 Washington State Water Quality Assessment (Ecology, 2004b), Kapowsin Lake has one Category 1 listing for total phosphorus, but no other water quality impairments.
4.5.2.2 Shoreline Use Patterns
Existing Land and Shoreline Use
Via Kapowsin Creek, Kapowsin Lake drains from the foothills to the valley floor and into the Puyallup River to the south of Orting. The shoreline planning area of the lake is predominated by rural and timber harvest land uses. There are two rural residences within the shoreline planning area.
Shoreline modifications
An active railroad bed (TMBL RR) lies along the western shore of the lake for approximately 1.5 miles. In addition, Oroville Road E (Kapowsin Highway) parallels the western and northern shores. Shoreline modifications including riprap and bank stabilization are found along the railroad grade. Some residential bulkheads are also established along the lake, as well as one residential dock and boat ramp.
Page 4-128 June 2009

Pierce County Shoreline Inventory and Characterization Report
Camp and private timber roads parallel the eastern shore of the lake within 100 feet. These roads access private timber lands owned by Hancock Forest Management on the east side of Kapowsin Lake. Rainier Resources owns and operates the Kapowsin gravel pit at the northeastern end of the lake. This gravel pit lies approximately 1,000 feet to the east of the lakeshore. Also, the Champion office shop facility lies to the east and central part of the lake. This shop facility is listed as lumber and wood manufacturing. The facility lies approximately 1,200 feet east of the lakeshore.
Shoreline Environment Designations, Zoning, and Other Applicable Regulations
The existing SMP Shoreline Environment Designation of Kapowsin Lake includes Natural and Conservancy. County zoning and Comprehensive Plan designations largely follow existing land use patterns, and are dominated by Rural 10, Rural 20 and Designated Forest Land. Kapowsin Lake is outside of the UGA.
Existing and Potential Public Access Areas
A WDFW boat ramp has been recently improved on the northern shore of Kapowsin Lake. This boat ramp provides fishing and public access to the lake. WDFW owns the parcel at 29405 Oroville Road E. The Muckleshoot Tribe also owns lands along the shoreline south of Oroville Road E.
Historic and Cultural Resources
No cultural resources are inventoried within the Kapowsin Lake area.
4.5.2.3 Reach Scale Assessment
Kapowsin Lake is the headwaters of Kapowsin Creek draining eventually to the Puyallup River. This lake is represented with one (1) reach for its shoreline – KAPO_LK_01.
4.5.2.4 Restoration Opportunities
Restoration opportunities for Kapowsin Lake include decommissioning private timber roads or relocating these roads outside of the shoreline jurisdiction. Existing shoreline vegetation should be protected, and shorelines should be replanted where vegetation is lacking.
4.5.3 Leaky Lake
4.5.3.1 Physical and Biological Characterization
Drainage Basin, Tributary Streams and Associated Wetlands
Leaky Lake is located near the southwest corner of Lake Tapps. This is also referred to as Hidden Lake in the Thomas Brothers Guide (2007). Approximately 12 acres (15%) of the lake’s shoreline planning area is mapped as wetland.
June 2009 Page 4-129

Pierce County Shoreline Inventory and Characterization Report
Geologic and Flood Hazards
Leaky Lake is located just west of Lake Tapps on an upland glacial drift plain to the east of the City of Puyallup. The lake is bounded by volcanic mudflow and continental ice-sheet deposits. Hazards identified for Lake Tapps include, flood, seismic, and landslide. The slopes which form its margin are also identified as steep slopes with the potential for erosion.
Critical or Priority Habitat and Species Use
Leaky Lake has two priority habitats associated with it: a small waterfowl concentration and the Lake Tapps plateau wetlands.
Water Quality
According to the 2004 Washington State Water Quality Assessment (Ecology, 2004b), Leaky Lake is not listed for any water quality impairments.
4.5.3.2 Shoreline Use Patterns
The shoreline planning area of Leaky Lake is predominated by rural residential land use. Rural residential access roads pass through the shoreline planning area, but no significant infrastructure, beyond shoreline modifications associated with residential development, intrudes on the lake. Some residential bulkheading has occurred along the lake, as well as residential use docks; however the rural nature of development has limited modification to the lake shoreline.
There is no existing SMP Shoreline Environment Designation for the Leaky Lake. County zoning and Comprehensive Plan designations largely follow existing land use patterns, and are dominated by Rural 10 (100% of shoreline planning area). Leaky Lake is outside of the UGA.
No existing or proposed points of public access occur along the lake.
Historic and Cultural Resources
No cultural resources are inventoried within the Leaky Lake area. However, seasonal hunting by the Puyallup Tribe could have occurred in the area, and as such there is some potential for the presence of cultural resources.
4.5.3.3 Reach Scale Assessment
Leaky Lake is identified as one (1) shoreline reach – LEAK_LK_01.
4.5.3.4 Restoration Opportunities
Restoration opportunities for the Leaky Lake shoreline include restoring native shoreline vegetation and replacing failing bulkheads with softer alternatives.
Page 4-130 June 2009

Pierce County Shoreline Inventory and Characterization Report
4.5.4 Morgan Lake
4.5.4.1 Physical and Biological Characterization
Drainage Basin, Tributary Streams and Associated Wetlands
Morgan Lake is located north of Kapowsin Lake and west of Kapowsin Creek. No information is available about the size of the sub-basin surrounding Morgan Lake. Morgan Lake is described to drain to Kapowsin Creek. A ditch is visible from 264th Street East running south to the lake. This ditch may direct surface and groundwater to or from Morgan Lake. A large wetland complex containing scrub-shrub and emergent habitats (based on aerial photos) surrounds the lake. Approximately 145 acres or 70% of the Morgan Lake shoreline planning area is mapped as wetland.
Geologic and Flood Hazards
Morgan Lake is situated on an upland glacial drift plain northwest of the town of Electron. The lake is bounded by Quaternary peat and continental ice-sheet deposits. The lake is identified as having flood and seismic hazards, as well as erosion potential.
Critical or Priority Habitat and Species Use
There are two priority habitats associated with Morgan Lake: large waterfowl concentration areas and the Upper Puyallup River wetlands, a collection of riverine, scrub-shrub, open-water, emergent and forested wetlands located in and around the lake.
Water Quality
According to the 2004 Washington State Water Quality Assessment (Ecology, 2004b), Morgan Lake is not listed for any water quality impairments.
4.5.4.2 Shoreline Use Patterns
Existing Land and Shoreline Use
The shoreline planning area of the Morgan Lake is predominated by agricultural uses and rural residential. Rural residential access roads pass through the shoreline planning area, but no significant infrastructure intrudes on the lakeshore. Pasture lands surround the lake and its planning area.
Shoreline modifications
No structural modifications in the lake or its shoreline are observed on 2005 and 2007 aerial photographs, with the exception of one dock at the single residence on the property. However, no forested riparian zone is present around the lake due to agricultural practices.
June 2009 Page 4-131

Pierce County Shoreline Inventory and Characterization Report
Shoreline Environment Designations, Zoning, and Other Applicable Regulations
The existing SMP Shoreline Environment Designation of Morgan Lake includes Rural. County zoning and Comprehensive Plan designations largely follow existing land use patterns, and are dominated by Rural 10 and Agricultural Resource Land. Morgan Lake is outside of the UGA.
Existing and Potential Public Access Areas
No parks or public access is provided on Morgan Lake. The lake is privately owned.
Historic and Cultural Resources
No cultural resources are inventoried within the Morgan Lake area.
4.5.4.3 Reach Scale Assessment
Morgan Lake drains to Kapowsin Creek and is represented by one (1) reach – MORG_LK_01 as described above.
4.5.4.4 Restoration Opportunities
Replant native riparian trees and shrubs around Morgan Lake to restore natural shoreline conditions. Establish a natural vegetated buffer of 100 feet or more to protect lake habitat and water quality. Revegetate degraded wetlands.
4.5.5 Mud Mountain Lake
4.5.5.1 Physical and Biological Characterization
Drainage Basin, Tributary Streams and Associated Wetlands
The Mud Mountain Reservoir (Lake) is one of the major surface water bodies of the White River sub-basin. The embankment for the Mud Mountain Dam began impounding flows in 1942 at RM 29.2. The Mud Mountain Reservoir extends 5.5 miles upstream and covers 1,200 acres when flooded. The reservoir has a storage capacity of 106,000 acre-feet (Ecology, et. al, 1995b). The Corps of Engineers currently controls flow through Mud Mountain Dam in order to mediate peak flood flows on the White and Green rivers. The reservoir is typically empty except for the flow of the White River.
There are no wetlands mapped in this shoreline planning area.
Geologic and Flood Hazards
Mud Mountain Lake occupies the floor of the White River valley just west of the confluence of the White and Clearwater rivers. The lake is bounded by volcanic rocks, Quaternary alluvium, and lahar deposits. The lake is subject to volcanic, seismic, and flood hazards. Erosion potential is also identified along discrete areas of the lake shoreline.
Page 4-132 June 2009

Pierce County Shoreline Inventory and Characterization Report
Critical or Priority Habitat and Species Use
Mud Mountain Lake has two priority habitats associated with it: the White River elk range and the White River riparian zone. Anadromous fish are hauled around the dam via tanker truck by the Corps of Engineers and released back into the White River above the dam. Salmonids that are transported are coho, Chinook, pink and steelhead.
Water Quality
According to the 2004 Washington State Water Quality Assessment (Ecology, 2004b), Mud Mountain Lake is not listed for any water quality impairments.
4.5.5.2 Shoreline Use Patterns
Existing Land and Shoreline Use
Mud Mountain Lake is formed by the Mud Mountain Dam on the White River. The land use of the shoreline planning area is predominantly timber harvest. Structures that occur at Mud Mountain Lake include infrastructure related to the dam facility, such as the dam itself, intake structures, bypass tunnels and associated roads.
Shoreline modifications
The dam structure itself on the White River is a major modification to the natural shoreline on the river. No other modifications occur within the shoreline of Mud Mountain Lake.
Shoreline Environment Designations, Zoning, and Other Applicable Regulations
There is no existing SMP Shoreline Environment Designation for Mud Mountain Lake. County zoning and Comprehensive Plan designations largely follow existing land use patterns, and are dominated by Designated Forest Land (75.5%).
Existing and Potential Public Access Areas
Public access is provided to Mud Mountain Lake via the Mud Mountain Recreational Facility that is owned and operated by the US Army Corps of Engineers. Mud Mountain Dam Park is open five days a week and offers picnic facilities, a children’s wading pool, view of the dam, and opportunities for hiking, biking and horseback riding. This is a day use area only with no overnight camping. See the Corps of Engineers web page at: http://www.nws.usace.army.mil/PublicMenu/Menu.cfm?sitename=MM&pagename=PAGE1.
June 2009 Page 4-133

Pierce County Shoreline Inventory and Characterization Report
Historic and Cultural Resources
No historical or cultural resources have been mapped.
4.5.5.3 Reach Scale Assessment
Mud Mountain Lake, a man-made reservoir created on the White River to control downstream flooding, is represented by reach MUDM_LK_M01. This reach is located downstream of Reach 6 on the White River and upstream of Reach 4.
4.5.5.4 Restoration Opportunities
Where native vegetation is lacking, revegetate shorelines to reduce sedimentation and improve water quality.
4.5.6 Printz Basin
4.5.6.1 Physical and Biological Characterization
Drainage Basin, Tributary Streams and Associated Wetlands
Printz Basin was constructed in 1911 by Puget Sound Energy as part of the Lake Tapps hydroelectric project. Two 1,500-foot long earthen dikes enclose the basin with canals entering and exiting the basin, directing surface water to Lake Tapps. In 2007, PSE proposed to construct a mass concrete spillway between Printz Basin and Lake Tapps to address concerns about safety from settlement of the earthen dikes. This is referred to as the backflow prevention structure designed to prevent backflow from Lake Tapps.
A large mapped wetland encompasses Printz Basin and a fringe of the adjoining shoreline. Approximately 263 acres (63%) of the basin’s shoreline planning area is mapped as wetland.
Geologic and Flood Hazards
Printz Basin is situated on an upland glacial drift plain east of Lake Tapps. The water body is bounded by both continental ice-sheet and volcanic mudflow deposits. Identified hazards along Printz Basin include seismic and flood. The basin is also identified as having erosion potential.
Critical or Priority Habitat and Species Use
There are two priority habitats associated with the Printz Basin: a small waterfowl concentration area and the Lake Tapps plateau wetlands.
Page 4-134 June 2009

Pierce County Shoreline Inventory and Characterization Report
Water Quality
According to the 2004 Washington State Water Quality Assessment (Ecology, 2004b), Printz Basin is not listed for any water quality impairments.
4.5.6.2 Shoreline Use Patterns
Existing Land and Shoreline Use
The shoreline planning area of the Printz Basin lies adjacent to single family residential, as well as agricultural land uses. The facility is operated by PSE and is being purchased by Cascade Water Alliance along with Lake Tapps.
Printz Basin is a man-made settling basin operated by PSE. Sediments in the water flowing in the flume entering Lake Tapps are settled here and removed. The shoreline of the basin is created by two earthen embankments. The basin is highly modified.
The existing SMP Shoreline Environment Designation of Printz Basin includes Conservancy, where it is mapped. County zoning and Comprehensive Plan designations largely follow existing land use patterns, and are dominated by Rural 10, Reserve 5, Moderate Density Single Family Residential, and Agricultural Resource Land. Printz Basin is outside of the UGA.
No existing public access points are located near Printz Basin. Public access will not be encouraged near the facility. No cultural resources are inventoried within the Printz Basin area.
4.5.6.3 Reach Scale Assessment
Printz Basin, a constructed reservoir east of Lake Tapps, is identified as one (1) reach – PRIN_BAS_01.
4.5.6.4 Restoration Opportunities
No restoration opportunities are proposed for the Printz Basin facility itself. Restoration of associated wetlands to the south may include enhancement of habitats and removal of agricultural ditches in pasture wetlands.
June 2009 Page 4-135

Pierce County Shoreline Inventory and Characterization Report
4.5.7 Rhodes Lake
4.5.7.1 Physical and Biological Characterization
Drainage Basin, Tributary Streams and Associated Wetlands
Rhodes Lake is located east of Fennel Creek and drains to this tributary of the Puyallup River. The lake is encompassed by a large wetland that appears to include scrub-shrub, emergent, and disturbed habitats. Approximately 22 acres (21%) of the Rhodes Lake shoreline planning area is mapped as wetland. However, based upon aerial photographs (2006) it appears that the entire area of Rhodes Lake may be considered wetland due to the presence of aquatic bed vegetation and emergent habitat across most of the lake surface.
Geologic and Flood Hazards
Rhodes Lake is situated on an upland glacial drift plain southeast of the town of Bonney Lake. Identified hazards along the lake include seismic and flood. The lake is also identified as having erosion potential.
Critical or Priority Habitat and Species Use
There are several priority habitats associated with Rhodes Lake: a small waterfowl concentration area; urban natural open space; and the Fennel Creek wetlands, a collection of forested and riparian wetlands and old abandoned beaver ponds (WDFW, 2007a).
Water Quality
According to the 2004 Washington State Water Quality Assessment (Ecology, 2004b), Rhodes Lake is not listed for any water quality impairments.
4.5.7.2 Shoreline Use Patterns
Rhodes Lake, which forms the headwaters of Fennel Creek, is surrounded predominantly with moderate density single-family and rural residential land use. Rhodes Lake Road E runs to the north of the shoreline planning area while 198th Avenue E runs parallel to the east and 193rd to the west. Pierce County Roads is proposing a Rhodes Lake Road Corridor Study and an EIS has been completed to investigate road improvement alternatives. Appendix F (Natural Resources) of the EIS discusses wetlands, wildlife and habitat within Rhodes Lake (Lawson et al., 2007).
There is no existing SMP Shoreline Environment Designation for Rhodes Lake. Zoning and Comprehensive Plan designations largely follow existing land use and are dominated by Moderate Density Single Family (Reach 1) and Rural Residential (Reach 2) zoning.
Page 4-136 June 2009

Pierce County Shoreline Inventory and Characterization Report
June 2009 Page 4-137
No state operated or county maintained boat launches or public parks are found on Rhodes Lake. This wetland is largely privately owned with one property owner for over 60 acres of the shoreline planning area.
Cultural resources within the Rhodes shoreline planning area include recorded pre-contact materials. Recorded artifacts include lithic scatters and charcoal deposits (DAHP, 2007).
4.5.7.3 Reach Scale Assessment
Rhodes Lake, located east of Fennel Creek in the mid Puyallup basin, is divided into two (2) shoreline reaches – RHOD_LK_01 and RHOD_LK_02 (Table 4-18).
4.5.7.4 Restoration Opportunities
Rhodes Lake has a high potential for restoration of wetland habitats. Although disturbed, this wetland has high diversity of habitats and is considered a valuable shoreline resource. This area could be purchased by the County for restoration and preservation.

Pierce County Shoreline Inventory and Characterization Report
Table 4-18. Reach assessment for Rhodes Lake
Reach Number Reach Location Reach Length (miles)
Land Use Description Modifications Unique Features Riparian Zones
RHOD_LK_01 North half of Rhodes Lake
1.52
Rural residential and agricultural uses Residential roads surrounding associated wetland
Extensive associated wetland
Forested fringe on associated wetland to the north.
RHOD_LK_02 South half of Rhodes Lake
0.91 Moderate-density single-family, rural residential
Residential roads Extensive associated wetland; portion of south side in conservation easement and drainage tract
Riparian habitat impacted by residential development to south.
Page 4-138 June 2009

Pierce County Shoreline Inventory and Characterization Report
4.5.8 Gaps in Existing Information
This subsection describes specific data gaps or limitations identified during development of the shoreline inventory and characterization, as required by Ecology’s guidelines (WAC 173-26-201(3)(c)(viii)). This list should not be considered exhaustive. As additional information is developed, this list may be helpful as the County considers future updates and amendments to its Shoreline Master Program.
Waterbodies with limited existing information are listed below according to the parameter for which information is lacking.
Table 4-19. Waterbody Parameters
Parameter for which data does not exist Waterbody
Modifications Instream and Riparian Habitat Water Quality
Bear Creek X X X
Canyon Creek Two X X
Cayada Creek X X X
Chenius Creek X X X
Clearwater River X
Deer Creek X X
East Fork South Prairie Creek X
Echo Lake X X X
Eleanor Creek X X
Evans Creek X X
Fennel Creek X
Gale Creek X X X
George Creek X X X
Goat Creek X X X
Greenwater River X
Huckleberry Creek X
Kapowsin Lake X X X
Kapowsin Creek X X
Kings Creek X X
Leaky Lake X X X
June 2009 Page 4-139

Pierce County Shoreline Inventory and Characterization Report
Page 4-140 June 2009
Waterbody Parameter for which data does not exist
Modifications Instream and Riparian Habitat Water Quality
Lost Creek X X X
Maggie Creek X X X
Meadow Creek X X
Milky Creek X X
Morgan Lake X X
Mud Mountain Lake X X
Neisson Creek X X
North Puyallup River X X
Ohop Creek X X
Page Creek X X X
Pinochle Creek X X
Printz Basin X X
Rhode Lake X X
Rushingwater Creek X X
Saint Andrews Creek X X X
Silver Creek X X X
South Fork South Prairie Creek X X
South Puyallup River X X
Tolmie Creek X X X
Twenty-Eight Mile Creek X X X
Unnamed Trib, Mowich River X X X
Unnamed Trib, Puyallup River X X X
Unnamed Trib, South Puyallup River X X X
Viola Creek X X X
Voight Creek X
West Fork White River X

Pierce County Shoreline Inventory and Characterization Report
CHAPTER 5 NISQUALLY RIVER SHORELINE PLANNING AREA (WRIA 11)
5.1 Water Bodies in the Nisqually River Shoreline Planning Area
This chapter provides inventory information for the waterbodies in the Nisqually River shoreline planning area that meet the jurisdiction of shoreline of the state or shoreline of statewide significance. In total there are marine/nearshore shorelines in County jurisdiction, one river, and one freshwater reservoir considered shorelines of statewide significance. There are 15 rivers and 20 freshwater lakes meeting the definition of shorelines of the state.
Inventory information in this chapter is presented by waterbody and described at both the waterbody and the reach scale for shorelines in the Nisqually shoreline planning area (WRIA 11). Maps illustrating the GIS information available by WRIA and illustrating the extent of shoreline reaches in WRIA 11 are provided in Appendix A. Shoreline reaches are illustrated in WRIA 11 on maps for marine shorelines (Map 21) and freshwater (Maps 22 and 23). Shoreline reaches within each waterbody type have been established based upon methods outlined in Chapter 2. Data by reach is provided in tables found in Appendix C. The GIS mapping available at Pierce County provides for reach-scale map information related to physical and biological features, as well as modifications.
For ease of reference, this chapter describes these water bodies in alphabetical order, as shown in the numbered list below. Following the alphabetical list, Table 5-1 shows the freshwater bodies organized by drainage basin. The drainage basin table provides a cross reference to where each freshwater body is discussed in the chapter text.
5.1.1 Alphabetical Listing of Water Bodies
Marine Shorelines of Statewide Significance –
1. Nisqually Delta (marine nearshore area)
Freshwater Shorelines of Statewide Significance –
1. Nisqually River (downstream from point where mean annual flow is 1,000 cfs) 2. Alder Lake (2,855 acres)
Rivers, Shorelines of the State –
1. Beaver Creek 2. Busy Wild Creek 3. Copper Creek 4. Horn Creek 5. Little Mashel River 6. S. Fork Little Mashel River 7. Lynch Creek 8. Mashel River
June 2009 Page 5-1

Pierce County Shoreline Inventory and Characterization Report
9. Unnamed Tributary, Mashel River 10. Midway Creek 11. Muck Creek 12. Ohop Creek 13. South Creek 14. Tanwax Creek 15. Twenty-five Mile Creek
Lakes, Shorelines of the State –
1. Benbow Lakes 2. Clear Lake 3. Cranberry Lake 4. Harts Lake 5. Kreger Lake 6. Little Lake 7. Muck Lake 8. Mud Lake 9. Ohop Lake 10. Rapjohn Lake 11. Silver Lake 12. Tanwax Lake 13. Trout Lake 14. Tule Lake 15. Twenty-seven Lake 16. Twin Lakes 17. Unnamed Lake (near Tanwax) 18. Unnamed Lake (south of Roy) 19. Whitman Lake 20. La Grande Reservoir
5.1.2 Listing of Freshwater Bodies by Drainage Basin
Table 5-1 lists the freshwater bodies within shoreline jurisdiction by drainage basin. The first column lists the basin name, the second column the main stream (river) in that basin. The third column lists the tributaries that flow into the river (e.g., Horn Creek is a tributary of the middle Nisqually River). The last column lists any small streams or lakes that drain to the tributaries (e.g., Tule Lake drains to Tanwax Creek).
Page 5-2 June 2009

Pierce County Shoreline Inventory and Characterization Report
Table 5-1. WRIA 11 Water Bodies by Drainage Basin
Basin Main Stream Tributaries to Main Stream
SmallerStreams/Lakes
Feeding into Tributaries
Lower Nisqually River
Lower Nisqually River
Mid Nisqually River
Mid Nisqually River Unnamed Lake near Roy
Horn Creek
Harts Lake
Little Lake
Trout Lake
Tanwax Creek Tule Lake
Rapjohn Lake
Tanwax Lake
Whitman Lake
Benbow Lakes
Twin Lakes
Kreger Lake
Unnamed Lake near Tanwax
Silver Lake
Cranberry Lake
Mud Lake
Clear Lake
Twenty-seven Lake
Upper Nisqually River
Upper Nisqually River La Grande Reservoir
Alder Lake
June 2009 Page 5-3

Pierce County Shoreline Inventory and Characterization Report
Page 5-4 June 2009
Basin Main Stream Tributaries to Main Stream
SmallerStreams/Lakes
Feeding into Tributaries
Copper Creek
Muck Creek
Muck Creek Muck Lake
South Creek
Ohop Creek
Ohop Creek Lynch Creek
Ohop Lake
Twenty-file Mile Creek
Mashel River
Mashel River Little Mashel River Midway Creek
South Fork Little Mashel River
Beaver Creek
Busy Wild Creek
Unnamed Tributary Mashel River
5.2 Marine Shorelines of Statewide Significance
5.2.1 Nisqually Nearshore
5.2.1.1 Physical and Biological Characterization
Drainage Basin, Tributary Streams, and Associated Wetlands
The Nisqually River forms a large delta as it enters the Puget Sound (Map 21). Most of the lands within the Nisqually River Delta are held within the Nisqually National Wildlife Refuge, which is managed and owned by the United States Fish and Wildlife Service (USFWS). However, some private property in-holdings lie within Pierce County and its shoreline jurisdiction.
The Nisqually National Wildlife Refuge, spanning over 3,000 acres, encompasses most of the wetlands at the mouth of the Nisqually River. This delta, which is also where Red Salmon and

Pierce County Shoreline Inventory and Characterization Report
McAllister Creeks discharge to Puget Sound, is one of the largest remaining relatively undisturbed estuaries in Washington (USFWS, 2006).
The wildlife refuge contains salt marsh and open mudflat habitats. These estuarine habitats are separated from freshwater marshes in the interior of the refuge by a historic five-mile-long dike. Freshwater wetland habitats include riparian forest and scrub-shrub, as well as palustrine emergent areas. Restoration of wetland and upland habitats in the refuge is ongoing. (USFWS, 2006). Old remnant tidal channels can be seen on aerial photographs in the Nisqually River reach within Pierce County jurisdiction.
Priority Habitat and Species
The Nisqually Delta supports several priority species: Dolly Varden/bull trout, chum salmon, Chinook salmon, steelhead, and coho salmon (WDFW, 2007b). Dolly Varden/bull trout have critical habitat designated in the Nisqually River. The Puget Sound/Strait of Georgia chum ESU does not warrant an ESA listing; thus, there is no critical habitat for this species (NOAA Northwest Regional Office, 2007). Critical habitat has been designated for the Puget Sound Chinook ESU in the Nisqually River (Federal Register, September 2, 2005). Critical habitat for the Puget Sound steelhead DPS has not yet been designated. The Puget Sound/Strait of Georgia coho ESU is listed as a species of concern and thus has no designated critical habitat (NOAA Northwest Regional Office, 2007).
The Nisqually River supports the following species: pink salmon, winter chum, winter steelhead, Dolly Varden/bull trout, coastal cutthroat trout, sockeye, coho, fall Chinook, and rainbow trout. Pink salmon have a documented presence in the river, with presence/migration, and spawning and rearing habitat. Winter chum, winter steelhead, coho, and fall Chinook have a documented presence with presence/migration and spawning habitat within the river. Coastal cutthroat trout, sockeye, and rainbow trout have a documented presence within the river, with presence/migration designated. Dolly Varden/bull trout have a documented historic presence with migration use designated (WDFW, 2007b).
The Nisqually River Delta has multiple priority habitats associated with it, most of which are located in the National Wildlife Refuge. These priority habitats are listed below (WDFW, 2007a):
• Nisqually River wetland habitat, which includes various riverine, forested, emergent marsh, scrub-shrub, and agricultural wetland providing fish habitat and waterfowl use areas; and
• Large concentrations of waterfowl.
Geologic and Flood Hazards
The entire Nisqually Delta is comprised of alluvial materials deposited at the mouth of the Nisqually. Flooding was historically common throughout the delta; however, dikes and levees were constructed to facilitate farming and agricultural uses. Removal of historical dikes is a goal of the National Wildlife Refuge to allow for greater extent of intertidal flooding and re-establishment of former mud flats.
June 2009 Page 5-5

Pierce County Shoreline Inventory and Characterization Report
5.2.1.2 Shoreline Use Patterns
Existing Land and Shoreline Use
The Nisqually Delta areas are undeveloped or are farmed pasture lands. Much of this area is associated wetland with both freshwater and brackish characteristics. These lands are classified as Rural/Residential and Agricultural Resource Lands. Other adjacent lands lie within the Wildlife Refuge and fall under federal jurisdiction.
Shoreline Modifications
No hardened structures are identified in this shoreline. However, the lands are actively ditched and drained to maintain agricultural uses. Railroad tracks lie to the east of the delta and Interstate 5 is located to the south. The eastern bank of the Nisqually lacks forested cover through the delta due to farming.
Shoreline Environment Designations, Zoning, and Other Applicable Regulations
The tidally-influenced delta of the Nisqually River has been designated as Natural in the County’s SMP. The Comprehensive Plan designation and implementing zone are for Agricultural Resource Land.
Existing and Potential Public Access Areas
Public access is provided in the Nisqually National Wildlife Refuge. Trails, walking paths and an environmental interpretive center are operating at the Refuge. Public access is provided by water for non-motorized boats and other watercraft depending upon seasonal restrictions. Hunting of waterfowl is allowed in the wildlife refuge during certain seasons. No public access is provided via private lands, which are in agricultural uses.
Historic and Cultural Resources
Cultural resources may be found within the Nisqually Delta due to historical use by the Nisqually Tribe.
Areas of Special Interest
According to Ecology guidelines, areas of special interest to be inventoried include such things as priority habitats, eroding shorelines, developing or redeveloping harbors or waterfronts, dredge disposal sites, and toxic or hazardous waste cleanup sites (WAC 173-26-201(3)(c)(iv)). Priority habitats are discussed above in Section 5.2.1.1. Eroding shorelines, where present, are described in the context of geologic hazards also in Section 5.2.1.1.
No areas of special interest are identified in the Nisqually Delta, with the exception of one identified hazardous chemical location. The Department of Ecology maintains a statewide GIS database of facilities with suspected or confirmed contaminated sites, and facilities with the potential to introduce contaminants into the environment. The database indicates that there is an
Page 5-6 June 2009

Pierce County Shoreline Inventory and Characterization Report
AT&T Wireless facility in the vicinity of this reach that contains hazardous chemicals (see Appendix C).
5.2.1.3 Reach Scale Assessment
The Nisqually Delta comprises one marine/ nearshore reach in WRIA 11 (Nisqually River). This reach is tidally influenced and encompasses private property in-holdings to the east of the Nisqually River and the Nisqually National Wildlife Refuge. The shoreline reach lacks riparian forested cover due to ongoing agricultural practices and farming.
5.2.1.4 Restoration Opportunities
Restoration opportunities for the Nisqually River are focused in the estuary, where agricultural lands are being restored to functioning condition. Restoration includes removal of dikes to restore tidal flats in both Nisqually tribal lands and within the 3,000-acre Nisqually National Wildlife Refuge. Land acquisition has also occurred within the river delta and estuary. One hundred forty acres of tribal lands have been restored, and another 762 acres will be restored within the wildlife refuge (Nisqually Indian Tribe, 2008). This project has been identified as the top priority to recover Chinook salmon populations in the Nisqually watershed (PSNP, 2008).
An assessment of the nearshore habitat was recently conducted by the South Puget Sound Salmon Enhancement Group (SPSSEG) for WRIAs 11 and 12. SPSSEG inventoried habitat from the Nisqually Delta north to Point Defiance to assess the existing conditions of the nearshore environment and identify appropriate restoration opportunities. The study team, entitled WRIA 11 and 12 Nearshore Habitat Assessment and Restoration Design Project, began in 2006 and is undertaken in cooperation with Pierce County, the Nisqually Tribe, People for Puget Sound, and the BNSF Railroad. The study is designed to identify restoration projects with the greatest long-term benefit to salmon with this reach and follows the Puget Sound Partnership’s guidance for nearshore assessments (PSNERP, 2002). Forage fish surveys and beach seining have been conducted to date (SSPEG, 2009b). A final report has not yet been prepared by SPSSEG for the nearshore assessment.
Restoration opportunities include restoring a wider forested riparian zone along the LB of the Nisqually River to provide protection to the river. Preservation of these lands for farming and wildlife use should continue, as should removal of dikes, wherever feasible. Acquisition of lands in the delta could be considered by Pierce County to preserve riparian habitats and tidally-influenced wetlands.
June 2009 Page 5-7

Pierce County Shoreline Inventory and Characterization Report
5.3 Freshwater Shorelines of Statewide Significance
5.3.1 Nisqually River
The Nisqually River is identified as a Shoreline of Statewide Significance downstream from the point where the mean annual flow reaches 1,000 cubic feet per second. Upstream from this point the river is a Shoreline of the State; however the entire river length is discussed in this section.
5.3.1.1 Physical and Biological Characterization
Processes and Modifications
The headwaters of the Nisqually River are protected in Mount Rainier National Park and its river delta at the mouth is protected by the Nisqually Wildlife Refuge. However, major process and channel modifications exist throughout the basin. Broad categories of modification include:
• Land conversion from forest to harvested forest, cleared military lands or agricultural uses, mainly pasture;
• Installation of levees and revetments;
• Installation of two hydroelectric projects associated with La Grande Dam and Alder Lake Dam, which capture sediment and alter downstream sediment dynamics;
• Installation of a water diversion feature and parallel water flume on the Thurston County side of the river;
• Gravel mining; and
• Water quality impacts from agricultural practices.
Drainage Basin, Tributary Streams, and Associated Wetlands
The Nisqually River begins at glaciers (South Tahoma, Pyramid, Kautz, Von Trump, Wilson and Nisqually Glaciers) on the southern slopes of Mount Rainier and flows generally west and north, entering Puget Sound at the Nisqually Delta south of Tacoma, Washington. Tributary drainages include Muck Creek, Ohop Creek, and the Mashel River. Power generation dams are present on the Nisqually River at La Grande, Washington, and Alder, Washington. The overall Nisqually River watershed is approximately 720 square miles in size.
The Nisqually River is approximately 78 miles in length and originates on the southern side of Mount Rainier, from the Nisqually Glacier (Pierce County PALS, 1999). The river drains a portion of the Cascade Range southwest of Tacoma. It flows west along the Pierce-Lewis County line, then in a northwest direction, forming the boundary between Pierce and Thurston Counties before flowing through the Nisqually Indian Reservation in the lower 10 miles. The mouth of the Nisqually River is located in the southern end of Puget Sound. Pierce County’s shoreline jurisdiction on the Nisqually is limited to its northern shore or left bank (LB). A total of approximately 40 miles of Nisqually shoreline lie within Pierce County jurisdiction (including Alder Lake and La Grande Reservoirs). Other areas of the river’s shoreline lie in Mount Rainier National Park, the federal lands of Fort Lewis, the Nisqually Reservation, or in Thurston County.
Page 5-8 June 2009

Pierce County Shoreline Inventory and Characterization Report
Approximately 8% (262 acres) of the Nisqually River shoreline planning area is mapped as wetland based on GIS data. The largest concentration of wetlands along the Nisqually River is within the river delta (described earlier) and the lower portion of the river within Fort Lewis. Upstream of the Fort Lewis boundary, within Pierce County shoreline planning jurisdiction, scattered riparian and floodplain wetlands containing palustrine forested, scrub-shrub, and emergent habitats are located up to La Grande Dam. Only a few small, scattered riparian and floodplain wetlands are mapped upstream of Alder Lake.
Geologic and Flood Hazards
There are several geologic and flood hazards along the length of the freshwater shoreline of the Nisqually River. These hazards are driven primarily by tectonic and glacial influences from Mount Rainier, flow within the Nisqually River, and from anthropogenic alterations to the river system.
Volcanic activity on Mount Rainier could influence the upper reaches of the Nisqually River either via ashfall (tephra), pyroclastic flow, or lahar (Hoblitt et al., 1998). Lahars (volcanic debris flows) could influence the Nisqually as far as the delta if Alder and LaGrande Dams were to fail.
Earthquakes could influence the Nisqually in several ways. Earthquake shaking could destabilize hillsides, or could destabilize Alder Dam. Failure of Alder Dam would have significant consequences. If Alder Dam were to fail, the consequences have been rated in hazard class 1A (extreme) by the Washington Office of Dam Safety, with more than 100 inhabited structures in the dam burst zone (Pierce County, 2002c). Earthquakes could also result in the liquefaction of weak soils, such as the highly organic soils present in the Nisqually Delta. Smaller pockets of soils that are prone to liquefaction are present throughout the Nisqually basin in closed depressions and along lake margins.
Flooding and channel migration are common along the mainstem of the Nisqually River. Channel migration zones have been delineated along the Upper Nisqually from approximately the National Park boundary to Alder Reservoir (Pierce County, 2007b). This study identified the potential for significant channel change in both the low flow channel geometry and in the overall plan form of the channel. The Channel Migration study identifies the Upper Nisqually as a braided system, with significant coarse sediment loading from Mount Rainier. These types of systems typically have the potential for rapid and ongoing channel adjustments during major runoff events (Pierce County, 2007b). Significant channel changes were observed in and downstream of Mount Rainier National Park during and following a major runoff event in November 2006.
Flood hazards occur along the mainstem of the Nisqually. Flooding is typically driven by winter storms that can deliver significant amounts of precipitation to the Cascades. Major flooding is often associated with rain-on-snow events, where snow melt augments already significant warmer precipitation events. These types of events can result in regionally significant flooding. Downstream flooding is modified by Alder and LaGrande Dams, but neither structure is intended specifically for flood storage.
June 2009 Page 5-9

Pierce County Shoreline Inventory and Characterization Report
Flooding can also be associated with glacial outbursts. These occur when water that is stored behind ice dams or glacial debris is released in a short period of time (e.g., the ice dam melts or fails, earthquake, etc.). An example of this type of flood occurred in Kautz Creek in 1947, and are most common in Tahoma Creek (Walder and Driedger, 1993). While these types of floods can release large volumes of water and mobilize channel sediments, their impact is typically local to the tributary channel, and would not result in regional flooding (Pierce County, 2007b).
Critical or Priority Habitat and Species Use
Freshwater bodies in the Nisqually River shoreline planning area support several priority species: Dolly Varden/bull trout, chum salmon, Chinook salmon, steelhead, and coho salmon (WDFW, 2007b). Dolly Varden/bull trout have critical habitat designated in the Nisqually River. The Puget Sound/Strait of Georgia chum ESU does not warrant an ESA listing; thus, there is no critical habitat for this species (NOAA Northwest Regional Office, 2007). Critical habitat has been designated for the Puget Sound Chinook ESU in the following waterbodies within WRIA 11: the Little Mashel River, Mashel River, Lynch Creek, Nisqually River, Ohop Creek, Tanwax Creek, and Twenty-five Mile Creek (Federal Register, September 2, 2005). Critical habitat for the Puget Sound steelhead DPS has not yet been designated. The Puget Sound/Strait of Georgia coho ESU is listed as a species of concern and thus has no designated critical habitat (NOAA Northwest Regional Office, 2007).
The Nisqually River supports the following species: pink salmon, winter chum, winter steelhead, Dolly Varden/bull trout, coastal cutthroat trout, sockeye, coho, fall Chinook, and rainbow trout. Pink salmon have a documented presence in the river, with presence/migration, and spawning and rearing habitat. Winter chum, winter steelhead, coho, and fall Chinook have a documented presence with presence/migration and spawning habitat within the river. Coastal cutthroat trout, sockeye, and rainbow trout have a documented presence within the river, with presence/migration designated. Dolly Varden/bull trout have a documented historic presence with migration use designated (WDFW, 2007b).
The Nisqually River fall Chinook and coho are considered to be a mixed population of both native and hatchery origin, and the number of adult hatchery fish that contribute to both the natural fall Chinook and coho spawning populations are undetermined. The overall status of fall Chinook within the River is unknown (Watershed Professionals Network, et al., 2002). The Nisqually River chum salmon have been defined as a native stock, and winter chum stocks are considered to be healthy (Watershed Professionals Network, et al., 2002). The Nisqually River winter steelhead stock is native in origin and has been showing a steady decline in numbers since the early 1990’s. Sockeye have been observed spawning in the Nisqually River, and the current status of Nisqually River bull trout is unknown.
The Lower Nisqually mainstem from RM 2.4 to RM 12.7 supports populations of all salmonid species. The Nisqually Tribe’s Clear Creek hatchery is located on the right bank at RM 6.1, and the Tribe’s Kalama Creek hatchery is located on an abandoned side channel of the river at approximately RM 9.5 (Watershed Professionals Network, et al. 2002). This reach provides important spawning habitat for chum, coho, Chinook, and steelhead (Kerwin, 1999b).
Page 5-10 June 2009

Pierce County Shoreline Inventory and Characterization Report
The Middle Nisqually from RM 12.7 to 26.2 provides spawning for chum, coho, and steelhead; there are spawning gravels present in the lower two miles of this reach (Watershed Professionals Network et al., 2002). The Centralia Diversion Dam has a fish ladder within this reach.
The Upper Nisqually mainstem, from RM 26.2 to 42.5 provides spawning ground for chum, coho, Chinook, and steelhead. There are two hydroelectric projects located within this reach of the mainstem, the LaGrande and Alder Dams. These dams limit habitat by intercepting spawning-sized gravels and LWD from the upper basin (Watershed Professionals Network et al., 2002).
The Nisqually River has multiple priority habitats associated with it, spanning from the lower, middle and upper reaches. These priority habitats are listed below (WDFW, 2007a):
• Urban natural open space, inclusive of candidate open space and Puyallup steep slopes open space areas;
• Nisqually elk wintering area;
• White River elk range;
• Rocky Mountain and Roosevelt elk winter range;
• Elk damage area;
• Snag rich habitat;
• Upper Nisqually bald eagle use area;
• Old growth habitat;
• Ohop Creek wetland habitat, which includes a collection of forested riparian, scrub-shrub, riparian, and agricultural wetlands;
• Nisqually River wetland habitat, which includes various riverine, forested, emergent marsh, scrub-shrub, and agricultural wetland providing fish habitat and waterfowl use areas;
• Murray Creek wetland habitat, which includes some forested, emergent marsh, riverine, scrub-shrub, and agricultural wetlands;
• Alder Lake and associated wetland habitat, which includes those wetlands above Alder Dam – a collection of marsh, scrub-shrub, forested and riverine wetlands;
• Lower Nisqually River riparian habitat, which is located below the Alder Dam and provides a critical protection area to preserve wild fish populations within the river;
• Ohop Creek riparian habitat, composed of an assortment of conifer, mixed trees, broadleaf shrubs, and agricultural riparian habitat with some riverine wetlands;
• Alder Lake and Upper Nisqually River riparian habitat;
• Murray Creek riparian habitat, inclusive of some riverine wetlands;
• Tanwax Creek riparian habitat, composed of an assortment of conifer, mixed trees, broadleaf shrubs and agricultural riparian habitat with some riverine wetlands;
June 2009 Page 5-11

Pierce County Shoreline Inventory and Characterization Report
• Nisqually deer wintering area;
• Large waterfowl concentration areas; and
• Nisqually River Harlequin duck breeding areas.
Instream and Riparian Habitats
The Lower Nisqually mainstem from RM 4.5 to 12.7 is the only reach in the system with good large woody debris (LWD) (Watershed Professionals Network et al., 2002). However, there is bank armoring present in the lower portions of this reach near highway and railroad bridges. This armoring has reduced lateral channel migration, available side channel rearing habitats, and riparian cover in specific areas (Kerwin, 1999b). Between RM 4.7 and RM 12.7, the river has several side channels that are important for chum spawning and that provide overwinter rearing habitat for coho and steelhead (Kerwin, 1999b).
The Middle Nisqually River between RM 12.7 to RM 19.0 is contained within a shallow and narrow canyon, yielding a fairly steep gradient within the channel. Instream habitat within this reach is characterized by deep pools with some areas of boulder substrate and areas of spawning gravel (Kerwin, 1999b). Riparian habitat within this reach is variable. Flood control dikes have been installed in the Middle Nisqually near RM 21.8 and in the Upper Nisqually mainstem between RM 26.2 to 42.5.
Riparian habitat along the Upper Nisqually (RM 26.2 to RM 42.5) consist of second growth conifers and hardwoods with some areas of old growth conifers (Kerwin, 1999b). Upstream of Ohop Creek, deep pools have formed between narrow cliffs and habitat conditions are generally good, with the exception of LWD (Watershed Professionals Network et al., 2002).
Water Quality
According to the 2004 Washington State Water Quality Assessment (Ecology, 2004b), the Nisqually River has one Category 4C listing for habitat impairment due to invasive exotic species. In addition, the river has three Category 2 listings for water quality impairment for chromium, fecal coliform, and total PCBs. The Nisqually River also has multiple Category 1 listings for dissolved oxygen, fecal coliform, mercury, pH, temperature, and other chemical parameters such as aldrin, DDT, and dieldrin.
Water quality monitoring data from the Nisqually Indian Tribe for the 1990’s indicates that the overall quality of the Nisqually River was good, with dissolved oxygen concentrations, fecal coliform bacteria concentrations, and temperature all within State standards (Watershed Professionals Network, et al., 2002).
During 2002 and 2003, the Department of Ecology conducted a total maximum daily load (TMDL) study for fecal coliform bacteria in the Nisqually River, including several other waterbodies. The results from this study indicate that the Nisqually River met water quality standards for fecal coliform, and because of this, no load reductions were recommended for the river (Ecology, 2005b).
Page 5-12 June 2009

Pierce County Shoreline Inventory and Characterization Report
5.3.1.2 Shoreline Use Patterns
Existing Land and Shoreline Use
Existing land uses within the Nisqually shoreline planning area are predominantly forest resource, rural residential development, and agriculture. Nisqually River Reach 1 occurs above where the river flows into Fort Lewis along the Pierce / Thurston County boundary. Land use within this reach is characterized by low density rural development and agricultural uses. Beginning in Reach 2 of the Nisqually, and continuing on through Reach 8, the shoreline planning area transitions from rural land use (dominant in Reach 2) to timber based resource use. State Route 706 is located to the north of the river from Alder Lake to the east. Along this highway, small pockets of low density residential development occur within the planning area, predominantly in Elbe and Ashford. Areas of gravel mining activity are also located within the planning area.
Shoreline modifications
Shoreline modifications along the Nisqually River include structures and flow modifications related to a dam and water diversion structure for the Centralia Power Canal, two hydroelectric dams owned by Tacoma Power, roadways and bridges, and levees.
The Yelm Hydroelectric Project and Centralia Power Canal were constructed in 1928 to provide power to Centralia City Light. The dam and water diversion structure are located on the Nisqually River at RM 26.2. The Centralia Power Canal parallels the river on the right bank and transports the water to a powerhouse located at RM 12.7, where the water is returned to the mainstem Nisqually River (Kerwin, 2000).
Tacoma Power owns and operates the Nisqually River Hydroelectric Project. The Project is located on the Nisqually River between river mile (RM) 40.8 and RM 51.6, and includes two projects, Alder and LaGrande. Each hydroelectric project includes a dam, power tunnel and/or penstocks, powerhouse, and associated power transmission system. The LaGrande facility involves a 192-foot high concrete dam creating the LaGrande Reservoir. This facility was built by Tacoma in 1912 and expanded in 1941.
The Alder Dam includes a 285-foot-high concrete arch dam at RM 44.2. This dam impounds the Nisqually River to create the Alder Lake Reservoir. This reservoir is approximately 3,000 acres in area and 7.4 miles long.
Channel migration is actively occurring in the Nisqually River as evidenced by the channel sinuosity in many sections of the river. Roadway infrastructure is minimal in all Nisqually River reaches. State Route 706, as noted above, roughly parallels the river; however only occasionally borders or crosses into the shoreline planning area. State Routes 507 and 7 both cross the Nisqually River via bridges.
Shoreline Environment Designations, Zoning, and Other Applicable Regulations
Shoreline environment designations for the Nisqually River include Conservancy for Reaches 1, 3 and 6. Reach 2 has a designation of Rural and Conservancy. Reaches 4 and 5 have a shoreline
June 2009 Page 5-13

Pierce County Shoreline Inventory and Characterization Report
environment designation of Natural. Reaches 7 and 8 do not have a shoreline designation. The Nisqually River largely passes through Residential 10 areas (Reaches 1 through 5) in the lower portion of the watershed and Residential 40 areas (Reaches 6 through 8) in the upper.
Existing and Potential Public Access Areas
No formal public access to the Nisqually River is provided, except at Alder Lake. Parks, swimming beaches and boat launches are found on Alder Lake and are discussed in Section 5.3.2.2. Informal access to the river’s edge is found along many sections of the river where roads run parallel.
New public access is proposed for the Nisqually River in Pierce County. The Washington State Parks and Recreation Commission (State Parks) is proposing a new State Park on the Nisqually and Mashel rivers. The proposed Nisqually-Mashel State Park is a 1,230-acre property at the confluence of these rivers. The property has good low-bank river access and opportunities for camping, trails, picnicking, and natural and cultural resource interpretation. State Parks has held several public hearings on the Nisqually-Mashel State Park proposal and is currently developing alternatives for park development. http://www.parks.wa.gov/plans/nisqually/.
Historic and Cultural Resources
Cultural resources within the Nisqually River shoreline planning area include recorded pre-contact materials and campsites. Native American use of the Nisqually basin, by the Nisqually and neighboring tribes, included seasonal hunting and gathering campsites near the Nisqually, with villages and camps frequently occurring at convergences with smaller tributary streams. Recorded artifacts include lithic scatters, charcoal deposits, and calcined bones (DAHP, 2007). Subsistence harvest of anadromous fish (salmon and trout) and supplemental hunting of upland mammals occurred along the Middle Nisqually and throughout the watershed (DAHP, 2007).
Areas of Special Interest
Areas of special interest on the Nisqually River include one active Underground Storage Tank (UST) in Reach 1 and one voluntary cleanup site at Tahoma Woods in Reach 6. No areas of rapidly developing waterfront are identified on the Nisqually River.
5.3.1.3 Reach Scale Assessment
The Nisqually River is divided into eight (8) shoreline reaches. These reaches are described as NISQ_RV_01 through 08 in the map folio and Table 5-2 below. Reaches are numbered from downstream to upstream. La Grande Reservoir and Alder Lake are located between Nisqually Reaches 5 and 6. The length of river not including La Grande and Alder Lake is 18.5 miles.
5.3.1.4 Restoration Opportunities
The Nisqually River is a highly functioning and dynamic river that has its headwaters in the Mount Rainier National Park and a delta protected by the 3,000-acre Nisqually Wildlife Refuge. The Nisqually Indian Tribe has led watershed planning and restoration for the Nisqually basin over the past 15 years. Restoration objectives for the Nisqually have focused upon salmon
Page 5-14 June 2009

Pierce County Shoreline Inventory and Characterization Report
June 2009 Page 5-15
recovery and preservation of the existing natural conditions within the Nisqually basin. The Nisqually River was listed among the ten most important rivers in Puget Sound for salmon recovery due to its remaining intact salmon habitat. According to Shared Strategy for Puget Sound, the goal for the Nisqually is protection of the mainstem core habitat and restoration of the estuary. Approximately 68% of the mainstem is already in protected status.
Several organizations are working to restore and preserve riparian and fish habitat along the Nisqually River. The Pierce Conservation District Stream Team and the Nisqually Land Trust have controlled invasive vegetation and planted thousands of trees along the river (PCD, 2008). The Nisqually Stream Stewards monitors streams, controls invasive vegetation, and plants native species. The Pierce County Noxious Weed Control Board and other groups have been treating invasive Japanese knotweed along the lower 42 miles of the river mainstem (Nisqually Indian Tribe, 2008).
The County’s Nisqually River Basin Plan (Pierce County, 2008b) includes several capital improvement projects for the river mainstem. Examples include creation of side channel habitat and large-scale revegetation. Acquisition of parcels to preserve riparian function and channel migration zones is also included as a project.
Other restoration opportunities include removal of culverts blocking salmon passage and altering sediment processes in tributaries to the Nisqually, restoring forested conditions in degraded areas of the riparian zone, and protecting feeder tributaries from sedimentation due to timber harvest, gravel mining, and other development. Restoration of a wider forested riparian zone along the LB (Pierce County side) of the Nisqually River would provide protection to the river, allow for LWD recruitment, and provide forest land for bank stabilization. Due to its good condition and the health of the basin, preservation of lands and protection of existing forested conditions are the biggest opportunities for the Nisqually River. Preservation of the existing conditions that support salmonid use in the river is desired.

Pierce County Shoreline Inventory and Characterization Report
Table 5-2. Reach Assessment for the Nisqually River
Reach Number Reach Location
Reach Length (miles)
Land Use Description Modifications Unique Features Riparian Zone
NISQ_RV_01 Fort Lewis to Horn Creek confluence
3.72 Rural residential land uses and forest lands. Two railroad bridges, SR 507 cross River.
Bridges with riprap. Pipeline easement, levees?
Forested riparian zone for most of reach, 800 to 2,000 feet wide forested zone
NISQ_RV_02 Horn Creek to Tanwax Creek confluence
2.48 Pasture lands and forest resource lands. Agricultural uses include Wilcox Farm near Harts Lake.
In-river diversion structure for Centralia Power Canal and Yelm Irrigation Ditch.
Channel braiding in this reach with LWD observed on RB.
Pasture and agricultural uses in riparian zone.
NISQ_RV_03 Tanwax Creek to Ohop Creek confluence
2.64 Largely forest resource lands, with small areas of pasture.
None Oxbow channel on LB, LWD on RB; sand bars.
Forested riparian area varies.
NISQ_RV_04 Ohop Creek to Mashel River confluence
1.29 Forest resource lands. Proposed new Washington State Park.
None. Islands and sand bars.
Forested riparian area is 200 to 300 feet wide.
NISQ_RV_05 Mashel River to La Grande Reservoir
1.60 Largely forest resource lands. Just upstream of Mashel River, bridge abutments lie in-stream from washed out road.
Tacoma Power, La Grande Powerhouse and penstock enter LB in this reach.
LaGrande Canyon thought to be natural barrier to anadromous fish.
Forested riparian area varies.
NISQ_RV_06 Upstream of Alder Lake to Copper Creek confluence.
6.51 Forest land, residential development and agricultural pastures.
Few areas of rip rap. Varies with development. Between towns of Elbe and Ashford, more developed.
NISQ_RV_07 Copper Creek to Goat Creek
0.06 Forest resource lands. No data. No data. No data.
NISQ_RV_08 Goat Creek to Mt. Rainier Nat. Park
0.19 Forest resource lands. No data. No data. No data.
Page 5-16 June 2009

Pierce County Shoreline Inventory and Characterization Report
5.3.2 Alder Lake
5.3.2.1 Physical and Biological Characterization
Drainage Basin, Tributary Streams, and Associated Wetlands
Alder Lake is a portion of the Nisqually River that is impounded behind Alder Dam, upstream of La Grande Reservoir. The town of Elbe is located on the eastern edge of Alder Lake. Alder Dam was constructed by Tacoma Power and completed in 1945. It was one of the tallest dams in the nation at the time, measuring 330 feet high and 1,600 feet in length. Alder Lake is approximately 2,800 acres in size with 28 miles of shoreline on the reservoir. Based on GIS data, approximately 10% of the Alder Lake planning area is wetland.
Geologic and Flood Hazards
Alluvial deposits and sediments may be found in the area of the lake, and volcanic bedrock with overlying alpine glacial soils are exposed on the valley walls. Identified hazards include erosion potential, seismic hazards from alluvial soils, and flooding hazard.
Critical or Priority Habitat and Species Use
There are multiple priority habitats associated with Alder Lake. These habitats include old growth habitat; Upper Nisqually bald eagle use areas; Alder Lake and associated wetland areas which are a collection of marsh, scrub-shrub, forested and riparian wetlands located above the Alder Dam; large waterfowl concentration areas; Nisqually River Harlequin duck breeding areas; Alder Lake and Upper Nisqually River riparian corridor which provides spawning and rearing habitat for resident trout or Kokanee; urban natural open space areas, including candidate open space areas and steep slope open space; snag rich habitat; Nisqually elk and deer wintering area habitats (WDFW, 2007a).
Each year, approximately 500,000 kokanee are planted in Alder Lake by Tacoma Power to provide recreational opportunities for visitors. Kokanee are landlocked sockeye salmon that live in Alder Lake for several years before spawning in area streams. Stocking of kokanee in Alder Lake began in 1999.
Instream and Riparian Habitats
Alder Lake is a man-made reservoir with the Nisqually River running through it. Instream habitats are significantly changed from the natural free-flowing river condition with the construction of the La Grande Dam in 1912 and Alder Dam in 1945. However, La Grande Dam was placed over a natural barrier to fish passage which historically limited the upstream migration of salmon (Tacoma Power, 2009).
Tacoma Power maintains riparian habitats surrounding Alder Lake for wildlife habitat through their Nisqually River Project. No wake zones have been created as part of the wildlife management plan for the riparian zone. This reduces shoreline erosion and minimizes disturbance for nesting waterfowl, and foraging for osprey and eagle (Tacoma Power, 2009).
June 2009 Page 5-17

Pierce County Shoreline Inventory and Characterization Report
Water Quality
According to the 2004 Washington State Water Quality Assessment (Ecology, 2004b), Alder Lake has one Category 2 listing for total phosphorus.
Alder Lake water quality does not appear to be substantially degraded by sediment deposition, and nutrient concentrations are below EPA criteria. Potential sources of pollution in the area surrounding the lake include stormwater runoff, erosion and forestry (Pierce County PALS, 1999).
5.3.2.2 Shoreline Use Patterns
Existing Land and Shoreline Use
The shoreline planning area of Alder Lake is dominated by rural residential development, pasture and forestry resource lands. Rural residential access roads pass through the shoreline planning area. Flooded roads can be observed entering Alder Lake from when the reservoir was flooded in 1945. A small residential community is located on the north shore of Alder Lake (off of Little Dale Road E). The town of Elbe is situated to the east of Alder Lake. A small island in the reservoir (Bogucki Island) is entirely forested.
Shoreline Modifications
Modifications along the shoreline of Alder Lake reservoir are minimal. The rural nature of development has likely limited modification to the reservoir shoreline. State Route (SR) 706 runs along several stretches of the north shore of the lake. Modifications include boat ramps at public parks and limited shoreline stabilization in the parks.
Approximately 12 private docks can be seen on aerial photographs in the community along Little Dale Road E.
Shoreline Environment Designations, Zoning, and Other Applicable Regulations
All of the shoreline of Alder Lake in Pierce County is designated Conservancy. County zoning and Comprehensive Plan designations largely follow existing land use patterns, and are dominated by Rural 10 (84% of area) and Agricultural Resource Land (6% of area).
Existing and Potential Public Access Areas
Alder Lake contains three public parks including Alder Lake Park, Sunny Beach Point, and Rocky Point owned and operated by Tacoma Power (see web site at: http://www.ci.tacoma.wa.us/power/parksandpower/parks_recreation/alder_lake_park.htm). Bogucki Island is also considered park land. A developed swimming beach is located in Alder Lake Park approximately 0.5 mile east of Alder Dam. Alder Lake Park is a 161-acre public beach and campground offering day-use areas, tent camping, RV hook-ups, picnic areas, swimming and boating facilities. Alder Lake Park contains a public boat launch and parking.
Page 5-18 June 2009

Pierce County Shoreline Inventory and Characterization Report
Sunny Beach Point is a nine-acre day-use park located to the south of Alder Lake Park just off of SR 7. Rocky Point is four miles southeast of Alder Lake Park; this park offers limited camping, picnic areas, and a boat launch. The Rocky Point boat launch is open during the summer when the Alder Lake Reservoir is at its higher elevations.
Historic and Cultural Resources
No cultural resources are inventoried within the Alder Lake area.
5.3.2.3 Reach Scale Assessment
Alder Lake, an impounded reservoir on the Nisqually River, is represented by one reach – ALD_LK_01. The reservoir shoreline is 18.85 miles long on the Pierce County side.
5.3.3 Restoration Opportunities
Planting of additional trees along the shoreline of Alder Lake could add to its riparian habitat. Riparian areas near park facilities and boat launches could also be restored.
5.4 Rivers, Shorelines of the State
5.4.1 Beaver Creek
5.4.1.1 Physical and Biological Characterization
Drainage Basin, Tributary Streams, and Associated Wetlands
Beaver Creek is a primary tributary of the Mashel River, which it joins at RM 9.3. The stream originates from a series of wetlands located within a broad valley in the foothills of the Mount-Baker Snoqualmie Forest (Kerwin, 1999b). There is a 341-acre wetland located in the middle reach of the stream. The Beaver Creek sub-basin is approximately 12 square miles in size. The headwaters of the stream are a series of extensive wetlands and beaver dam complexes (Kerwin, 1999b).
One small riparian wetland is mapped along Lower Beaver Creek. Wetlands mapped in the GIS data comprise less than 1% of the total shoreline planning area.
Geologic and Flood Hazards
Beaver Creek has its confluence with the Mashel River east of Eatonville, Washington. The lower reach of Beaver Creek flows across alpine glacial soils, and exposes intrusive and extrusive igneous bedrock and sedimentary bedrock in the upper reach. Identified hazards include flooding and localized areas of erosion potential.
Critical or Priority Habitat and Species Use
Beaver Creek supports coho, fall Chinook, winter steelhead, and cutthroat trout. Coho and coastal cutthroat trout have a documented presence within the stream, and fall Chinook and
June 2009 Page 5-19

Pierce County Shoreline Inventory and Characterization Report
winter steelhead have a presumed presence. PHS data indicates that all four species are known to utilize the stream for migration. In addition, coho have spawning habitat within Beaver Creek. Coastal cutthroat trout are present throughout the sub-basin and are present in large numbers in the wetland complexes located through the middle reaches of Beaver Creek. Coho are known to be present within the lower reaches (Kerwin, 1999b).
There are several priority habitats associated with Beaver Creek including the White River elk range; the Mashel River wetlands, consisting of some forested, riverine, emergent marsh and scrub-shrub wetlands; waterfowl concentration areas; Mashel River riparian corridor zone consisting of conifers with hardwood patches; and an Upper Nisqually River bald eagle use area (WDFW, 2007a).
Instream and Riparian Habitats
Beaver Creek flows entirely through commercial timberlands. The stream enters a narrow canyon at approximately RM 2.0. Downstream of RM 0.5, the gradient of the stream becomes flatter and the substrate is comprised of boulders with small areas of gravel interspersed (Kerwin, 1999b). The stream flows entirely within lands managed for commercial timber, and because of that, the riparian corridor consists of second growth conifer and hardwoods. Young second growth along the stream channel is a limiting factor for both LWD recruitment and the provision of shade.
With respect to barriers to fish passage, there is an impassable cascade which is located at RM 0.5 which limits fish access in the upper reaches of the creek.
Water Quality
According to the 2004 Washington State Water Quality Assessment (Ecology, 2004b), Beaver Creek is not listed for any water quality impairments. Lack of inclusion in the assessment does not indicate that the waterbody is not impaired; smaller streams are often not sampled and may not reflect degraded water quality standards.
5.4.1.2 Shoreline Use Patterns
The Beaver Creek shoreline planning area is characterized by forestry resource land use, as well as some rural development.
The existing Shoreline Environment Designation of Beaver Creek is Conservancy, where it is mapped. Comprehensive Plan designations and implementing zones follow existing land use patterns (95% Designated Forest Land, 5% Rural 20). No existing or proposed points of public access occur along the stream. No levees or other significant shoreline modifications are mapped. No cultural resources are inventoried within the Beaver Creek area.
5.4.1.3 Reach Scale Assessment
Beaver Creek is a tributary to the Mashel River and is represented by one (1) reach. This reach is labeled BEAV_CR_01, and is 5.83 miles long. Alterations to the shoreline of Beaver Creek are related to timber harvest, road crossings and sedimentation.
Page 5-20 June 2009

Pierce County Shoreline Inventory and Characterization Report
5.4.1.4 Restoration Opportunities
Restoration opportunities for Beaver Creek include restoring forested riparian areas, decommissioning timber roads or resurfacing gravel roads to reduce sedimentation inputs into streams, replacing existing culverts, and protection of associated wetlands.
5.4.2 Busy Wild Creek
5.4.2.1 Physical and Biological Characterization
Drainage Basin, Tributary Streams, and Associated Wetlands
Busy Wild Creek is a primary tributary of the Mashel River, located in the upper reach of the drainage. There are no mapped wetlands in this shoreline planning area.
Geologic and Flood Hazards
The creek exposes intrusive and extrusive igneous bedrock and sedimentary bedrock, with areas of alpine glacial soils. Identified hazards include flooding and localized areas of erosion potential.
Critical or Priority Habitat and Species Use
Busy Wild Creek supports winter steelhead, coho, channel catfish, coastal cutthroat trout, and fall Chinook. Coho, steelhead, and cutthroat salmon occur in Busy Wild Creek in low numbers (Kerwin, 1999b; Watershed Professionals Network et al., 2002). Winter steelhead, channel catfish, and cutthroat trout have a documented presence within the stream. Coho and fall Chinook have a presumed presence within the stream. PHS data indicate that all species utilize the stream for migration, and only winter steelhead has spawning habitat within the stream.
There are several priority habitats associated with Busy Wild Creek: a large waterfowl concentration area, White River elk range areas, an Upper Nisqually River bald eagle use area, and the Mashel River riparian corridor, composed of conifers with patches of hardwoods intermixed (WDFW, 2007a).
Instream and Riparian Habitats
Busy Wild Creek flows entirely within commercial forests owned by the Washington Department of Natural Resources and Champion Pacific Timberlands (Kerwin, 1999b). The riparian corridor can be characterized by young second growth which limits future LWD recruitment and the provision of shade. Much of the stream flows through steep canyon habitat (Watershed Professionals Network et al., 2002).
With the exception of the lower two miles of stream which flow through a valley, the gradient of Busy Wild Creek is fairly steep and the channel is confined in a narrow canyon (Kerwin, 1999b). There is an impassable cascade located at approximately RM 5.0 that limits upstream migration of anadromous salmonids.
June 2009 Page 5-21

Pierce County Shoreline Inventory and Characterization Report
Water Quality
According to the 2004 Washington State Water Quality Assessment (Ecology, 2004b), Busy Wild Creek is not listed for any water quality impairments. Lack of inclusion in the assessment does not indicate that the waterbody is not impaired; smaller streams are often not sampled and may not reflect degraded water quality standards.
5.4.2.2 Shoreline Use Patterns
The shoreline planning area of Busy Wild Creek is characterized by forestry resource land use.
All shorelines of the state on Busy Wild Creek lie in the Conservancy Shoreline Environment Designation. Comprehensive Plan designations and implementing zoning follow existing land use patterns (100% Designated Forest Land). The stream’s planning area is entirely outside the UGA. No information is known on shoreline modifications or the presence of cultural resources. No public access is provided and the potential for future access is low.
5.4.2.3 Reach Scale Assessment
Busy Wild Creek, a tributary to the Mashel River, is located in the upper most portion of the Mashel River basin. Busy Wild Creek is represented by one (1) reach (BUSY_CR_01); this reach is 7.55 miles long. Alterations to the shoreline of Busy Wild Creek are related to timber harvest, road crossings and sedimentation. For example, the stream lacks LWD and shade.
5.4.2.4 Restoration Opportunities
Restoration opportunities for Busy Wild Creek include restoring forested riparian areas, decommissioning timber roads or resurfacing gravel roads to reduce sedimentation inputs into streams, and replacing existing culverts to improve fish passage below RM 5.0.
5.4.3 Copper Creek
5.4.3.1 Physical and Biological Characterization
Drainage Basin, Tributary Streams, and Associated Wetlands
Copper Creek is a small tributary to the Nisqually River, with no tributaries of its own. The headwaters and drainage basin of Copper Creek lie largely within the National Forest. There are no mapped wetlands in this shoreline planning area.
Geologic and Flood Hazards
Copper Creek enters the upper reach of the Nisqually River and exposes sedimentary rocks over most of the drainage. Alluvial soils are found at the confluence with the Nisqually River, and localized intrusive igneous rocks are found in the upper reach. Identified hazards include flooding in the lower reach. Although not identified, seismic hazards from alluvial soils may be present in the lower reach.
Page 5-22 June 2009

Pierce County Shoreline Inventory and Characterization Report
Critical or Priority Habitat and Species Use
According to PHS data, Copper Creek does not support any fish species. There is one priority habitat area associated with Copper Creek: the White River elk range (WDFW, 2007a).
Water Quality
According to the 2004 Washington State Water Quality Assessment (Ecology, 2004b), Copper Creek is not listed for any water quality impairments. Lack of inclusion in the assessment does not indicate that the waterbody is not impaired; smaller streams are often not sampled and may not reflect degraded water quality standards.
5.4.3.2 Shoreline Use Patterns
The Copper Creek shoreline planning area is partly within the Mount Baker-Snoqualmie National Forest and is characterized by forestry resource uses and recreation. There is no existing shoreline environment designation for Copper Creek. County zoning and Comprehensive Plan designations are dominated by Rural 10 (70%) and Rural 40 (22%). The stream’s planning area is entirely outside the UGA.
No existing or proposed points of public access occur along the stream. No levees or other significant shoreline modifications are mapped along the Copper Creek. No cultural resources are inventoried within the shoreline planning area.
5.4.3.3 Reach Scale Assessment
Copper Creek, a tributary to the Nisqually River, is represented by one (1) reach – COPP_CR_01. This short reach (0.77 miles) lies in managed forest lands. Alterations to the shoreline of Copper Creek are likely related to timber harvest, road crossings and sedimentation.
5.4.3.4 Restoration Opportunities
Restoration opportunities for Copper Creek include restoring forested riparian areas, decommissioning timber roads or resurfacing gravel roads to reduce sedimentation inputs into streams, and replacing existing culverts, where appropriate.
5.4.4 Horn Creek
5.4.4.1 Physical and Biological Characterization
Drainage Basin, Tributary Streams, and Associated Wetlands
Horn Creek drains an area of approximately 15 square miles (Kerwin, 1999b). This creek drains directly to the Nisqually River just downstream from Harts Lake. Horn Creek is associated with wetland complexes and lakes, and is a spring fed, low-gradient stream. Riparian wetlands are mapped along Lower Horn Creek and where the stream joins the Nisqually River. Wetlands are mapped to comprise approximately 66% of the shoreline planning area.
June 2009 Page 5-23

Pierce County Shoreline Inventory and Characterization Report
Geologic and Flood Hazards
Horn Creek has its headwaters on a glacial terrace east of McKenna and merges with the Nisqually River northwest of Harts Lake. Continental glacial soils are present in the drainage. A flooding hazard is identified for the majority of the drainage, with localized areas of erosion potential. A volcanic hazard from mudflow deposits is identified for Horn Creek at the confluence with the Nisqually River.
Critical or Priority Habitat and Species Use
This stream supports populations of coho, fall Chinook, pink salmon, winter chum, winter steelhead, and cutthroat trout. All of these species have a documented presence within the stream. According to PHS data, coho have presence/migration, known spawning and known juvenile rearing in portions of the stream. Winter steelhead have presence/migration in the stream. Fall Chinook have presence/migration and known juvenile rearing. Winter chum have known spawning areas within the stream, and pink salmon have presence/migration within the stream (WDFW, 2007b). Fall Chinook, coho and chum have been observed spawning in the lower reaches of Horn Creek (Kerwin, 1999b).
There are several priority habitat areas associated with Horn Creek. There are three Nisqually River wetland areas, comprised of various wetland types, including forested, riverine, emergent marsh and scrub-shrub. In addition, there are three small Pierce County waterfowl concentrations, and two large waterfowl concentration areas (WDFW, 2007a).
Instream and Riparian Habitats
There is limited quantitative data available on habitat conditions; however, there appear to be large amounts of fine sediments downstream of RM 0.4 where the stream gradient is flat (Watershed Professionals Network et al., 2002). There is some local channel incision near the confluence with the mainstem of the Nisqually River. Although no formal investigations have been done on riparian habitat within this drainage basin, the lower reaches of Horn Creek have been reported to contain large amounts of LWD, due to beaver activity. In addition, other data indicates that the riparian habitat along Horn Creek can be generally characterized as being composed of moderate aged hardwoods and some second growth conifers (Kerwin, 1999b).
There is a waterfall located at RM 1.0 that served in the past as a barrier to upstream migration for anadromous fish; however, a fish ladder was installed in 1997 to improve upstream migration (Kerwin, 1999b).
Water Quality
According to the 2004 Washington State Water Quality Assessment (Ecology, 2004b), Horn Creek is not listed for any water quality impairments. Lack of inclusion in the assessment does not indicate that the waterbody is not impaired; smaller streams are often not sampled and may not reflect degraded water quality standards.
Water quality in Horn Creek is thought to be adversely affected by the large commercial agricultural use and hobby farms present within the drainage basin. These agricultural uses are
Page 5-24 June 2009

Pierce County Shoreline Inventory and Characterization Report
assumed to contribute higher levels of nutrients, such as phosphorus, to the waterbodies within the drainage basin (Kerwin, 1999b).
5.4.4.2 Shoreline Use Patterns
The shoreline planning area for Horn Creek is characterized by rural and agricultural land use patterns. There is no existing shoreline environment designation for Horn Creek. Comprehensive Plan designations and implementing zones largely follow existing land use and are dominated by Rural 10 and Agricultural Resource Land.
There are no bridges over Horn Creek; however, two lane surface roads do parallel portions of the stream. No cultural resources are inventoried within the Horn Creek area.
5.4.4.3 Reach Scale Assessment
Horn Creek is a short tributary to the Nisqually River located downstream of Harts Lake. Horn Creek is represented by one (1) reach – HORN_CR_01. This reach is 2.42 miles long. Alterations to this reach include lack of a forested riparian zone and nutrient inputs from agricultural land uses.
5.4.4.4 Restoration Opportunities
Restoration opportunities for Horn Creek shorelines include restoring forested riparian areas, protection of associated wetlands for the enhancement of waterfowl and wildlife habitat, restoration of wetlands to enhance water quality improvement, and protection of stream water quality through use of best management practices for agricultural businesses and hobby farms in the basin. Fish passage improvements on Horn Creek are planned as capital improvement projects by Pierce County and in the 2008 South Puget Sound salmon habitat three-year project list (Pierce County Lead Entity, 2008a).
5.4.5 Little Mashel River
5.4.5.1 Physical and Biological Characterization
Drainage Basin, Tributary Streams, and Associated Wetlands
The Little Mashel River flows from its headwaters north of the Nisqually River to its confluence with the Mashel River southwest of Eatonville, Washington. Identified tributaries include Midway Creek and South Fork Little Mashel River. The Little Mashel River is one of the primary tributaries of the Mashel River, which it joins at RM 4.4. The Little Mashel River sub-basin is 15 square miles in size.
Approximately 136 acres (44%) of the Little Mashel River planning area is mapped as wetland based on the County GIS data. A riparian wetland system is located along the Little Mashel River just upstream of its confluence with the Mashel River. Wetland habitats in this area are forested, scrub-shrub, and emergent, based on aerial photos. Additional scattered wetlands are located within the shoreline planning area farther upstream.
June 2009 Page 5-25

Pierce County Shoreline Inventory and Characterization Report
Geologic and Flood Hazards
The lowermost reach of the Little Mashel River flows across a continental glacial soil terrace and exposes localized areas of intrusive and extrusive igneous rocks. The majority of the Little Mashel River crosses alpine glacial soils. The upper reach of the Mashel River exposes intrusive and extrusive igneous bedrock. Identified hazards include flooding and localized areas of erosion potential.
Critical or Priority Habitat and Species Use
According to PHS data, the Little Mashel River supports winter chum, winter steelhead, coho, fall Chinook, and coastal cutthroat trout. With the exception of winter chum, the rest of the species have a documented presence in the stream; winter chum have a presumed presence (WDFW, 2007b). Winter steelhead and coho have known spawning areas within the Little Mashel River. Winter chum, fall Chinook and coastal cutthroat trout all have presence/migration within the river. Coastal cutthroat trout are found throughout the Little Mashel River sub-basin, and coho and Chinook have been observed below the falls at RM 0.8. Only 0.8 miles of the Little Mashel River are accessible to salmonids.
There are several areas of priority habitats associated with the Little Mashel River. These areas include: large waterfowl concentrations, numerous areas of the White River elk range, six Upper Nisqually River bald eagle use areas, an area of Mashel River wetlands, one small waterfowl concentration area, and several Mashel River riparian corridor habitat areas (WDFW, 2007a).
Instream and Riparian Habitats
The Little Mashel River flows through hobby farms and rural residential areas. The riparian corridor is largely intact and consists of hardwoods (Kerwin, 1999b). There is a waterfall located at RM 0.8 which serves as a barrier to fish passage. The substrate of the stream is composed of cobble and boulders with limited areas of gravel (Watershed Professionals Network et al., 2002).
Water Quality
According to the 2004 Washington State Water Quality Assessment (Ecology, 2004b), the Little Mashel River is not listed for any water quality impairments. Lack of inclusion in the assessment does not indicate that the waterbody is not impaired; smaller streams are often not sampled and may not reflect degraded water quality standards.
Concentrations of total phosphorus increase in the Little Mashel River during storm events and are thought to be linked to total suspended solids present in the stream (Kerwin, 1999b).
5.4.5.2 Shoreline Use Patterns
The Little Mashel River (Reaches 1 through 3) contains rural and agricultural use areas as well as areas with commercial development. Low to moderate density commercial development in Eatonville occurs in Reach 1. There are two bridges over Reach 1 of the river.
Page 5-26 June 2009

Pierce County Shoreline Inventory and Characterization Report
June 2009 Page 5-27
The existing shoreline Environment Designation of the Little Mashel River includes Rural in Reaches 1 and 2, and Conservancy in Reach 3. Comprehensive Plan designations and implementing zones largely follow existing land use patterns, and are dominated by Moderate Single Family (100% of Reach 1), and both Rural 10 and Agricultural Resource Land designations in Reaches 2 and 3. The Little Mashel River planning area is mostly inside the UGA; however Reaches 2 and 3 lie outside of the UGA boundary.
Within Reach 1, it appears that channelization has occurred; however the channel seems largely un-modified above this more urban reach. No cultural resources are inventoried within the Little Mashel River area.
5.4.5.3 Reach Scale Assessment
The Little Mashel River is a tributary to the mainstem Mashel River. This river contains three (3) reaches labeled – LMAS_RV_01 through LMAS_RV03 with a total of 4.0 river miles. Reach 1 is more modified and has altered shoreline functions compared to the other reaches. Reaches are described below in Table 5-3.
5.4.5.4 Restoration Opportunities
Acquisition of riparian and floodplain habitat near the confluence of the Mashel and Little Mashel rivers has been identified as an opportunity by the Nisqually Land Trust and Pierce County. Other restoration opportunities for the Little Mashel River shorelines include restoring forested riparian areas, protecting associated wetlands for the enhancement of waterfowl habitat, restoring wetlands to enhance water quality improvement functions, and restoring natural channel configuration.

Pierce County Shoreline Inventory and Characterization Report
Table 5-3. Reach Assessment for the Little Mashel River
Reach Number Reach Location Reach Length (miles)
Land Use Description Modifications Unique Features Riparian Zone
LMAS_RV_01 From Mashel River to UGA
0.32 Urban land uses in the town of Eatonville. Residential areas.
Creek has been channelized.
Two road crossings with bridges.
Low to moderate quality. Some trees in riparian zone.
LMAS_RV_02 From UGA to Midway Creek confluence
2.01 Rural, agricultural. Forest resource uses. Parallels Alder Cutoff Road.
Unknown. Two regional detention ponds visible from aerial photographs.
Extensive wetlands and floodplain to east and west of river
Varies.
LMAS_RV_03 Midway Creek confluence to South Fork Little Mashel
1.70 Rural, agricultural. Forest resource uses.
Unknown. Timber harvest.
Page 5-28 June 2009

Pierce County Shoreline Inventory and Characterization Report
5.4.6 South Fork of the Little Mashel River
5.4.6.1 Physical and Biological Characterization
Drainage Basin, Tributary Streams, and Associated Wetlands
The South Fork Little Mashel River flows to the Little Mashel River, east of Midway Creek. The South Fork drains an area of approximately eight square miles. There are no mapped wetlands in this shoreline planning area.
Geologic and Flood Hazards
The upper reach of the South Fork of the Little Mashel exposes extrusive igneous rocks, and the lower reach crosses alpine glacial soils. No hazards are identified at this time but flooding and localized erosion potential are likely hazards.
Critical or Priority Habitat and Species Use
PHS data does not specifically indicate the fish species that are supported in the South Fork of the Little Mashel River. Therefore, those species supported by the Little Mashel River are assumed to be supported by the South Fork. There are several priority habitat areas associated with the South Fork of the Little Mashel River. These include small and large waterfowl concentration areas, an Upper Nisqually River bald eagle use area, several areas of the White River elk range, and areas included as part of the Mashel River riparian corridor habitat areas (WDFW, 2007a).
Water Quality
As indicated previously, the Little Mashel River is not listed for any water quality impairments in the 2004 Washington State Water Quality Assessment (Ecology, 2004b).
5.4.6.2 Shoreline Use Patterns
The South Fork of the Little Mashel River contains rural residential and agricultural use areas. There is no existing Shoreline Environment Designation for the South Fork of the Little Mashel River. County zoning and Comprehensive Plan designations largely follow existing land use patterns, indicating that the reach is 100% Rural 10. The Little Mashel River planning area lies outside of the UGA boundary.
No information on modifications is available. No cultural resources are inventoried within the South Fork of the Little Mashel River area.
One area of special interest is an Ecology-identified suspected contaminated site in Reach 2 of Little Mashel Creek. This is an UST, which is listed as being actively used.
June 2009 Page 5-29

Pierce County Shoreline Inventory and Characterization Report
5.4.6.3 Reach Scale Assessment
South Fork of the Little Mashel is a tributary to the Mashel River. This creek has one (1) reach which is described as SFLM_RV_01. This reach is 0.34 miles long.
5.4.6.4 Restoration Opportunities
Restoration opportunities for the South Fork of the Little Mashel Creek shorelines include restoring forested riparian areas.
5.4.7 Lynch Creek
5.4.7.1 Physical and Biological Characterization
Drainage Basin, Tributary Streams, and Associated Wetlands
Lynch Creek is one of the two primary tributaries of Ohop Creek where its joins at RM 6.2. The headwaters of the stream originate on a ridge at approximately 3,000 feet in elevation. Lynch Creek has one tributary stream: Berg Creek. Lynch Creek flows into Ohop Creek, the outlet stream, approximately 900 feet south of Ohop Lake.
Approximately 19 acres (9%) of the Lynch Creek planning area is mapped as wetland. Small riparian wetlands are mapped along Lynch Creek just upstream of its confluence with Ohop Lake.
Geologic and Flood Hazards
Lynch Creek flows west from its headwaters west of the Mowich River to its confluence with Ohop Creek south of Ohop Lake. Lynch Creek exposes intrusive and extrusive volcanic bedrock the upper reach, crosses alpine glacial soils in the middle reach, and crosses a continental glacial soil terrace in the lower reach. Identified hazards include flooding and localized areas of erosion potential.
Critical or Priority Habitat and Species Use
Lynch Creek supports channel catfish, coastal cutthroat trout, coho, pink salmon, winter steelhead, fall Chinook, winter chum, and sockeye. Channel catfish, coastal cutthroat trout, pink salmon, and sockeye all have a documented presence within the stream, as well as use of the stream for migration (WDFW, 2007b). Fall Chinook have a documented presence in the stream as well as known spawning areas within Lynch Creek. Winter chum and winter steelhead both have a presumed presence and presence/migration within the stream. Coho has documented presence/migration and known spawning within the stream.
There is a natural falls located at RM 1.0 of the stream that blocks upstream fish access. In addition, the steep gradient in the lower reach of the stream serves as a limiting factor for spawning (Watershed Professionals Network et al., 2002).
Page 5-30 June 2009

Pierce County Shoreline Inventory and Characterization Report
There are several priority habitat areas associated with Lynch Creek. These areas include the White River elk range; Ohop Creek riparian corridor areas which are comprised of an assortment of conifer, mixed trees, and broadleaf shrub riparian habitat; a small waterfowl concentration area; and Upper Nisqually River bald eagle use area; and Ohop Creek wetland areas, comprised of forested, riparian, shrub, and agricultural wetlands (WDFW, 2007a).
Instream and Riparian Habitats
Lynch Creek flows through commercially-owned timberlands, to rural residential areas and hobby farms throughout the lower mile of the stream (Watershed Professionals Network et al., 2002). There are localized areas of residential encroachment into the riparian zone along the lower reaches of Lynch Creek; however, the remainder of the riparian area is comprised of second growth hardwoods. LWD is sparse in the lower reaches of the stream (Kerwin, 1999b).
Water Quality
According to the 2004 Washington State Water Quality Assessment (Ecology, 2004b), Lynch Creek is not listed for any water quality impairments. Lack of inclusion in the assessment does not indicate that the waterbody is not impaired; smaller streams are often not sampled and may not reflect degraded water quality standards.
Lynch Creek receives discharge from the Town of Eatonville’s stormwater collection, which contributes to a sediment load that is 17% above background values in the stream (Watershed Professionals Network et al., 2002). Forestry has been listed as a probably cause of the elevated levels of total suspended solids (TSS) within the stream.
5.4.7.2 Shoreline Use Patterns
Existing Land and Shoreline Use
Lynch Creek lies at the north end of the town of Eatonville. Lynch Creek passes from timberland in its upper reaches, through rural and agricultural areas in the lower reaches. The shoreline planning area surrounding Lynch Creek is characterized by rural residential land uses, and agricultural development patterns in the lower reaches. Upstream of the town, the creek passes through forest resource lands, through the Eatonville airport, and through an active gravel mining operation. A narrow forested riparian corridor is maintained surrounding Lynch Creek.
Shoreline modifications
No levees or other significant shoreline modifications are mapped along Lynch Creek.
Shoreline Environment Designations, Zoning, and Other Applicable Regulations
All shorelines of the state currently designated on Lynch Creek (Reaches 1 and 2) lie in the Conservancy Shoreline Environment Designation. Newly identified segments of Lynch Creek (Reaches 3 and 4) do not have a Shoreline Environment Designation. Comprehensive Plan designations and implementing zones largely follow existing land use patterns, and include Agricultural Resource Land in Reach 1, Moderate Density Single Family in Reach 2, Rural 10 in
June 2009 Page 5-31

Pierce County Shoreline Inventory and Characterization Report
Page 5-32 June 2009
Reach 3, and a mix of Rural 20, Agricultural Resource Land and Designated Forest Land in Reaches 4. Reach 1 is within Eatonville’s UGA, while Reaches 2, 3, and 4 are outside of the UGA.
Existing and Potential Public Access Areas
No existing public access is provided in the Lynch Creek planning area.
Historic and Cultural Resources
Cultural resources within the Lynch Creek shoreline planning area include recorded pre-contact materials and campsites. Native American use of the Nisqually basin area, by the Nisqually Tribe and neighboring tribes, included seasonal hunting and gathering campsites near Lynch Creek. Recorded artifacts include lithic scatters, charcoal deposits, and calcined bones (DAHP, 2007). Subsistence harvest of anadromous fish (salmon and trout) and supplemental hunting of upland mammals occurred along Lynch Creek and throughout the watershed (DAHP, 2007).
Areas of Special Interest
One area of special interest is an Ecology-identified suspected contaminated site in Reach 4 of Lynch Creek. This is an UST owned by Venture Bank, which is in an “inactive” status.
5.4.7.3 Reach Scale Assessment
Lynch Creek, a tributary to Ohop Creek (Nisqually) has four (4) reaches identified and 4.0 miles of shoreline. These reaches are labeled LYNC_CR_01 though 04 (Table 5-4). Reaches 1 and 3 of Lynch Creek contain wetlands that make up 60% of the planning area. Reaches 2 and 4 contain no wetlands.
5.4.7.4 Restoration Opportunities
Restoration opportunities for Lynch Creek shorelines include restoring forested riparian areas where they are degraded due to agricultural practices and gravel mining; decommissioning forest roads; and stabilizing slopes. Aerial photographs indicate that riparian cover is lacking within 200 feet of the stream in some locations. Restoration of degraded associated wetlands in Reaches 1 and 3 could also improve stream quality and habitat.

Pierce County Shoreline Inventory and Characterization Report
Table 5-4. Reach Assessment for Lynch Creek
Reach Number Reach Location Reach Length (miles)
Land Use Description Modifications Unique Features Riparian Zone
LYNC_CR_01 Ohop Creek confluence to Eatonville’s UGA
0.17 Agricultural lands and pasture, wetlands associated with Ohop Lake. Rural residential land uses.
Ditching and draining of associated wetlands.
Associated wetlands present.
Narrow forested riparian zone, rest is pasture.
LYNC_CR_02 East of UGA 0.56 Rural residential and forest resource lands.
No wetlands. Good forested cover.
LYNC_CR_03 Eatonville Airport 0.34 Rural residential and forest lands, passes through Eatonville airport, north of runway.
Associated wetlands present.
LYNC_CR_04 Upstream and including Berg Creek confluence
2.91 Gravel mining operation (active) within 200 feet of this reach.
Riparian habitat altered within 200 feet.
No wetlands. Mining operations near riparian zone.
June 2009 Page 5-33

Pierce County Shoreline Inventory and Characterization Report
5.4.8 Mashel River
5.4.8.1 Physical and Biological Characterization
Drainage Basin, Tributary Streams, and Associated Wetlands
The Mashel River flows from its headwaters west of Big Deer Creek and Neisson Creek, and merges with the Nisqually River northwest of La Grande, Washington. The Mashel River has 20 miles of mainstem and drains an area of 83 square miles (Watershed Professionals Network et al., 2002). The Mashel River originates on the mountain slopes associated with Mount Rainier. It is a tributary to the Nisqually River which it joins at RM 39.6. The Mashel River has three major tributaries: Busy Wild Creek, Beaver Creek, and the Little Mashel River. The Little Mashel joins the mainstem at RM 4.4 and Beaver Creek joins the mainstem at RM 9.3.
Approximately 129 acres (12%) of the Mashel River planning area is mapped as wetland based on GIS data. Small scattered riparian wetlands are mapped along the Mashel River downstream of Eatonville. Based upon aerial photography, a large riparian wetland system containing forested habitats lies immediately east of Eatonville along the Mashel.
Geologic and Flood Hazards
The lower reach of the Mashel River flows across alpine glacial soils and a continental glacial soil terrace. The upper reach of the Mashel River exposes intrusive and extrusive igneous bedrock and sedimentary bedrock. Identified hazards include volcanic hazards in the lower reach from mudflow deposits, seismic hazards in the lower reach from alluvial deposits, flooding, and localized erosion potential.
Critical or Priority Habitat and Species Use
Mashel River supports winter chum, winter steelhead, fall chum, coho, coastal cutthroat trout, channel catfish, sockeye, and pink salmon (WDFW, 2007b). All of these species have a documented presence within the river (WDFW, 2007b). Coastal cutthroat trout, channel catfish, sockeye and pink salmon all have presence/migration in the river. Winter chum and coho have presence/migration as well as known spawning areas within Mashel River. Winter steelhead and fall Chinook have presence/migration, as well as known spawning and rearing areas in the river.
There are numerous priority habitats associated with the mainstem of the Mashel River. These habitats are inclusive of: Upper Nisqually bald eagle use areas; large waterfowl concentration areas; White River elk range; old growth habitat; snag rich habitat; candidate open space areas; and Mashel River riparian habitat, which is an assortment of large and small conifers with hardwoods interspersed that provide valuable habitat and fish resource protection (WDFW, 2007a).
Instream and Riparian Habitats
The Mashel River sub-basin has limited spawning areas. The upper portion of the basin is located in a steep canyon where spawning-sized material would not be expected to be found in large quantities. The lower portion of the mainstem (below RM 6.0) has a more moderate
Page 5-34 June 2009

Pierce County Shoreline Inventory and Characterization Report
gradient and thus contains good quantities of spawning substrate (Watershed Professionals Network et al., 2002). There are small areas of spawning gravels found throughout the lower 3.2 river miles, but the dominant substrate is composed of small boulders and cobble (Kerwin, 1999b). A naturally occurring falls is present at RM 15.4 which blocks access to salmonids.
The majority of the Mashel River flows through forested lands containing second growth timber, and above RM 6.0, the sub-basin is entirely forested (Watershed Professionals et al., 2002). The lower 3.2 miles of the river are confined within a narrow canyon. The Mashel River is riprapped and channelized between RM 5.1 and RM 6.0. Upstream of RM 6.6, the river banks are unstable and failing in certain locations. In addition, low quantities of LWD exist along the river and because the riparian corridor is composed of young growth, future LWD recruitment and the provision of shade is limited (Watershed Professionals Network et al., 2002).
The Nisqually Indian Tribe, South Puget Sound Salmon Enhancement Group, and Northwest Indian Fisheries Commission have worked together to enhance and monitor salmonid habitat in the Mashel River (Leischner et al., 2006). Large woody debris and log jams were installed in the lower 1.6 miles of the Mashel River in 2004 to improve instream fish habitat. In 2005, the stream was monitored to determine the success of these habitat structures. Fish surveys conducted in 2005 indicated that a large number of pink salmon and Chinook redds were counted in the Lower Mashel River.
Water Quality
According to the 2004 Washington State Water Quality Assessment (Ecology, 2004b), the Mashel River has one Category 5 (303(d)) listing for water quality impairment for temperature. The river also has a Category 2 listing for temperature and four Category 1 listings for dissolved oxygen, fecal coliform, pH, and temperature.
Data from the Nisqually Indian Tribe’s water quality database from the 1990s indicates that minimum dissolved oxygen concentrations in the stream were above the State standard. In addition, temperature standards were exceeded at monitoring stations along the stream (Watershed Professionals Network et al., 2002). Forestry and other natural causes have been listed as probable sources for the temperature departures from the State standard. Forestry has also been listed as a probably source for elevated TSS concentrations in the stream during the wet season (Watershed Professionals Network et al., 2002).
In addition, the Town of Eatonville operates a secondary treatment sewage plant that discharges into the Mashel River at RM 5.4. This facility is thought to be a source of elevated total phosphorus within the river.
June 2009 Page 5-35

Pierce County Shoreline Inventory and Characterization Report
5.4.8.2 Shoreline Use Patterns
Existing Land and Shoreline Use
The Mashel River (Reaches 1 through 7) passes through rural and agricultural areas in the lower reaches, and eventually into timber land. The shoreline planning area surrounding the Mashel River is characterized by rural, vacant (unused), and agricultural development patterns in the lower reaches, with areas of forestry occurring predominantly from Reach 5 above. Portions of roadways parallel the Mashel River, and several roadway bridge and major utility crossings occur. Major overhead powerlines cross the river in Reach 2.
Shoreline modifications
No levies or other significant shoreline modifications are mapped along Mashel River.
Shoreline Environment Designations, Zoning, and Other Applicable Regulations
The existing Shoreline Environment Designations on Mashel River include Natural and Conservancy in Reach 1, Conservancy in Reach 2, Rural and Rural/Residential in Reach 3 and Conservancy and Rural Residential in Reach 4. Reach 5 has a shoreline designation of Conservancy, where mapped. Reaches 6 and 7 do not have a shoreline designation. Comprehensive Plan designations and implementing zones largely follow existing land use patterns, and are dominated by Moderate Single Family, Rural 10 and Designated Forest Land (100% in Reaches 4 through 7). The Mashel River passes outside the UGA; however the majority of Reach 1 is inside the UGA.
Existing and Potential Public Access Areas
No existing or proposed points of public access occur along the Mashel River. However, as described above in the Nisqually River section, a new state park is proposed for development on the Nisqually and Mashel Rivers. The proposed Nisqually-Mashel State Park is a 1,230-acre property at the confluence of these rivers. This new park would include portions of the lower reaches of the Mashel River. See Section 5.3.1.2.
Historic and Cultural Resources
Cultural resources within the Mashel River shoreline planning area include recorded pre-contact materials and campsites. Native American use of the Mashel River area, by the Nisqually Tribe and other neighboring tribes, included seasonal hunting and gathering campsites near the Mashel River. Recorded artifacts include lithic scatters, charcoal deposits, and calcined bones (DAHP, 2007). Subsistence harvest of anadromous fish (salmon and trout) and supplemental hunting of upland mammals occurred along the Mashel River and throughout the watershed (DAHP, 2007).
5.4.8.3 Reach Scale Assessment
Mashel River is a significant tributary to the Nisqually River. The Mashel River planning area is divided into seven (7) reaches; these are labeled as MASH_RV_01 through 07 (Table 5-5). The
Page 5-36 June 2009

Pierce County Shoreline Inventory and Characterization Report
June 2009 Page 5-37
river lies mostly within agricultural and forest resource lands. The total length of the Mashel River identified as a shoreline is 17.97 miles.
5.4.8.4 Restoration Opportunities
The South Puget Sound Salmon Enhancement Group (SPSSEG) and Nisqually Tribe led restoration efforts on the Lower Mashel River near Eatonville. In 2004, seven engineered logjams were constructed. In 2006 and 2007, a total of 13 engineered logjams were installed to increase large woody debris and enhance in-channel habitat. Long term habitat monitoring of this section of the Mashel River is underway to determine the use and success of the restoration project. SPSSEG conducted habitat monitoring in 2007 and 2008. Funding for this project was provided by the Salmon Recovery Funding Board, U.S. Fish and Wildlife Service, and National Wildlife Foundation (SSPEG, 2006, 2009a).
Pierce County has identified acquisition of shoreline properties along the Mashel River in and near Eatonville as capital improvement projects in the Nisqually River Basin Plan (Pierce County, 2008b).
Other restoration opportunities for the Mashel River shorelines include restoring forested riparian areas where they are degraded due to agricultural practices and timber harvest. Aerial photographs indicate that riparian cover is lacking within 200 feet of the stream in some locations. This limits the recruitment of LWD. Decommissioning timber roads or resurfacing gravel roads would reduce sedimentation inputs into streams. Culverts could be replaced where appropriate.

Pierce County Shoreline Inventory and Characterization Report
Table 5-5. Reach Assessment for Mashel River
Reach Number Reach Location Reach Length (miles)
Land Use Description Modifications Unique Features Riparian Zone
MASH_RV_01 Confluence with Nisqually River upstream to SR 7 3.64
Rural residential and forest lands. Highly sinuous channel in steep ravine.
Forested riparian zone of 200 feet wide leaving CMZ uncut.
MASH_RV_02 SR 7 to Eatonville UGA
1.03
Rural residential and agriculture. Riprap at SR 161 crossing. Eatonville WWTF on LB, large pond east of SR 161
Creek channel straighter.
Forest riparian zone 60 to 150 feet wide.
MASH_RV_03 East of Eatonville 1.17
Rural residential, timber lands. Wide CMZ Timber cutting in riparian zone.
MASH_RV_04 To Beaver Creek confluence 4.04
Forest resource lands Wide CMZ Timber cutting in riparian zone.
MASH_RV_05 Beaver Creek to Busy Wild confluence 4.40
Forest resource lands No data No data Timber cutting in riparian zone.
MASH_RV_06 Busy Wild Creek to Unnamed Tributary 1.28
Forest resource lands No data No data Timber cutting in riparian zone.
MASH_RV_07 Upstream from confluence with Unnamed Tributary 2.41
Forest resource lands No data No data Timber cutting in riparian zone.
Page 5-38 June 2009

Pierce County Shoreline Inventory and Characterization Report
5.4.9 Unnamed Tributary, Mashel River
5.4.9.1 Physical and Biological Characterization
Drainage Basin, Tributary Streams, and Associated Wetlands
An unnamed tributary flows in to the Mashel River from the west, and converges just upstream of the confluence of Busy Wild Creek and the mainstem Mashel. No wetlands are anticipated or mapped due to the steep terrain.
Geologic and Flood Hazards
This tributary of the Mashel River is located northeast of Busy Wild Creek and exposes intrusive and extrusive igneous bedrock and sedimentary bedrock. No hazards are identified, but likely hazards may include flooding and localized areas of erosion potential.
Critical or Priority Habitat and Species Use
There is one priority habitat associated with this unnamed tributary of the Mashel River, an area of the White River elk range (WDFW, 2007a). There are no mapped wetlands in this reach.
Water Quality
According to the 2004 Washington State Water Quality Assessment (Ecology, 2004b), the unnamed tributary to Mashel River is not listed for any water quality impairments. Lack of inclusion in the assessment does not indicate that the waterbody is not impaired; smaller streams are often not sampled and may not reflect degraded water quality standards.
5.4.9.2 Shoreline Use Patterns
The Unnamed Tributary of the Mashel River lies within timberlands. Forest logging roads parallel and cross this tributary. No levees or other significant shoreline modifications are mapped along the unnamed tributary of Mashel River.
There is no existing Shoreline Environment Designation for the unnamed tributary of Mashel River. Comprehensive Plan designations and implementing zones follow existing land use patterns which include 100% Designated Forest Land. The unnamed tributary of Mashel River lies fully outside of the UGA.
No existing or proposed points of public access occur along the stream.
Historic and Cultural Resources
Cultural resources within the Mashel River area include recorded pre-contact materials and campsites. Native American use of the Mashel River area, by the Nisqually Tribe and other neighboring tribes, included seasonal hunting and gathering campsites near the Mashel River. Recorded artifacts include lithic scatters, charcoal deposits, and calcined bones (DAHP, 2007).
June 2009 Page 5-39

Pierce County Shoreline Inventory and Characterization Report
Subsistence harvest of anadromous fish (salmon and trout) and supplemental hunting of upland mammals occurred along the Mashel River and throughout the watershed (DAHP, 2007).
5.4.9.3 Reach Scale Assessment
The Unnamed Tributary, Mashel River has one reach identified. This reach is labeled UTMR_CR_01. This reach is 2.93 miles long. Alterations to the creek are not well documented; however, timber harvest and sedimentation due to gravel forest roads are likely.
5.4.9.4 Restoration Opportunities
Restoration opportunities for the Unnamed Tributary of the Mashel River include restoring forested riparian areas, decommissioning timber roads or resurfacing gravel roads to reduce sedimentation inputs into streams, and replacing existing culverts, where appropriate.
5.4.10 Midway Creek
5.4.10.1 Physical and Biological Characterization
Drainage Basin, Tributary Streams, and Associated Wetlands
The Midway Creek sub-basin is 8 square miles in size. Midway Creek is a tributary to the Little Mashel River. There is a 555-acre wetland complex bisected by roads that extends along the stream (Kerwin, 1999b). There are no mapped wetlands in this shoreline planning area.
Geologic and Flood Hazards
Midway Creek flows from its headwaters north of Alder Lake to its confluence with the Little Mashel River southeast of Eatonville, Washington. Midway Creek crosses alpine glacial soils. Identified hazards include flooding and localized areas of erosion potential.
Critical or Priority Habitat and Species Use
Midway Creek supports coastal cutthroat trout. This species has a document presence within the stream as well as use of the stream for migration.
There are several priority habitat areas associated with Midway Creek. These areas include the White River elk range; an Upper Nisqually River bald eagle use area; Mashel River riparian corridor areas, composed of conifers with hardwoods intermixed; Mashel River wetland areas, composed of forested, riverine, emergent marsh, and scrub-shrub wetlands; and two large waterfowl concentration areas (WDFW, 2007a).
Water Quality
According to the 2004 Washington State Water Quality Assessment (Ecology, 2004b), Midway Creek is not listed for any water quality impairments. Lack of inclusion in the assessment does not indicate that the waterbody is not impaired; smaller streams are often not sampled and may not reflect degraded water quality standards.
Page 5-40 June 2009

Pierce County Shoreline Inventory and Characterization Report
5.4.10.2 Shoreline Use Patterns
Midway Creek passes through predominantly rural and agricultural areas, although areas of forestry land use also occur. There is no existing Shoreline Environment Designation for Midway Creek. Comprehensive Plan designations and implementing zones include Rural 10 and Agricultural Resource Land.
There are no bridges over Midway Creek; however two lane surface roads do parallel portions of the stream. No public access or parks lie along Midway Creek.
No cultural resources are inventoried within the Midway Creek area. However seasonal hunting could have occurred in the area, and as such there is some potential for the presence of cultural resources.
5.4.10.3 Reach Scale Assessment
Midway Creek, a tributary to the Little Mashel River, is characterized by one (1) reach – MIDW_CR_01. This reach is 2.59 miles long.
5.4.10.4 Restoration Opportunities
Restoration opportunities for Midway Creek include restoring forested riparian areas, using best management practices to reduce sediment loss during agricultural lands uses, and replacing existing culverts, where appropriate.
5.4.11 Muck Creek
5.4.11.1 Physical and Biological Characterization
Drainage Basin, Tributary Streams, and Associated Wetlands
The Muck Creek basin is the largest basin in the Nisqually River watershed, and comprises approximately 93 square miles. It is inclusive of Muck Creek, and its three primary tributaries: Lacamas Creek, the North Fork of Muck Creek, and the South Fork of Muck Creek, also referred to as South Creek (Pierce County, 2003). The North and South Forks drain the eastern two-thirds of the basin. The North Fork drains approximately 20.5 square miles, and the South Fork drains approximately 36.6 square miles (Pierce County, 2003). The Lacamas Creek is the smallest tributary, with a drainage area of approximately 15.2 square miles. Muck Creek joins the Nisqually River at RM 10.6.
Muck Creek originates as two major forks from a series of springs and seeps in the eastern portion of the basin. The North Fork begins west of Graham, and flows westerly, joining the South Fork in the north-central portion of the basin (Pierce County, 2003). The South Fork of Muck Creek originates south of Graham and flows southwest to the south-central portion of the basin. Below the junction of the two forks, the mainstem of Muck Creek flows westerly through Fort Lewis and the City of Roy, where Lacamas Creek joins the mainstem. With the exception of a short segment of the stream which flows through Roy, a majority of the mainstem of Muck
June 2009 Page 5-41

Pierce County Shoreline Inventory and Characterization Report
Creek (or the lower 7.0 miles) flows within Fort Lewis (Pierce County, 2003). Muck Creek flows into the Nisqually River at approximately 10 miles upstream of the mouth of the river.
Approximately 85 acres (43%) of the Muck Creek planning area is wetland, based on County GIS data. Narrow riparian forested wetlands are mapped along much of Muck Creek upstream of Fort Lewis.
Geologic and Flood Hazards
Muck Creek extends from its headwaters west of Graham, Washington and flows west and south to its confluence with the Nisqually River southwest of Roy, Washington. Tributaries of Muck Creek include South Creek and Lacamas Creek. Muck Creek flows through or receives drainage from a number of lakes (including Nisqually Lake, Muck Lake, Chambers Lake, and Shaver Lake). Within the drainage area, there are also a number of lakes that have formed in closed depressions (i.e. Hamilton Lake and Dailman Lake). Muck Creek flows across continental glacial soil terraces and alluvial soils may be present in the drainage. A seismic hazard is identified for peat and alluvial deposits situated in the upper reach of Muck Creek. A flooding hazard is identified for the majority of Muck Creek. A volcanic hazard from mudflow deposits is identified for Muck Creek in the Nisqually River valley. Erosion potential is identified in localized areas of Muck Creek, especially in the area of the lakes.
Critical or Priority Habitat and Species Use
Muck Creek supports the following species: winter chum, winter steelhead, coho, coastal cutthroat trout, fall Chinook, and pink salmon (WDFW, 2007b). All of these species with the exception of pink salmon, which has a presumed presence, have a documented presence within the stream. Coastal cutthroat trout, fall Chinook, and pink salmon have presence/migration within the stream. Winter chum and coho have presence/migration, and designated spawning areas within the stream. Winter steelhead have presence/migration, as well as juvenile rearing areas within Muck Creek (WDFW, 2007b). There are no known man-made barriers to salmon migration on Muck Creek (Kerwin, 1999b).
There are five broad categories of habitat limiting factors in Muck Creek: riparian function, fish passage, sedimentation, channel morphology, and exotic plant species. Each of these categories is briefly summarized below (Pierce County, 2003).
• Riparian Function – Riparian clearing has affected habitat within the stream by reducing or removing shade, overhead cover, terrestrial insects, large woody debris (LWD) and leaf litter recruitment (Pierce County, 2003). Loss of shade leads to higher stream temperatures, and loss of overhead cover leads to a reduction in protection from birds. LWD is important for fish for several reasons: it plays a role in pool formation and instream cover, it provides substrate for insects and gravel transport, and helps to form complex habitats (Pierce County, 2003).
• Fish Passage – The intermittent flow in Muck Creek has had a significant impact on fish passage and salmon population. Portions of the creek experience periods of both low and no flow. The timing of salmon runs is dependent upon the flow regime and Muck Creek is only accessible to salmon after mid-December, until late spring when flows
Page 5-42 June 2009

Pierce County Shoreline Inventory and Characterization Report
begin to decline (Pierce County, 2003). Salmonid runs in Muck Creek occur relatively late when compared with the majority of runs in the larger Puget Sound region, which indicates that the creek has had an intermittent nature for a long period of time. The intermittent nature of the stream is thought to be worsening and limits salmon production by constricting spawning timing, incubation, and early-rearing opportunities (Pierce County, 2003).
In addition to the intermittent flow issues within Muck Creek, reed canarygrass forms a physical barrier to fish passage in some segments of the stream.
• Sedimentation – Sedimentation, primarily caused by unrestricted livestock access to the stream, has been found to be heavy in glide areas and moderate in areas with intermediate gradients. This sedimentation has led to a lack of suitable stream substrate for fish spawning.
• Channel Morphology – A larger portion of Muck Creek and its tributaries have been channelized and cleared, leading to a narrow, confined stream channel with limited floodplains. The combination of channel constriction, straightening, and clearing serves to increase water velocity and significantly degrades habitat quality for salmon, specifically a loss of quality pool habitat (Pierce County 2003).
• Problem Plant Species – Reed canarygrass is a significant problem in the overall Muck Creek basin, as it has a widespread occurrence and fills small channels and can serve to confine larger channels, which ultimately leads to reduced channel conveyance capacity and flooding hazards (Pierce County, 2003). Reed canarygrass is removed by dredging the channel; however, that results in sedimentation downstream, leading to habitat degradation.
There are several priority habitats associated with Muck Creek. There are two large waterfowl concentration areas; Muck Creek wetland areas which are composed of forested, emergent, and scrub-shrub wetlands; and areas of Muck Creek riparian habitats, which include some riverine wetlands (WDFW, 2007a).
Instream and Riparian Habitats
There are numerous reaches of the mainstem of Muck Creek and its tributaries with no riparian vegetation other than grasses. Where riparian vegetation does exist, it is dominated by species such as alders, maples, cottonwood, salmonberry, and reed canarygrass (Pierce County, 2003).
The mainstem of Muck Creek is approximately 14 miles in length, the majority of which flows through Fort Lewis. The lower 2 or 3 miles of the mainstem is characterized by numerous pools and a relatively deep channel with sparse substrate (Pierce County, 2003). A majority of the riparian zone within the boundaries of Fort Lewis is coniferous, with varying habitat quality. The stream gradient is generally shallow with a few moderate reaches, primarily in the lower sections of the stream, where it cuts through a canyon.
In terms of spawning habitat, field observations have indicated that it is marginal in quality through the Muck Creek basin, but not limiting for coho and chum salmon. Spawning habitat does appear to be a limiting factor for cutthroat trout because of the scarcity of suitable-sized
June 2009 Page 5-43

Pierce County Shoreline Inventory and Characterization Report
gravel. Substrate throughout the overall basin was found to be either large gravel, cobble, or sand/silt and cutthroat trout prefer small gravel (Pierce County, 2003).
Water Quality
There are two major water quality issues occurring in the Muck Creek basin: temperature and bacteria, and the water quality standards for these two parameters are frequently exceeded (Pierce County, 2003). The removal of riparian vegetation, coupled with naturally low stream flows lead to higher temperatures that can be stressful to salmonids. Higher levels of bacteria stem from livestock, as cattle ranching operations are present throughout the basin (Pierce County, 2003).
However, according to recent water quality data for Muck Creek (2000-2001), the chemical quality of the stream is reasonably good, and observations have indicated that Muck Creek was least impacted by nonpoint source pollution out of the major streams in the Lower Nisqually River basin (Pierce County, 2003). Water temperature readings exceeded the state standard several times during the summer of 2000, but readings for pH generally remained within stream water quality standards and there was only one instance where ammonia exceeded the standard (Pierce County, 2003).
According to the 2004 Washington State Water Quality Assessment (Ecology, 2004b), Muck Creek does not have any Category 5 (303(d)) listings for water quality impairment. However, Muck Creek has two Category 2 listings for dissolved oxygen and fecal coliform, and two Category 1 listings for pH and temperature.
5.4.11.2 Shoreline Use Patterns
Existing Land and Shoreline Use
Only a small segment of Muck Creek lies within County shoreline jurisdiction. Most of the creek lies downstream within the federal lands of Fort Lewis. The Muck Creek shoreline planning area is characterized by rural residential development and agricultural land uses. Pasture lands and scattered forests are visible on aerial photographs in the GIS data.
Muck Creek lies within active pastures and lacks a forested riparian zone in these areas. Ditching and draining of adjacent lands has also occurred, some of which are associated wetlands. No structures or levees occur along Muck Creek. Residential roads cross the creek. SR 7 crosses Muck Creek upstream of its designation as a shoreline of the state.
There is no existing Shoreline Environment Designation on Muck Creek. Comprehensive Plan designations and implementing zones largely follow existing land use and are considered Rural 10. No public access, parks or open space is currently provided in the Muck Creek planning area.
Cultural resources have not been inventoried within the Muck Creek area. However seasonal hunting by the Nisqually Tribe could have occurred in the area, and as such there is some potential for the presence of cultural resources.
Page 5-44 June 2009

Pierce County Shoreline Inventory and Characterization Report
Sedimentation and bank stability are areas of special interest for Muck Creek. No suspected contaminants or hazardous waste have been identified for this shoreline area.
5.4.11.3 Reach Scale Assessment
Muck Creek, a major tributary to the Nisqually River, largely lies with federal lands of Fort Lewis. One reach is found within Pierce County jurisdiction; this is referred to as MUCK_CR_01. The Muck Creek reach is 2.59 miles long.
5.4.11.4 Restoration Opportunities
The Muck Creek Basin Plan (Pierce County, 2003) provides for long-term restoration focused on establishment of a functional riparian corridor along the stream system through large-scale plantings of riparian vegetation and exclusion of agricultural activities, primarily grazing by cattle and horses, from the corridor. The basin plan states that the restoration program should be focused in those areas of the creek that maintain perennial flow such as the North Fork, Lacamas Creek, and a two-mile segment of the South Fork from approximately 3 to 5 miles above the confluence with the North Fork. Altogether these areas include about 12 stream miles.
Other restoration opportunities for Muck Creek include using best management practices to reduce sediment loss during agricultural lands uses, and replacing existing culverts where appropriate to improve fish passage. Removal and control of invasive plant species such as reed canarygrass is also an opportunity for shoreline restoration.
5.4.12 Ohop Creek - Nisqually
5.4.12.1 Physical and Biological Characterization
Drainage Basin, Tributary Streams, and Associated Wetlands
Ohop Creek flows from its headwaters south of Lake Kapowsin south and west to its confluence with the Nisqually River northwest of La Grande, Washington. Ohop Creek is a tributary to the Nisqually River, which it joins at RM 37.3. Ohop Creek drains an area of approximately 44 square miles and has two primary tributary streams: Lynch Creek and Twenty-five Mile Creek which join the stream at RM 6.2 and 9.9, respectively (Watershed Professionals Network et al., 2002). Ohop Creek flows through Ohop Lake located northwest of Eatonville, Washington, between RM 6.2 and 9.9.
Approximately 682 acres (70%) of the Ohop Creek planning area consists of wetland, based on GIS data. Riparian wetlands are mapped along most of Ohop Creek within the shoreline planning area. Wetlands habitats include palustrine emergent, scrub-shrub and forested communities.
Geologic and Flood Hazards
Ohop Creek has developed on a continental glacial soil terrace. Peat and alluvial soils may be found in the valley floor, especially in the area of Ohop Lake. Identified hazards include
June 2009 Page 5-45

Pierce County Shoreline Inventory and Characterization Report
volcanic hazards from mudflow deposits, seismic hazards from peat and alluvial soils, flooding, and localized areas of erosion potential.
Critical or Priority Habitat and Species Use
Ohop Creek supports the following fish species: winter steelhead, coho, sockeye, coastal cutthroat trout, channel catfish, pink salmon, winter chum, and fall Chinook. The PHS data indicates that each of these species has a documented presence within the stream. Sockeye, coastal cutthroat trout, and channel catfish have presence/migration use within the stream. Pink and winter chum have presence/migration and spawning areas within the Ohop Creek. Fall Chinook have spawning and juvenile rearing areas within the stream. Winter steelhead and coho have presence/migration, spawning and juvenile rearing areas within Ohop Creek (WDFW, 2007b).
Lower Ohop Creek supports populations of coho, Chinook, pink, winter steelhead, and coastal cutthroat trout (Watershed Professionals Network et al., 2002).
Ohop Creek has multiple priority habitats associated with it. These habitats include: the Kapowsin Lake wetlands; the White River elk range; small and large waterfowl concentration areas; snag rich habitat; Kapowsin Creek riparian habitat; Upper Nisqually bald eagle use areas; Ohop Creek riparian habitat composed of an assortment of conifers, mixed trees, broadleaf shrubs, and agricultural riparian habitats; urban natural open space, including Puyallup steep slopes and candidate open space areas; Ohop Creek wetlands; and Lower Nisqually River riparian habitat (WDFW, 2007a).
Instream and Riparian Habitats
Ohop Creek has varying riparian habitat along its channel. Downstream of RM 0.3, a limited hardwood riparian corridor exists; however, from RM 0.3 to RM 4.5, the creek is channelized with no intact riparian corridor present, and can be characterized as having a sand and silt substrate (Watershed Professionals Network et al., 2002). Due to the limited riparian corridor, instream LWD is low and water temperatures within the stream are high. From RM 4.5 to RM 6.2, there is a narrow corridor of hardwoods present, and there are small areas of pools and riffles formed by the woody inputs of the riparian area. Ohop Lake is located within the stream channel (between RM 6.2 and RM 9.9) and a log weir at the lake may serve in delaying upstream migration with the stream. Because of the low gradient of the stream, there are high sediment concentrations throughout, and spawning locations have been documented to contain more than 17% fines.
Downstream of Ohop Lake, the effects of channelization associated with past agricultural activities are evident in the form of little or no off-channel rearing opportunities and meanders, and a lack of riparian area. In addition, there is little LWD in this reach (Kerwin, 1999b).
Page 5-46 June 2009
Pierce County Shoreline Inventory and Characterization Report
Water Quality
According to the 2004 Washington State Water Quality Assessment (Ecology, 2004b), Ohop Creek has one Category 5 (303(d)) listing for fecal coliform. In addition, Ohop Creek has four Category 1 listings for temperature, dissolved oxygen, and pH. There is low dissolved oxygen present throughout the stream, due in part to the lack of riparian corridor.
The Nisqually Tribe Water Quality data for 1991-1992 and 1995-1997 indicate that dissolved oxygen levels and temperature levels were exceeded, especially during the summer months for dissolved oxygen levels (Watershed Professionals Network et al., 2002).
The Department of Ecology completed a TMDL study for fecal coliform bacteria during 2002-2003 for several waterbodies, including Ohop Creek. The results of this study indicate that bacteria levels in Ohop Creek have greatly improved since the early 1990’s; however, load allocations for fecal coliform were deemed necessary for several sites in the creek downstream of Ohop Lake during the dry season, and for Lynch Creek (Ecology, 2005b).
5.4.12.2 Shoreline Use Patterns
Ohop Creek (Nisqually) passes through predominantly rural and agricultural areas, although areas of forestry land use also occur. The existing Shoreline Environment Designation of Ohop Creek (Nisqually) is Rural. Comprehensive Plan designations and implementing zones follow existing land use and include Rural 10, Rural 20, Agricultural Resource Land, and Designated Forest Land.
Modifications in the Ohop Creek planning area include roads, utilities, bridges, and alterations related to agricultural land practices. SR 7 and 161 cross Ohop Creek as does Ohop Valley Road. Oroville Road parallels Ohop Creek on the west side, upstream of Ohop Lake. The TMBL Railroad tracks parallel the creek on the east side. Ditching and draining of associated wetland occurs north and south of Ohop Lake. Forest cover is lacking in agricultural areas.
No cultural resources are inventoried within the Ohop Creek (Nisqually) area. However seasonal hunting by the Nisqually Tribe could have occurred in the area, and there is some potential for the presence of cultural resources. There are a series of historical structures within the Ohop valley that are registered on the State and National Registries of Historic Places. Structures are associated with late 19th century and early 20th century homesteading and settlement of the valley, making up the Ohop rural farming community.
5.4.12.3 Reach Scale Assessment
Ohop Creek (Nisqually) is a tributary to the Nisqually River and the outlet of Ohop Lake. Ohop Creek is referenced as four (4) reaches – OHOP_NIS_CR_01 to 04.
5.4.12.4 Restoration Opportunities
In an effort to develop an appropriate multiple fish species management plan for the Nisqually River basin, the Nisqually Tribe analyzed fall Chinook salmon using the Ecosystem Diagnosis and Treatment (EDT) model (Nisqually Chinook Recovery Team, 2001). The EDT model ranked the lower 6.3 miles of Ohop Creek as among the highest priority tributary reaches in need
June 2009 Page 5-47

Pierce County Shoreline Inventory and Characterization Report
of restoration for salmonid habitat. In 2002, the Nisqually Tribe led efforts in preparation of the Lower Ohop Creek Enhancement Plan (Homza et.al, 2002). Several channel reconstruction measures and other stream enhancement measures were evaluated in this Phase 1 study.
The Pierce County Conservation District, SPSSEG, and the Nisqually Tribe have evaluated restoration opportunities for the Ohop valley (Watershed Professionals and Geoengineers, 2006). Placement of engineered logjams is slated by SPSSEG for summer of 2008 and 2009 (SPSSEG, 2008).
The Nisqually Land Trust owns 200 acres in the Ohop Creek valley. The Land Trust and partner organizations have begun a large-scale restoration project in the valley to restore meanders to the stream, which was historically channelized for agriculture. The project also includes restoration of floodplain wetlands (Nisqually Indian Tribe, 2008; Nisqually Land Trust, 2006).
In addition to the County’s participation in the Lower Ohop Creek valley restoration project, the Nisqually River Basin Plan (Pierce County, 2008b) includes capital improvement projects to acquire shoreline properties along reaches of Upper Ohop Creek that are accessible to anadromous fish.
Other restoration opportunities for Ohop Creek include restoring forested riparian areas, using best management practices to reduce sediment loss during agricultural lands uses, and replacing existing culverts where appropriate to improve fish passage. Removal and control of invasive plant species such as reed canarygrass is also an opportunity for shoreline restoration.
5.4.13 South Creek
5.4.13.1 Physical and Biological Characterization
Drainage Basin, Tributary Streams, and Associated Wetlands
South Creek is a tributary of Muck Creek and originates south of Graham and flows southwest to the south-central portion of the basin, where it begins to flow northwest to join the North Fork of Muck Creek. South Creek is 17 miles in length and drains an area of approximately 36.6 square miles. The upper portion of South Creek splits into a northerly and southerly branch (Pierce County, 2003).
Approximately 612 acres (71%) of the South Creek planning area is wetland, based on GIS data. An extensive system of riparian wetlands is mapped along almost the entire length of South Creek within the shoreline planning area. These wetlands include palustrine emergent, scrub-shrub, and forested habitat types.
Geologic and Flood Hazards
South Creek extends from its headwaters west of Graham, Washington and flows west and south to its confluence with Muck Creek in the Fort Lewis area. South Creek flows across continental glacial soil terraces and alluvial soils and peat may be present in the drainage. A seismic hazard is identified for alluvial deposits situated in the upper reach of South Creek. A flooding hazard is identified for South Creek. Erosion potential is identified in localized areas of South Creek.
Page 5-48 June 2009

Pierce County Shoreline Inventory and Characterization Report
Critical or Priority Habitat and Species Use
South Creek supports the following species: winter chum, coho, winter steelhead, and coastal cutthroat trout. All of these species, with the exception of winter steelhead, have a documented presence in South Creek; winter steelhead has a presumed presence (WDFW, 2007b). In addition, all of the species have presence/migration use within South Creek. No spawning or rearing use areas have been designated for any of the aforementioned species.
There are several priority habitats associated with South Creek. These include small and large waterfowl concentration areas; Muck Creek riparian habitat areas which include riverine wetlands; and Muck Creek wetlands which are composed of riparian, forested, emergent and scrub-shrub wetlands (WDFW, 2007a).
Instream and Riparian Habitats
The lower section of South Creek, above 8th Avenue, has been classified as having highly suitable habitat (Pierce County, 2003). Outside of Fort Lewis, where South Creek flows, riparian corridors are typically narrow due to development. Riparian buffers can be as narrow as one row of trees or completely absent where they are limited by grazing. The widest corridors do not exceed 40 to 50 feet in width (Pierce County, 2003). Riparian growth, where it does exist, is often limited to young trees which do not provide large woody debris to the stream, thus reducing habitat complexity and few areas with high quality ponds.
Water Quality
According to the 2004 Washington State Water Quality Assessment (Ecology, 2004b), South Creek is not listed for any water quality impairments. Lack of inclusion in the assessment does not indicate that the waterbody is not impaired; smaller streams are often not sampled and may not reflect degraded water quality standards.
5.4.13.2 Shoreline Use Patterns
South Creek passes through predominantly rural and agricultural areas, although areas of forestry land use also occur. The existing Shoreline Environment Designation of South Creek is Rural, where it is mapped. Comprehensive Plan designation and implementing zones follow existing land use and include Rural 10 and Agricultural Resource Land.
Modifications include roads, loss of riparian forest, and ditching and draining of wetlands. There are no bridges over South Creek; however two lane surface roads do parallel short portions of the stream. Forested riparian cover is lacking in agricultural areas which have been converted to pasture.
No cultural resources are inventoried within the South Creek area. However seasonal hunting by the Nisqually Tribe could have occurred in the area, and as such there is some potential for the presence of cultural resources.
June 2009 Page 5-49
Pierce County Shoreline Inventory and Characterization Report
5.4.13.3 Reach Scale Assessment
South Creek, a tributary to Muck Creek, is represented by one reach – SOUT_CR_01. The South Creek shoreline planning area contains extensive wetlands as evidenced by the width of the reach.
5.4.13.4 Restoration Opportunities
The Muck Creek Basin Plan (Pierce County, 2003) provides for long-term restoration focused on establishment of a functional riparian corridor along the South Creek system through large-scale plantings of riparian vegetation and exclusion of agricultural activities, primarily grazing by cattle and horses, from the corridor. The basin plan states that the restoration program should be focused in those areas of the Muck Creek basin that maintain perennial flow such as a two-mile segment of the South Fork Muck Creek (South Creek) from approximately 3 to 5 miles above the confluence with the North Fork.
General restoration opportunities for South Creek include restoring forested riparian areas, using best management practices to reduce sediment loss during agricultural lands uses, replacing existing culverts where appropriate to improve fish passage, and restoring degraded wetlands. Removal and control of invasive plant species such as reed canarygrass is also an opportunity for shoreline restoration.
5.4.14 Tanwax Creek
5.4.14.1 Physical and Biological Characterization
Drainage Basin, Tributary Streams, and Associated Wetlands
Tanwax Creek flows from its headwaters west of Lake Kapowsin south and west to its confluence with the Nisqually River northwest of Kreger Lake. Tanwax Creek either flows through or receives drainage from a number of lakes, including the Benbow Lakes (Lake Whitman, Twin Lakes), Buron Lake, Tanwax Lake, Stidham Lake, Trout Lake, Mud Lake, Rapjohn Lake, and Cranberry Lake. The stream is just over 13 miles in length and is associated with wetland complexes. Tanwax Creek drains an area approximately 27 square miles in size and joins the Nisqually River at RM 30.8. The headwaters of the stream are comprised of a series of lakes, the largest of which is Tanwax Lake, located at RM 11.3. In addition, there are 10 other lakes and numerous wetlands throughout the stream (Watershed Professionals Network et al., 2002).
The upper portion of Tanwax Creek flows through a series of small lakes and wetlands containing a variety of wetland habitat types. Using the GIS data, 42% of the Tanwax Creek shoreline planning area is comprised of wetlands habitat.
Geologic and Flood Hazards
Tanwax Creek developed over continental glacial soil terraces, and alluvial soils and peat deposits may be found in the area of the lake. A flooding hazard is identified for the drainage. Erosion potential is identified in the area of the lakes and in localized areas along the drainage.
Page 5-50 June 2009

Pierce County Shoreline Inventory and Characterization Report
A seismic hazard is identified for alluvial soils and peat in the area of the lakes. A volcanic hazard from mudflow deposits is identified for the lower reach of Tanwax Creek, near the confluence with the Nisqually River.
Critical or Priority Habitat and Species Use
Tanwax Creek supports Kokanee, coho, coastal cutthroat trout, winter steelhead, winter chum, pink, and fall chum. All of these species have a document presence within the stream, with the exception of winter steelhead, which has a presumed presence (WDFW, 2007b). Kokanee, coastal cutthroat trout, winter steelhead, pink, and fall Chinook have presence/migration within the stream. Coho and winter chum have presence/migration as well as known spawning areas within the stream (WDFW, 2007b).
Coho, steelhead, and cutthroat trout populations are supported within Tanwax Creek. In addition, juvenile Chinook may use the stream for rearing or refuge (Watershed Professionals Network et al., 2002).
There are no known anthropogenic barriers to fish passage within the Tanwax Creek sub-basin; however, beaver dams are present which have served to hinder fish access within the waterbodies in this basin (Kerwin, 1999b).
There are several priority habitats associated with Tanwax Creek. These habitat areas include old growth/mature forest habitat; Tanwax Creek riparian corridor habitat, comprised of mixed trees, broadleaf trees, shrubs, and agricultural areas; candidate open space areas (urban natural open space); Lower Nisqually River riparian habitat, which is located below the Alder Dam and has been designated to preserve wild fish populations; multiple Upper Nisqually River bald eagle use areas; small and large waterfowl concentration areas; snag rich habitats; and Tanwax Creek riparian areas, comprised of a mix of forested, emergent marsh, scrub-shrub, and riverine wetland areas (WDFW, 2007a).
Instream and Riparian Habitats
Land use in the lower portion of Tanwax Creek is comprised of forested area, agricultural land use is primarily found within the middle reach, and non-rural recreational and residential homes are located within the upper reach along the lakes associated with the stream (Watershed Professionals Network et al., 2002).
Downstream of Tanwax Lake, Tanwax Creek is a low-gradient stream with localized areas of incised streambanks where the stream cuts through fine sediment layers. Fine sediment load is high within the stream due to actively eroding sites and the historical agricultural activities taking place within the basin (Kerwin, 1999b). These fine sediments are deposited in downstream wetland areas.
Intense recreational use and fishing pressure have impacted conditions within the stream. Above RM 6.5, riparian conditions are poor, and below this, wetlands have been invaded by reed canarygrass. The stream has been channelized in the past and upstream of RM 6.5, the effects of past channelization are present. In addition, beaver dams limit access in various parts of the stream (Watershed Professionals Network et al., 2002).
June 2009 Page 5-51

Pierce County Shoreline Inventory and Characterization Report
Water Quality
According to the 2004 Washington State Water Quality Assessment (Ecology, 2004b), Tanwax Creek has four Category 1 listings for dissolved oxygen, fecal coliform, pH and temperature. The system of open water wetlands along the stream are believed to be a contributor to the elevated water temperatures in the stream (Kerwin, 1999b).
The Nisqually Indian Tribe’s water quality database indicates that for monitoring conducted between 1991 and 1997, the creek had dissolved oxygen levels that exceeded state standards, and that were more pronounced during the summer months. In further studies, fecal coliform levels were found to exceed the State standard (Watershed Professionals Network et al., 2002).
5.4.14.2 Shoreline Use Patterns
Existing Land and Shoreline Use
Tanwax Creek passes through predominantly rural and agricultural areas, although areas of rural residential land use also occur. The existing Shoreline Environment Designation of Tanwax Creek is Conservancy. Comprehensive Plan designations and implementing zoning largely follow existing land use and are predominantly Rural 10.
There are several bridges over Tanwax Creek, including crossing at Tanwax Creek Road and Harts Lake Valley Road. SR 7 and 161 both cross Tanwax Creek. In addition two lane surface roads parallel portions of the stream. Portions of the stream have been channelized as it passes through agricultural and rural lands.
No cultural resources are inventoried within the Tanwax Creek area. However seasonal hunting by the Nisqually Tribe could have occurred in the area, and as such there is some potential for the presence of cultural resources.
5.4.14.3 Reach Scale Assessment
Tanwax Creek, a significant tributary to the Nisqually River (confluence in Reach 3), is referenced in a single reach referred to as – TANW_CR_01. Tanwax Creek is 8.14 miles long. Alterations to this reach include loss of forested riparian cover, channelization, erosion of streambanks, and degraded associated wetlands.
5.4.14.4 Restoration Opportunities
Restoration of riparian habitat along Lower Tanwax Creek and protection of wetlands that maintain flow in the stream were identified as capital improvement projects in the Nisqually Basin Plan (Pierce County, 2008b).
Along with the County, the Nisqually Tribe’s Natural Resources Department works with other entities to restore habitat along Tanwax Creek. These efforts have included controlling invasive vegetation and planting thousands of native trees and shrubs along the stream in cooperation with the Nisqually River Education Project (PCD, 2008).
Page 5-52 June 2009

Pierce County Shoreline Inventory and Characterization Report
Other restoration opportunities for Tanwax Creek include using best management practices to reduce sediment loss and erosion during agricultural practices, returning the creek to original channels, and eliminating ditching and draining of wetlands.
5.4.15 Twenty-five Mile Creek
5.4.15.1 Physical and Biological Characterization
Drainage Basin, Tributary Streams, and Associated Wetlands
Twenty-five Mile Creek is a tributary of Ohop Creek, and joins it at RM 9.9. The upper reaches of the stream have numerous wetlands. Twenty-five Mile Creek has two forks, the North and South Forks. Riparian wetlands are located along Twenty-five Mile Creek at its confluence with Ohop Creek. Five percent of the shoreline planning area is occupied by wetland.
Geologic and Flood Hazards
Twenty-five Mile Creek flows from its headwaters in the area west of the upper reaches of the Puyallup River west to its confluence with Ohop Creek, north of Ohop Lake. Twenty-five Mile Creek exposes intrusive and extrusive volcanic bedrock and alpine glacial soils. Identified hazards include flooding and localized areas of erosion potential.
Critical or Priority Habitat and Species Use
Twenty-five Mile Creek supports coho, winter steelhead, pink salmon, and coastal cutthroat trout. Coho and cutthroat trout have a documented presence, and winter steelhead and pink salmon have a presumed presence within the stream. Coho have presence/migration and spawning areas within Twenty-five Mile Creek. Winter steelhead, pink, and coastal cutthroat trout have presence/migration use within the stream (WDFW, 2007b).
Coho salmon are found within the lower reaches of the stream. In addition, coastal cutthroat trout are now believed to be present within the waters upstream of RM 1.0 (Kerwin, 1999b).
There are several priority habitats associated with Twenty-five Mile Creek. These habitats include Puyallup steep open spaces (urban natural open space); Ohop Creek riparian corridor areas, which include conifer, mixed trees, broadleaf shrubs, and agricultural riparian habitat; White River elk range areas; large waterfowl concentration areas; an Upper Nisqually River bald eagle use area; and Ohop Creek wetland areas, comprised of forested, riverine, shrub, and agricultural wetlands (WDFW, 2007a).
Instream and Riparian Habitats
Twenty-five Mile Creek flows through timberlands, an abandoned clay mine, and rural residences and hobby farms. There is a natural barrier to fish passage at RM 1.0. The substrate of the stream contains mean fines of 18-19% (Watershed Professionals Network et al., 2002).
Riparian conditions vary along the length of the stream. Encroachments in residential areas are present in the lower 0.3 miles of the stream. Upstream of RM 0.3 where the stream flows within
June 2009 Page 5-53

Pierce County Shoreline Inventory and Characterization Report
commercial timberlands, the riparian area is composed of second growth hardwoods with small numbers of conifers interspersed (Kerwin, 1999b). LWD recruitment is also present.
Water Quality
According to the 2004 Washington State Water Quality Assessment (Ecology, 2004b), Twenty-five Mile Creek has one Category 2 listing for water quality impairment based on invertebrate data. The information was insufficient to determine whether the biological impairment resulted from pollution.
There is an abandoned clay mine that is present at RM 0.5. Debris from the mine continues to enter the stream through erosion of a nearby slope (Kerwin, 1999b). Stormwater drainage from the mine is thought to be a contributor of additional sediments to the lower reaches of the stream.
5.4.15.2 Shoreline Use Patterns
Twenty-five Mile Creek passes through predominantly rural and agricultural areas, although areas of forestry land use also occur. The existing Shoreline Environment Designation of Twenty-five Mile Creek is Conservancy. Comprehensive Plan designations and implementing zones largely follow existing land use and are predominantly Rural 10 and Rural 20.
There are no bridges over Twenty-five Mile Creek, however two lane surface roads do parallel portions of the stream.
No cultural resources are inventoried within the Twenty-five Mile Creek area.
5.4.15.3 Reach Scale Assessment
Twenty-five Mile Creek is a tributary to Ohop Creek (Nisqually) in the upper part of the basin. This creek is referenced as – 25MI_CR_01. This creek enters Ohop Creek between Reaches 3 and 4 of that stream.
5.4.15.4 Restoration Opportunities
Restoration opportunities for Twenty-five Mile Creek include restoring forested riparian areas, decommissioning forest roads that cause siltation of streams, stabilizing slopes, and restoring mined areas.
Page 5-54 June 2009

Pierce County Shoreline Inventory and Characterization Report
5.5 Lakes, Shorelines of the State
5.5.1 Benbow Lakes
5.5.1.1 Physical and Biological Characterization
Drainage Basin, Tributary Streams, and Associated Wetlands
Benbow Lakes are located in the Mid-Nisqually River drainage basin, near a cluster of lakes, including Twin Lakes, Whitman Lake, Tanwax Lake, and Bryon Lake. Benbow Lakes are approximately 28 acres in size, and it is the headwaters of Tanwax Creek. The Thomas Brothers Guide for Pierce County (2007) indicates that Benbow Lakes is also called North Twin Lake.
Benbow Lakes are part of a complex of wetlands and small lakes along the upper portion of Tanwax Creek. These lakes are generally mapped as lacustrine, palustrine aquatic bed, or palustrine unconsolidated bottom habitats, surrounded by palustrine forested and scrub-shrub wetlands. An estimated 36% of the Benbow Lakes planning area is comprised of wetlands.
Geologic and Flood Hazards
The Benbow Lakes (Lake Whitman and the Twin Lakes) developed in depressions formed in continental glacial soils in the upper reach of Tanwax Creek. Identified hazards include erosion potential, seismic hazards from peat and alluvial soils, and flooding hazard.
Critical or Priority Habitat and Species Use
There are several priority habitats associated with the Benbow Lakes. These habitats include large waterfowl concentration areas; urban natural open space; and Tanwax Creek wetland areas, comprised of a collection of forested, emergent marsh, scrub-shrub, and riverine wetlands (WDFW, 2007a).
Water Quality
According to the 2004 Washington State Water Quality Assessment (Ecology, 2004b), Benbow Lake is not listed for any water quality impairments; however, lack of inclusion in the assessment does not indicate that the waterbody is not impaired, but may indicate that the waterbody has not been sampled.
5.5.1.2 Shoreline Use Patterns
The shoreline planning area of the Benbow Lakes is dominated by rural residential development. Benbow Lake is not designated under the existing SMP. Comprehensive Plan designations and implementing zones largely follow existing land use patterns, as they both designate the entire planning area as Rural 10. The Benbow Lakes are outside of the UGA.
Minimal residential development has occurred along the lake. One residential structure and dock is found on the northern shore of the lake. Pasture is located to the north in the shoreline.
June 2009 Page 5-55

Pierce County Shoreline Inventory and Characterization Report
No existing or proposed points of public access occur on the lake.
No cultural resources are inventoried within the Benbow Lakes area. However, seasonal hunting by the Nisqually Tribe could have occurred in the area, and as such there is some potential for the presence of cultural resources.
5.5.1.3 Reach Scale Assessment
Benbow Lakes, an approximately 28-acre lake, is located at the headwaters of Tanwax Creek. Benbow and other lakes in the sub-basin support stream flow in Tanwax. Benbow Lakes is referred to as one reach - BENB_LK_01.
5.5.1.4 Restoration Opportunities
Restoration opportunities for Benbow Lake include reforestation of pasture lands on the northern shore of the lake within 200 feet. Otherwise, restoration opportunities for Benbow Lake are limited due to the undeveloped condition of the lake and its shoreline.
5.5.2 Clear Lake
5.5.2.1 Physical and Biological Characterization
Drainage Basin, Tributary Streams, and Associated Wetlands
Clear Lake is located in the Mid-Nisqually River drainage basin and is approximately 155 acres in size. It is located adjacent to and east of Twenty-seven Lake. Approximately 3% of the Clear Lake planning area is wetland, based on the County GIS data.
Geologic and Flood Hazards
Clear Lake formed in a depression on a continental glacial soil terrace. Clear Lake receives discharge from Twenty-seven Lake and then drains to the southeast into Ohop Creek. Alluvial soils and peat deposits may be found in the area of the lake. Identified hazards include flooding and erosion potential. Although not identified, seismic hazards from peat or alluvial soils may be likely.
Critical or Priority Habitat and Species Use
There are several priority habitats associated with Clear Lake. These habitats include large waterfowl concentration areas; an Upper Nisqually bald eagle use area; and an area of urban natural open space, specifically Puyallup steep slopes open space (WDFW, 2007a).
Clear Lake is typically stocked with rainbow trout for anglers. Other fish found in Clear Lake include large mouth bass, black crappie, and yellow perch. An occasional sockeye salmon is also found in this lake.
Page 5-56 June 2009

Pierce County Shoreline Inventory and Characterization Report
Water Quality
According to the 2004 Washington State Water Quality Assessment (Ecology, 2004b), Clear Lake has one Category 5 (303(d)) listing for water quality impairment due to total phosphorus. In addition, Clear Lake has one Category 4C listing for habitat impairment due to invasive exotic species.
5.5.2.2 Shoreline Use Patterns
Existing Land and Shoreline Use
The shoreline planning area of the Clear Lake is dominated by rural residential development. The existing Shoreline Environment Designation of Clear Lake is Rural/Residential. Comprehensive Plan designations largely follow existing land use patterns, and are predominantly Rural 10. Clear Lake is outside of the UGA.
Modifications to the Clear Lake shoreline are related to residential development, including roads in the shoreline planning area, bulkheads, docks and residential structures. SR 161 passes to the west of the lake and its shoreline planning area. Approximately 70% of the shoreline is protected by bulkheads based upon observations made from aerial photographs. A total of 126 docks, 27 swimming floats, and 2 boat houses were counted along the Clear Lake shoreline from aerial photographs.
Public access to Clear Lake is limited due to private residential development. However, a WDFW boat launch is provided on the northwestern shore of the lake. Gravel parking for boat trailers is also provided at this boat launch. No cultural resources are inventoried within the Clear Lake area.
5.5.2.3 Reach Scale Assessment
Clear Lake, a 155-acre lake, is located between Ohop Creek and Tanwax Creek in the Nisqually River watershed. Clear Lake is the headwaters for Ohop Creek; this lake shoreline planning area is referred to as one reach - CLEA_LK_01.
5.5.2.4 Restoration Opportunities
Restoration opportunities for Clear Lake include planting trees on the shoreline and revegetating disturbed areas adjacent to residential developments. Docks in disrepair could be replaced with joint-use docks or alternative decking options. Failing bulkheads could be replaced with soft-shore stabilization measures where possible.
June 2009 Page 5-57

Pierce County Shoreline Inventory and Characterization Report
5.5.3 Cranberry Lake
5.5.3.1 Physical and Biological Characterization
Drainage Basin, Tributary Streams, and Associated Wetlands
Cranberry Lake is located in the Mid-Nisqually River drainage basin and is approximately 33 acres in size. Cranberry Lake is located just west of SR 7 (Mountain Highway E) and east of Tanwax Creek. The lake is situated southwest of Rapjohn Lake. Cranberry Lake drains to the west to Tanwax Creek. A wide fringe of wetland around the lake perimeter includes aquatic bed, emergent, scrub-shrub, and disturbed wetland habitats. An estimated 80% of the Cranberry Lake planning area is considered wetland.
Geologic and Flood Hazards
Cranberry Lake formed in a depression on a continental glacial soil terrace. Alluvial soils and peat deposits may be found in the area of the lake. Identified hazards include flooding, erosion, and seismic hazards from peat or alluvial soils.
Critical or Priority Habitat and Species Use
There are two types of priority habitats associated with Cranberry Lake: large waterfowl concentration areas and Tanwax Creek wetland habitat, which includes a mixture of forested, emergent marsh, scrub-shrub and riverine wetlands (WDFW, 2007a).
Water Quality
According to the 2004 Washington State Water Quality Assessment (Ecology, 2004b), Cranberry Lake is not listed for any water quality impairments.
5.5.3.2 Shoreline Use Patterns
The shoreline planning area of the Cranberry Lake is predominated by rural residential development and agricultural uses. The existing Shoreline Environment Designation of Cranberry Lake is Natural. Comprehensive Plan designations and implementing zones largely follow existing land use patterns, and are dominated by Rural 10 and Agricultural Resource Land. Cranberry Lake is outside of the UGA.
Modifications to Cranberry Lake include use of the wetlands and shoreline area in active pasture, resulting in loss of shrub and all forested riparian cover. Livestock may have access to the lake. No public access is currently provided to Cranberry Lake. No cultural resources are inventoried within the Cranberry Lake area.
5.5.3.3 Reach Scale Assessment
Cranberry Lake, a 33-acre lake located between Rapjohn and Silver Lakes, drains to Kreger Lake. Cranberry Lake is represented by one reach – CRAN_LK_01. This lake and its shoreline planning area are highly altered due to loss of native vegetation, specifically forested cover.
Page 5-58 June 2009

Pierce County Shoreline Inventory and Characterization Report
5.5.3.4 Restoration Opportunities
Restoration opportunities for Cranberry Lake include restoring forested riparian areas and using best management practices to reduce sediment loss and erosion during agricultural practices. This lake could be protected by fencing out livestock from sensitive shoreline areas and providing alternative sources of drinking water. Wetlands associated with Cranberry Lake could be rehabilitated and forested cover restored to improve wetland and riparian habitats.
5.5.4 Harts Lake
5.5.4.1 Physical and Biological Characterization
Drainage Basin, Tributary Streams, and Associated Wetlands
Harts Lake is located in the Mid-Nisqually River drainage basin, adjacent to Little Lake and is 109 acres in size.
Harts Lake is surrounded by a fringe of mapped palustrine emergent and scrub-shrub wetland that also extends around Little Lake. Mapping indicates a floodplain drainage connecting the Harts Lake wetlands to another palustrine emergent wetland area located approximately 0.5 mile east of the lake. Approximately 39% of the shoreline planning area for Harts Lake is considered wetland.
Geologic and Flood Hazards
Harts Lake is located southeast of the Centralia Canal Dam and collects drainage from the area east and north of the lake, including discharge from Little Lake. Drainage from the lake enters the Nisqually River south of the Centralia Canal Dam. The lake has developed on a continental glacial soil terrace. Peat and alluvial soils may be present. A seismic hazard is identified for alluvial deposits at the lake, and a flooding hazard is for the lake. A volcanic hazard from mudflow deposits is identified for Harts Lake. Erosion potential is identified in the area of the lake.
Critical or Priority Habitat and Species Use
There are two types of priority habitats associated with Harts Lake. These habitats include both small and large waterfowl concentration areas; and Nisqually River wetland habitat, inclusive of riverine, forested, emergent, scrub-shrub, and agricultural wetlands providing fish habitat and waterfowl use areas (WDFW, 2007a).
Harts Lake is stocked regularly with rainbow trout by WDFW. Fish found in Harts Lake are channel catfish, bass, crappie, and trout.
Water Quality
According to the 2004 Washington State Water Quality Assessment (Ecology, 2004b), Harts Lake has one Category 5 (303(d)) listing for water quality impairment for total phosphorus. In
June 2009 Page 5-59

Pierce County Shoreline Inventory and Characterization Report
addition, Harts Lake has one Category 4C listing for habitat impairment due to invasive exotic species, and one Category 1 listing for water quality impairment due to fecal coliform bacteria.
5.5.4.2 Shoreline Use Patterns
The shoreline planning area of the Harts Lake is predominated by rural residential development and farming uses. Rural residential access roads pass through the shoreline planning area, but no significant infrastructure intrudes on the lake.
The existing Shoreline Environment Designation for Harts Lake is Rural, where it is mapped. Comprehensive Plan designations and implementing zones follow existing land use patterns, and include Rural 10 and Agricultural Resource Land. Harts Lake is outside of the UGA.
Modifications of the Harts Lake shoreline include residential development, docks and agricultural uses. Based upon observations from aerial photographs, approximately 7 docks occur on the lake. These are associated with residential development on the northeastern shoreline. The other shores of the lake are largely undeveloped. Wilcox Farms borders the lake to the south, with associated pasture lands.
Public access to Harts Lake is limited. However, there is a boat launch owned and operated by WDFW on the northern shore of the lake. No cultural resources are inventoried within the Harts Lake area.
5.5.4.3 Reach Scale Assessment
Harts Lake, a lake draining to the Nisqually River in the mid-Nisqually basin, is considered one shoreline reach – HART_LK_01. Harts Lake is 109 acres in size with 7.1 miles of shoreline.
5.5.4.4 Restoration Opportunities
Restoration of the historic connection between the Nisqually mainstem and Harts Lake Creek is identified as a restoration opportunity in the 2008 South Puget Sound three-year salmon habitat project list (Pierce County Lead Entity, 2008a). Other restoration opportunities for Harts Lake include restoring forested riparian areas and using best management practices to reduce sediment transport and erosion during agricultural practices. Wetlands associated with Harts Lake could be rehabilitated and forested cover restored to improve wetland and riparian habitats.
5.5.5 Kreger Lake
5.5.5.1 Physical and Biological Characterization
Drainage Basin, Tributary Streams, and Associated Wetlands
Kreger Lake is located in the Mid-Nisqually River drainage basin and is approximately 31 acres in size. Kreger Lake drains to the southwest into Nisqually River at Reach 3. Kreger Lake is located within a large palustrine emergent and scrub-shrub wetland area. Approximately 63% of the lake’s planning area is wetland, based on GIS data.
Page 5-60 June 2009

Pierce County Shoreline Inventory and Characterization Report
Geologic and Flood Hazards
Kreger Lake receives drainage from Silver Lake to the north, and discharges into the Nisqually River east of the confluence with Tanwax Creek. The lake was formed on a continental glacial soil terrace. Peat and alluvial soils may be found in the area of the lake. Identified hazards include flooding, erosion potential, and seismic hazards from peat or alluvial soils.
Critical or Priority Habitat and Species Use
Kreger Lake has several different priority habitats associated with it. These priority habitats include the following: large waterfowl concentration areas; urban natural open space areas comprised of the Kreger Lake Farm; Kreger and Silver Lakes riparian corridor areas which provide resident trout spawning and rearing habitat; and Kreger and Silver Lakes wetland habitat areas, comprised of a mix of agricultural, forested, scrub-shrub, and emergent marsh wetlands, all providing important waterfowl wintering areas (WDFW, 2007a).
Water Quality
According to the 2004 Washington State Water Quality Assessment (Ecology, 2004b), Kreger Lake has one Category 2 listing for water quality impairment for total phosphorus.
5.5.5.2 Shoreline Use Patterns
Existing Land and Shoreline Use
The shoreline planning area of the Kreger Lake is predominated by rural residential development and farming uses. The existing Shoreline Environment Designation for Kreger Lake is Rural. Comprehensive Plan designations and implementing zones are Rural 10 and Agricultural Resource Land.
No significant infrastructure intrudes on the lake, including docks, bulkheads or other structures. However, the native vegetation along the lake and its entire riparian zone has been extensively modified. All vegetation has been maintained as pasture, including large areas of wet pasture to the south of Kreger Lake itself.
No existing or proposed points of public access occur on Kreger Lake. It lies entirely within private property. No cultural resources are inventoried within the Kreger Lake area.
5.5.5.3 Reach Scale Assessment
Kreger Lake drains to the Nisqually River between the confluences of Ohop Creek and Tanwax Creek with the Nisqually. Kreger Lake is described as one shoreline reach – KREG_LK_01.
5.5.5.4 Restoration Opportunities
Restoration opportunities for Kreger Lake include restoring degraded wetlands and forested riparian areas. Best management practices should be used to reduce sediment loss and erosion during agricultural practices.
June 2009 Page 5-61

Pierce County Shoreline Inventory and Characterization Report
5.5.6 Little Lake
5.5.6.1 Physical and Biological Characterization
Drainage Basin, Tributary Streams, and Associated Wetlands
Little Lake is located in the Mid-Nisqually River drainage basin, adjacent to Harts Lake, and is approximately 10 acres in size. Little Lake is also known as “Little Harts Lake.”
Little Lake is part of a wetland system that also encompasses Harts Lake to the north. Mapped wetland habitats include palustrine emergent and scrub-shrub and encompass about 39% of the shoreline planning area.
Geologic and Flood Hazards
Little Lake is located east of the Centralia Canal Dam and drains into Harts Lake to the north. The lake has developed on a continental glacial soil terrace. Peat and alluvial soils may be present. A seismic hazard is identified for alluvial deposits at the lake, and a flooding hazard is for the lake. A volcanic hazard from mudflow deposits is identified for Little Lake. Erosion potential is identified in the area of the lake.
Critical or Priority Habitat and Species Use
Little Lake has three types of priority habitats associated with it: small waterfowl concentration areas; Nisqually River wetland areas, comprised of a mixture of riverine, forested, emergent marsh, scrub-shrub, and agricultural wetlands, all providing fish habitat and waterfowl use areas; and Little Lake wood duck nesting areas (WDFW, 2007a).
Water Quality
According to the 2004 Washington State Water Quality Assessment (Ecology, 2004b), Little Lake has one Category 2 listing for water quality impairment for total phosphorus.
5.5.6.2 Shoreline Use Patterns
The shoreline planning area of the Little Lake is predominated by rural residential development and farming uses. Little Lake shoreline is not currently designated under the existing County SMP. Comprehensive Plan designations largely follow existing land use patterns, and are dominated by Rural 10 (77%) and Agricultural Resource Land (23%). Little Lake is outside of the UGA.
Modifications to Little Lake are limited to access roads and pasturelands. The rural nature of development has likely limited modification to the lake shoreline. No existing or proposed points of public access occur along the lake.
No cultural resources are inventoried within the Little Lake area. However, seasonal hunting by the Nisqually Tribe could have occurred in the area, and as such there is some potential for the presence of cultural resources.
Page 5-62 June 2009

Pierce County Shoreline Inventory and Characterization Report
5.5.6.3 Reach Scale Assessment
Little Lake drains to the Nisqually River as part of the Harts Lake sub-basin. Little Lake is considered a shoreline of the state due to its proximity to Harts Lake and associated wetlands. This lake reach is called LITT_LK_01.
5.5.6.4 Restoration Opportunities
Restoration opportunities for Little Lake include restoring forested riparian areas and using agricultural best management practices to reduce sediment loss and erosion. No other restoration opportunities are available based upon the information available.
5.5.7 Muck Lake
5.5.7.1 Physical and Biological Characterization
Drainage Basin, Tributary Streams, and Associated Wetlands
Muck Lake, a 15-acre lake, is located in the Muck Creek drainage basin, just north of the town of Roy. Muck Creek flows through the lake. Muck Lake is part of a complex of lakes and wetlands that extends from the confluence of Lacamas and Muck Creeks, north into Fort Lewis. Wetlands comprise approximately 24% of the Muck Lake planning area.
Muck Lake appears to be very shallow at certain times of the year. Surface water cannot be observed from aerial photographs taken of Muck Lake.
Geologic and Flood Hazards
Muck Lake receives drainage from Muck Creek on the north and from Lacamas Creek on the east. Muck Lake discharges into Muck Creek to the southwest. Muck Lake developed in a depression formed on continental glacial soils. Alluvial soils and peat deposits may be found in the area of the lake. Muck Lake has been identified as an erosion hazard area and a flooding hazard area. The lake is not currently identified as a seismic hazard area, but liquefaction.
Critical or Priority Habitat and Species Use
There are three types of priority habitats associated with Muck Lake. These habitat areas include large waterfowl concentration areas; Muck Creek riparian habitat which includes some riverine wetlands; and Muck Creek wetland habitat, inclusive of a mixture of riverine, forested, emergent and scrub-shrub wetlands (WDFW, 2007a).
Water Quality
According to the 2004 Washington State Water Quality Assessment (Ecology, 2004b), Muck Lake is not listed for any water quality impairments; however, lack of inclusion in the assessment does not indicate that the waterbody is not impaired, but may indicate that the waterbody has not been sampled.
June 2009 Page 5-63

Pierce County Shoreline Inventory and Characterization Report
5.5.7.2 Shoreline Use Patterns
Existing Land and Shoreline Use
The shoreline planning area of Muck Lake is predominated by rural residential development and farming uses. The existing Shoreline Environment Designation for Muck Lake is Rural-Residential. Comprehensive Plan designations and implementing zones are Rural 10. Muck Lake is outside of the UGA.
Modifications of Muck Lake are limited to vegetation modification and removal of forested riparian areas. Forest areas are observed only to the northeast of this lake shore. Other shoreline areas and associated wetlands are maintained in pasture or shrub cover. No existing or proposed points of public access occur along the stream.
No cultural resources are inventoried within the Muck Lake area. However, seasonal hunting by the Nisqually Tribe could have occurred in the area, and as such there is some potential for the presence of cultural resources.
5.5.7.3 Reach Scale Assessment
Muck Lake and its associated wetlands are referred to as one reach named MUCK_LK_01. Although the lake itself is less than 20 acres, the associated wetlands increase the shoreline area to over 20 acres. Large expanses of wetlands and marshes feed into Muck Lake.
5.5.7.4 Restoration Opportunities
Restoration opportunities for Muck Lake include restoring forested riparian areas. Wetlands associated with Muck Lake could be rehabilitated and forested cover restored to improve wetland and riparian habitats.
5.5.8 Mud Lake
5.5.8.1 Physical and Biological Characterization
Drainage Basin, Tributary Streams, and Associated Wetlands
Mud Lake is located in the Mid-Nisqually River drainage basin, and is approximately 20 acres in size. Mud Lake is surrounded by a wide perimeter of wetland that is mapped as palustrine emergent habitat. Based upon the GIS data, wetland habitat is calculated to be 46% of the total shoreline planning area.
Geologic and Flood Hazards
Mud Lake receives drainage from the area east and south of the lake, and then discharges water to the west to Tanwax Creek. Mud Lake formed in a depression on a continental glacial soil terrace. Alluvial soils and peat deposits may be found in the area of the lake. Identified hazards include flooding, erosion potential, and seismic hazards from peat or alluvial soils.
Page 5-64 June 2009

Pierce County Shoreline Inventory and Characterization Report
Critical or Priority Habitat and Species Use
Mud Lake has two types of priority habitats associated with it: small and large waterfowl concentration areas and Tanwax Creek wetland habitat, inclusive of a mixture of forested, emergent marsh, scrub-shrub, and riverine wetlands (WDFW, 2007a).
Water Quality
According to the 2004 Washington State Water Quality Assessment (Ecology, 2004b), Mud Lake has one Category 2 listing for water quality impairment due to total phosphorus.
5.5.8.2 Shoreline Use Patterns
The shoreline planning area of the Mud Lake is predominantly farming use, as well as undeveloped land. The existing Shoreline Environment Designation for Mud Lake is Rural. County zoning and Comprehensive Plan designations largely follow existing land use patterns, and are dominated by Agricultural Resource Land and some areas of Rural 20.
Farming and rural residential access roads pass through the shoreline planning area, but no significant infrastructure intrudes on the lake. One dock exists on Mud Lake. Similar to Cranberry Lake described above, Mud Lake lacks forested riparian vegetation. The entire area surrounding Mud Lake has been converted to pasture.
5.5.8.3 Reach Scale Assessment
Mud Lake is represented by a single reach – MUD_LK-01. Mud Lake, an approximately 20-acre lake, is surrounded by agricultural land uses. Native vegetation has been altered. Ditches have been cut to drain wetlands.
5.5.8.4 Restoration Opportunities
Restoration opportunities for Mud Lake include restoring forested riparian areas and enhancing degraded pasture wetlands wherever possible.
5.5.9 Ohop Lake
5.5.9.1 Physical and Biological Characterization
Drainage Basin, Tributary Streams, and Associated Wetlands
Ohop Lake is the largest natural lake in the Nisqually River basin, with a surface area of 235 acres and a length of 2.25 miles (Kerwin, 1999b). Ohop Lake lies on the watershed boundary of WRIA 11 and 10 with the watershed break falling between Ohop Lake and Lake Kapowsin to the north (in WRIA 10). Ohop Lake drains to the south to Ohop Creek.
Ohop Lake is part of a mapped riparian wetland system along Ohop Creek, just upstream of the confluence of Lynch Creek. Narrow palustrine forested, scrub-shrub and emergent wetland areas
June 2009 Page 5-65

Pierce County Shoreline Inventory and Characterization Report
are located along the lake shore. According to the GIS data, wetland comprises about 9% of the shoreline planning area.
Geologic and Flood Hazards
Ohop Lake has formed on a continental glacial soil terrace in the Ohop Creek drainage, below the confluence with Twenty-five Mile Creek. Alluvial soils and peat deposits may be found in the area of the lake. Identified hazards include flooding, erosion potential, volcanic hazards from mudflow deposits, and seismic hazards from peat or alluvial soils.
Critical or Priority Habitat and Species Use
Ohop Lake has multiple priority habitats associated with it. These habitat types include the following: small and large waterfowl concentration areas; snag rich habitat; Upper Nisqually bald eagle use areas; urban natural open space, specifically Puyallup steep slopes open space; Ohop Creek wetland habitat, inclusive of a mixture of forested, riparian, scrub-shrub, and agricultural wetlands; and Ohop Creek riparian corridor habitat, comprised of an assortment of conifer, mixed trees, broadleaf shrubs, agricultural riparian habitat with some riverine wetlands, all providing vital fish protection and waterfowl wintering areas (WDFW, 2007a).
Water Quality
According to the 2004 Washington State Water Quality Assessment (Ecology, 2004b), Ohop Lake has one Category 5 (303(d) listing for water quality impairment due to total phosphorus. In addition, Ohop Lake has one Category 4C listing for habitat impairment due to invasive exotic species.
5.5.9.2 Shoreline Use Patterns
The shoreline planning area of Ohop Lake is predominated by rural residential development and farming uses. Information on shoreline modifications on Ohop is lacking.
There are two existing Shoreline Environment Designations for Ohop Lake – Rural Residential on the east and northwestern shores, and Conservancy on the southwestern shore. County zoning and Comprehensive Plan designations indicate that land use is mainly Rural 10. Ohop Lake lies outside of the UGA.
Modifications on Ohop Lake are related to residential development, including roads within the shoreline planning area, docks, bulkheads, swimming floats and residential structures. Oroville Road E lies on the west side of Ohop Lake and runs within 30 feet of the shoreline for half of the lake. Ohop Ski Park Road lies on the eastern side of the lake within 120 to 150 feet away from the lake water. Residential development occurs on both the east and western sides of the lake. A total of 142 docks and 12 swimming floats were observed on the lake based upon observations made from aerial photographs. Bulkheads are also present.
Ohop Lake has limited public access through a WDFW boat launch and facilities on the southwestern shore. The boat launch has a large gravel parking area with poor riparian habitat. No public parks or other public access points are available on Ohop Lake.
Page 5-66 June 2009

Pierce County Shoreline Inventory and Characterization Report
One suspected location of contaminants is identified by Ecology for the Ohop Lake shoreline. A hazardous waste generator is listed for Oroville Road in the vicinity of the lake. No cultural resources are inventoried within the Ohop Lake area.
5.5.9.3 Reach Scale Assessment
Ohop Lake is the headwaters to Ohop Creek (Nisqually). Ohop Lake is 2.25-miles long and is named as one shoreline reach; this reach is called OHOP_LK_01. Ohop Lake is a 235-acre natural lake with residential shoreline uses.
5.5.9.4 Restoration Opportunities
Restoration opportunities for Ohop Lake include planting trees on the shoreline and revegetating disturbed areas adjacent to residential developments and the WDFW boat launch. Docks in disrepair could be replaced with joint-use docks or constructed with alternative decking to reduce shade impacts. Failing bulkheads could be replaced with soft-shore stabilization measures where possible.
5.5.10 Rapjohn Lake
5.5.10.1 Physical and Biological Characterization
Drainage Basin, Tributary Streams, and Associated Wetlands
Rapjohn Lake is a 56-acre freshwater lake located in the Mid-Nisqually River drainage basin. Rapjohn Lake is located east of Tanwax Creek, between Mud Lake and Cranberry Lake. This lake receives drainage from the area east and south of the lake, and then discharges water to the west to Tanwax Creek. Rapjohn Lake is surrounded by palustrine emergent, scrub-shrub, forested and disturbed wetland areas. Wetlands cover approximately 32% of the lake’s planning area based on GIS data.
Geologic and Flood Hazards
Rapjohn Lake formed in a depression on a continental glacial soil terrace. Alluvial soils and peat deposits may be found in the area of the lake. Identified hazards include flooding, erosion potential and seismic hazards from peat or alluvial soils.
Critical or Priority Habitat and Species Use
Rapjohn Lake has two types of priority habitat associated with it: large waterfowl concentration areas and Tanwax Creek wetland areas, inclusive of some forested, emergent marsh, scrub-shrub, and riverine wetlands (WDFW, 2007a).
Water Quality
According to the 2004 Washington State Water Quality Assessment (Ecology, 2004b), Rapjohn Lake has one Category 4C listing for habitat impairment due to invasive exotic species, and one Category 2 listing for water quality impairment due to total phosphorus.
June 2009 Page 5-67
Pierce County Shoreline Inventory and Characterization Report
5.5.10.2 Shoreline Use Patterns
The shoreline planning area of Rapjohn Lake is dominated by rural residential development and farming uses. The existing Shoreline Environment Designation of Rapjohn Lake is Rural. Comprehensive Plan designations and implementing zones are Rural 10 and Agricultural Resource Land. Rapjohn lies outside of the UGA.
Rural residential access roads pass through the shoreline planning area, but no significant infrastructure intrudes on the lake. Rapjohn Lake has limited public access. A WDFW boat ramp has been developed on the western shore, from 384th Street E. The facility also includes approximately 20 parking stalls and toilets.
No residential bulkheads or docks have been constructed along the lake. Modifications to the shoreline are primarily draining and ditching of associated wetlands and alterations to native vegetation and forested riparian areas due to conversion to pasture.
5.5.10.3 Reach Scale Assessment
Rapjohn Lake, draining to Tanwax Creek, is represented by one (1) reach. This reach is referred to as RAPJ_LK_01. Rapjohn Lake is a 56-acre lake, which is entirely under agricultural land uses.
5.5.10.4 Restoration Opportunities
Restoration opportunities for Rapjohn Lake include restoring forested riparian areas along lake and the inlet stream to the lake. No trees are found along the inlet stream for a 900-foot long section leading to Rapjohn Lake. Extensive wetlands to the south are degraded and could be restored to native cover.
5.5.11 Silver Lake
5.5.11.1 Physical and Biological Characterization
Drainage Basin, Tributary Streams, and Associated Wetlands
Silver Lake is a 138-acre freshwater lake located in the Mid-Nisqually River drainage basin. Silver Lake is located south of Cranberry Lake and drains to the southwest to Kreger Lake.
Wetland areas mapped as palustrine emergent and scrub-shrub habitats extend northwest and southeast from the lake. Approximately 49% of the lake’s planning area is wetland based on GIS data. A large associated wetland extends to the west and south of the lake.
Geologic and Flood Hazards
Silver Lake formed in a depression on a continental glacial soil terrace. Alluvial soils and peat deposits may be found in the area of the lake. Identified hazards include flooding, erosion potential, and seismic hazards from peat or alluvial soils.
Page 5-68 June 2009

Pierce County Shoreline Inventory and Characterization Report
Critical or Priority Habitat and Species Use
There are three broad types of priority habitat associated with Silver Lake. These habitats include large waterfowl concentration areas; Kreger and Silver Lakes wetland habitat, inclusive of a mixture of agricultural, forested, scrub-shrub, and emergent marsh wetlands providing important waterfowl wintering areas; and Kreger and Silver Lakes riparian zones which provide resident trout spawning and rearing habitat areas (WDFW, 2007a). Silver Lake is stocked annually by WDFW. Rainbow trout are the main fish stocked by the state.
Water Quality
According to the 2004 Washington State Water Quality Assessment (Ecology, 2004b), Silver Lake is not listed for any water quality impairments; however, lack of inclusion in the assessment does not indicate that the waterbody is not impaired, but may indicate that the waterbody has not been sampled.
5.5.11.2 Shoreline Use Patterns
The shoreline planning area of the Silver Lake is predominated by rural residential development and farming uses. The existing SMP Shoreline Environment Designation of Silver Lake is 50% Rural on the north shore and around 50% Conservancy on the south. County zoning and Comprehensive Plan designations largely follow existing land use patterns, and are dominated by Agricultural Resource Land and Rural 10. Silver Lake is outside of the UGA.
Modifications to Silver Lake shorelines include those related to residential development and agricultural land uses. Rural residential access roads pass through the shoreline planning area. Residential development along the shoreline is limited to the northern shore. The remainder of Silver Lake’s shoreline is in agricultural use as pasture. Based on aerial photographs, approximately 24 private docks are present on Silver Lake. Most of the docks are 50 to 70 feet long; however, docks on the northwestern side extend up to 250 feet through aquatic bed habitat due to the shallow nature of the lake on the northwestern shore. The lake contains an aquatic bed habitat that is 90 to 200 feet wide. Overhead transmission lines pass to the east of Silver Lake. Vegetation in the associated wetlands to the west and south have been highly modified and converted to pasture.
Silver Lake has no state-owned boat launch. However, a private resort on the north end of the lake provides a boat ramp, dock and access to the shoreline for fishing.
5.5.11.3 Reach Scale Assessment
Silver Lake is referenced by one shoreline reach –SILV_LK_01. Extensive wetlands are mapped to the northwest and south of the lake.
5.5.11.4 Restoration Opportunities
Restoration opportunities for Silver Lake include restoring forested riparian areas along the lakeshore and restoring natural vegetation in degraded associated wetlands.
June 2009 Page 5-69

Pierce County Shoreline Inventory and Characterization Report
5.5.12 Tanwax Lake
5.5.12.1 Physical and Biological Characterization
Drainage Basin, Tributary Streams, and Associated Wetlands
Tanwax Lake is located in the Mid-Nisqually River drainage basin, southwest of a cluster of lakes comprised of Benbow Lakes, Whitman Lake, and Bryon Lake. Tanwax Lake is approximately 178 acres in overall size. Tanwax Lake is located within the Tanwax Creek sub-basin.
Approximately 44% of the lake’s planning area consists of wetland. Tanwax Lake is part of a large mapped wetland system along the upper portion of Tanwax Creek. Palustrine forested and scrub-shrub wetlands are mapped at the north and south ends of the lake. Another large wetland area containing palustrine emergent, scrub-shrub, and forested areas and a small lake (Stidham Lake) are mapped to the west of Tanwax Lake, connected to the lake by a floodplain drainage area.
Geologic and Flood Hazards
Tanwax Lake developed in a depression formed in continental glacial soils in the upper reach of Tanwax Creek. Identified hazards include erosion potential, seismic hazards from peat and alluvial soils, and flooding hazard.
Critical or Priority Habitat and Species Use
There are several self-sustaining populations of exotic warm-weather fish species (such as yellow perch, large-mouth bass, and bluegill) present within Tanwax Lake. These species can move out of the lake, due to the fact that there are no downstream barriers to migration. In addition, docks and other overwater structures provide cover for predatory species which affect the behavior of salmonids (Kerwin, 1999b).
There are several priority habitats associated with Tanwax Lake. These areas include the Tanwax Creek riparian corridor which is comprised of mixed trees, broadleaf trees, shrubs and agricultural areas; wetland areas which include a mix of forested, emergent marsh, scrub-shrub, and riverine wetlands; small and large waterfowl concentration areas; urban natural open space; and Tanwax Lake/Tanwax Creek outlet and low marsh area (WDFW, 2007a).
Instream and Riparian Habitats
Tanwax Lake has been affected by the development on and around the lake. Single family homes densely line the lakeshore, docks and other overwater structures line the shores, and recreational boaters have removed large quantities of LWD. These development-related impacts have served to alter the overall function of the riparian zone surrounding the lake (Kerwin, 1999b).
Page 5-70 June 2009

Pierce County Shoreline Inventory and Characterization Report
Water Quality
According to the 2004 Washington State Water Quality Assessment (Ecology, 2004b), Tanwax Lake has one Category 2 listing for water quality impairment due to total phosphorus.
5.5.12.2 Shoreline Use Patterns
The shoreline planning area of the Tanwax Lake is predominated by rural residential development and moderate density residential development. The existing Shoreline Environment Designation of Tanwax Lake includes Rural/Residential and Conservancy. Comprehensive Plan designations and implementing zones largely follow existing land use patterns, and include Rural 10 and Agricultural Resource Land. Tanwax Lake is outside of the UGA.
Modifications to the shoreline of Tanwax Lake are related to residential development, such as shoreline armoring with bulkheads, docks, and construction of residential structures. Moderate residential bulkheading has occurred along the lake. Based on aerial photographs, a total of 63 private docks are present on Tanwax Lake – 40 on the eastern shore and 23 on the western shore. In addition, 4 swim floats or diving platforms and 2 boat houses are also present. Small ponds have been dug near the outlet stream (Tanwax Creek) in its floodplain just north of 352nd Street E. The northwestern shoreline of the lake contains no residential development and has an excellent forested riparian zone.
A boat launch is provided on the southern shore of Tanwax Lake. In addition, a public swim area and dock is visible on aerial photographs on the northern shore. No cultural resources are inventoried within the Tanwax Lake area.
5.5.12.3 Reach Scale Assessment
Tanwax Lake is a complex of lake, forested wetlands and other small lakes. The reach name for Tanwax Lake system is TANW_LK_01. Tanwax Lake, a 178-acre lake, is altered due to residential development.
5.5.12.4 Restoration Opportunities
Restoration opportunities for Tanwax Lake include restoring trees in the riparian zone. Docks in disrepair could be replaced with joint-use docks or constructed with alternative decking to reduce shade impacts. Failing bulkheads could be replaced with soft-shore stabilization measures where possible.
5.5.13 Trout Lake
5.5.13.1 Physical and Biological Characterization
Drainage Basin, Tributary Streams, and Associated Wetlands
Trout Lake is located in the Mid-Nisqually River drainage basin and the lake itself is approximately 15 acres in size. Trout Lake lies within the northern portion of a mapped
June 2009 Page 5-71

Pierce County Shoreline Inventory and Characterization Report
palustrine emergent and scrub-shrub wetland. Approximately 100 acres (84%) of the lake’s planning area is wetland, based on GIS data.
Geologic and Flood Hazards
Trout Lake is located north of Tanwax Creek, west of Tanwax Lake. Trout Lake developed in a depression formed in continental glacial soils. Peat and alluvial soils are likely present. Identified hazards include erosion potential, seismic hazards from peat and alluvial soils, and flooding hazard.
Critical or Priority Habitat and Species Use
There are three types of priority habitats associated with Trout Lake: small and large waterfowl concentration areas, and Tanwax Creek wetland habitat, inclusive of a mixture of some forested, emergent marsh, scrub-shrub, and riverine wetlands (WDFW, 2007a).
Water Quality
According to the 2004 Washington State Water Quality Assessment (Ecology, 2004b), Trout Lake is not listed for any water quality impairments; however, lack of inclusion in the assessment does not indicate that the waterbody is not impaired, but may indicate that the waterbody has not been sampled.
5.5.13.2 Shoreline Use Patterns
The shoreline planning area of the Trout Lake is predominantly in agricultural uses. Limited residential development occurs at the north end of the lake. Trout Lake is not designated under the current SMP. County zoning and Comprehensive Plan designations are Rural 10. Trout Lake is outside of the UGA.
Modifications to Trout Lake include conversion of the large wetland to the south of the lake into pasture lands. One dock and a boat ramp are located on the Trout Lake shoreline. There is an informal trail around the lake for apparently private use. No existing or proposed points of public access occur on the lake shore. No cultural resources are inventoried within the Trout Lake area.
5.5.13.3 Reach Scale Assessment
Trout Lake is considered one shoreline reach – TROU_LK_01.
5.5.13.4 Restoration Opportunities
Restoration opportunities for Trout Lake include restoring forested riparian areas along the lakeshore and restoring natural vegetation in degraded associated wetlands.
Page 5-72 June 2009

Pierce County Shoreline Inventory and Characterization Report
5.5.14 Tule Lake
5.5.14.1 Physical and Biological Characterization
Drainage Basin, Tributary Streams, and Associated Wetlands
Tule Lake is located to the east of and a tributary to Tanwax Creek. Approximately 74% of the Tule Lake planning area is wetland. A narrow strip of mapped palustrine forested and scrub-shrub riparian wetland extends northeast of the lake along Rocky Slough; this wetland is also included in the Tule Lake shoreline planning area.
Geologic and Flood Hazards
Tule Lake formed in a depression on continental glacial soil terraces west of Tanwax Creek. Tule Lake receives drainage from Rocky Slough and discharges into Tanwax Creek near the confluence with the Nisqually River. Alluvial soils and peat deposits may be found in the area of the lake. An erosion potential hazard area has been identified in the area of the lake. Although not identified, flooding and seismic hazards are likely with the presence of alluvial soils.
Critical or Priority Habitat and Species Use
There are several priority habitat types associated with Tule Lake. These habitats include: large waterfowl concentration areas; Rocky Slough wood duck site, consisting of a marsh complex; Tanwax Creek wetland habitat, inclusive of a mixture of some forested, emergent marsh, scrub-shrub, and riverine wetlands; and Tule Lake wood duck breeding areas (WDFW, 2007a).
Water Quality
According to the 2004 Washington State Water Quality Assessment (Ecology, 2004b), Tule Lake has one Category 2 listing for water quality impairment due to total phosphorus.
5.5.14.2 Shoreline Use Patterns
The shoreline planning area of the Tule Lake is largely in forest resource uses. Previous logging is evident from aerial photographs on all sides of the lake. Timber cutting appears to have occurred more recently within 500 feet of the eastern shore of Tule Lake. The existing Shoreline Environment Designation of Tule Lake is Conservancy, where it is mapped. The Comprehensive Plan designation for Tule Lake is Rural 10. Tule Lake is outside of the UGA.
Modifications to Tule Lake are related to timber harvest and construction of logging roads. An informal boat launch is located on the northwestern shore of the lake. No structures other than roads are found within the shoreline planning area.
No existing or proposed parks occur on Tule Lake. No cultural resources are inventoried within the Tule Lake area.
June 2009 Page 5-73

Pierce County Shoreline Inventory and Characterization Report
5.5.14.3 Reach Scale Assessment
Tule Lake and associated wetlands along Rocky Slough are designated as a single reach - TULW_LK_01.
5.5.14.4 Restoration Opportunities
Restoration opportunities for Tule Lake include restoring forested riparian areas along the lakeshore, which have been modified through timber harvest. This lake could be protected in its current condition due to its relatively natural state.
5.5.15 Twenty-seven Lake
5.5.15.1 Physical and Biological Characterization
Drainage Basin, Tributary Streams, and Associated Wetlands
Twenty-seven Lake is located in the Mid-Nisqually River drainage basin, west of SR 161 and west of Clear Lake. The lake is approximately 21 acres in size. Approximately 16% of the Twenty-seven Lake planning area is mapped as wetland habitat based on GIS data.
Geologic and Flood Hazards
Twenty-seven Lake formed in a depression on a continental glacial soil terrace. Discharge from the lake drains to the north into Clear Lake. Alluvial soils and peat deposits may be found in the area of the lake. Identified hazards include flooding and erosion potential. Although not identified, seismic hazards from peat or alluvial soils may be likely.
Critical or Priority Habitat and Species Use
There are two priority habitats associated with Twenty-seven Lake: large waterfowl concentration areas, and the Tanwax Creek wetlands, composed of an assortment of forested, emergent marsh, scrub-shrub, and riverine wetlands (WDFW, 2007a).
Water Quality
According to the 2004 Washington State Water Quality Assessment (Ecology, 2004b), Twenty-seven Lake has one Category 2 listing for water quality impairment for total phosphorus.
5.5.15.2 Shoreline Use Patterns
The shoreline planning area of the Twenty-seven Lake is predominated by rural residential development and farming uses. The existing Shoreline Environment Designation of Twenty-seven Lake is Conservancy. County zoning and Comprehensive Plan designations are Rural 10. Twenty-seven Lake is outside of the UGA.
Modifications to the lake shore are related to rural residential uses in the northern half of the lake. One dock was observed on Twenty-seven Lake. There are only 5 to 6 developed lots on Twenty-seven Lake. Pasture occurs on the southern shoreline.
Page 5-74 June 2009

Pierce County Shoreline Inventory and Characterization Report
No existing or proposed points of public access occur on the lake shore. No cultural resources are inventoried within the Twenty-seven Lake area.
5.5.15.3 Reach Scale Assessment
Twenty-seven Lake is referred to as a single shoreline reach called TWEN_LK_01.
5.5.15.4 Restoration Opportunities
Restoration opportunities for Twenty-seven Lake include restoring forested riparian areas along the lakeshore. This lake could be protected in its current condition due to its relatively natural state.
5.5.16 Twin Lake
5.5.16.1 Physical and Biological Characterization
Drainage Basin, Tributary Streams, and Associated Wetlands
Twin Lake is located in the Mid-Nisqually River drainage basin near a cluster of lakes comprised of Benbow Lakes, Whitman, Bryon and Tanwax Lakes. Twin Lake is approximately 12 acres in size. Approximately 22% of the lake’s planning area is covered by wetland, based on GIS data. Twin Lake is part of a complex of wetlands and small lakes along the upper portion of Tanwax Creek. These lakes are surrounded by mapped forested and scrub-shrub wetlands.
Geologic and Flood Hazards
Twin Lake is comprised as part of the Benbow Lakes complex. The Twin Lakes (the southernmost which is referred to here) developed in depressions formed in continental glacial soils in the upper reach of Tanwax Creek. Identified hazards are erosion potential, seismic hazards from peat and alluvial soils, and flooding hazard.
Critical or Priority Habitat and Species Use
There are several priority habitats associated with Twin Lake. These habitats include large waterfowl concentration areas, natural urban open space, and Tanwax Creek wetlands, composed of forested, emergent marsh, scrub-shrub, and riverine wetlands (WDFW, 2007a).
Water Quality
According to the 2004 Washington State Water Quality Assessment (Ecology, 2004b), Twin Lake North and South have Category 2 listings for water quality impairment due to total phosphorus.
5.5.16.2 Shoreline Use Patterns
The shoreline planning area of the Twin Lake is predominated by rural residential development and farming uses. Twin Lakes does not have a Shoreline Environment Designation in the County SMP. However, Whitman Lake, a neighboring lakeshore, is designated Rural-
June 2009 Page 5-75

Pierce County Shoreline Inventory and Characterization Report
Residential. Comprehensive Plan designations and implementing zoning largely follow existing land use patterns, and are dominated by Rural 10. Twin Lake is outside of the UGA.
Little is know about the shoreline modifications on Twin Lake. However, 15 docks are counted from aerial photographs, occurring on the east and southern shores of the lake. No docks were observed on the western and north shores. No existing or proposed points of public access occur on Twin Lake. No cultural resources are inventoried within the Twin Lake area.
5.5.16.3 Reach Scale Assessment
Twin Lake, the southernmost of the Twin Lakes, is designated in one shoreline reach called TWIN_LK_01. The northern “twin” is designated Benbow Lake. Whitman Lake is immediately to the southwest of Twin Lake.
5.5.16.4 Restoration Opportunities
Restoration opportunities for Twin Lake include adding trees along the eastern shoreline. The western shore of the lake could be protected in its current condition due to its relatively natural state.
5.5.17 Unnamed Lake (Tanwax)
5.5.17.1 Physical and Biological Characterization
Drainage Basin, Tributary Streams, and Associated Wetlands
This unnamed lake near Tanwax Creek is a nearly circular lake with a wetland fringe. This unnamed lake is mapped northwest of Kreger Lake. Thomas Brothers mapping (2007) indicates that this lake is referred to as “Swan Lake.” Based on aerial photos, wetland habitats are highly disturbed. Wetlands comprise approximately 48% of this shoreline reach.
Geologic and Flood Hazards
Unnamed Lake is located just north of Kreger Lake and developed in a depression in continental glacial soils. Drainage from this lake flows into Kreger Lake. Peat and alluvial soils may be present. Identified hazards include flooding, erosion potential and seismic hazards from peat or alluvial soils.
Page 5-76 June 2009

Pierce County Shoreline Inventory and Characterization Report
Critical or Priority Habitat and Species Use
There are two types of priority habitat areas associated with this Unnamed Lake: large waterfowl concentration areas and Kreger and Silver Lakes wetland habitat, comprised of a mixture of agricultural, forested, scrub-shrub, and emergent marsh wetlands providing important waterfowl wintering areas (WDFW, 2007a).
5.5.17.2 Shoreline Use Patterns
The shoreline planning area of the Unnamed Lake is in agricultural uses and has been converted to pasture lands. There is no existing SMP Shoreline Environment Designation for this Unnamed Lake (Tanwax). The Comprehensive Plan designates this area as Rural 10. The lake is outside of the UGA.
No structures or infrastructure intrudes into the planning area of the lake. However, the vegetation along the shoreline of the lake is highly modified and converted to pasture lands. No shrub or forested cover remains within 300 feet of the lake. No existing or proposed points of public access occur along the stream.
No cultural resources are inventoried within the Unnamed Lake area. However, seasonal hunting by the Nisqually Tribe could have occurred in the area, and as such there is some potential for the presence of cultural resources.
5.5.17.3 Reach Scale Assessment
This Unnamed Lake, east of Tanwax Creek and northwest of Kreger Lake, is referred to as UNNA_LK_01.
5.5.17.4 Restoration Opportunities
Restoration opportunities for Unnamed or Swan Lake include restoring forested riparian areas along the lakeshore and restoring natural vegetation in degraded associated wetlands.
5.5.18 Unnamed Lake (South of Roy)
5.5.18.1 Physical and Biological Characterization
Drainage Basin, Tributary Streams, and Associated Wetlands
Unnamed Lake (South of Roy) is located west of Horn Creek and east of the confluence of Murray Creek with the Nisqually River. This unnamed lake includes a large, narrow wetland system that extends to the southwest toward SR 702. Wetland habitats in this area include palustrine forested, scrub-shrub, and emergent areas. Based upon the GIS data, wetlands comprise 91% of the lake shoreline planning area.
June 2009 Page 5-77

Pierce County Shoreline Inventory and Characterization Report
Geologic and Flood Hazards
Unnamed Lake (South of Roy) is located between Lake Serene and the Nisqually River and has developed on a terrace of continental glacial soils. Peat and alluvial soils may be present. Identified hazards include flooding, erosion potential and seismic hazards from peat or alluvial soils.
Critical or Priority Habitat and Species Use
There are two types of priority habitats associated with this Unnamed Lake. These habitats include Nisqually River wetland habitat, comprised of various riverine, forested, emergent marsh, scrub-shrub, and agricultural wetlands providing fish habitat and waterfowl use areas; and Murray Creek wetland habitat, composed of a mixture of some forested, emergent marsh, riverine, scrub-shrub, and agricultural wetlands (WDFW, 2007a).
5.5.18.2 Shoreline Use Patterns
The shoreline planning area of the Unnamed Lake is predominated by rural residential development and farming uses. Unnamed Lake (near Roy) is not designated in the County’s current SMP. The Comprehensive Plan designates this area as Rural 10. Unnamed Lake is outside of the UGA.
Little information is known about this Unnamed Lake. However, it appears from aerial photographs that this lake has been historically excavated from former wetlands. An “island” of upland exists in the lake that is used by vehicles. No existing or proposed points of public access occur along the stream. No cultural resources are inventoried within the Unnamed Lake area.
5.5.18.3 Reach Scale Assessment
The Unnamed Lake (Roy) west of Horn Creek confluence with the Nisqually and east of the Murray Creek confluence at the border of Fort Lewis is called – UNNA_LK1_01.
5.5.18.4 Restoration Opportunities
Restoration opportunities for Unnamed Lake include restoring forested riparian areas along the lakeshore and restoring natural vegetation in degraded associated wetlands.
Page 5-78 June 2009

Pierce County Shoreline Inventory and Characterization Report
5.5.19 Whitman Lake
5.5.19.1 Physical and Biological Characterization
Drainage Basin, Tributary Streams, and Associated Wetlands
Whitman Lake, a 30-acre lake, is located approximately 6.5 miles north of Eatonville. Whitman Lake is fed by Twin Lakes (Benbow and Twin Lake) and drains to Tanwax Creek and the Nisqually River. This lake occurs at an altitude of 601 feet and drains approximately 0.97 square miles (Ecology, 1994).
Whitman Lake is part of a complex of wetlands and small lakes along the upper portion of Tanwax Creek. These lakes are generally mapped as lacustrine, palustrine aquatic bed, or palustrine unconsolidated bottom habitats, surrounded by palustrine forested and scrub-shrub wetlands. Based upon GIS data, approximately 37% of the shoreline planning area is considered wetland.
Geologic and Flood Hazards
Lake Whitman comprises part of the Benbow Lakes complex. The lake formed in a depression in continental glacial soils. Lake Whitman receives drainage from the Twin Lakes to the north and discharges to the south into Tanwax Creek. Identified hazards include erosion potential, seismic hazards from peat and alluvial soils, and flooding hazard.
Critical or Priority Habitat and Species Use
There are several priority habitat types associated with Whitman Lake. These habitats include small and large waterfowl concentration areas; urban natural open space; and Tanwax Creek wetland habitat, inclusive of a mixture of forested, emergent marsh, scrub-shrub, and riverine wetlands (WDFW, 2007a).
Instream and Riparian Habitats
Shoreline along Whitman Lake extends approximately 1.0 mile. Mean depth is 12 feet and maximum depth is 20 feet. Plant species present at the lake include waterweed and eel-grass pondweed (Ecology, 1994).
Water Quality
According to the 2004 Washington State Water Quality Assessment (Ecology, 2004b), Whitman Lake has one Category 2 listing for water quality impairment for total phosphorus.
5.5.19.2 Shoreline Use Patterns
The shoreline planning area of the Whitman Lake is predominated by rural residential development and farming uses. The existing Shoreline Environment Designation of Whitman Lake is Rural-Residential. The Comprehensive Plan designates the lake as Rural 10. Whitman Lake is outside of the UGA.
June 2009 Page 5-79

Pierce County Shoreline Inventory and Characterization Report
Modifications on Whitman Lake are related to residential development. Residential roads surround the lake providing access to homes along the shoreline. Approximately 44 docks were identified on Whitman Lake, some of which appear to be abandoned.
WDFW maintains a boat launch on Whitman Lake on the southeastern shore. No cultural resources are inventoried within the Whitman Lake area.
5.5.19.3 Reach Scale Assessment
Whitman Lake is one lake in the Benbow Lakes complex. Whitman Lake is represented by a single shoreline reach – WHIT_LK_01.
5.5.19.4 Restoration Opportunities
Restoration opportunities for Whitman Lake include restoring forested riparian areas along the lakeshore and restoring natural vegetation in degraded associated wetlands.
5.5.20 La Grande Reservoir
5.5.20.1 Physical and Biological Characterization
Drainage Basin, Tributary Streams, and Associated Wetlands
La Grande Reservoir is located in the Upper Nisqually River drainage basin and is approximately 24 acres in size. La Grande Reservoir is a portion of the Nisqually River that is impounded behind La Grande Dam. Approximately 72% of the reservoir’s planning area is wetland based on GIS data.
Geologic and Flood Hazards
La Grande Reservoir is a narrow reservoir formed by the construction of the La Grande Dam on the Nisqually River, south of the town of La Grande, Washington, and extends to the Alder Dam. Alluvial deposits may be found in the area of the lake, and volcanic bedrock with overlying alpine glacial soils are exposed on the valley walls. Identified hazards include volcanic hazards from mudflow deposits and flooding.
Critical or Priority Habitat and Species Use
La Grande Reservoir has several associated priority habitats. These habitats include old growth habitat; natural open space areas, specifically candidate open space areas and Puyallup steep slopes open space areas; Pierce County snag rich habitat; and Upper Nisqually bald eagle use areas (WDFW, 2007a).
Water Quality
According to the 2004 Washington State Water Quality Assessment (Ecology, 2004b), La Grande Reservoir has one Category 2 listing for water quality impairment due to total phosphorus.
Page 5-80 June 2009

Pierce County Shoreline Inventory and Characterization Report
5.5.20.2 Shoreline Use Patterns
The shoreline planning area of the La Grande Reservoir is predominated by rural residential development and agricultural resource lands. La Grande Reservoir’s shorelines have not been modified with the exception of dam walls and structures, which create the southern and northern shorelines of the reservoir.
There is no existing Shoreline Environment Designation for La Grande Reservoir in the County’s SMP. The Comprehensive Plan designates this area as Rural 10 and Agricultural Resource Land.
No existing or proposed points of public access occur along the reservoir’s shoreline. The 45-acre La Grande Reservoir is not publicly accessible due to steep, rugged terrain (Tacoma Power, 2009).
No cultural resources are inventoried within the La Grand Reservoir area. However, seasonal hunting by the Nisqually Tribe could have occurred in the area, and there is some potential for the presence of cultural resources. Cultural resources could exist below the waterline of the reservoir, inundated when La Grand Dam was constructed and the reservoir was created.
5.5.20.3 Reach Scale Assessment
La Grande Reservoir is an impounded portion of the Nisqually River adjacent to Alder Lake. This shoreline planning area is given the reach name LAGR_RES_01.
5.5.20.4 Restoration Opportunities
Restoration opportunities for La Grande Reservoir include restoring forested riparian areas along the lakeshore and restoring natural vegetation.
June 2009 Page 5-81

Pierce County Shoreline Inventory and Characterization Report
5.5.21 Gaps in Existing Information
This subsection describes specific data gaps or limitations identified during development of the shoreline inventory and characterization, as required by Ecology’s guidelines (WAC 173-26-201(3)(c)(viii)). This list should not be considered exhaustive. As additional information is developed, this list may be helpful as the County considers future updates and amendments to its Shoreline Master Program.
There are many waterbodies within the planning area for which limited information is available to provide a complete characterization. Waterbodies with limited existing information are listed below in Table 5-6 according to the parameter for which information is lacking.
Table 5-6. Waterbodies Parameters
Waterbody Parameter for which data do not exist
Modifications Instream and Riparian Habitat Water Quality
Beaver Creek X X
Busy Wild Creek X X
Copper Creek X X X
Midway Creek X X X
South Fork of the Little Mashel River
X X X
Twenty-five Mile Creek X
Unnamed Trib. Mashel River
X X X
Alder Lake X
Benbow Lakes X X
Clear Lake X X
Cranberry Lake X X X
Harts Lake X X
Kreger Lake X X
La Grande Reservoir X
Little Lake X X
Muck Lake X X X
Mud Lake X X
Silver Lake X X X
Page 5-82 June 2009

Pierce County Shoreline Inventory and Characterization Report
June 2009 Page 5-83
Waterbody Parameter for which data do not exist
Modifications Instream and Riparian Habitat Water Quality
Tanwax Lake X
Trout Lake X X X
Tule Lake X X
Twenty-seven Lake X X
Twin Lakes X X
Unnamed Lake (near Tanwax)
X X X
Unnamed Lake (S of Roy) X X X

Pierce County Shoreline Inventory and Characterization Report
CHAPTER 6 CHAMBERS-CLOVER SHORELINE PLANNING AREA (WRIA 12)
6.1 Water Bodies in the Chambers-Clover Shoreline Planning Area
This chapter provides inventory information for the waterbodies in the Chambers-Clover shoreline planning area that meet the jurisdiction of shoreline of the state or shoreline of statewide significance. In total there is one freshwater lake considered shorelines of statewide significance in the Chambers-Clover Creek watershed. There are three streams and one lake meeting the definition of shorelines of the state.
For ease of reference, this chapter describes these water bodies in alphabetical order, as shown in the numbered list below. Following the alphabetical list, Table 6-1 shows the freshwater bodies organized by drainage basin. The drainage basin table provides a cross reference to where each freshwater body is discussed in the chapter text.
6.1.1 Alphabetical Listing of Water Bodies
Freshwater Shorelines of Statewide Significance –
1. American Lake (1,091 acres)
Rivers, Shorelines of the State –
1. Chambers Creek 2. Clover Creek 3. Spanaway Creek
Lakes, Shorelines of the State –
1. Spanaway Lake
6.1.2 Listing of Freshwater Bodies by Drainage Basin
Table 6-1 lists the freshwater bodies within shoreline jurisdiction by drainage basin. Table 6-1. WRIA 12 Freshwater Bodies by Drainage Basin
Basin Main Stream Tributaries to Main Stream
Smaller Streams/Lakes Feeding into Tributaries
Chambers Bay Basin Chambers Creek
Clover Creek/ Steilacoom Basin
Clover Creek Spanaway Creek Spanaway Lake American Lake Basin
American Lake
June 2009 Page 6-1

Pierce County Shoreline Inventory and Characterization Report
6.2 Freshwater Shorelines of Statewide Significance
6.2.1 American Lake
6.2.1.1 Physical and Biological Characterization
Processes and Channel Modifications
Ecological process and channel modifications exist throughout the American Lake system. Primary process modifications include:
• Water quality degradation from urban stormwater runoff;
• Lack of riparian habitat and increases in hard armoring of lakeshores.
Drainage Basin, Tributary Streams and Associated Wetlands
The American Lake is an approximately 1,100 acre lake near Fort Lewis and the City of Lakewood. The American Lake sub-basin comprises 25% of the Chambers-Clover Creek watershed. This sub-basin is dominated by lakes including American Lake, Gravelly Lake, Lake Louise, and Sequalitchew Lake (Ecology, et al., 1995a). American Lake drains southwesterly towards Sequalitchew Creek through wetlands and marshes.
A very small portion of the American Lake shoreline (less than 1% of the planning area) is mapped as wetland by Pierce County.
Sequalitchew Creek flows out of the west end of Sequalitchew Lake on Fort Lewis, through the City of Dupont to Puget Sound. The stream flows through Hanner Marsh on Fort Lewis and Edmond Marsh in Dupont. These marshes are densely vegetated with emergent, floating, and submerged plants (TPCHD, 2004).
Geologic and Flood Hazards
American Lake occupies a closed depression in the recession outwash that forms the upland surface and mantles till in this area. Ice contact deposits underlie the recessional outwash, and till is likely present at shallow depths beneath these recessional deposits. The lake is directly connected to the groundwater of the shallow aquifer perched on top of till. Lake levels vary with variations in the shallow aquifer in the surrounding area.
Critical or Priority Habitat and Species Use
Several priority habitats have been designated in and around American lake. The lake has been designated a waterfowl concentration area and there are Sequalitchew Creek wetlands around the lake. Urban natural open space is located on the east side of the lake, and there are multiple bald eagle nests located around the shoreline of the lake.
Page 6-2 June 2009

Pierce County Shoreline Inventory and Characterization Report
Water Quality
According to the 2004 Washington State Water Quality Assessment (Ecology, 2004b), American Lake is 303(d) listed (Category 5 listing) for total phosphorus, Dieldrin (a toxic pesticide), and total PCBs. In addition, American Lake has one Category 1 listing for total phosphorus.
6.2.1.2 Shoreline Use Patterns
Existing Land and Shoreline Use
American Lake lies within Fort Lewis Military Reservation and the City of Lakewood, with a small area of the southeastern shoreline in Camp Murray Washington National Guard, which is in Pierce County jurisdiction. Ecology’s web page for WRIA 12 indicates that American lake is largely urban in setting specifically urban residential (http://www.ecy.wa.gov/apps/watersheds/wriapages/12.html).
Shoreline modifications
Modifications along the shoreline of American Lake include bulkheads, docks and hardened surfaces typical of urban residential uses. Interstate 5 and the Burlington Northern Railroad run parallel to the eastern shoreline of American Lake within 0.5 mile of the shore.
Shoreline Environment Designations, Zoning, and Other Applicable Regulations
American Lake is currently designated as Urban in the County’s SMP. The Comprehensive Plan designates the shoreline planning area of American Lake as Urban Military Land.
Existing and Potential Public Access Areas
American Lake has several parks and boat launches within the City of Lakewood.
Historic and Cultural Resources
Cultural resources are recorded in the American Lake shoreline planning area, including pre-contact materials and campsites in the area to the southeast of the lake. Native American use of the American Lake area, by the Puyallup Tribe, included seasonal hunting and gathering campsites near the lakeshore and associated streams. Recorded artifacts include lithic scatters, charcoal deposits, and calcined bones (DAHP, 2007). Subsistence hunting of upland mammals and other supplemental foraging activities occurred in the American Lake vicinity and throughout the watershed (DAHP, 2007).
In addition, several historic resources and registered sites are located within and near the American Lake shoreline planning area. A historic debris scatter was inventoried to the southeast of the lake shoreline. Along the east shore of the lake several estates and residences are listed on the National Register and Washington Historic Register. The Adjunct General's Residence, located within Camp Murray, was constructed in 1921 as a military housing facility. The residence, which was converted to office use in the 1960s, retains original architectural character and was listed as a historic structure in 1991. Other historic locations outside of Pierce
June 2009 Page 6-3

Pierce County Shoreline Inventory and Characterization Report
County jurisdiction along the American Lake shoreline include the Thornewood Estate and the Veterans Administration American Lake Medical Center. Thornewood Estate originally included over 100 acres, of which the manor house, stables, and gate house remain intact presently. The estate, which is located entirely in Lakewood, was developed in 1911 and listed in 1982. The American Lake Medical Center, located on the west shoreline of the lake, was designated a historic district by Washington State in 1980. Center facilities were built between 1925 and 1959 and are still used as a Veterans Affairs Department medical center.
6.2.1.3 Reach Scale Assessment
American Lake has one reach within Pierce County jurisdiction. This reach is referred to as AMER_LK_01. Water quality degradation and shoreline modifications are the biggest impairments to shoreline function in American Lake.
6.2.1.4 Restoration Opportunities
Restoration opportunities for the American Lake shoreline include replacing bulkheads with softer alternatives where possible; consolidating or replacing docks with alternate decking to reduce shade impacts; and restoring forested riparian buffers where possible. Other opportunities for restoration include stormwater retro-fits to reduce sediment transport to the lake and to provide water quality improvement in runoff entering American Lake.
6.3 Rivers, Shorelines of the State
6.3.1 Chambers Creek
6.3.1.1 Physical and Biological Characterization
Processes and Channel Modifications
Ecological process and channel modifications exist throughout the Chambers Creek system. Primary process modifications include:
• Land conversion from forest to pasture, lawn, or impervious surfaces;
• Installation of physical barriers and crossings;
• Groundwater extraction and use has modified the amount of water available during low flow periods;
• Installation of the dam at the outlet of Steilacoom Lake; and
• Installation of a fish weir/reservoir at the mouth of the creek.
Drainage Basin, Tributary Streams and Associated Wetlands
The Chambers-Clover Creek drainage originates from spring and groundwater discharge in the northeast corner of the watershed. The two primary streams within this basin are Chambers Creek and Clover Creek. Chambers Creek is formed from the outlet of Steilacoom Lake and flows 4.0 miles north and west down a narrow ravine where it is joined by Flett and Leach
Page 6-4 June 2009

Pierce County Shoreline Inventory and Characterization Report
Creeks, before discharging to Puget Sound through Chambers Bay (Ecology, et al., 1995a). Flett and Leach Creeks are the two primary tributaries of Chambers Creek. Although the full length of Chambers Creek is 4 miles, only 0.4 miles of the stream qualifies as a Shoreline of the State within Pierce County borders.
Approximately 23 acres (94%) of the Chambers Creek shoreline planning area consists of wetlands, based on GIS data. Aerial photos and NWI data indicate these are estuarine and riparian, forested wetlands at the mouth of the stream.
Geologic Hazards
Chambers Creek drains the north side of Steilacoom Lake, flows northward to the junction with Leach and Flett Creeks, and then turns westward to Puget Sound. Chambers Creek is deeply incised into an upland plateau comprised largely of continental ice-sheet deposits. In its upper reaches, the stream passes over recessional outwash deposits. Where the stream is more deeply incised near Puget Sound, the valley floor is underlain by glacially overridden advance outwash. Toward the mouth of Chambers Creek, the stream valley is incised into older glacial and nonglacial sediments. Hazards identified along Chambers Creek include seismic, flood, and landslide. Steep slopes and areas with erosion potential are also identified along the creek. Wet areas, or areas with low infiltration, may be present in places where the creek crosses fine-grained deposits or till.
Flood Hazards
Flood hazards occur along Chambers Creek associated with streamflow and with interaction with the shallow groundwater table in the region. Potential flooding areas associated with stream flow are shown on FEMA FIRMs.
Flooding associated with groundwater can occur throughout the large outwash channel, generally south of Clover Creek within WRIA 12.
Critical or Priority Habitat and Species Use
Chambers Creek provides habitat for cutthroat trout, fall Chinook, coho, summer chum, and winter steelhead. Fish species distribution maps (WDFW, 2007b) indicate that fall Chinook have a documented presence in a segment of Chambers Creek adjacent to Puget Sound, spawning habitat for coho throughout the creek, and a documented presence for summer chum and winter steelhead throughout the creek.
Critical habitat for the Puget Sound DPS steelhead has not yet been designated. The Puget Sound/Strait of Georgia ESU coho salmon is a species of concern, and therefore, does not have critical habitat designated. Puget Sound ESU Chinook salmon and the summer chum do not have critical habitat designated within Chambers Creek.
Anadromous fish production in the Chambers-Clover Creek watershed is relatively low and has been below historic levels for a number of years. There are many factors contributing to these low levels, including seasonal flooding, low summer flows, unstable stream beds, physical barriers, poor water quality, and spawning habitat destruction (Ecology, et al., 1995a). This
June 2009 Page 6-5

Pierce County Shoreline Inventory and Characterization Report
decline is illustrated by the following figures from the Salmon Habitat Protection and Restoration Strategy for WRIAs 10 and 12.
Chinook within the Chambers-Clover Creek watershed had a historic average abundance of 2,100 and have a current average abundance of 0. This can be explained by the fact that WDFW currently operates a fish ladder and trap at the head of the tidewater so as to inhibit any Chinook passage upstream. Coho within the Chambers-Clover Creek watershed had a historic average abundance of 12,200 and a current average abundance of 700 (Pierce County, 2005c).
Adult salmonids migrate upstream through the Chambers Creek estuary throughout the year. Pacific salmon species (e.g., Chinook, chum, and coho) migrate upstream during late summer, fall, and early winter, while steelhead trout migrate in both winter and summer runs (Ecology, et al., 1995a). Migrating salmon aggregate near the mouth of Chambers Creek during July and August before migrating during the months of September through January (Ecology, et al., 1995a).
There are several priority habitat areas associated with Chambers Creek. These habitats include urban natural open space in the form of candidate open space and Puyallup steep slopes; a large waterfowl concentration area; Chambers Creek riparian corridor habitat; an open lagoon; and estuaries associated with the Chambers Creek confluence. A bald eagle nest has been recorded approximately 500 feet southeast of the westernmost segment of Chambers Creek.
Instream and Riparian Habitats
Much of the Chambers-Clover Creek watershed has been urbanized and, as a result, associated streams have incurred impacts such as extreme water level fluctuations (increased flooding and summer low-flow levels) and increased temperatures. Overall, there is not enough quantitative data available for making a thorough assessment of this reach (Ecology 1995).
Water Quality
According to the 2004 Washington State Water Quality Assessment (Ecology, 2004b), Chambers Creek has one 303(d) listing (Category 5 listing) for impaired water quality: fecal coliform. In addition, Chambers Creek contains a Category 4A listing for copper; two Category 2 listings for pH and temperature; and ten Category 1 listings for ammonia-N, arsenic, copper, dissolved oxygen, lead, mercury, pH, total PCBs, zinc, and temperature (Ecology, 2004b).
6.3.1.2 Shoreline Use Patterns
Existing Land and Shoreline Use
Approximately the lower 2 miles of Chambers Creek is surrounded mainly by undeveloped riparian forest, which is protected as the Chambers Creek Canyon Park. Outside of this Park, which surrounds the stream channel as it runs generally east to west, is primarily moderate density single-family residential development .A private golf course, the Oakbrook Golf Course, is located directly south of Chambers Creek Canyon Park.
Page 6-6 June 2009

Pierce County Shoreline Inventory and Characterization Report
Shoreline modifications
There are few bridges over Chambers Creek, with the first occurring near RM 3.0 – for 81st Street SW, a two lane residential road. At approximately RM 3.5 where Chambers Creek flows from Lake Steilacoom, a four-lane arterial, Steilacoom Blvd. SW, passes over the stream. No culverts occur on Chambers Creek and the two noted bridges do not interfere with fish passage. A major overhead and underground utility crossing occurs at approximately RM 2.8, near the 81st Street SW Bridge.
As noted above, the lower 2 miles of Chambers Creek, within the Chambers Creek Canyon Park, has not been modified. Upstream of the park, from approximately RM 2.0, portions of the stream are channelized with concrete bulkheads. It appears that these shoreline modifications are associated with areas where residential development is closest to Chambers Creek, likely constructed to protect homes, accessory structures, and upland property.
Shoreline Environment Designations, Zoning, and Other Applicable Regulations
The existing Shoreline Environment Designations for Chambers Creek are Conservancy and Natural. Zoning, as noted above, largely follows existing land use and is dominated by Moderate Single Family (99%) zoning. Small areas of commercial and industrial zoning occur within the stream’s planning area, predominantly around the stream’s downstream extent, where it flows into the Chambers Creek Reservoir and Chambers Bay.
Existing and Potential Public Access Areas
Chambers Creek Canyon Park is approximately 195 acres of open space and provides public access to Chambers Creek via nature trails (Pierce County Parks, 2007). There are currently no restrooms in Chambers Creek Canyon, but the Master Site Plan calls for restrooms to be added in the future.
Historic and Cultural Resources
Cultural resources within the Chambers Creek shoreline planning area include recorded pre-contact materials and campsites. Native American use of the Chambers Creek area, by the Puyallup Tribe, included seasonal hunting and gathering campsites near Chambers Creek. Recorded artifacts include lithic scatters, charcoal deposits, and calcined bones (DAHP, 2007). Subsistence harvest of anadromous fish (salmon and trout) and supplemental hunting of upland mammals occurred along Chambers Creek and throughout the watershed (DAHP, 2007).
6.3.1.3 Reach Scale Assessment
Chambers Creek is identified by one reach – CHAMB_CR01.
6.3.1.4 Restoration Opportunities
The Chambers-Clover Creek Watershed Council (CCCWC) is one of several watershed councils in Pierce County. It is composed of citizens, local governments and local businesses, elected officials, and environmental agency representatives who coordinate their efforts to restore and
June 2009 Page 6-7

Pierce County Shoreline Inventory and Characterization Report
protect the watershed. The Council’s action plan for 2007 through 2011 includes restoring streams, wetlands, and riparian areas, restoring beneficial uses of lakes, and supporting salmon recovery efforts (CCCWC, 2007).
In addition, Pierce County has undertaken a program to identify and control knotweed infestations in Chambers Creek Canyon. Partners in the project include state and local agencies, community organizations and schools (Pierce County, 2008a).
6.3.2 Clover Creek
6.3.2.1 Physical and Biological Characterization
Processes and Channel Modifications
The Clover Creek channel system has been significantly modified in the past 150 years. Primary process modifications include:
• Land conversion from forest to pasture, lawn, or impervious surfaces;
• Installation of physical barriers and crossings associated with McChord Air Force Base, including 2,500 feet of pipe;
• Installation of large regional retention facilities;
• Diversions into asphalt-lined ditch around Pacific Lutheran University;
• Installation of vertical culverts to divert high flows into deeper aquifers;
• Groundwater extraction and use has modified the amount of water available during low flow periods;
• Installation of in-line and off-line privately-held ponds; and
• Removal of LWD and invasion by non-native invasive plant species.
Drainage Basin, Tributary Streams and Associated Wetlands
The Clover Creek basin is 74-square-miles in area and comprises roughly half of the Chambers-Clover Creek drainage area. Clover Creek flows through the center of the watershed, flowing from east to northwest, terminating just west of Interstate 5 (Ecology, et al., 1995a). The headwaters of Clover Creek are located in the vicinity of South Hill, near Puyallup, and flows generally northwest for 13.8 miles until it terminates at Lake Steilacoom (Tetra Tech/KCM, 2002). Approximately 3.5 miles of Clover Creek qualify as a Shoreline of the State within Pierce County. Groundwater discharge forms the actual headwaters of the stream. Clover Creek has been modified multiple times over the last century. These modifications have included rechanneling the creek into two large canals for irrigation; dredging and diking on the McChord Air Force Base; and other modifications resulting from the construction of creek-fed ponds in the eastern and central portions of the basin (Tetra Tech/KCM, 2002).
The three main Clover Creek tributary systems are the North Fork system, the Spanaway Creek system, and the Morey Creek system. The North Fork system carries runoff from the north central portion of the basin, near Midland and Parkland, south for approximately 4 miles through
Page 6-8 June 2009

Pierce County Shoreline Inventory and Characterization Report
county drainage ditches, then through a steep sloping ravine to the Clover Creek valley. The North Fork then flows west through residential areas of Parkland to its confluence with Clover Creek (Tetra Tech/KCM, 2002).
The headwaters of Morey Creek are located at the main Spanaway Creek channel in the southwestern part of the basin. Morey Creek flows in a generally westward direction for 1.1 miles and into the main channel of Clover Creek. The confluence of Morey Creek with Clover Creek is upstream from the culverts under the McChord Air Force Base runways and downstream of Smith Lake (Tetra Tech/KCM, 2002).
In addition to the three major tributary streams discussed above, the Clover Creek basin also contains several lakes, the largest in size being Lake Steilacoom, Spanaway Lake, and Tule Lake (Tetra Tech/KCM, 2002).
Associated wetlands within the Clover Creek basin are primarily freshwater, emergent, and scrub-shrub wetlands associated with stream channels and the headwaters of North Fork Clover, Clover, and Spanaway Creeks (Tetra Tech/KCM, 2002).
Approximately 88 acres (32%) of the Clover Creek planning area is mapped as wetland. A large riparian, scrub-shrub wetland (formerly known as Smith Lake) is mapped along Clover Creek at its confluence with Steilacoom Creek. A few smaller riparian wetlands are mapped by Pierce County farther upstream, near the confluence of Clover Creek and the North Fork Clover Creek.
Geologic Hazards
Clover Creek occupies a former westerly-trending, glacial meltwater channel that currently flows into Steilacoom Lake. The channel is deeply incised into recessional outwash deposits that form much of the upland surface. In places, the sides of the channel are steep and are likely underlain by till and advance outwash sand. Hazards identified along Clover Creek include seismic, flood, and landslide. Steep slopes and areas with erosion potential are also identified in discrete areas along the creek.
Flood Hazards
Flood hazards occur along Clover Creek associated with streamflow, and with interaction with the shallow groundwater table in the region. Potential flooding associated with stream flow is shown on FEMA flood maps. Flooding associated with groundwater can occur throughout the large outwash channel, generally south of Clover Creek within WRIA 12.Existing and future flooding magnitudes, sources, and potential solutions are detailed in Pierce County’s Clover Creek Basin Plan (2002a).
Critical or Priority Habitat and Species Use
Clover Creek provides habitat for cutthroat trout, coho and winter steelhead. Fish species distribution maps (WDFW, 2007b) indicate that coho has a documented presence throughout Clover Creek, and that winter steelhead has a historic presence. Critical habitat for the Puget Sound DPS steelhead has not yet been designated. The Puget Sound/Strait of Georgia ESU coho salmon is a species of concern, and therefore, does not have critical habitat designated.
June 2009 Page 6-9

Pierce County Shoreline Inventory and Characterization Report
There are several priority habitats associated with Clover Creek. These habitats include: large waterfowl concentration areas, Chambers Creek wetlands, and candidate urban natural open space areas.
Instream and Riparian Habitats
A two-phase stream reconnaissance survey was conducted in the spring of 2000 to document existing Clover Creek conditions for fish habitat, fish passage, riparian vegetation and connections between the creek and adjacent wetlands (Tetra Tech/KCM, 2002). All reaches in the Clover Creek system were classified as either floodplain or palustrine channel types. Floodplain channels are ranked as high use for fish habitat for all species of anadromous salmon. Palustrine channels are ranked as high use for coho, sockeye, chum, and pink salmon; and secondary use for Chinook, steelhead, sea-run cutthroat and bull trout (Tetra Tech/KCM, 2002). The majority of the stream reaches have been modified with a variety of structures, including weirs, asphalt substrate, bank armoring, culverts, bridges, and dams. Due to these alterations, no reaches were found to have highly suitable habitat use (Tetra Tech/KCM, 2002).
No suitable spawning habitat for Chinook was found in the stream system during the surveys. It was concluded unlikely that any anadromous salmon species access the upper three reaches of the mainstem because these reaches appear to go dry (or close to dry) for several months of the year (Tetra Tech/KCM, 2002). Overall findings from the areas surveyed indicate that there is very little spawning habitat available for salmon or trout species, as there are few areas of riffles and the substrate has a high amount of fine sediment. Wetland habitat within Clover Creek and Spanaway Creeks provide limited rearing habitat. Riparian vegetation consists in large part of non-native species, primarily reed canary grass, blackberries, yellow flag iris, and Scotch broom.
Instream and riparian habitat was found to be variable along Clover Creek. In the downstream-most reach, there is hardly any riparian zone present and the majority of the banks are hardened with riprap, concrete or other similar materials. There are no connections to off-channel habitats or wetlands and woody debris is not present (Tetra Tech/KCM, 2002). The riparian vegetation zone, where present, is often dominated by non-native species such as blackberries and reed canary grass. In the two uppermost reaches, there are connections with wetlands dominated by reed canary grass; riparian vegetation comprised of native species such as willows, alders and salmonberry; no woody debris; and aquatic habitat characterized as deep glide (Tetra Tech/KCM, 2002).
Water Quality
According to the 2004 Washington State Water Quality Assessment (Ecology, 2004b), Clover Creek has three 303(d) listings (Category 5 listings) for impaired water quality: dissolved oxygen, fecal coliform, and temperature. Reaches of Clover Creek also contain six Category 2 listings for dissolved oxygen, fecal coliform, lead, mercury, pH, and temperature. In addition, various reaches of Clover Creek contain Category 1 listings for ammonia-N, arsenic, cadmium, chromium, copper, nickel, pH, and zinc (Ecology, 2004b).
There are several key factors that are most likely to affect water quality in the Clover Creek basin: the permeability of surface soils, land use, sewage and stormwater disposal methods, and
Page 6-10 June 2009

Pierce County Shoreline Inventory and Characterization Report
June 2009 Page 6-11
the presence of lakes in the basin which serve as sources of nutrient and waste accumulation (Tetra Tech/KCM, 2002). The northwestern portion of the basin is highly urbanized and there are significant areas of commercial and industrial development. Stormwater outfalls and runoff from commercial and industrial uses, as well as sources such as the Brookdale Golf Course, are all potential sources of water quality degradation. Water quality problems associated with subsurface sewage disposal systems have been documented. The majority of the eastern half of the Chambers/Clover Creek basin relies on septic tanks and drainfields for sewage disposal.
6.3.2.2 Shoreline Use Patterns
Existing Land and Shoreline Use
From Spanaway Loop Rd. S to the crossing of State Highway 7, Clover Creek is highly channelized with an asphalt lined creek bottom (Pierce County, 2002a). This portion of the stream passes through a dense single-family residential neighborhood and the PLU Campus, and includes numerous culverts for roads.
To the southeast of State Highway 7 to 138th St E, the majority of the stream remains channelized. To the southeast of 138th St E, channel modifications are minimal, with the stream channel passing through a vegetated buffer approximately 100 feet wide to both sides.
For approximately 1.3 miles within the shoreline planning area of Lower Clover Creek, from Steilacoom Lake to Interstate 5, the primary land use is moderate to high-density single-family residential development. A 30 to 60-foot vegetated buffer extends from either shore of the stream in most areas throughout this portion of the stream, with residential lawns, landscaping, and house structures making up the remainder of the shoreline planning area. Within this reach, there appear to be no public access areas, beyond visual vistas presented by roadway overpasses. Near Lake Steilacoom, the stream is culverted below Gravelly Lake Drive and Clover Crest Drive.
For approximately 1.3 miles within the shoreline planning area of Lower Clover Creek, from Steilacoom Lake to Interstate 5, the primary land use is moderate to high-density single-family residential development. A 30 to 60 foot vegetated buffer extends from either shore of the stream in most areas throughout this portion of the stream, with residential lawns, landscaping, and house structures making up the remainder of the shoreline planning area. Within this reach, there appear to be no public access areas, beyond visual vistas presented by roadway overpasses. Near Lake Steilacoom, the stream is culverted below Gravelly Lake Drive and Clover Crest Drive. The only other roadway overpass before Interstate 5 is for Pacific Highway SW (RM 1.3), which parallels the interstate. Additionally, a railroad bridge overpass occurs immediately to the northwest of Pacific Highway SW.
Clover Creek passes under an Interstate 5 bridge overpass at approximately RM 1.4. Upstream for another 0.5 miles, the stream flows through an area with predominantly high-density single- and multi-family existing land use before crossing out of McChord Air Force Base1. A 50 to 80
1 McChord Air Force Base is a federally owned and controlled area; the Shoreline Management Act and other State and County regulations do not apply within federally controlled areas.

Pierce County Shoreline Inventory and Characterization Report
foot vegetated buffer extends from either shore of the stream in most areas, with landscaping and housing structures making up the remainder of the shoreline planning area. Visual public access is provided by the Bridgeport Way bridge over the stream.
From approximately RM 1.9 to RM 3.8, Clover Creek flows through the McChord Air Force Base (including within a 1,800-foot long culvert under a runway). Immediately upstream of McChord, Spanaway Creek converges with Clover Creek. In the area of convergence (RM ~3.9), neither stream is channelized, and the surrounding XX zoned area is vacant and provides an extensive vegetated buffer. Immediately north of the vacant area, an area of industrial/manufacturing use occurs to the north of Clover Creek.
Upstream of this point, from the Spanaway Loop Rd. S bridge, the stream is predominantly surrounded by single-family residential land use. Residential densities tend to decrease (as one moves further upstream, away from Interstate 5 and major arterial corridors). Other major land uses include the Pacific Lutheran University Campus, open space/recreation areas (including the Brookdale Golf Course), and vacant areas.
Shoreline Environment Designations, Zoning, and Other Applicable Regulations
Clover Creek and its shoreline planning area are currently designated as Urban and Rural. In the County’s existing SMP, Urban Shoreline Environment Designations are located up and downstream of McChord Air Force Base. The Rural designation occurs in the upper reaches of Clover Creek. Clover Creek now lies in incorporated Lakewood downstream of McChord and is no longer within County jurisdiction. Zoning and land use designations indicate that Moderate Single-Family residential is the dominant land use on Clover Creek.
Existing and Potential Public Access Areas
Public access to Clover Creek is provided at the Clover Creek Reserve, an 18-acre site purchased by Tahoma Land Conservancy and managed by Cascade Land Conservancy (see web site at: http://www.cascadeland.org/properties/pierce-property-descriptions). This purchase was funded by the Conservation Futures fund. The reserve consists of four properties along Clover Creek west of the Brookdale Golf Club and east of SR 7 and south of John Street East. Cascade Land Conservancy also owns an 11-acre parcel on Clover Creek just west of Spanaway Loop Road. This parcel is referred to as the Schibig-Lakeview Natural Preserve.
In addition, Pierce County Parks and Recreation owns a small parcel on 138th Street E called the Hopp Farm. This area has the potential to provide public access to Clover Creek. In addition, a 3.8-acre property called Parkland Habitat was purchased by Pierce County Parks using Conservation Futures funds. This park land is downstream of the Hopp Farm on the north bank of Clover Creek, south of Tule Lake Road.
In the upper watershed of Clover Creek, the Naches Trail Preserve is a 50-acre site purchased by Pierce County Public Works in 2003. This preserve is located off Military Road East and includes Clover Creek. The Naches Trail Stewardship Plan was developed in August 2006 and includes trails, non-motorized public access, and restoration within the site to improve habitats (web site at: http://www.co.pierce.wa.us/pc/services/home/environ/water/ps/naches.htm).
Page 6-12 June 2009

Pierce County Shoreline Inventory and Characterization Report
Historic and Cultural Resources
Cultural resources throughout the Clover Creek shoreline planning area include recorded pre-contact materials and campsites. Native American use of the Clover Creek area, by the Puyallup Tribe, included seasonal hunting and gathering campsites near Clover Creek. Recorded artifacts include lithic scatters, charcoal deposits, and calcined bones (DAHP, 2007). Subsistence harvest of anadromous fish (salmon and trout) and supplemental hunting of upland mammals occurred along Clover Creek and throughout the watershed (DAHP, 2007).
6.3.2.3 Reach Scale Assessment
Clover Creek, a tributary to Steilacoom Lake, is represented by one (1) shoreline reach. This reach is referred to as CLOV_CR_01 on the maps. Clover Creek has significant alterations to functions due to armoring of the channel, loss of surface water during the summer months, urban stormwater runoff, and degradation of water quality.
6.3.2.4 Restoration Opportunities
Pierce County Surface Water Management Program is undertaking a habitat and floodplain restoration project on Clover Creek. The multi-year project includes restoring terrestrial and aquatic habitat, enhancing riparian forest plant diversity, and improving floodplain areas along the stream. The goals of the project are to restore the natural interaction between the creek and its floodplain, restore habitat within the creek channel and its floodplain for fish and wildlife, and improve water quality conditions within the stream. The project extends from just below the confluence of the North Fork Clover Creek to the Brookdale Golf Course (Pierce County, 2006b).
6.3.3 Spanaway Creek
6.3.3.1 Physical and Biological Characterization
Processes and Channel Modifications
Primary process modifications include:
• Land conversion from forest to pasture, lawn, or impervious surfaces;
• Installation of a weir 2,200 feet downstream of the Spanaway Lake outlet;
• Diversions into asphalt-lined ditch around Pacific Lutheran University;
• Installation of vertical culverts to divert high flows into deeper aquifers;
• Groundwater extraction and use has modified the amount of water available during low flow periods; and
• Installation of in-line and off-line privately-held ponds.
June 2009 Page 6-13

Pierce County Shoreline Inventory and Characterization Report
Drainage Basin, Tributary Streams and Associated Wetlands
Spanaway Creek is a 5.8-mile tributary of Clover Creek, which flows in a generally northward direction from its source at Spanaway Lake. Approximately 2.4 miles of the total stream length is considered a Shoreline of the State. The creek flows north for 2.2 miles through urbanizing residential areas of Parkland, until it reaches a large marsh, formerly known as Smith Lake, where it enters Clover Creek (Tetra Tech/KCM, 2002). Spanaway Creek’s main channel is a perennial stream, which carries substantial flow, and in the summer months, is the only flow that continues into Clover Creek and Lake Steilacoom (Tetra Tech/KCM, 2002).
The Spanaway Creek sub-basin includes 25.6 square miles of the Clover Creek basin, and is located in the southwestern portion of that basin. The surface drainage system within the Spanaway Creek sub-basin includes several small streams, including Coffee Creek, all of which feed into Spanaway Lake. There are no tributary streams associated with this sub-basin.
As stated above, Spanaway Creek flows generally north from the north end of Spanaway Lake, under Old Military Road, then north for 2.2 miles through residential portions of Parkland. Spanaway Creek eventually flows into a large marsh, where it enters Clover Creek. Spanaway Creek’s main channel is a perennial stream which carries significant flow, which during the summer months, is the only flow that continues into Clover Creek and Lake Steilacoom.
Approximately 88 acres (51%) of the Spanaway Creek shoreline planning area consists of wetlands, based on GIS data. A large wetland (formerly known as Smith Lake) is mapped along Steilacoom Creek at its confluence with Clover Creek. Wetlands also surround Tule Lake. More scattered wetland habitats are mapped along Steilacoom Creek upstream from Tule Lake to Lake Steilacoom. Wetland habitats include palustrine scrub-shrub, forested, and emergent.
Geologic Hazards
Spanaway Creek drains northward from Spanaway Lake and occupies a channel developed in recessional outwash deposits. Till likely underlies the stream at shallow depths. Upstream of Spanaway Lake are several small, closed depressions filled with peat. Hazards identified along Spanaway Creek include seismic, flood, and landslide. Steep slopes and areas with erosion potential are also identified in discrete areas along the creek. Wet areas, or areas with low infiltration, may be present in places where the creek crosses fine-grained deposits or till.
Flood Hazards
Flood hazards occur along Spanaway Creek associated with streamflow, and with interaction with the shallow groundwater table in the region. Flooding associated with stream flow is shown on FEMA maps. In general, the risks associated with Spanaway Creek are relatively lower than other creeks in the area, due to the storage provided in Spanaway Lake.Flooding associated with groundwater can occur throughout the large outwash channel, generally south of Clover Creek within WRIA 12.
Page 6-14 June 2009

Pierce County Shoreline Inventory and Characterization Report
Critical or Priority Habitat and Species Use
Fish distribution maps (WDFW, 2007b) indicate that Spanaway Creek supports cutthroat trout and winter steelhead, as there is a historic presence of this species, and also supports coho. There is a small area within the stream that has been designated as spawning habitat for coho. Critical habitat for the Puget Sound DPS steelhead has not yet been designated. The Puget Sound/Strait of Georgia ESU coho salmon is a species of concern, and therefore, does not have critical habitat designated.
The PHS data indicates that there are several priority habitats associated with Spanaway Creek. The creek flows through Chambers Creek wetland areas, and there are waterfowl concentration areas at the northern and southern ends of Spanaway Creek. There is an area of urban natural open space at the northern end of the creek. In addition, Spanaway Creek is documented as a riparian zone because it provides a riparian corridor in connection with Chambers Creek and its fish hatcheries (WDFW, 2007a).
Instream and Riparian Habitats
The instream and riparian habitat along Spanaway Creek were found to be variable by the 2000 stream survey. The two downstream-most reaches of Spanaway Creek were found to have a riparian zone dominated by non-native species such as reed canary grass and rhododendrons with no pools or woody debris present. The middle reaches of the stream were found to have areas of dense riparian vegetation dominated by medium-sized conifers and hardwoods, along with reed canary grass in the herbaceous layer (Tetra Tech/KCM, 2002). Several pools were observed, along with woody debris and a connected wetland. The uppermost two reaches of Spanaway Creek were found to have a riparian zone dominated by conifers and hardwoods, with an unchannelized section with connections to side channels and wetlands (Tetra Tech/KCM, 2002). The uppermost reach, beginning at the outlet of Spanaway Lake, has banks hardened with riprap and very few pieces of woody debris and no pool habitat.
Water Quality
Spanaway Creek was not listed on the 303(d) list for any water quality parameters in 2004. However, a segment of the creek did contain a Category 2 listing for temperature (Ecology, 2002).
As stated above, there are several key factors contributing to water quality degradation in the larger Clover Creek basin. These factors include: the permeability of surface soils, land use, sewage and stormwater disposal methods, and the presence of lakes in the basin which serve as sources of nutrient and waste accumulation. In the Spanaway Creek sub-basin, water quality problems were linked to specific locations in the sub-basin, including on-site sewerage systems which pose an elevated risk for groundwater contamination because of the permeable soils, and dry wells belonging to businesses along the Pacific Avenue corridor which are used for disposal of wastewater and stormwater (Tetra Tech/KCM, 2002).
June 2009 Page 6-15

Pierce County Shoreline Inventory and Characterization Report
6.3.3.2 Shoreline Use Patterns
Existing Land and Shoreline
From its convergence with Clover Creek (at Clover Creek RM 3.9), Spanaway Creek flows generally to the southeast for approximately 2.3 miles to headwaters at Spanaway Lake. The lower two-thirds of the creek pass through low to areas with predominantly low to moderate density single-family residential land use. A vegetated riparian buffer around Spanaway Creek is largely maintained throughout the residential areas. The upper third of the creek lies in Spanaway Park.
Shoreline modifications
Bulkheads are common along Spanway Creek due to long-standing problems with erosion and flooding. As noted above, the upper third of Spanaway Creek, within the park/open space area, has not been modified. Downstream of the park portions of the stream are channelized and modified with concrete and other hard banks. It appears that these shoreline modifications are associated with areas where residential development is closest to Spanaway Creek, likely constructed to protect homes, accessory structures, and upland property.
Shoreline Environment Designations, Zoning, and Other Applicable Regulations
The existing Shoreline Environment Designation for Spanaway Creek is Urban. Zoning, as noted above, largely follows existing land use and is dominated by Moderate Single Family zoning. There are few bridges over Spanaway Creek, occurring at Military Road S, 138th Street SE, and Spanaway Loop Road.
Existing and Potential Public Access Areas
The upper third section of Spanaway Creek passes through Bresemann Forest (70 acres; forested area, public access via nature trails) and Spanaway Park (135 acres; Spanaway Lake access, nature trails near creek), both of which provide public access to the stream.
Historic and Cultural Resources
Cultural resources within the Spanaway Creek shoreline planning area include recorded pre-contact materials and campsites. Native American use of the Spanaway Creek area, by the Puyallup Tribe, included seasonal hunting and gathering campsites near Spanaway Creek. Recorded artifacts include lithic scatters, charcoal deposits, and calcined bones (DAHP, 2007). Subsistence harvest of anadromous fish (salmon and trout) and supplemental hunting of upland mammals occurred along Spanaway Creek and throughout the watershed (DAHP, 2007).
6.3.3.3 Reach Scale Assessment
Spanaway Creek, a tributary to Clover Creek, is represented by one (1) reach – SPAN_CR_01. This reach lies within established park lands or urban areas.
Page 6-16 June 2009

Pierce County Shoreline Inventory and Characterization Report
6.3.3.4 Restoration Opportunities
In 2007 Pierce County Public Works and Utilities completed a fish passage project at Bresemann Dam on Spanaway Creek. The Clover Creek Basin Plan recognized Bresemann Dam as a barrier to salmon and steelhead that could migrate upstream from Clover Creek. The primary purpose of the new fish passage channel is to allow fish to successfully bypass the dam from either upstream or downstream while preserving an existing pond and regulating flows to avoid flooding (Pierce County, 2007d).
Future projects planned by the County in the Spanaway Creek basin include removal of invasive plants and stream enhancement downstream from the Bresemann Dam (Pierce County, 2007d). Replacement of replace hardened stream banks with bioengineered bank stabilization measures and installation of woody debris in the channel are other opportunities identified in the Clover Creek Basin Plan (Pierce County, 2002a).
6.4 Lakes, Shorelines of the State
6.4.1 Spanaway Lake
6.4.1.1 Physical and Biological Characterization
Drainage Basin, Tributary Streams and Associated Wetlands
Spanaway Lake, a 262-acre natural lake, is located in the town of Spanaway, west of State Route 7. This lake serves as the headwaters to Spanaway Creek and downstream Clover Creek. Wetlands and floodplains are mapped on the southwestern shore of Spanaway Lake, both east and west of Spanaway Loop Road. Approximately 98 acres (17%) of the Spanaway Lake planning area consists of wetlands, based on GIS data. Wetland habitat types include palustrine emergent, forested, and scrub-shrub based on NWI data.
Geologic and Flood Hazards
Spanaway Lake occupies a depression on the surface of an upland plateau comprised of continental ice-sheet deposits. The western margin of the lake borders Quaternary peat deposits. Hazards identified along Spanaway Lake include seismic, flood, and landslide. The lake is directly connected to the groundwater of the shallow aquifer perched on top of till. Lake levels vary with variations in the shallow aquifer in the surrounding area. Steep slopes and areas with erosion potential are also identified in discrete areas along the lake.
Critical or Priority Habitat and Species Use
Several priority habitats are documented for Spanaway Lake: urban natural open space (UNOS), wetlands, waterfowl concentration areas, and riparian zones. The UNOS areas include a collection of public parks and undeveloped lands that are dominated by native vegetation and provide habitat for wildlife. The wetlands are associated with the nearby Chambers Creek drainage. Spanaway Lake also provides a riparian corridor in conjunction with Chambers Creek and its fish hatcheries (WDFW, 2007a).
June 2009 Page 6-17

Pierce County Shoreline Inventory and Characterization Report
Water Quality
According to the 2004 Washington State Water Quality Assessment (Ecology, 2004b), Spanaway Lake is 303(d) listed (Category 5 level) for total phosphorus, and fecal coliform. In addition, Spanaway Lake has one Category 1 listing for total phosphorus.
6.4.1.2 Shoreline Use Patterns
Existing Land and Shoreline Use
Spanaway Lake, which forms the headwaters of Spanaway Creek, is surrounded predominantly with moderate density single-family residential land use. The northern and northeastern shores of the lake are bordered by Spanaway Park and Bresemann Forest.
Shoreline Modifications
The lake shore has been modified with shoreline armoring, the majority of which occurs outside of the park area. Approximately 90% of the residents on Spanaway Lake have residential docks. The lower two-thirds of the creek pass through low to areas with predominantly low to moderate density single-family residential land use. A vegetated riparian buffer around Spanaway Creek is largely maintained throughout the residential areas). The upper third passes through Bressemann Forest (70 acres; forested area, public access via nature trails) and Spanaway Park (135 acres; Spanaway Lake access, nature trails near creek), both of which provide limited public access to the stream.
Shoreline Environment Designations, Zoning, and Other Applicable Regulations
The existing Shoreline Environment Designations of Spanaway Lake are Urban and Conservancy. Zoning and Comprehensive Plan designations largely follow existing land use and are dominated by Moderate Single Family (100%) zoning.
Spanaway Lake has one island, which is referred to as Enchanted Island. Access to the residences of Enchanted Island is provided by the Mountain View Blvd. S Bridge. The eastern shoreline of the lake is fronted by Lake Side Drive S, which is completely within the lake’s shoreline planning area.
Existing and Potential Public Access Areas
The 135-acre Spanaway Lake Park provides significant public access to the lake, and has recently undergone a redevelopment project that improved the existing restrooms, picnic facilities, and walking trails. Spanaway Lake Park is located west of the intersection of Military Road and 152nd Street on the northeastern shore of Spanaway Lake. Other lake access opportunities include a fishing pier, a boat launch area, two swimming beaches, and non-motorized boat rentals (see web site at: http://www.piercecountywa.org/pc/services/recreate/SpanawayLk.htm).
Page 6-18 June 2009

Pierce County Shoreline Inventory and Characterization Report
June 2009 Page 6-19
Historic and Cultural Resources
Cultural resources within the Spanaway Lake shoreline planning area include recorded pre-contact materials. Native American use of the Spanaway Lake area, by the Puyallup Tribe, included seasonal hunting and gathering campsites near Spanaway Creek. Recorded artifacts include lithic scatters and charcoal deposits (DAHP, 2007). Subsistence harvest of anadromous fish (salmon and trout) and supplemental hunting of upland mammals occurred along the nearby Spanaway Creek and throughout the lake’s watershed (DAHP, 2007).
6.4.1.3 Reach Scale Assessment
Spanaway Lake is the headwaters for Spanaway Creek and Clover Creek in WRIA 12. Spanaway Lake is represented by one (1) reach – SPAN_LK_01. The Spanaway Lake shoreline planning area is much larger than the original shoreline depicted in the County’s current SMP due to extensive wetlands and floodplains to the southwest.
6.4.1.4 Restoration Opportunities
Restoration opportunities for the Spanaway Lake shoreline include replacing bulkheads with softer alternatives where possible; consolidating or replacing docks with alternate decking to reduce shade impacts; and restoring forested riparian buffers where possible.
6.4.2 Gaps in Existing Information (WRIA 12)
This subsection describes specific data gaps or limitations identified during development of the shoreline inventory and characterization, as required by Ecology’s guidelines (WAC 173-26-201(3)(c)(viii)). This list should not be considered exhaustive. As additional information is developed, this list may be helpful as the County considers future updates and amendments to its Shoreline Master Program.
There are many waterbodies within the planning area for which limited information is available to provide a complete characterization. Waterbodies with limited existing information are listed below according to the parameter for which information is lacking (Table 6-2).
Table 6-2. Waterbodies Parameters
Waterbody Parameter for which data does not exist
Modifications Instream and Riparian Habitat Water Quality
Chambers Creek X Spanaway Creek X Spanaway Lake X X

Pierce County Shoreline Inventory and Characterization Report
CHAPTER 7 KITSAP PENINSULA SHORELINE PLANNING AREA (WRIA 15)
7.1 Water Bodies in the Kitsap Peninsula Shoreline Planning Area
This chapter provides inventory information for the waterbodies in Kitsap Peninsula shoreline planning area that meet the jurisdiction of shoreline of the state or shoreline of statewide significance. In total there are five (5) management units in WRIA 15 for marine shorelines considered shorelines of statewide significance; each of these management units is determined based upon similar coastal processes. Marine management units are described from east to west. There are two (2) rivers and eight (8) freshwater lakes meeting the definition of shorelines of the state. .
Inventory information in this chapter is presented by waterbody and described at both the waterbody and the reach scale for shorelines in the Kitsap Peninsula shoreline planning area (WRIA 15). Maps illustrating the GIS information available by WRIA and illustrating the extent of shoreline reaches in WRIA 15 are provided in Appendix A. Shoreline reaches within each waterbody type have been established based upon methods outlined in Chapter 2. Data sources are provided in Appendix B. Data by reach is provided in tables found in Appendix C. The County’s GIS mapping provides for reach-scale maps in WRIA 15. An analysis of river shoreline functions in WRIA 15 is provided in Appendix D.
For ease of reference, this chapter describes these water bodies in alphabetical order, as shown in the numbered list below. Following the alphabetical list, Table 7-1 shows the freshwater bodies organized by drainage basin. The drainage basin table provides a cross reference to where each freshwater body is discussed in the chapter text.
7.1.1 Alphabetical Listing of Water Bodies
Marine Shorelines of Statewide Significance, Management Units –
1. Colvos Passage – Tacoma Narrows 2. Hale Passage – Wollochet Bay 3. Carr Inlet – Henderson Bay 4. South Key Peninsula and Islands 5. Case Inlet
Freshwater Shorelines of Statewide Significance –
1. None Rivers, Shorelines of the State –
1. Minter Creek 2. Rocky Creek
June 2009 Page 7-1

Pierce County Shoreline Inventory and Characterization Report
Lakes, Shorelines of the State –
1. Bay Lake 2. Butterworth Reservoir 3. Carney Lake 4. Crescent Lake 5. Florence Lake 6. Jackson Lake 7. Josephine Lake 8. Lake Minterwood
7.1.2 Listing of Freshwater Bodies by Drainage Basin
Table 7-1 lists the freshwater bodies within shoreline jurisdiction by drainage basin. The first column lists the basin name, the second column the tributaries or lakes in each basin.
Table 7-1. WRIA 15 Freshwater Bodies by Drainage Basin
Basin Tributaries or Lakes
Gig Harbor Basin
Crescent Lake
Minter Bay Basin
Minter Creek
Key Peninsula Basin
Carney Lake
Stansberry Lake
Rocky Creek
Lake Minterwood
Jackson Lake
Bay Lake
Islands Basin
Butterworth Reservoir
Florence Lake
Josephine Lake
Page 7-2 June 2009

Pierce County Shoreline Inventory and Characterization Report
7.2 Marine Shorelines of Statewide Significance
7.2.1 Colvos Passage – Tacoma Narrows
7.2.1.1 Physical and Biological Characterization
Beaches, Bluffs and Backshore
The Colvos Passage – Tacoma Narrows management area encompasses the shoreline of the eastern side of Gig Harbor Peninsula (Map 21). This area extends from the northern Pierce County border in Colvos Passage, south to Fosdick Point, located at the northeast entrance to Hale Passage. The area also includes the northern shore of Gig Harbor. The shores are generally comprised of exposed, high-gradient bluffs fronted by narrow sand and gravel beaches. Feeder bluffs make up approximately 52% of the management area (Pentec 2003), with the extent of active feeder bluffs varying by reach).
Table 7-2. Feeder Bluff Data for Colvos Passage – Tacoma Narrows (Pentec 2003)
SMP REACH % of Reach with Active Feeder Bluffs
CP-TN 1 19%
CP-TN 2 61%
CP-TN 3 0%
CP-TN 4 98%
These shores are exposed to predominant southerly, and less common northerly, wind and wave conditions as well as the strong currents, most notably through the Tacoma Narrows. The wave and current induced erosion likely enhances erosional processes throughout the Tacoma Narrows and Colvos Passage to a slightly lesser extent, specifically with regard to current-induced erosion. The northern shore of Gig Harbor is an exception to these general patterns, with its protected banks of moderate height and considerably more dense residential development. This portion of the management area has no active large woody debris (LWD) recruitment and very little marine riparian vegetation, relative to the outer shores of the management area. Shore modifications account for 39% of the management area (DNR 2001a).
Colvos Passage and Tacoma Narrows are tidal straits within the Puget Sound. Colvos Passage has a permanent northbound current, whereas the rest of the Puget Sound either flows southward or varies with the tide.
Net-shore Drift
Seven drift cells occur within the management area (see Table 7-3) with four large cells encompassing the majority of the area’s shoreline. Two converging cells are found both north and south of the entrance to Gig Harbor, and three shorter cells are associated with the harbor itself. A recurved spit marks the outer entrance to Gig Harbor; another shorter cell is found on
June 2009 Page 7-3

Pierce County Shoreline Inventory and Characterization Report
the leeward side of the spit. Along the northern shore of Gig Harbor, northwestward drift predominates due to the southward oriented shore.
Table 7-3. Drift Cells within Colvos Passage – Tacoma Narrows (Pentec 2003)
SMP REACH # Drift Cells Drift Cell Names
CP-TN 1 1 + partial PI-7-1 PI-7-2 (partial)
CP-TN 2 1 + partial PI-7-3, PI-7-2 (partial)
CP-TN 3 3 + partial PI-8-3, PI-8-4, PI-8-2, PI-8-5 (partial)
CP-TN 4 2 + partial PI-9-2, PI-9-1, PI-8-5 (partial)
Drainage Basin, Tributary Streams, and Associated Wetlands
No rivers enter the marine shoreline on the east side of Gig Harbor Peninsula. The major tributary stream in this marine management unit is Crescent Creek, which flows into the north side Gig Harbor itself. Crescent Creek drains Crescent Lake, which is a lake freshwater shoreline in WRIA 15.
Pierce County maps less than 1% of the marine shoreline planning area between the Pierce/Kitsap County line and Point Fosdick as wetland. However, field studies performed for the City of Gig Harbor wetland inventory (Adolfson, 2005) identified estuarine wetland at the mouth of Crescent Creek and extending south along the northeastern shore of the harbor. Pocket estuaries are identified at Crescent Creek, North Creek (altered by filling and disconnected by road and culvert crossing), and small remnant salt marsh along the south shore of Gig Harbor (Redman et al. 2005).
Critical or Priority Habitat and Species Use
Eelgrass occurs but is patchy and does not form extensive eelgrass beds. Patchy eelgrass is found mostly in the northern portion of Colvos Passage (CP-TN-1 and the northern portion of CP-TN-2) and in a small area north of Point Fosdick (Pentec 2003). Eelgrass is absent from Gig Harbor and from most of the Tacoma Narrows shoreline (Map 24).
Surf smelt and sand lance spawning are mapped along most of the Colvos Passage and sand lance spawning is mapped along the Tacoma Narrows shorelines (Pentec 2003, WDFW 2007a). Small areas mapped as surf smelt spawning also occur at the mouth of Gig Harbor on the north shore. The Key Peninsula-Gig Harbor-Islands (KGI) Nearshore assessment study concluded that much of the upper shoreline along Colvos Passage, and especially within the Tacoma Narrows, appears to be suitable for forage fish spawning. The extent of potential forage fish habitat varies greatly by reach (see table below; Pentec 2003).
Page 7-4 June 2009

Pierce County Shoreline Inventory and Characterization Report
Table 7-4. Potential Forage Fish Habitat, Colvos Passage – Tacoma Narrows
SMP REACH % of Reach with Potential Forage Fish Habitat
CP-TN 1 79%
CP-TN 2 84%
CP-TN 3 0%
CP-TN 4 100%
A red sea urchin concentration area is mapped along the western shore of Colvos Passage and the Tacoma Narrows (WDFW 2007a).
The coarser substrates and higher velocity currents associated with the Tacoma Narrows shorelines support floating kelp beds (mostly bull kelp, Nereocystis luetkeana) in this area – one of the few locations within the Pierce County nearshore to support floating kelp.
Shellfish
Crab, hardshell clam and geoduck are not mapped for Colvos Passage – Tacoma Narrows (see Appendix C, Table 3). Further, there are no commercial shellfish operations on Colvos Passage and Tacoma Narrows shoreline (Map 25). The majority of this section of shoreline is considered unclassified for commercial shellfish growing areas (DOH 2007). However, one recreational shellfish beach (No. 244) is mapped by Washington State Department of Health near Point Fosdick in Reach CP-TN 4.
Marine Riparian Habitats
Marine riparian habitat (the extent of shrub and forest cover) has been estimated from the Shorezone data (Marine reach table, Appendix C). Shrub and forest vegetation above the ordinary high water mark occupies between 51 and 100% of the shoreline area in most of the Colvos Passage-Tacoma Narrows management unit. This indicates that forest cover in the marine riparian areas is typically over 50% in much of this shoreline. The exception to this is the northshore of Gig Harbor, where 43% of the shoreline area lacks riparian vegetation and is largely developed.
Marine riparian vegetation has been removed or highly altered along the more developed portions of this management unit, particularly the northern portion of Colvos Passage (CP-TN-1), and the northern shore of Gig Harbor (CP-TN-3). Numerous shoreline structures, docks, and bulkheads in these areas are associated with a lack of riparian vegetation. In contrast, locations along the southern portion of Colvos Passage (CP-TN-2) and the Tacoma Narrows (CP-TN-4) contain large stretches with densely wooded riparian vegetation along the shoreline (Pentec 2003). Areas with generally intact marine riparian vegetation tend to correspond to high, active feeder bluff areas which lack associated shoreline development or structures. These areas also generally are associated with a high potential for LWD recruitment.
June 2009 Page 7-5

Pierce County Shoreline Inventory and Characterization Report
Water Quality
Water quality in the Colvos Passage and Tacoma Narrows reaches of the management unit tend to be relatively high quality, due primarily to the relatively high currents in this area and the associated high flushing or mixing rates. The exception is the Gig Harbor area, in which the enclosed waters of Gig Harbor are affected by the level of shoreline development, with resulting increases in nutrient, pollutant, and pathogen inputs. Gig Harbor waters are on 303(d) lists for fecal coliform and Gig Harbor is categorized as a prohibited shellfish growing area.
7.2.1.2 Shoreline Use Patterns
Existing Land and Shoreline Use
Land use near the Colvos Passage – Tacoma Narrows shoreline area is characterized by rural residential patterns along the Colvos Passage and Tacoma Narrows shorelines (CP-TN 1, CP-TN 2, and CP-TN 4) and higher density residential along the northern shoreline of Gig Harbor (CP-TN 3). Within CP-TN 3, all buildable parcels are developed with primary residential structures and associated outbuildings (garages and beach front structures). Single family residences along the Colvos Passage shoreline (CP-TN 1 and CP-TN 2) are clustered into small areas where roadways provide access to the shorelines. The majority of the Colvos Passage shoreline is undeveloped and is vegetated with mixed coniferous-evergreen forest.
Immediately south of Gig Harbor along the Tacoma Narrows, there is a stretch of shoreline with houses built directly on the beach. This section of CP-TN4 is approximately 0.4 miles in length. South of this section, there is more or less continuous residential development to Point Fosdick, but the development is setback from the beach and is located at the tops of shoreline bluffs or steep slopes. This area of residential development is interrupted by a relatively undeveloped and forested zone just south of the Tacoma Narrows bridges and another undeveloped area adjacent to the airport runway near Point Fosdick.
Shoreline modifications
Shoreline modifications associated with residential and parkland uses are prevalent in the Colvos Pass – Tacoma Narrows shoreline area, predominantly in areas where residential development fronts the marine shoreline. Analysis of aerial photographs shows that the majority of shoreline residences within all reaches have concrete bulkheads along the shoreline side of their properties. Some of the residential parcels have developed the area immediately landward of their respective bulkheads with accessory structures. Nearly all the residential parcels along the Gig Harbor shoreline have private docks. The level of modification is high along the Gig Harbor shoreline, as nearly the entire waterfront is developed; however along Colvos Pass and Tacoma Narrows shorelines, the shoreline is less modified especially in Tacoma Narrows (CP-TN4) (see table below).
Page 7-6 June 2009

Pierce County Shoreline Inventory and Characterization Report
Table 7-5. Shoreline Modification Data for Colvos Passage and Tacoma Narrows (Pentec 2003)
SMP REACH Shorezone MOD%
Modifications MHW
Modifications MSL
CP-TN 1 44% 15% 10%
CP-TN 2 46% 27% 0%
CP-TN 3 62% 21% 16%
CP-TN 4 12% 4% 0%
Shoreline Environment Designations, Zoning, and Other Applicable Regulations
The current Shoreline Environment Designations of the Colvos Passage shoreline are a combination of Conservancy and Rural/Residential. Within Gig Harbor, the designation is Rural/Residential, with a small area of Natural designation at the point entering the harbor where the Gig Harbor Lighthouse stands. Along the Tacoma Narrows shoreline, the current designation is entirely Conservancy. Zoning and land use designations indicate that Rural 10 is the dominant land use on Colvos Passage. Along North Gig Harbor (Reach 3) the dominant land use is Moderate Single Family.
Marine Shoreline Critical Salmon Habitat was designated by Pierce County for portions of this shoreline planning area, specifically for the marine shorelines south of Gig Harbor in Tacoma Narrows. The designated marine shoreline critical areas are subject to a 100 foot vegetative buffer from the ordinary high water mark under the County’s critical areas ordinance.
Existing and Potential Public Access Areas
There are three shoreline parks that provide public access to the Colvos Passage – Tacoma Narrows shoreline: Sunrise Beach County Park, Crescent Creek Park in Gig Harbor, and Narrows Park. Sunrise Beach County Park includes 82 acres of natural open space, walking trails, beach access, picnic areas and restroom facilities. Sunrise Park has over 2,400 feet of undeveloped waterfront on Colvos Passage (see shoreline photograph on Ecology web page http://apps.ecy.wa.gov/shorephotos/scripts/bigphoto.asp?id=PIE0519). Sunrise is also a popular diving destination due to an interesting array of marine species that inhabit the area. A creviced wall between 30 to 60 feet deep is found just south of Sunrise Park, which provides habitat for many marine species including wolf eel and giant octopus.
City Park at Crescent Creek is operated by the City of Gig Harbor and is located at the northern tip of the harbor at the Crescent Creek estuary. The 4.8 acre park offers basketball and tennis courts and a softball field, as well as a playground, picnic table, picnic shelter and restroom (Gig Harbor, 2007; http://204.117.123.80/city_of_gig_harbor_parks.html). Gig Harbor Lighthouse is also city-owned land on the spit at the entrance to Gig Harbor. The lighthouse was built in 1988 and acts as a navigation aid. The shoreline is accessible by the boat only.
June 2009 Page 7-7

Pierce County Shoreline Inventory and Characterization Report
Page 7-8 June 2009
An undeveloped open space area, referred to as Narrows Park, also provides public access to approximately 1,000 feet of Tacoma Narrows shoreline. This 36-acre site is located at 1600 Lucille Parkway, south of the Tacoma Narrows Bridge, and is a Pierce County Park maintained by PenMet. http://204.117.123.80/pierce_county_parks.htm#Narrows_Park
Historic and Cultural Resources
Cultural resources within the Colvos Passage – Tacoma Narrows shoreline planning area include recorded pre-contact materials and campsites. Native American use of the Puget Sound coastal shoreline included seasonal hunting and gathering campsites typically near rivers and streams. The Twana people, who inhabited these shorelines, lived in summer season hunting and fishing camps as smaller family units and gathered during winter months in larger family-based winter villages. During summer months, these camp sites were formed for their proximity to migrating salmon, which were frequently caught using weirs within the river and tributary streams, and to upland hunting food resources. Family groups would spend winter months in large winter villages, which consisted of plank houses, constructed of split western red cedar.
Recorded artifacts include lithic scatters, charcoal deposits, shell middens, and calcined bones (DAHP, 2007). Subsistence harvest of anadromous fish (salmon and trout) and supplemental hunting of upland mammals occurred along the shoreline and throughout the watershed (DAHP, 2007).
7.2.1.3 Reach Scale Assessment
The Colvos Passage – Tacoma Narrows marine management unit covers 16.2 miles of shoreline. There are four (4) shoreline reaches in the management unit. From north to south, these reaches are referred to as CP_TN 1 (Reach 1) through CP_TN 4 (Reach 4). Reaches are described below in Table 7-6.
7.2.1.4 Restoration Opportunities
General restoration opportunities for the Colvos Passage – Tacoma Narrows marine shoreline include replacing hard armoring with alternative methods for bank stabilization; replacing solid decks with grating where possible to enhance light penetration; upgrading septic systems to improve water quality; managing urban stormwater runoff; and re-vegetating residential shorelines. There are several reaches where unused or derelict structures could be removed to facilitate restoration (Pentec, 2003; Pierce County, 2006d).
In 2007, Colvos Passage was nominated for Aquatic Reserve status from the Washington DNR. The south end of Colvos Passage contains a WDFW Marine Protected Area that protects salmon, shellfish, bottom fish and forage fish. This aquatic reserve would increase protection to approximately 13,000 acres between Vashon Island and the mainland, some of which lies in Pierce County. The shoreline includes extensive eelgrass and kelp beds.

Pierce County Shoreline Inventory and Characterization Report
Table 7-6. Reach Assessment for the Colvos Passage– Tacoma Narrows Marine Management Unit
Reach Number Reach Location Reach Length (miles)
Land Use Description Modifications Unique Features Marine Riparian
Zone
CP_TN 1 Kitsap County line to south
2.27 Gig Harbor Peninsula to Richmond Point. Residential uses.
Moderate. 44% of reach is considered modified based upon Shore zone data.
19% of reach has active feeder bluffs Sand lance habitat potential.
79% of reach has riparian cover that is more than 50% of the shoreline.
CP_TN 2 Eastern shore of peninsula
4.03 Bluffs and residential uses along Colvos Passage. Sunrise Beach County Park.
Moderate to High. 46% of reach is modified.
Area south of Richmond Point designated as Marine Shoreline Critical Salmon Habitat. 61% of reach has active feeder bluffs Sand lance habitat.
High quality. 61 % of reach has riparian cover on more than half of the shoreline zone.
CP_TN 3 North shore of Gig Harbor
4.00 Single family residential within Gig Harbor UGA.
High. Shoreline highly developed in single-family residential uses. 62% of shoreline is modified.
Commercial shellfish growing prohibited, Gig Harbor WWTF
Low marine riparian cover
CP_TN 4 Eastern shore, south of Gig Harbor
5.90 Reach extends south on Tacoma Narrows to Point Fosdick. Residential uses.
Low. 12% of reach modified according to Shore Zone data.
98% of reach has active feeder bluffs. 90% of reach designated Marine Shoreline Critical Salmon Habitat. Potential sand lance habitat. Recreational Shellfish Growing Area No. 244
High quality marine riparian zone. 98% of reach has riparian cover.
June 2009 Page 7-9

Pierce County Shoreline Inventory and Characterization Report
7.2.2 Hale Passage – Wollochet Bay
7.2.2.1 Physical and Biological Characterization
Beaches, Bluffs and Backshore
This management area encompasses the shores of Gig Harbor Peninsula from Point Fosdick to western Shaw Bay, including all of Wollochet Bay, and the north side of Fox Island (from Nearns Point to Toy Point). Fox Island provides shelter to these shores from strong southerly and northerly wind and wave conditions, although strong currents are found through Hale Passage. The bluffs from Point Fosdick to the western shore of the mouth of Wollochet Bay and the southeast shore of Fox Island are still considerably exposed both to the south and north, and as a result, marine induced erosion is prevalent. Regionally, the majority of beach sediment is derived from eroding bluffs, resulting in mixed sand and gravel beaches (with some pebble). Feeder bluffs make up roughly 43% of the management area (see Table 7-7), and LWD recruitment occurs along 24% of the bluffs (Pentec 2003).
Table 7-7. Feeder Bluff Data for Hale Passage and Wollochet Bay (Pentec 2003)
SMP REACH % of Reach with Active Feeder Bluffs
HP-WB 1 51%
HP-WB 2 33%
HP-WB 3 40%
The most sheltered shores in the management area are found within northern Wollochet Bay. These beaches are typically comprised of a (relatively) finer mix of sediment and are slightly more estuarine in character. Several small creeks flow into the nearshore throughout this part of Pierce County, creating small deltas that increase intertidal and backshore width as well as shore complexity.
Shore modifications within the Hale Passage-Wollochet Bay management area are prolific due to dense residential development. Department of Natural Resources mapped modifications along 75% of these shores (DNR 2001a).
Net-shore Drift
Twenty-four net shore-drift cells are found within this management area (see table below). From Point Fosdick, drift travels west then northward along both the east and west shores of Wollochet Bay. Along the north shore of Hale Passage, drift is predominantly to the west. Subtle changes in shore orientation result in 4 small cells in Shaw Cove. The north shore of Fox Island is comprised of one relatively long drift cell, exhibiting northward drift along the east end of the Island. In contrast, the northwest tip of the Island is comprised of 14 small cells, resulting from
Page 7-10 June 2009

Pierce County Shoreline Inventory and Characterization Report
the more crenulated complex shoreline, which includes a number of small embayments, spits, stream deltas and Tanglewood Island.
Table 7-8. Drift Cell Data for Hale Passage and Wollochet Bay (Pentec 2003)
SMP REACH
# Drift Cells
Drift Cell Names
HP-WB 1 2 PI-11-21, PI-9-3
HP-WB 2 5 PI-11-23, PI-11-22, PI-11-24, PI-11-26, PI-11-25
HP-WB 3 18 + partial
PI-11-13, PI-11-15, PI-11-17, PI-10-3, PI-10-1, PI-11-3, PI-11-5, PI-11-7, PI-11-9, PI-11-12, PI-11-14, PI-11-16, PI-10-2, PI-11-2, PI-11-4, PI-11-6, PI-11-8, PI-11-10, PI-11-18 (partial)
Drainage Basin, Tributary Streams, and Associated Wetlands
The major tributary streams flowing into this marine management area are found in Wollochet Bay; these include Wollochet Creek, Artondale Creek, Garr Creek, Murphy Creek and Sullivan Gulch Creek. Two tributaries to the west of Wollochet Bay are Muri Creek and Warren Creek. None of these tributaries has sufficient flow to be considered shorelines of the state. No streams are noted on the northshore of Fox Island.
Approximately 2 to 5% of each reach within the Hale Passage -Wollochet Bay management area is mapped as wetland. Scattered wetland areas are mapped in the shoreline planning area within Wollochet Bay, and from Wollochet Bay west to Horsehead Bay. These include forested wetlands along drainages that flow to the bay, as well as small estuarine wetland areas. A larger estuarine wetland is associated with Artondale Creek; small, scattered estuarine wetlands are mapped along the northshore of Fox Island. No wetlands are mapped on Tanglewood Island.
Critical or Priority Habitat and Species Use
Eelgrass is found around the mouth of Wollochet Bay, where relatively dense eelgrass beds have been mapped on the eastern shore, just west of Point Fosdick (Map 24). Other areas of patchy eelgrass include the western shore at the mouth of Wollochet Bay around to the west of the Bay, and scattered locations along the north shore of Hale Passage and at Shaw’s Cove. The north shore of Fox Island generally lacks eelgrass.
Forage fish spawning is limited within this management unit, although suitable habitat for forage fish spawning appears to be more widespread than documented spawning locations (see table below) (Pentec 2003). Sand lance spawning has been documented in limited, scattered areas along the north and south shores of Hale Passage. Surf smelt spawning occurs in Wollochet Bay.
June 2009 Page 7-11

Pierce County Shoreline Inventory and Characterization Report
Table 7-9. Forage Fish Habitat in Hale Passage and Wollochet Bay (Pentec 2003)
SMP REACH % of Reach with Potential Forage Fish Habitat
HP-WB 1 66%
HP-WB 2 79%
HP-WB 3 53%
Pacific herring spawning occurs at the mouth of Wollochet Bay, with the pre-spawn holding area located in Hale Passage. This is the only herring spawning location documented for the Pierce County nearshore.
Shellfish
Wollochet Bay and along the north shore of Fox Island are mapped geoduck habitat. Wollochet Bay supports Dungeness crab. According to the WDOH, the shallowest areas of Wollochet Bay are prohibited for commercial shellfish growing areas, likely due to problems with water quality (Map 25). The remainder of Wollochet Bay and Hale Passage (including the north shore of Fox Island) are unclassified for commercial shellfish (WDOH, 2007).
Marine Riparian Habitats
Marine riparian vegetation is generally lacking in this management unit. Riparian vegetation is particularly lacking in the more developed shoreline areas on the north shore of Hale Passage west of Wollochet Bay and along the northern shore of Fox Island, with the exception of a small area at the very eastern tip of the Island.
Marine riparian habitat (the extent of shrub and forest cover) has been estimated from the Shorezone data (Marine reach table, Appendix C). Shrub and forest vegetation above the ordinary high water mark occupies a low percent of the shoreline area (0 to 25%) in most of the Hale Pass-Wollochet Bay management unit. Recruitment of LWD from marine riparian areas is also therefore low (6 to 28% of each reach provides LWD). The southern shore of Gig Harbor Peninsula (from Wollochet Bay to Green Point) provides the least riparian habitat; 74% of the shoreline provides no shrub or forest vegetation.
Water Quality
Water quality impairments are present within Wollochet Bay, particularly at the head of the Bay, which is designated a Prohibited Shellfish Growing Area (DOH 2007). Wollochet Bay is also on the 303(d) impaired water body list for fecal coliform and dissolved oxygen.
Page 7-12 June 2009

Pierce County Shoreline Inventory and Characterization Report
7.2.2.2 Shoreline Use Patterns
Existing Land and Shoreline Use
Land use near the Hale Pass – Wollochet Bay shoreline area is characterized by rural residential patterns along Hale Pass (HP-WB 2 and HP-WB 3) and higher density residential throughout the Wollochet Bay shoreline (HP-WB 1). Within HP-WB 1, the majority of buildable parcels are developed with primary residential structures and associated outbuildings (garages and beach front structures), especially in the northern portion of the bay near the community of Artondale. Single family residences within the management unit line the majority of the shorelines on the mainland and on Fox Island sides of Hale Pass. Residential development throughout the management area is accessed via predominantly two-lane residential roadways. Major roadways directly adjacent to the shoreline include: Cromwell Drive NW within HP-WB 2, East Bay Drive within HP-WB 1, and North Shore Blvd. within HP-WB 3. Fox Island Bridge crosses Hale Pass, passing over Towhead Island on the northwest side of Fox Island.
Shoreline modifications
Shoreline modifications associated with residential and parkland uses are prevalent in the Hale Pass – Wollochet Bay shoreline area (see Table 7-10), predominantly in areas where residential development fronts the marine shoreline. Aerial photographs show that the majority of shoreline residences have concrete bulkheads along the shoreline side of their properties. Some of the residential parcels have developed the area immediately landward of their respective bulkheads with accessory structures and a significant number of the residential parcels along the shorelines of reaches HP-WB 1 and HP-WB 3 have private docks.
Table 7-10. Shoreline Modification Data for Hale Passage and Wollochet Bay (Pentec 2003)
SMP REACH
Shore- zone
MOD% Modifications
MHW Modifications
MSL
HP-WB 1 83% 41% 0%
HP-WB 2 83% 45% 0%
HP-WB 3 64% 29% 7%
Shoreline Environment Designations, Zoning, and Other Applicable Regulations
The current Shoreline Environment Designations of the Hale Pass – Wollochet Bay shorelines are primarily a combination of Conservancy and Rural/Residential. Within Wollochet Bay, there is a small area of Natural designation at the northernmost extent of the bay. Zoning and land use designations indicate that Rural 10 is the dominant land use of Hale Pass – Wollochet Bay.
June 2009 Page 7-13

Pierce County Shoreline Inventory and Characterization Report
Page 7-14 June 2009
Marine Shoreline Critical Salmon Habitat was designated by Pierce County for portions of the Hale Pass-Wollochet Bay shoreline planning area, specifically for the marine shorelines at the western point of Wollochet Bay and Shaws Cove.
Existing and Potential Public Access Areas
There are four public parks or boat launches along the Hale Pass-Wollochet Bay shoreline. These are: Wollochet Bay Park, Point Fosdick Boat Launch, Fox Island Fishing Pier, and Fox Island Boat Launch. Wollochet Bay Estuary Park is located on the northwestern shore of Wollochet Bay. This 14-acre park is located on Wollochet Drive NW, between Lagoon Lane and East Bay Drive. The park provides approximately 850 feet of shoreline including the estuary at the mouth of Artondale Creek. Wollochet Bay Estuary Park is operated by PenMet, the Peninsula Metropolitan Park District (http://204.117.123.80/wollochet_bay_estuary_park.htm).In addition, there is a County boat launch on Point Fosdick at the mouth of Wollochet Bay. The boat launch is located at 10th Street NW and is maintained by Pierce County Public Works.
The Fox Island Fishing Pier and Park (located at Toy Point) provide shoreline access within reach HP-WB 3. The facility, built by WDFW and managed by Pierce County Parks Department, includes parking, restrooms, and the fishing pier. http://www.co.pierce.wa.us/pc/abtus/ourorg/parks/FoxIsland.htm.
Fox Island Boat Launch (or formally known as Towhead Island Boat Launch) is located on Fox Island Bridge Road on the northwestern shore of Towhead Island. This 40-year old boat launch is owned by the Bureau of Land Management, operated by Pierce County Parks, and is proposed to be renovated (http://www.ficra.net/boat_launch.htm).
Historic and Cultural Resources
Cultural resources within the Hale Pass – Wollochet Bay shoreline planning area include recorded pre-contact materials and campsites. Native American use of the Puget Sound coastal shoreline included seasonal hunting and gathering campsites typically near rivers and streams, as described in greater detail within the Colvos Pass – Tacoma Narrows land use section. Recorded artifacts include lithic scatters, charcoal deposits, shell middens, and calcined bones (DAHP, 2007). Subsistence harvest of anadromous fish (salmon and trout) and supplemental hunting of upland mammals occurred along the shoreline and throughout the watershed (DAHP, 2007).
7.2.2.3 Reach Scale Assessment
The Hale Passage – Wollochet Bay Marine management unit covers 22.6 miles of shoreline. There are three (3) reaches designated for the Hale Passage – Wollochet Bay shoreline planning; these are described below in Table 7-11.
7.2.2.4 Restoration Opportunities
General restoration opportunities for the Hale Passage – Wollochet Bay marine shoreline include removing old pilings; enhancing pocket estuaries; enhancing riparian vegetation in residential areas; and replacing shoreline armoring with bioengineered alternatives (Pentec 2003; Pierce County 2006d).

Pierce County Shoreline Inventory and Characterization Report
Table 7-11. Reach Assessment for the Hale Passage – Wollochet Bay (HP_WB) Marine Management Unit
Reach Number Reach Location Reach Length (miles)
Land Use Description Modifications Unique Features Marine Riparian
Zone
HP_WB 1 Wollochet Bay 7.84 Includes Point Fosdick and Wollochet Bay. Boat launch at Point Fosdick. Single-family residential uses with bulkheads.
Highly modified. 83% of reach is modified according to Shore Zone data
Designated Marine Shoreline Critical Salmonid Habitat. Moderate presence of eelgrass at mouth of bay. Prohibited for commercial shellfish growing from approximately Murphy Creek to shallow end of Bay. Remainder of Bay is considered unclassified for commercial shellfish.
Low riparian quality.
HP_WB 2 South shore of Gig Harbor Peninsula
4.51 Includes Shaws Cove and Green Point. Single-family residential uses.
High. 82% of reach is modified with bulkheads.
Designated Marine Shoreline Critical Habitat at the mouth of Warren Creek. Geoduck and sand lance potential habitat.
Low riparian quality. 74% of reach lacks riparian vegetation
HP_WB 3 North shore of Fox Island
10.2 Includes Toy Point, Smugglers Cove, Cedrona Cove, Ketner’s Point, Echo Bay, Tanglewood Island, Towhead Island, and Nearns Point on Fox Island. Towhead Island Boat Launch and Fox Island Fishing Pier. Single-family residential uses.
64% of reach is modified. Many residential docks and boat houses along shoreline.
Moderate presence of eelgrass. Geoduck and sand lance potential habitat.
Low marine riparian quality.
June 2009 Page 7-15

Pierce County Shoreline Inventory and Characterization Report
7.2.3 Carr Inlet – Henderson Bay
7.2.3.1 Physical and Biological Characterization
Beach, Bluffs, and Backshore
The Carr Inlet – Henderson Bay management area encompasses the south shore of Fox Island and all of Henderson Bay. This management area also includes Raft and Cutts Islands. Along the west shore of Carr Inlet, the management area extends south to the peninsula at Southhead. This deep, north-south trending fjord-like inlet is comprised of long stretches of open shore with several small embayments, sub-estuaries and two small Islands. Open shores are typically comprised of high gradient, eroding feeder bluffs, fronted by narrow sand and pebble beaches. These beaches are largely classified as “protected” with some “semi-protected” areas (DNR 2001a), where shore orientation is to the north or south and fetch extends up most of the length of the Inlet. These “semi-protected” shores are most likely to incur marine-induced bluff erosion. In total 59% of the Carr Inlet – Henderson Bay shore is comprised of feeder bluffs, with 52% of those bluffs (also) providing large woody debris to the nearshore. The extent of active feeder bluffs varies by reach (see table below). Shore modifications are found along just over 50% of this management unit (DNR 2001a).
Table 7-12. Feeder Bluff Data for Carr Inlet – Henderson Bay (Pentec 2003)
SMP REACH % of Reach with Active Feeder Bluffs
CI-HB 1 64%
CI-HB 2 82%
CI-HB 3 0%
CI-HB 4 69%
CI-HB 5 27%
CI-HB 6 18%
CI-HB 7 13%
CI-HB 8 44%
CI-HB 9 0%
CI-HB 10 83%
CI-HB 11 89%
CI-HB 12 50%
CI-HB 13 51%
Page 7-16 June 2009

Pierce County Shoreline Inventory and Characterization Report
Several embayments are found within Carr Inlet and Henderson Bay including Mayo Cove, Von Geldern Cove, Horsehead Bay, Lay Inlet, Burley Lagoon, Glen Cove and several smaller embayments, pocket estuaries and lagoons. Barriers front several of these shoreforms, most are comprised of finer sediments, have broad intertidal and backshore areas, and are associated with a source of freshwater such as a perennial or ephemeral stream.
Net-shore Drift
Over 34 drift cells are encompassed within the Carr Inlet – Henderson Bay management unit (see table below). South-facing shores typically exhibit northward drift due to southerly predominant and prevailing winds and waves, while littoral drift along north facing shores is typically to the south. Less frequent northerlies result in southward drift along shores that are oriented to the north. Similar to other management areas, embayments and shores with more crenulated, complex shorelines tend to result in numerous shorter drift cells, the direction of which is largely correlated with aspect relative to predominant conditions as described above.
Table 7-13. Carr Inlet – Henderson Bay Drift Cell Data (Pentec 2003)
SMP REACH # Drift Cells Drift Cell Names
CI-HB 1 2 + partial PI-11-19, PI-10-4, PI-11-18 (partial)
CI-HB 2 2 PI-11-27, PI-11-28
CI-HB 3 2 PI-11-30, PI-11-29
CI-HB 4 2 + partial PI-12-2, PI-12-1, PI-11-31 (partial)
CI-HB 5 11 + 2 partial PI-12-14, PI-12-13, PI-12-12, PI-12-11, PI-12-10, PI-12-9, PI-12-8, PI-12-7, PI-12-6, PI-12-5, PI-12-4, PI-11-31 (partial), PI-12-15 (partial)
CI-HB 6 2 partial PI-12-16 (partial), PI-12-15 (partial)
CI-HB 7 2 + partial PI-13-3, PI-13-2, PI-12-16 (partial)
CI-HB 8 partial PI-14-1 (partial)
CI-HB 9 1+ 2 partial PI-13-4/PI-14-2, PI-14-2 (partial), PI-14-1 (partial)
CI-HB 10 partial PI-14-2
CI-HB 11 4 + partial PI-14-4, PI-14-14, PI-14-5, PI-14-3, PI-14-7 (partial)
CI-HB 12 partial PI-14-7 (partial)
CI-HB 13 9 + partial PI-19A-9, PI-19A-5, PI-19A-8, PI-19A-4, PI-19A-3, PI-16-2, PI-19A-2, PI-19A-6, PI-19A-7, PI-14-7 (partial)
June 2009 Page 7-17

Pierce County Shoreline Inventory and Characterization Report
Drainage Basin, Tributary Streams, and Associated Wetlands
The Carr Inlet – Henderson Bay marine planning area encompasses several mainland drainages on both Gig Harbor Peninsula and Key Peninsula. Major streams and subbasins include: Ray Nash Creek, McCormick Creek, Goodnough Creek, Purdy Creek and Minter Creek (Map 21). No major streams flow from Fox Island. One freshwater shoreline lake – Bay Lake – drains to Mayo Cove in the southern end of this marine area.
Approximately 620 acres (9%) of the Carr Inlet – Henderson Bay marine planning area is mapped as wetland. Much of this wetland area is concentrated along Ray Nash Creek, Minter Bay, Glen Cove, and the area from Von Geldern Cove to South Head Point. Wetlands were noted along the eastern shoreline of Henderson Bay from Horsehead Bay to Burley Lagoon. Several wetland areas are mapped along drainages that flow to the coves west of Raft Island. Based on aerial photos, these wetlands include forested and emergent habitats, as well as excavated ponds. Several small, forested wetlands are mapped on Raft Island itself. Estuarine wetland appears to be present at the mouths of the streams. While not mapped by Pierce County, estuarine wetlands were documented at the mouth of Purdy Creek and extending north along the eastern shore of Burley Lagoon as part of the City of Gig Harbor wetland inventory (Adolfson, 2005).
On Key Peninsula, scattered wetlands that appear to be estuarine based on aerial photos are mapped along the western shoreline of Burley Lagoon. Estuarine and palustrine forested/scrub-shrub wetlands are mapped in the cove north of Thompson Spit. Estuarine wetlands are mapped near the mouth of Minter Creek. Another large wetland containing palustrine forested, scrub-shrub, and emergent habitats as well as a potential estuarine wetland area is mapped at the head of Van Geldern Cove to the south end of Henderson Bay.
Critical or Priority Habitat and Species Use
Eelgrass occurrences are scattered and locally extensive in this management unit. Eelgrass is especially extensive north of Horsehead Bay and around Cutts and Raft Islands, forming contiguous beds (Map 24). Areas generally lacking eelgrass include Green Point the inner portion of Horsehead Bay and the mainland shore east of Raft Island. Eelgrass beds extend more or less continuously along the shore north of Allen Point to Purdy Creek, are absent from Burley Lagoon and then occur scattered along most of the shoreline on the west side of Henderson Bay. Scattered eelgrass occurs along the point between Van Gledern and Mayo Coves, but is generally lacking south of there. The south shore of Fox Island supports eelgrass beds along most of the shoreline, with locally extensive beds near Gibson Point (Pentec 2003).
With the exception of the south shore of Fox Island, documented forage fish spawning is limited in this management unit, being restricted to a three small areas of surf smelt spawning – one small area in Henderson Bay south of Purdy Creek, an area adjacent to Glen Cove, and near Van Geldern and Mayo Coves. Sand lance spawning is even more restricted, being documented in a small area north of Glen Cove (WDFW 2007a). Both sand lance and surf smelt spawning areas are documented along the southern shore of Fox Island (Pentec 2003, WDFW 2007a). A herring spawning area has been documented in Mayo Cover (Pierce County, 2006). The extent of shoreline considered potential forage fish habitat in the Carr Inlet and Henderson Bay area is relatively high (see table below).
Page 7-18 June 2009

Pierce County Shoreline Inventory and Characterization Report
Marine mammal haulouts occur in Horsehead Bay and off Cutts and Raft Islands, and waterfowl concentration areas also occur near Cutts and Raft Island and at Glen Cove.
Table 7-14. Forage Fish Habitat in Carr Inlet – Henderson Bay (Pentec 2003)
SMP REACH % of Reach with Potential Forage Fish Habitat
CI-HB 1 94%
CI-HB 2 100%
CI-HB 3 91%
CI-HB 4 69%
CI-HB 5 41%
CI-HB 6 80%
CI-HB 7 4%
CI-HB 8 100%
CI-HB 9 14%
CI-HB 10 100%
CI-HB 11 41%
CI-HB 12 59%
CI-HB 13 58%
Shellfish
Hardshell clam occurrences are mapped near Cutts and Raft Islands, in Burley Lagoon and along the western shore of Henderson Bay just south of Burley Lagoon, in a small area north of Glen Cove, along Mayo Cove to Penrose Point, and near Gibson Point on Fox Island. Geoducks are mapped along most of the shoreline of this management unit except in Horsehead Bay and Burley Lagoon. Pandalid shrimp occurrences are mapped in Henderson Bay and Carr Inlet.
The majority of shorelines in Carr Inlet and Henderson Bay are considered unclassified for commercial shellfish growing areas (DOH 2007). However the southshore of Fox Island and the headland by Horsehead Bay are approved commercial growing areas (Map 25). Burley Lagoon and Minter Bay contain approved, prohibited and restricted commercial shellfish growing areas. The area near Penrose Point contains both Approved and Prohibited shellfish growing areas
June 2009 Page 7-19

Pierce County Shoreline Inventory and Characterization Report
(WADOH Annual Shellfish Growing Area Report, 2008). Most of the area between Van Geldern Cove and South Head is currently an Approved growing area, as a result of improving water quality conditions. A small area in the upper end of Mayo Cove is currently classified as Prohibited; the stream entering Mayo Cove is a 303D listed stream for fecal coliform (WADOH Annual Shellfish Growing Area Report, 2008).
Marine Riparian Habitats
About 50% of this management unit has relatively intact marine riparian vegetation along the shoreline. Cutts and Raft Islands, the shoreline adjacent to Glen Cove, the shoreline along Penrose Point and South Head, and the south shore of Fox Island have relatively intact riparian vegetation, contribute LWD recruitment, and are generally associated with active feeder bluffs.
Marine riparian condition (the extent of shrub and tree cover) has been estimated from the Shorezone data (Marine reach table, Appendix C). Shrub and forest vegetation above the ordinary high water mark in the Carr Inlet – Henderson Bay marine unit is found at a wide range of cover percentages, from low to high forested cover. Marine riparian vegetation ranges from entirely lacking in developed areas (such as in Horsehead Bay) to entirely vegetated with forest cover in natural shorelines (such as Green Point south of Horsehead Bay). Recruitment of LWD from marine riparian areas is also variable, from 85% of the south shore of Fox Island having LWD recruitment to none of the shorelines in Horsehead Bay.
Water Quality
The Carr Inlet-Henderson Bay management unit is sensitive to water quality impairment from enhanced nutrient, pathogen, or pollutant inputs, dueto the long, relatively shallow embayments and the slow flushing rates in this area of the Sound (Newton et al. 2002, Albertson et al. 2002). Carr Inlet water quality concerns include 303(d) listings for fecal coliform, dissolved oxygen, total PCB’s in tissue, and high nitrite concentrations (Newton et al. 2002, SPSSEG 2004). Carr Inlet waters are rated sensitive to eutrophication and with a very high sensitivity to added nutrients (Newton et al. 2002). Areas of concentrated shoreline development, such as Horsehead Bay, Geldern Cove, and Mayo Cove, are subject to higher nutrient and pollutant inputs – from residential lawns, septic systems, marinas, and roads adjacent to the shoreline. These enhanced inputs, in combination with a general lack of riparian vegetation in these areas, has resulted in some impaired water bodies in this management unit.
Water quality impairments are associated with Mayo Cove (prohibited shellfish growing area) and the head of Burley Lagoon (restricted shellfish growing area). In addition, Horsehead Bay, portions of the shoreline south of Burley Lagoon, and embayments east of Raft Island are listed as impaired water bodies for fecal coliforms.
7.2.3.2 Shoreline Use Patterns
Existing Land and Shoreline Use
Land use near the Carr Inlet – Henderson Bay shoreline area is characterized by rural residential patterns, with higher densities of residential development from Horsehead Bay to Allen Point (reaches CI-HB 3 through 5), surrounding Burley Lagoon (reach CI-HB 7), and surrounding Von
Page 7-20 June 2009

Pierce County Shoreline Inventory and Characterization Report
Geldern Cove (part of reach CI-HB 13). Residential development throughout the management area is accessed via predominantly two-lane residential roadways. Major roadways directly adjacent to the shoreline include: State Route 302 (which crosses the Purdy Sand Spit, which seperates Henderson Bay from Burley Lagoon), Cramer Rd. and Glencove Rd. KP within Glen Cove, A St. and Bayshore Rd. within Van Geldern Cove, and Lorenz Rd. KP within Mayo Cove.
Shoreline modifications
Shoreline modifications associated with residential uses occur within the Carr Inlet – Henderson Bay shoreline area; however, they do not characterize the majority of the shoreline (see table below). Modifications are most predominantly found in areas where residential development fronts the marine shoreline, and are most commonly rip-rap and concrete bulkheads. Aerial photographs show that many shoreline residences within all reaches have bulkheads on their properties. Some of the residential parcels in the higher density areas of the shoreline management area (as noted in the first paragraph of this section) have developed the area immediately landward of their respective bulkheads with accessory structures and a significant number of the residential parcels along the shorelines of reach CI-HB 5 have private docks.
Table 7-15. Shoreline Modifications for Carr Inlet – Henderson Bay (Pentec 2003)
SMP REACH Shorezone MOD% Modifications MHW
Modifications MSL
CI-HB 1 26% 20% 0%
CI-HB 2 53% 36% 0%
CI-HB 3 97% 29% 15%
CI-HB 4 57% 15% 0%
CI-HB 5 71% 42% 0%
CI-HB 6 60% 27% 14%
CI-HB 7 37% 20% 0%
CI-HB 8 67% 28% 0%
CI-HB 9 7% 10% 0%
CI-HB 10 33% 28% 0%
CI-HB 11 38% 36% 0%
CI-HB 12 65% 27% 0%
CI-HB 13 48% 28% 0%
June 2009 Page 7-21

Pierce County Shoreline Inventory and Characterization Report
Shoreline Environment Designations, Zoning, and Other Applicable Regulations
The current Shoreline Environment Designations of the Carr Inlet – Henderson Bay shorelines are predominantly Conservancy, Rural/Residential, and Rural throughout (Map 28). The eastern shore of Henderson Bay is almost entirely Rural/Residential, whereas the western shore is predominantly Conservancy. The eastern shore of Burley Lagoon is designated Urban (community of Purdy) and the western shore is Rural/Residential. There are small areas of Natural designation, primarily associated with points and spits along the coves lining Carr Inlet and Henderson Bay, within several of the management unit reaches. Most of the shoreline within the Carr Inlet-Henderson Bay area is zoned Rural 10 (60 to 100% of each reach except Reaches 6 and 7), with smaller areas zoned Agricultural Resource Lands.
Marine Shoreline Critical Salmon Habitat was designated by Pierce County for portions of the Carr Inlet – Henderson Bay shoreline planning area. There are seven shoreline sections designated including: 1) a small section of the southern shore of Fox Island, 2) all of Cutts Island, 3) a small section of the eastern shore of Burley Lagoon, 4) the mouth of Minter Creek, 5) south of Minter Bay, 6) south of Glen Cove, and 7) Mayo Cove.
Existing and Potential Public Access Areas
There are two state parks that provide public access to the Carr Inlet – Henderson Bay shoreline: Kopachuck State Park and Penrose Point State Park. Kopachuck State Park (located within CI-HB 4) is 109 acres and provides camping facilities, hiking trails, picnic grounds, and wildlife viewing. Cutts Island (or Deadman’s Island) officially part of Kopachuck State Park, is located ½ mile offshore and is only accessible by boat. Kopachuck State Park provides 5,600 feet of marine shoreline access for shoreline recreation opportunities such as diving, swimming, waterskiing, fishing, crabbing, and clamming. (http://www.parks.wa.gov/parkpage.asp?selectedpark=Kopachuck).
Penrose Point State Park is a 152-acre marine and camping park that provides shoreline recreation opportunities, including a public dock and overnight moorage facilities, camping facilities, hiking trails, picnic grounds, and wildlife viewing. Penrose Point State Park is located on the eastern shore of Key Peninsula and provides over 2 miles of saltwater frontage on Mayo Cove and Carr Inlet (http://parks.wa.gov/parkpage.asp?selectedpark=Penrose+Point). Shoreline access includes 158 of marine dock and 270 feet of saltwater moorage.
In addition, there is one County park, the Purdy Sand Spit Park, located between Henderson Bay and Burley Lagoon. The 7.5 acre park is minimally improved; however, it does provide shoreline access and a public boat launch. This spot is widely used by wind surfers. http://www.co.pierce.wa.us/pc/services/recreate/fac-list.htm#P.
There are three boat launches in this shoreline planning area. One lies on Horsehead Bay on the Gig Harbor Peninsula. A second public boat launch is located at Purdy Sand Spit as described above. Another is a boat ramp within Von Geldern Cove named the Home Boat Launch at 8th Street KPS. The Home Boat Launch and Horsehead Bay Launch are maintained by Pierce County Public Works and Utilities; these were repaired in 2005.
Page 7-22 June 2009

Pierce County Shoreline Inventory and Characterization Report
June 2009 Page 7-23
Historic and Cultural Resources
Cultural resources within the Carr Inlet – Henderson Bay shoreline planning area include recorded pre-contact materials and campsites. Native American use of the Puget Sound coastal shoreline included seasonal hunting and gathering campsites typically near rivers and streams, as described in greater detail within the Colvos Passage – Tacoma Narrows land use section. Recorded artifacts include lithic scatters, charcoal deposits, shell middens, and calcined bones (DAHP, 2007). Subsistence harvest of anadromous fish (salmon and trout) and supplemental hunting of upland mammals occurred along the shoreline and throughout the watershed (DAHP, 2007).
7.2.3.3 Reach Scale Assessment
The Carr Inlet-Henderson Bay marine area covers 56.6 miles of WRIA 15 marine shoreline. This shoreline planning area is divided into 13 reaches named CI-HB 1 through CI-HB 13. CI-HB 1 (Reach 1) is the south side of Fox Island. Reaches are described below in Table 7-16.
7.2.3.4 Restoration Opportunities
Restoration opportunities for the Carr Inlet-Henderson Bay marine shoreline include replacing bulkheads with bioengineered alternatives; removing derelict structures and pilings; restoring marsh areas; restoring riparian vegetation; and improving culverts. The South Puget Sound Salmon Enhancement Group is working on a project to restore estuary habitat at Silver Bow Farms in reach CI-HB 12 (Pentec, 2003; Pierce County, 2006d).

Pierce County Shoreline Inventory and Characterization Report
Table 7-16. Reach Assessment for Carr Inlet - Henderson Bay (CI_HB) Marine Management Area
Reach Number Reach Location
Reach Length (miles)
Land Use Description Modifications Unique Features Marine Riparian Areas
CI-HB 1 South shore of Fox Island 5.54 Includes Gibson Point and western shore of Nearns Point on Fox Island. Residential land uses.
Low - 26% of reach is modified according to Shore Zone data.
Designated as a Marine Shoreline Critical Salmon Habitat (Pierce County 2007). High potential forage fish habitat (94%). Approved by WDOH as a commercial shellfish growing area
High quality. 70% of south shore Fox Island has good riparian cover.
CI-HB 2 Green Point 2.27 Headland of Horsehead Bay.
Moderate. 53% of reach is modified.
High potential forage fish habitat (100%). Active feeder bluffs on 82% of reach. Approved by WDOH as a commercial shellfish growing area. Mapped geoduck tract.
High quality. 82% of reach provides good riparian cover.
CI-HB 3 Horsehead Bay 2.89 Horsehead Bay and spit. Single family residential with small lots. Kopachuck State Park.
High. 97% of shoreline reach is modified
High potential for forage fish (91%). No feeder bluffs (0%). Unclassified as commercial shellfish area.
Low quality riparian zone. 91% of zone is poorly vegetated.
Page 7-24 June 2009

Pierce County Shoreline Inventory and Characterization Report
June 2009 Page 7-25
Reach Number Reach Location
Reach Length (miles)
Land Use Description Modifications Unique Features Marine Riparian Areas
CI-HB 4 North of Horsehead Bay 1.84 Includes Cutts Island (and Kopachuck State Park.
Moderate to High. 57% of reach is modified.
Cutts Island designated as Marine Critical Habitat. 69% of reach has active feeder bluffs. Unclassified for commercial shellfish. Recreational shellfish beach at Kopachuck State Park (No.242).
Moderate quality. 69% of reach has riparian cover on more than 50% of the shoreline zone.
CI-HB 5 Lay Inlet 7.44 Includes Raft Island and Ray Nash Creek estuary.
High. 71% of reach is modified.
Approximately 13% of reach is mapped as wetland.
Low quality. 54% of reach is poorly vegetated.
CI-HB 6 North of Lay Inlet and Raft Island to Burley Lagoon
5.82 Includes Allen Point and estuaries of McCormick and Goodnough creeks.
Moderate. 60% of reach is considered modified.
Active feeder bluffs on 80% of reach. Estuaries at creek mouths. Two shoreline segments are Approved by WDOH as commercial shellfish growing area north of Allen Point and at McCormick Creek.
Moderate. Riparian vegetation is lacking on 44% of reach.
CI-HB 7 Burley Lagoon 6.77 East and western shores of Burley Lagoon to County line. Purdy Sand Spit Park.
Moderate. 37% of reach is considered modified.
Marine Critical Habitat on eastern shore of Burley Lagoon. Approved, conditional and restricted beaches near Burley Lagoon. Recreational Shellfish beach at Purdy Spit (No. 241).
Moderate. 46% of reach has good riparian cover.

Pierce County Shoreline Inventory and Characterization Report
Page 7-26 June 2009
Reach Number Reach Location
Reach Length (miles)
Land Use Description Modifications Unique Features Marine Riparian Areas
CI-HB 8 Burley Lagoon to Minter Bay
3.35 Includes south shore of Purdy Sand Spit
Moderate to High. 67% of reach.
Approved and prohibited commercial shellfish near Purdy Spit. Rest of shoreline is unclassified.
Moderate. 51% of reach has good riparian cover.
CI-HB 9 Minter Bay 3.61 Includes spit at Minter Bay.
Low degree of modification (7%)
Includes Bay and floodplain along Minter Creek; Marine Critical Habitat Designated at mouth of Minter Creek. Approx. 53% of reach mapped as wetland. Restricted and prohibited by DOH for commercial shellfish in Minter Bay. Approved at mouth of Bay.
High. 72% of reach has 50% of more of the riparian zone intact (Pentec 2003).
CI-HB 10 Between Minter Bay and Glen Cove
1.83 Residential land uses. 33% of reach is modified.
Active feeder bluffs (83% of reach). 100% of reach considered potential habitat for forage fish. Marine Critical Habitat Designated.
Moderate quality and varies.
CI-HB 11 Glen Cove 1.69 Includes Glen Cove and floodplain.
38% modified. Active feeder bluffs (89% of reach). Approx. 33% of reach mapped as wetland.
Moderate quality.
CI-HB 12 Between Glen Cove and Von Geldern Cove
4.44 Includes Thompson Spit and Sunshine Beach;
65% modified. Active feeder bluffs (50% of reach). Marine Critical Habitat.
40% of reach has good quality riparian areas.

Pierce County Shoreline Inventory and Characterization Report
June 2009 Page 7-27
Reach Number Reach Location
Reach Length (miles)
Land Use Description Modifications Unique Features Marine Riparian Areas
CI-HB 13 Von Geldern Cove to South Head Point
9.1 Includes Von Geldern Cove, Mayo Cove, Penrose Point, Delano Bay, and western shore of South-head Point. Penrose Point State Park.
48% of reach is modified.
Bay Lake drains to Mayo Cove. Marine Critical Habitat Designated. Approx. 19% of reach mapped as wetland. Approved for commercial shellfish except in Mayo Cove where prohibited. Recreational shellfish beach at Penrose Point (No. 247).
Varies.

Pierce County Shoreline Inventory and Characterization Report
7.2.4 South Key Peninsula and Islands
7.2.4.1 Physical and Biological Characterization
Beach, Bluffs, and Backshore
The South Key Peninsula and Islands management area encompasses the shores of six Islands (McNeil, Anderson, Ketron, Eagle, Pitt and Gertrude Islands) and the southeastern shores of the Key Peninsula, from Southhead to Devil’s Head (Maps 4 and 21). The broad channels of the Nisqually Reach comprise the south end of the management area, with Carr Inlet to the north and the strong currents of Pitt Passage to the west. The east, south and western portions of this management unit were classified as “protected” by DNR (2001a). However the northern shore of McNeil Island is exposed to considerable fetch up Carr Inlet and Henderson Bay, leading to its classification as “semi-protected” (DNR 2001a). Marine induced erosion occurs throughout the area but is likely most active in areas with greater exposure.
The KGI Study by Pentec (2003) documented feeder bluffs throughout the shores of much of Pierce County (excluding Ketron Island). The study reported that feeder bluffs represent approximately 67% of this management unit (see table below for feeder bluff extent by reach). In addition, large woody debris was being actively recruited to the nearshore from 76% of that same area (Pentec 2003).
Table 7-17. Feeder Bluff on Anderson Island, Ketron and McNeil, and South Key Peninsula
SMP REACH % of Reach with Active Feeder Bluff
AND IS 1 82%
AND IS 2 40%
AND IS 3 56%
AND IS 4 22%
AND IS 5 86%
KETRN_IS No data
MCN IS 1 100%
MCN IS 2 68%
MCN IS 3 50%
MCN IS 4 79%
SKEY 1 97%
SKEY 2 48%
SKEY 3 81%
Page 7-28 June 2009

Pierce County Shoreline Inventory and Characterization Report
Much of the shores are moderate to high elevation bluffs that are fronted by narrow, sand and gravel beaches, though at least four large embayments are encompassed within the management area, which are more estuarine in character. These embayments include: Filucy Bay on the Key Peninsula, Amsterdam and Oro Bays on Anderson Island and Still Harbor on McNeil Island. Several other smaller embayments, pocket estuaries and lagoons are also found in the area. Most embayments are sheltered from wave-induced erosion by barrier spits, thus the leeward beaches are comprised of a finer mix of sediments, sometimes with fringing marsh vegetation. In addition intertidal areas are often much broader in embayments, often with sand/mud flats..
Net-shore Drift
Over 30 drift cells make up the South Key Peninsula and Islands management area (see Table 7-18). Anderson Island is comprised of 14 drift cells and 12 are found along the Peninsula shores. Four drift cells encompass Ketron Island. Littoral drift mapping has not been conducted along the shores of McNeil Island; however, it is likely that over seven cells comprise drift around the island and possibly more. Drift has also not been mapped around Pitt, Eagle and Gertrude Island. Littoral drift follows the same general pattern throughout this management unit– with northward drift along south-facing shores due to southerly predominant and prevailing winds and waves. Littoral drift along north facing shores is typically to the south due to less-frequent northerlies. Embayments and shores with more crenulated, complex shorelines tend to have numerous shorter drift cells, the direction of which is largely correlated with aspect relative to predominant conditions as previously described. Shore modifications have been mapped along approximately 23% of these shores (DNR 2001a).
Table 7-18. Drift Cell Data for Anderson Island, Ketron and South Key Peninsula
SMP REACH # Drift Cells Drift Cell Names
AND IS 1 4 PI-22-3, PI-22-1, PI-22-2, PI-21-5
AND IS 2 5 + partial PI-22-5, PI-22-8, PI-22-6, PI-22-4, PI-22-7, PI-22-9 (partial)
AND IS 3 2 + 2 partial PI-22-11, PI-22-10, PI-21-1 (partial), PI-22-9 (partial)
AND IS 4 1 + partial PI-21-2, PI-21-1 (partial)
AND IS 5 2 PI-21-3, 21-4
KETRN_IS and MCN_IS no drift data
SKEY 1 3 + partial
SKEY 2 5 + 2 partial
SKEY 3 2 + partial
June 2009 Page 7-29

Pierce County Shoreline Inventory and Characterization Report
Drainage Basin, Tributary Streams, and Associated Wetlands
There are few major streams within the South Key Peninsula and Island area. Major streams are not found on South Key Peninsula, nor are they identified on Anderson Island, Ketron or other small islands. McNeil Island has two mapped streams: Bradley Creek and Luhr Creek.
On the mainland of Key Peninsula, approximately 14% of the marine shoreline area in Filucy Bay is mapped as wetland. Several wetlands are mapped around the perimeter of Filucy Bay. Habitat types based on aerial photos include estuarine and palustrine scrub-shrub/forested. A complex of wetlands containing estuarine and palustrine forested, scrub-shrub, and emergent habitat types is mapped between Filucy Bay and South Head.
On the islands, approximately 14% of the Anderson Island shoreline planning area is mapped as wetland. Several small wetland areas are mapped along the northern and eastern shoreline of Anderson Island. A large wetland complex extends from Oro Bay to the north across the center of the island; this wetland is associated with the marine shoreline and is therefore included in Reach 2 described below; approximately 38% of the Oro Bay/East Oro Bay reach is mapped as wetland. Substantial wetland areas are also present near Otso Point. Several small wetland areas are mapped along the northern and eastern shoreline of the island. Wetland habitat types in the shoreline planning area on the island include palustrine forested, scrub-shrub, emergent, and estuarine.
One wetland area is mapped within the marine shoreline planning area of McNeil Island, constituting 3% of the island’s shoreline planning area. This wetland appears to be located in a pasture, based on aerial photographs, and extends south to a forested area along the marine shoreline. No wetlands are mapped on Ketron or Eagle Islands.
Critical or Priority Habitat and Species Use
Eelgrass is found in Pitt Passage, and is largely absent from Drayton Passage and Filucy Bay (Map 24). Eelgrass is found in a few limited locations along the Anderson Island shoreline, primarily on the north at Otso Point, in the south at Thompson Cove, around Oro Bay and Cole Point and on the east from Sandy Point north to Yoman Point. With the exception of beds at Otso Point, much of the eelgrass is patchy in distribution here and does not form extensive contiguous beds (Pentec 2003). McNeil Island also has localized eelgrass beds, primarily along the western side of the island along Pitt Passage and at the west end of Balch Passage. Some of these eelgrass beds are more extensive than most in this management unit and are contiguous along the shoreline.
Salt marsh areas occur in North Cove in Filucy Bay and on the inner side of the small spit south of McDermott Point.
Forage fish spawning (surf smelt and sand lance) is mapped south of Filucy Bay along the shoreline south of McDermott Point and in isolated locations within Filucy Bay. Sand lance spawning is documented on the outer edge of the small spit south of McDermott Point in Drayton Passage. Much of the shoreline appears to be suitable spawning habitat, however (WDFW 2007a). Documented forage fish spawning for surf smelt and sand lance is limited to a few locations on Anderson Island, along the western and southern shorelines. McNeil Island
Page 7-30 June 2009

Pierce County Shoreline Inventory and Characterization Report
does not contain documented forage fish spawning locations, although much of the shoreline appears to be suitable for forage fish spawning (Pentec 2003, WDFW 2007a). The extent of potential forage fish habitat varies by reach (see table below).
Table 7-19. Forage Fish Habitat for Anderson, Ketron and McNeil Islands, and South Key Peninsula
SMP REACH % of Reach with Potential Forage Fish Habitat
AND IS 1 95%
AND IS 2 40%
AND IS 3 79%
AND IS 4 29%
AND IS 5 82%
KETRN_IS No data
MCN IS 1 100%
MCN IS 2 87%
MCN IS 3 100%
MCN IS 4 94%
SKEY 1 100%
SKEY 2 63%
SKEY 3 97%
This management unit has the highest concentration of marine mammal haul-out sites within the Pierce County nearshore, with several sites clustered around McNeil Island. Several waterfowl concentration areas occur in this management unit. Waterfowl concentration areas occur in Pitt Passage, between McNeil Island and the Key Peninsula, around Still Harbor and Gertrude Island on McNeil Island, and near Thompson’s Cove on Anderson Island.
Shellfish
This management unit supports concentrations of marine invertebrates, especially around Anderson and McNeil Islands (WDFW 2007a). Geoduck habitat is mapped along most of the South Key Peninsula shoreline, in Pitt and Drayton Passages, but not within Filucy Bay. Geoduck habitat extends around McNeil Island and along the northwestern side of Anderson Island and near Oro Bay. Hardshell clams occur in the North Cove of Filucy Bay, in Still Harbor on McNeil Island, and near Otso Point and in Amsterdam Bay on Anderson Island. In addition to geoduck and clams, Dungeness crab areas are mapped in Oro Bay, and pandalid shrimp areas occur along the Nisqually reach and between Anderson and Ketron Islands.
June 2009 Page 7-31

Pierce County Shoreline Inventory and Characterization Report
Commercial shellfish growing areas and recreational harvest sites for the South Key Peninsula area are shown on Map 25. Filucy Bay currently is classified as Restricted (northern inner bay), Conditionally Approved (central bay), and Prohibited (western bay) (DOH Annual Growing Area Reports, 2008). The most recent five-year trend shows increased fecal coliform pollution over the past three years. Pierce County Water Programs has been working with local residents to address water quality issues; for example, in 2006 the County purchased one of the properties that was a major contributor of fecal coliform bacteria to the bay.
Between the mid-1990s and into the early part of this decade, efforts to improve water quality in Burley Lagoon were generally successful. Shellfish growing areas in the southern portion of the lagoon were reclassified from Restricted to Approved in 2001. Despite efforts of state, county, tribes, and local residents to improve water quality, a portion of the Burley Lagoon shellfish growing area was downgraded in 2008 from Approved to Conditionally Approved (Map 25). The downgrade was due to declining water quality resulting from increasing levels of fecal coliform bacteria at sampling stations in the southwestern portion of the lagoon. The more enclosed center and northern portions of Burley Lagoon are currently (2008 status based on 2007 data) classified as Conditionally Approved and Restricted, respectively. Sources of fecal coliform bacteria to Burley Lagoon are multiple, including septic systems, livestock manure, domestic pets, and wildlife. Pierce County Water Programs is currently working under a Department of Ecology grant with local homeowners to identify and address potential sources of bacteria to Burley Lagoon. Increased density of development, with an increased density of septic systems, domestic animals, and runoff from developed areas, may result in a continuing decline in water quality in these areas if sources of pollution are not addressed.
Marine Riparian Habitats
Relatively intact riparian vegetation is present along the marine shoreline north of Filucy Bay and south of McDermott Point, with active feeder bluffs and sources of LWD. Riparian vegetation is mostly lacking from Filucy Bay, with the exception of the north cove. Lack of riparian vegetation is associated with a high level of shoreline development in the southeastern portion of the Bay. Anderson Island shorelines are somewhat less developed than shorelines on the South Key Peninsula, but within the bays and protected shorelines such as Oro Bay and Amsterdam Bay, shoreline development has resulted in removal or alteration of riparian vegetation. The exception within sheltered bays includes relatively intact riparian occurring at the head of Oro Bay and at Carlson Bay. The open shorelines of Anderson Island tend to have relatively intact riparian vegetation and support active feeder bluffs and LWD recruitment. Areas of intact riparian vegetation occur along Drayton Passage from Otso Point to Amsterdam Bay, from Treble Point to east of Carlson Bay, along Thompson Cove and from Cole Point north to Yoman Point.
Water Quality
Water quality in this management unit is generally good and most of the area is categorized as approved shellfish growing area (DOH 2007). Filucy Bay is a conditional shellfish growing area, while Oro Bay and Still Harbor are categorized as prohibited shellfish growing areas.
Page 7-32 June 2009

Pierce County Shoreline Inventory and Characterization Report
7.2.4.2 Shoreline Use Patterns
Existing Land and Shoreline Use
Land use near the South Key Peninsula and Islands shoreline area, outside of McNeil Island, is characterized by rural residential patterns, with higher densities of residential development surrounding Filucy Bay (Map 26). Residential development throughout this portion of the management area is accessed via predominantly two-lane residential roadways. Major roadways directly adjacent to the shoreline include: Villa Beach Rd. and Eckenstam Johnson Rd. on Anderson Island.
McNeil Island in its entirety is an approximately 20 square mile penal colony. Since 1875, a number of prison complexes have been built on the island, including a maximum security prison on the southern shoreline (partially within reach MCN_IS_2). Some of the grounds of McNeil are used as a cattle farm for prison work programs. There are no industries or residences on the island unrelated to the correctional programs. McNeil Island is ringed by a road that passes in and out of the shoreline planning area.
McNeil Island has been designated as a wildlife area called McNeil Island Wildlife Area. http://www.publiclands.org/explore/site.php?id=4656&PHPSESSID=23cfeb7c9. This area includes Gertrude and Pitt Islands. All the islands are largely forested. Gertrude Island has one of the largest haulout sites for harbor seals in southern Puget Sound.
Shoreline modifications
Shoreline modifications associated with residential uses occur within the South Key Peninsula and Islands shoreline area, but do not characterize the majority of the shoreline. Modifications are most predominantly found in areas where residential development fronts the marine shoreline, and are most commonly rip-rap and concrete bulkheads. Aerial photographs show that many shoreline residences within all reaches have bulkheads on their properties. Some of the residential parcels in the higher density areas of the shoreline management area (as noted in the first paragraph of this section) have developed the area immediately landward of their respective bulkheads with accessory structures, most likely used as cabanas. The level of shoreline modification by reach is listed in the table below.
June 2009 Page 7-33

Pierce County Shoreline Inventory and Characterization Report
Table 7-20. Shoreline Modifications for Anderson, Ketron, McNeil Islands and South Key Peninsula
SMP REACH
Shorezone MOD%
Modifications MHW
Modifications MSL
AND IS 1 9% 6% 0%
AND IS 2 17% 9% 0%
AND IS 3 13% 10% 1%
AND IS 4 30% 14% 0%
AND IS 5 5% 7% 0%
KETRN_IS No data No data No data
MCN IS 1 7% 0% 0%
MCN IS 2 13% 6% 0%
MCN IS 3 7% 5% 0%
MCN IS 4 8% 20% 0%
SKEY 1 25% 27% 0%
SKEY 2 45% 11% 0%
SKEY 3 25% 21% 2%
Shoreline Environment Designations, Zoning, and Other Applicable Regulations
The current Shoreline Environment Designations of the South Key Peninsula and Islands shorelines are predominantly Natural, Rural/Residential, Rural, and Conservancy. The majority of McNeil Island, outside of the major prison facility along the southern shoreline, is Natural. There are small areas of Natural designation, primarily associated with spits in the South Key Peninsula and Islands management unit. Anderson Island, Ketron Island, and other small islands have shorelines designated largely as Conservancy. Zoning and land use designations indicate that Rural 40 is the dominant land use on McNeil Island. The remaining islands have a zoning and land use designation of Rural 10 and Agricultural Resource Lands.
Marine Shoreline Critical Salmon Habitat was designated by Pierce County for portions of the South Key Peninsula and Islands shoreline planning area. There are nine shoreline sections designated including six sections on the mainland of Key Peninsula, one section on the eastern shore of McNeil Island, and two sections on Anderson Island.
Existing and Potential Public Access Areas
There is one state park that provides public access to the South Key Peninsula and Islands shoreline: Eagle Island State Park, which is only accessible by boat, is managed by the Jarrell
Page 7-34 June 2009

Pierce County Shoreline Inventory and Characterization Report
June 2009 Page 7-35
Cove State Park offices. Eagle Island is a 10-acre marine park with 2,600 feet of saltwater shoreline in Balch Passage (Washington State Parks – A Complete Recreation Guide, Marge and Ted Mueller, 2004). Three mooring buoys are available for boats; the island itself is day-use only. Eagle Island is thought to have been an Indian burial ground with burial canoes placed in the trees. No public access is allowed on McNeil Island due to its use as a state corrections facility.
There are several parks on Anderson Island that provide shoreline access. Two parks on Anderson Island are: Andy’s Park and Andrew Anderson Marine Park (http://www.andersonisland.net/parks.asp). Andy’s Park includes 170 acres of wetlands, estuary and mature forested habitat. This park is located on Eckenstam-Johnson Road with a small picnic area on School House Creek. The park offers trails, picnicking, beach access and wildlife viewing.
Andrew Anderson Marine Park provides 40 acres of hiking trails and access to saltwater at Carlson Bay. See map at http://www.andersonislandhs.com/links.html. This park is operated by Anderson Island Park and Recreation District and is part of the Washington Water Trails Association, allowing overnight camping for kayakers and other boaters. This marine park was dedicated in 1990.
Additionally, there is the WDFW boat ramp/launch at McDermott Point on 72nd Street KPS. This boat ramp is located at the mouth of Filucy Bay.
Historic and Cultural Resources
Cultural resources within the Key Peninsula and Islands shoreline planning area include recorded pre-contact materials and campsites. Native American use of the Puget Sound coastal shoreline included seasonal hunting and gathering campsites typically near rivers and streams, as described in greater detail within the Colvos Passage – Tacoma Narrows land use section. Recorded artifacts include lithic scatters, charcoal deposits, shell middens, and calcined bones (DAHP, 2007). Subsistence harvest of anadromous fish (salmon and trout) and supplemental hunting of upland mammals occurred along the shoreline and throughout the watershed (DAHP, 2007).
7.2.4.3 Reach Scale Assessment
The South Key Peninsula and Islands marine area covers 49.9 miles of the WRIA 15 marine shoreline. This shoreline planning area is divided into 13 reaches, with three reaches for South Key Peninsula, four reaches for Mc Neil Island, one reach for Ketron Island, and five reaches for Anderson Island. Reaches are described below in Table 7-21.
7.2.4.4 Restoration Opportunities
Restoration opportunities for the South Key Peninsula and Islands marine shoreline include restoring pocket estuaries; protecting functioning drift cells; removing dilapidated structures; maintaining culverts; replacing existing vertical hard armoring with bioengineering alternatives; and repairing failing septic systems (Pentec, 2003; Pierce County, 2006d). The South Puget Sound Salmon Enhancement Group is working on an estuarine restoration project at East Oro Bay (AND_IS_2).

Pierce County Shoreline Inventory and Characterization Report
Table 7-21. Reach Assessment for South Key Peninsula and Islands Marine Unit
Reach Number Reach Location Reach Length
(miles) Land Use Description Modifications Unique Features Marine Riparian Areas
SKEY-1 South Head to Filucy Bay
3.48 Along Pitt Passage. Rural residential and agricultural uses.
Low. Marine Shoreline Critical Salmon Habitat is designated. Kelp beds mapped. Approved for commercial shellfish growing by WDOH.
Moderate quality.
SKEY-2 Filucy Bay 6.21 Includes Filucy Bay and large floodplain. Town of Longbranch. Small marina. Key Peninsula Highway parallels portion of shoreline.
Moderate. Nearby roads, marinas, docks.
Marine Shoreline Critical Salmon Habitat is designated. Approx. 14% of reach mapped as wetland.
Moderate.
SKEY-3 Filucy Bay to Devils Head
3.29 Longbranch Boat launch at 72nd St. KPS. Residential land uses.
Low to Moderate. Docks, roads.
Marine Shoreline Critical Salmon Habitat is designated.
Moderate.
MCN_IS_1 McNeil Island – Eastern shore
1.21 State Correctional Facility and WDFW lands. Includes Hyde Point.
Low. Only 7% of shoreline reach is modified.
Designated Marine Shoreline Critical Salmon Habitat.
High quality riparian area. However, perimeter road follows shoreline.
MCN _IS_2 McNeil Island – South shore
4.70 State Correctional Facility and WDFW lands. Includes entire shoreline along Balch Passage. Agricultural uses. McNeil Island Ferry landing.
Low. Only 13% of shoreline reach is modified
Butterworth Reservoir drains to this reach. Continuous kelp beds are mapped.
High quality, perimeter road follows shoreline.
Page 7-36 June 2009

Pierce County Shoreline Inventory and Characterization Report
June 2009 Page 7-37
Reach Number Reach Location Reach Length
(miles) Land Use Description Modifications Unique Features Marine Riparian Areas
MCN_IS_3 McNeil Island – Western shore
2.22 State Correctional Facility and WDFW lands. Includes Pitt Island, shoreline along Pitt Passage. Agricultural uses.
Low. Only 7% of shoreline reach is modified
Approved for commercial shellfish growing.
High quality. However, perimeter road follows shoreline.
MCN_IS_4 McNeil Island – North shore
4.56 State Correctional Facility and WDFW lands. Includes Gertrude Island and Still Harbor.
Low. Only 7% of shoreline reach is modified
Approved for commercial shellfish growing.
High quality.
KETRN_IS Ketron Island 3.16 All of Ketron Island. No public parks on island.
No data. Feeder bluffs on south end of island. Ketron Island is in polluted area as classified by DOH (Map 25).
High quality mature forested riparian zone on south end of island.
AND_IS_1 Anderson Island – North/East
5.08 Includes Eagle Island State Park, Yoman Point, Sandy Point, and Cole Point. Yoman Ferry Landing and Eagle Island State Park.
Low. Shoreline is modified at ferry landing but only 9% of reach is modified.
Eelgrass greater than 25% of low tide line at south end of reach. Approved commercial shellfish area and approved recreational shellfish beaches. Eelgrass at Eagle Island.
High quality riparian. 76% of reach has good riparian cover.

Pierce County Shoreline Inventory and Characterization Report
Page 7-38 June 2009
Reach Number Reach Location Reach Length
(miles) Land Use Description Modifications Unique Features Marine Riparian Areas
AND_IS_2 Anderson Island – Oro Bay
5.80 Includes Oro Bay and East Oro Bay. Rural residential and agricultural land uses.
Low. 17% of reach is modified according to Shore zone data.
Extensive associated wetlands. Approximately 38% of this reach is mapped as wetland. Marine Shoreline Critical Salmon Habitat is designated. Oro Bay is restricted or prohibited for commercial shellfish.
High quality riparian. 83% of reach has good riparian cover.
AND_IS_3 Anderson Island – Southwest
5.64 Includes Carlson Bay and Thompson Cove. Residential land uses.
Low. 13% of reach is modified according to Shore zone data.
Carlson Bay is designated as Marine Critical Habitat. Feeder bluffs mapped 56% of reach. Approved for commercial shellfish growing. Eelgrass observed by citizen.
Moderate to High quality riparian. 66% of reach has good riparian cover.
AND_IS_4 Anderson Island – Amsterdam Bay
1.36 Includes Amsterdam Bay and spit. Rural residential.
Low. 30% of reach is modified according to Shore zone data.
Active feeder bluff on 22% of reach. Pocket estuary. Sand lance spawning noted by citizens.
Moderate quality riparian. 40% of reach has good riparian cover.
AND_IS_5 Anderson Island – North/West
3.18 Includes Otso Point and shoreline along Drayton Passage.
Low. 5% of reach is modified according to Shore zone data.
Feeder bluffs on 86% of reach. Eelgrass at Otso Point. Approx. 12% of reach mapped as wetland.
High quality riparian. 87% of reach has good riparian cover.

Pierce County Shoreline Inventory and Characterization Report
7.2.5 Case Inlet
7.2.5.1 Physical and Biological Characterization
Beaches, Bluffs and Backshore
Case Inlet is a deep north-south trending fjordal inlet that is comprised of long stretches of open shore with several moderately sized embayments, numerous sub-estuaries, lagoons and a single small island (Heron Island). A number of other islands are found within the Inlet, they are however not included within Pierce County’s jurisdiction.
The shores of Case Inlet are largely oriented to the west-southwest, which results in exposure to southerly winds and waves. This not only results in predominant northward drift, but marine-induced erosion along much of the management area shores. Results of a recent study by Pentec Environmental (2003) documented feeder bluffs along 63% of the management unit (see table below for feeder bluffs by reach). Approximately 65% of the area also provides a source of large woody debris to the nearshore. Shore modifications have been mapped along 38% of the management area (DNR 2001a).
Table 7-22. Feeder Bluff Data for Case Inlet
SMP REACH % of Reach with Active Feeder Bluffs
CI 1 51%
CI 2 0%
CI 3 94%
CI 4 13%
CI 5 65%
CI 6 77%
CI 7 55%
CI 8 36%
CI 9 100%
CI 10 52%
CI 11 82%
DNR classified most of these shores as “semi-protected”, excluding shores located within embayments and a segment of shore between Heron Island and Dutchers Cove that is slightly oriented to the west-northwest (DNR 2001a).
June 2009 Page 7-39

Pierce County Shoreline Inventory and Characterization Report
Net-shore Drift
Seventeen drift cells are encompassed within this management area (see table below) (Schwartz et al. 1991). Littoral drift follows the same general pattern throughout this management unit – with northward drift along south-facing shores and southward drift along north-facing shores. Embayments and islands are comprised of numerous shorter drift cells, the direction of which is largely correlated with aspect relative to predominant conditions as previously described.
Table 7-23. Drift Cell Data for Case Inlet
SMP REACH # Drift Cells Drift Cell Names
CI 1 partial PI-20-4 (partial)
CI 2 2 partial PI-20-5 (partial), PI-20-4 (partial)
CI 3 partial PI-20-5 (partial), PI-15-5 (partial)
CI 4 partial PI-15-5 (partial)
CI 5 4 + partial PI-17-5, PI-17-4, PI-17-3, PI-17-2, PI-15-5 (partial)
CI 6 3 PI-15-2, PI-15-3, PI-15-4
CI 7 partial PI-15-1 (partial)
CI 8 2 + partial PI-14-9, PI-14-10, PI-15-1 (partial)
CI 9 1 PI-14-11
CI 10 3 + partial PI-14-13, PI-14-14, PI-14-12, PI-14-15 (partial)
CI 11 partial PI-14-15 (partial)
Drainage Basin, Tributary Streams, and Associated Wetlands
The two major streams within the Case Inlet marine management area are: Vaughn Creek and Rocky Creek. Rocky Creek is itself a freshwater shoreline of the state and will be described in later sections of this chapter. No major streams are found on the western shore of Key Peninsula or on Herron Island.
On Key Peninsula, a large wetland system containing a mosaic of palustrine open water, scrub-shrub, emergent, and forested areas, and potentially some estuarine habitat, is mapped extending northeast from the head of Taylor Bay. These wetlands constitute 75% of the Taylor Bay planning reach. Another large wetland system makes up 29% of the Devils Head planning reach. Smaller wetlands are mapped near the mouth of the bay and between Taylor Bay and Whitman Cove.
Page 7-40 June 2009

Pierce County Shoreline Inventory and Characterization Report
Small, scattered wetlands are mapped along the marine shoreline between Whiteman Cove and Dutchers Cove. A large wetland complex extends east from the head of Whiteman Cove; this wetland covers 13% of the Whiteman Cove planning reach and contains palustrine scrub-shrub and lacustrine habitats (based on aerial photography and NWI data). Several small wetlands are mapped on Herron Island.
Critical or Priority Habitat and Species Use
Eelgrass is extremely limited in this management unit, being found only in scattered, patchy distribution at the mouths of Vaughn Bay and Rocky Bay (Map 24). Similarly, forage fish spawning areas are limited in this management unit. Surf smelt spawning is documented at Vaughn Bay, Devils Head, and north of Taylor Bay, while sand lance spawning has been documented north of Whiteman Cove. The extent of potential forage fish habitat varies by reach (see Table 7-24).
A waterfowl concentration area occurs at the mouths of Vaughn and Rocky Bays.
Table 7-24. Potential Forage Fish Habitat on Case Inlet
SMP REACH % of Reach with Potential Forage Fish Habitat
CI 1 62%
CI 2 11%
CI 3 100%
CI 4 27%
CI 5 78%
CI 6 55%
CI 7 51%
CI 8 21%
CI 9 100%
CI 10 24%
CI 11 63%
Shellfish
The only mapped location for shellfish includes hardshell clam at Rocky Bay. Commerical shellfish growing areas are approved for most of Case Inlet and Henderson Bay. Recreational shellfish beaches occur in Reaches 4 and 6 near the mouths of estuaries such as Whiteman Cove. Talyor Bay is closed to recreation shellfish harvest and commercial is prohibited (Map 25). Vaughn Bay is also closed for commercial shellfish due to pollution.
June 2009 Page 7-41

Pierce County Shoreline Inventory and Characterization Report
Marine Riparian Habitats
Marine riparian vegetation along the shorelines in this management unit is in generally good condition. Intact riparian vegetation occurs for long stretches from Devils Head almost to Herron Island. However, shoreline armoring and development have removed or highly altered riparian vegetation in the vicinity of Vaughn and Rocky Bays and the shoreline south to Herron Island and on Herron Island itself. Some areas within Whiteman Cove and Taylor Bay also are lacking riparian vegetation.
Water Quality
Similar to the conditions in Henderson Bay, Case Inlet is vulnerable to impaired water quality due to the sheltered shorelines, long, shallow embayments, and slow flushing or mixing rates. A number of general water quality concerns have been identified for Case Inlet waters including 303(d) listings for fecal coliform, low dissolved oxygen, high ammonium nitrogen, and high nitrite nitrogen (Newton et al. 2002, PSAT 2007). Sensitivity to eutrophication is high and sensitivity to added nutrients is very high (Newton et al. 2002). Water quality impairment in this management unit includes Taylor Bay, which is categorized as a prohibited shellfish growing area.
7.2.5.2 Shoreline Use Patterns
Existing Land and Shoreline Use
Land use near the Case Inlet shoreline area is characterized by rural residential patterns, with higher densities of residential development surrounding Rocky Bay and Vaughn Bay. Residential development throughout this portion of the management area is accessed via predominantly two-lane residential roadways. There are no major roadways within the Case Inlet shoreline planning area.
Shoreline modifications
Shoreline modifications associated with residential uses occur within the South Case Inlet shoreline area; however, they do not characterize the majority of the shoreline. Modifications are most predominantly found in areas where residential development fronts the marine shoreline, and are most commonly rip-rap and concrete bulkheads. Aerial photographs show that shoreline residences within all reaches have bulkheads along the shoreline side of their properties. The extent of modification by reach is listed in the table below.
Page 7-42 June 2009

Pierce County Shoreline Inventory and Characterization Report
Table 7-25. Modifications by Reach for Case Inlet (Pentec 2003)
SMP REACH
Shorezone MOD%
Modifications MHW
Modifications MSL
CI 1 11% 0% 0%
CI 2 2% 0% 0%
CI 3 0% 3% 0%
CI 4 28% 7% 0%
CI 5 43% 24% 0%
CI 6 42% 16% 0%
CI 7 65% 38% 0%
CI 8 67% 33% 0%
CI 9 46% 42% 0%
CI 10 40% 26% 0%
CI 11 33% 19% 0%
Shoreline Environment Designations, Zoning, and Other Applicable Regulations
The current Shoreline Environment Designations of the Case Inlet shorelines are predominantly Natural, Rural/Residential, Rural, and Conservancy throughout. Areas with Natural designation are located predominantly within reaches CI 1, CI 3 and CI 5. Reaches CI 7 through 11 are predominantly Rural. Zoning designations for this shoreline planning area are largely Residential 10 (78 to 100% of each reach).
Marine Shoreline Critical Salmon Habitat was designated by Pierce County for portions of the Case Inlet shoreline planning area. There are seven shoreline sections designated including six sections on the western shore of Key Peninsula and one section on Heron Island.
Existing and Potential Public Access Areas
There is one developed state park that provides public access to the Case Inlet shoreline - Joemma Beach State Park. Joemma Beach State Park is a 122-acre marine camping park with over 3,000 feet of saltwater beach. This park is located in southeastern Key Peninsula on Whiteman Cove and provides camping, day use, fishing, crabbing and a boat ramp. http://parks.wa.gov/parkpage.asp?selectedpark=Joemma+Beach. In addition, the Haley Property, an undeveloped site along Case Inlet is owned by State Parks and provides recreational shellfish harvesting, kayak landing, and beach access.
June 2009 Page 7-43

Pierce County Shoreline Inventory and Characterization Report
Page 7-44 June 2009
At Herron Point, there is a 1.5 acre County owned shoreline parcel that provides potential future access to the shoreline. There is one boat ramp in Joemma Beach State Park and another maintained by Pierce County Public Works at Vaughn Bay.
Historic and Cultural Resources
Cultural resources within the Case Inlet shoreline planning area include recorded pre-contact materials and campsites. Native American use of the Puget Sound coastal shoreline included seasonal hunting and gathering campsites typically near rivers and streams, as described in greater detail within the Colvos Pass – Tacoma Narrows land use section. Recorded artifacts include lithic scatters, charcoal deposits, shell middens, and calcined bones (DAHP, 2007). Subsistence harvest of anadromous fish (salmon and trout) and supplemental hunting of upland mammals occurred along the shoreline and throughout the watershed (DAHP, 2007).
7.2.5.3 Reach Scale Assessment
The Case Inlet (CI) marine management area covers 30.4 miles of the WRIA 15 marine shoreline of Pierce County. This shoreline planning area is divided into 11 reaches, referred to as CI_1 (Reach 1) through CI_11 (Reach 11). Reaches are described below in Table 7-26.
7.2.5.4 Restoration Opportunities
Restoration opportunities along Case Inlet include removing derelict structures; replacing hard shore armoring with bioengineered alternatives; restoring tidal connections to marshes and lagoons; and restoring riparian vegetation (Pentec, 2003; Pierce County, 2006d).

Pierce County Shoreline Inventory and Characterization Report
Table 7-26. Reach Assessment for the Case Inlet (CI) Marine Management Area
Reach Number
Reach Location on Key Peninsula
Reach Length (miles) Land Use Description Modifications Unique Features Marine Riparian
Area
CI-1 Devils Head 1.43 Rural lands and residential uses.
Low. Only 11% of the shoreline is modified.
Includes Critical Marine Habitat. Approximately 29% of the reach is mapped as wetland Patchy kelp at Devils Head
High quality riparian. 96% of the riparian area is vegetated with 50% or more cover.
CI-2 Taylor Bay 1.21 Includes Taylor Bay and large associated wetland area.
Low. Only 2% of the shoreline is modified.
Taylor Bay is also designated as Marine Shoreline Critical Habitat. Approx. 75% of reach mapped as wetland.
High quality riparian.
CI-3 Taylor Bay to Whiteman Cove
1.09 Rural land and residential uses.
Low. 0% of the shoreline is modified.
Active feeder bluff on 94% of reach. Open water wetland lies within the shoreline as observed on aerials.
High quality riparian.
CI-4 Whiteman Cove 2.49 Rural lands and residential uses. Includes Joemma Beach State Park. 350 foot long public dock at Joemma Beach.
Low to moderate. 28% modified.
Approx. 13% of reach mapped as wetland.
Moderate (64% of reach is vegetated).
June 2009 Page 7-45

Pierce County Shoreline Inventory and Characterization Report
Page 7-46 June 2009
Reach Number
Reach Location on Key Peninsula
Reach Length (miles) Land Use Description Modifications Unique Features Marine Riparian
Area
CI-5 Western shore 8.12 Rural lands and residential uses. One residential community off Tiedman Road KPS on the beach. Includes Herron Island and Herron Bay. Public dock at Herron Bay. Residential land uses and private ferry with landing.
Moderate. 43% modified.
Southwestern shore of Herron Island is designated Marine Shoreline Critical Habitat. Patchy kelp on Herron Island. 65% of reach has active feeder bluffs. Approved for commercial aquaculture growing area.
Moderate quality.
CI-6 Western shore 5.26 Includes Dutcher’s Cove. Haley Property -undeveloped waterfront park lands owned by State Parks. Rural residential land uses.
Low to moderate. Dutcher’s Cove is designated Marine Shoreline Critical Habitat. Active feeder bluffs on 77% of reach. Estuary and sand spit Approved for commercial shellfish aquaculture.
High quality riparian. 96% of the riparian area is vegetated with 50% or more cover.
CI-7 North of Dutcher’s Cove
2.23 Includes west shore of spit at Vaughn Bay. Rural residential.
65% of reach is modified.
Active feeder bluff is 55% of reach.
High quality riparian. 100% of the riparian area is vegetated with 50% or more cover.
CI-8 Vaughn Bay 3.51 Includes east shore of spit at Vaughn Bay. Vaughn Bay boat launch.
Moderate. Docks, floats and residential development.
Moderate quality. 60% of reach is vegetated.

Pierce County Shoreline Inventory and Characterization Report
June 2009 Page 7-47
Reach Number
Reach Location on Key Peninsula
Reach Length (miles) Land Use Description Modifications Unique Features Marine Riparian
Area
CI-9 Point between Vaughn Bay and Rocky Bay
0.87 Residential land uses. Moderate. Point is Marine Shoreline Critical Salmon Habitat area. Active feeder bluffs (100% of reach). Estuary.
Low. 30% vegetated.
CI-10 Rocky Bay – eastern shore
3.05 Residential land uses. Moderate. Includes Marine Critical Habitat. Includes marshes and lagoons.
High. 74% vegetated.
CI-11 Rocky Bay – western shore
1.09 Residential. SR 302 lies within shoreline on west shore of Rocky Bay.
Low modifications. 33% of reach.
Includes Marine Critical Habitat.
Moderate. 64% vegetated.

Pierce County Shoreline Inventory and Characterization Report
7.3 Rivers, Shorelines of the State
7.3.1 Minter Creek
7.3.1.1 Physical and Biological Characterization
Drainage Basin, Tributary Streams, and Associated Wetlands
Minter Creek has two major tributaries: Huge and Little Minter Creeks. The headwaters of Minter Creek are located north of Pine Road in Kitsap County. From there the stream flows into Minter Bay and eventually into Case Inlet. The total length of Minter Creek is approximately 6.3 miles; however, only the lower 1.5 miles qualify as a shoreline of the state (Ecology, 2007; Pierce County, 2005e). The Minter subbasin drains approximately 8.5 square miles.
Riparian wetlands are mapped along almost the entire length of Minter Creek and compose 88% of the shoreline planning area along this stream. Based on aerial photos, much of this wetland is forested, with a smaller portion consisting of disturbed habitats.
Critical or Priority Habitat and Species Use
Freshwater bodies in the Kitsap Peninsula shoreline planning area support several priority species: chum salmon, Chinook salmon, steelhead, and coho salmon (WDFW, 2007a). Critical habitat for these species is discussed below.
The Puget Sound/Strait of Georgia chum ESU does not warrant an ESA listing; thus, there is no critical habitat for this species (NOAA Northwest Regional Office, 2007). Critical habitat has been designated for the Puget Sound Chinook ESU; however, none of the freshwater bodies in WRIA 15 are included in the critical habitat areas for this species (Federal Register, 2005a). Critical habitat for the Puget Sound steelhead DPS has not yet been designated. The Puget Sound/Strait of Georgia coho ESU is listed as a species of concern and thus has no designated critical habitat (NOAA Northwest Regional Office, 2007).
Minter Creek contains documented wetland priority habitat. This includes coastal salt marshes, salt meadows, and brackish marshes (WDFW, 2007a).
There are two WDFW fish hatcheries located on Minter Creek. The Minter Springs Hatchery is located near the mouth of Minter Creek and is a production facility that releases fall Chinook, coho, and chum (Pierce County, 2005e). The Hupp Springs Hatchery is a recovery facility that releases White River Spring Chinook stock at its location on the White River. The Hupp Springs rearing ponds are located in one of the reaches of Minter Creek.
Several salmonid species are found in Minter Creek: Chinook, chum, coho, steelhead, and cutthroat trout. The coho, steelhead, and cutthroat trout distributions extend to Pine Road (Pierce County, 2005e). Documented presence exists for migrating and spawning fall chum and migrating fall Chinook, resident cutthroat trout, and winter steelhead along Minter Creek. Presence of spawning coho is also documented along this stream (WDFW, 2007b).
Page 7-48 June 2009

Pierce County Shoreline Inventory and Characterization Report
There are several potential barriers to fish passage located along Minter Creek. Diversion and intake structures for the Minter Creek Hatchery have served as barriers in the past. In addition, undersized culverts along the stream serve as impediments to fish passage (Pierce County, 2005e).
Instream and Riparian Habitats
Stream surveys conducted along Minter Creek indicate that aquatic and riparian habitat conditions vary; however, the majority of both habitat types have been rated as “good.” The reaches rated as having “good” quality had off-channel habitat, well-developed sinuous channels, and an abundance of LWD (Pierce County, 2005e).
The lowest reach of the creek is affected by the operation of the Hupp Springs/Minter Creek Hatchery. Water diversions, intake and outfall structures alter natural habitat forming processes within this reach. In addition, the hatchery facilities limit riparian buffer width and quality (Pierce County, 2005). This reach was given ratings of “poor” for both aquatic and riparian habitat. The reach stemming from just north of 149th Street to south of 155th Street Court was also rated “poor” for both aquatic and riparian habitat mainly due to stream bank and channel alterations and lack of riparian function (Pierce County, 2005e).
Water Quality
According to the 2004 Washington State Water Quality Assessment, Minter Creek had two Category 5 listings (303(d) listings) for dissolved oxygen and fecal coliform. In addition, Minter Creek has two Category 1 listings for pH and temperature (Ecology, 2004b).
Field visits indicated the presence of several potential causes for the problematic dissolved oxygen concentrations in the stream. Algal bloom growth was observed on a number of the reaches along Minter Creek during 2003 and 2005 field inspections. Removal of riparian vegetation, the location of pasture and livestock areas in close proximity to the stream, and residential and recreational development along the stream were also listed as potential causes for the dissolved oxygen impairment. Potential sources of fecal coliform impairment include uncontrolled domestic animal access to parts of Minter Creek, as well as pastures located along the stream (Pierce County, 2005e).
7.3.1.2 Shoreline Use Patterns
Minter Creek passes through predominantly rural and undeveloped (vacant) areas. No Shoreline Environment Designation has been determined for Minter Creek in the County’s SMP. Zoning and Comprehensive Plan designations largely follow existing land use and are dominated by R10 (89%), as well as Agricultural Resource Land. Bridges over Minter Creek include the Creviston Drive and Eligin Clifton Road crossings.
No County owned public access or parks lie along Minter Creek.
Inventoried cultural resources within the Minter Creek area include an identified shell midden near the stream’s mouth (DAHP, 2007). No other resources or inventoried cultural resources or historic sites are mapped. However seasonal hunting by the Squaxan and Skokomish Tribes
June 2009 Page 7-49

Pierce County Shoreline Inventory and Characterization Report
could have occurred in the area, and as such there is some potential for the presence of cultural resources.
7.3.1.3 Reach Scale Assessment
Minter Creek is described as one reach – MINT_CR_01. The Minter Creek reach is 1.47 miles long measured from the mouth upstream.
7.3.1.4 Restoration Opportunities
General restoration opportunities for Minter Creek include removing invasive vegetation and restoring riparian habitat. The County could also coordinate with the hatchery to improve water quality and enhance instream habitat (Pierce County, 2006d).
The Pierce Conservation District and the South Puget Sound Enhancement Group (SPSSEG) have implemented programs to resolve fish passage barriers on Minter Creek (KGI-WIC, 2001). The Key Peninsula-Islands Basin Plan (Pierce County, 2006d) recommends several measures to restore and protect habitat in Minter Creek, such as removing historic pilings from nearshore areas, removing invasive vegetation and restoring riparian habitat, coordinating with the hatchery to improve water quality and enhance instream habitat, and educating landowners.
The Key Peninsula Metro Park District acquired eight acres on Minter Creek through funding from the Washington Wildlife and Recreation Program. The goals of acquiring the property were to provide public water access, protect habitat, and offer opportunities for environmental education.
7.3.2 Rocky Creek
7.3.2.1 Physical and Biological Characterization
Drainage Basin, Tributary Streams, and Associated Wetlands
Rocky Creek has two major tributaries and several minor tributaries. Its headwaters are located just south of Wye Lake, in Kitsap County, and from there, the stream flows into Rocky Bay and eventually into Case Inlet. Although the stream spans approximately 5 miles in length, only 0.1 mile of the stream qualifies as a shoreline of the state (Ecology, 2007; Pierce County, 2005e).
No wetlands are mapped in the Rocky Creek shoreline planning area.
Critical or Priority Habitat and Species Use
Rocky Creek supports several salmonid species: Chinook, chum, coho, steelhead, and cutthroat trout (Pierce County, 2005e). Rocky Creek is known to support spawning summer chum and is documented as providing suitable habitat for migrating summer chum. Fall chum are known to be present during migration and spawning. PHS records document the presence and migration of largemouth bass, fall Chinook, winter steelhead, and resident cutthroat trout. Rocky Creek is also known to support spawning coho salmon (WDFW, 2007b).
Page 7-50 June 2009

Pierce County Shoreline Inventory and Characterization Report
Instream and Riparian Habitats
Stream surveys indicate that with the exception of one reach, aquatic and riparian conditions along Rocky Creek are “good.” Contributing to this rating is the presence of off-channel habitat, well-developed sinuous channel lengths, and an abundance of LWD (Pierce County, 2005e). An additional contributor to this good rating is the stream’s location within a vegetated ravine for most of its length.
Water Quality
According to the 2004 Washington State Water Quality Assessment (Ecology, 2004b), Rocky Creek has one Category 2 listing for dissolved oxygen and one Category 1 listing for temperature.
Field investigations in 2003 and 2005 indicated the presence of algal bloom growth on a number of reaches along Rocky Creek, a potential source of dissolved oxygen impairment (Pierce County, 2005e).
7.3.2.2 Shoreline Use Patterns
Rocky Creek passes through predominantly rural and undeveloped areas extending north from Rocky Bay. Currently, Rocky Creek is not designated by the County’s shoreline master plan. Zoning and Comprehensive Plan designation for the Rocky Creek shoreline is 98% Rural 10. Bridges over Rocky Creek include the State Route 303 and 144th St crossings.
No public access or parks lie along Rocky Creek within the shoreline planning area. However, a 224-acre County property was leased to Key Peninsula Parks & Recreation District for recreation and conservation along the upstream sections of the creek. Walking trails provide access to the creek and its associated wetlands (see web page http://keypeninsulaparks.com/system.html).
No cultural resources are inventoried within the Rocky Creek area. However seasonal hunting by the Squaxan and Skokomish Tribes could have occurred in the area, and as such there is some potential for the presence of cultural resources.
7.3.2.3 Reach Scale Assessment
Rocky Creek is represented by one reach that is 0.12 miles long. This reach (ROCK_CR_01) is located at the mouth of the creek where mean annual flow is greater than 20 cfs.
7.3.2.4 Restoration Opportunities
The South Puget Sound Salmon Enhancement Group (SPSSEG) has been working in partnership with Pierce County Roads to improve fish passage on Rocky Creek and replace blocking culverts. Culvert replacement projects took place in 2007 and were funded by the Salmon Recovery Funding Board (SRFB), USFWS, and Pierce County Water Programs.
The Key Peninsula-Islands Basin Plan (Pierce County, 2006d) recommends several measures to restore and protect habitat in Rocky Creek, such as removing old wooden structures from
June 2009 Page 7-51

Pierce County Shoreline Inventory and Characterization Report
nearshore areas, preserving high-quality instream and riparian habitats, replacing culverts, and purchasing important habitat areas. The County could also coordinate with the hatchery to improve water quality and enhance instream habitat.
7.4 Lakes, Shorelines of the State
7.4.1 Bay Lake
7.4.1.1 Physical and Biological Characterization
Drainage Basin, Tributary Streams, and Associated Wetlands
Bay Lake is a recreational lake located on the Key Peninsula, draining to the marine shoreline in Penrose State Park. The lake covers approximately 129.6 acres and measures up to 11 feet in depth (KGI Watershed Committee, 1999). The shoreline measures 5.8 miles in length.
Wetlands make up 27% of the shoreline planning area for Bay Lake. Based on aerial photography, wetland habitat surrounding the lake includes a mixture of palustrine forested, scrub-shrub, and emergent types. Wetlands are mapped to the southeast of Bay Lake and along the outlet stream to the north of Delano Drive.
Critical or Priority Habitat and Species Use
Priority habitats associated with Bay Lake include waterfowl concentration areas and an estuarine zone. The lake provides habitat for migrating waterfowl and is adjacent to pristine estuarine shoreline containing eelgrass beds, marshes, and other intertidal habitat (WDFW, 2007a).
Fish species occurring in Bay Lake may include largemouth bass, bluegill, rainbow trout, and German brown trout. The lake is regularly stocked with rainbow trout and German brown trout for recreational fishing (KGI Watershed Committee 1999). An impassable dam is present at the confluence of Bay Lake and Mayo Creek at RM 15.0042. This is located near Mayo Cove on Carr Inlet (Williams et al. 1975).
Instream and Riparian Habitats
Common vegetation associated with Bay Lake includes Elodea spp. and bladderwort species (KGI Watershed Committee, 1999).
Water Quality
According to the 2004 Washington State Water Quality Assessment (Ecology, 2004b), Bay Lake has one Category 2 listing for total phosphorus.
Page 7-52 June 2009

Pierce County Shoreline Inventory and Characterization Report
7.4.1.2 Shoreline Use Patterns
Existing Land and Shoreline Use
The shoreline planning area of Bay Lake is dominated by low density residential development and open space (undeveloped) existing land uses. Sanford Ave. S and 166th Ave. S pass through the shoreline planning area, but no significant infrastructure intrudes on the lake.
Shoreline modifications
Shoreline modifications are minimal and associated with residential development. Minimal residential bulkheads have been constructed along the lake, as well as minimal installation of residential use docks. The low density nature of development has likely limited modification to the lake shoreline, as well as the significant areas that are undeveloped along the Bay Lake’s eastern, southern, and western shorelines.
Shoreline Environment Designations, Zoning, and Other Applicable Regulations
Conservancy is the existing Shoreline Environment Designation of Bay Lake. County zoning and Comprehensive Plan designations are Rural 10 (82%) and Agricultural Resource Land (18%). Bay Lake lies outside of the CUGA.
Existing and Potential Public Access Areas
There are no existing parks on Bay Lake. However, a WDFW boat ramp has been developed on the northern shore off 166th Ave. KPS. The facility also includes approximately 20 parking stalls and toilets.
Historic and Cultural Resources
No cultural resources are inventoried within the Bay Lake area. However, seasonal hunting by the Squaxan and Skokomish Tribes could have occurred in the area, and as such there is some potential for the presence of cultural resources.
7.4.1.3 Reach Scale Assessment
Bay Lake is represented by one reach – BAY_LK_01. The Bay Lake reach is 5.82 miles long, encompassing the entire lake shoreline.
7.4.1.4 Restoration Opportunities
Restoration opportunities for Bay Lake are limited. There are few developed properties and much of the shoreline is currently forested. Preservation of existing shoreline forest around Bay Lake would be desired.
June 2009 Page 7-53

Pierce County Shoreline Inventory and Characterization Report
7.4.2 Butterworth Reservoir
7.4.2.1 Physical and Biological Characterization
Drainage Basin, Tributary Streams, and Associated Wetlands
Butterworth Reservoir is located on McNeil Island and is fed by Luhr, Floyd Cove, and Bradley Creeks. These streams are small and shallow, approximately 2 feet wide. The reservoir covers approximately 100 acres and reaches a maximum of 42 feet in depth, with the shoreline spanning a total of 2.5 miles. Elevation of the site is about 85 feet (KGI Watershed Committee, 1999). Butterworth Reservoir provides the water supply to the McNeil Island Corrections Center and the residential units on the island. Water is piped from the reservoir into Eden Creek Reservoir, where the water is treated and distributed around the island (Till and Caudill, 2003). The reservoir was created by damming Eden Creek in 1936. This stemmed from a need to provide the federal penitentiary with its own water supply system. During the formative years, the sewage from the penitentiary was dumped directly onto the shoreline of McNeil Island; later, a pipeline was installed to dump the sewage directly into Puget Sound. The construction of Butterworth Reservoir and the accompanying filtration plant (installed in 1935) resolved these issues (McClary, 2003).
No wetlands are shown within the Butterworth Reservoir shoreline planning area.
Critical or Priority Habitat and Species Use
Several priority habitats are documented for Butterworth Reservoir: Urban Natural Open Space (UNOS) and waterfowl concentrations. Property owned by the Washington Department of Fish and Wildlife (WDFW) on McNeil Island contains largely second-growth, lowland Puget Sound mixed coniferous/deciduous forest. These UNOS areas also include some abandoned farm fields, orchards, and smaller reservoirs. Butterworth Reservoir specifically is documented as hosting waterfowl concentrations in winter, spring, and fall (WDFW, 2007a).
Butterworth Reservoir contains mostly rainbow trout that are stocked annually. The reservoir does not contain sufficient habitat to sustain native salmon populations. The streams feeding into the reservoir are narrow and contain mostly sand and silt with little spawning habitat as well. Butterworth Dam (site 981737) acts as a total barrier to fish passage (Till and Caudill, 2003).
Water Quality
According to the 2004 Washington State Water Quality Assessment (Ecology, 2004b), Butterworth Reservoir is not listed for any water quality impairments. Lack of inclusion in the assessment does not indicate that the waterbody is not impaired; smaller waterbodies are often not sampled and may not reflect degraded water quality standards.
7.4.2.2 Shoreline Use Patterns
Butterworth Reservoir, located on McNeil Island, is dominated by rural residential development and farming uses within its shoreline planning area. McNeil Island in its entirety is an approximately 20 square mile penal colony. Since 1875, a number of prison complexes have
Page 7-54 June 2009

Pierce County Shoreline Inventory and Characterization Report
been built on the island, including a prison complex directly north of the Butterworth Reservoir (located outside of the shoreline planning area). Some of the grounds of McNeil are used as a cattle farm for prison work programs; however existing land use surrounding the reservoir is primarily undeveloped (vacant) forest land. There are no industries or residences on the island unrelated to the correctional programs. Butterworth Reservoir is the water supply reservoir for the McNeil Island Correctional Center and other facilities on the island. This reservoir drains to Eden Creek.
A small (one lane) paved road encircles the entire lake within the shoreline planning area. Minimal other modifications to the shoreline environment occur, however two small docks are located on the southwestern and northwestern shorelines. A causeway cuts across the southeastern portion of the lake, and is crossed by a two lane paved road.
The existing Shoreline Environment Designation of Butterworth Reservoir is Conservancy. County zoning and Comprehensive Plan designations are 100% Rural 40. The reservoir lies outside of the CUGA.
Public access to the shoreline to Butterworth Reservoir is not provided due to its location near the McNeil Island Corrections Center.
No cultural resources are inventoried within the Butterworth Reservoir area.
AReach Scale Assessment
One shoreline reach represents Butterworth Reservoir – BUTT_RES_01. This reach is 2.50 miles long.
7.4.2.3 Restoration Opportunities
No restoration opportunities are proposed for this reservoir. Butterworth is surrounded by forested land, with a perimeter road around the entire drinking water reservoir. Restoration is likely not feasible for this shoreline due to its use in a water supply system.
7.4.3 Carney Lake
7.4.3.1 Physical and Biological Characterization
Drainage Basin, Tributary Streams, and Associated Wetlands
Carney Lake is located about 4 miles north of Vaughn and covers approximately 39.2 acres. This lake has no surface outlet and the lake level rises during periods of heavy rainfall (KGI Watershed Committee, 1999). The total length of the shoreline is 1.2 miles.
Carney Lake is mapped as a lacustrine wetland habitat. Approximately 5% of the Carney Lake shoreline planning area outside of the lake is mapped as wetland.
June 2009 Page 7-55

Pierce County Shoreline Inventory and Characterization Report
Critical or Priority Habitat and Species Use
Resident fish species include rainbow trout, which are stocked for recreational fishing in the lake (KGI Watershed Committee, 1999).
Water Quality
According to the 2004 Washington State Water Quality Assessment (Ecology, 2004b), Carney Lake has one Category 1 listing for total phosphorus.
7.4.3.2 Shoreline Use Patterns
Existing Land and Shoreline Use
The shoreline planning area of Carney Lake, which lies on the northern boundary of Pierce County, is dominated by low density residential development existing land use. Residential roads that pass within the shoreline area of Carney Lake include Carney Lake Rd and 166th Ave, but no significant infrastructure intrudes on the lake.
Shoreline modifications
Moderate residential bulkheading has been constructed along the lake, as well as minimal installation of residential use docks. The low density nature of development has likely limited modification to the lake shoreline.
Shoreline Environment Designations, Zoning, and Other Applicable Regulations
The existing Shoreline Environment Designation of Carney Lake is Rural. County zoning and Comprehensive Plan designations are 100% Rural 10. Carney Lake lies outside of the CUGA.
Existing and Potential Public Access Areas
A WDFW boat ramp has been developed on the southeastern shore of Carney Lake; however only boats without internal combustion engines are allowed. Parking and toilets are also provided. Carney Lake is stocked with rainbow trout for fishing. No parks are provided on the lake.
Historic and Cultural Resources
No cultural resources are inventoried within the Carney Lake area. However seasonal hunting by the Squaxan and Skokomish Tribes could have occurred in the area, and as such there is some potential for the presence of cultural resources.
7.4.3.3 Reach Scale Assessment
Carney Lake is represented by one reach, which is 1.22 miles long. Carney Lake, a 39 acre lake, is developed with low density single family residential development.
Page 7-56 June 2009

Pierce County Shoreline Inventory and Characterization Report
7.4.3.4 Restoration Opportunities
Carney Lake allows no motorized boat use. Restoration opportunities include restoring riparian vegetation where lacking, especially native trees and shrubs. Removal of derelict over-water structures if present and replacement of failing bulkheads with softer alternatives for bank protection are other restoration opportunities.
7.4.4 Crescent Lake
7.4.4.1 Physical and Biological Characterization
Drainage Basin, Tributary Streams, and Associated Wetlands
Crescent Lake is located approximately 3.5 miles north of Gig Harbor, Washington at an elevation of about 166 feet. It is about 46.8 acres in size and has a maximum depth of 29 feet. The lake extends along 4.2 miles of shoreline. This is the largest lake in the Gig Harbor subwatershed and one of the largest lakes in the Key Peninsula-Gig Harbor-Islands (KGI) watershed. Crescent Lake is used largely for recreational activities and the surrounding area is mostly developed (KGI Watershed Committee, 1999). Crescent Lake is the headwaters to Crescent Creek, which drains a catchment area of about 5 square miles (Haring, 2000).
Crescent Lake is mapped as lacustrine wetland habitat. Wetlands outside of the lake itself compose 46% of the shoreline planning area for Crescent Lake. A large riparian wetland area extends along Crescent Creek downstream of the lake to the south. Based on aerial photos the portion of this wetland in the planning area contains a patchwork of forested and disturbed wetland habitats.
Critical or Priority Habitat and Species Use
Largemouth bass, smallmouth bass, bluegill, cutthroat trout, and rainbow trout are known to occupy Crescent Lake (Haring, 2000; KGI Watershed Committee, 1999). The lake has been stocked with rainbow trout to support recreational fishing (KGI Watershed Committee, 1999). Recent studies indicate resident fish are abundant and are feeding on juvenile salmonids in the lake (Haring, 2000).
A culvert located just downstream of the confluence of Crescent Lake and Crescent Creek was documented at one time as a fish passage barrier; this was later replaced in 1999. A driveway culvert that is located further downstream is considered a partial fish passage barrier (Haring, 2000).
Instream and Riparian Habitats
The shoreline of Crescent Lake is heavily developed. The lake is used for many recreational activities and there are a corresponding number of public docks lining the shoreline (Haring, 2000). The shoreline vegetation is dominated by Douglas fir, western red cedar and spruce species. There are wetland pockets present around the shoreline of the lake, comprised predominantly of sedges (Hulscher, pers. comm., 2007). Yellow pond lily is also along the edge of the shoreline in large quantities.
June 2009 Page 7-57

Pierce County Shoreline Inventory and Characterization Report
Purple loosestrife is an invasive species that is problematic around the shoreline of the lake.
Water Quality
According to the 2004 Washington State Water Quality Assessment (Ecology, 2004b), Crescent Lake has one Category 1 listing for total phosphorus. Future plans for additional developments in the Upper North Creek watershed may affect water quality in Crescent Lake (Haring, 2000).
7.4.4.2 Shoreline Use Patterns
Existing Land and Shoreline Use
The shoreline planning area of Crescent Lake is dominated by low to moderate density residential development and undeveloped (vacant) existing land use. The existing Shoreline Environment Designation of Crescent Lake is Rural/Residential (majority, including north, east, west shorelines) and Conservancy (limited to southern shoreline). Residential roads that pass within the shoreline area of Crescent Lake include Crescent Valley Drive and Talmo Drive, but no significant infrastructure intrudes on the lake shoreline.
Shoreline modifications
Moderate residential bulkheading has been constructed along the lake in areas that have existing residential development, as well as moderate frequency of installation of residential use docks.
Shoreline Environment Designations, Zoning, and Other Applicable Regulations
The existing Shoreline Environment Designation of Crescent Lake is Rural-Residential and Conservancy. County zoning and Comprehensive Plan designations are 98% Rural Sensitive Resource (RSR). The RSR designation reflects significant areas of undeveloped natural open space which surround the lake. Crescent Lake lies outside of the CUGA.
Existing and Potential Public Access Areas
A boat ramp has been developed on the northern shore of Crescent Lake. Boat access is provided by State Game Road NW, but there is no public beach or bathrooms at this location. Crescent Lake County Park, operated by Pierce County, provides access to the southeastern shoreline of the lake. Crescent Lake Park is located at 14404 Talmo Dr. NW in Gig Harbor and provides 2 acres of undeveloped waterfront park.
Historic and Cultural Resources
No cultural resources are inventoried within the Crescent Lake area. However seasonal hunting by the Squaxan and Skokomish Tribes could have occurred in the area, and as such there is some potential for the presence of cultural resources.
Page 7-58 June 2009

Pierce County Shoreline Inventory and Characterization Report
7.4.4.3 Reach Scale Assessment
Crescent Lake is represented by one shoreline reach – CRES_LK_01. This reach is 4.22 miles long.
7.4.4.4 Restoration Opportunities
The Crescent Valley Alliance (CVA) is a local organization that works on habitat restoration on Crescent Lake as well as Crescent Creek and its estuary. Projects include registering backyard wildlife habitats, organizing volunteers, maintaining wildlife corridors, establishing native vegetation, providing public education, encouraging low impact development, and collecting monitoring data (CVA, undated).
The CVA produced a stewardship plan for the Crescent Valley Biodiversity Management Area to identify threats and restoration opportunities in the watershed (CVA, 2007). The plan’s many strategies for Crescent Lake include working with property owners to plant, retain, and restore buffers around the lake; monitoring the lake’s water quality; assessing and reducing impacts caused by boating; and evaluating the effects of non-native species, including stocked fish, in the lake.
Friends of Pierce County is also active in the Crescent Creek watershed, for example by working with students to restore riparian vegetation (Friends of Pierce County, 2008).
7.4.5 Florence Lake
7.4.5.1 Physical and Biological Characterization
Drainage Basin, Tributary Streams, and Associated Wetlands
Florence Lake is located within the Riviera Subdivision on Anderson Island in Puget Sound and is located at about 197 feet in elevation. The lake covers approximately 66.5 acres, including 2.6 miles of shoreline, and reaches depths of 36 feet in the center. Primary use of the lake is for recreational activities and the shoreline is occupied by residential development (KGI Watershed Committee, 1999). The outlet stream of the lake is unknown.
Approximately 5% of the Florence Lake shoreline planning area is mapped as a wetland habitat.
Critical or Priority Habitat and Species Use
Priority habitats associated with Florence Lake include waterfowl concentrations and UNOS. Some portions of the shoreline contain steep slopes unsuitable for development and still provide habitat for wildlife. These have been documented as UNOS areas. The lake is known to host large concentrations of waterfowl during winter, spring, and fall (WDFW, 2007a).
The dominant fish species observed at Florence Lake is spiney ray. The lake provides habitat for waterfowl, including eagles, geese, and heron species (KGI Watershed Committee, 1999).
June 2009 Page 7-59

Pierce County Shoreline Inventory and Characterization Report
Instream and Riparian Habitats
High levels of milfoil are present in Florence Lake. Grass carp, an herbivorous fish species, has been introduced as a control mechanism, because it is known to eat milfoil (KGI Watershed Committee, 1999).
Water Quality
According to the 2004 Washington State Water Quality Assessment (Ecology, 2004b), Florence Lake is not listed for any water quality impairments. Lack of inclusion in the assessment does not indicate that the waterbody is not impaired; smaller waterbodies are often not sampled and may not reflect degraded water quality standards.
7.4.5.2 Shoreline Use Patterns
Existing Land and Shoreline Use
Florence Lake is located near Josephine Lake on the eastern, more developed side, of Anderson Island. The shoreline planning area of Florence Lake is dominated by low to moderate density residential development along the southern shoreline and low density residential development (with large areas of undeveloped open space) along the northern shoreline. Several residential access roads pass through the shoreline planning area along the south side of the lake, but no significant infrastructure intrudes on the lake.
Shoreline modifications
Residential bulkheads have been constructed along the majority of the lake’s southern shore; however, they are not prevalent on the northern shoreline. Existing residential use docks are common on most shoreline residential parcels.
Shoreline Environment Designations, Zoning, and Other Applicable Regulations
The existing Shoreline Environment Designation of Florence Lake is Conservancy. County zoning and Comprehensive Plan designations are 100% Rural 10. Florence Lake lies outside of the CUGA.
Existing and Potential Public Access Areas
Florence Lake has limited public access, provided via Lowell Johnson Park on the north shore of the lake. The park provides shoreline and swimming access, and space for picnicking. There is an undeveloped boat ramp in the county park on the north shore of this lake on Anderson Island. Largemouth bass, bluegill and brown trout are available in the lake for fishing.
Page 7-60 June 2009

Pierce County Shoreline Inventory and Characterization Report
Historic and Cultural Resources
No cultural resources are inventoried within the Florence Lake area. However seasonal hunting by the Squaxan and Skokomish Tribes could have occurred in the area, and as such there is some potential for the presence of cultural resources.
7.4.5.3 Reach Scale Assessment
Florence Lake is represented by one reach – FLOR_LK_01. This reach is 2.60 miles long. Undeveloped lots are found along the north shore, whereas the south shore is developed in single family residential housing.
7.4.5.4 Restoration Opportunities
The primary restoration opportunities in Florence Lake are restoration of degraded areas of the lakeshore with native vegetation. Removal of derelict over-water structures if present and replacement of failing bulkheads with softer alternatives for bank protection are other restoration opportunities. Milfoil control efforts should be continued.
7.4.6 Jackson Lake
7.4.6.1 Physical and Biological Characterization
Drainage Basin, Tributary Streams, and Associated Wetlands
Jackson Lake is located about 4 miles south of Vaughn, Washington. The lake is about 196 feet in elevation and approximately 15.8 acres in size, with approximately 3.3 miles of shoreline. Jackson Lake reaches depths of 30 feet, making it the deepest lake in the Key Peninsula subwatershed. Jackson Lake is used for recreational activities (KGI Watershed Committee, 1999). The outlet stream of the lake is unknown.
Jackson Lake is mapped as palustrine open water wetland habitat, surrounded by palustrine scrub-shrub and emergent wetland areas. Wetland associated with the lake extends to the south and southeast. Approximately 61% of the lake’s shoreline planning area is mapped as wetland.
Critical or Priority Habitat and Species Use
Fish species inhabiting the lake include largemouth bass (KGI Watershed Committee, 1999).
Water Quality
According to the 2004 Washington State Water Quality Assessment (Ecology, 2004b), Jackson Lake has one Category 1 listing for total phosphorus.
7.4.6.2 Shoreline Use Patterns
The shoreline planning area of Jackson Lake is dominated by low density residential development existing land use. Residential roads that pass within the shoreline area of Jackson Lake include Bass Lane and 178th Ave, but no significant infrastructure intrudes on the lake.
June 2009 Page 7-61

Pierce County Shoreline Inventory and Characterization Report
Minimal residential bulkheading has been constructed along the lake, as well as minimal installation of residential use docks. Bulkheading and docks are most prevalent at the southern end of the lake. The low density nature of development has likely limited modification to the lake shoreline.
Jackson Lake is not designated under the existing Shoreline Master Plan. County zoning and Comprehensive Plan designations are 100% Rural 10. Jackson Lake lies outside of the CUGA.
A WDFW boat ramp has been developed on the northwestern shore of Jackson Lake. No other parks have been developed.
No cultural resources are inventoried within the Jackson Lake area. However seasonal hunting by the Squaxan and Skokomish Tribes could have occurred in the area, and as such there is some potential for the presence of cultural resources.
7.4.6.3 Reach Scale Assessment
Jackson Lake is represented by one reach that is 3.27 miles long. This reach is called JACK_LK_01.
7.4.6.4 Restoration Opportunities
Restoration opportunities for Jackson Lake include revegetating shoreline areas where native vegetation is lacking; removing derelict overwater structures; and replacing failing bulkheads with soft alternatives for shoreline restoration.
7.4.7 Josephine Lake
7.4.7.1 Physical and Biological Characterization
Drainage Basin, Tributary Streams, and Associated Wetlands
Josephine Lake is a naturally occurring lake that occupies connected depressions at the northeast area of Anderson Island. The lake is located in the Lake Josephine Riviera subdivision, which was constructed in the 1960s. This lake occurs at an elevation of approximately 196 feet and encompasses about 72.5 acres. Josephine Lake is approximately 23 feet in depth (KGI Watershed Committee, 1999). The lake stretches along 2.5 miles of shoreline.
Approximately 8% of the shoreline planning area for Josephine Lake is mapped as wetland. Small palustrine emergent and aquatic bed wetlands are mapped at the north and south ends of the lake.
Critical or Priority Habitat and Species Use
Several priority habitats are present at Josephine Lake: waterfowl concentration areas, wetlands, and UNOS. Waterfowl are known to congregate at the lake during winter, spring, and fall months. Wetland habitat is documented on Anderson Island in the vicinity of Josephine Lake.
Page 7-62 June 2009

Pierce County Shoreline Inventory and Characterization Report
Also, the lake is associated with steep slopes that are unsuitable for development and still provide habitat for wildlife (WDFW, 2007a).
Josephine Lake provides habitat for waterfowl, including eagles, geese, and heron species. The lake is stocked with bass and trout for recreational fishing (KGI Watershed Committee, 1999).
Water Quality
According to the 2004 Washington State Water Quality Assessment, Josephine Lake has one Category 1 listing for total phosphorus (Ecology, 2004b). Potential sources of nonpoint pollution stem from on-site sewage, and fertilizer and pesticide runoff from lakeside homes, parks, and an adjacent golf course (KGI Watershed Committee, 1999).
7.4.7.2 Shoreline Use Patterns
The shoreline planning area of Josephine Lake is dominated by low density residential development throughout. The existing Shoreline Environment Designation of Josephine Lake is Rural/Residential. County zoning and Comprehensive Plan designations are 100% Rural 10. Josephine Lake lies outside of the CUGA.
Several residential access roads pass through the shoreline planning area along the south side of the lake, but no significant infrastructure intrudes on the lake. Josephine Lake has limited public access. No county or WDFW access facilities are present along the lake’s shoreline; however the Riviera County Club provides recreation activity (and limited public access) to the Lake Josephine planning area.
Moderate levels of residential bulkheads have been constructed along the lake, as well as minimal installation of residential use docks. The low density nature of development has likely limited modification to the lake shoreline.
No cultural resources are inventoried within the Josephine Lake area. However seasonal hunting by the Squaxan and Skokomish Tribes could have occurred in the area, and as such there is some potential for the presence of cultural resources.
7.4.7.3 Reach Scale Assessment
Josphine Lake is located on Anderson Island, and is represented by JOSE_LK_01. This reach is 2.51 miles long.
7.4.7.4 Restoration Opportunities
Restoration on Josephine Lake could include restoration of the north end of the lake where parking lot and tennis courts exist. Revegetation of the shoreline area with native plants would improve conditions on the north end of the lake. Also, several residences have developed private beaches on certain properties; these beaches could be minimized and partially restored to reduce sediment transport to the lake.
June 2009 Page 7-63

Pierce County Shoreline Inventory and Characterization Report
7.4.8 Lake Minterwood
7.4.8.1 Physical and Biological Characterization
Drainage Basin, Tributary Streams, and Associated Wetlands
Lake Minterwood is located northeast of Vaughn on the west side of the Key Peninsula Highway. The total length of shoreline extends approximately 2.2 miles. Lake Minterwood was created by the damming of a small tributary to Vaughn Creek. The outlet of the lake was historically blocked and an overflow pipe installed. The lake now artificially drains to Lackey Creek to the east (Pierce County, 2006d).
Approximately 35% of the Lake Minterwood shoreline planning area is mapped as wetland habitat. The lake is almost entirely surrounded by small lots. A narrow, vegetated wetland approximately 0.3 mile long extends southwest from the lake.
Critical or Priority Habitat and Species Use
No information exists as to the potential presence of critical or priority habitats and species in Lake Minterwood.
Instream and Riparian Habitats
Lake Minterwood is located on private property that has been heavily developed. There is beach and boat access to the lake, as well as a large beach and playground located at the southwestern top of the lake. The dominant vegetation along the shoreline of the lake consists of Douglas fir, cottonwoods, some willow species, and Pacific madrone (Hulscher, pers. comm., 2007).
Water Quality
Lake Minterwood does not have any listings for water quality issues from the 2004 Washington State Water Quality Assessment (Ecology, 2004b).
7.4.8.2 Shoreline Use Patterns
The shoreline planning area of Lake Minterwood is dominated by low to moderate density residential development and undeveloped (vacant) existing land use. Residential roads that pass within the shoreline area of Minterwood Lake include Minterwood Drive, 113th St, and Beach Club Lane. A short segment of the Minterwood Drive runs directly along the lake’s northern shoreline.
Moderate residential bulkheading has been constructed along the lake in areas that have existing residential development, as well as moderate frequency of installation of residential use docks.
No county or WDFW access facilities are present along the lake’s shoreline; however a private beach club is located at the southern end of the lake.
Page 7-64 June 2009
Pierce County Shoreline Inventory and Characterization Report
The existing Shoreline Environment Designation of Lake Minterwood is Rural/Residential. County zoning and Comprehensive Plan designations are 100% Rural 10. The lake lies outside of the CUGA.
7.4.8.3 Reach Scale Assessment
Lake Minterwood is represented by one shoreline reach that is 2.12 miles long. The name of this reach is MINT_LK_01.
7.4.8.4 Restoration Opportunities
Restoration opportunities for Lake Minterwood are limited due to existing residential development. However, the County could work with private property owners to revegetate private shoreline areas with native plant species. Removal of derelict overwater structures and replacement of failing bulkheads with softer alternatives for bank protection are other restoration opportunities.
7.4.9 Stansberry Lake
7.4.9.1 Physical and Biological Characterization
Drainage Basin, Tributary Streams, and Associated Wetlands
Stansberry Lake, otherwise know as Lake Holiday, is located approximately 3.5 miles northeast of Vaughn. This lake is used primarily for recreation and lies within a 300-lot residential subdivision established in the 1960s. The lake stretches along 1.5 miles of shoreline and covers a total of approximately 19 acres. The lake reaches a maximum depth of 15 feet (KGI Watershed Committee, 1999).
Stansberry Lake is surrounded by a narrow fringe of wetland vegetation. Wetlands cover approximately 9% of the lake’s shoreline planning area.
Critical or Priority Habitat and Species Use
No information is known for habitat and species use in Stansberry Lake. No critical habitat or priority habitat or species is documented.
Water Quality
According to the 2004 Washington State Water Quality Assessment, Stansberry Lake has one Category 1 listing for total phosphorus (Ecology, 2004b).
7.4.9.2 Shoreline Use Patterns
The shoreline planning area of Stansberry Lake is dominated by existing moderate density residential land use. Subdivisions surrounding the lake were established in the 1960s; the Lake Holiday Association was formed by the homeowners. Recent news indicates that although vacant buildable lots exist in the area, additional water share rights will not be issued by
June 2009 Page 7-65

Pierce County Shoreline Inventory and Characterization Report
Washington Department of Ecology (October 2007, www.keypennews.com). Building permits are effectively halted for the foreseeable future on Stansberry Lake due to the lack of rights for drinking water. Residential roads that pass within the shoreline area of Stansberry Lake include 144th Street and Sandy Point East, but no significant infrastructure intrudes on the lake shoreline.
Moderate residential bulkheading has been constructed along the lake in areas that have existing residential development, as well as moderate frequency of installation of single family docks.
The existing Shoreline Environment Designation of Stansberry Lake (or Holiday Lake) is Rural/Residential. County zoning and Comprehensive Plan designations are 100% Rural 10. Stansberry Lake lies outside of the CUGA.
No County owned public access or parks lie along the lake’s shoreline; however aerial analysis does reveal the presence of a boat launch along the northwestern shoreline.
No cultural resources are inventoried within the Stansberry Lake area.
7.4.9.3 Reach Scale Assessment
Stansberry Lake is represented by one reach named – STAN_LK_01. This lake shoreline reach is 1.46 miles long.
7.4.9.4 Restoration Opportunities
Restoration of Stansberry Lake shorelines could include restoring the riparian zone, which lacks native tree cover. Replanting native trees and shrubs in this riparian zone would be appropriate actions to reduce sediment transport and improve habitat on the lake.
7.4.10 Gaps in Existing Information for Freshwater Shorelines (for all of WRIA 15)
This subsection describes specific data gaps or limitations identified during development of the shoreline inventory and characterization, as required by Ecology’s guidelines (WAC 173-26-201(3)(c)(viii)). This list should not be considered exhaustive. As additional information is developed, this list may be helpful as the County considers future updates and amendments to its Shoreline Master Program.
There are many waterbodies within the planning area for which limited information is available to provide a complete characterization. Waterbodies with limited existing information are listed below according to the parameter for which information is lacking. Table 7-7 outlines these data gaps.
Page 7-66 June 2009

Pierce County Shoreline Inventory and Characterization Report
June 2009 Page 7-67
Table 7-27. Waterbody Data Gaps
Waterbody Parameter for which data does not exist
Modifications Instream and Riparian Habitat Water Quality
Bay Lake X
Butterworth Reservoir X X
Carney Lake X X
Crescent Lake
Florence Lake X X
Jackson Lake X X
Josephine Lake X X
Lake Minterwood X X
Minter Creek X
Rocky Creek
Stransberry Lake X X

Pierce County Shoreline Inventory and Characterization Report
CHAPTER 8 SHORELINE USE ANALYSIS
State guidelines for SMP updates require that local jurisdictions analyze current and projected shoreline use patterns and trends and identify potential conflicts (WAC 173-26-2013)(d)(ii)). Previous chapters of this report characterize the following:
• Current use patterns;
• Public access opportunities;
• Future land use as defined by the county’s comprehensive plan; and
• Characterization of shoreline ecological processes, functions, and opportunities for restoration.
The general policy goals of the SMA provide for protection of shoreline ecological functions while allowing for “all reasonable and appropriate uses.” The Act states:
Alterations of the natural condition of the shorelines of the state, in those limited instances when authorized, shall be given priority for single family residences and their appurtenant structures, ports, shoreline recreational uses including but not limited to parks, marinas, piers, and other improvements facilitating public access to shorelines of the state, industrial and commercial developments which are particularly dependent on their location on or use of the shorelines of the state and other development that will provide an opportunity for substantial numbers of the people to enjoy the shorelines of the state (RCW 90.58.020).
This chapter focuses on trends and projected demand for shoreline uses and potential use conflicts. Potential conflicts in this context are focused on competing objectives or planning priorities inherent in the overall SMA policy intent (e.g., preference for water-dependent uses, public access, and ecological protection and restoration). Potential conflicts may also address conflicts between SMA policy objectives and other interests or regulatory requirements affecting shoreline resources (e.g., levee vegetation maintenance vs. restoration of riparian vegetation).
8.1 Trends and Future Demand
8.1.1 Shoreline Development Trends
In order to characterize shoreline development trends, the County examined permitting history between 2000 and 2008 in shoreline areas. This involved two approaches: 1) looking at all SMA related permits county-wide (Shoreline Substantial Development; Shoreline Conditional Use; etc.); 2) looking at residential development permit activity in shoreline areas, regardless of whether an SMP permit was applied for and granted. Data sources for this analysis include the Planning and Land Services permit database, linked to GIS by parcel numbers, for SMP permit activity. Secondly, GIS data compiled by Puget Sound Regional Council (PSRC) depicting parcels with single- or multi-family residential permit activity (demolition or construction) was spatially queried to identify residential development with the shoreline planning reaches (an approximation of shoreline jurisdiction). The PSRC data is intended to inform how much development has occurred in recent years in shoreline areas that may be exempt from obtaining a
June 2009 Page 8-1

Pierce County Shoreline Inventory and Characterization Report
Substantial Development Permit. Both data sets have been linked to GIS in order to differentiate between permit activity on marine versus freshwater shorelines. One caveat to this information is the fact that not all permits in the database were successfully linked to parcels in the GIS because of chagnes in tax parcel identification numbers and/or absence of tax parcel numbers in the database. The tables below illustrate the trends in shoreline development (focused on residential development) between 2000 and 2008. For purposes of calculating the number of permits per mile of shoreline, miles are calculated on regulated rivers and streams as the centerline of the waterbody (rather than mileage per both banks). Approximate shoreline mileage for unincorporated Pierce County is 609 miles for freshwater (rivers, streams, and lakes combined), and 185 miles of marine shoreline.
Permit Type Freshwater Shorelines
Marine Shorelines Total
SMP Related Permits (2000-2008) (Accepted, Approved, or Processing) (Source: Pierce County PALS)
150 permits
0.24 permits per mile
760 permits
4.1 permits per mile
910 permits (on 791 unique parcels)
Residential Construction Permits(2000-2007) (Source: PSRC, via PC PALS)
1,058 permits
1.7 permits per mile
577 permits
3.1 permits per mile
1,635 permits
Residential Demolition Permits (2000-2007) (Source: PSRC, via PC PALS)
114 permits 98 permits 212 permits
In the following graphics, the green dots represent either SMP permit activity or residential development in proximity to shorelines. The red dots on the second graphic illustrate residential demolition activity.
Page 8-2 June 2009

Pierce County Shoreline Inventory and Characterization Report
Figure 8-1. Shoreline Permit Locations 2000-2008 (Pierce County PALS GIS)
June 2009 Page 8-3

Pierce County Shoreline Inventory and Characterization Report
Figure 8-2. Residential Permit Locations 2000-2007 (PSRC via Pierce County PALS GIS
This analysis suggests two key findings. First, in recent years Pierce County’s SMP related permit activity has been predominantly located on marine shorelines (~84 percent of SMP permits accepted, approved, or in processing). The greatest concentration of marine shoreline permit activity has occurred along Hale Passage and in Wollochet Bay, with a large number of permit applications also on Henderson Bay and Carr Inlet. Shoreline permits for freshwater shorelines are predominantly on Lake Tapps, with lesser permit activity on Spanaway Lake and Clover Creek. The second key finding is that residential development (with or without associated SMP permit activity) has been predominantly near freshwater shorelines (~65 percent of residential construction permits). However, this may be due simply to the fact that the County has more freshwater than marine shoreline generally. As the graphics and table above illustrate, there is more residential development activity per mile of shoreline on marine shorelines when compared to freshwater shorelines.
Page 8-4 June 2009

Pierce County Shoreline Inventory and Characterization Report
8.1.2 Demand for Water-Dependent Uses
Water-dependent industrial uses in Pierce County are limited to those facilities at the Port of Tacoma. Similarly, water-dependent and water-related commercial and recreational uses such as marinas and supporting uses (moorage, boat building and repair services, etc.) are primarily located in cities and urban areas such as Tacoma and Gig Harbor. Water-dependent uses in unincorporated Pierce County are primarily ferry terminals serving Ketron Island, Anderson Island, McNeil Island, and Herron Island, and private docks and small marinas. There is one public marina located on Ketron Island adjacent to the ferry terminal. There are many water-dependent or water-oriented recreation sites in Pierce County that provide use and public access to the shoreline, such as the Fox Island Fishing Pier. There are many private docks and piers associated with residential development on lakes and portions of the marine shoreline.
An economic demand analysis has not been prepared for water-dependent uses in Pierce County. However, a waterfront lands analysis for the City of Tacoma was recently prepared that contains some information based on county-wide trends (BST Associates, 2008). Tacoma’s analysis is focused on water-dependent industrial uses located primarily in the Port of Tacoma Manufacturing and Industrial Center. Since water-dependent industrial and commercial uses are not located in unincorporated Pierce County, the analysis of these business sectors is less relevant to the County’s SMP update. The analysis does not address transportation facilities like ferry terminals, but given projected population growth in the region, it is reasonable to expect that demand for maintenance and/or expansion of ferry terminals serving island communities will continue in the future. The analysis does address demand for marinas and associated services. It found that Tacoma’s marinas are well utilized (a 96 percent occupancy rate) and several have waiting lists. Dry-stack operations for upland moorage in Tacoma have also been successful. Over the past 13 years, boat builders have experienced an average annual increase (inflation adjusted) in gross revenues of 9.3 percent. Between 1990 and 2007 Pierce County has experienced sustained growth in boat registrations. For boats ranging from 21-feet to over 60-feet in length, the number of registered boats in the County grew by 1.4 percent per year. The analysis also notes strong growth (7.6 percent per year) in the number of sales for hand-powered watercraft (e.g., kayaks and canoes). The analysis for Tacoma projects that demand for wet moorage could increase by as many as 500 slips by 2025. Generally, the analysis concludes that there is a need for additional transient and permanent wet moorage; a need to preserve and enhance recreational boating and upland support activities; and a need for improved facilities serving hand-launched boats and boats which must be hauled by trailor (i.e., boat launches) (BST, Inc., 2008). While this analysis was focused on the City of Tacoma, some of the trends reflect conditions throughout Pierce County and are relevant to the County’s SMP update.
Existing ferry docks and facilities are owned and operated by Pierce County, Washington State Department of Corrections (DOC), and the Herron Maintenance Company (HMC). Pierce County operates two ferries from Steilacoom - one to Ketron Island and another to Anderson Island. The need for maintenance and expansion of the Pierce County ferry system is outlined in the County’s Transportation Plan. DOC operates the McNeil Island Ferry. Expansion or relocation of the McNeil Island Ferry is not anticipated. HMC owns the small private ferry to Herron Island. The HMC ferry is slated for maintenance and improvements at its current location. Other islands in the marine areas of Pierce County are connected to peninsulas by bridges (i.e., Fox and Raft Islands); therefore new ferry terminals and docks are not anticipated.
June 2009 Page 8-5

Pierce County Shoreline Inventory and Characterization Report
The Pierce County Transportation Improvement Plan (TIP) for 2009 to 2014 indicates that several smaller projects are proposed at the County’s ferry docks. These improvements are minor modifications including replacing dolphins, extending queuing lanes, and updates to security systems. Construction of a second loading ramp is proposed in 2009 for the Steilacoom Ferry landing. The 2009 to 2022 Fourteen Year Ferry Program outlines the anticipated future maintenance and expansion of the County’s ferry program. Most of the data was extracted from the 2003 Waterborne Transportation Study conducted by Pierce County Public Works and Utilities. The County’s ferry system has seen passenger use grow from 34,000 in 1958 to 204,800 in 2006. However, additional ferry routes, landings or docks are not anticipated in the fourteen year program (Pierce County, 2008c; Pierce County Public Works and Utilities, 2003).
Many of the small inlets and bays within the marine waters of Pierce County are too shallow to support development as new public marinas or ferry terminals. For example, many of the coves on Key Peninsula are two fathoms (12 feet) deep or shallower and are considered not appropriate for marina development to accommodate larger boats. These shallow coves include Glen Cove, Von Geldern, Mayo Cove, Burley Lagoon, Horsehead Bay, Whitman Cove, Dutcher’s Cove, and Rocky Bay. Oro Bay on Anderson Island and shoals of Raft and Cutts Island are also shallow. Therefore, the bathymetry of the Pierce County marine shoreline plays a role in limiting the potential location of new marinas or ferry landings. The County is not currently planning any new public marinas or ferry facilities.
There is also an increasing demand for aquaculture, and specifically geoduck farming, in the intertidal zones of Puget Sound. The Washington State Shellfish Aquaculture Regulatory Committee’s report on geoduck aquatic operations states:
In recent years domestic and international demand for geoducks has increased dramatically. Wild geoducks are commercially harvested by divers. Over the last decade shellfish growers have developed aquaculture techniques to grow geoduck clams in the intertidal zone. The most common method involves inserting plastic tubes into the beach at low tide, planting cultured geoduck seed in the tubes, and covering the tubes with netting. The tubes and nets protect the baby clams from predators. After the geoducks grow for one to one and a half years, the tubes and nets are removed. When the geoduck clams reach market size, usually after four to six years, they are harvested by workers using water jets to loosen the sediment surrounding the clams so they can be removed. Planting, maintenance of the tubes and nets and harvest usually occur during low tides when the area where the clams are planted is exposed. In certain times of the year the low tides occur at night. (Ecology 2009)
8.1.3 Park, Recreation, & Open Space Plan
Pierce County recently adopted the 2008 Update to its Park, Recreation, & Open Space Plan (MIG, Inc., 2008; Ordinance No. 2008-38s). Development of the plan included an extensive public process, incorporating and building on the desires for recreational facilities expressed in the County’s nine Community Plans. Chapter 4 of the adopted plan describes park, facility, and program needs. The preferred approach to meeting program needs is referred to as “the Adaptive System,” which aims to create a regionally-focused system that responds to specific community
Page 8-6 June 2009

Pierce County Shoreline Inventory and Characterization Report
needs. One element of the Adaptive System is prioritizing water access. Locations should be identified for boat launches, swimming, fishing, water viewpoints, and other types of access. The plan notes that the public desires a saltwater marina, and recommends that development of a marina and other water access locations be accomplished through a partnership with various entities such as Public Works, Washington State Parks, Metro Parks Tacoma, and others (MIG, Inc., 2008).
Table 6.1 in the Plan represents the Draft Parks and Recreation System Capital Improvement Plan for 2008-2022. One project calls for creating an opportunity fund to acquire and develop water access sites. Other potential projects that would provide or improve water access at specific locations include:
Spanaway Regional Park – boat ramp;
Improve water access at several locations (Purdy Sand Spit, Sunrise Beach / Doc Weathers Park, Narrows Park, Crescent Lake Park, Delano Beach Park, Fox Island Ferry Landing, Herron Point, Malesky Property,
Victor Falls – landbank site to provide access to waterfall;
Chambers Creek Canyon – improve trailheads and water access;
Chambers Creek Properties and Golf Course – replace dock;
Puget Creek Beach – Beach restoration;
Wilkeson Creek Park – water viewpoint through Foothills Trail improvements; and
Puyallup River Levee Trail – continued development with Puyallup.
8.2 Potential Use Conflicts
Several development types and land uses present potential use conflicts within Pierce County’s shorelines. These use conflicts are primarily occurring on marine shorelines of Puget Sound.
8.2.1 Piers and Docks
Development of piers and docks has the potential for conflicts with other shoreline uses. Public piers and docks provide public access and recreation for shoreline users, which is a major policy objective of the SMA. Private docks associated with residential development are typically allowed, and are considered exempt from obtaining a shoreline permit under certain conditions (WAC 173-27-040(h)). Large concentrations of piers and docks can create conflicts with other uses by limiting potential for recreation and potentially interfering with navigation. For example, kayaking is a growing recreational sport in the Puget Sound region. Navigability and opportunities to access the shoreline from the water can be constrained by large concentrations of piers and docks.
June 2009 Page 8-7

Pierce County Shoreline Inventory and Characterization Report
8.2.2 Aquaculture and Other Shoreline Uses and Activities
Aquaculture, particularly shellfish growing and harvesting, is considered a preferred use under the SMA as a water-dependent use. In addition, Ecology’s SMP guidelines consider commercial and recreational shellfish beds “critical saltwater habitat” that should be afforded higher levels of protection from other uses that can impact water quality and substrate composition (WAC 173-26-221(2)(c)(iii)). Shellfish beds perform a number of important ecological functions including cycling nutrients, stabilizing substrates, creating habitat structure (e.g., oyster reefs), enhancing water quality (filtering and retention), and providing food for a wide variety of marine invertebrates, birds, fish, and mammals. Many other shoreline uses have the potential to adversely affect shellfish aquaculture. Any use or activity that degrades water quality or alters substrates in the nearshore has potential to impact native shellfish stocks and commercial aquaculture. Examples include use of pesticides and fertilizer on upland areas; marinas with potential for fuel spills; and shoreline modifications (e.g., bulkheads, breakwaters, and over-water structures) that can alter substrate composition by cutting off sediment supply or altering natural erosion and accretion processes.
While many shoreline uses can adversely affect aquaculture, commercial shellfish harvesting itself can have impacts on adjacent shorleine uses. Due to the methods required for aquaculture in the intertidal areas, a potential use conflict occurs between shellfish farming and public access in the shoreline. Unlike recreational harvest of native shellfish, aquaculture requires the use of small equipment within the intertidal zone, including plastic tubes, nets and other devices. This can temporarily inhibit public access and recreational uses. For example, plastic tubes used to plant geoduck cultures can create a use conflict for beach walkers on the farmed portion of the intertidal area when water levels recede below the tubes. This would occur during low tide periods and during the period the equipment is installed in the intertidal substrate.
There has also been growing public and scientific interest in the Puget Sound region in the possible ecological effects of expanding aquaculture operations, specifically geoduck aquaculture. A large-scale multi-disciplinary study is currently underway, with researchers addressing many of the most pressing issues related to the effects of geoduck aquaculture on the Puget Sound ecosystem. Participants in the research include local university marine scientists from the University of Washington, state agencies, and researchers from local shellfish growers. For example, Washington Sea Grant (WSG) operating out of the University of Washington College of Ocean and Fishery Sciences has embarked on a Geoduck Aquaculture Research Program. This program is supported by the Washington geoduck aquaculture research account and aims to address the specific research priorities stated in SSHB220 2007-08 (see web site at: http://www.wsg.washington.edu/research/geoduck/index.html). A comprehensive literature review, which summarized the data gaps and pinpointed areas of future research needed, was prepared for WSG by Straus and others (2008).
Projects supported by WSG in the 2007-2009 biennium were selected through a scientific peer-review process. Research is underway related to the effects of geoduck aquaculture on: eelgrass, sediment characteristics in the intertidal zone, native benthic species, and other ecological systems in the shoreline. The possible effects, including cumulative effects, of current geoduck aquaculture practices on the Puget Sound ecosystem are currently being studied.
Page 8-8 June 2009

Pierce County Shoreline Inventory and Characterization Report
In 2007, the Washington State Legislature, in response to public concern, passed Second Substitute House Bill 2220 (Chapter 216, Laws of 2007) relating to shellfish aquaculture. This bill (SSHB220 2007-08) sets up the Shellfish Aquaculture Regulatory Committee (SARC). The SARC was established to provide guidance and advice on shellfish aquaculture and to develop recommendations for guidelines for addressing geoduck operations in shoreline master programs. The committee’s recommendations are documented in a 2008 report to the legislature and in the Ecology publication: Shellfish Aquaculture Regulatory Committee Recommendations On Guidelines For Geoduck Aquaculture Operations (Ecology 2009). Although the committee did not reach consensus on all recommendations, major areas of agreement included:
• Local jurisdictions should identify where geoduck aquaculture will and will not be allowed, subject to site-specific reviews, in establishing shoreline designations.
• The extent and sensitivity of ecological features (e.g., presence of eelgrass) should be considered when determining whether a site is appropriate for aquaculture.
• Aquaculture should be restricted at sites requiring major physical alterations prior to use for aquaculture.
• Possible conflicts with surrounding land uses should be considered before approving aquaculture operations.
• WDFW should determine how to minimize risks of introducing parasites or diseases.
• Buffers between aquaculture operations and sensitive habitats should be required.
• The ecological effects of tubes, nets, and other predator exclusion devices should be addressed.
• Loss of tubes, nets and other items should be prevented, and litter and debris should be recovered.
• Prior approval for geoduck aquaculture operations should be required through a shoreline substantial development permit, conditional use permit, and written exemption (Ecology 2008 and 2009).
In April 2009, Pierce County adopted amendments to its Shoreline Master Program to temporarily address aquaculture activities and construction of new piers and docks. The amendments became effective upon approval by the Department of Ecology in May 2009 and will be in effect until the Shoreline Master Program is updated. New regulations for aquaculture address intertidal geoduck aquaculture as well as other activities. Provisions include standards for right to harvest, access, visual impacts, impacts on public use of the shoreline, litter control, and harvest methods. The pier and dock amendments address impacts to navigation, limit visual impacts, define float lifts, and prohibit covered docks, piers, and floats/float lifts in all shoreline environments. The adopted amendments will be superseded by new regulations adopted through the comprehensive SMP update.
June 2009 Page 8-9

Pierce County Shoreline Inventory and Characterization Report
8.2.3 Flood Management and Habitat Restoration
Conflicts may exist in Pierce County along shorelines which are regulated by various state and federal agencies with different mandates related to flood management and habitat restoration. For example, levee setbacks along rivers can address multiple flood management and habitat goals, but levee protection issues conflict with ecological protection/restoration. A prime example of this is the US Army Corps of Engineers requirements and guidelines for levee maintenance, which dictate that trees shall be removed from levees so as not to compromise the structures for flood certification. In the case of approximately eight miles of the lower Puyallup River system owned by the Puyallup Tribe of Indians, there is a vegetation retention requirement that is mandated by a separate federal agreement.
8.2.4 Permit Exemptions and Cumulative Impacts
A number of uses and activities are designated by the SMA as being exempt from the requirement to obtain a Shoreline Substantial Development Permit (WAC 173-27-040), but nonetheless have adverse impacts to shoreline ecological functions. For example, single-family residential use is treated as a priority use in the Act. Homes and bulkheads are exempt from permitting. Cumulative effects of bulkheads are known to be major impact to nearshore habitat in Puget Sound. Similar issues are related to docks and piers. These activities are not exempt from the requirement to be reviewed for consistency with the SMP as part of another permit process (e.g., county building permit; Hydraulic Project Approval (HPA), etc.).
The Puget Sound Partnership Action Agenda (Puget Sound Partnership 2009) is a strategy for cleaning up, restoring, and protecting Puget Sound by 2020. The Action Agenda outlines the current health of Puget Sound, identifies threats to a healthy Sound, and identifies priorities and strategies for meeting the goal of restoring Puget Sound by 2020. The Action Agenda notes that alteration of nearshore habitat through the localized construction of bulkheads and docks, in a cumulative fashion, can threaten broad components of the Puget Sound ecosystem. One of the highest ranking priority actions identified in the Action Agenda relates to amending the Shoreline Management Act to elevate the regulatory requirements for these types of activities and development. It states:
Priority Ranking A.6. (Action Number A.2.(7)): Change Shoreline Management Act statues and regulations to require a shoreline conditional use permit for: bulkheads and docks associated with all residential development; all new and replacement shoreline hardening; all seawall/bulkhead/revetment repair projects; and new docks and piers. (Puget Sound Partnership 2009).
If implemented, this change would not alter the fact that residential uses are considered a priority use in the SMA, but it would create a significantly higher level of regulatory review for alterations of the shoreline associated with residential development. A transition from being considered “exempt” from permitting to requiring a shoreline conditional use permit would require Department of Ecology approval of every bulkhead, dock, or shoreline armoring project and would allow Ecology and Pierce County to place conditions on approving such alterations.
Page 8-10 June 2009

Pierce County Shoreline Inventory and Characterization Report
June 2009 Page 8-11
8.2.5 Energy Development and Marine Habitat Quality
Tidal energy is a new developing source of clean energy in Washington State. Several pilot projects are underway to test the viability of tidal energy in Puget Sound. One proposed project in the Tacoma Narrows that is currently being studied by Tacoma Power involves a turbine submerged in the Narrows off of Point Defiance. Little is known about the potential impacts of tidal energy projects to marine mammals and marine habitats.

Pierce County Shoreline Inventory and Characterization Report
CHAPTER 9 SUMMARY AND RECOMMENDATIONS
Pierce County is updating its existing Shoreline Master Program (SMP) to comply with the Washington State Shoreline Management Act (SMA) requirements (Revised Code of Washington [RCW] 90.58), and its implementing guidelines (Washington Administrative Code [WAC] 173-26, Part III), which were adopted in 2003. The County’s SMP includes policies and regulations for managing all fresh and saltwater shorelines of the state in unincorporated Pierce County, Washington. This inventory report provides background information to be used in updating the existing program including goals, policies, and regulations for shoreline management.
The purpose of this inventory report is to describe current shoreline conditions and characterize the ecosystem processes (also referred to as watershed processes) that shape and influence shoreline environments. As described in the state shoreline guidelines (see WAC 173-26-201(3)), the shoreline inventory and analysis are the first two steps in the multi-step SMP update process required for local jurisdictions in Washington. The other required steps are: 1) invite and encourage public participation in the development of shoreline goals and policies; 2) establish shoreline environment designations (SEDs); 3) establish shoreline goals and policies; and 4) develop shoreline regulations.
The County is in the process of completing all of the required steps in accordance with the terms and conditions of a grant agreement (Grant# G0000007) with the Washington State Department of Ecology (Ecology). This report describes the inventory and analysis undertaken for Pierce County as required in Tasks 4, 5 and 6 of the grant agreement.
9.1 Summary of Pierce County Shorelines
The inventory and characterization has resulted in the identification of approximately 700 miles of shoreline within Pierce County, Washington. These areas are considered either “shorelines of statewide significance” or “shorelines of the state” as defined by the Washington Administrative Code. The identification of shorelines in Pierce County is based upon the best available technical information. No field inventories were conducted as part of the 2007 shoreline inventory; all analyses relied upon existing literature, aerial photography, relevant studies, or other documentation.
Chapter 1 of this report summarized the purpose of this study and the WAC requirements. Methodologies for identifying and designating shorelines and shoreline reaches are described in detail in Chapter 2. Ecosystem-wide processes and shoreline functions have been evaluated by WRIA and sub-basin as part of this inventory and analysis; the results of this evaluation are summarized in Chapter 3. Chapters 4 through 7 provide the reach-scale analysis by watershed for WRIAs 10, 11, 12, and 15, respectively. A general shoreline use analysis is provided in Chapter 8. Appendices to this report include detailed tables which summarize the reach scale data and GIS information.
Shorelines identified, inventoried and analyzed in this document for Pierce County are summarized in Table 9-1.
June 2009 Page 9-1

Pierce County Shoreline Inventory and Characterization Report
Table 9-1. Shorelines identified in Pierce County, Washington
Type of Shoreline
Number of Shoreline
Waterbodies / Management
Units (MU)
Number of Reaches
Inventoried
Total Shoreline Miles in the
County
% of Total Shoreline Miles
in Pierce County
Marine/nearshore 7 MU 46 180 26 % Freshwater – Rivers and Streams
70 rivers 137 375 53%
Freshwater – Lakes and Reservoirs
40 lakes 47 145 21%
Freshwater, subtotal 110 rivers and lakes
184 520 74%
Grand Total 230 700 100%
Approximately 181 miles of new shoreline have been added to the Pierce County list of designated shorelines of the state during this 2007 shoreline inventory and analysis. This includes 103 additional miles of shoreline on waterbodies currently regulated by Pierce County in its SMP and 78 miles of shoreline on newly identified waterbodies. The majority of the newly identified waterbodies are within the upper reaches of streams and rivers in WRIA 10 (Puyallup/White River), which currently lie outside of the County’s jurisdiction in the Mt. Baker- Snoqualmie National Forest. These tributaries have been included in the inventory to determine a baseline for shoreline conditions in the National Forest should any of these areas be privatized in the future.
Marine shorelines around McNeil Island (+12.7 miles) are considered part of the 103 additional miles of shorelines added to the nearshore inventory of WRIA 15. On the other hand, marine shoreline miles were reduced (-3.4 miles) due to annexation of marine shoreline areas in the cities of Lakewood, University Place and Tacoma. For example, the Thea Foss Waterway is now fully within the City of Tacoma and is no longer included in the County’s shoreline inventory. Table 9-2 describes the number, type and length of new waterbodies identified as shorelines of the state in Pierce County by WRIA.
Page 9-2 June 2009

Pierce County Shoreline Inventory and Characterization Report
Table 9-2. Waterbodies newly identified as shorelines in Pierce County, Washington
Water Resources Inventory Area (WRIA)
Number of Newly Identified Waterbodies
Shoreline Miles for New Waterbodies
10 31 (Total) 27 – Rivers / streams 4 – Lakes
64.1 (miles) 52.6 – Rivers / streams 11.5 – Lakes
11 11 (Total) 4 – Rivers / streams 7 – Lakes
10.9 (miles) 4.3 – Rivers / streams 6.6 – Lakes
12 None None 15 2 (Total)
0 – Rivers / streams 2 – Lakes
2.8 (Total) 0 – Rivers / streams 2.8 – Lakes
Total 44 78 miles
9.2 Watershed Analysis Summary
9.2.1 Puyallup/White River Watershed (WRIA 10)
In the Puyallup/White River Watershed (WRIA 10), 58 shorelines, including marine areas, rivers and lakes, were inventoried and characterized with a total of approximately 352 shoreline miles. WRIA 10 contains the greatest number of shoreline waterbodies and shoreline linear miles of any watershed in Pierce County. Based upon shoreline linear distance, this watershed contains 49 percent of all of the County’s shorelines. The majority of the County’s shorelines in WRIA 10 are freshwater rivers and streams.
WRIA 10 contains the entire length of the Puyallup River, including both banks, with the exception of small river sections in incorporated areas such as the cities of Puyallup, Sumner and Tacoma. Forty seven rivers and streams meet the definition of “shorelines of the state” and are tributaries flowing into the Puyallup River and the White River in this watershed. Lake Tapps, the largest lake in Pierce County and man-made reservoir, is a shoreline of statewide significance, encompassing approximately 48 miles of lakeshore. Results of the inventory and analysis are presented by waterbody or marine management unit in Chapter 4 of this report.
June 2009 Page 9-3

Pierce County Shoreline Inventory and Characterization Report
Table 9-3. Shorelines inventoried in the Puyallup/White River Watershed
Type of Shoreline Number of
Shorelines or Management Units
Shoreline Miles in
Watershed
Number of Reaches
Inventoried
Marine 1 (Dash Point / Brown’s Point)
3.2 1
Freshwater – Rivers and Streams
49 rivers 266 92
Freshwater – Lakes and Reservoirs
8 lakes 73.3 15
Freshwater, subtotal 57 340 107 Total 58 343 108
Major alterations within the Puyallup/White River watershed include Mud Mountain Dam on the White River, levees along the majority of the Puyallup River, water diversions for Lake Tapps, alterations to the landscape due to timber harvest in the upper watershed, agriculture, and urban development with associated infrastructure in the lower watershed. Flow modifications related to the management of Mud Mountain Dam and the Puget Sound Energy flow diversion from the White River to Lake Tapps have impaired in-stream habitats for fish within the river. Sedimentation within the Puyallup River has resulted in an increasing risk of flooding along the river within the county. Historical alterations in the Puyallup River delta have occurred resulting in loss of wetlands and estuarine habitat within Commencement Bay in Tacoma.
Despite alterations and modifications within the Puyallup/White River watershed (WRIA 10), the rivers provide significant habitat to salmonids and the watershed includes some of the most productive rivers for listed anadromous fisheries. South Prairie Creek is one of the most productive streams in the county and supports significant spawning habitat for anadromous fisheries.
Restoration opportunities are being pursued at the watershed level by Pierce County, the lead entity for WRIAs 10 and 12 (Pierce County, April 2008). Goals for restoration in the Puyallup and White Rivers include levee setbacks to reconnect floodplains and allow for flood storage and off-channel habitat, etc.
Restoration priorities include:
• Acquisition and restoration of riverine and estuarine floodplain corridors;
• Restoration of flows in the diversion reach of the Lower White River;
• Restoration of spring Chinook population and strategies by the Muckleshoot and Puyallup Tribes;
Page 9-4 June 2009

Pierce County Shoreline Inventory and Characterization Report
• Estuary restoration, including development of a Puyallup River estuary ecosystem restoration action plan;
• Feasibility study of river floodplain restoration and levee setbacks; and
• Adaptive management framework.
Puyallup River priorities were developed by Pierce County as the Lead Entity in Salmonid recovery using the EDT modeling data for the County (Pierce County March 2008). Based upon this data and fish counts, it is clear that South Prairie Creek is the most productive tributary of the Puyallup River and protection of habitat in South Prairie is a high priority strategy for the Puyallup river watershed and its fishery. Also, increasing habitat diversity (pools and off-channel habitat), channel stability and key habitat quantity are high priority strategies for the rest of the Puyallup river system. This is most important in the lower parts of the system from Orting downstream. The habitat degradation and hydrologic modifications in the Puyallup and White Rivers are all related to the levee system, including loss of LWD and riparian habitat.
White River priorities include protection of important tributaries that all support salmonid habitat and productivity. The important tributaries within Pierce County jurisdiction include Clearwater Creek, Greenwater Creek, Huckleberry Creek and West Fork White River. Restoration in the White also includes flow management at Mud Mountain Dam and the PSE water diversion to Lake Tapps to simulate a more natural flow regime. Levee setback projects, placement of LWD and estuary restoration are also targeted to restore shorelines and salmonid habitat within the White River. Control of sediment sources and improvement to riparian conditions is a priority for the important tributaries on the White River.
9.2.2 Nisqually River Watershed (WRIA 11)
In the Nisqually River (WRIA 11), a total of 38 shoreline areas representing approximately 150 miles of shoreline, including marine nearshore, rivers and lakes, were identified and characterized. The Nisqually River watershed contains the north riverbank of the Nisqually River and the greatest number of shoreline lakes of any watershed in Pierce County. Based upon shoreline miles, this watershed contains 21.4 percent of the County’s shoreline areas. Twenty one lakes over 20 acres are found in the watershed. Much of this watershed is undeveloped and in good condition, providing excellent habitat for critical fish and wildlife. Inventory results are summarized by waterbody or marine management unit in Chapter 5.
June 2009 Page 9-5

Pierce County Shoreline Inventory and Characterization Report
Table 9-4. Shorelines inventoried in the Nisqually River Watershed
Type of Shoreline Number of
Shorelines / Management Units
Shoreline Miles in
Watershed
Number of Reaches
Inventoried
Marine 1 (Nisqually Reach) 2.1 1 Freshwater – Rivers and Streams
16 98 40
Freshwater – Lakes and Reservoirs
21 50 21
Freshwater, subtotal 37 148 61 Total 38 150 62
Major alterations and impairments within the Nisqually River watershed include two hydro-electric dams on the Nisqually River, the presence of levees, agricultural land uses along tributaries and lakes in the watershed, and alterations to the landscape due to timber harvest and a high density of forest roads in the upper watershed. The Nisqually River is the least altered of all watersheds within Pierce County, Washington.
9.2.3 Chambers/Clover Creek Watershed (WRIA 12)
In the Chambers/Clover Creek Watershed (WRIA 12), five (5) rivers and lakes with a total of 16 miles of shoreline were identified and characterized. This watershed, the smallest in Pierce County, contains 2.3 percent of the County’s shorelines of the state. Marine shoreline areas previously regulated by Pierce County in this watershed have since been incorporated into Lakewood and University Place. No nearshore marine shorelines are now identified in Pierce County jurisdiction within WRIA 12. As noted above in Table 9-3, new shorelines have not been added as a result of this inventory within this watershed. All areas are currently identified and regulated within the Pierce County SMP. Inventory results for WRIA 12 are summarized by waterbody in Chapter 6.
Table 9-5. Shorelines inventoried in the Chambers/Clover Creek Watershed
Type of Shoreline Number of Shorelines /
Management Units
Shoreline Miles in
Watershed
Number of Reaches
Inventoried
Marine - - - Freshwater – Rivers and Streams
3 6.2 3
Freshwater – Lakes and Reservoirs
2 9.6 2
Freshwater, subtotal 5 16 5 Total 5 16 5
Page 9-6 June 2009

Pierce County Shoreline Inventory and Characterization Report
Alterations to this watershed are related to urban development and stormwater runoff. Alterations include infrastructure which has altered the natural hydrology of streams, stormwater runoff affecting water quality and summer low flows, and removal of native vegetation within the riparian zone.
According to Pierce County Lead Entity (March 2008), restoration actions for shorelines in the Chambers and Clover Creek watershed include:
• Flow restoration in dewatered reaches (Clover Creek);
• LWD placement;
• Acquisition of riparian corridors and restoration of riparian habitat;
• Channel reconstruction;
• Fish passage barrier removal; and
• Regional stormwater detention (and water quality improvement).
The highest priority restoration for WRIA 12 is restoring the mainstem of Clover Creek above Steilacoom Lake (Pierce County Lead Entity, 2008). Restoration is focused on restoring flow regimes, habitat complexity, LWD and removal of fish passage barriers in Clover Creek. Further, habitat enhancements along the lower four miles of Chambers Creek should be included. Also, the continued focus on improvements in water quality within the creeks and lakes in WRIA 12 will serve to restore habitat in these shorelines.
The preliminary results from the WRIA 11 and 12 Nearshore Assessment project (see SPSSEG web page) indicate that restoration in the WRIA 12 shoreline includes Chambers Bay property and Sequalitchew Creek. These and other nearshore areas within WRIA 12 do not lie within Pierce County’s shoreline jurisdiction and therefore will not be affected by the County’s shoreline program or regulations.
9.2.4 Kitsap Peninsula Watershed (WRIA 15)
The Kitsap Peninsula Watershed includes marine and freshwater shorelines on Gig Harbor Peninsula, Key Peninsula, and several islands including Fox, Anderson, McNeil, Ketron, Herron, Raft, Tanglewood, and several smaller islands. The watershed includes marine shorelines within unincorporated Pierce County along Tacoma Narrows, Gig Harbor Bay, Colvos Passage, Carr Inlet, Henderson Bay, Hale Passage, and Case Inlet. Marine shorelines, rivers and lakes for WRIA 15 are summarized in Table 9-6. A total of 192 miles of shoreline were identified in this watershed. Based upon shoreline length, WRIA 15 contains 27 percent of Pierce County’s shoreline resources. The majority of shorelines in this watershed are marine nearshore areas, which are currently regulated by Pierce County through its existing SMP. Only two short sections of streams are included in this inventory. Very few streams meet the shoreline definition due to the shorter length and lower flows of rivers and streams on the Kitsap Peninsula. Inventory results for shorelines in WRIA 15 are provided by waterbody in Chapter 7. McNeil Island, a former federal corrections facility, has now been transferred to the state and is
June 2009 Page 9-7

Pierce County Shoreline Inventory and Characterization Report
referred to as the McNeil Island Corrections Center. This island and its shorelines will be regulated under Pierce County jurisdiction and are therefore identified in the 2007 shoreline inventory.
Table 9-6. Shorelines inventoried in Kitsap Peninsula Watershed (WRIA 15)
Type of Shoreline Number of
Shorelines / Management
Units
Shoreline Miles in Watershed
Number of Reaches
Inventoried
Marine 5 176 44 Freshwater – Rivers and Streams
2 1.6 2
Freshwater – Lakes and Reservoirs
9 14 9
Freshwater, subtotal 11 16 11 Total 16 192 55
The major alterations to the Kitsap Peninsula are related to marine and nearshore development, largely associated with residential land uses. Natural net-shore drift of sediments is interrupted by bulkheads and hardened shorelines. Coastal feeder bluffs stabilized at the toe can no longer provide a sediment source to the nearshore environment. Removal of riparian vegetation results in a reduction of large woody debris. Stormwater runoff from urban areas degrades water quality in the Puget Sound.
Restoration opportunities in WRIA 15 include both protection of existing shoreline functions and restoration of impaired functions. Many of the restoration measures for the Kitsap Peninsula are the same as those developed by the Puget Sound Partnership in its Action Agenda for the Puget Sound (PSP, 2008). These include:
• Protection of marine water quality through treatment of urban runoff;
• Protection of coastal feeder bluffs to support natural sediment delivery;
• Preserve high quality ecological habitats in the marine nearshore environment;
• Preservation of marine riparian vegetation for species habitat and to allow for LWD recruitment;
• Protection of forage fish spawning areas and eelgrass beds;
• Removal of derelict structures in the nearshore environment and restoration of degraded in-water habitats; and
Page 9-8 June 2009

Pierce County Shoreline Inventory and Characterization Report
• Restoration of specific transitional habitats such as pocket estuaries and estuarine wetlands.
9.3 Reach Scale Analysis Summary
All available technical and scientific information was used to characterize and analyze the 230 shoreline reaches designated within Pierce County. The reach-scale analysis is required as part of the shoreline inventory in order to assist the County in determining shoreline environment designations and provide technical information in support of the development of goals, policies and regulations. The reach-scale analysis relies upon Pierce County GIS data, aerial photographs, Ecology shorezone information, Ecology shoreline photographs and other data referenced in Appendix A (data sources). Reach-scale information is provided in tables within the appendices to this report and is summarized by waterbody within Chapters 4, 5, 6 and 7 for the WRIAs 10, 11, 12 and 15, respectively.
Reach scale information has also been graphically provided in a DVD that accompanies this report. The DVD provides an Adobe Acrobat based, desk-top version of the Pierce County GIS data and other data used to analyze the shorelines reaches. Over 80 data layers, including the shoreline planning areas and reach names, are illustrated in this desk-top version of the GIS maps used. The County’s SMP update will include the final shoreline reaches (and important information developed through the SMP process) in the Pierce County Public GIS information. The desktop GIS version is an interim product to assist the STG and SCAC with review of the program and development of the Draft SMP goals, policies and regulations.
9.3.1 Puyallup/White River Watershed (WRIA 10)
Reach scale analysis indicates the following alterations and impairments at the reach-scale level:
• Presence of levees and hardened shorelines especially on the Puyallup River and the lower White River;
• Presence of culverts or other fish passage barriers on tributaries;
• Development or infrastructure (i.e. bridges, roads, etc.) is found within the 200 foot shoreline jurisdiction;
• Development is found within the floodplain and limits channel migration or connectivity of associated wetlands;
• Associated wetlands have been altered or filled in river valleys;
• Residential docks, piers and boat ramps on lakes, especially on Lake Tapps; and
• In some areas there is an overall lack of native trees in the riparian zone thereby limiting LWD recruitment. In the lower watershed, trees are lacking due to development. In the upper watershed, trees have been removed through timber harvest.
June 2009 Page 9-9

Pierce County Shoreline Inventory and Characterization Report
9.3.2 Nisqually River Watershed (WRIA 11)
The reach-scale analysis for the Nisqually River watershed indicates that the following alterations and impairments are present at the reach level:
• Presence of levee and hardened shorelines;
• Presence of culverts or other fish passage barriers on tributaries to the Nisqually River;
• Residential docks, piers and boat ramps on many of the developed lakes in the watershed;
• Agricultural practices have ditched or drained wetlands associated with shoreline rivers or undeveloped lakes;
• Development or infrastructure (i.e. bridges, roads, etc.) is found within the 200 foot shoreline jurisdiction;
• Associated wetlands are degraded due to agricultural practices, especially for certain lakes; and
• In some areas there is an overall lack of native trees in the riparian zone thereby limiting LWD recruitment and habitat due to agricultural practices and timber harvest.
9.3.3 Chambers/Clover Creek Watershed (WRIA 12)
The reach-scale analysis for the Chambers and Clover Creek watershed indicates that the following alterations and impairments are present at the reach level:
• Presence of bulkheads, concrete stream lining, and hardened shorelines;
• Presence of culverts or other fish passage barriers;
• Residential docks, piers and boat ramps on lakes especially American Lake and Spanaway Lake;
• Development or infrastructure (i.e. bridges, roads, etc.) is found within the 200 foot shoreline jurisdiction;
• Associated wetlands are degraded; and
• There is an overall lack of native trees in the riparian zone thereby limiting LWD recruitment and habitat.
9.3.4 Kitsap Peninsula Watershed (WRIA 15)
The reach-scale analysis for the Kitsap Peninsula watershed indicates that the following alterations and impairments are present at the reach level:
Page 9-10 June 2009

Pierce County Shoreline Inventory and Characterization Report
• Presence of bulkheads and hardened shorelines in marine nearshore areas (i.e., Gig Harbor Bay, Fox Island);
• Presence of bulkheads on lake shores within WRIA 15 (i.e., Minterwood Lake, Lake Josephine on Anderson Island);
• Presence of culverts or other fish passage barriers on tributaries to the Puget Sound;
• Loss of estuarine wetlands and saltwater marshes;
• Residential docks, piers, boat ramps and launches on many of the developed shorelines, especially Fox Island, Horsehead Bay, and Wollochet Bay;
• Dredging for marinas and ferries;
• Agricultural practices have ditched or drained associated wetlands (i.e., Anderson Island);
• Development or infrastructure (ie. bridges, roads, etc.) is found within the 200 foot shoreline jurisdiction; and
• In some areas there is an overall lack of native trees in the riparian zone thereby limiting LWD recruitment and habitat.
9.4 Management Recommendations
Based upon this inventory and characterization, several preliminary management recommendations have been developed for the Pierce County shorelines. These are broad recommendations which apply to future management decisions for marine and freshwater shorelines of the state in the County including the development of shoreline environment designations, goals and policies, and shoreline regulations. Management recommendations coming out of this inventory are:
• Marine shorelines with special features such as high-value coastal feeder bluffs, mature riparian habitat, or prior designation as “Critical Marine Habitat Conservation Areas” by Pierce County should be preserved in an unaltered condition and considered for the Natural Environment designation;
• Rivers with high-value for salmonid habitat and demonstrated use by multiple salmonid species (determined by EDT Modeling) should be preserved in an unaltered condition and considered for the Natural Environment designation;
• Lakes that support high-value habitat or associated wetlands that are considered Category I wetlands in Pierce County should be preserved in an unaltered condition and considered for the Natural Environment designation;
June 2009 Page 9-11

Pierce County Shoreline Inventory and Characterization Report
Page 9-12 June 2009
• Continue to include the floodplain area within the shoreline jurisdiction of Pierce County as per the current County SMP;
• The County should continue to partner with the Nisqually Tribe, the Puyallup Tribe, the City of Tacoma and other stakeholders to encourage restoration of river deltas and estuarine habitat at the mouths of the Nisqually and the Puyallup Rivers;
• New development in the shoreline should comply with both vegetation conservation measures and recommended setbacks and buffers from the OWHM;
• New development should be conditioned to provide an analysis of impacts to shoreline functions during permit approval;
• Stormwater runoff threatens water quality in Puget Sound (PSP, 2008) Efforts should be made to retrofit existing stormwater management facilities to improve water quality and require low impact development strategies or higher levels of water quality improvement for new development with Pierce County. Water pollution should be prevented at its source (PSP, 2008);
• Consider joint-use docks prior to construction of single-use residential docks to minimize dock proliferation;
• Regulations should encourage and facilitate levee setback projects and other shoreline enhancement projects;
• Restoration should focus on floodplain reconnection where rivers are confined by levees;
• Require soft-shore armoring techniques where new armoring or retrofits cannot be avoided;
• Protect forage fish spawning areas and eelgrass beds within the marine nearshore;
• Prevent the introduction of non-native invasive species and allow for their rapid eradication; and
• Build an implementation, monitoring and adaptive management plan at the County level in order to track changes in the shoreline jurisdiction and determine successes, failures and corrective actions (PSP, 2008).

Pierce County Shoreline Inventory and Characterization Report
CHAPTER 10 REFERENCES
Abbe, T.B. and D.R. Montgomery. 1996. Large woody debris jams, channel hydraulics and habitat formation in large rivers. Regulated Rivers: Research & Management, v. 12, p. 201-221.
Addy, K.L., A.J. Gold, P.M. Groffman, and P.A. Jacinthe. 1999. Ground water nitrate removal in subsoil of forested and mowed riparian buffer zones. Journal of Environmental Quality, v. 28, n. 3, p. 962-970.
Adolfson Associates, Inc. City of Gig Harbor wetland inventory.
Adolfson Associates, Inc. 2006a. Draft Tacoma Shoreline Inventory and Characterization. Prepared for City of Tacoma.
Adolfson Associates, Inc. 2006b. Final Environmental Evaluation: Temporary Discharge of Secondary Effluent to the Puyallup River. Prepared for Montgomery Watson Harza and City of Tacoma Department of Public Works. June 2006.
Albertson et al. 2002. South Puget Sound Water Quality Study. Washington State Department of Ecology Environmental Assessment Program, Olympia, Washington, Publication #02-03-021, Available: http://www.ecy.wa.gov/biblio/0203021.html
Anchor Environmental and People for Puget Sound. 2002. Final Report Northwest Straits Nearshore Habitat Evaluation. Available: http://www.biomes.net/finalnwscreport
Atwater, T.M. 1989. Plate tectonic history of the northeast Pacific and western North America. Pp. 21-72 in The geology of North America v. N; The northeastern Pacific Ocean and Hawaii, E.L. Winterer, D.M. Hussong, and R.W. Decker (eds.). Boulder, CO: Geological Society of America.
Bahls, P., C. Kindberg, M. Wait, J. Glasgow. 2006. An Assessment of Error in State Shoreline Designation for Lakes in Washington. Northwest Watershed Institute and Washington Trout. August, 2006.
Bargmann, G. 1998. Forage fish management plan. Washington Department of Fish and Wildlife, Olympia, Washington.
Bauer, H.H. and M.C. Mastin. 1997. Water-Resources Investigations Report Number 96-4219: Recharge from precipitation in three small glacial-till-mantled catchments in the Puget Sound Lowland, Washington.
Beamer, E.R., Henderson, A, McBride and K.W. Wolf. 2003. The importance of nonnatal pocket estuaries in Skagit Bay to wild Chinook salmon: an emerging priority for restoration. Skagit System Cooperative, Research Department, La Connor, Washington 10p.
June 2009 Page 10-1

Pierce County Shoreline Inventory and Characterization Report
Bell, S.S., M.S. Fonseca, and N.B. Stafford. 2006. Seagrass ecology: new contributions from a landscape perspective. In, Larkum, A. W. D., R. J. Orth, and C. M. Duarte (eds.), Seagrasses: Biology, Ecology, and Conservation. Pages 625-645. Springer, Dordrecht, The Netherlands.
Berger, A. and K. Williamson. 2005. Puyallup River Juvenile Salmonid Production Assessment Project 2004. Puyallup Tribal Fisheries Department.
Berry, H. D., A. T. Sewell, S. Wyllie-Echeverria, B. R. reeves, T. F. Mumford, Jr., J. R. Skalski, R. C. Zimmerman and J. Archer. 2003. Puget Sound submerged vegetation monitoring project: 2000-2003 Monitoring Report. Nearshore Habitat Program, Aquatic Resources Division, Washington State Department of Natural Resources, Olympia, WA.
Bisson, P.A., R.E. Bilby, M.D. Bryant, C.A. Dolloff, G.B. Grette, R.A. House, M.L. Murphy, K.V. Koski, and J.R. Sedell. 1987. Large woody debris in forested streams in the Pacific Northwest: Past, present, and future. Pp. 143-190 in: Streamside management: forestry and fishery interactions. E. O. Salo and T. W. Cundy (eds.), Seattle, WA: University of Washington, Institute of Forest Resources, Contribution No. 57.
Blaylock. B. 2006. City of Tacoma – Central Wastewater Treatment Plant Preliminary Evaluation of Puyallup River Discharge Impacts to the Side Channel Habitat Restoration Sites. Memorandum to City of Tacoma, January 12, 2006.
Booth, D. B. 1991. Urbanization and the Natural Drainage System – Impacts, Solutions, and Prognoses. Northwest Environmental Journal, v. 7, p. 93-118.
Booth, D.B. 1994. Glaciofluvial infilling and scour of the Puget Lowland, Washington, during ice-sheet glaciation: Geology, v. 22, n. 8, p. 695-698.
Booth, D.B. and C. R. Jackson. 1997. Journal of the American Water Resources Association. Urbanization of aquatic systems: degradation thresholds, stormwater detection, and the limits of mitigation.
Booth, D.B., D. Hartley, and C.R. Jackson. 2002. Forest Cover, Impervious-Surface Area, and the Mitigation of Stormwater Impacts.” Journal of the American Water Resources Association. 38: 835-845.
Booth, D.B., H.H. Waldron, and K.G. Troost. 2001. Geologic map of the Poverty Bay 7.5-minute quadrangle, Washington: U.S. Geological Survey, Open-File Report, scale 1:24,000.
Booth, D.B., K.G. Troost, and J.T. Hagstrum. 2004. Deformation of Quaternary strata and its relationship to crustal folds and faults, south-central Puget Lowland, Washington State: Geology, v. 32, n. 6, p. 505-508.
Page 10-2 June 2009

Pierce County Shoreline Inventory and Characterization Report
Borden, R.K. and K.G. Troost. 2001. Late Pleistocene stratigraphy in the south-central Puget Lowland, Pierce County, Washington: Olympia, WA, Washington State Dept. of Natural Resources.
Bortleson, G.C. M.J. Chrzastowski, and A.K. Helgerson. 1980. Historical change of shoreline and wetland at eleven major deltas in the Puget Sound region, Washington. U.S. Geological Survey, Hydrologic Investigations Atlas HA-617. USGS Washington DC.
Bottom, D.L., C.A. Simenstad, A.M. Baptista, D.A. Jay, J. Burke, K.K. Jones, E. Casillas, and M.H. Schiewe. 2001. Salmon at River’s end: The role of the estuary in the decline and recovery of Columbia River Salmon. Draft Report, National Marine Fisheries Service.
Brennan, J. and H. Culverwell. 2004. Marine Riparian: An Assessment of Riparian Functions in Marine Ecosystems. Seattle, WA: Washington Sea Grant, University of Washington Press.
Brinson, M.M. 1993. A hydrogeomorphic classification for wetlands. Technical Report WRP-DE-4. Vicksburg, MS, U.S. Army Corps of Engineers, Waterways Experiment Station.
Brinson, M.M., F.R. Hauer, L.C. Lee, W.L. Nutter, R.D. Rheinhardt, R.D. Smith, and D. Whigham. 1995. A guidebook for application of hydrogeomorphic assessments to riverine wetlands. Technical Report WRP-DE-11, Vicksburg, MS, U.S. Army Corps of Engineers, Waterways Experiment Station.
Brocher, T.M., R.J. Blakely, and R.E. Wells. 2004. Interpretation of the Seattle uplift, Washington, as a passive-roof duplex: Bulletin of the Seismological Society of America, v. 94, n. 4, p. 1379-1401.
Brooks, K., K.M. Dvornich, M. Tirhi, E. Neatherlin, M. McCalmon, and J. Jacobsen. 2004. Pierce County Biodiversity Network Assessment: August, 2004. Report to Pierce County Council, Pierce County, 146 pp.
Brown, G.W. 1969. Predicting temperatures of small streams. Water Resources Research, v. 5, p. 68-75.
Brown and Caldwell. 2008. South Prairie Creek Monitoring Data Evaluation Technical Memorandum. Prepared for Pierce County. January 14, 2008.
Bruun, P. 1962. Sea-level rise as a cause of shore erosion. Journal Waterways and Harbors Division, v. 88, n. 1-3, p. 117.
Buchanan, J. B. 2006. Nearshore Birds in Puget Sound. Prepared for the Puget Sound Nearshore Partnership. Technical Report 2006-05. November 2006.
June 2009 Page 10-3

Pierce County Shoreline Inventory and Characterization Report
Buchanan-Banks, J.M. and D.S. Collins. 1994. Map showing depth to bedrock of the Tacoma and part of the Centralia 30’ x 60’ quadrangles, Washington: U.S. Geological Survey Miscellaneous Field Studies Map MF-2265, scale 1:100,000.
Bulthuis, D. A. 1994. Distribution of seagrasses in a North Puget Sound estuary: Padilla Bay, Washington, USA. Aquatic Botany 50:99-105.
Canning, D.J., R.W. Wisseman, and S. F. Cook. 1976. Wapato Lake, an environmental study on the effects of urbanization: final report to the Washington State Department of Ecology. Available: University of Washington, Suzallo/Allen Stacks, GB1625.W2 C3.
Cannon, G.A. 1983. An overview of circulation in the Puget Sound Estuarine System. NOAA technical Memorandum ERL PMEL-48. Pacific Marine Environmental Laboratory.
Cascade Land Conservancy. Undated. South Prairie Creek. Available: http://www.cascadeland.org/conservation-program/gallery/south-prarie-creek. Accessed January 2009.
Chambers-Clover Creek Watershed Council (CCCWC). 2007. Watershed Action Agenda: Priorities for Focus within the Chambers-Clover Creek Watershed, 2007 through 2011. July 2007.
Chatwin, S.C., et al. 1991. A Guide to Management of Landslide-Prone Terrain in the Pacific Northwest. Land Management Handbook Number 18, B.C. Ministry of Forests, Victoria, B.C., Canada.
Chu, Y.H. 1985. Beach erosion and protection: a case study at Lincoln Park, Seattle: Shore and Beach, n. 53, p. 26-32.
City of Tacoma Environmental Services Division, Wastewater and Surface Water Management Department. 2003. Surface Water Management Manual. Available: http://www.cityoftacoma.org/Page.aspx?hid=951#manual
City of Tacoma. 1996. City of Tacoma Shoreline Master Plan.
City of Tacoma. 2000. Recreation and Open Space Plan. Available: http://www.cityoftacoma.org/Page.aspx?cid=2241.
City of Tacoma. 2005. Comprehensive Plan. Available: http://www.cityoftacoma.org/Page.aspx?cid=2241.
Climate Impacts Group. 2008. Climate change web page. Available: http://cses.washington.edu/cig/pnwc/cc.shtml. Last updated March 2008. University of Washington Climate Impacts Group.
Page 10-4 June 2009

Pierce County Shoreline Inventory and Characterization Report
Climate Impacts Group. 2009. The Washington Climate Change Impacts Assessment. University of Washington Climate Impacts Group. Available: http://cses.washington.edu/cig/res/ia/waccia.shtml.
Coleman, J.M. 1976. Deltas: Processes of Deposition and Models for Exploration. Champagne, IL: Continuing Education Publication Company, Inc., 102 p.
Collins, B.D. and A.J. Sheikh. 2004. Historical aquatic habitats in the White River Valley, RM 5 – RM 28, King County, Washington. Available: http://riverhistory.ess.washington.edu/project_reports/screen_white_hab_022305.pdf
Collins, B.D. and A.J. Sheikh. 2005. Historic reconstruction, classification, and change analysis of Puget Sound tidal marshes. Project Completion Report to Washington Department of Natural Resources, Aquatic Resources Division, Olympia, Washington. Available: http://riverhistory.ess.washington.edu/research/tidal_marshes.php
Collins, B.D. and D.R. Montgomery. 2002. Forest Development, Wood Jams, and Restoration of Floodplain Rivers in the Puget Lowland, Washington. Restoration Ecology, v. 10, n. 2, p. 237-247.
Collins, B.D., D.R. Montgomery and A.D. Haas. 2002. Historical changes in the distribution and functions of large wood in Puget Lowland Rivers. Canadian Journal of Fisheries and Aquatic Sciences, v. 59, p. 66-76.
Collins, B.D., D.R. Montgomery, and A.J. Sheikh. 2003. Reconstructing the historical riverine landscape of the Puget Lowland. Pp. 79 – 128 in Restoration of Puget Sound Rivers, D.R. Montgomery, S.M. Bolton, D.B. Booth, and L. Wall (eds.), Seattle, WA: University of Washington Press.
Commencement Bay Natural Resource Trustees (CBNRT). 1997. Commencement Bay Natural Resource Restoration Plan. Available: http://www.darrp.noaa.gov/pacific/cbay/pdf/restplan.pdf
Cooper, N.J. 2003. The Use of Managed Retreat in Coastal Engineering. Proceedings of the Institution of Civil Engineers, Engineering Sustainability 156, June 2003, Issue ES2, p. 101-110.
Crandell, D.R. 1961. Surficial geology of the Orting quadrangle, Washington: Washington, U.S. Government Printing Office, U.S. Geological Survey Open-File Report 61-35.
Crandell, D.R. 1963. Surficial geology and geomorphology of the Lake Tapps quadrangle, Washington: Washington, U.S. Government Printing Office, U.S. Geological Survey Professional Paper, 388-A.
June 2009 Page 10-5

Pierce County Shoreline Inventory and Characterization Report
Crandell, D.R. 1971. Postglacial Lahars from Mount Rainier Volcano, Washington. U.S. Geological Survey Professional Paper, 677. Available: http://vulcan.wr.usgs.gov/Volcanoes/Rainier/Publications/PP677/osceola_mudflow.html
Crescent Valley Alliance (CVA). Undated. Crescent Valley Alliance brochure. Available: http://www.crescentvalleyalliance.org/. Accessed January 2009.
Crescent Valley Alliance (CVA). 2007. Crescent Valley Biodiversity Management Area (BMA) Stewardship Plan. July 2007. Available: http://www.crescentvalleyalliance.org/. Accessed January 2009.
Culverwell, H., Brennan, J. 2003. Marine Riparian Areas: Protection and Preservation in Puget Sound and the Georgia Basin. Proceedings from 2003 Georgia Basin/Puget Sound Research Conference.
Daily, G. C. (ed.). 1997. Nature’s services: Societal dependence on natural ecosystems. Washington, D.C.: Island Press.
Dames & Moore. 1981. Commencement Bay Study. Prepared for the Army Corps of Engineers, Seattle District, Washington. Volumes 1-7.
Desbonnet, A., P. Pogue, V. Lee, and N. Wolff. 1994. Vegetated buffers in the Coastal Zone: a summary review and bibliography. Coastal Resources Center, Rhode Island Sea Grant, University of Rhode Island. ISBN 0-938 412-37-x. 71 pp.
Dethier M.N. 1990. A marine and estuarine habitat classification system for Washington State. Washington State Natural Heritage Program, Department of Natural Resources. 56 pages, Olympia, Washington.
Dethier, M. N. 2006. Native Shellfish in Nearshore Ecosystems of Washington State. Puget Sound Nearshore Partnership, Technical Report 2006-04. November 2006. 20 p.
Diefenderfer, H L., K L. Sobocinski, R. M. Thom, C. W. May, S. L. Southard, A. B. Borde, C. Judd, J. Vavrinec, and N. K. Sather. 2006. Multi-Scale Restoration Prioritization for Local and Regional Shoreline Master Programs: A Case Study from Jefferson County, Washington. Battelle Marine Sciences Laboratory, Sequim, Washington Report No. PNWD-3762. November 22, 2006.
Downing, J. 1983. The Coast of Puget Sound, Its Processes and Development. Seattle, WA: Washington Sea Grant, University of Washington Press.
Dowty, P., B. Reeves, H. Berry, S. Wyllie-Echeverria, T. Mumford, A. Sewell, P. Milos, and R. Wright. 2005. Puget Sound submerged vegetation monitoring project: 2003-2004 Monitoring Report. Nearshore Habitat Program, Aquatic Resources Division, Washington State Department of Natural Resources, Olympia, WA.
Page 10-6 June 2009

Pierce County Shoreline Inventory and Characterization Report
Dragovich, J.D., P.T. Pringle, and T.J. Walsh. 1994. Extent and geometry of the mid-Holocene Osceola mudflow in the Puget Lowland – Implications for Holocene sedimentation and paleogeography: Washington Geology, v. 22, n. 3, p. 3-26.
Dragovich, J.D., R.L. Logan, H.W. Schasse, T.J. Walsh, W.S. Lingley, Jr., D.K. Norman, W.J. Gerstel, T.J. Lapen, J.E. Schuster, and K.D. Meyers. 2002. Geologic map of Washington – northwest quadrant: Washington Division of Geology and Earth Resources Geologic Map GM-50, scale 1:250,000.
Dunne, T. and L. Leopold. 1979. Water in Environmental Planning. New York, NY: W.H. Freeman and Company.
Ebbert, J.C. 2003. Water temperature, specific conductance, pH, and dissolved oxygen concentrations in the lower White River and the Puyallup River estuary, Washington, August-October 2002. U.S. Geological Survey Water-Resources Investigation Report 03-4177. Available: http://pubs.usgs.gov/wri/wri034177/
Edwards, R.C. 2006. Images of America: Tacoma’s Salmon Beach. ISBN 0-7385-3108-1. Arcadia Publishing, Charleston, South Carolina.
Ellings, C. 2004. Nisqually River Off-Channel Habitat Assessment. South Puget Sound Salmon Enhancement Group. Available: http://www.spsseg.org/projects/projects.asp
Embrey, S.S. and E.L. Inkpen. 1998. Nutrient transport in rivers of the Puget Sound Basin, Washington 1980-1993: US Geological Survey Water-Resources Investigation Report 97-4270.
Emmett, R. L., S. A. Hinton, S. L. Stone, and M. E. Monaco. 1991. Distribution and abundance of fishes and invertebrates in West Coast estuaries, Volume II: Species life history summaries. ELMR Report No. 8. Strategic Environmental Assessments Division, National Ocean Service, National Oceanic and Atmospheric Administration, Rockville, Maryland. 329 pp.
ESA Adolfson. 2007. City of Puyallup Draft Shoreline Restoration Plan. November 2007. Prepared for City of Puyallup.
EVS Environmental Consultants. 1995. Commencement Bay Phase I Damage Assessment. Prepared for Commencement Bay Natural Resource Trustees. May 1995.
Federal Register. 2005a. Volume 70, Number 170. Endangered and Threatened Species; Designation of Critical Habitat for 12 Evolutionarily Significant Units of West Coast Salmon and Steelhead in Washington, Oregon, and Idaho; Final Rule. Friday, September 2, 2005.
June 2009 Page 10-7

Pierce County Shoreline Inventory and Characterization Report
Federal Register. 2005b. Volume 70, Number 185. Endangered and Threatened Wildlife and Plants; Designation of Critical Habitat for the Bull Trout; Final Rule. Monday, September 26, 2005.
Federal Register. 2006a. Volume 71, Number 60. Proposed Rule, Petition Finding. Listing Endangered and Threatened Species and Designating Critical Habitat: 12–Month Finding on Petition to List Puget Sound Steelhead as an Endangered or Threatened Species under the Endangered Species Act. Wednesday, March 29, 2006.
Federal Register. 2006b. Volume 71, Number 115. Endangered and Threatened Species; Designation of Critical Habitat for the Southern Resident Killer Whale. Thursday, June 15, 2006.
Federal Register. Volume 71, Number 60. Proposed Rule, Petition Finding. Listing Endangered and Threatened Species and Designating Critical Habitat: 12–Month Finding on Petition to List Puget Sound Steelhead as an Endangered or Threatened Species under the Endangered Species Act. March 29, 2006.
FEMA Map Service Center. Flood Insurance Study (FIS) Bonney Lake, Twn/Pierce Co, 11/01/79. FIS ID #530274V000. Available: https://msc.fema.gov/webapp/wcs/stores/servlet/StoreCatalogDisplay?storeId=10001&catalogId=10001&langId=-1&userType=R
FEMA Map Service Center. Flood Insurance Study (FIS) Buckley, Cty/Pierce Co, 11/01/79. FIS ID #530139V000. Available: https://msc.fema.gov/webapp/wcs/stores/servlet/StoreCatalogDisplay?storeId=10001&catalogId=10001&langId=-1&userType=R
FEMA Map Service Center. Flood Insurance Study (FIS) Dupont, Twn/Pierce Co, 9/15/83. FIS ID #530245V000. Available: https://msc.fema.gov/webapp/wcs/stores/servlet/StoreCatalogDisplay?storeId=10001&catalogId=10001&langId=-1&userType=R
FEMA Map Service Center. Flood Insurance Study (FIS) Eatonville, Twn/Pierce Co, 07/03/86. FIS ID #530283V000. Available: https://msc.fema.gov/webapp/wcs/stores/servlet/StoreCatalogDisplay?storeId=10001&catalogId=10001&langId=-1&userType=R
FEMA Map Service Center. Flood Insurance Study (FIS) Fife, Cty/Pierce Co, 05/05/80. FIS ID #530140V000. Available: https://msc.fema.gov/webapp/wcs/stores/servlet/StoreCatalogDisplay?storeId=10001&catalogId=10001&langId=-1&userType=R
FEMA Map Service Center. Flood Insurance Study (FIS) Fircrest, Twn/Pierce Co, 08/03/81. FIS ID #530141V000. Available: https://msc.fema.gov/webapp/wcs/stores/servlet/StoreCatalogDisplay?storeId=10001&catalogId=10001&langId=-1&userType=R
Page 10-8 June 2009

Pierce County Shoreline Inventory and Characterization Report
FEMA Map Service Center. Flood Insurance Study (FIS) Gig Harbor, Twn/Pierce Co, 03/02/81. Available: https://msc.fema.gov/webapp/wcs/stores/servlet/StoreCatalogDisplay?storeId=10001&catalogId=10001&langId=-1&userType=R
FEMA Map Service Center. Flood Insurance Study (FIS) Orting, Cty/Pierce Co, 09/27/85. FIS ID #530143V000. Available: https://msc.fema.gov/webapp/wcs/stores/servlet/StoreCatalogDisplay?storeId=10001&catalogId=10001&langId=-1&userType=R
FEMA Map Service Center. Flood Insurance Study (FIS) Pierce Co, 08/19/87. FIS ID #530138V001. Available: https://msc.fema.gov/webapp/wcs/stores/servlet/StoreCatalogDisplay?storeId=10001&catalogId=10001&langId=-1&userType=R
FEMA Map Service Center. Flood Insurance Study (FIS) Pierce Co, 08/19/87. FIS ID #530138V002. Available: https://msc.fema.gov/webapp/wcs/stores/servlet/StoreCatalogDisplay?storeId=10001&catalogId=10001&langId=-1&userType=R
FEMA Map Service Center. Flood Insurance Study (FIS) Puyallup, Cty/Pierce Co, 02/15/80. FIS ID #530144V000. Available: https://msc.fema.gov/webapp/wcs/stores/servlet/StoreCatalogDisplay?storeId=10001&catalogId=10001&langId=-1&userType=R
FEMA Map Service Center. Flood Insurance Study (FIS) Roy, Twn/Pierce Co, 09/15/81. FIS ID #530262V000. Available: https://msc.fema.gov/webapp/wcs/stores/servlet/StoreCatalogDisplay?storeId=10001&catalogId=10001&langId=-1&userType=R
FEMA Map Service Center. Flood Insurance Study (FIS) Ruston, Twn/Pierce Co, 07/03/86. FIS ID #530300V000. Available: https://msc.fema.gov/webapp/wcs/stores/servlet/StoreCatalogDisplay?storeId=10001&catalogId=10001&langId=-1&userType=R
FEMA Map Service Center. Flood Insurance Study (FIS) S. Prairie, Twn/Pierce Co, 06/15/81. FIS ID #530145V000. Available: https://msc.fema.gov/webapp/wcs/stores/servlet/StoreCatalogDisplay?storeId=10001&catalogId=10001&langId=-1&userType=R
FEMA Map Service Center. Flood Insurance Study (FIS) Steilacoom, Twn/Pierce Co, 01/19/82. FIS ID #530146V000. Available: https://msc.fema.gov/webapp/wcs/stores/servlet/StoreCatalogDisplay?storeId=10001&catalogId=10001&langId=-1&userType=R
FEMA Map Service Center. Flood Insurance Study (FIS) Sumner, Cty/Pierce Co, 06/18/87. FIS ID #530147V000. Available:
June 2009 Page 10-9

Pierce County Shoreline Inventory and Characterization Report
https://msc.fema.gov/webapp/wcs/stores/servlet/StoreCatalogDisplay?storeId=10001&catalogId=10001&langId=-1&userType=R
FEMA Map Service Center. Flood Insurance Study (FIS) Tacoma, Cty/Pierce Co, 06/01/83. FIS ID #530148V000. Available: https://msc.fema.gov/webapp/wcs/stores/servlet/StoreCatalogDisplay?storeId=10001&catalogId=10001&langId=-1&userType=R
FEMA Map Service Center. Flood Insurance Study (FIS) Wilkeson, Twn/Pierce Co, 09/01/81. FIS ID #530268V000. Available: https://msc.fema.gov/webapp/wcs/stores/servlet/StoreCatalogDisplay?storeId=10001&catalogId=10001&langId=-1&userType=R
Franklin, J. F. and C. T. Dyrness. 1988. Natural vegetation of Oregon and Washington. Corvallis, OR: Oregon State University Press.
Fresh, K. L., R. D. Cardwell, and R. P. Koons. 1981. Food habits of Pacific salmon, baitfish, and their potential competitors and predators in the marine waters of Washington, August 1978 to September 1979. Progress Report No. 145. Washington Department of Fisheries, Olympia, Washington.
Friedman, J. M., W. R. Osterkamp, and W. M. Lewis, Jr. 1996a. Channel narrowing and vegetation development following a Great Plains flood. Ecology, v. 77, n. 7, p. 2167-2181.
Friedman, J. M., W. R. Osterkamp, and W. M. Lewis, Jr. 1996b. The role of vegetation and bed-level fluctuations in the process of channel narrowing. Geomorphology, v. 14, p. 341-351.
Friends of Hylebos Wetlands. Undated. Completed Restoration Projects. Available: http://www.hylebos.org/projects/completed-restoration-projects. Accessed January 2009.
Friends of Pierce County. 2008. Friends’ Focus newsletter, May – June 2008. Available: http://www.friendsofpiercecounty.org/updates/FPC-Newsletter-May-June-2008.pdf. Accessed January 2009.
Friends of the Hylebos. 2005. State of the Hylebos Report. Available: http://www.hylebos.org/News/Publications/state.htm
Friends of the Hylebos. 2006. Active Habitat Restoration Projects, Lower Hylebos Marsh Restoration. Available: http://www.hylebos.org/restoration/Active/index.htm
Friends of the Hylebos. 2007. Making a Healthier Watershed for Salmon and People. Available: http://www.hylebos.org/index.htm
GeoEngineers. 2002. Geomorphic Evaluation and Channel Migration Zone Analysis: Upper Nisqually (draft).
Page 10-10 June 2009

Pierce County Shoreline Inventory and Characterization Report
GeoEngineers. 2003. Geomorphic Evaluation and Channel Migration Zone Analysis: Puyallup, Carbon and White Rivers.
GeoEngineers. 2004. Final Shoreline Inventory Element Text Report [and associated GIS mapping data]. Prepared for the City of Tacoma. June 11, 2004. Tacoma, Washington.
GeoEngineers. 2005. Geomorphic Evaluation and Channel Migration Zone Analysis: South Prairie Creek.
Gerstel, W.J. and J.F. Brown. 2006. Alternative Shoreline Stabilization Evaluation Project Final Report. Prepared for Puget Sound Action Team. Available: http://www.psat.wa.gov/Programs/shorelines/FinalPSAT9_15_06withphotos.pdf
Gerstel, W. J., M.J. Brunengo, W.S. Lingley Jr., R.L. Logan, H.S. Shipman, and T.J. Walsh. 1997. Puget Sound Bluffs: The Where, Why, and When of Landslides Following the Holiday 1996/97 Storms. Washington Geology. March 1997. Vol 25, no. 1.
Gibson, C. 1998. Population of the 100 largest cities and other places in the U.S. 1790-1990. Population Division. U.S. Bureau of Census. Washington D.C.
Golder Associates. 2003. Watershed Management Plan - Nisqually (WRIA 11). Available: http://nisquallyriver.org/planning/Final/plan.pdf
Grant, G.E., Lewis, S.L., Swanson, F.J., Cissel, J.H., McDonnell, J.J. 2008. Effects of Forest Practices on Peak Flows and Consequent Channel Response: A State-of-Science Report for Western Oregon and Washington. Gen. Tech. Rep. PNW.GTR-760, Portland, OR: U.S. Department of Agriculture, Forest Service, Pacific Northwest Research Station.
Gray, D. and R. B. Sotir. 1996. Biotechnical and Soil Bioengineering Slope Stabilization: A Practical Guide for Erosion Control. John Wiley and Sons.
Greenway, D. R. 1987. Vegetation and Slope Stability. In Slope Stability, M. F. Anderson and K. S. Richards (eds.), New York, NY: Wiley and Sons.
Gregory, S.V., F. J. Swanson, W. A. McKee, and K. W. Cummins. 1991. An ecosystem perspective of riparian zones. BioScience, v. 41, p. 540-551.
Griffin, W.C. 1962. Water resources of the Tacoma area: Olympia, Wash., U.S. Geological Survey and Water Supply paper 1499-B.
Griggs, G. B. 2005. The impacts of coastal armoring. Shore and Beach, v. 73, n. 1, p. 13-22.
Groffman, P. M., A. J. Gold, and R. C. Simmons. 1992. Nitrate dynamics in riparian forests: micro-ecosystems and their relationships to multi-use natural resource
June 2009 Page 10-11

Pierce County Shoreline Inventory and Characterization Report
management. Pp. 80-92 in: Strategies for protection and management of floodplain wetlands and other riparian ecosystems. Proceedings of the Symposium, Dec. 11-13, 1978, Callaway Gardens, GA. Washington, D.C.: USDA and USFS.
Gustafson, R.G., W.H. Lenarz, B.B. McCain, C.C. Schmitt, W.S. Grant, T.L. Builder, and R.D. Methot. 2000. Status Review of Pacific Hake, Pacific Cod, and Walley Pollock from Puget Sound, Washington. U.S. Dept. Commerce, NOAA Tech. Memo. NMFS-NWFSC-44, 275 p.
Hallock, D. 2006. Lake Tapps (Pierce County) Monitoring, Final Data Report. Washington Department of Ecology Publication #06-03-006. Available: http://www.ecy.wa.gov/biblio/0603006.html
Hampton, M., G. Griggs, T. Edil, D. Guy, J. Kelly, P. Komar, D. Mickleson, and H. Shipman. 2004. P. 7-38 in Processes that Govern the Formation and Evolution of Coastal Cliffs: Formation, Evolution, and Stability of Coastal Cliffs—Status and Trends, Hampton, M.A. and Griggs, G.B. (eds.), USGS Professional Paper 1693.
Haring, 2000. Salmonid Habitat Limiting Factors. Water Resource Inventory Area 15 (East) Final Report. Washington State Conservation Commission.
Harp, B.D. 1983. Net shore-drift of Pierce County, Washington. Shorelands and Environmental Assistance Program, Washington Department of Ecology, Olympia, Washington.
Harrison, P. J. et al. 1994. An assessment of nutrients, plankton, and some pollutants in the water column of Juan de Fuca Strait, Strait of Georgia and Puget Sound, and their transboundary transport. In: Wilson, R. C. H., et al. eds. 1994. Review of the marine environment and biota of Strait of Georgia, Puget Sound and Juan de Fuca Strait: Proceedings of the B.C./Washington Symposium on the Marine Environment, State of the Nearshore Ecosystem 13 – 12 January 13 and 14, 1994. Canadian Technical Report of Fisheries and Aquatic Sciences1948: 398 p.
Hart Crowser, Inc. 1974. Geology of the Port of Tacoma: Report prepared by Hart Crowser, Inc.
Hoblitt et al. 1998. Volcano Hazards from Mount Rainier, Washington, Revised 1998. Available: http://vulcan.wr.usgs.gov/Volcanoes/Rainier/Hazards/OFR98-428/framework.html
Hoffman, A., A. Bradbury, and C. L. Goodwin. 2000. Modeling geoduck, Panopea abrupta (Conrad, 1849) population dynamics. I. Growth. Journal of Shellfish Research 19:57-62.
Hood, W.G. 2004. Indirect Environmental Effects of Dikes on Estuarine Tidal Channels: Thinking Outside of the Dike for Habitat Restoration and Monitoring. Estuaries 27(2):273-282.
Page 10-12 June 2009

Pierce County Shoreline Inventory and Characterization Report
Hood, W.G. 2005. Sea Level Rise in the Skagit Delta. Pages 14-15 in S. Solomon, editor. Skagit River Tidings. Skagit Watershed Council, Mount Vernon, Washington.
Houghton, J., C. Ruedebusch, J. Eric Hagen, A. MacLennan, J. Fabbri. 2003. Key Peninsula, Gig Harbor, and Islands Watershed Nearshore Salmon Habitat Assessment. Pentec Environmental for Pierce County Public Works and Utilities, Environmental Services, Water Programs, University Place, Washington. 37 pp.
Hulscher, 2007. Personal communication, telephone conversation with K. Dixon on September 7, 2007.
Intergovernmental Panel on Climate Change (IPCC). 2007. Contribution of Working Groups I, II and III to the Fourth Assessment Report of the Intergovernmental Panel on Climate Change. Core Writing Team, Pachauri, R.K. and Reisinger, A. (Eds.). IPCC, Geneva, Switzerland. pp 104. Available: http://www.ipcc.ch/ipccreports/ar4-syr.htm.
Island County Marine Resources Committee. 2004. Regional Forage Fish Habitat Assessment, 2001-2003.
Jacobsen, E.E. and M.L. Schwartz. 1981. The use of geomorphic indicators to determine the direction of net shore-drift. Shore and Beach, v. 49, p. 38-42.
Jeffries, S.J., P.J. Gearin, H.R. Huber, D.L. Saul and D.A. Pruett. 2000. Atlas of Seal and Sea Lion Haulout Sites in Washington. Washington Department of Fish and Wildlife, Wildlife Science Division, Olympia, Washington.
Johannessen, J. W. and M. A. Chase, 2003. Point Whitehorn to Birch Bay State Park Shoreline Reach Analysis, Whatcom County, WA – Final Report. Prepared for: Whatcom County Public Works, River and Flood Division, 28 p., 5 Appendices.
Johannessen, J. W., A. MacLennan, and A. McBride. 2005. Inventory and Assessment of Current and Historic Beach Feeding Sources/ Erosion and Accretion Areas for the Marine Shorelines of Water Resource Inventory Areas 8 and 9, Prepared for King Co. DNRP, WRIA 8 & 9, By Coastal Geologic Services Inc., Bellingham, WA, 74 p plus Appendices.
Johannessen, J.W. and A. MacLennan. 2006/7 in press. Puget Sound Nearshore Partnership Report No 2006-10. Beaches and Bluffs of Puget Sound and the Northern Straits a Valued Ecosystem Component of Washington State. Published by Seattle District, U.S. Army Corps of Engineers, Seattle, Washington.
Jones, M.A. 1996. Thickness of unconsolidated deposits in the Puget Sound Lowland, Washington and British Columbia: U.S. Geological Survey Water-Resources Investigations Report 94-4133, 1 plate.
June 2009 Page 10-13

Pierce County Shoreline Inventory and Characterization Report
Jones, M.A., L.A. Orr, J.C. Ebbert, and S.S. Sumioka. 1999. Ground-Water Hydrology of the Tacoma-Puyallup Area, Pierce County, Washington. U.S. Geological Survey Water-Resources Investigations Report 99-4013.
Kerwin, J. 1999a. Salmon Habitat Limiting Factors Report for the Puyallup River Basin (Water Resource Inventory Area 10). Washington Conservation Commission, Olympia, Washington. Available: http://dnr.metrokc.gov/wlr/watersheds/white.htm
Kerwin, J. 1999b. Salmon and Steelhead Habitat Limiting Factors - Water Resource Inventory Area 11. Washington Conservation Commission, Olympia, Washington. Available: http://www.scc.wa.gov/index2.php?option=com_docman&task=doc_view&gid=1013&Itemid=26.
Ketcheson, G. and K. McKee. 2006. Upper White Watershed Sediment and Temperature Total Maximum Daily Load (Water Cleanup Plan) for Aquatic Habitat: Detailed Implementation Plan. Washington State Department of Ecology, Publication #05-10-038, Olympia, Washington. Available: http://www.ecy.wa.gov/biblio/0510038.html
Ketcheson, G. et al. 2003. Mt. Baker Snoqualmie National Forest Upper White Watershed Sediment and Temperature TMDL for Aquatic Habitat: Submittal Report. Washington State Department of Ecology, Publication #03-10-032, Olympia, Washington. Available: http://www.ecy.wa.gov/biblio/0310032.html
Keuler, R.F. 1979. Coastal zone processes and geomorphology of Skagit County, Washington: unpublished M.S. thesis, Western Washington University., Bellingham, 127 p., 8 maps.
Keuler, R.F. 1988. Map showing coastal erosion, sediment supply, and longshore transport in the Port Townsend 30- by 60-minute quadrangle, Puget Sound region, Washington: U.S. Geologic Survey Miscellaneous Investigations Map I-1198-E, scale 1:100,000.
KGI (Key Peninsula-Gig Harbor-Islands) Watershed Committee. 1999. KGI Characterization. Available online at http://www.co.pierce.wa.us/pc/services/home/environ/water/ps/watershed/kgimain.htm.
KGI Watershed Council. Undated. KGI Watershed Council brochure. Available: http://www.co.pierce.wa.us/xml/services/home/environ/water/ps/kgi/KGIWCBrochure-WEB.pdf. Accessed January 2009.
KGI Watershed Interim Council (KGI-WIC). 2001. Key Peninsula-Gig Harbor-Islands Watershed, State of the Watershed Report 2001. Available: http://www.co.pierce.wa.us/xml/services/home/environ/water/general/KGIAnnualReport2001.pdf. Accessed January 2009.
Page 10-14 June 2009

Pierce County Shoreline Inventory and Characterization Report
King County Department of Natural Resources (KCDNR). 2001. Reconnaissance Assessment of the State of the Nearshore Report: Including Vashon and Maury Islands (WRIAs 8 and 9). Seattle, Washington.
King County Department of Natural Resources and Parks Water and Land Resources Division Flood Hazard Reduction Services Section. 2002. Land Acquisition Evaluation Report For The White River Corridor. Available: http://dnr.metrokc.gov/wlr/watersheds/white.htm
King County. 1988. The White River and the Inter-County River Improvement District. King County Department of Public Works, Surface Water Management Division. Seattle, Washington.
King County. 2006. Flood Hazard Management Plan: King County, Washington. King County Department of Natural Resources and Parks, Water and Land Resources Division, Seattle, Washington.
Knighton, D. 1998. Fluvial forms and processes, a new perspective. New York, NY: Oxford University Press Inc.
Knutsen, K. L., and V. L. Naef. 1997. Management recommendations for Washington’s priority habitats: riparian. Washington Department of Fish and Wildlife, Olympia.
Komar, P.D. 1976. Beach Processes and Sedimentation. Englewood Cliffs, NJ: Prentice-Hall, Inc., 429 p.
Kraus, N. C. and M. Gravens, and D. Mark, 1988. Coastal Processes at Sea Bright to Ocean Township, New Jersey. Volume II, Appendixes B-B, miscellaneous paper CERC-88- 12, U. S. Army Waterways Experiment Station, Vicksburg MS.
Kresch, D.L. 1998. Determination of Upstream Boundaries on Western Washington Streams and Rivers Under the Requirements of the Shoreline Management Act of 1971. U.S. Geological Survey Water-Resources Investigations Report 96-4208. Prepared in cooperation with the Washington State Department of Ecology.
Kruckeberg, A.R. 1991. The Natural History of Puget Sound Country. University of Washington Press, Seattle.
Lawson et al. 2007. Lawson, P., M. Louther, and J. Coop. 2007. Natural Resources Technical Memorandum for the Rhodes Lake Road Corridor Draft EIS (Appendix F). Bellevue, WA. 60 pp. Available at: http://www.co.pierce.wa.us/pc/abtus/ourorg/pwu/crp/rhodeslkrd.htm.
Lemberg, N.A., M.F. O’Toole, D.E. Pentilla, and K.C. Stick. 1997. 1996 Forage Fish Stock Status Report. Stock Status Report No. 98-1. Washington State Department of Fish and Wildlife, Olympia, Washington.
June 2009 Page 10-15

Pierce County Shoreline Inventory and Characterization Report
Logan, R.L., T. J. Walsh, and K. G. Troost. 2001. Geologic map of the Fox Island 7.5-minute quadrangle, Pierce County, Washington, 33 x 36 in. color sheet, scale 1:24,000. Available: http://www.dnr.wa.gov/geology/pubs/pubs_ol.htm
Lower Columbia Fish Recovery Board. 2004. Lower Columbia Salmon Recovery And Fish & Wildlife Subbasin Plan Volume II – Subbasin Plan Chapter E – Cowlitz, Coweeman and Toutle. Available: http://www.nwcouncil.org/fw/subbasinplanning/lowerColumbia/plan/Vol%20II%20E--Cowlitz.pdf
Lower Puyallup Watershed Management Committee. 1992. Lower Puyallup Watershed, Phase 1 Report.
Lower Puyallup Watershed Management Committee. 1995. Lower Puyallup Watershed Action Plan.
Luce, C. H. and T. A. Black. 1999. Sediment production from forest roads in western Oregon. Water Resources Research 35(8): 2561-2570.
Luzier, J.E. 1969. Geology and groundwater resources of southwestern King County, Washington. Washington Department of Water Resoures Water-Supply Bulletin 28, 260 p. 3 plates.
MacDonald, K., D. Simpson, B. Paulsen, J. Cox, and J. Gendron. 1994. Shoreline Armoring Effects on Physical Coastal Processes in Puget Sound, Washington. Coastal Erosion Management Studies Volume 5. Shorelands and Water Resources Program, Washington Department of Ecology, Olympia, Washington. Report #94-78.
Marks, E., B. Smith, R. Ladley, and T. Sebastian. 2005. 2004 - 2005 Annual Salmon, Steelhead, and Char Report: WRIA 10, Puyallup/White River Watershed. August 2004 - June 2005. Puyallup Tribe Fisheries Division. Puyallup, Washington. Available: http://www.nwifc.wa.gov/recovery/documents/Section1toClearCreek.pdf
Marks, E., R. C. Ladley, B. E. Smith, and T. G. Sebastian. 2008. 2007-2008 Annual Salmon, Steelhead and Bull Trout Report: Puyallup/White River Watershed-Water Resource Inventory Area 10. Puyallup Tribal Fisheries, Puyallup, WA.
Maser, C., R. F. Tarrant, J. M. Trappe, and J. F. Franklin (eds.). 1988. From the forest to the sea: a story of fallen trees. General Technical Report PNW-GTR-229. Portland, OR: USDA Forest Service. 153 pp.
McClary, Daryl C. 2003. HistoryLink Essay: McNeil Island and the Federal Penitentiary, 1841-1981. HistoryLink.org Essay 5238. Accessed online at http://www.historylink.org/essays/output.cfm?file_id=5238
Page 10-16 June 2009

Pierce County Shoreline Inventory and Characterization Report
McCullough, D. A. 1999. A review and synthesis of effects of alterations to the water temperature regime of freshwater life stages of salmonids, with special reference to chinook salmon. Water Resource Assessment EPA 910-R-99-010. Portland, OR: Columbia River Inter-Tribal Fish Commission. 291 pp.
Menashe, E. 1993. Vegetation Management: A guide for Puget Sound bank property owners. Shorelands and Coastal Zone Management Program, Washington Department of Ecology, Olympia, Washington.
Menashe, E. 2001. “Bio-structural” Erosion Control: Incorporating Vegetation in Engineering Designs to Protect Puget Sound Shorelines. Puget Sound Research 2001, Conference Proceedings, Puget Sound Action Team.
Michaud, J. 1994. A Citizen’s Guide to Understanding and Monitoring Lakes and Streams. Washington State Department of Ecology, Publication #94-149, Olympia, Washington. Available: http://www.ecy.wa.gov/biblio/94149.html
Miles, J.R., P.E. Russel and D.A. Huntley. 2001. Field measurements of sediment dynamics in front of a seawall. Journal of Coastal Research, v. 17, n. 1, p. 195-206.
Mobrand Biometrics, Inc. 2001. Watershed Analysis for the Development of Salmonid Conservation and Recovery Plans Within Pierce County, Completion Report and Appendices (Appendix D includes Reach Habitat Analysis).
Montgomery Consulting Engineers, Inc. 1991. Pierce County river improvement: Puyallup River Basin comprehensive flood control management plan: Prepared by Montgomery Consulting Engineers, Inc. for Pierce County Dept. of Public Works, Bellevue, Washington.
Montgomery, D.R., B.D. Collins, J.J. Buffington, and T.B. Abbe. 2003. Geomorphic Effects of Wood in Rivers. In The Ecology and Management of Wood in World Rivers, S.V. Gregory, K.L. Boyer, and A.M. Gurnell (eds.), American Fisheries Society, December 2003.
Montgomery, D.R., S. Bolton, D.B. Booth, and L. Wall (eds). 2003. Restoration of Puget Sound Rivers. Center for Watershed and Streamside Studies, Seattle, WA: University of Washington Press.
Montgomery, D.R., T.M. Massong and S.C.S. Hawley. 2003. Debris flows, log jams, and the formation of pools and alluvial channel reaches in the Oregon Coast Range: Geological Society of America Bulletin, v. 115, p. 78–88, doi:10.1130/00167606(2003)1152.0.CO;2.
Mote, P., A. Peterson, S. Reeder, H. Shipman, and L. Whitely Binder. 2008. Sea Level Rise in the Coastal Waters of Washington State. A report by the University of Washington Climate Impacts Group and the Department of Ecology. Available: http://cses.washington.edu/db/pdf/moteetalslr579.pdf
June 2009 Page 10-17

Pierce County Shoreline Inventory and Characterization Report
Muckleshoot Indian Tribe, Puyallup Tribe of Indians, Washington Department of Fish and Wildlife. 1996. Recovery plan for White River Spring Chinook Salmon. A report prepared by the South Puget Sound Technical Committee.
Mullineaux. D. R. 1970. Geology of the Renton, Auburn, and Black Diamond Quadrangles, King County, Washington. US Geological Survey Professional Paper 672.
Murray, M.R. and L. Ferguson. 1998. The Status of Marine Protected Areas in Puget Sound. Volume II: MPA Site Profiles & Appendices. Prepared for the Puget Sound/Georgia Basin International Task Force Work Group on Marine Protected Areas. March 1998. Available: http://www.psat.wa.gov/shared/volume2/intro.html
Naiman, R. J., R. E. Bilby, and P. A. Bisson. 2000. Riparian ecology and management in the Pacific coastal rain forest. BioScience, v. 50, p. 996-1011.
Nakamura, F. and F. J. Swanson. 1993. Effects of coarse woody debris on morphology and sediment storage of a mountain stream system in Western Oregon. Earth Surface Processes and Landforms, v.18, p. 43-61.
Nakata, K. and J. Newton. 2001. Seasonal patterns and controlling factors of primary production in Puget Sound’s Central Basin and Possession Sound. Proceedings of the Puget Sound Georgia Basin Research Conference 2001.
National Climatic Data Center. Undated. Climate of Washington. Accessed online.
National Research Council (NRC). 2002. Riparian Areas: Functions and Strategies for Management. Committee on Riparian Zone Functioning and Strategies for Management, Water Science and Technology Board, Board on Environmental Studies and Toxicology, Division on Earth and Life Studies, National Research Council. National Academy Press, Washington D.C., 428 pp.
National Wildlife Federation (NWF). 2007. Sea-level Rise and Coastal Habitats in the Pacific Northwest: An Analysis for Puget Sound, Southwestern Washington, and Northwestern Oregon. July 2007. Available: http://www.nwf.org/sealevelrise/Maps_of_the_Pacific_Northwest_Coast.cfm.
Newton, J.A., S.L. Albertson, K. Nakata, and C. Clishe. 1998. Washington State Marine Water Quality in 1996 and 1997. Washington State Department of Ecology, Environmental Assessment Program, Publication #98-338, Olympia, Washington.
NHC. 2005. Draft FIRM Maps for the Puyallup River. Submitted to FEMA for review.
Nicola, R.M. and Sandison, D.I . 1985. Clover/Chambers Creek geohydrologic study for Tacoma-Pierce County Health Dept: final report: Brown and Caldwell Consultants.
Page 10-18 June 2009

Pierce County Shoreline Inventory and Characterization Report
Nightingale, B., 2000. Summary report from a literature and data search on the status of marine resources in Jefferson County, WA. Prepared for the Jefferson County Marine Resources Committee, 67p.
Nightingale, B., and C. Simenstad. 2001. Executive Summary-Over-water Structures: Marine Issues, White paper, Prepared for Washington Department of Fish and Wildlife, Washington Department of Ecology, and Washington Department of Transportation, Olympia, Washington.
Nisqually Chinook Recovery Team. 2001. Nisqually Chinook Recovery Plan. Available: http://www.co.pierce.wa.us/pc/abtus/ourorg/exec/specialprojects/chinookrecovery.htm
Nisqually Indian Tribe. 2008. Yil-me-hu, The Nisqually Watershed Salmon Recovery Newsletter, Fall/Winter 2008. Available: http://www.nisquallyriver.org/stewards/Yil_Me_Hu_Fall_Winter_08.pdf. Accessed January 2009.
Nisqually Land Trust. 2006. Nisqually Land Trust - Protected Lands, Ohop Creek. Available: www.nisquallylandtrust.org/ohop_creek.php. Accessed January 2009.
NOAA. 2003. Puget Sound Tsunami Sources – 2002 Workshop Report. Contribution No. 2526 from NOAA/Pacific Marine Environmental Laboratory.
NOAA Fisheries. 2005a. Final Critical Habitat Designations in Washington, Oregon, Idaho and California for Endangered and Threatened Pacific Salmon and Steelhead. Available: http://swr.nmfs.noaa.gov/chd/CH-FACT.PDF
NOAA Fisheries. 2005b. Supplement to the Draft Puget Sound Salmon Recovery Plan. National Marine Fisheries Service (NMFS), Northwest Region. December 19, 2005.
NOAA Fisheries Northwest Region. 2007. Salmon Populations page. Available: http://www.nwr.noaa.gov/ESA-Salmon-Listings/Salmon-Populations/. Website accessed on June 24, 2007.
O’Toole, M. 1995. Puget Sound Herring: A Review. Pp. 849-854 in Proceedings of Puget Sound Research. Puget Sound Water Quality Authority, Seattle, Washington.
Palmer, S.P., S.L. Magsino, E.L. Bilderback, J.L. Poelstra, D.S. Folger, and R.A. Niggemann. 2003. Liquefaction susceptibility and site class maps for Washington State: Washington Division of Geology and Earth Resources Geologic Map GM-51, scale 1:30,000.
Palmer, S.P., W.J. Perkins, and W.P. Grant. 2003. Washington Department of Natural Resources Geologic Map-51. Liquefaction Susceptibility of the Greater Tacoma Urban Area, Pierce and King Counties, Washington. Available: http://www.dnr.wa.gov/geology/pubs/pubs_ol.htm
June 2009 Page 10-19

Pierce County Shoreline Inventory and Characterization Report
Parametrix, Inc. 1985. Juvenile Salmon Stomach Contents Study, Everett Harbor, 1984. Prepared by U.S. Navy, Naval Facilities Engineering Command, San Bruno, California.
Pelletier, G.J. 1993. Puyallup River Total Maximum Daily Load for Biochemical Oxygen Demand, Ammonia, and Residual Chlorine. Washington State Department of Ecology, Publication #96-326, Olympia, Washington. Available: http://www.ecy.wa.gov/biblio/96326.html
Pelletier, G.J. 1994. Addendum to the Puyallup River total maximum daily load for biochemical oxygen demand, ammonia, and residual chlorine. Washington State Department of Ecology, Publication #94-e36, Olympia, Washington. Available: http://www.ecy.wa.gov/biblio/94e36.html
Pentec Environmental. 2003. Key Peninsula, Gig Harbor, and Islands Watershed Nearshore Salmon Habitat Assessment. Prepared for Pierce County Public Works and Utilities, Environmental Services, Water Programs. Available: http://www.co.pierce.wa.us/xml/services/home/environ/water/ps/KGIHabitatAssess.pdf
Penttila, D. 1978. Studies of the surf smelt (Hypomesus pretiosus) in Puget Sound. Technical Report No. 42. Washington Department of Fisheries, Olympia, Washington.
Penttila, D. E. 1995. The Washington Department of Fish and Wildlife’s Puget Sound intertidal baitfish spawning beach survey project. In: Proceedings of Puget Sound Research. 1995. pp. 235-241. Puget Sound Water Quality Authority, Seattle, Washington.
Penttila, D. E. 2001. Effects of shading upland vegetation on egg survival for summer spawning surf smelt, Hypomesus, on upper intertidal beaches in Northern Puget Sound. In: Proceedings of Puget Sound Research, 2001 Conference. Puget Sound Water Quality Action Team, Olympia, Washington.
Pethick, J. 2001. Coastal management and sea-level rise. Catena, v. 42, p. 307-322.
Phillip Whilliams & Associates. 2002. Tidal Hydrology Phase Report for A Coastal Flood Insurance Study: Sandy Point, Whatcom County, Washington, Prepared for Whatcom County Public Works, 18 pp. plus appendices and figures.
Pierce Conservation District (PCD). 2008. The Tahoma View. Volume 5, Issue 4, Winter 2008-09. Available: http://www.piercecountycd.org/images/tahomaViewPDFs/thm_vw_wint0809.pdf. Accessed January 2009.
Pierce County. 1991. Comprehensive Stormwater Plan. Pierce County Public Works and Utilities, Water Programs Division.
Page 10-20 June 2009

Pierce County Shoreline Inventory and Characterization Report
Pierce County. 1996. Chambers Creek Properties Master Site Plan Draft Environmental Impact Statement Volume 1. Department of Public Works and Utilities, Department of Parks and Recreation Services. November 5, 1996.
Pierce County. 2001. Key Peninsula-Gig Harbor-Islands State of the Watershed Report 2001. Pierce County Public Works and Utilities, Water Programs Division. Available: http://www.co.pierce.wa.us/pc/services/home/environ/water/general/periodicals.htm
Pierce County. 2002a. Clover Creek/Steilacoom Basin Plan. Pierce County Public Works and Utilities, Water Programs Division. Available: http://www.co.pierce.wa.us/pc/services/home/environ/water/ps/basinplans/bpmain.htm
Pierce County. 2002b. Gig Harbor Basin Plan. Pierce County Public Works and Utilities, Water Programs Division. Available: http://www.co.pierce.wa.us/pc/services/home/environ/water/ps/basinplans/bpmain.htm
Pierce County. 2002c. Hazard Identification and Vulnerability Analysis. Available: http://www.co.pierce.wa.us/xml/abtus/ourorg/dem/HIVAWEB.pdf
Pierce County. 2003a. Muck Creek Basin Plan. Pierce County Public Works and Utilities, Water Programs Division. Available: http://www.co.pierce.wa.us/pc/services/home/environ/water/ps/basinplans/bpmain.htm
Pierce County Public Works and Utilities, Transportation Services. 2003b. Waterborne Transportation Study, Summary Report. Prepared by the IBI Group in association with the Elliott Bay Design Group and Jacobs Civil. Seattle, WA 13 pages.
Pierce County. 2005a. Habitat Protection and Restoration Package website. Available: http://www.co.pierce.wa.us/pc/abtus/ourorg/exec/specialprojects/habitathome.htm
Pierce County. 2005b. Mid-Puyallup Basin Plan. Pierce County Public Works and Utilities, Water Programs Division. Available: http://www.co.pierce.wa.us/pc/services/home/environ/water/ps/basinplans/bpmain.htm
Pierce County. 2005c. Salmon Habitat Protection and Restoration Strategy, WRIA-10 Puyallup Watershed and WRIA-12 Chambers/Clover Creek Watershed. June 23, 2005.
Pierce County. 2005d. Stormwater Management & Site Development Manual – 2005. Available: http://www.co.pierce.wa.us/pc/services/home/environ/water/cip/swmmanual.htm
June 2009 Page 10-21

Pierce County Shoreline Inventory and Characterization Report
Pierce County. 2006a. Clear/Clarks Creek Basin Plan. Pierce County Public Works and Utilities, Water Programs Division. Available: http://www.co.pierce.wa.us/pc/services/home/environ/water/ps/basinplans/bpmain.htm
Pierce County. 2006b. Clover Creek Habitat/Floodplain Restoration Fact Sheets. Pierce County Public Works and Utilities. Available: http://www.co.pierce.wa.us/pc/services/home/environ/water/cip/cloverrest.htm. Accessed January 2009.
Pierce County. 2006c. Hylebos-Browns-Dash Point Basin Plan. Pierce County Public Works and Utilities, Water Programs Division. Available: http://www.co.pierce.wa.us/pc/services/home/environ/water/ps/basinplans/bpmain.htm
Pierce County. 2006d. Key Peninsula/Islands Basin Plan. Pierce County Public Works and Utilities, Water Programs Division. Available: http://www.co.pierce.wa.us/pc/services/home/environ/water/ps/basinplans/bpmain.htm
Pierce County. 2006e. National Pollutant Discharge Elimination System (NPDES) permit information. Available: http://www.co.pierce.wa.us/pc/services/home/environ/water/wq/main.htm
Pierce County. 2007a. Capital Facilities Plan 2006-2011 & Draft 2007-2012 Capital Facilities Plan. Available: http://www.co.pierce.wa.us/pc/services/home/environ/water/cip/cfp.htm
Pierce County. 2007b. Channel Migration and Avulsion Potential Analyses. Upper Nisqually River Pierce County, Washington. Prepared by GeoEngineers for Pierce County Public Works and Utilities, Water Programs Division. June 26, 2007.
Pierce County. 2007c. Current Use Assessment Program website. Available: http://www.co.pierce.wa.us/pc/abtus/ourorg/at/Content.htm
Pierce County. 2007d. Spanaway Creek Fish Passage Project Background. Pierce County Public Works and Utilities.
Pierce County. 2007e. White River Basin Plan – Characterization Report. September 2007. Pierce County Public Works and Utilities.
Pierce County. 2008a. Knockout knotweed. Available: http://www.piercecountywa.org/pc/abtus/ourorg/ccp/Knotweed.htm. Accessed March 2009.
Page 10-22 June 2009

Pierce County Shoreline Inventory and Characterization Report
Pierce County. 2008b. Nisqually River Basin Plan Volume 1 – Public Review Draft. June 2008. Pierce County Public Works and Utilities. Available: http://www.co.pierce.wa.us/pc/services/home/environ/water/ps/basinplans/nisqually.htm. Accessed January 2009.
Pierce County Public Works and Utilities. 2008c. Six-Year Transportation Improvement Program and 2009-2022 Fourteen-Year Ferry Program. Exhibit A to Ordinance No. 2008-76s. Tacoma, Washington. 118 pages.
Pierce County (WRIA 10/12) Lead Entity. 2008a. 2008 Three-year Watershed Implementation Priorities. April 21, 2008.
Pierce County (WRIA 10/12) Lead Entity. 2008b. Salmon Habitat Protection and Restoration Strategy, WRIA 10 Puyallup Watershed, WRIA 12 Chambers/Clover Creek Watershed. March.
Pierce County GIS. 2006, 2007. Pierce County Online GIS Data Catalog. Available: http://yakima.co.pierce.wa.us/geodataexpress/main.html
Pierce County Planning and Land Services (PALS). 1999. Upper Nisqually Valley Community Plan.
Pierce County Planning and Land Services (PALS). 2007. Pierce County Planning Regulations website. Available: http://www.co.pierce.wa.us/pc/services/home/property/pals/regs/regs.htm
Pilkey, O.H and H. L. Wright, 1988. Seawalls versus beaches, In: N.C. Kraus and O.H. Pilkey (Editors) The effects of seawalls on the beach, Journal of Coastal Research, SI 4, p. 41-64.
Polasik, S. 2005. Tacoma Narrows Bridge Hydraulic Analysis. Proceedings of the 2005 Structures Congress and the 2005 Forensic Engineering Symposium, April 20–24, 2005, New York, NY.
Port of Tacoma. 2000. Habitat Improvement and Restoration. Available: http://www.portoftacoma.com/aboutus.cfm?sub=28&lsub=7
Port of Tacoma. 2006. Comprehensive Scheme of Harbor Improvements, Revised and Amended August 3, 2006. Resolution 2006-07. Tacoma, Washington.
Poston, T. 2001. Treated Wood Issues Associated with Over-water Structures in Marine and Freshwater Environments, White paper, Prepared for Washington Department of Fish and Wildlife, Washington Department of Ecology, and Washington Department of Transportation, Olympia, Washington.
Pringle, P.T. and K.M. Scott. 2001. Postglacial influence of volcanism on the landscape and environmental history of the Puget Lowland, Washington—A review of geologic literature and recent discoveries, with emphasis on the landscape
June 2009 Page 10-23

Pierce County Shoreline Inventory and Characterization Report
disturbances associated with lahars, lahar runouts, and associated flooding. In Puget Sound Research 2001, Proceedings: Washington State Puget Sound Water Quality Action Team, 23 p.
Puget Sound Action Team (PSAT). 2003. Puget Sound update.
Puget Sound Water Quality Action Team. 2002. Puget Sound update. Seventh Report of the Puget Sound Ambient Monitoring Program. Olympia, Washington. 127 pp.
Puget Sound Nearshore Partnership (PSNP). 2008. Around the Sound, Fall 2008.
Puget Sound Partnership (PSP). 2009. Puget Sound 2009 Economic Stimulus Projects. Updated February 3, 2009.
Puget Sound Partnership. 2009. Puget Sound Action Agenda (Action Agenda). Updated May 27, 2009. Olympia, Washington. Available at: http://www.psp.wa.gov/aa_action_agenda.php
Puget Sound T-Sheets. Undated. Available: http://riverhistory.ess.washington.edu/tsheets/framedex.htm
Puyallup River Watershed Council (PRWC). 2007a. Forum Meeting Notes, May 23, 2007.
Puyallup River Watershed Council (PRWC). 2007b. Watershed Action Agenda: Priorities for Focus Within the Puyallup River Watershed - 2007 through 2011.
Puyallup Tribe of Indians. Undated. Fisheries. Available: http://www.puyallup-tribe.com/index.php?nav=programs&id=21. Accessed January 2009.
Redman, S., D. Myers, and D. Averill, eds. (2005). Regional Nearshore and Marine Aspects of Salmon Recovery in Puget Sound. Shared Strategy for Puget Sound. June 28, 2005.
Rheinhardt, R.D., M.C. Rheinhardt, M.M. Brinson, and K. Faser. 1998. Forested wetlands of low order streams in the inner coastal plain of North Carolina, USA. Wetlands, v. 18, p. 365-378.
Rice, C. A. 2006. Effects of Shoreline Modification on a Northern Puget Sound Beach: Microclimate and Embryo Mortality in Surf Smelt (Hypomesus pretiosus). Estuaries and Coasts, v. 29, n. 1, p. 63-71.
Ridolfi Inc. 2005. Water Quality Standards for Surface Waters of the Puyallup Tribe. Prepared for the Puyallup Tribe of Indians. Available: http://www.nwifc.wa.gov/water/documents/PTIWQS_rev_050311.pdf
Page 10-24 June 2009

Pierce County Shoreline Inventory and Characterization Report
Ridolfi Inc. and Adolfson Associates, Inc. 2003. Year 1 (2002) Monitoring Report for Commencement Bay Habitat Restoration Sites. Prepared for the Commencement Bay Natural Resource Damage Assessment and Restoration Trustees. June 2003.
Roering, J.J., K.M. Schmidt, J.D. Stock, W.E. Dietrich, and D.R. Montgomery. 2003. Shallow landsliding, root reinforcement, and the spatial distribution of trees in the Oregon Cost Range, Canadian Geotechnical Journal, v. 40, p. 237-253.
Rose, L.A. 2005. Saltwater Wetlands of Concern.
Rosen, J. 1977. Increasing shoreline erosion rates with decreasing tidal range in the Virginia Chesapeake Bay: Chesapeake Science, v. 18, p. 383-386.
Ruckleshaus, M. H. and M. M. McClure. 2007. Sound Science: Synthesizing ecological and socioeconomic information about the Puget Sound ecosystem. Prepared in cooperation with the Sound Science collaborative team. U.S. Department of Commerce, National Oceanic and Atmospheric Administration (NMFS), Northwest Fisheries Science Center, Seattle, WA. 93 p.
Runge, J., M. Marcantonio, and M. Mahan. 2003. Salmonid Habitat Limiting Factors Analysis Chambers-Clover Creek Watershed (Including Sequalitchew Creek and Independent Tributaries) Water Resource Inventory Area 12. Pierce Conservation District. June 2003.
Salo, E.O. and T.H. Jagielo. 1983. The Status of the Anadromous Fishes of the White-Puyallup River System. Report to the U.S. Army Corps of Engineers, Seattle District, Washington.
Sargeant et al. 2005. Nisqually River Basin Fecal Coliform Bacteria and Dissolved Oxygen Total Maximum Daily Load Study. Washington State Department of Ecology, Publication #05-03-002, Olympia, Washington. Available: http://www.ecy.wa.gov/biblio/0503002.html
Schwartz, M. 1995. Coastal Processes in the Lummi Peninsula Region, prepared for the Lummi Indian Business Council.
Schwartz, M.L. et al. 1991. Net shore-drift in Washington State: Vol. 3, Central Puget Sound, Shorelands and Coastal Zone Management Program, Washington Department of Ecology, Olympia, Washington.
Sedell, J. R. and R. L. Beschta. 1991. Bringing back the “bio” in bioengineering. American Fisheries Society Symposium, v. 10, p. 160-175.
Severinghaus, J. and T. Atwater. 1990. Cenozoic geometry and thermal state of the subducting slabs beneath North America. In Basin and Range extensional tectonics near the latitude of Las Vegas, Nevada, Wernicke, B.P. (ed.), Geological Society of America Memoir 176, p. 1–22.
June 2009 Page 10-25

Pierce County Shoreline Inventory and Characterization Report
Shaffer, J. A., D. C. Doty, R. M. Buckley, and J. E. West. 1995. Crustacean community composition and trophic use of the drift vegetation habitat by juvenile splitnose rockfish Sebastes diplopora. Marine Ecology Progress Series 123:13-21.
Shannon and Wilson, Inc. 1998. Geology and Soils Technical Expertise Report: State Route 16 / Tacoma Narrows Corridor: Prepared by Shannon & Wilson, Inc., Seattle, Washington, for HNTB Corporation, 27 p.
Shannon and Wilson, Inc. 2000. Tacoma Narrows Bridge: Preliminary Engineering Geotechnical Report. Prepared for Parsons Transportation Group/HNTB, 67 p.
Shapiro and Associates. 1992. Assessment of habitat loss in Commencement Bay cumulative impact study. Prepared for the U.S. Army Corps of Engineers, Seattle District, Washington.
Shared Salmon Strategy. 2006. Watershed Work Plans for the Implementation of the First Three Years of the Puget Sound Salmon Recovery Plan: East Kitsap, Nisqually, and Puyallup/White and Chambers/Clover chapters. Available: http://www.sharedsalmonstrategy.org/RecoveryPlan.htm#plan
Shared Strategy for Puget Sound (SSPS). Undated. Salmon and the Puyallup/White and Chambers/Clover Creek Watersheds. Available: http://www.sharedsalmonstrategy.org/watersheds/watershed-puyallup.htm#Changes. Accessed January 2009.
Shared Strategy for Puget Sound Development Committee. 2005. Draft Puget Sound Salmon Recovery Plan. Available: http://www.sharedsalmonstrategy.org/plan/
Shared Strategy for Puget Sound. Undated. Watershed Profile: Salmon and the Nisqually Watershed. Available: http://www.sharedsalmonstrategy.org/watersheds/watershed-nisqually.htm. Accessed January 2009.
Sherrod, B.L., et al. 2004. Holocene fault scarps near Tacoma, Washington, USA: Geology, v. 32, n. 1, p. 9-12.
Shipman, H. 2001. Coastal Landsliding on Puget Sound: A review of landslides occurring between 1996 and 1999, Publication #01-06-019, Shorelands and Environmental Assistance Program, Washington Department of Ecology, Olympia.
Shipman, H. 2004. Coastal Bluffs and Sea Cliffs on Puget Sound, Washington. In Formation, evolution, and stability of coastal cliffs-status and trends, M.A. Hampton and G.B. Griggs, (eds.). U.S. Geological Survey Professional Paper 1693, p. 81-94.
Simenstad, C. A. 2000. Appendix Report 3.5. Estuarine landscape impacts on Hood Canal and Strait of Juan de Fuca summer chum salmon and recommended
Page 10-26 June 2009

Pierce County Shoreline Inventory and Characterization Report
actions. In Summer Chum Salmon Conservation Initiative, an Implementation Plan to Recover Summer Chum in Hood Canal and Strait of Juan de Fuca Region. Washington Department of Fish and Wildlife, Point-No-Point Treaty Tribes. April 2000.
Simenstad, C.A. 2003. Commencement Bay aquatic ecosystem assessment: ecosystem-scale restoration for juvenile salmon recovery. University of Washington, School of Fisheries, Sof-UW-2003, Seattle, Washington. 25pp.
Simenstad, C. A., C.D. Tanner, R.M. Thom, and L.L. Conquest. 1991. Estuarine habitat assessment protocol, U.S. EPA, Seattle, WA.
Simenstad, C. M., B. Nightingale, R. M. Thom, and D. K. Shreffler. 1999. Impacts of ferry terminals on juvenile salmon migrating along Puget Sound shorelines: Phase I synthesis of state of knowledge. Research Project T9903 Task A2. Washington StateTransportation Center.
Simenstad, C., M. Lodgson, K. Fresh, H. Shipman, M. Dethier, and J. Newton. 2006. Conceptual Model for Assessing Restoration of Puget Sound Nearshore Ecosystems. Puget Sound Nearshore Partnership. Technical Report 2006-03.
Smith, M. 1972. Stratigraphy and chronology of the Tacoma area, Washington: Bellingham, Washington, Western Washington University, M.S. Thesis, 38 p.
Smith, M. 1976. Surficial geology of northeast Tacoma, Pierce County, Washington: Washington Division of Geology and Earth Resources Geologic Open File Report 76-9, scale 1:24,000.
Smith, M. 1977. Geologic map of the City of Tacoma, Pierce County, Washington: Washington Division of Geology and Earth Resources.
Soil Conservation Service. 1979. Soil survey of Pierce County area, Washington: U.S. Department of Agriculture.
South Puget Sound Salmon Enhancement Group (SPSSEG). 2004. Chinook & Bull Trout Recovery Approach for the South Puget Sound Nearshore – Draft. Prepared for the Shared Strategy for Puget Sound. Available: http://www.piercecountywa.org/xml/abtus/ourorg/exec/specialprojects/chinookrecovery/Nearshore/SPSSR%20Plan%20Draft%20V1.pdf
South Puget Sound Salmon Enhancement Group (SPSSEG). 2006. SalmonGram, The South Puget Sound Salmon Enhancement Group Newsletter Fall 2006.
South Puget Sound Salmon Enhancement Group (SPSSEG). 2007. SalmonGram, The South Puget Sound Salmon Enhancement Group Newsletter Spring 2007.
South Puget Sound Salmon Enhancement Group (SPSSEG). 2008. SalmonGram, The South Puget Sound Salmon Enhancement Group Newsletter. Winter 2008.
June 2009 Page 10-27

Pierce County Shoreline Inventory and Characterization Report
South Puget Sound Salmon Enhancement Group (SPSSEG). 2009a. Mashel River ELGs. Available: http://www.spsseg.org/?page_id=423. Accessed January 2009.
South Puget Sound Salmon Enhancement Group (SPSSEG). 2009b. WRIA 11/12 Nearshore Assessment. Available: http://www.spsseg.org/index.php/projects/habitat-assessment/wria-1112-nearshore-assessment/. Accessed January 2009.
Stanford, J. A. and J. V. Ward. 1993. An ecosystem perspective of alluvial rivers: connectivity and the hyporheic corridor. Journal of North American Benthological Society, v. 12, n. 1, p. 48-60.
Stanley, S., J. Brown, and S. Grigsby. 2005. Protecting Aquatic Ecosystems: A Guide for Puget Sound Planners to Understand Watershed Processes. Washington State Department of Ecology, Publication #05-06-013, Olympia, Washington. Available: http://www.ecy.wa.gov/biblio/0506027.html
State of Washington. 1997. Water quality standards for surface waters of the State of Washington: Washington Administrative Code, Chapter 173-201A.
Stick, K. C. 2005. 2004 Washington State Herring Stock Status Report. Washington Department of Fish and Wildlife, Fish Program, Fish Management Division. SS-05-01.
Straus, Kristina M., L.M. Crosson, and B. Vadopalas. 2008. Effects of Geoduck Aquaculture on the Environment, A Synthesis of Current Knowledge. University of Washington, School of Aquatic and Fishery Sciences, prepared or Washington Sea Grant. Seattle, WA. 67 pp.
Sumioka, S.S. 2004. Trends in streamflow and comparisons with instream flows in the Lower Puyallup Basin, Washington, U.S. Geological Survey Scientific Investigations Report 2004-5016, 46 p.
Tacoma News Tribune. 2006. Carbon River Critters Get More Room. July 27, 2006.
Tacoma Power. 2009. Parks and Recreation information. Available at: http://www.ci.tacoma.wa.us/power/parksandpower/parks_recreation/alder_lake_park.htm. Accessed March 2009.
Tait, J. F. and G. B. Griggs, 1991. Beach response to the presence of a seawall: a comparison of field observations. US Army Engineers Waterways Experiment Station, Contract Report CERC 91-1, 60 pp.
TCPHD (Tacoma-Pierce County Health Department). 2003. Chambers-Clover Technical Assessment Final Report. Prepared by Robinson & Noble, Inc., Brown and Caldwell, Inc., Applied Environmental Services, Inc., and Water Rights, Inc. April 10, 2003.
Page 10-28 June 2009

Pierce County Shoreline Inventory and Characterization Report
TCPHD (Tacoma-Pierce County Health Department). 2004. Chambers-Clover Watershed Management Plan. September 21, 2004. Ecology Grant Number G9900033. Prepared in association with Triangle Associates, Inc., and TetraTech/KCM.
Tetra Tech and KCM. 2002. Pierce County Clover Creek Basin Characterization Report.
Thom, R. M. and R. G. Albright. 1990. Dynamics of benthic vegetation standing stock, irradiance, and water properties in Puget Sound. Marine Biology 104: 129 – 141.
Thom, R. M., and D. K. Shreffler. 1994. Shoreline armoring effects on coastal ecology and biological resources in Puget Sound, Washington. Coastal Erosion Management Studies, Volume 7. Prepared for the Washington Department of Ecology, Olympia.
Thom, R. M., A. B. Borde, G. D. Williams, J. A. Southard, S. L. Blanto and D. L. Woodruff. 2001. Effects of multiple stressors on eelgrass restoration projects. Battelle Marine Sciences Laboratory, Pacific Northwest National Laboratory. In Proceedings of Puget Sound Research.
Thom, R. M., A. B. Borde, W. Gardiner, D. Schreffler, P. Farley, J. Norris, S. Willey-Echeverria and T. McKenzie. 1998. Puget Sound eelgrass meadows: depth distribution and spatial patchiness. Puget Sound ’98 Conference Proceedings, March 12-13, 1998, Seattle, WA.
Thorsen, G. W. 1987. Soil Bluffs + Rain = Slide hazards. Washington Geologic Newsletter, v. 15, n. 3, p. 3-11.
Till, L. and D. Caudill. 2003. South Puget Sound Wildlife Area Fish Passage and Diversion Screening Prioritization Inventory. Habitat Program, Technical Applications Division, Habitat and Passage Projects Section. Washington Department of Fish and Wildlife. Available online at http://wdfw.wa.gov/hab/tapps/reports/spswa.pdf .
Troost, K.G., in review, Geologic map of the Puyallup 7.5-minute quadrangle, Washington: U.S. Geological Survey Miscellaneous Field Investigation, scale 1:24,000.
Troost, K.G., and D.B. Booth. 1997. Field trip guide: Quaternary stratigraphy of the Tacoma area: August 23, 1997, 2nd Symposium on the Hydrogeology of Washington State.
Troost, K.G. and D.B. Booth. 2001. Geologic map of the Tacoma North 7.5-minute quadrangle, Washington, U.S. Geological Survey, Open-File Report, scale 1:24,000.
June 2009 Page 10-29

Pierce County Shoreline Inventory and Characterization Report
Troost, K.G., D.B. Booth and R.K. Borden. 2001. Geologic map of the Steilacoom 7.5-minute quadrangle, Washington, U.S. Geological Survey, Open-File Report, scale 1:24,000, (submitted).
Trust for Public Land. Public Access Regional Maps. http://www.tpl.org/tier3_cd.cfm?content_item_id=19981&folder_id=262
Tubbs, D.W. 1974. Causes, Mechanisms and Prediction of Landsliding in Seattle. Unpublished dissertation, University of Washington, November 1975.
U.S. Army Corps of Engineers. 1981. Shore protection selection criteria. Technical Note CETN-III-6. Waterways Experiment Station, Vicksburg, Mississippi. 2 pp.
U.S. Army Corps of Engineers. 2005. Puyallup River Side Channel Real Estate Actions Final Environmental Assessment. Seattle District Corps of Engineers. March 2005.
U.S. Army Corps of Engineers et al. 1993. Commencement Bay Cumulative Impact Study (May/June 1993). Prepared by U.S. Army Corps of Engineers, National Oceanic and Atmospheric Administration, U.S. Department of the Interior, and U.S. Environmental Protection Agency.
U.S. Department of the Interior (USDI). 1987. National Wetlands Inventory, Washington 7.5-minute USGS Quadrangles (54 quads). Available: http://wetlandsfws.er.usgs.gov/NWI/download.html
U.S. Environmental Protection Agency. 1993. Support document for sole source aquifer designation of the Central Pierce County aquifer system: U.S. Environmental Protection Agency.
U.S. Fish and Wildlife Service (USFWS). 1987. National Wetland Inventory map, Steilacoom, Washington.
U.S. Fish and Wildlife Service (USFWS). 1988. National Wetland Inventory map, Tacoma South, Washington.
U.S. Fish and Wildlife Service (USFWS). 1989. National Wetland Inventory map, Spanaway, Washington.
U.S. Fish and Wildlife Service (USFWS). 2004. Draft Recovery Plan for the Coastal-Puget Sound Distinct Population Segment of Bull Trout (Salvelinus confluentus). Volumes I (Puget Sound Management Unit, 389 + xvii pp.) and II (Olympic Peninsula Management Unit, 277 +xvi pp.). Portland, Oregon. http://www.fws.gov/pacific/bulltrout/RP/Puget%20Sound_Vol1_Puget%20Sound.pdf
U.S. Fish and Wildlife Service (USFWS) and U.S. National Oceanic and Atmospheric Administration. 1997. Commencement Bay Natural Resource Damage
Page 10-30 June 2009

Pierce County Shoreline Inventory and Characterization Report
Assessment: Restoration Plan and Final Programmatic Environmental Impact Statement.
U.S. Geological Survey (USGS). 1990. Sediment Transport in the Lower Puyallup, White, and Carbon Rivers of Western Washington. Prepared in cooperation with the Pierce County Public Works Department and Washington State Department of Ecology. Available: http://pubs.er.usgs.gov/usgspubs/wri/wri894112
U.S. Geological Survey (USGS). 1998. Volcano hazards from Mount Rainier, Washington: U.S. Geological Survey, Open file report 98-428, revised 1998.
U.S. Geological Survey (USGS). 2000. Fact Sheet - Ground-Water Flooding in Glacial Terrain of Southern Puget Sound, Washington.
Upper Puyallup Watershed Committee. 2002. Upper Puyallup Watershed Characterization and Action Plan. Available: http://piercecountywa.gov/pc/services/home/environ/water/ps/watershed/uppuymain.htm
Vallance, J.W. and K.M. Scott. 1997. The Osceola Mudflow from Mount Rainier: Sedimentology and hazard implications of a huge clay-rich debris flow. Geological Society of America Bulletin, v. 109, n. 2, p. 143-163.
Walder, J.S. and C.L. Driedger. 1993. Glacier-generated debris flows at Mount Rainier. USGS Open File Report 93-124.
Walsh, T.J. 1987. Geologic map of the south half of the Tacoma quadrangle, Washington: Olympia, Wash., Washington Division of Geology and Earth Resources, Open file report 87-3, scale 1:100000, 10 p.
Walters, K.L., and G. Kimmel. 1968. Ground-water occurrence and stratigraphy of unconsolidated deposits, Central Pierce County, Washington: Washington Department of Water Resources, Olympia, Washington.
Washington Conservation Commission. 2000. Salmon & Steelhead Habitat Limiting Factors WRIA Area 26 (Cowlitz).
Washington Conservation Commission. 2000. Salmon & Steelhead Habitat Limiting Factors WRIA Area 11 (Nisqually Watershed).
Washington Conservation Commission. 2000. Salmon & Steelhead Habitat Limiting Factors WRIA Area 15 (East Kitsap Watershed).
Washington Conservation Commission. 2003. Salmonid Habitat Limiting Factors Analysis Chambers-Clover Creek Watershed (Including Sequalitchew Creek and Independent Tributaries) Water Resource Inventory Area 12.
June 2009 Page 10-31

Pierce County Shoreline Inventory and Characterization Report
Washington Department of Archaeology and Historic Preservation. 2006b. The Washington Information System for Architectural and Archaeological Records Data (WISAARD). Available: http://www.oahp.wa.gov/pages/wisaardIntro.htm
Washington Department of Archeology and Historic Preservation (WDAHP). 2006a. Archeological and historic resources database. Available at WDAHP offices, Olympia, Washington.
Washington Department of Fish and Wildlife (WDFW). 2000. Critical spawning habitat for herring, surf smelt, sand lance, and rock sole in Puget Sound Washington. Washington Department of Fish and Wildlife, Fish Program. Olympia, WA.
Washington Department of Fish and Wildlife (WDFW). 2004. Priority habitats and species database: Surfsmelt spawning areas. Metadata available at: http://gisdw/intranet/sdc/nonkcgis/content/enviro_ext/sph_smelt.htm.
Washington Department of Fish and Wildlife (WDFW). 2004. Priority habitats and species database: Pacific sand lance spawning areas. Metadata available at: http://gisdw/intranet/sdc/nonkcgis/content/enviro_ext/sph_sandlanz.htmhttp:/gisdw/intranet/sdc/nonkcgis/content/enviro_ext/sph_sandlanz.htm.
Washington Department of Fish and Wildlife (WDFW). 2005a. Priority Species and Habitat Lists and StreamNet database. Olympia, Washington.
Washington Department of Fish and Wildlife (WDFW). 2005b. Priority Species List: Vertebrates. Olympia, Washington. Available: http://wdfw.wa.gov/hab/phsvert.htm
Washington Department of Fish and Wildlife (WDFW). 2007a. Priority Habitats and Species database information.
Washington Department of Fish and Wildlife (WDFW). 2007b. SalmonScape data. Olympia, Washington. Available: http://wdfw.wa.gov/mapping/salmonscape/index.html
Washington Department of Water Resources. 1968. Ground-water occurrence and stratigraphy of unconsolidated deposits, central Pierce County, Washington: Washington Department of Water Resources Water Supply Bulletin no. 22, Olympia, Washington.
Washington Office of Financial Management. 2006. Historical Data. Available: http://www.ofm.wa.gov/pop/
Washington State Department of Ecology (Ecology). Public Access Information. BEACH Program. http://www.ecy.wa.gov/programs/eap/beach/
Page 10-32 June 2009

Pierce County Shoreline Inventory and Characterization Report
Washington State Department of Ecology (Ecology). Digital Coastal Atlas. Shorelands and Environmental Assistance Program. Available: http://apps.ecy.wa.gov/website/coastal_atlas/viewer.htm
Washington State Department of Ecology (Ecology). 1979. Coastal Zone Atlas of Washington: Volume 7, Pierce County; Publication No. DOE 77-21-7.
Washington State Department of Ecology (Ecology). 1991. Shoreline Aerial Photos. Available: http://apps.ecy.wa.gov/shorephotos/index.html
Washington State Department of Ecology (Ecology). 1994. Whitman Lake – Pierce County: 1994. Available online at http://www.ecy.wa.gov/programs/eap/lakes/wq/docs/lkwhipi1.html.
Washington State Department of Ecology (Ecology). 1995. Chambers - Clover Creek Watershed Initial Assessment. Washington State Department of Ecology, Publication #95-157, Olympia, Washington. Available: http://www.ecy.wa.gov/biblio/95157.html
Washington State Department of Ecology (Ecology). 2001. Shorelands and Environmental Assistance Program, Olympia, Washington. Shoreline Oblique air photos. April 2001.
Washington State Department of Ecology (Ecology). 2002. Seasonal Patterns and Controlling Factors of Primary Production in Puget Sound's Central Basin and Possession Sound. Available: http://www.ecy.wa.gov/biblio/wria10.html.
Washington State Department of Ecology (Ecology). 2003. South Prairie Creek Bacteria and Temperature TMDL (Water Cleanup Plan). Water Quality Program, Publication Number 03-10-055.
Washington State Department of Ecology (Ecology). 2004a. Restoration Planning and the 2003 Shoreline Management Guidelines.
Washington State Department of Ecology (Ecology). 2004b. Water Quality Assessment for Washington: 2002/2004 Candidate List. Available: http://www.ecy.wa.gov/Programs/wq/303d/2002/2002-index.html
Washington State Department of Ecology (Ecology). 2005a. 2004 Water Quality Assessment (Final) – Category 5 Listings for WRIA 10. Available: http://www.ecy.wa.gov/programs/wq/303d/2002/2004_documents/wria_pdfs-5final/kk-active-5-wria10.pdf
Washington State Department of Ecology (Ecology). 2005b. Nisqually River Basin Fecal Coliform Bacteria and Dissolved Oxygen Total Maximum Daily Load Study. May 2005.
June 2009 Page 10-33

Pierce County Shoreline Inventory and Characterization Report
Washington State Department of Ecology (Ecology). 2005c. Stormwater Management Manual for Western Washington. Publication Numbers 05-10-029 through 05-10-33. Olympia, Washington.
Washington State Department of Ecology (Ecology). 2006a. Quality Assurance Project Plan, Puyallup River Watershed, Fecal Coliform Bacterial TMDL. Publication Number 06-03-115.
Washington State Department of Ecology (Ecology). 2006b. South Prairie Creek Bacteria and Temperature Total Maximum Daily Load (Water Cleanup Plan) - Detailed Implementation Plan - Draft. March 2006. Publication Number 06-10-018. Available: http://www.co.pierce.wa.us/xml/services/home/environ/water/ps/prwc/2006/SouthPrairieCreekDIP-finalDraft.pdf. Accessed January 2009.
Washington State Department of Ecology (Ecology). 2006c. Washington’s Water Quality Management Plan to Control Nonpoint Sources of Pollution Volume 1: Water Quality Summaries for Watersheds in Washington State. June 2006. Publication Number 06-10-039. Prepared by: Bill Hashim, Washington State Department of Ecology Water Quality Program. Available: http://www.ecy.wa.gov/pubs/0610039/.
Washington Department of Ecology. 2008. Final Progress Report, House Bill 2220 Shellfish Aquaculture Regulatory Committee. Report to the Washington State Legislature, December 2008, Publication No. 08-06-024. Olympia, Washington. Available at: http://www.ecy.wa.gov/biblio/0806024.html
Washington Department of Ecology. 2009. Shellfish Aquaculture Regulatory Committee Recommendations On Guidelines For Geoduck Aquaculture Operations. January 2009. Publication No. 09-06-024. Olympia, Washington. Available at: http://www.ecy.wa.gov/biblio/0906001.html
Washington State Department of Ecology (Ecology), Southwest Regional Office, Water Resources Program; Science Applications International Corporation; Shapiro and Associates; Taylor Associates; and Environmental Systems Research Institute, 1995a. Draft Initial Watershed Assessment Water Resources Inventory Area 12 Chambers-Clover Creek Watershed. Open-File Report 95-09.
Washington State Department of Ecology (Ecology), Southwest Regional Office, Water Resources Program; Science Applications International Corporation; Shapiro and Associates; Taylor Associates; and Environmental Systems Research Institute, 1995b. Draft Initial Watershed Assessment Water Resources Inventory Area 10 Puyallup-White River Watershed. Open-File Report 95-08.
Washington State Department of Health (DOH). 2005 Annual Inventory: Commercial and Recreational Shellfish Areas of Washington State. Office of Food Safety and Shellfish, Washington State Department of Health, Olympia, WA. June 2006. 33p.
Page 10-34 June 2009

Pierce County Shoreline Inventory and Characterization Report
Washington State Department of Health (DOH). 2006. Marine Biotoxin Closure Zones. Available: http://ww4.doh.wa.gov/scripts/esrimap.dll?name=BIOVIEW&Left=587799&Bottom=337200&Right=1337201&Top=1360000&Co=Select+a+County&Beach=Select+a+Beach&Step=1&click.x=225&click.y=133.
Washington State Department of Health (DOH). 2007. Washington State Department of Health 2007 Early Warning System Summary for Shellfish Growing Areas in Pierce County. May 2007. Available: http://www.doh.wa.gov/ehp/sf/growreports.htm
Washington State Department of Natural Resources (DNR) –Division of Geology and Earth Resources. 2001a. Digital geologic maps of the 1:100,000 quadrangles of Washington. Olympia, WA. Available: http://www.dnr.wa.gov/geology/dig100k.htm
Washington State Department of Natural Resources (DNR). 2001b. Washington State ShoreZone Inventory, Nearshore Habitat Program, Washington State Department of Natural Resources. Olympia, Washington. Available: http://www2.wadnr.gov/nearshore/
Washington State Department of Natural Resources (DNR). 2003. Natural Heritage Plan.
Washington State Parks. 2006. Washington State Accessible Outdoor Recreation Guide - North Puget Sound Region. Available: http://www.parks.wa.gov/ada-rec/detail.asp?region=NPS#12 .
Washington Water Trust (WWT). 2009. South Prairie Creek information. Available: www.thewatertrust.org.
Washington Wildlife and Recreation Coalition (WWRP). 2008. West Farm. Available: http://www.wildliferecreation.org/wwrp-projects/projects/West_Farm?searchterm=west+farm. Accessed March 2009.
Watershed Professionals Network et al. 2002. Nisqually River Level I Watershed Assessment (WRIA 11). Available: http://www.ecy.wa.gov/programs/eap/wrias/assessments/wria11/index.html
Wiles, G.J. 2004. Washington State status report for the killer whale. Washington Department Fish and Wildlife, Olympia, Washington. 106 pp.
Williams, G.D., and R.M. Thom. 2001. Development of Guidelines for Aquatic Habitat Protection and Restoration: Marine and Estuarine Shoreline Modification Issues. PNWD-3087. Prepared for the Washington State Department of Transportation, Washington Department of Fish and Wildlife, and the Washington Department of Ecology, by Battelle Marine Sciences Laboratory, Sequim, Washington.
June 2009 Page 10-35

Pierce County Shoreline Inventory and Characterization Report
Page 10-36 June 2009
Williams, G.D, R.M. Thom, and N.R. Evans. 2004. Bainbridge Island Nearshore Habitat Characterization and Assessment, Management Strategy Prioritization, and Monitoring Recommendations. PNWD-3391. Prepared for the City of Bainbridge Island: Bainbridge Island, WA; by Battelle Marine Sciences Laboratory: Sequim, WA.
Williams, G.D, R.M. Thom, J.E. Starkes, J.S. Brennan, J.P. Houghton, D. Woodruff, P.L.Striplin, M. Miller, M. Pedersen, A. Skillman, R. Kropp, A. Borde, C. Freeland, K. McArthur, V. Fagerness, S. Blanton, and L. Blackmore. 2001. Reconnaissance Assessment of the State of the Nearshore Ecosystem: Eastern Shore of Central Puget Sound, Including Vashon and Maury Islands (WRIA’s 8 and 9). J.S. Brennan, Editor. Report prepared for King County Department of Natural Resources, Seattle, Washington.
Williams, R.W., R.M. Laramie and J.J. James. 1975. A Catalog of Washington Streams and Salmon Utilization: Volume 1, Puget Sound Region. Washington State Department of Fisheries, Olympia, Washington. November 1975.
Woodward, D.G., F.A. Packard, N.P. Dion and S.S. Sumioka. 1995. Occurrence and quality of ground water in southwestern King County, Washington. U. S. Geological Survey Water Resources Investigations Report 92-4098, 69 p., 4 plates.
Zehfuss, P.H. 2005. Distal records of sandy Holocene lahars from Mount Rainier, Washington. Ph.D. Dissertation. Seattle, WA: University of Washington, 160 p.
Zehfuss, P.H., B.F. Atwater, J.W. Vallance, H. Brenniman, and T.A. Brown. 2003. Holocene lahars and their by-products along the historical path of the White River between Mount Rainier and Seattle. Pp. 209-223 in Western Cordillera and Adjacent Areas, Swanson, T.W. (ed.), Geological Society of America Field Guide, Boulder, Colorado, v. 4.
Zelo, I., H. Shipman, and J. Brennan. 2000. Alternative Bank Protection Methods for Puget Sound Shorelines. Prepared for the Shorelands and Environmental Assistance Program, Washington Department of Ecology, Olympia, Washington. Publication #00-06-012.

Pierce County Shoreline Inventory and Characterization Report
APPENDIX A:
MAP FOLIO
June 2009 Appendix A


Pierce County Shoreline Inventory and Characterization Report
June 2009 Page A-1
APPENDIX A: MAP FOLIO TABLE OF CONTENTS
1 Shorelines of the State 2 City Limits and Urban Growth Areas 3 Indian Reservation Lands 4 Marine Shorelines 5 Freshwater Shorelines 6 WRIAS and Basins 7 Geology 8 Soils 9 Topography and Hydrology 10 Land Cover 11 Hydrology - Important Areas 12 Hydrology - Alterations 13 % Impervious Surface by Basin 14 Forest Cover 15 Sediment - Important Areas 16 Sediment - Alterations 17 Water Quality - Important Areas 18 Water Quality - Alterations 19 Organics 20 Shoreline Inventory Areas 21 Marine Shoreline Reaches 22 Freshwater Shoreline Reaches - East 23 Freshwater Shoreline Reaches - West 24 Eelgrass and Kelp Beds 25 Commercial Shellfish Growing Areas 26 Existing Land Use Patterns 27 Future Land Use 28 Marine Reaches - Existing Environmental Designations 29 Eastern Freshwater Reaches - Existing Environment Designations 30 Western Freshwater Reaches - Existing Environment Designations

Pierce County Shoreline Inventory and Characterization Report
APPENDIX B:
GIS DATA SOURCES
June 2009 Appendix B


Appendix B - GIS / Mapping Data Sources PIERCE COUNTY SMP UPDATE
June 2009 Page B-1
One of the first steps in development of Pierce County’s shoreline inventory and characterization is determining available spatial data for mapping and analysis, as well as existing reports and plans. Below is a list of mapping GIS data typically used for analysis and preparation of the shoreline inventory and characterization map folio. Many of the themes are Pierce County owned or maintained. Others are standard from state resource agencies. For each theme or data layer, we have identified the status or availability of the data and if a particular mapping theme represents a data gap. The list was compiled cooperatively between Pierce County PALS GIS staff, ESA Adolfson staff, and reviewed by Department of Ecology technical staff.
An interactive web-based mapping application was developed for use by the report authors, County staff, and the Technical Advisory Group. Data was used to visually display over 80 mapping themes (e.g., piers and docks, eelgrass distribution, flood hazards, fish distribution) related to individual shoreline reaches. In addition, GIS overlay analysis was used to quantify certain conditions (e.g., spatial extent of wetlands, land use designations) in the shoreline planning area. The mapping application was web-based and allows viewers to interactively view, pan, zoom, and query mapping information. It allows users to zoom to their desired scale, turn specific mapping layers on and off, or view them in combination, as well as access some of the “data behind the maps” more readily. FGDC compliant metadata is available on the website for all of the mapping layers. This GIS data is now maintained by Pierce County Planning and Land Services.
Theme Data Source Status / Availability Soils SSURGO soil mapping (1:24K scale) is available for the Pierce County and
Snoqualmie Pass Soil Survey Areas. STATSGO statewide soil mapping (1:250K scale) is available for Pierce County except for Fort Lewis, Federal Lands, and the City of Tacoma.
Obtained
Geology WDNR has 1:100K scale Statewide data available. County Has Dataset With Fields Such As Dynamic Settlement And Liquefaction.
100K scale obtained
Hydrography 1) County GIS data (streams, lakes, river, marine). County has updated versions 6/1/2006 & 11/27/2006. Hydro- centerlines and Hydro – surface boundaries 2) WARIS Stream Hydrography
Obtained
Puget Sound Shoreline Shoreline based on LIDAR and Aerial Photos Obtained
Floodplains 1) County Floodplain (update to FEMA floodplain). 2) FEMA Floodplain 3) Channel Migration Zones (portions of Puyallup, White, Carbon,
South Prairie)
Obtained
Drainage basin boundaries (surface water and or storm water basins)
King County, Pierce County GIS (drnbasin.shp). Obtained – No other more refined County owned data sources is confirmed.

Pierce County Shoreline Inventory and Characterization Report
Theme Data Source Status / Availability Topography 30m DEM for Pierce County from WDNR; 20’ topo contours from Pierce
County; 2’ topo contours. County developing refined contour dataset based on lidar data. Lidar tins dataset available for small scale areas.
Obtained
Air Photos / Orthophotography
County has 2005 orthophotos and 2002 CIR Obtained
Historic air photos or scanned GLO maps (T-sheets)
From UW Puget Sound River History Project. Available for the Puyallup and Nisqually.
Obtained (partial) - others available online
WDFW PHS / Streamnet / Wildlife Heritage / Marine Resource Species
Included in Adolfson on-call area. Obtained
Parcels County GIS data. Obtained
Existing Land Use / Assessor data
County GIS data. (including present use per Assessor codes) Obtained
Zoning County GIS data. Obtained
Future Land Use / Comp Plan Land Use Designations
County GIS data. Obtained
Impervious Area County has this dataset, based on 2005 orthophotos Obtained
Vegetation / Land Cover NOAA (landsat derived) CCAP data (Western Washington, 2001 land cover) Obtained
Stormwater and wastewater pipes and outfalls
- Drainage Datasets (Limited, Appears CAD Derived) 1) Break Points 2) Channels 3) Catch Basins 4) Control Structures 5) Dry Wells 6) Manholes 7) Pipes 8) Sediment Traps 9) Vaults
- Wastewater Treatment Plants - Sewerlines - Man Holes
Obtained
Page B-2 June 2009

Pierce County Shoreline Inventory and Characterization Report
Theme Data Source Status / Availability - Stormwater ponds - Sanitary Pump Stations - Sewer Improvement Districts
Other utility lines (water, electric, natural gas, etc.)
1) Franchise Datasets (polygons) 2) Pipelines (Jet Fuel, Natural Gas, and Refined Petroleum)
Obtained
Septic tanks DATA GAP Possible source: Dept of Health
DATA GAP
Contaminated Sites Ecology facility site database. Obtained 2004 Water Quality Assessment (303d list)
Ecology Obtained
Historic / Cultural Resources Cultural Resource Inventory data from County. Hood Canal Archaeological Predictive Model (WDAHP)
Obtained
Critical areas data; aquifer recharge, landslide hazard/steep slopes, seismic hazard, wetlands, flood hazards
Layers available from County. POTENTIAL LAYERS
1) Aquifer Recharge 2) Potential Landslide Hazard 3) Potential Wetlands 4) Potential Fish & Wildlife Habitat 5) Potential Flood Hazard 6) Potential Seismic Hazard 7) Potential Mine Hazard 8) Potential Erosion Hazard
POTENTIAL LAYERS (SOURCE)
1) Wellhead Protection Area 2) Clover/Chambers Creek Aquifer 3) EPA Sole Source Aquifer 4) DRASTIC Zones 5) Slope Stability (CZA) 6) Steep Slopes (Urban Areas Only) 7) County Wetlands (CWI), Wetlands and Boundaries 8) Supplemental Wetland Inventory 9) National Wetland Inventory
Obtained
June 2009 Page B-3

Pierce County Shoreline Inventory and Characterization Report
Page B-4 June 2009
Theme taDa Source Status / Availability 10) County Floodplain 11) FEMA Floodplain 12) County Hydro Layer (Centerline and Surface Boundary, aka
Streams and Ponds) 13) Hydric Soils 14) Volcanic Hazard Areas 15) Volcanic Time of Travel 16) Channel Migration Zones 17) Mine Hazard Areas
Roads/Transportation Layers available from County. Obtained Shoreline Modifications; levees, revetments, piers, docks, bulkheads, boat ramps.
Partial DATA GAP County has: Levees, and limited docks datasets (planimetrics, gig harbor only)
Obtained what is available (partial DATA GAP)
Dairies Ecology point data - limited spatial extent Obtained Road Density Logging roads in upper watershed available from WDNR Available online (WDNR) Drift cells Ecology compiled statewide GIS file. Compilation of drift cell studies of
varying detail and dates of study; accuracy is limited. Obtained.
Feeder bluffs Nearshore salmon habitat data – Pierce County (marine shoreline and location of feeder bluffs)
Obtained
Eelgrass and Kelp Nearshore salmon habitat data – Pierce County (survey points, eel grass yes/no)
Obtained
Parks, Trails, Playfields, Designated Open Space (any public access location to the shoreline)
Pierce County open space corridors, and biodiversity management areas. Pierce County trails, saltwater trails, and parks. Ecology BEACH draft data.
Obtained County data; need to obtain draft Ecology data for BEACHES.

Pierce County Shoreline Inventory and Characterization Report
APPENDIX C:
REACH SCALE TABLES
June 2009 Appendix C

Pierce County Shoreline Inventory and Characterization Report
June 2009 Page C-1
APPENDIX C: REACH SCALE TABLES TABLE OF CONTENTS
Table 1A Marine Reaches Pierce County
Table 1B. Freshwater Reaches Pierce County
Table 2. Coastal Data by Marine Reach
Table 3. Biological and Water Quality Data by Marine Reach, Pierce County
Table 4A. Wetland Area by Marine Reach
Table 4B. Wetland Area by Freshwater Reach
Table 5A. Geologic and Hazard Data by Marine Reach
Table 5B. Geologic and Hazard Data by Freshwater Reach
Table 6. Fish Species, Habitat and Water Quality by Freshwater Reach
Table 7. Contaminated Sites, Marine
Table 8 Contaminated Sites, Freshwater
Table 9A. Land Use by Marine Reach
Table 9B. Land Use by Freshwater Reach
Table 10A. Parks and Public Access by Marine Reach
Table 10B. Parks and Public Access by Freshwater Reach
Table 11. Conservation Futures by Reach

TABLE 1A Marine Reaches Pierce County
# Reaches by Management Unit Management Units Reach Name WRIA Name WRIA Number Length (miles)
13 S.Key Peninsula + Islands AND IS 1 Kitsap 15 5.079S.Key Peninsula + Islands AND IS 2 Kitsap 15 5.802S.Key Peninsula + Islands AND IS 3 Kitsap 15 5.639S.Key Peninsula + Islands AND IS 4 Kitsap 15 1.356S.Key Peninsula + Islands AND IS 5 Kitsap 15 3.184
13 Carr Inlet - Henderson Bay CI-HB 1 Kitsap 15 5.540Carr Inlet - Henderson Bay CI-HB 10 Kitsap 15 1.830Carr Inlet - Henderson Bay CI-HB 11 Kitsap 15 1.694Carr Inlet - Henderson Bay CI-HB 12 Kitsap 15 4.436Carr Inlet - Henderson Bay CI-HB 13 Kitsap 15 9.107Carr Inlet - Henderson Bay CI-HB 2 Kitsap 15 2.270Carr Inlet - Henderson Bay CI-HB 3 Kitsap 15 2.887Carr Inlet - Henderson Bay CI-HB 4 Kitsap 15 1.844Carr Inlet - Henderson Bay CI-HB 5 Kitsap 15 7.446Carr Inlet - Henderson Bay CI-HB 6 Kitsap 15 5.818Carr Inlet - Henderson Bay CI-HB 7 Kitsap 15 6.767Carr Inlet - Henderson Bay CI-HB 8 Kitsap 15 3.345Carr Inlet - Henderson Bay CI-HB 9 Kitsap 15 3.610
11 Case Inlet CI-1 Kitsap 15 1.430Case Inlet CI-10 Kitsap 15 3.054Case Inlet CI-11 Kitsap 15 1.093Case Inlet CI-2 Kitsap 15 1.213Case Inlet CI-3 Kitsap 15 1.086Case Inlet CI-4 Kitsap 15 2.486Case Inlet CI-5 Kitsap 15 8.123Case Inlet CI-6 Kitsap 15 5.261Case Inlet CI-7 Kitsap 15 2.228Case Inlet CI-8 Kitsap 15 3.512Case Inlet CI-9 Kitsap 15 0.865
4 Colvos Pass-Tacoma Narrows CP-TN 1 Kitsap 15 2.273Colvos Pass-Tacoma Narrows CP-TN 2 Kitsap 15 4.027
Appendix C

TABLE 1A Marine Reaches Pierce County
# Reaches by Management Unit Management Units Reach Name WRIA Name WRIA Number Length (miles)
Colvos Pass-Tacoma Narrows CP-TN 3 Kitsap 15 3.999Colvos Pass-Tacoma Narrows CP-TN 4 Kitsap 15 5.895
1 Dash Point DP Puyallup 10 3.2123 Hale Pass Wollochet Bay HP-WB 1 Kitsap 15 7.838
Hale Pass Wollochet Bay HP-WB 2 Kitsap 15 4.519Hale Pass Wollochet Bay HP-WB 3 Kitsap 15 10.178S.Key Peninsula + Islands KTRN IS Kitsap 15 3.164S.Key Peninsula + Islands MCN IS 1 Kitsap 15 1.212S.Key Peninsula + Islands MCN IS 2 Kitsap 15 4.698S.Key Peninsula + Islands MCN IS 3 Kitsap 15 2.217S.Key Peninsula + Islands MCN IS 4 Kitsap 15 4.564S.Key Peninsula + Islands SKEY 1 Kitsap 15 3.476S.Key Peninsula + Islands SKEY 2 Kitsap 15 6.208S.Key Peninsula + Islands SKEY 3 Kitsap 15 3.287
45
* Length in Miles is based on WDNR ShoreZone line file (SZLINE.shp)
SummaryManagement Unit Total # ReachesCarr Inlet 11Case Inlet - Henderson Bay 13Colvos Pass-Tacoma Narrows 4Dash Point 1Hale Pass Wollochet Bay 3S.Key Peninsula + Islands 13
Total 45
Appendix C

TABLE 1BFreshwater Reaches, Pierce County
# Reaches by Feature Reach Feature Reach Name WRIA Name WRIA Number Length (Ft) Length (Mi)
1 Chambers Creek CHAM_CR_01 Chambers-Clover 12 1928.391 0.3651 Clover Creek CLOV_CR_01 Chambers-Clover 12 18559.163 3.5151 Spanaway Creek SPAN_CR_01 Chambers-Clover 12 12429.318 2.3541 Spanaway Lake SPAN_LK_01 Chambers-Clover 12 426.134 0.081
1 Bay Lake BAY_LK_01 Kitsap 15 30720.520 5.8181 Butterworth Reservoir BUTT_RES_01 Kitsap 15 13207.764 2.5011 Carney Lake CARN_LK_01 Kitsap 15 6433.134 1.2181 Crescent Lake CRES_LK_01 Kitsap 15 22271.710 4.2181 Florence Lake FLOR_LK_01 Kitsap 15 13705.071 2.5961 Jackson Lake JACK_LK_01 Kitsap 15 17252.301 3.2671 Josephine Lake JOSE_LK_01 Kitsap 15 13228.105 2.5051 Lake Minterwood MINT_LK_01 Kitsap 15 11378.776 2.1551 Minter Creek MINT_CR_01 Kitsap 15 7762.509 1.4701 Rocky Creek ROCK_CR_01 Kitsap 15 639.775 0.1211 Stansberry Lake STAN_LK_01 Kitsap 15 7729.896 1.464
1 Alder Lake ALD_LK_01 Nisqually 11 162.248 18.8501 Beaver Creek BEAV_CR_01 Nisqually 11 30770.467 5.8281 Benbow Lakes BENB_LK_01 Nisqually 11 9213.803 1.7451 Busy Wild Creek BUSY_CR_01 Nisqually 11 39836.570 7.5451 Clear Lake CLEA_LK_01 Nisqually 11 13188.520 2.4981 Copper Creek COPP_CR_01 Nisqually 11 4047.792 0.7671 Cranberry Lake CRAN_LK_01 Nisqually 11 14069.887 2.6651 Harts Lake HART_LK_01 Nisqually 11 37167.628 7.0391 Horn Creek HORN_CR_01 Nisqually 11 12780.439 2.4211 Kreger Lake KREG LK 01 Nisqually 11 27490.769 5.2071 Kreger Lake KREG_LK_01 Nisqually 11 27490.769 5.2071 La Grande Reservoir LAGR_RES_01 Nisqually 11 33493.066 6.3431 Little Lake LITT_LK_01 Nisqually 11 12670.105 2.4003 Little Mashel River LMAS_RV_01 Nisqually 11 1673.111 0.317
Little Mashel River LMAS_RV_02 Nisqually 11 10584.588 2.005Little Mashel River LMAS_RV_03 Nisqually 11 8980.534 1.701
5 Lynch Creek LYNC_CR_01 Nisqually 11 909.137 0.172Lynch Creek LYNC_CR_02 Nisqually 11 2964.505 0.561Lynch Creek LYNC_CR_03 Nisqually 11 1784.471 0.338Lynch Creek LYNC_CR_04 Nisqually 11 15359.200 2.909
7 Mashel River MASH_RV_01 Nisqually 11 19212.517 3.639Mashel River MASH_RV_02 Nisqually 11 5452.761 1.033Mashel River MASH_RV_03 Nisqually 11 6191.257 1.173Mashel River MASH_RV_04 Nisqually 11 21354.659 4.044Mashel River MASH_RV_05 Nisqually 11 23205.987 4.395Mashel River MASH_RV_06 Nisqually 11 6761.369 1.281Mashel River MASH_RV_07 Nisqually 11 12716.263 2.408
Appendix C

TABLE 1BFreshwater Reaches, Pierce County
# Reaches by Feature Reach Feature Reach Name WRIA Name WRIA Number Length (Ft) Length (Mi)
1 Midway Creek MIDW_CR_01 Nisqually 11 4061.087 0.7691 Muck Creek MUCK_CR_01 Nisqually 11 13671.067 2.5891 Muck Lake MUCK_LK_01 Nisqually 11 11937.829 2.2611 Mud Lake MUD_LK_01 Nisqually 11 18543.322 3.5128 Nisqually River NISQ_RV_01 Nisqually 11 19627.699 3.717
Nisqually River NISQ_RV_02 Nisqually 11 13065.550 2.475Nisqually River NISQ_RV_03 Nisqually 11 13946.591 2.641Nisqually River NISQ_RV_04 Nisqually 11 6797.763 1.287Nisqually River NISQ_RV_05 Nisqually 11 8455.982 1.602Nisqually River NISQ_RV_06 Nisqually 11 34378.331 6.511Nisqually River NISQ_RV_07 Nisqually 11 311.565 0.059Nisqually River NISQ_RV_08 Nisqually 11 982.552 0.186
1 Ohop Creek_Nis OHOP_LK_CR Nisqually 11 10937.771 2.0724 Ohop Creek_Nis OHOP_NIS_CR_01 Nisqually 11 32402.970 6.137
Ohop Creek_Nis OHOP_NIS_CR_02 Nisqually 11Ohop Creek_Nis OHOP_NIS_CR_03 Nisqually 11Ohop Creek_Nis OHOP_NIS_CR_04 Nisqually 11 12869.344 2.437
1 Ohop Lake OHOP_LK_01 Nisqually 11 44854.947 8.4951 Rapjohn Lake RAPJ_LK_01 Nisqually 11 24852.390 4.7071 Silver Lake SILV_LK_01 Nisqually 11 18153.568 3.4381 South Creek SOUT_CR_01 Nisqually 11 50863.089 9.6331 South Fork Little Mashel River SFLM_RV_01 Nisqually 11 1800.277 0.3411 Tanwax Creek TANW_CR_01 Nisqually 11 42962.148 8.1371 Tanwax Lake TANW_LK_01 Nisqually 11 91503.691 17.3301 Trout Lake TROU_LK_01 Nisqually 11 13019.438 2.4661 Tule Lake TULE_LK_01 Nisqually 11 52393.564 9.9231 Twentyfive Mile Creek 25MI CR 01 Nisqually 11 8413.075 1.5931 Twentyfive Mile Creek 25MI_CR_01 Nisqually 11 8413.075 1.5931 Twentyseven Lake TWEN_LK_01 Nisqually 11 6696.060 1.2681 Twin Lakes TWIN_LK_01 Nisqually 11 7288.396 1.3801 Unnamed Lake UNNA_LK_01 Nisqually 11 3908.752 0.7401 Unnamed Lake1 UNNA_LK1_01 Nisqually 11 41560.494 7.8711 Unnamed Trib of Mashel River UTMR_CR_01 Nisqually 11 15442.693 2.9251 Whitman Lake WHIT_LK_01 Nisqually 11 18294.293 3.465
1 Bear Creek BEAR_CR_01 Puyallup-White 10 2958.033 0.5601 Canyon Creek Two CANY_CR_01 Puyallup-White 10 7032.555 1.3328 Carbon River CARB_RV_01 Puyallup-White 10 5011.375 0.949
Carbon River CARB_RV_02 Puyallup-White 10 3877.063 0.734Carbon River CARB_RV_03 Puyallup-White 10 7682.079 1.455Carbon River CARB_RV_04 Puyallup-White 10 9219.020 1.746Carbon River CARB_RV_05 Puyallup-White 10 67825.407 12.846Carbon River CARB_RV_06 Puyallup-White 10 19308.587 3.657Carbon River CARB_RV_07 Puyallup-White 10 20401.485 3.864
Appendix C

TABLE 1BFreshwater Reaches, Pierce County
# Reaches by Feature Reach Feature Reach Name WRIA Name WRIA Number Length (Ft) Length (Mi)
Carbon River CARB_RV_08 Puyallup-White 10 5358.155 1.0151 Cayada Creek CAYA_CR_01 Puyallup-White 10 8884.993 1.6831 Chenuis Creek CHEN_CR_01 Puyallup-White 10 21820.221 4.1331 Clarks Creek CLAR_CR_01 Puyallup-White 10 12482.204 2.3642 Clearwater River CLEA_RV_01 Puyallup-White 10 28114.429 5.325
Clearwater River CLEA_RV_02 Puyallup-White 10 22764.654 4.3111 Deer Creek DEER_CR_01 Puyallup-White 10 22498.569 4.2611 East Fork South Prairie Creek EFSP_CR_01 Puyallup-White 10 17997.016 3.4091 Echo Lake ECHO_LK_01 Puyallup-White 10 2240.824 0.4241 Eleanor Creek ELEA_CR_01 Puyallup-White 10 4083.566 0.7731 Evans Creek EVAN_CR_01 Puyallup-White 10 30071.921 5.6951 Fennel Creek FENN_CR_01 Puyallup-White 10 12743.860 2.4141 Gale Creek GALE_CR_01 Puyallup-White 10 25237.702 4.7801 George Creek GEOR_CR_01 Puyallup-White 10 7020.501 1.3301 Goat Creek GOAT_CR_01 Puyallup-White 10 6403.830 1.2135 Greenwater River GREE_RV_01 Puyallup-White 10 24875.923 4.711
Greenwater River GREE_RV_02 Puyallup-White 10 26750.439 5.066Greenwater River GREE_RV_03 Puyallup-White 10 13660.770 2.587Greenwater River GREE_RV_04 Puyallup-White 10 4294.870 0.813Greenwater River GREE_RV_05 Puyallup-White 10 27849.861 5.275
3 Huckleberry Creek HUCK_CR_01 Puyallup-White 10 19293.206 3.654Huckleberry Creek HUCK_CR_02 Puyallup-White 10 14263.654 2.701Huckleberry Creek HUCK_CR_03 Puyallup-White 10 4866.998 0.922
1 Hylebos Creek HYLE_CR_01 Puyallup-White 10 6519.850 1.2351 Kapowsin Lake KAPO_LK_01 Puyallup-White 10 6074.546 1.1502 Kapowskin Creek KAPO_CR_01 Puyallup-White 10 17620.664 3.337
Kapowskin Creek KAPO CR 02 Puyallup-White 10 3235.817 0.613Kapowskin Creek KAPO_CR_02 Puyallup White 10 3235.817 0.6131 Kings Creek KING_CR_01 Puyallup-White 10 1663.938 0.3156 Lake Tapps TAPP_LK_01 Puyallup-White 10 1425.306 0.270
Lake Tapps TAPP_LK_02 Puyallup-White 10 11347.792 2.149Lake Tapps TAPP_LK_03 Puyallup-White 10 36565.402 6.925Lake Tapps TAPP_LK_04 Puyallup-White 10 1495.714 0.283Lake Tapps TAPP_LK_05 Puyallup-White 10 135437.534 25.651Lake Tapps TAPP_LK_06 Puyallup-White 10 3273.242 0.620
1 Leaky Lake LEAK_LK_01 Puyallup-White 10 17988.795 3.4071 Lost Creek_Greenwater LOST_GR_CR_01 Puyallup-White 10 12546.545 2.3761 Lost Creek_Huckleberry LOST_HC_CR_01 Puyallup-White 10 2326.667 0.4411 Maggie Creek MAGG_CR_01 Puyallup-White 10 2331.065 0.4411 Meadow Creek MEAD_CR_01 Puyallup-White 10 6402.987 1.2131 Milky Creek MILK_CR_01 Puyallup-White 10 8218.860 1.5571 Morgan Lake MORG_LK_01 Puyallup-White 10 28743.733 5.4443 Mowich River MOWI_RV_01 Puyallup-White 10 4687.601 0.888
Mowich River MOWI_RV_02 Puyallup-White 10 22868.581 4.331
Appendix C

TABLE 1BFreshwater Reaches, Pierce County
# Reaches by Feature Reach Feature Reach Name WRIA Name WRIA Number Length (Ft) Length (Mi)
Mowich River MOWI_RV_03 Puyallup-White 10 7764.919 1.4711 Mud Mountain Lake MUDM_LK_01 Puyallup-White 10 14363.541 2.7201 Neisson Creek NEIS_CR_01 Puyallup-White 10 10712.630 2.0291 North Puyallup River NOPU_RV_01 Puyallup-White 10 9250.085 1.7521 Ohop Creek_Kapowskin OHOP_KAP_CR_01 Puyallup-White 10 15068.704 2.8541 Page Creek PAGE_CR_01 Puyallup-White 10 4005.618 0.7591 Pinochle Creek PINO_CR_01 Puyallup-White 10 5587.845 1.0582 Printz Basin PRIN_BAS_01 Puyallup-White 10 5477.928 1.037
Printz Basin PRIN_BAS_02 Puyallup-White 10 40264.091 7.62613 Puyallup River PUYA_RV_01 Puyallup-White 10 5261.854 0.997
Puyallup River PUYA_RV_02 Puyallup-White 10 10580.085 2.004Puyallup River PUYA_RV_03 Puyallup-White 10 5653.010 1.071Puyallup River PUYA_RV_04 Puyallup-White 10 20625.919 3.906Puyallup River PUYA_RV_05 Puyallup-White 10 11823.236 2.239Puyallup River PUYA_RV_06 Puyallup-White 10 21467.120 4.066Puyallup River PUYA_RV_07 Puyallup-White 10 18829.812 3.566Puyallup River PUYA_RV_08 Puyallup-White 10 22856.391 4.329Puyallup River PUYA_RV_09 Puyallup-White 10 42292.579 8.010Puyallup River PUYA_RV_10 Puyallup-White 10 9154.938 1.734Puyallup River PUYA_RV_11 Puyallup-White 10 7103.978 1.345Puyallup River PUYA_RV_12 Puyallup-White 10 19600.656 3.712Puyallup River PUYA_RV_13 Puyallup-White 10 7993.262 1.514
2 Rhode Lake RHOD_LK_01 Puyallup-White 10 8028.133 1.520Rhode Lake RHOD_LK_02 Puyallup-White 10 4805.325 0.910
1 Rushingwater Creek RUSH_CR_01 Puyallup-White 10 17091.704 3.2371 Saint Andrews Creek STAN_CR_01 Puyallup-White 10 1065.896 0.2021 Silver Creek SILV CR 01 Puyallup-White 10 29564.708 5.5991 Silver Creek SILV_CR_01 Puyallup White 10 29564.708 5.5991 South Fork South Prairie Creek SFSP_CR_01 Puyallup-White 10 13877.684 2.6284 South Prairie Creek SOPR_CR_01 Puyallup-White 10 29466.017 5.581
South Prairie Creek SOPR_CR_02 Puyallup-White 10 2596.455 0.492South Prairie Creek SOPR_CR_03 Puyallup-White 10 24139.229 4.572South Prairie Creek SOPR_CR_04 Puyallup-White 10 35204.959 6.668
2 South Puyallup River SOPU_RV_01 Puyallup-White 10 13018.891 2.466South Puyallup River SOPU_RV_02 Puyallup-White 10 5586.586 1.058
1 Tolmie Creek TOLM_CR_01 Puyallup-White 10 9014.384 1.7071 Twentyeight Mile Creek 28MI_CR_01 Puyallup-White 10 15475.923 2.9311 Unnamed Trib of Puyallup River UTPU_CR_01 Puyallup-White 10 2228.904 0.4221 Unnamed Trib of So. Puyallup River UTSP_CR_01 Puyallup-White 10 5367.041 1.0161 Viola Creek VIOL_CR_01 Puyallup-White 10 8866.100 1.6792 Voight Creek VOIG_CR_01 Puyallup-White 10 35546.812 6.732
Voight Creek VOIG_CR_02 Puyallup-White 10 47983.643 9.0882 West Fork White River WFWR_RV_01 Puyallup-White 10 36657.450 6.943
West Fork White River WFWR_RV_02 Puyallup-White 10 23683.339 4.485
Appendix C

TABLE 1BFreshwater Reaches, Pierce County
# Reaches by Feature Reach Feature Reach Name WRIA Name WRIA Number Length (Ft) Length (Mi)
10 White River WHIT_RV_01 Puyallup-White 10 17529.600 3.320White River WHIT_RV_02 Puyallup-White 10 2935.648 0.556White River WHIT_RV_03 Puyallup-White 10 47467.200 8.990White River WHIT_RV_04 Puyallup-White 10 22281.600 4.220White River WHIT_RV_06 Puyallup-White 10 7497.600 1.420White River WHIT_RV_07 Puyallup-White 10 55387.200 10.490White River WHIT_RV_08 Puyallup-White 10 18638.400 3.530White River WHIT_RV_09 Puyallup-White 10 24657.600 4.670White River WHIT_RV_10 Puyallup-White 10 77140.800 14.610White River WHIT_RV_11 Puyallup-White 10 11352.000 2.150
5 Wilkeson Creek WILK_CR_01 Puyallup-White 10 21972.173 4.161Wilkeson Creek WILK_CR_02 Puyallup-White 10 1319.832 0.250Wilkeson Creek WILK_CR_03 Puyallup-White 10 10981.507 2.080Wilkeson Creek WILK_CR_04 Puyallup-White 10 7007.172 1.327
185** White River miles revised in March 2009 to correct for migration in river centerline.
Appendix C

TABLE 2 Coastal Data by Marine Reach
SMP REACH
Restoration Opportunities
Shore types
CONTINUITY FORAGE FISH FEEDER BLUFFS
DEPOSITION SEDIMENTS LWD RECRUITMENT
LWD DENSITY MARSH RIPARIAN Shorezone MOD%
Pentec Mods@MHW
Pentec Mods@MSL
# Drift Cells
Drift Cell Names
Brown Pt BR, RE, RSR, SMR, CM 100% Open no pentec data
available unknown estimated from SZ data ~21% na na estimate from SZ
data ~12%
estimated from SZ data to be along 52% of
reach beaches
none estimate from SZ data ~12% 80% ND ND 4 PI-1-3, PI-1-2,
PI-1-4, PI-1-1
AND IS 1 NA94% Open, 5% Lagoon,
1% Spit.
64% =3, 28% =1, 8% =0.
95% of the reach has
potential forage fish habitat.
82% of the reach has
active feeder bluffs.
95% =0, 5% =3, 1% =2.
97% =1, 3% =0.
87% of the reach has LWD
recruitment.
87% =3, 8% =0, 5% =1.
61% =0, 32% =1, 7% =2.
76% =3, 11% =2, 8% =1, 5% =0.
9% 6% 0% 4PI-22-3, PI-22-1, PI-22-2, PI-
21-5
AND IS 2 DDR,CM, 76% Inlet, 22% Open 86% =3,
40% of the reach has
40% of the reach has 62% =3,
20% =2 63% =5, 19% 65% of the reach has LWD
59% =3, 33% =1
37% =2, 31% =4, 22% =0
83% =3, 8% =1, 17% 9% 0% 5 +
PI-22-5, PI-22-8, PI-22-6, PI-AND IS 2 RSR,DB 22% Open,
2% Spit. 14% =1. potential forage fish habitat.
active feeder bluffs.
20% =2, 18% =0. =1, 18% =6. has LWD
recruitment.33% =1, 8% =0.
22% =0, 6% =1, 4% = 3.
7% =2, 2% =0.
17% 9% 0% partial 22-4, PI-22-7, PI-22-9 (partial)
AND IS 3 MR, RE
73% Open, 21%
Lagoon, 4% Inlet, 2% Spit.
61% =3, 26% =1, 13% =0.
79% of the reach has
potential forage fish habitat.
56% of the reach has
active feeder bluffs.
23% =3, 14% =2, 63% =0.
38% =1, 23% =6, 21% =5,
11% =0, 4% =3, 3% =4.
78% of the reach has LWD
recruitment.
85% =3, 9% =0, 6% =2.
70% =0, 13% =4, 10% =2, 6% =1, 1% = 3.
66% =3, 22% =2, 6% =1, 6% =0.
13% 10% 1% 2 + 2 partial
PI-22-11, PI-22-10, PI-21-1
(partial), PI-22-9 (partial)
AND IS 4 RSR71% Inlet,
22% Open, 7% Spit.
49% =3, 51% =1.
29% of the reach has
potential forage fish habitat.
22% of the reach has
active feeder bluffs.
44% =3, 56% =2.
61% =5, 39% =6.
38% of the reach has LWD
recruitment.
38% =3, 35% =1, 27% =0.
53% =2, 9% =4,
22% =1, 16% = 3.
35% =3, 7% =1,
48% =2, 10% =0.
30% 14% 0% 1 + partial
PI-21-2, PI-21-1 (partial)
AND IS 5 NA
77% Open, 18%
Lagoon, 6% 72% =3, 28% =1.
82% of the reach has
potential forage
86% of the reach has
active feeder
51% =0, 45% =2, 4% 3
92% =1, 8% =5.
88% of the reach has LWD
it t
83% =3, 10% =1, 7% 2
76% =0, 10% =3, 8% =4,
87% =3, 7% =2, 6% 0
5% 7% 0% 2 PI-21-3, 21-4Lagoon, 6% Spit.
28% 1. potential forage fish habitat.
active feeder bluffs. 4% =3. 5. recruitment. 7% =2. 8% 4,
6% =2. 6% =0.
CI 1 NA
51% Open, 38%
Lagoon, 11% Spit.
71% =3, 29% =1.
62% of the reach has
potential forage fish habitat.
51% of the reach has
active feeder bluffs.
51% =0, 49% =3.
58% =1, 4% =6, 38% =5.
89% of the reach has LWD
recruitment.100% =3.
59% =0, 38% =4, 3% =1.
96% =3, 4% =0. 11% 0% 0% partial PI-20-4 (partial)
CI 2 RSR
57% Inlet, 32%
Lagoon, 11% Spit.
100% =3.
11% of the reach has
potential forage fish habitat.
0% of the reach has
active feeder bluffs.
100% =3. 79% =5, 11%
=1, 10% =4.
67% of the reach has LWD
recruitment.
78% =3, 22% =1.
79% =2, 11% =0, 10% =4.
67% =3, 22% =2, 11% =1.
2% 0% 0% 2 partial PI-20-5
(partial), PI-20-4 (partial)
CI 3 NA 94% Open, 6% Inlet.
94% =3, 6% =1.
100% of the reach has
potential forage fish habitat.
94% of the reach has
active feeder bluffs.
58% =2, 36% =0, 6% =3.
100% =1. 100% of the reach
has LWD recruitment.
100% =3. 100% =0. 94% =3, 6% =1. 0% 3% 0% partial
PI-20-5 (partial), PI-15-
5 (partial)
CI 4 DB
74% Lagoon,
13% Open, 13% Spit.
24% =3, 76% =1.
27% of the reach has
potential forage fish habitat.
13% of the reach has
active feeder bluffs.
74% =3, 13% =2, 13% =0.
74% =6, 13% =1,
13% =0.
13% of the reach has LWD
recruitment.
34% =3, 66% =1.
67% =2, 13% =1, 13% =0, 7% =4.
97% =3, 3% =0. 28% 7% 0% partial PI-15-5 (partial)
Appendix C

TABLE 2 Coastal Data by Marine Reach
SMP REACH
Restoration Opportunities
Shore types
CONTINUITY FORAGE FISH FEEDER BLUFFS
DEPOSITION SEDIMENTS LWD RECRUITMENT
LWD DENSITY MARSH RIPARIAN Shorezone MOD%
Pentec Mods@MHW
Pentec Mods@MSL
# Drift Cells
Drift Cell Names
CI 5 BR, CM, DB.
71% Open, 14%
Lagoon, 9% Spit,
6% Inlet.
70% =3, 20% =1, 10% =0.
78% of the reach has
potential forage fish habitat.
65% of the reach has
active feeder bluffs.
39% =3, 34% =0, 27% =2.
43% =1, 16% =6, 15% =5,
11% =4, 9% =2, 6%
=0.
64% of the reach has LWD
recruitment.
70% =3, 20% =2, 4% =0, 6% =1.
62% =0, 19% =1, 10% =2, 8% =4, 1% = 3.
61% =3, 22% =2, 12% =0, 5% =1.
43% 24% 0% 4 + partial
PI-17-5, PI-17-4, PI-17-3, PI-17-2, PI-15-5
(partial)
CI 6 RSR
52% Open, 26% Inlet,
17% Lagoon, 6% Spit.
78% =3, 22% =1.
55% of the reach has
potential forage fish habitat.
77% of the reach has
active feeder bluffs.
59% =3, 23% =2, 18% =0.
51% =6, 43% =5,
4% =1, 2% =4.
96% of the reach has LWD
recruitment.
43% =3, 35% =2, 22% =0.
57% =0, 26% =1, 11% =2, 6% =4.
96% =3, 4% =0. 42% 16% 0% 3 PI-15-2, PI-15-
3, PI-15-4
CI 7 NA 85% Open, 15% Inlet.
80% =1, 15% =3, 5% =0.
51% of the reach has
potential forage fi h h bit t
55% of the reach has
active feeder bl ff
94% =2, 6% =3. 100% =1.
55% of the reach has LWD
recruitment.
55% =3, 45% =0.
94% =0, 6% =1. 100% =3. 65% 38% 0% partial PI-15-1 (partial)
5% 0. fish habitat. bluffs. recruitment.
CI 8 DB, BR 79% Inlet, 21% Spit.
64% =1, 36% =3.
21% of the reach has
potential forage fish habitat.
36% of the reach has
active feeder bluffs.
40% =2, 35% =0, 25% =3.
75% =1, 25% =2.
25% of the reach has LWD
recruitment.
21% =3, 79% =0.
54% =1, 25% = 3, 21% =2.
60% =3, 21% =0, 19% =1.
67% 33% 0% 2 + partial
PI-14-9, PI-14-10, PI-15-1
(partial)
CI 9 NA 100% Open 100% =1.
100% of the reach has
potential forage fish habitat.
100% of the reach has
active feeder bluffs.
100% =0. 100% =1. 30% of the reach
has LWD recruitment.
70% =0, 30% =3. 100% =0. 70% =1,
30% =3. 46% 42% 0% 1 PI-14-11
CI 10 DDR, BR, SMR
53% Open, 27% Inlet,
10% Lagoon,
10% Spit.
92% =3, 8% =1.
24% of the reach has
potential forage fish habitat.
52% of the reach has
active feeder bluffs.
30% =0, 70% =3.
23% =1, 21% =5, 17% =3,
17% =6, 13% =2, 9% =4.
60% of the reach has LWD
recruitment.
87% =3, 13% =2.
27% =0, 24% =4, 23% =1, 17% = 3, 9% =2.
74% =3, 19% =0, 7% =1.
40% 26% 0% 3 + partial
PI-14-13, PI-14-14, PI-14-12, PI-14-15 (partial)
p
CI 11 NA
45% Open, 37%
Lagoon, 18% Spit.
56% =3, 29% =0, 15% =1.
63% of the reach has
potential forage fish habitat.
82% of the reach has
active feeder bluffs.
71% =3, 29% =2.
37% =5, 30% =1, 18% =4,
15% =6.
82% of the reach has LWD
recruitment.100% =3.
48% =0, 37% =4, 15% =1.
67% =2, 18% =0, 15% =3.
33% 19% 0% partial PI-14-15 (partial)
CI-HB 1 BR, RSR 100% Open. 54% =3, 46% =1.
94% of the reach has
potential forage fish habitat.
64% of the reach has
active feeder bluffs.
85% =0, 15% =2.
91% =1, 9% =6.
85% of the reach has LWD
recruitment.
90% =3, 5% =2, 5% =1.
95% =0, 5% =1.
70% =3, 18% =1, 8% =0, 4% =2.
26% 20% 0% 2 + partial
PI-11-19, PI-10-4, PI-11-18
(partial)
CI-HB 2 RSR 82% Open, 18% Spit. 100% =3.
100% of the reach has
potential forage fish habitat.
82% of the reach has
active feeder bluffs.
43% =2, 39% =0, 18% =3.
61% = 0, 39% =1,
82% of the reach has LWD
recruitment.
43% =1, 39% =3, 18% =2.
100% =0. 82% =3, 18% =0. 53% 36% 0% 2 PI-11-27, PI-11-
28
61% I l t 91% of the 0% of the 50% 0 0% f th h 80% 0CI-HB 3 DDR
61% Inlet, 28% Open, 11% Spit.
78% =3, 22% =1.
91% of the reach has
potential forage fish habitat.
0% of the reach has
active feeder bluffs.
50% =0, 41% =2, 9% =9.
39% =6, 31% =2, 30% =1.
0% of the reach has LWD
recruitment.
80% =0, 11% =3, 9% =1.
89% =0, 11% =2.
91% =0, 9% =1. 97% 29% 15% 2 PI-11-30, PI-11-
29
Appendix C

TABLE 2 Coastal Data by Marine Reach
SMP REACH
Restoration Opportunities
Shore types
CONTINUITY FORAGE FISH FEEDER BLUFFS
DEPOSITION SEDIMENTS LWD RECRUITMENT
LWD DENSITY MARSH RIPARIAN Shorezone MOD%
Pentec Mods@MHW
Pentec Mods@MSL
# Drift Cells
Drift Cell Names
CI-HB 4 BR? 100% Open. 81% =3, 19% =0.
69% of the reach has
potential forage fish habitat.
69% of the reach has
active feeder bluffs.
69% =2, 31% =3.
50% =1, 31% =6, 19%
=0.
69% of the reach has LWD
recruitment.
69% =3, 31% =0. 100% =0. 69% =3,
31% =1. 57% 15% 0% 2 + partial
PI-12-2, PI-12-1, PI-11-31
(partial)
CI-HB 5 BR, DDR, MR, RE
55% Open, 45% Inlet.
57% =3, 19% =1, 14% =0.
41% of the reach has
potential forage fish habitat.
27% of the reach has
active feeder bluffs.
72% =3, 15% =0, 12% =2.
38% =5, 23% =6, 16% =1,
12% =4, 11% =2.
49% of the reach has LWD
recruitment.
50% =0, 23% =2, 17% =1, 10% =3.
68% =0, 12% =3, 11% =1, 9% =2.
36% =1, 25% =2, 21% =3, 18% =0.
71% 42% 0% 11 + 2 partial
PI-12-14, PI-12-13, PI-12-12, PI-
12-11, PI-12-10, PI-12-9, PI-12-8, PI-12-7, PI-12-6, PI-12-5, PI-12-4, PI-11-31 (partial),
PI-12-15 (partial)(partial)
CI-HB 6 SMR, BR, MR
83% Open, 9% Inlet,
7% Lagoon, 1% Spit.
88% =3, 12% =1.
80% of the reach has
potential forage fish habitat.
18% of the reach has
active feeder bluffs.
57% =3, 23% =0, 21% =2.
36% =5, 23% =6, 20% =2,
7% =4, 6% =1, 4% =3,
4% =0.
22% of the reach has LWD
recruitment.
42% =0, 34% =1, 24% =3.
71% =0, 13% =1, 9% =2, 7% =4.
32% =0, 28% =3, 28% =2, 12% =1.
60% 27% 14% 2 partial PI-12-16
(partial), PI-12-15 (partial)
CI-HB 7 CM, RSR, RE, SMR
80% Inlet, 12% Spit, 8% Open.
92% =3, 4% =1, 4% =0.
4% of the reach has potential forage fish
habitat.
13% of the reach has
active feeder bluffs.
96% =3, 4% =2.
80% =5, 12% =6, 4% =4, 4% =1.
28% of the reach has LWD
recruitment.
64% =3, 21% =1, 11% =2, 4% =0.
52% =3, 25% =2, 15% =1, 4% =4, 4% = 0.
46% =3, 25% =0, 18% =1, 11% =2.
37% 20% 0% 2 + partial
PI-13-3, PI-13-2, PI-12-16
(partial)
CI-HB 8 RSR 75% Open, 25% Spit.
69% =0, 31% =3.
100% of the reach has
potential forage fish habitat.
44% of the reach has
active feeder bluffs.
56% =2, 44% =3.
44% =0, 37% =5, 19% =6.
44% of the reach has LWD
recruitment.
44% =3, 31% =0, 25% =2.
75% =0, 25% =1.
51% =3, 49% =0. 67% 28% 0% partial PI-14-1 (partial)
CI-HB 9 RSR 81% Spit, 19% Open.
86% =3, 14% =1.
14% of the reach has
potential forage fish habitat.
0% of the reach has
active feeder bluffs.
86% =3, 14% =2.
58% =5, 23% =6, 14% =0,
5% =1.
65% of the reach has LWD
recruitment.
42% =3, 35% =0, 23% =2.
42% =2, 23% =3, 19% =0, 16% =4.
72% =3, 23% =2, 5% =0.
7% 10% 0% 1+ 2 partial
PI-13-4/PI-14-2, PI-14-2
(partial), PI-14-1 (partial)
CI-HB 10 BR 83% Open, 17% Spit.
66% =3, 34% =1.
100% of the reach has
potential forage fish habitat.
83% of the reach has
active feeder bluffs.
68% =0, 32% =2.
48% =6, 37% =1, 15% =0.
34% of the reach has LWD
recruitment.
52% =3, 48% =1. 100% =0.
48% =2, 35% =3, 17% =0.
33% 28% 0% partial PI-14-2
CI-HB 11 BR, RE
84% Inlet, 10%
Lagoon, 6% Spit.
83% =3, 17% =1.
41% of the reach has
potential forage fish habitat.
89% of the reach has
active feeder bluffs.
100% =3. 58% =5, 36% =1, 6% =6.
46% of the reach has LWD
recruitment.
95% =3, 5% =0.
54% =3, 29% =1, 12% =2, 5% = 0.
77% =2, 12% =3, 6% =0, 5% =1.
38% 36% 0% 4 + partial
PI-14-4, PI-14-14, PI-14-5, PI-14-3, PI-14-7
(partial)
78% O 51% 3 59% of the 50% of the 73% 5 13% 62% f th h 48% 3 74% 0 40% =3,
CI-HB 12 BR, RE78% Open, 9% Lagoon, 13% Spit.
51% =3, 26% =1, 23% =0.
59% of the reach has
potential forage fish habitat.
50% of the reach has
active feeder bluffs.
100% =3. 73% =5, 13% =6, 9% =0,
5% =3.
62% of the reach has LWD
recruitment.
48% =3, 47% =0, 5% =1.
74% =0, 13% =4, 13% =2.
40% 3, 24% =1, 23% =0, 13% =0.
65% 27% 0% partial PI-14-7 (partial)
Appendix C

TABLE 2 Coastal Data by Marine Reach
SMP REACH
Restoration Opportunities
Shore types
CONTINUITY FORAGE FISH FEEDER BLUFFS
DEPOSITION SEDIMENTS LWD RECRUITMENT
LWD DENSITY MARSH RIPARIAN Shorezone MOD%
Pentec Mods@MHW
Pentec Mods@MSL
# Drift Cells
Drift Cell Names
CI-HB 13 BR, DDR, RSR 50% Open, 45% Inlet, 5% Spit.
93% =3, 7% =1.
58% of the reach has
potential forage fish habitat.
51% of the reach has
active feeder bluffs.
61% =3, 20% =0, 19% =2.
46% =5, 23% =6, 17% =0, 6% =4, 4% =2, 4% =1.
37% of the reach has LWD
recruitment.
47% =0, 30% =3, 13% =2, 10% =1.
55% =0, 26% =1, 14 % =3, 5% =4.
39% =3, 24% =0, 19% =1, 18% =2.
48% 28% 0% 9 + partial
PI-19A-9, PI-19A-5, PI-19A-8, PI-19A-4, PI-19A-3, PI-16-2, PI-19A-2, PI-
19A-6, PI-19A-7, PI-14-7 (partial)
CP-TN 1 RSR, BR, FR 100% Open. 64% =3, 36% =1.
79% of the reach has
potential forage fish habitat.
19% of the reach has
active feeder bluffs.
100% =0. 100% =1. 79% of the reach
has LWD recruitment.
79% =3, 21% =0. 100% =0. 79% =3,
21% =0. 44% 15% 10% 1 + partial
PI-7-1 PI-7-2 (partial)
83% 384% of the
h h61% of the
h h 91% 0 68% 0 61% of the reach 50% 3 82% 0 61% =3, 1 PI 7 3 PI 7 2CP-TN 2 BR, MR 100% Open. 83% =3, 17% =1.
reach has potential forage
fish habitat.
reach has active feeder
bluffs.
91% =0, 9% =2.
68% =0, 32% =1.
61% of the reach has LWD
recruitment.
50% =3, 50% =0.
82% =0, 18% = 3.
61% 3, 21% =1, 18% =0.
46% 27% 0% 1 + partial
PI-7-3, PI-7-2 (partial)
CP-TN 3 MR?, RE, RSR88% Inlet,
11% Open, 1% Spit.
61% =3, 22% =0, 17% =1.
0% of the reach has potential forage fish
habitat.
0% of the reach has
active feeder bluffs.
73% =3, 21% =0, 6% =2.
44% =5, 34% =3, 16%
=0, 6% =2.
0% of the reach has LWD
recruitment.
88% =0, 12% =1.
43% =0, 28% =1, 20% = 3.
47% =0, 29% =1, 13% =3, 11% =2.
62% 21% 16% 3 + partial
PI-8-3, PI-8-4, PI-8-2, PI-8-5
(partial)
CP-TN 4 BR, RE? 100% Open. 100% =3.
100% of the reach has
potential forage fish habitat.
98% of the reach has
active feeder bluffs.
100% =0. 100% =0. 98% of the reach
has LWD recruitment.
98% =3, 2% =0. 100% =0. 98% =3,
2% =1. 12% 4% 0% 2 + partial
PI-9-2, PI-9-1, PI-8-5 (partial)
DP
HP-WB 1 RSR 71% Inlet, 82% =3, 13% =0
66% of the reach has
51% of the reach has 60% =0,
25% =5, 24% =1, 23% =6, 29% of the reach
has LWD70% =0, 16% =1
49% =0, 24% =1,
33% =3, 26% =1, 83% 41% 0% 2 PI-11-21 PI-9-3HP-WB 1 RSR 29% Open. 13% =0,
5% =1. potential forage fish habitat.
active feeder bluffs.
40% =3. 20% =0, 8% =2.
has LWD recruitment.
16% =1, 14% =3. 15% = 3,
12% =2.22% =2, 19% =0.
83% 41% 0% 2 PI-11-21, PI-9-3
HP-WB 2 MR, RE 94% Open, 6% Inlet.
52% =3, 36% =1, 12% =0.
79% of the reach has
potential forage fish habitat.
33% of the reach has
active feeder bluffs.
58% =0, 35% =3, 7% =2.
57% =0, 32% =1, 11%
=6.
6% of the reach has LWD
recruitment.
55% =0, 19% =1, 18% =3, 8% =2.
82% =0, 6% =4,
12% =1.
74% =0, 21% =3, 5% =1.
83% 45% 0% 5PI-11-23, PI-11-22, PI-11-24, PI-11-26, PI-11-25
HP-WB 3 DDR, BR, RSR
82% Open, 13% Inlet, 4% Spit,
1% Spit/Lagoon
.
42% =1, 41% =3, 17% =0.
53% of the reach has
potential forage fish habitat.
40% of the reach has
active feeder bluffs.
62% =0, 20% =2, 18% =3.
75% =1, 17% =6, 8% =5.
28% of the reach has LWD
recruitment.
63% =0, 19% =3, 12% =1, 6% =2.
66% =0, 17% =1, 14% =2, 3% = 3.
31% =0, 29% =3, 29% =1, 11% =2.
64% 29% 7% 18 + partial
PI-11-13, PI-11-15, PI-11-17, PI-10-3, PI-10-1, PI-11-3, PI-11-5, PI-11-7, PI-11-9, PI-11-12, PI-11-14, PI-11-16, PI-10-2, PI-11-2, PI-11-4, PI 11 6 PI 11PI-11-6, PI-11-8 PI 11 10 PI
MCN IS 1 RSR, BR
55% Open, 45%
Spit/Lagoon.
100% =3.
100% of the reach has
potential forage fish habitat.
100% of the reach has
active feeder bluffs.
55% =0, 45% =2. 100% =1.
100% of the reach has LWD
recruitment.100% =3. 55% =0
45% =4. 100% =3. 7% 0% 0% no drift data
Appendix C

TABLE 2 Coastal Data by Marine Reach
SMP REACH
Restoration Opportunities
Shore types
CONTINUITY FORAGE FISH FEEDER BLUFFS
DEPOSITION SEDIMENTS LWD RECRUITMENT
LWD DENSITY MARSH RIPARIAN Shorezone MOD%
Pentec Mods@MHW
Pentec Mods@MSL
# Drift Cells
Drift Cell Names
MCN IS 2 CM 100% Open. 54% =3, 46% =1.
87% of the reach has
potential forage fish habitat.
68% of the reach has
active feeder bluffs.
82% =0, 10% =2, 8% =3.
79% =1, 21% =6.
53% of the reach has LWD
recruitment.
90% =3, 10% =0.
77% =0, 23% =1.
70% =3, 20% =2, 10% =0.
13% 6% 0%
MCN IS 3 CM 100% Open. 66% =1, 30% =0, 4% =3.
100% of the reach has
potential forage fish habitat.
50% of the reach has
active feeder bluffs.
89% =0, 8% =3, 3% =2.
81% =1, 11% =0, 8% =4.
97% of the reach has LWD
recruitment.
72% =3, 20% =0, 8% =1.
100% =0. 89% =3, 8% =2, 3% =1.
7% 5% 0%
MCN IS 4 CM, RSR
73% Open, 24% Inlet,
3% Spit/Lagoon
.
43% =3, 33% =1, 24% =0.
94% of the reach has
potential forage fish habitat.
79% of the reach has
active feeder bluffs.
41% =2, 33% =0, 26% =3.
60% =1, 31% =6,
9% =4.
86% of the reach has LWD
recruitment.
94% =3, 6% =2.
50% =0, 37% =1, 10% = 3, 3% =2.
86% =3, 6% =2, 8% =1.
8% 20% 0%
no drift data
no drift data
no drift data
.
SKEY 1 BR, DDR 97% Open, 3% Spit.
70% =3, 30% =1.
100% of the reach has
potential forage fish habitat.
97% of the reach has
active feeder bluffs.
64% =2, 28% =3, 8% =0.
44% =5, 28% =6,
17% =3, 8% =1, 3%
=2.
57% of the reach has LWD
recruitment.
65% =3, 14% =0, 12% =1, 9% =2.
66% =0, 22% =1, 12% =2.
73% =3, 21% =2, 3% =1, 3% =0.
25% 27% 0% 3 + partial
PI-19A-11, PI-19-1, PI-19A-10, PI-19-2
(partial)
SKEY 2 NA 96% Inlet, 4% Open.
96% =3, 4% =1.
63% of the reach has
potential forage fish habitat.
48% of the reach has
active feeder bluffs.
62% =3, 25% =2, 13% =0.
37% =5, 34% =6,
25% =3, 4% =1.
89% of the reach has LWD
recruitment.
45% =0, 39% =3, 9% =1, 7% =2.
50% =1, 35% =2, 15% =0.
85% =3, 13% =2, 2% =1.
45% 11% 0% 5 + 2 partial
PI-19-6, PI-19-4, PI-19-7, PI-19-3, PI-19-5,
PI-19-8 (partial), PI-19-
2 (partial)
SKEY 3 BR81% Open, 10% Inlet, 9% Spit.
56% =3, 44% =1.
97% of the reach has
potential forage fish habitat.
81% of the reach has
active feeder bluffs.
48% =0, 27% =3, 25% =2.
38% =1, 35% =5, 19% =2, 8% =0.
72% of the reach has LWD
recruitment.
80% =3, 13% =2, 7% =1.
72% =0, 18% =1, 10% =2.
71% =3, 17% =2, 9% =0, 3% =1.
25% 21% 2% 2 + partial
PI-20-3, PI-20-2, PI-19-8 (partial)
Data codes are summarized in Summary worksheet (within this xls) Pentec data was not available for Browns Point reach No drift cell mapping was available for McNeil IslandData codes are summarized in Summary worksheet (within this .xls) Pentec data was not available for Browns Point reach. No drift cell mapping was available for McNeil Island
Appendix C

Table 3 Biological and Water Quality Data by Marine Reach, Pierce County
Appendix C
# Reaches
by Management
Unit
Management Units Reach Name
Eelgrass (H, M, L, 0; >50%, 25-50,
<25%, no eelgrass)
Riparian Vegetation
Cover >50%
Surf Smelt
Sand Lance
Herring Waterfowl
Crab Urchin Hardshell Clam
Shrimp Geoduck Shellfish Growing
Area
303d List
13 Carr Inlet - Henderson Bay CI-HB 1 0 Y x x Y Carr Inlet - Henderson Bay CI-HB 10 M Y x x x Carr Inlet - Henderson Bay CI-HB 11 0 Y x x x Carr Inlet - Henderson Bay CI-HB 12 M N x x x Carr Inlet - Henderson Bay CI-HB 13 M N x x x x x P Y Carr Inlet - Henderson Bay CI-HB 2 0 N Y Carr Inlet - Henderson Bay CI-HB 3 L N x x Carr Inlet - Henderson Bay CI-HB 4 M N x x x Y Carr Inlet - Henderson Bay CI-HB 5 L N x x x Y Carr Inlet - Henderson Bay CI-HB 6 H N x Carr Inlet - Henderson Bay CI-HB 7 0 Y x P Carr Inlet - Henderson Bay CI-HB 8 0 Y x Carr Inlet - Henderson Bay CI-HB 9 0 Y x x
11 Case Inlet CI-1 0 Y x x Case Inlet CI-10 0 N x x Y Case Inlet CI-11 0 Y x x Case Inlet CI-2 0 Y x P Case Inlet CI-3 0 Y x Y Case Inlet CI-4 0 Y x Case Inlet CI-5 0 Y Case Inlet CI-6 0 Y x Case Inlet CI-7 0 Y x Case Inlet CI-8 0 Y x Case Inlet CI-9 0 N x 4 Colvos Pass-Tacoma Narrows CP-TN 1 0 N x Colvos Pass-Tacoma Narrows CP-TN 2 0 Y x x x Colvos Pass-Tacoma Narrows CP-TN 3 0 N x P Y Colvos Pass-Tacoma Narrows CP-TN 4 0 Y x x 1 Dash Point DP 0 Y x x Y 3 Hale Pass Wollochet Bay HP-WB 1 M N x x x x x P Y Hale Pass Wollochet Bay HP-WB 2 0 N x x x Hale Pass Wollochet Bay HP-WB 3 M N x x
13 S.Key Peninsula + Islands AND IS 1 M Y x x x x Y S.Key Peninsula + Islands AND IS 2 L Y x x x P Y S.Key Peninsula + Islands AND IS 3 0 Y x x x x x S.Key Peninsula + Islands AND IS 4 0 Y x S.Key Peninsula + Islands AND IS 5 L Y x x x x S.Key Peninsula + Islands KTRN IS 0 Y x S.Key Peninsula + Islands MCN IS 1 0 Y x S.Key Peninsula + Islands MCN IS 2 0 Y x S.Key Peninsula + Islands MCN IS 3 0 Y x x S.Key Peninsula + Islands MCN IS 4 0 Y x x x P S.Key Peninsula + Islands SKEY 1 M Y x x S.Key Peninsula + Islands SKEY 2 0 Y x x S.Key Peninsula + Islands SKEY 3 0 Y x x x

TABLE 4AWetland Area by Marine Reach
# Reaches by Management
Unit Management UnitsReach Name
WRIA Name
WRIA Number
Length (miles)
Reach Area (acres)
Wetland Area (acres) % Wetland
13 S.Key Peninsula + Islands AND IS 1 Kitsap 15 5.079 767.516 25.261 3.291S.Key Peninsula + Islands AND IS 2 Kitsap 15 5.802 775.524 298.043 38.431S.Key Peninsula + Islands AND IS 3 Kitsap 15 5.639 802.466 25.061 3.123S.Key Peninsula + Islands AND IS 4 Kitsap 15 1.356 90.784 0.000 0.000S.Key Peninsula + Islands AND IS 5 Kitsap 15 3.184 444.924 53.257 11.970
13 Case Inlet - Henderson Bay CI-HB 1 Kitsap 15 5.540 983.550 1.097 0.112Case Inlet - Henderson Bay CI-HB 10 Kitsap 15 1.830 325.508 0.000 0.000Case Inlet - Henderson Bay CI-HB 11 Kitsap 15 1.694 208.697 68.976 33.051Case Inlet - Henderson Bay CI-HB 12 Kitsap 15 4.436 545.570 14.805 2.714Case Inlet - Henderson Bay CI-HB 13 Kitsap 15 9.107 1287.635 243.930 18.944Case Inlet - Henderson Bay CI-HB 2 Kitsap 15 2.270 357.984 0.000 0.000Case Inlet - Henderson Bay CI-HB 3 Kitsap 15 2.887 276.773 0.719 0.260Case Inlet - Henderson Bay CI-HB 4 Kitsap 15 1.844 363.830 0.000 0.000Case Inlet - Henderson Bay CI-HB 5 Kitsap 15 7.446 819.630 105.362 12.855Case Inlet - Henderson Bay CI-HB 6 Kitsap 15 5.818 659.611 0.000 0.000Case Inlet - Henderson Bay CI-HB 7 Kitsap 15 6.767 475.092 14.767 3.108Case Inlet - Henderson Bay CI-HB 8 Kitsap 15 3.345 469.326 2.090 0.445Case Inlet - Henderson Bay CI-HB 9 Kitsap 15 3.610 316.699 167.811 52.987
11 Carr Inlet CI-1 Kitsap 15 1.430 310.396 91.230 29.392Carr Inlet CI-10 Kitsap 15 3.054 234.072 11.073 4.731Carr Inlet CI-11 Kitsap 15 1.093 83.481 0.000 0.000Carr Inlet CI-2 Kitsap 15 1.213 251.438 187.855 74.712Carr Inlet CI-3 Kitsap 15 1.086 423.035 25.199 5.957Carr Inlet CI-4 Kitsap 15 2.486 169.766 21.387 12.598Carr Inlet CI-5 Kitsap 15 8.123 1154.529 38.478 3.333Carr Inlet CI-6 Kitsap 15 5.261 513.321 47.559 9.265Carr Inlet CI-7 Kitsap 15 2.228 415.574 13.977 3.363Carr Inlet CI-8 Kitsap 15 3.512 292.841 23.744 8.108Carr Inlet CI-9 Kitsap 15 0.865 124.774 0.300 0.241
4 Colvos Pass-Tacoma Narrows CP-TN 1 Kitsap 15 2.273 298.062 0.000 0.000Colvos Pass-Tacoma Narrows CP-TN 2 Kitsap 15 4.027 605.726 0.157 0.026
Appendix C

TABLE 4AWetland Area by Marine Reach
# Reaches by Management
Unit Management UnitsReach Name
WRIA Name
WRIA Number
Length (miles)
Reach Area (acres)
Wetland Area (acres) % Wetland
Colvos Pass-Tacoma Narrows CP-TN 3 Kitsap 15 3.999 192.380 0.960 0.499Colvos Pass-Tacoma Narrows CP-TN 4 Kitsap 15 5.895 816.579 0.000 0.000
1 Dash Point DP Kitsap 15 3.212 471.077 0.000 0.0003 Hale Pass Wollochet Bay HP-WB 1 Kitsap 15 7.838 898.420 43.440 4.835
Hale Pass Wollochet Bay HP-WB 2 Kitsap 15 4.519 578.716 12.175 2.104Hale Pass Wollochet Bay HP-WB 3 Kitsap 15 10.178 1073.894 26.831 2.499S.Key Peninsula + Islands KTRN IS Kitsap 15 3.164 531.131 0.000 0.000S.Key Peninsula + Islands MCN IS 1 Kitsap 15 1.212 242.923 0.000 0.000S.Key Peninsula + Islands MCN IS 2 Kitsap 15 4.698 677.563 19.157 2.827S.Key Peninsula + Islands MCN IS 3 Kitsap 15 2.217 348.366 0.000 0.000S.Key Peninsula + Islands MCN IS 4 Kitsap 15 4.564 589.335 0.000 0.000S.Key Peninsula + Islands SKEY 1 Kitsap 15 3.476 564.479 20.515 3.634S.Key Peninsula + Islands SKEY 2 Kitsap 15 6.208 614.630 86.212 14.027S.Key Peninsula + Islands SKEY 3 Kitsap 15 3.287 471.240 0.586 0.124
45 178.771
* Length in Miles is based on WDNR ShoreZone line file (SZLINE.shp)
Appendix C

TABLE 4BWetland Area by Freshwater Reach
# Reaches by Feature Reach Feature Reach Name WRIA Name
WRIA Number
Length (Ft)
Length (Mi)
Reach Area (acres)
Mapped Wetland Area (acres)*
% Mapped Wetland Area*
Wetland Area w/o Open Water
(acres)*
% area Wetland w/o Open Water*
Open Water Area
(acres)**
% area Open
Water**1 Chambers Creek CHAM_CR_01 Chambers-Clover 12 1928 0.37 24.9 23.3 94 23.3 94 0.0 01 Clover Creek CLOV_CR_01 Chambers-Clover 12 18559 3.51 274.9 87.5 32 87.5 32 0.0 01 Spanaway Creek SPAN_CR_01 Chambers-Clover 12 12429 2.35 173.0 95.6 55 87.5 51 8.1 51 Spanaway Lake SPAN_LK_01 Chambers-Clover 12 39637 7.51 591.8 365.3 62 97.8 17 267.4 45
1 Bay Lake BAY_LK_01 Kitsap 15 10832 2.05 255.4 191.3 75 70.1 27 121.2 471 Butterworth Reservoir BUTT_RES_01 Kitsap 15 10621 2.01 154.7 0.0 0 0.0 0 0.0 01 Carney Lake CARN_LK_01 Kitsap 15 5222 0.99 49.7 17.3 35 2.4 5 14.9 301 Crescent Lake CRES_LK_01 Kitsap 15 8135 1.54 165.6 123.3 74 76.0 46 47.3 291 Florence Lake FLOR_LK_01 Kitsap 15 10968 2.08 150.4 65.3 43 8.0 5 57.3 381 Jackson Lake JACK_LK_01 Kitsap 15 4390 0.83 91.3 68.1 75 55.4 61 12.6 14_ _ p1 Josephine Lake JOSE_LK_01 Kitsap 15 12054 2.28 169.2 88.9 53 14.1 8 74.7 441 Lake Minterwood MINT_LK_01 Kitsap 15 5941 1.13 71.7 25.3 35 25.3 35 0.0 01 Minter Creek MINT_CR_01 Kitsap 15 7763 1.47 164.5 144.9 88 144.9 88 0.0 01 Rocky Creek ROCK_CR_01 Kitsap 15 640 0.12 8.6 0.0 0 0.0 0 0.0 01 Stansberry Lake STAN_LK_01 Kitsap 15 8029 1.52 76.6 26.6 35 7.1 9 19.5 25
1 Alder Lake ALD_LK_01 Nisqually 11 99543 18.85 2182.5 235.7 11 214.6 10 21.1 11 Beaver Creek BEAV_CR_01 Nisqually 11 30770 5.83 370.3 2.9 1 2.9 1 0.0 01 Benbow Lakes BENB_LK_01 Nisqually 11 5166 0.98 65.7 34.4 52 23.5 36 10.9 171 Busy Wild Creek BUSY_CR_01 Nisqually 11 39837 7.54 362.9 0.0 0 0.0 0 0.0 01 Clear Lake CLEA_LK_01 Nisqually 11 11997 2.27 242.1 155.5 64 6.6 3 148.9 611 Copper Creek COPP_CR_01 Nisqually 11 4048 0.77 38.0 0.0 0 0.0 0 0.0 01 Cranberry Lake CRAN_LK_01 Nisqually 11 4534 0.86 165.1 165.1 100 131.7 80 33.4 201 Harts Lake HART_LK_01 Nisqually 11 9286 1.76 265.8 211.4 80 102.7 39 108.7 411 Horn Creek HORN_CR_01 Nisqually 11 12780 2.42 215.3 142.5 66 142.5 66 0.0 0_ _ q y1 Kreger Lake KREG_LK_01 Nisqually 11 12998 2.46 341.9 256.5 75 215.8 63 40.7 121 La Grande Reservoir LAGR_RES_01 Nisqually 11 13153 2.49 299.7 214.5 72 214.5 72 0.0 01 Little Lake LITT_LK_01 Nisqually 11 3697 0.70 47.3 28.1 59 18.2 39 9.9 213 Little Mashel River LMAS_RV_01 Nisqually 11 1673 0.32 15.2 0.8 5 0.8 5 0.0 0
Little Mashel River LMAS_RV_02 Nisqually 11 10585 2.00 214.2 135.2 63 135.2 63 0.0 0Little Mashel River LMAS_RV_03 Nisqually 11 8981 1.70 80.7 0.0 0 0.0 0 0.0 0
5 Lynch Creek LYNC_CR_01 Nisqually 11 909 0.17 6.5 3.9 60 3.9 60 0.0 0Lynch Creek LYNC_CR_02 Nisqually 11 2965 0.56 26.1 0.0 0 0.0 0 0.0 0Lynch Creek LYNC_CR_03 Nisqually 11 1784 0.34 20.4 13.3 65 13.3 65 0.0 0Lynch Creek LYNC_CR_04 Nisqually 11 15359 2.91 146.7 1.7 1 1.7 1 0.0 0
7 Mashel River MASH_RV_01 Nisqually 11 19213 3.64 229.9 0.3 0 0.3 0 0.0 0Mashel River MASH_RV_02 Nisqually 11 5453 1.03 56.8 0.0 0 0.0 0 0.0 0Mashel River MASH_RV_03 Nisqually 11 6191 1.17 99.0 50.2 51 50.2 51 0.0 0Mashel River MASH_RV_04 Nisqually 11 21355 4.04 267.0 78.9 30 78.9 30 0.0 0Mashel River MASH_RV_05 Nisqually 11 23206 4.40 216.9 0.0 0 0.0 0 0.0 0_ _ q yMashel River MASH_RV_06 Nisqually 11 6761 1.28 59.8 0.0 0 0.0 0 0.0 0Mashel River MASH_RV_07 Nisqually 11 12716 2.41 115.9 0.0 0 0.0 0 0.0 0
1 Midway Creek MIDW_CR_01 Nisqually 11 4061 0.77 37.4 0.0 0 0.0 0 0.0 01 Muck Creek MUCK_CR_01 Nisqually 11 13671 2.59 195.6 84.5 43 84.5 43 0.0 0
Appendix C

TABLE 4BWetland Area by Freshwater Reach
# Reaches by Feature Reach Feature Reach Name WRIA Name
WRIA Number
Length (Ft)
Length (Mi)
Reach Area (acres)
Mapped Wetland Area (acres)*
% Mapped Wetland Area*
Wetland Area w/o Open Water
(acres)*
% area Wetland w/o Open Water*
Open Water Area
(acres)**
% area Open
Water**1 Muck Lake MUCK_LK_01 Nisqually 11 5508 1.04 63.4 30.6 48 15.0 24 15.6 251 Mud Lake MUD_LK_01 Nisqually 11 3746 0.71 132.5 80.8 61 60.6 46 20.2 158 Nisqually River NISQ_RV_01 Nisqually 11 19628 3.72 470.7 51.2 11 51.2 11 0.0 0
Nisqually River NISQ_RV_02 Nisqually 11 13066 2.47 565.4 101.6 18 101.6 18 0.0 0Nisqually River NISQ_RV_03 Nisqually 11 13947 2.64 390.2 35.0 9 35.0 9 0.0 0Nisqually River NISQ_RV_04 Nisqually 11 6798 1.29 100.8 1.8 2 1.8 2 0.0 0Nisqually River NISQ_RV_05 Nisqually 11 8456 1.60 101.1 1.0 1 1.0 1 0.0 0Nisqually River NISQ_RV_06 Nisqually 11 34378 6.51 1178.9 70.7 6 70.4 6 0.3 0Nisqually River NISQ_RV_07 Nisqually 11 312 0.06 400.5 0.8 0 0.8 0 0.0 0Nisqually River NISQ_RV_08 Nisqually 11 983 0.19 142.8 0.0 0 0.0 0 0.0 0
1 Ohop Creek_Nis OHOP_LK_CR Nisqually 11 10938 2.07 4.2 0.3 7 0.3 7 0.0 0p _ _ _ q y4 Ohop Creek_Nis OHOP_NIS_CR_01 Nisqually 11 32403 6.14 640.4 393.6 61 393.6 61 0.0 0
Ohop Creek_Nis OHOP_NIS_CR_02 Nisqually 11 5.1 0.0 0 0.0 0 0.0 0Ohop Creek_Nis OHOP_NIS_CR_03 Nisqually 11 96.7 82.2 85 82.2 85 0.0 0Ohop Creek_Nis OHOP_NIS_CR_04 Nisqually 11 12869 2.44 229.3 206.0 90 206.0 90 0.0 0
1 Ohop Lake OHOP_LK_01 Nisqually 11 25617 4.85 407.7 237.6 58 37.3 9 200.3 491 Rapjohn Lake RAPJ_LK_01 Nisqually 11 8326 1.58 192.3 118.0 61 60.7 32 57.3 301 Silver Lake SILV_LK_01 Nisqually 11 9466 1.79 337.7 295.1 87 164.4 49 130.7 391 South Creek SOUT_CR_01 Nisqually 11 50863 9.63 864.2 612.3 71 612.3 71 0.0 01 South Fork Little Mashel Riv SFLM_RV_01 Nisqually 11 1800 0.34 18.2 0.0 0 0.0 0 0.0 01 Tanwax Creek TANW_CR_01 Nisqually 11 42962 8.14 452.7 189.8 42 189.8 42 0.0 01 Tanwax Lake TANW_LK_01 Nisqually 11 23794 4.51 627.4 449.5 72 276.9 44 172.5 281 Trout Lake TROU_LK_01 Nisqually 11 3730 0.71 119.1 106.6 89 100.4 84 6.2 51 Tule Lake TULE_LK_01 Nisqually 11 5903 1.12 228.2 169.1 74 135.8 60 33.3 151 Twentyfive Mile Creek 25MI_CR_01 Nisqually 11 8413 1.59 85.9 4.5 5 4.5 5 0.0 01 Twentyseven Lake TWEN_LK_01 Nisqually 11 4013 0.76 54.2 29.6 55 8.9 16 20.6 38y _ _ q y1 Twin Lakes TWIN_LK_01 Nisqually 11 5356 1.01 51.3 23.0 45 11.5 22 11.4 221 Unnamed Lake UNNA_LK_01 Nisqually 11 1746 0.33 24.4 11.7 48 11.7 48 0.0 01 Unnamed Lake1 UNNA_LK1_01 Nisqually 11 2009 0.38 138.4 126.4 91 126.4 91 0.0 01 Unnamed Trib of Mashel Ri UTMR_CR_01 Nisqually 11 15443 2.92 140.0 0.0 0 0.0 0 0.0 01 Whitman Lake WHIT_LK_01 Nisqually 11 5498 1.04 105.0 73.0 69 39.1 37 33.8 32
1 Bear Creek BEAR_CR_01 Puyallup-White 10 2958 0.56 30.4 0.0 0 0.0 0 0.0 01 Canyon Creek Two CANY_CR_01 Puyallup-White 10 7033 1.33 66.2 0.0 0 0.0 0 0.0 08 Carbon River CARB_RV_01 Puyallup-White 10 5011 0.95 157.7 2.7 2 2.0 1 0.7 0
Carbon River CARB_RV_02 Puyallup-White 10 3877 0.73 55.6 0.0 0 0.0 0 0.0 0Carbon River CARB_RV_03 Puyallup-White 10 7682 1.45 187.0 0.0 0 0.0 0 0.0 0Carbon River CARB_RV_04 Puyallup-White 10 9219 1.75 521.2 0.0 0 0.0 0 0.0 0Carbon River CARB_RV_05 Puyallup-White 10 67825 12.85 968.0 0.4 0 0.4 0 0.0 0Carbon River CARB_RV_06 Puyallup-White 10 19309 3.66 368.7 0.0 0 0.0 0 0.0 0Carbon River CARB_RV_07 Puyallup-White 10 20401 3.86 387.8 0.0 0 0.0 0 0.0 0_ _ y pCarbon River CARB_RV_08 Puyallup-White 10 5358 1.01 69.4 0.0 0 0.0 0 0.0 0
1 Cayada Creek CAYA_CR_01 Puyallup-White 10 8885 1.68 83.0 0.0 0 0.0 0 0.0 01 Chenuis Creek CHEN_CR_01 Puyallup-White 10 21820 4.13 197.6 0.0 0 0.0 0 0.0 01 Clarks Creek CLAR_CR_01 Puyallup-White 10 12482 2.36 122.0 3.4 3 3.4 3 0.0 0
Appendix C

TABLE 4BWetland Area by Freshwater Reach
# Reaches by Feature Reach Feature Reach Name WRIA Name
WRIA Number
Length (Ft)
Length (Mi)
Reach Area (acres)
Mapped Wetland Area (acres)*
% Mapped Wetland Area*
Wetland Area w/o Open Water
(acres)*
% area Wetland w/o Open Water*
Open Water Area
(acres)**
% area Open
Water**2 Clearwater River CLEA_RV_01 Puyallup-White 10 28114 5.32 275.0 0.0 0 0.0 0 0.0 0
Clearwater River CLEA_RV_02 Puyallup-White 10 22765 4.31 207.9 0.0 0 0.0 0 0.0 01 Deer Creek DEER_CR_01 Puyallup-White 10 22499 4.26 206.1 0.0 0 0.0 0 0.0 01 East Fork South Prairie Cre EFSP_CR_01 Puyallup-White 10 17997 3.41 165.8 0.0 0 0.0 0 0.0 01 Echo Lake ECHO_LK_01 Puyallup-White 10 7760 1.47 98.8 0.0 0 0.0 0 0.0 01 Eleanor Creek ELEA_CR_01 Puyallup-White 10 4084 0.77 39.0 0.0 0 0.0 0 0.0 01 Evans Creek EVAN_CR_01 Puyallup-White 10 30072 5.70 276.7 0.0 0 0.0 0 0.0 01 Fennel Creek FENN_CR_01 Puyallup-White 10 12744 2.41 130.1 30.9 24 30.9 24 0.0 01 Gale Creek GALE_CR_01 Puyallup-White 10 25238 4.78 232.7 0.0 0 0.0 0 0.0 01 George Creek GEOR_CR_01 Puyallup-White 10 7021 1.33 65.5 0.0 0 0.0 0 0.0 01 Goat Creek GOAT_CR_01 Puyallup-White 10 6404 1.21 60.0 0.0 0 0.0 0 0.0 0_ _ y p5 Greenwater River GREE_RV_01 Puyallup-White 10 24876 4.71 241.4 0.0 0 0.0 0 0.0 0
Greenwater River GREE_RV_02 Puyallup-White 10 26750 5.07 121.3 0.0 0 0.0 0 0.0 0Greenwater River GREE_RV_03 Puyallup-White 10 13661 2.59 74.3 0.0 0 0.0 0 0.0 0Greenwater River GREE_RV_04 Puyallup-White 10 4295 0.81 35.8 0.0 0 0.0 0 0.0 0Greenwater River GREE_RV_05 Puyallup-White 10 27850 5.27 250.1 0.0 0 0.0 0 0.0 0
3 Huckleberry Creek HUCK_CR_01 Puyallup-White 10 19293 3.65 176.7 0.0 0 0.0 0 0.0 0Huckleberry Creek HUCK_CR_02 Puyallup-White 10 14264 2.70 128.3 0.0 0 0.0 0 0.0 0Huckleberry Creek HUCK_CR_03 Puyallup-White 10 4867 0.92 42.1 0.0 0 0.0 0 0.0 0
1 Hylebos Creek HYLE_CR_01 Puyallup-White 10 6520 1.23 180.3 62.1 34 62.1 34 0.0 01 Kapowsin Lake KAPO_LK_01 Puyallup-White 10 48088 9.11 978.8 738.2 75 196.1 20 542.1 552 Kapowskin Creek KAPO_CR_01 Puyallup-White 10 17621 3.34 176.1 21.8 12 21.6 12 0.2 0
Kapowskin Creek KAPO_CR_02 Puyallup-White 10 3236 0.61 52.1 0.0 0 0.0 0 0.0 01 Kings Creek KING_CR_01 Puyallup-White 10 1664 0.32 16.6 0.0 0 0.0 0 0.0 06 Lake Tapps TAPP_LK_01 Puyallup-White 10 0.4 0.0 0 0.0 0 0.0 0
Lake Tapps TAPP_LK_02 Puyallup-White 10 6394 1.21 73.5 21.7 30 12.5 17 9.2 13pp _ _ y pLake Tapps TAPP_LK_03 Puyallup-White 10 21321 4.04 113.4 6.2 5 4.3 4 1.8 2Lake Tapps TAPP_LK_04 Puyallup-White 10 1.0 0.0 0 0.0 0 0.0 0Lake Tapps TAPP_LK_05 Puyallup-White 10 223747 42.38 3338.4 2354.7 71 278.3 8 2076.4 62Lake Tapps TAPP_LK_06 Puyallup-White 10 6.6 2.3 35 2.3 35 0.0 0
1 Leaky Lake LEAK_LK_01 Puyallup-White 10 4698 0.89 82.6 30.7 37 12.0 15 18.7 231 Lost Creek_Greenwater LOST_GR_CR_01 Puyallup-White 10 12547 2.38 116.6 0.0 0 0.0 0 0.0 01 Lost Creek_Huckleberry LOST_HC_CR_01 Puyallup-White 10 2327 0.44 22.5 0.0 0 0.0 0 0.0 01 Maggie Creek MAGG_CR_01 Puyallup-White 10 2331 0.44 22.9 0.0 0 0.0 0 0.0 01 Meadow Creek MEAD_CR_01 Puyallup-White 10 6403 1.21 61.4 0.0 0 0.0 0 0.0 01 Milky Creek MILK_CR_01 Puyallup-White 10 8219 1.56 76.4 0.0 0 0.0 0 0.0 01 Morgan Lake MORG_LK_01 Puyallup-White 10 7618 1.44 207.5 171.8 83 145.1 70 26.7 133 Mowich River MOWI_RV_01 Puyallup-White 10 4688 0.89 43.3 0.0 0 0.0 0 0.0 0
Mowich River MOWI_RV_02 Puyallup-White 10 22869 4.33 223.8 0.0 0 0.0 0 0.0 0Mowich River MOWI_RV_03 Puyallup-White 10 7765 1.47 82.4 0.0 0 0.0 0 0.0 0
1 Mud Mountain Lake MUDM_LK_01 Puyallup-White 10 39062 7.40 587.3 0.0 0 0.0 0 0.0 0_ _ y p1 Neisson Creek NEIS_CR_01 Puyallup-White 10 10713 2.03 99.5 0.0 0 0.0 0 0.0 01 North Puyallup River NOPU_RV_01 Puyallup-White 10 9250 1.75 85.2 0.0 0 0.0 0 0.0 01 Ohop Creek_Kapowskin OHOP_KAP_CR_01 Puyallup-White 10 15069 2.85 139.6 0.0 0 0.0 0 0.0 01 Page Creek PAGE_CR_01 Puyallup-White 10 4006 0.76 38.1 0.0 0 0.0 0 0.0 0
Appendix C

TABLE 4BWetland Area by Freshwater Reach
# Reaches by Feature Reach Feature Reach Name WRIA Name
WRIA Number
Length (Ft)
Length (Mi)
Reach Area (acres)
Mapped Wetland Area (acres)*
% Mapped Wetland Area*
Wetland Area w/o Open Water
(acres)*
% area Wetland w/o Open Water*
Open Water Area
(acres)**
% area Open
Water**1 Pinochle Creek PINO_CR_01 Puyallup-White 10 5588 1.06 51.1 0.0 0 0.0 0 0.0 02 Printz Basin PRIN_BAS_01 Puyallup-White 10 1969 0.37 17.7 6.5 37 6.5 37 0.0 0
Printz Basin PRIN_BAS_02 Puyallup-White 10 17238 3.27 398.4 290.5 73 256.4 64 34.1 913 Puyallup River PUYA_RV_01 Puyallup-White 10 5262 1.00 1094.9 96.1 9 96.1 9 0.0 0
Puyallup River PUYA_RV_02 Puyallup-White 10 10580 2.00 251.6 23.3 9 23.3 9 0.0 0Puyallup River PUYA_RV_03 Puyallup-White 10 5653 1.07 94.0 15.4 16 15.4 16 0.0 0Puyallup River PUYA_RV_04 Puyallup-White 10 20626 3.91 667.7 58.3 9 58.3 9 0.0 0Puyallup River PUYA_RV_05 Puyallup-White 10 11823 2.24 495.0 26.1 5 24.5 5 1.5 0Puyallup River PUYA_RV_06 Puyallup-White 10 21467 4.07 1026.7 112.9 11 100.8 10 12.1 1Puyallup River PUYA_RV_07 Puyallup-White 10 18830 3.57 558.2 34.0 6 34.0 6 0.0 0Puyallup River PUYA_RV_08 Puyallup-White 10 22856 4.33 630.8 16.4 3 15.9 3 0.5 0y p _ _ y pPuyallup River PUYA_RV_09 Puyallup-White 10 42293 8.01 468.3 0.0 0 0.0 0 0.0 0Puyallup River PUYA_RV_10 Puyallup-White 10 9155 1.73 97.3 0.0 0 0.0 0 0.0 0Puyallup River PUYA_RV_11 Puyallup-White 10 7104 1.35 76.0 0.0 0 0.0 0 0.0 0Puyallup River PUYA_RV_12 Puyallup-White 10 19601 3.71 190.3 0.0 0 0.0 0 0.0 0Puyallup River PUYA_RV_13 Puyallup-White 10 7993 1.51 72.8 0.0 0 0.0 0 0.0 0
2 Rhode Lake RHOD_LK_01 Puyallup-White 10 6469 1.23 77.2 46.2 60 18.4 24 27.8 36Rhode Lake RHOD_LK_02 Puyallup-White 10 2702 0.51 26.0 3.3 13 3.3 13 0.0 0
1 Rushingwater Creek RUSH_CR_01 Puyallup-White 10 17092 3.24 156.8 0.0 0 0.0 0 0.0 01 Saint Andrews Creek STAN_CR_01 Puyallup-White 10 1066 0.20 9.2 0.0 0 0.0 0 0.0 01 Silver Creek SILV_CR_01 Puyallup-White 10 29565 5.60 265.7 0.0 0 0.0 0 0.0 01 South Fork South Prairie Cr SFSP_CR_01 Puyallup-White 10 13878 2.63 128.4 0.0 0 0.0 0 0.0 04 South Prairie Creek SOPR_CR_01 Puyallup-White 10 29466 5.58 556.4 38.7 7 38.7 7 0.0 0
South Prairie Creek SOPR_CR_02 Puyallup-White 10 2596 0.49 53.9 0.0 0 0.0 0 0.0 0South Prairie Creek SOPR_CR_03 Puyallup-White 10 24139 4.57 458.8 163.6 36 163.6 36 0.0 0South Prairie Creek SOPR_CR_04 Puyallup-White 10 35205 6.67 341.2 0.0 0 0.0 0 0.0 0_ _ y p
2 South Puyallup River SOPU_RV_01 Puyallup-White 10 13019 2.47 119.5 0.0 0 0.0 0 0.0 0South Puyallup River SOPU_RV_02 Puyallup-White 10 5587 1.06 44.3 0.0 0 0.0 0 0.0 0
1 Tolmie Creek TOLM_CR_01 Puyallup-White 10 9014 1.71 84.1 0.0 0 0.0 0 0.0 01 Twentyeight Mile Creek 28MI_CR_01 Puyallup-White 10 15476 2.93 142.9 0.0 0 0.0 0 0.0 01 Unnamed Trib of Puyallup R UTPU_CR_01 Puyallup-White 10 2229 0.42 20.4 0.0 0 0.0 0 0.0 01 Unnamed Trib of So. Puyall UTSP_CR_01 Puyallup-White 10 5367 1.02 50.5 0.0 0 0.0 0 0.0 01 Viola Creek VIOL_CR_01 Puyallup-White 10 8866 1.68 83.2 0.0 0 0.0 0 0.0 02 Voight Creek VOIG_CR_01 Puyallup-White 10 35547 6.73 384.8 3.8 1 3.8 1 0.0 0
Voight Creek VOIG_CR_02 Puyallup-White 10 47984 9.09 441.2 0.0 0 0.0 0 0.0 02 West Fork White River WFWR_RV_01 Puyallup-White 10 36657 6.94 519.8 0.0 0 0.0 0 0.0 0
West Fork White River WFWR_RV_02 Puyallup-White 10 23683 4.49 951.0 0.0 0 0.0 0 0.0 010 White River WHIT_RV_01 Puyallup-White 10 17530 3.32 21.2 0.0 0 0.0 0 0.0 0
White River WHIT_RV_02 Puyallup-White 10 2936 0.56 51.8 0.3 1 0.3 1 0.0 0White River WHIT_RV_03 Puyallup-White 10 47467 8.99 1466.9 191.9 13 184.7 13 7.2 0White River WHIT_RV_04 Puyallup-White 10 22282 4.22 235.0 0.0 0 0.0 0 0.0 0_ _ y pWhite River WHIT_RV_06 Puyallup-White 10 7498 1.42 132.5 0.0 0 0.0 0 0.0 0White River WHIT_RV_07 Puyallup-White 10 55387 10.49 791.1 0.0 0 0.0 0 0.0 0White River WHIT_RV_08 Puyallup-White 10 18638 3.53 265.1 0.0 0 0.0 0 0.0 0White River WHIT_RV_09 Puyallup-White 10 24658 4.67 365.5 0.0 0 0.0 0 0.0 0
Appendix C

TABLE 4BWetland Area by Freshwater Reach
# Reaches by Feature Reach Feature Reach Name WRIA Name
WRIA Number
Length (Ft)
Length (Mi)
Reach Area (acres)
Mapped Wetland Area (acres)*
% Mapped Wetland Area*
Wetland Area w/o Open Water
(acres)*
% area Wetland w/o Open Water*
Open Water Area
(acres)**
% area Open
Water**White River WHIT_RV_10 Puyallup-White 10 77141 14.61 660.1 0.0 0 0.0 0 0.0 0White River WHIT_RV_11 Puyallup-White 10 11352 2.15 114.8 0.0 0 0.0 0 0.0 0
5 Wilkeson Creek WILK_CR_01 Puyallup-White 10 21972 4.16 219.8 32.4 15 32.4 15 0.0 0Wilkeson Creek WILK_CR_02 Puyallup-White 10 1320 0.25 8.8 0.0 0 0.0 0 0.0 0Wilkeson Creek WILK_CR_03 Puyallup-White 10 10982 2.08 100.8 10.7 11 10.7 11 0.0 0Wilkeson Creek WILK_CR_04 Puyallup-White 10 7007 1.33 62.7 0.0 0 0.0 0 0.0 0
Appendix C

TABLE 5AGeologic and Hazard Data by Marine Reach
AND IS 1 S.Key Peninsula + Islands 15 No Yes Yes Yes No Yes NO DATA NoAND IS 2 S.Key Peninsula + Islands 15 Yes Yes Yes Yes Yes Yes NO DATA NoAND IS 3 S.Key Peninsula + Islands 15 No Yes Yes Yes No Yes NO DATA NoAND IS 4 S.Key Peninsula + Islands 15 No Yes Yes Yes No No NO DATA NoAND IS 5 S.Key Peninsula + Islands 15 No Yes Yes Yes No Yes NO DATA NoCI-HB 1 Carr Inlet - Henderson Bay 15 No Yes Yes Yes Yes Yes NO DATA NoCI-HB 2 Carr Inlet - Henderson Bay 15 Yes Yes Yes Yes Yes Yes NO DATA NoCI-HB 3 Carr Inlet - Henderson Bay 15 Yes Yes Yes Yes Yes Yes NO DATA NoCI-HB 4 Carr Inlet - Henderson Bay 15 No Yes Yes Yes Yes Yes NO DATA NoCI-HB 5 Carr Inlet - Henderson Bay 15 Yes Yes Yes Yes Yes Yes NO DATA NoCI-HB 6 Carr Inlet - Henderson Bay 15 Yes Yes Yes Yes Yes Yes Yes NoCI-HB 7 Carr Inlet - Henderson Bay 15 No Yes Yes Yes Yes Yes Yes NoCI-HB 8 Carr Inlet - Henderson Bay 15 Yes Yes Yes Yes Yes Yes NO DATA NoCI-HB 9 Carr Inlet - Henderson Bay 15 Yes Yes Yes Yes Yes No NO DATA NoCI-HB 10 Carr Inlet - Henderson Bay 15 Yes Yes Yes Yes Yes Yes NO DATA NoCI-HB 11 Carr Inlet - Henderson Bay 15 No Yes Yes Yes Yes No NO DATA NoCI-HB 12 Carr Inlet - Henderson Bay 15 No Yes Yes Yes Yes Yes NO DATA NoCI-HB 13 Carr Inlet - Henderson Bay 15 No Yes Yes Yes Yes Yes NO DATA NoCI-1 Case Inlet 15 Yes Yes Yes Yes No Yes NO DATA NoCI-2 Case Inlet 15 Yes Yes Yes Yes Yes Yes NO DATA NoCI-3 Case Inlet 15 No Yes Yes Yes Yes Yes NO DATA NoCI-4 Case Inlet 15 Yes Yes Yes Yes No Yes NO DATA NoCI-5 Case Inlet 15 Yes Yes Yes Yes No Yes NO DATA NoCI-6 Case Inlet 15 No Yes Yes Yes Yes Yes NO DATA NoCI-7 Case Inlet 15 Yes Yes Yes Yes Yes Yes NO DATA No
Volcanic(8)Seismic Hazard(5)
Landslide Hazard Area(4)
Flood Hazard Area(3)
WRIASlope Stability (unstable,
unstable recent slide, unstable old slide)(6)
IDSteep
Slopes(7)Erosion
Potential(2)
Aquifer Recharge
Area(1)Feature Name
CI-8 Case Inlet 15 No Yes Yes Yes Yes Yes NO DATA NoCI-9 Case Inlet 15 No Yes Yes Yes Yes Yes NO DATA NoCI-10 Case Inlet 15 No Yes Yes Yes Yes Yes NO DATA NoCI-11 Case Inlet 15 No Yes Yes Yes No No NO DATA NoCP-TN 1 Colvos Pass-Tacoma Narrows 15 Yes Yes Yes Yes Yes Yes No NoCP-TN 2 Colvos Pass-Tacoma Narrows 15 Yes Yes Yes Yes Yes Yes Yes NoCP-TN 3 Colvos Pass-Tacoma Narrows 15 Yes Yes Yes Yes Yes No Yes NoCP-TN 4 Colvos Pass-Tacoma Narrows 15 Yes Yes Yes Yes Yes Yes Yes NoDP Dash Point 15 No Yes Yes Yes Yes Yes Yes NoHP-WB 1 Hale Pass - Wollochet Bay 15 Yes Yes Yes Yes Yes Yes NO DATA NoHP-WB 2 Hale Pass - Wollochet Bay 15 Yes Yes Yes Yes Yes Yes NO DATA NoHP-WB 3 Hale Pass - Wollochet Bay 15 Yes Yes Yes Yes Yes Yes NO DATA NoKTRN IS S.Key Peninsula + Islands 15 Yes Yes Yes Yes No Yes NO DATA NoMCN IS 1 S.Key Peninsula + Islands 15 No Yes Yes No Yes No NO DATA NoMCN IS 2 S.Key Peninsula + Islands 15 No Yes Yes No Yes No NO DATA NoMCN IS 3 S.Key Peninsula + Islands 15 No Yes Yes No Yes No NO DATA No
Appendix C

TABLE 5AGeologic and Hazard Data by Marine Reach
Volcanic(8)Seismic Hazard(5)
Landslide Hazard Area(4)
Flood Hazard Area(3)
WRIASlope Stability (unstable,
unstable recent slide, unstable old slide)(6)
IDSteep
Slopes(7)Erosion
Potential(2)
Aquifer Recharge
Area(1)Feature Name
MCN IS 4 S.Key Peninsula + Islands 15 No Yes Yes No Yes No NO DATA NoSKEY 1 S.Key Peninsula + Islands 15 No Yes Yes Yes No Yes NO DATA NoSKEY 2 S.Key Peninsula + Islands 15 Yes Yes Yes Yes No Yes NO DATA NoSKEY 3 S.Key Peninsula + Islands 15 Yes Yes Yes Yes No Yes NO DATA No
Appendix C

TABLE 5BGeologic and Hazard Data by Freshwater Reach
28MI_CR_01 Twentyeight Mile Creek 10 No No Yes NO DATA Yes No NO DATA NoBEAR_CR_01 Bear Creek 10 No Yes Yes NO DATA Yes No NO DATA NoCANY_CR_01 Canyon Creek Two 10 No No No NO DATA No No NO DATA NoCARB_RV_01 Carbon River 10 Yes Yes Yes Yes Yes No Yes YesCARB_RV_02 Carbon River 10 Yes No Yes Yes Yes No Yes YesCARB_RV_03 Carbon River 10 Yes No Yes Yes Yes No Yes YesCARB_RV_04 Carbon River 10 Yes Yes Yes Yes Yes No Yes YesCARB_RV_05 Carbon River 10 Yes Yes Yes Yes Yes No Yes YesCARB_RV_06 Carbon River 10 Yes No Yes NO DATA Yes No NO DATA YesCARB_RV_07 Carbon River 10 Yes No Yes NO DATA Yes No NO DATA YesCARB_RV_08 Carbon River 10 Yes No Yes NO DATA Yes No NO DATA YesCAYA_CR_01 Cayada Creek 10 Yes No No NO DATA Yes No NO DATA YesCHEN_CR_01 Chenuis Creek 10 No No No NO DATA Yes No NO DATA YesCLAR_CR_01 Clarks Creek 10 Yes No Yes Yes Yes No Yes YesCLEA_RV_01 Clearwater River 10 No No Yes NO DATA Yes No NO DATA YesCLEA_RV_02 Clearwater River 10 No No Yes NO DATA Yes No NO DATA NoDEER_CR_01 Deer Creek 10 No No Yes NO DATA Yes No NO DATA YesECHO_LK_01 Echo Lake 10 No No No NO DATA Yes No NO DATA NoEFSP_CR_01 East Fork South Prairie Creek 10 No No No NO DATA Yes No NO DATA NoELEA_CR_01 Eleanor Creek 10 No No No NO DATA Yes No NO DATA NoEVAN_CR_01 Evans Creek 10 Yes No Yes NO DATA No No NO DATA YesFENN_CR_01 Fennel Creek 10 Yes No Yes Yes Yes No Yes YesGALE_CR_01 Gale Creek 10 No No Yes No Yes No No NoGEOR_CR_01 George Creek 10 No No No NO DATA No No NO DATA NoGOAT_CR_01 Goat Creek 10 No No Yes NO DATA No No NO DATA Yes
Volcanic(8)Flood
Hazard Area(3)
Landslide Hazard Area(4)
Seismic Hazard(5)
Slope Stability (unstable, unstable recent slide, unstable old slide)(6)
ID Feature NameAquifer
Recharge Area(1)
Erosion Potential(2)WRIA
Steep Slopes(7)
_ _GREE_RV_01 Greenwater River 10 No No Yes NO DATA No No NO DATA YesGREE_RV_02 Greenwater River 10 No No Yes NO DATA No No NO DATA NoGREE_RV_03 Greenwater River 10 No Yes No NO DATA No No NO DATA NoGREE_RV_04 Greenwater River 10 No No No NO DATA No No NO DATA NoGREE_RV_05 Greenwater River 10 No No No NO DATA Yes No NO DATA NoHUCK_CR_01 Huckleberry Creek 10 No No Yes NO DATA Yes No NO DATA YesHUCK_CR_02 Huckleberry Creek 10 No No No NO DATA Yes No NO DATA NoHUCK_CR_03 Huckleberry Creek 10 No No No NO DATA Yes No NO DATA NoHYLE_CR_01 Hylebos Creek 10 Yes No Yes Yes Yes No Yes YesKAPO_CR_01 Kapowskin Creek 10 Yes Yes Yes NO DATA Yes No NO DATA YesKAPO_CR_02 Kapowskin Creek 10 No No Yes NO DATA Yes No NO DATA NoKAPO_LK_01 Kapowsin Lake 10 No Yes Yes NO DATA Yes No NO DATA YesKING_CR_01 Kings Creek 10 No No Yes NO DATA Yes No NO DATA YesLEAK_LK_01 Leaky Lake 10 Yes Yes Yes Yes Yes No Yes No
Appendix C

TABLE 5BGeologic and Hazard Data by Freshwater Reach
Volcanic(8)Flood
Hazard Area(3)
Landslide Hazard Area(4)
Seismic Hazard(5)
Slope Stability (unstable, unstable recent slide, unstable old slide)(6)
ID Feature NameAquifer
Recharge Area(1)
Erosion Potential(2)WRIA
Steep Slopes(7)
LOST_GR_CR_01Lost Creek_Greenwater 10 No No No NO DATA Yes No NO DATA NoLOST_HC_CR_01 Lost Creek_Huckleberry 10 No No No NO DATA Yes No NO DATA NoMAGG_CR_01 Maggie Creek 10 No No No NO DATA No No NO DATA NoMEAD_CR_01 Meadow Creek 10 Yes No Yes NO DATA Yes No NO DATA YesMILK_CR_01 Milky Creek 10 No No No NO DATA No No NO DATA NoMORG_LK_01 Morgan Lake 10 No Yes Yes NO DATA Yes No NO DATA NoMOWI_RV_01 Mowich River 10 Yes No Yes NO DATA Yes No NO DATA YesMOWI_RV_02 Mowich River 10 Yes No Yes NO DATA Yes No NO DATA YesMOWI_RV_03 Mowich River 10 Yes No Yes NO DATA Yes No NO DATA YesNEIS_CR_01 Neisson Creek 10 Yes No Yes NO DATA No No NO DATA YesNOPU_RV_01 North Puyallup River 10 Yes Yes Yes NO DATA Yes No NO DATA YesOHOP_KAP_CR_0Ohop Creek_Kapowskin 10 No No Yes NO DATA No No NO DATA NoPAGE_CR_01 Page Creek 10 No Yes Yes No No No No NoPINO_CR_01 Pinochle Creek 10 No No Yes NO DATA Yes No NO DATA YesPRIN_BAS_01 Printz Basin 10 No Yes Yes Yes Yes No Yes NoPRIN_BAS_02 Printz Basin 10 No Yes Yes Yes Yes No Yes NoPUYA_RV_01 Puyallup River 10 Yes Yes Yes Yes Yes No Yes YesPUYA_RV_02 Puyallup River 10 Yes Yes Yes Yes Yes No Yes YesPUYA_RV_03 Puyallup River 10 Yes No Yes Yes Yes No Yes YesPUYA_RV_04 Puyallup River 10 Yes Yes Yes Yes Yes No Yes YesPUYA_RV_05 Puyallup River 10 Yes Yes Yes Yes Yes No Yes YesPUYA_RV_06 Puyallup River 10 Yes Yes Yes Yes Yes No Yes YesPUYA_RV_07 Puyallup River 10 Yes Yes Yes NO DATA Yes No NO DATA YesPUYA_RV_08 Puyallup River 10 Yes No Yes NO DATA Yes No NO DATA YesPUYA_RV_09 Puyallup River 10 Yes Yes Yes NO DATA Yes No NO DATA Yes_ _ y pPUYA_RV_10 Puyallup River 10 Yes No Yes NO DATA Yes No NO DATA YesPUYA_RV_11 Puyallup River 10 Yes No Yes NO DATA Yes No NO DATA YesPUYA_RV_12 Puyallup River 10 Yes Yes Yes NO DATA Yes No NO DATA YesPUYA_RV_13 Puyallup River 10 Yes No Yes NO DATA Yes No NO DATA YesRHOD_LK_01 Rhode Lake 10 Yes Yes Yes Yes Yes No Yes NoRHOD_LK_02 Rhode Lake 10 Yes Yes Yes Yes Yes No Yes NoRUSH_CR_01 Rushingwater Creek 10 Yes No Yes NO DATA No No NO DATA YesSFSP_CR_01 South Fork South Prairie Creek 10 No No No NO DATA No No NO DATA NoSILV_CR_01 Silver Creek 10 No No Yes NO DATA Yes No NO DATA YesSOPR_CR_01 South Prairie Creek 10 Yes Yes Yes Yes Yes No Yes YesSOPR_CR_02 South Prairie Creek 10 Yes No Yes No Yes No No YesSOPR_CR_03 South Prairie Creek 10 Yes No Yes Yes Yes No Yes YesSOPR_CR_04 South Prairie Creek 10 No No Yes No Yes No No NoSOPU_RV_01 South Puyallup River 10 Yes No Yes NO DATA Yes No NO DATA Yes
Appendix C

TABLE 5BGeologic and Hazard Data by Freshwater Reach
Volcanic(8)Flood
Hazard Area(3)
Landslide Hazard Area(4)
Seismic Hazard(5)
Slope Stability (unstable, unstable recent slide, unstable old slide)(6)
ID Feature NameAquifer
Recharge Area(1)
Erosion Potential(2)WRIA
Steep Slopes(7)
SOPU_RV_02 South Puyallup River 10 No No Yes NO DATA Yes No NO DATA YesSTAN_CR_01 Saint Andrews Creek 10 No No No NO DATA Yes No NO DATA YesTAPP_LK_01 Lake Tapps 10 Yes No No Yes No No Yes NoTAPP_LK_02 Lake Tapps 10 Yes Yes Yes Yes Yes No Yes NoTAPP_LK_03 Lake Tapps 10 Yes Yes Yes Yes Yes No Yes NoTAPP_LK_04 Lake Tapps 10 Yes Yes No NO DATA Yes No NO DATA NoTAPP_LK_05 Lake Tapps 10 Yes Yes Yes Yes Yes No Yes NoTAPP_LK_06 Lake Tapps 10 No Yes Yes Yes Yes No Yes NoTOLM_CR_01 Tolmie Creek 10 Yes No Yes NO DATA Yes No NO DATA YesUTPU_CR_01 Unnamed Trib of Puyallup River 10 Yes No Yes NO DATA Yes No NO DATA YesUTSP_CR_01 Unnamed Trib of So. Puyallup R 10 No No No NO DATA No No NO DATA YesVIOL_CR_01 Viola Creek 10 No No No NO DATA No No NO DATA NoVOIG_CR_01 Voight Creek 10 Yes No Yes Yes Yes No Yes YesVOIG_CR_02 Voight Creek 10 No Yes Yes NO DATA Yes No NO DATA NoWFWR_RV_01 West Fork White River 10 No No Yes NO DATA Yes No NO DATA YesWFWR_RV_02 West Fork White River 10 No No Yes NO DATA Yes No NO DATA YesWHIT_RV_01 White River 10 Yes No Yes Yes Yes No Yes YesWHIT_RV_02 White River 10 Yes Yes Yes Yes Yes No Yes YesWHIT_RV_03 White River 10 Yes Yes Yes Yes Yes No Yes YesWHIT_RV_04 White River 10 Yes No Yes Yes Yes No Yes YesWHIT_RV_06 White River 10 No Yes Yes NO DATA Yes No NO DATA YesWHIT_RV_07 White River 10 No No Yes NO DATA Yes No NO DATA YesWHIT_RV_08 White River 10 No No No NO DATA Yes No NO DATA YesWHIT_RV_09 White River 10 Yes No Yes NO DATA Yes No NO DATA YesWHIT_RV_10 White River 10 No No Yes NO DATA Yes No NO DATA Yes_ _WHIT_RV_11 White River 10 No No Yes NO DATA Yes No NO DATA YesWILK_CR_01 Wilkeson Creek 10 Yes Yes Yes No Yes No No YesWILK_CR_02 Wilkeson Creek 10 Yes No Yes No No No No YesWILK_CR_03 Wilkeson Creek 10 Yes No Yes No No No No YesWILK_CR_04 Wilkeson Creek 10 No No Yes No Yes No No NoALD_LK_01 Alder Lake 11 No Yes Yes NO DATA Yes No NO DATA YesBEAV_CR_01 Beaver Creek 11 No Yes Yes NO DATA No No NO DATA NoBENB_LK_01 Benbow Lakes 11 No Yes Yes NO DATA Yes No NO DATA NoBUSY_CR_01 Busy Wild Creek 11 No Yes Yes NO DATA No No NO DATA NoCLEA_LK_01 Clear Lake 11 No Yes Yes NO DATA No No NO DATA NoCOPP_CR_01 Copper Creek 11 No No Yes NO DATA No No NO DATA YesCRAN_LK_01 Cranberry Lake 11 No Yes Yes NO DATA Yes No NO DATA NoHART_LK_01 Harts Lake 11 Yes Yes Yes NO DATA Yes No NO DATA YesHORN_CR_01 Horn Creek 11 Yes Yes Yes NO DATA Yes No NO DATA Yes
Appendix C

TABLE 5BGeologic and Hazard Data by Freshwater Reach
Volcanic(8)Flood
Hazard Area(3)
Landslide Hazard Area(4)
Seismic Hazard(5)
Slope Stability (unstable, unstable recent slide, unstable old slide)(6)
ID Feature NameAquifer
Recharge Area(1)
Erosion Potential(2)WRIA
Steep Slopes(7)
KREG_LK_01 Kreger Lake 11 No Yes Yes NO DATA Yes No NO DATA NoLAGR_RES_01 La Grande Reservoir 11 No Yes Yes NO DATA No No NO DATA YesLITT_LK_01 Little Lake 11 Yes Yes Yes NO DATA Yes No NO DATA YesLMAS_RV_01 Little Mashel River 11 No No Yes NO DATA Yes No NO DATA NoLMAS_RV_02 Little Mashel River 11 No Yes Yes NO DATA No No NO DATA NoLMAS_RV_03 Little Mashel River 11 No No Yes NO DATA No No NO DATA NoLYNC_CR_01 Lynch Creek 11 Yes No Yes NO DATA Yes No NO DATA YesLYNC_CR_02 Lynch Creek 11 Yes No Yes NO DATA Yes No NO DATA YesLYNC_CR_03 Lynch Creek 11 No No Yes NO DATA Yes No NO DATA NoLYNC_CR_04 Lynch Creek 11 No Yes Yes NO DATA No No NO DATA NoMASH_RV_01 Mashel River 11 No No Yes NO DATA No No NO DATA YesMASH_RV_02 Mashel River 11 No No Yes NO DATA Yes No NO DATA NoMASH_RV_03 Mashel River 11 Yes Yes Yes NO DATA Yes No NO DATA NoMASH_RV_04 Mashel River 11 No Yes Yes NO DATA Yes No NO DATA NoMASH_RV_05 Mashel River 11 No No Yes NO DATA No No NO DATA NoMASH_RV_06 Mashel River 11 No No Yes NO DATA No No NO DATA NoMASH_RV_07 Mashel River 11 No No Yes NO DATA No No NO DATA NoMIDW_CR_01 Midway Creek 11 No Yes Yes NO DATA No No NO DATA NoMUCK_CR_01 Muck Creek 11 Yes No Yes NO DATA Yes No NO DATA NoMUCK_LK_01 Muck Lake 11 Yes Yes Yes Yes No No Yes NoMUD_LK_01 Mud Lake 11 No Yes Yes NO DATA Yes No NO DATA NoMUDM_LK_01 Mud Mountain Lake 11 No No Yes NO DATA Yes No NO DATA NoNISQ_RV_01 Nisqually River 11 Yes Yes Yes NO DATA Yes No NO DATA YesNISQ_RV_02 Nisqually River 11 Yes Yes Yes NO DATA Yes No NO DATA YesNISQ_RV_03 Nisqually River 11 Yes No Yes NO DATA Yes No NO DATA YesQ_ _ q yNISQ_RV_04 Nisqually River 11 Yes No Yes NO DATA Yes No NO DATA YesNISQ_RV_05 Nisqually River 11 No Yes Yes NO DATA No No NO DATA YesNISQ_RV_06 Nisqually River 11 Yes Yes Yes NO DATA No No NO DATA YesNISQ_RV_07 Nisqually River 11 No No Yes NO DATA No No NO DATA YesNISQ_RV_08 Nisqually River 11 No No Yes NO DATA Yes No NO DATA YesOHOP_LK_01 Ohop Lake 11 Yes Yes Yes NO DATA Yes No NO DATA YesOHOP_LK_CR Ohop Creek_Nis 11 Yes No Yes NO DATA Yes No NO DATA YesOHOP_NIS_CR_0 Ohop Creek_Nis 11 Yes Yes Yes NO DATA Yes No NO DATA YesOHOP_NIS_CR_0 Ohop Creek_Nis 11 Yes No Yes NO DATA Yes No NO DATA YesOHOP_NIS_CR_0 Ohop Creek_Nis 11 Yes Yes Yes NO DATA Yes No NO DATA YesOHOP_NIS_CR_0 Ohop Creek_Nis 11 Yes No Yes NO DATA Yes No NO DATA YesRAPJ_LK_01 Rapjohn Lake 11 No Yes Yes NO DATA Yes No NO DATA NoSFLM_RV_01 South Fork Little Mashel River 11 No No Yes NO DATA No No NO DATA NoSILV_LK_01 Silver Lake 11 No Yes Yes NO DATA Yes No NO DATA No
Appendix C

TABLE 5BGeologic and Hazard Data by Freshwater Reach
Volcanic(8)Flood
Hazard Area(3)
Landslide Hazard Area(4)
Seismic Hazard(5)
Slope Stability (unstable, unstable recent slide, unstable old slide)(6)
ID Feature NameAquifer
Recharge Area(1)
Erosion Potential(2)WRIA
Steep Slopes(7)
SOUT_CR_01 South Creek 11 Yes Yes Yes NO DATA Yes No NO DATA NoTANW_CR_01 Tanwax Creek 11 Yes Yes Yes NO DATA Yes No NO DATA YesTANW_LK_01 Tanwax Lake 11 No Yes Yes NO DATA Yes No NO DATA NoTROU_LK_01 Trout Lake 11 No Yes Yes NO DATA Yes No NO DATA NoTULE_LK_01 Tule Lake 11 No Yes Yes NO DATA Yes No NO DATA No25MI_CR_01 Twentyfive Mile Creek 11 Yes No Yes NO DATA Yes No NO DATA YesTWEN_LK_01 Twentyseven Lake 11 Yes Yes Yes NO DATA No No NO DATA NoTWIN_LK_01 Twin Lakes 11 No Yes Yes NO DATA Yes No NO DATA NoUNNA_LK_01 Unnamed Lake 11 No Yes Yes NO DATA Yes No NO DATA NoUNNA_LK1_01 Unnamed Lake1 11 Yes Yes Yes NO DATA Yes No NO DATA YesUTMR_CR_01 Unnamed Trib of Mashel River 11 No No Yes NO DATA No No NO DATA NoWHIT_LK_01 Whitman Lake 11 No Yes Yes NO DATA Yes No NO DATA NoCHAM_CR_01 Chambers Creek 12 Yes Yes Yes Yes Yes Yes Yes NoCLOV_CR_01 Clover Creek 12 Yes Yes Yes Yes Yes No Yes NoSPAN_CR_01 Spanaway Creek 12 Yes Yes Yes Yes No No Yes NoSPAN_LK_01 Spanaway Lake 12 Yes Yes Yes Yes Yes No Yes NoBAY_LK_01 Bay Lake 15 No Yes Yes NO DATA No No NO DATA NoBUTT_RES_01 Butterworth Reservoir 15 No Yes Yes NO DATA No No NO DATA NoCARN_LK_01 Carney Lake 15 No Yes Yes NO DATA No No NO DATA NoCRES_LK_01 Crescent Lake 15 No Yes Yes Yes No No Yes NoFLOR_LK_01 Florence Lake 15 No Yes Yes NO DATA No No NO DATA NoJACK_LK_01 Jackson Lake 15 No Yes Yes NO DATA Yes No NO DATA NoJOSE_LK_01 Josephine Lake 15 Yes Yes Yes Yes No Yes No NoMINT_CR_01 Minter Creek 15 No Yes Yes Yes Yes No No NoMINT_LK_01 Lake Minterwood 15 Yes Yes Yes NO DATA No No NO DATA No_ _ROCK_CR_01 Rocky Creek 15 No Yes Yes Yes Yes No No NoSTAN_LK_01 Stansberry Lake 15 Yes Yes Yes NO DATA Yes No NO DATA No
Appendix C

TABLE 6Fish Species, Habitat and Water Quality by Freshwater Reach
# Reaches by Feature
1 Chambers Creek CHAM_CR_01 Chambers-Clover 12 1928.391 0.365
Category 5 (303(d)) - fecal coliform; Category 4A - copper; Category 2 - pH and
temperature; Category 1 - ammonia-N, arsenic, copper, dissolved oxygen, lead,
mercury, pH, total PCBs, zinc, and temperature Chinook, coho, chum, steelhead UNOS, waterfowl concentration area, riparian zone, bald eagle nest
1 Clover Creek CLOV_CR_01 Chambers-Clover 12 18559.163 3.515
Category 5 (303(d)) - dissolved oxygen, fecal coliform, and temperature; Category 2
- dissolved oxygen, fecal coliform, lead, mercury, pH, and temperature; Category 1 -ammonia-N, arsenic, cadmium, chromium,
copper, nickel, pH, and zinc coho, steelhead wetlands, UNOS, waterfowl concentration area1 Spanaway Creek SPAN_CR_01 Chambers-Clover 12 12429.318 2.354 Category 2 - temperature steelhead (potential coho) wetlands, UNOS, waterfowl concentration area, riparian zone
1 Spanaway Lake SPAN_LK_01 Chambers-Clover 12 426.134 0.081Category 5 (303(d)) - total phosphorus;
Category 1 - total phosphorus cutthroat trout, coho, steelhead wetlands, UNOS, waterfowl concentration area, riparian zone
1 Bay Lake BAY_LK_01 Kitsap 15 30720.520 5.818 Category 2 - total phosphorus largemouth bass, bluegill, rainbow trout, German brown trout waterfowl concentration area; estuarine zone1 Butterworth Reservoir BUTT_RES_01 Kitsap 15 13207.764 2.501 None listed rainbow trout UNOS, waterfowl concentration area1 Carney Lake CARN_LK_01 Kitsap 15 6433.134 1.218 Category 1 - total phosphorus rainbow trout N/A1 Crescent Lake CRES_LK_01 Kitsap 15 22271.710 4.218 Category 1 - total phosphorus argemouth bass, smallmouth bass, bluegill, cutthroat trout, rainbow trou N/A
Water Quality Impairments Species Use Priority HabitatReach Name Length (Mi)Reach Feature WRIA Name WRIA Number Length (Ft)
1 Florence Lake FLOR_LK_01 Kitsap 15 13705.071 2.596 None listed spiney ray UNOS, waterfowl concentration area1 Jackson Lake JACK_LK_01 Kitsap 15 17252.301 3.267 Category 1 - total phosphorus largemouth bass N/A1 Josephine Lake JOSE_LK_01 Kitsap 15 13228.105 2.505 Category 1 - total phosphorus bass and trout species wetlands, UNOS, waterfowl concentration area1 Lake Minterwood MINT_LK_01 Kitsap 15 11378.776 2.155 None listed None/unknown N/A
1 Minter Creek MINT_CR_01 Kitsap 15 7762.509 1.470
Category 5 (303(d)) - dissolved oxygen, fecal coliform; Category 1 - pH,
temperature Chinook, chum, coho, steelhead, cutthroat trout wetlands
1 Rocky Creek ROCK_CR_01 Kitsap 15 639.775 0.121Category 2 - dissolved oxygen; Category 1 -
temperature Chinook, chum, coho, steelhead, cutthroat trout N/A1 Stansberry Lake STAN_LK_01 Kitsap 15 7729.896 1.464 Category 1 - total phosphorus None/unknown N/A
1 Alder Lake ALD_LK_01 Nisqually 11 162.248 0.031 Category 2 - total phosphorus cutthroat trout
Upper Nisqually bald eagle use areas, waterfowl concentration area, wetlands, island habitat, harlequin duck breeding areas, riparian zone; UNOS, old growth
habitat, snag rich habitat, deer and elk wintering areas
1 Beaver Creek BEAV_CR_01 Nisqually 11 30770.467 5.828 None listed coho, Chinook, steelhead, cutthroat troutUpper Nisqually bald eagle use areas, waterfowl concentration areas, riparian zone,
White River elk range, wetlands1 Benbow Lakes BENB_LK_01 Nisqually 11 9213.803 1.745 None listed None/unknown UNOS, waterfowl concentration areas, wetlands
1 Busy Wild Creek BUSY_CR_01 Nisqually 11 39836.570 7.545 None listed steelhead, coho, channel catfish, cutthroat trout, ChinookWhite River elk range, waterfowl concentration area, riparian zone, Upper Nisqually
bald eagle use area1 Clear Lake CLEA_LK_01 Nisqually 11 13188.520 2.498 Category 5 (303(d)) - total phosphorus None/unknown UNOS, waterfowl concentration area, Upper Nisqually bald eagle use area1 Copper Creek COPP_CR_01 Nisqually 11 4047.792 0.767 None listed None/unknown White River elk range1 Cranberry Lake CRAN_LK_01 Nisqually 11 14069.887 2.665 None listed None/unknown Wetlands, waterfowl concentration areas
1 Harts Lake HART LK 01 Nisqually 11 37167 628 7 039
Category 5 (303(d) - total phosphorus; Category 4C - invasive exotic species;
Category 1 - fecal coliform cutthroat trout coho steelhead Wetlands waterfowl concentration areas1 Harts Lake HART_LK_01 Nisqually 11 37167.628 7.039 Category 1 - fecal coliform cutthroat trout, coho, steelhead Wetlands, waterfowl concentration areas1 Horn Creek HORN_CR_01 Nisqually 11 12780.439 2.421 None listed coho, Chinook, pink, chum, steelhead, cutthroat trout Waterfowl concentration areas, wetlands1 Kreger Lake KREG_LK_01 Nisqually 11 27490.769 5.207 Category 2 - total phosphorus channel catfish UNOS, riparian zone, waterfowl concentration areas, wetlands
1 La Grande Reservoir LAGR_RES_01 Nisqually 11 33493.066 6.343 Category 2 - total phosphorus cutthroat trout, Chinook, coho, pink, steelheadUpper Nisqually River bald eagle use area, old growth habitat, snag rich
habitat, UNOS
1 Little Lake LITT_LK_01 Nisqually 11 12670.105 2.400 Category 2 - total phosphorus None/unknownWaterfowl concentration areas, wetlands, Little Lake wood duck nesting
area
3 Little Mashel River LMAS_RV_01 Nisqually 11 1673.111 0.317 None listed cutthroat trout, Chinook, coho, chum, steelheadRiparian zones, White River elk range, Upper Nisqually River bald eagle
use area
Little Mashel River LMAS_RV_02 Nisqually 11 10584.588 2.005 None listed cutthroat trout, Chinook, coho, chum, steelheadWaterfowl concentration areas, wetlands, White River elk range, Upper
Nisqually bald eagle use area, riparian zones
Little Mashel River LMAS_RV_03 Nisqually 11 8980.534 1.701 None listed cutthroat troutWhite River elk range, Upper Nisqually bald eagle use area, riparian
zones, waterfowl concentration areas
5 Lynch Creek LYNC_CR_01 Nisqually 11 909.137 0.172 None listedchannel catfish, cutthroat trout, Chinook, chum, coho, pink,
sockeye, steelheadWaterfowl concentration areas, Upper Nisqually bald eagle use area,
riparian zones
Lynch Creek LYNC_CR_02 Nisqually 11 2964.505 0.561 None listed channel catfish, cutthroat trout, Chinook, chum, coho, sockeye Riparian zonesLynch Creek LYNC_CR_03 Nisqually 11 1784.471 0.338 None listed channel catfish, cutthroat trout, coho, sockeye Riparian zonesLynch Creek LYNC_CR_04 Nisqually 11 15359.200 2.909 None listed channel catfish, cutthroat trout White River elk range, riparian zones, wetlands
7 Mashel River MASH_RV_01 Nisqually 11 19212.517 3.639
Category 5 (303(d) - temperature; Category 2 - temperature; Category 1 - dissolved oxygen, fecal coliform, pH, temperature cutthroat trout, Chinook, chum, coho, pink, sockeye, steelhead
Riparian zones, UNOS, waterfowl concentration areas, Upper Nisqually bald eagle use areas, old growth habitat, snag rich habitat
Category 5 (303(d) - temperature; Category
Mashel River MASH_RV_02 Nisqually 11 5452.761 1.033
Category 5 (303(d) temperature; Category 2 - temperature; Category 1 - dissolved oxygen, fecal coliform, pH, temperature cutthroat trout, Chinook, chum, coho, pink, sockeye, steelhead
Upper Nisqually bald eagle use area, riparian zones, and waterfowl concentration areas
Mashel River MASH_RV_03 Nisqually 11 6191.257 1.173
Category 5 (303(d) - temperature; Category 2 - temperature; Category 1 - dissolved oxygen, fecal coliform, pH, temperature cutthroat trout, Chinook, chum, coho, sockeye, steelhead
Upper Nisqually bald eagle use area, riparian zones, White River elk range, waterfowl concentration areas
Mashel River MASH_RV_04 Nisqually 11 21354.659 4.044
Category 5 (303(d) - temperature; Category 2 - temperature; Category 1 - dissolved oxygen, fecal coliform, pH, temperature cutthroat trout, Chinook, chum, coho, steelhead
Upper Nisqually bald eagle use area, waterfowl concentration areas, riparian zones, White River elk range
Appendix C

TABLE 6Fish Species, Habitat and Water Quality by Freshwater Reach
# Reaches by Feature Water Quality Impairments Species Use Priority HabitatReach Name Length (Mi)Reach Feature WRIA Name WRIA Number Length (Ft)
Mashel River MASH_RV_05 Nisqually 11 23205.987 4.395
Category 5 (303(d) - temperature; Category 2 - temperature; Category 1 - dissolved oxygen, fecal coliform, pH, temperature cutthroat trout, Chinook, coho, steelhead
Upper Nisqually bald eagle use area, White River elk range, waterfowl concentration areas, riparian zones
Mashel River MASH_RV_06 Nisqually 11 6761.369 1.281
Category 5 (303(d) - temperature; Category 2 - temperature; Category 1 - dissolved oxygen, fecal coliform, pH, temperature cutthroat trout, Chinook, coho, steelhead
Upper Nisqually bald eagle use area, waterfowl concentration areas, White River elk range, riparian zones
Mashel River MASH_RV_07 Nisqually 11 12716.263 2.408
Category 5 (303(d) - temperature; Category 2 - temperature; Category 1 - dissolved oxygen, fecal coliform, pH, temperature channel catfish, cutthroat trout, Chinook, coho White River elk range
1 Midway Creek MIDW_CR_01 Nisqually 11 4061.087 0.769 None listed cutthroat troutRiparian zones, Upper Nisqually bald eagle use area, waterfowl
concentration areas, White River elk range, wetlands
1 Muck Creek MUCK_CR_01 Nisqually 11 13671.067 2.589Category 2 - dissolved oxygen, fecal
coliform; Category 1 - pH, temperature chum, steelhead, coho, cutthroat trout, Chinook, pink Riparian zones, waterfowl concentration areas, wetlands1 Muck Lake MUCK_LK_01 Nisqually 11 11937.829 2.261 None listed cutthroat trout, chum, coho, steelhead Riparian zones, wetlands, waterfowl concentration areas1 Mud Lake MUD_LK_01 Nisqually 11 18543.322 3.512 Category 2 - total phosphorus None/unknown Wetlands, waterfowl concentration areas
8 Nisqually River NISQ_RV_01 Nisqually 11 19627.699 3.717
Category 4C - Invasive exotic species; Category 2 - chromium, fecal coliform, total
PCBs; Category 1 - multiplecutthroat trout, Chinook, chum, coho, Dolly Varden/bull trout,
pink, sockeye, steelheadWaterfowl concentration areas, Upper Nisqually bald eagle use areas,
wetlands, UNOS, riparian zones
Nisqually River NISQ_RV_02 Nisqually 11 13065.550 2.475
Category 4C - Invasive exotic species; Category 2 - chromium, fecal coliform, total
PCBs; Category 1 - multiplecutthroat, Chinook, chum, coho, Dolly Varden/bull trout, pink,
sockeye, steelheadRiparian zones, wetlands, Upper Nisqually bald eagle use areas, waterfowl
concentration areas, UNOS
Nisqually River NISQ_RV_03 Nisqually 11 13946.591 2.641
Category 4C - Invasive exotic species; Category 2 - chromium, fecal coliform, total
PCBs; Category 1 - multiplechannel catfish, cutthroat trout, Chinook, chum, coho, Dolly
Varden/bull trout/ pink, sockeye, steelhead UNOS, Upper Nisqually bald eagle use areas, riparian zones
Nisqually River NISQ_RV_04 Nisqually 11 6797.763 1.287
Category 4C - Invasive exotic species; Category 2 - chromium, fecal coliform, total
PCBs; Category 1 - multiplecutthroat trout, Chinook, chum, coho, Dolly Varden/bull trout,
pink, sockeye, steelheadUpper Nisqually bald eagle use areas, UNOS, wetlands, riparian zones,
snag rich habitat, old growth habitat, waterfowl concentration areas
Nisqually River NISQ_RV_05 Nisqually 11 8455.982 1.602
Category 4C - Invasive exotic species; Category 2 - chromium, fecal coliform, total
PCBs; Category 1 - multiplecutthroat trout, Chinook, chum, coho, Dolly Varden/bull trout,
pink, sockeye, steelheadOld growth habitat, riparian zones, Upper Nisqually bald eagle use areas,
snag rich habitat, UNOS
Nisqually River NISQ_RV_06 Nisqually 11 34378.331 6.511
Category 4C - Invasive exotic species; Category 2 - chromium, fecal coliform, total
PCBs; Category 1 - multiple cutthroat trout, rainbow trout
Riparian zones, Upper Nisqually bald eagle use areas, Nisqually deer and elk wintering areas, White River elk range, harlequin duck breeding areas,
wetlands
Nisqually River NISQ_RV_07 Nisqually 11 311.565 0.059
Category 4C - Invasive exotic species; Category 2 - chromium, fecal coliform, total
PCBs; Category 1 - multiple cutthroat trout, rainbow trout White River elk range, Nisqually elk wintering area
Nisqually River NISQ_RV_08 Nisqually 11 982.552 0.186
Category 4C - Invasive exotic species; Category 2 - chromium, fecal coliform, total
PCBs; Category 1 - multiple cutthroat trout White River elk range, Nisqually elk wintering area
1 Ohop Creek_Nis OHOP_LK_CR Nisqually 11 10937.771 2.072
Category 5 (303(d)) - fecal coliform; Category 1 - temperature, dissolved
oxygen, pHchannel catfish, cutthroat trout, Chinook, chum, coho, pink,
sockeye, steelheadUpper Nisqually bald eagle use area, riparian zones, UNOS, waterfowl
concentration areasC t 5 (303(d)) f l lif
4 Ohop Creek_Nis OHOP_NIS_CR_01 Nisqually 11 32402.970 6.137
Category 5 (303(d)) - fecal coliform; Category 1 - temperature, dissolved
oxygen, pH cutthroat trout, Chinook, chum, coho, pink, sockeye, steelheadUpper Nisqually bald eagle use areas, waterfowl concentration areas,
UNOS, riparian zones, wetlands
Ohop Creek_Nis OHOP_NIS_CR_02 Nisqually 11
Category 5 (303(d)) - fecal coliform; Category 1 - temperature, dissolved
oxygen, pH cutthroat trout, Chinook, chum, coho, pink, sockeye, steelheadUNOS, Upper Nisqually bald eagle use areas, waterfowl concentration
areas, riparian zones, wetlands
Ohop Creek_Nis OHOP_NIS_CR_03 Nisqually 11
Category 5 (303(d)) - fecal coliform; Category 1 - temperature, dissolved
oxygen, pH channel catfish, cutthroat trout, coho, pink, sockeye, steelheadUpper Nisqually bald eagle use araeas, waterfowl concentration areas,
wetlands, UNOS, snag rich habitat
Ohop Creek_Nis OHOP_NIS_CR_04 Nisqually 11 12869.344 2.437
Category 5 (303(d)) - fecal coliform; Category 1 - temperature, dissolved
oxygen, pH channel catfish, cutthroat trout, coho, pink, sockeye, steelheadUNOS, waterfowl concentration areas, Upper Nisqually bald eagle use
areas, wetlands
1 Ohop Lake OHOP_LK_01 Nisqually 11 44854.947 8.495Category 5 (303(d)) - total phosphorus; Category 4C - invasive exotic species cutthroat trout, Chinook, chum, coho, pink, sockeye, steelhead
Upper Nisqually bald eagle use areas, riparian zones, wetlands, snag rich areas, waterfowl concentration areas, UNOS
1 Rapjohn Lake RAPJ_LK_01 Nisqually 11 24852.390 4.707Category 4C - invasive exotic species;
Category 2 - total phosphorus coho Wetlands, waterfowl concentration areas1 Silver Lake SILV_LK_01 Nisqually 11 18153.568 3.438 None listed None/unknown Waterfowl concentration areas, wetlands, riparian zones1 South Creek SOUT_CR_01 Nisqually 11 50863.089 9.633 None listed chum, coho, steelhead, cutthroat trout Riparian zones, wetlands, waterfowl concentration areas
1 South Fork Little Mashel River SFLM_RV_01 Nisqually 11 1800.277 0.341 None listed cutthroat troutUpper Nisqually bald eagle use area, White River elk range, waterfowl
concentration areas, riparian zones
1 Tanwax Creek TANW_CR_01 Nisqually 11 42962.148 8.137Category 1 - dissolved oxygen, fecal
coliform, pH, temperature coho, steelhead, cutthroat troutRiparian zones, waterfowl concentration areas, snag rich habitat, old
growth habitat, Upper Nisqually bald eagle use area, UNOS, wetlands
1 Tanwax Lake TANW_LK_01 Nisqually 11 91503.691 17.330 Category 2 - total phosphorus cutthroat trout, coho, Kokanee, steelheadWaterfowl concentration areas, riparian zones, UNOS, wetlands, wood
duck1 T t L k TROU LK 01 Ni ll 11 13019 438 2 466 N li t d N / k W tl d t f l t ti1 Trout Lake TROU_LK_01 Nisqually 11 13019.438 2.466 None listed None/unknown Wetlands, waterfowl concentration areas1 Tule Lake TULE_LK_01 Nisqually 11 52393.564 9.923 Category 2 - total phosphorus None/unknown Wetlands, waterfowl concentration areas, wood duck,
1 Twentyfive Mile Creek 25MI_CR_01 Nisqually 11 8413.075 1.593 Category 2 - bioassessment coho, steelhead, pink, cutthroat troutWhite River elk range, riparian zones, UNOS, Upper Nisqually bald eagle
use area, waterfowl concentration areas, wetlands1 Twentyseven Lake TWEN_LK_01 Nisqually 11 6696.060 1.268 Category 2 - total phosphorus None/unknown Wetlands, waterfowl concentration areas1 Twin Lakes TWIN_LK_01 Nisqually 11 7288.396 1.380 Category 2 - total phosphorus None/unknown Waterfowl concentration areas, UNOS, wetlands1 Unnamed Lake UNNA_LK_01 Nisqually 11 3908.752 0.740 None/unknown Waterfowl concentrations, wetlands1 Unnamed Lake1 UNNA_LK1_01 Nisqually 11 41560.494 7.871 None/unknown Wetlands1 Unnamed Trib of Mashel River UTMR_CR_01 Nisqually 11 15442.693 2.925 None listed cutthroat trout White River elk range1 Whitman Lake WHIT_LK_01 Nisqually 11 18294.293 3.465 Category 2 - total phosphorus None/unknown Wetlands, UNOS, waterfowl concentration areas
1 Bear Creek BEAR_CR_01 Puyallup-White 10 2958.033 0.560 None listed None/unknown Riparian zones, White River elk range
Appendix C

TABLE 6Fish Species, Habitat and Water Quality by Freshwater Reach
# Reaches by Feature Water Quality Impairments Species Use Priority HabitatReach Name Length (Mi)Reach Feature WRIA Name WRIA Number Length (Ft)
1 Canyon Creek Two CANY_CR_01 Puyallup-White 10 7032.555 1.332 None listed coho, steelhead White River elk range
8 Carbon River CARB_RV_01 Puyallup-White 10 5011.375 0.949
Category 1 - ammonia-N, arsenic, dissolved oxygen, fecal coliform, pH, and
temperature. cutthroat trout, Chinook, chum, coho, Dolly Varden/bull trout,
pink, steelhead UNOS, riparian zones
Carbon River CARB_RV_02 Puyallup-White 10 3877.063 0.734
Category 1 - ammonia-N, arsenic, dissolved oxygen, fecal coliform, pH, and
temperature. cutthroat trout, Chinook, chum, coho, Dolly Varden/bull trout,
pink, steelhead Carbon River bald eagle winter areas, UNOS, riparian zones
Carbon River CARB_RV_03 Puyallup-White 10 7682.079 1.455
Category 1 - ammonia-N, arsenic, dissolved oxygen, fecal coliform, pH, and
temperature. cutthroat trout, Chinook, chum, coho, Dolly Varden/bull trout,
pink, steelhead UNOS, riparian zones, Carbon River bald eagle winter areas
Carbon River CARB_RV_04 Puyallup-White 10 9219.020 1.746
Category 1 - ammonia-N, arsenic, dissolved oxygen, fecal coliform, pH, and
temperature. cutthroat trout, Chinook, chum, coho, Dolly Varden/bull trout,
pink, steelheadUNOS, Carbon River bald eagle winter areas, wetlands, White River elk
range, riparian zones, elk damage areas
Carbon River CARB_RV_05 Puyallup-White 10 67825.407 12.846
Category 1 - ammonia-N, arsenic, dissolved oxygen, fecal coliform, pH, and
temperature. cutthroat trout, Chinook, chum, coho, Dolly Varden/bull trout,
pink, steelhead UNOS, riparian zones, White River elk range
Carbon River CARB_RV_06 Puyallup-White 10 19308.587 3.657
Category 1 - ammonia-N, arsenic, dissolved oxygen, fecal coliform, pH, and
temperature. Chinook, coho, Dolly Varden/bull trout, steelhead White River elk range, riparian zonesCategory 1 - ammonia-N, arsenic,
dissolved oxygen, fecal coliform, pH, and Carbon River CARB_RV_07 Puyallup-White 10 20401.485 3.864 temperature. Chinook, Dolly Varden/bull trout, steelhead Riparian zones, harlequin duck breeding areas
Carbon River CARB_RV_08 Puyallup-White 10 5358.155 1.015
Category 1 - ammonia-N, arsenic, dissolved oxygen, fecal coliform, pH, and
temperature. Dolly Varden/bull trout Harlequin duck breeding areas1 Cayada Creek CAYA_CR_01 Puyallup-White 10 8884.993 1.683 None listed None/unknown None1 Chenuis Creek CHEN_CR_01 Puyallup-White 10 21820.221 4.133 None listed None/unknown None
1 Clarks Creek CLAR_CR_01 Puyallup-White 10 12482.204 2.364
Category 5 (303(d)) - fecal coliform and pH; Category 2 - dissolved oxygen;
Category 1 - temperature chum, coho, pink, steelhead Riparian zones
2 Clearwater River CLEA_RV_01 Puyallup-White 10 28114.429 5.325 Category 5 (303(d)) - temperature chum, Chinook, coho, Dolly Varden/bull trout, pink, steelheadRiparian zones, White River elk range, harlequin duck breeding areas,
White River elk winter areaClearwater River CLEA_RV_02 Puyallup-White 10 22764.654 4.311 Category 5 (303(d)) - temperature chum, Chinook, coho, Dolly Varden/bull trout, steelhead White River elk range
1 Deer Creek DEER_CR_01 Puyallup-White 10 22498.569 4.261 None listed chum, coho, Dolly Varden/bull trout Harlequin duck breeding areas, White River elk range
1 East Fork South Prairie Creek EFSP_CR_01 Puyallup-White 10 17997.016 3.409
Category 4A - fecal coliform and temperature; Category 2 - pH; Category 1 -
ammonia-N, dissolved oxygen, fecal coliform, pH, and temperature None/unknown White River elk range
1 Echo Lake ECHO_LK_01 Puyallup-White 10 2240.824 0.424 None/unknown None1 Eleanor Creek ELEA_CR_01 Puyallup-White 10 4083.566 0.773 Category 4C - coarse sediment Dolly Varden/bull trout, rainbow trout None1 Evans Creek EVAN_CR_01 Puyallup-White 10 30071.921 5.695 None listed coho White River elk range, riparian zones1 Fennel Creek FENN_CR_01 Puyallup-White 10 12743.860 2.414 None listed cutthroat trout, chum, coho, pink, steelhead Waterfowl concentration areas, UNOS, riparian zones, wetlands1 Gale Creek GALE_CR_01 Puyallup-White 10 25237.702 4.780 None listed coho, pink, steelhead White River elk range, riparian zones1 George Creek GEOR_CR_01 Puyallup-White 10 7020.501 1.330 None listed coho, Dolly Varden/bull trout, steelhead None1 Goat Creek GOAT_CR_01 Puyallup-White 10 6403.830 1.213 None listed None/unknown None
C t 4C fi h h bit t C t 4A
5 Greenwater River GREE_RV_01 Puyallup-White 10 24875.923 4.711
Category 4C - fish habitat; Category 4A - coarse sediment, fine sediment, and temperature; Category 1 - dissolved
oxygen and pHchum, Chinook, coho, Dolly Varden/bull trout, pink, rainbow
trout, steelheadHarlequin duck breeding areas, White River elk range and winter area,
riparian zones
Greenwater River GREE_RV_02 Puyallup-White 10 26750.439 5.066
Category 4C - fish habitat; Category 4A - coarse sediment, fine sediment, and temperature; Category 1 - dissolved
oxygen and pHchum, Chinook, coho, Dolly Varden/bull trout, rainbow trout,
steelhead White River elk range and winter area
Greenwater River GREE_RV_03 Puyallup-White 10 13660.770 2.587
Category 4C - fish habitat; Category 4A - coarse sediment, fine sediment, and temperature; Category 1 - dissolved
oxygen and pH coho, Dolly Varden/bull trout, steelhead None
Greenwater River GREE_RV_04 Puyallup-White 10 4294.870 0.813
Category 4C - fish habitat; Category 4A - coarse sediment, fine sediment, and temperature; Category 1 - dissolved
oxygen and pH Dolly Varden/bull trout None
Greenwater River GREE_RV_05 Puyallup-White 10 27849.861 5.275
Category 4C - fish habitat; Category 4A - coarse sediment, fine sediment, and temperature; Category 1 - dissolved
oxygen and pH None/unknown None
3 Huckleberry Creek HUCK_CR_01 Puyallup-White 10 19293.206 3.654 Category 1 - bioassessment, temperature chum, Chinook, coho, Dolly Varden/bull trout, steelhead Harlequin duck breeding areas, White River elk range and winter range
Huckleberry Creek HUCK_CR_02 Puyallup-White 10 14263.654 2.701 Category 1 - bioassessment, temperature chum, coho, Dolly Varden/bull trout, rainbow trout, Chinook None
Huckleberry Creek HUCK_CR_03 Puyallup-White 10 4866.998 0.922 Category 1 - bioassessment, temperature coho, Dolly Varden/bull trout None
1 Hylebos Creek HYLE_CR_01 Puyallup-White 10 6519.850 1.235Category 5 (303(d)) - fecal coliform;
Category 2 - dissolved oxygen Chinook, chum, coho, pink, steelhead Wetlands, UNOS, riparian zones
1 Kapowsin Lake KAPO_LK_01 Puyallup-White 10 6074.546 1.150 Category 1 - total phosphorus Chinook, coho, Dolly Varden/bull trout, pink, steelheadWetlands, waterfowl concentrations, UNOS, White River elk range, island
habitat
2 Kapowskin Creek KAPO_CR_01 Puyallup-White 10 17620.664 3.337 None listed Chinook, chum, coho, Dolly Varden/bull trout, pink, steelhead Riparian zones, wetlands, White River elk rangeKapowskin Creek KAPO_CR_02 Puyallup-White 10 3235.817 0.613 None listed coho, steelhead Riparian zones, UNOS, wetlands, waterfowl concentration areas
1 Kings Creek KING_CR_01 Puyallup-White 10 1663.938 0.315 Category 5 (303(d)) - temperature coho None
6 Lake Tapps TAPP_LK_01 Puyallup-White 10 1425.306 0.270Category 4C - invasive exotic species,
Category 1 - total phosphorus None/unknown None
Appendix C

TABLE 6Fish Species, Habitat and Water Quality by Freshwater Reach
# Reaches by Feature Water Quality Impairments Species Use Priority HabitatReach Name Length (Mi)Reach Feature WRIA Name WRIA Number Length (Ft)
Lake Tapps TAPP_LK_02 Puyallup-White 10 11347.792 2.149Category 4C - invasive exotic species,
Category 1 - total phosphorus None/unknown Waterfowl concentration areas, wetlands
Lake Tapps TAPP_LK_03 Puyallup-White 10 36565.402 6.925Category 4C - invasive exotic species,
Category 1 - total phosphorus None/unknown Waterfowl concentration areas
Lake Tapps TAPP_LK_04 Puyallup-White 10 1495.714 0.283Category 4C - invasive exotic species,
Category 1 - total phosphorus None/unknown None
Lake Tapps TAPP_LK_05 Puyallup-White 10 135437.534 25.651Category 4C - invasive exotic species,
Category 1 - total phosphorus None/unknown UNOS, waterfowl concentration areas, wetlands
Lake Tapps TAPP_LK_06 Puyallup-White 10 3273.242 0.620Category 4C - invasive exotic species,
Category 1 - total phosphorus None/unknown Waterfowl concentration areas1 Leaky Lake LEAK_LK_01 Puyallup-White 10 17988.795 3.407 None listed None/unknown Waterfowl concentration areas, wetlands1 Lost Creek_Greenwater LOST_GR_CR_01 Puyallup-White 10 12546.545 2.376 None listed None/unknown None1 Lost Creek_Huckleberry LOST_HC_CR_01 Puyallup-White 10 2326.667 0.441 None listed Dolly Varden/bull trout None1 Maggie Creek MAGG_CR_01 Puyallup-White 10 2331.065 0.441 None listed None/unknown None1 Meadow Creek MEAD_CR_01 Puyallup-White 10 6402.987 1.213 None listed coho White River elk range1 Milky Creek MILK_CR_01 Puyallup-White 10 8218.860 1.557 Category 5 (303(d)) - temperature None/unknown White River elk range1 Morgan Lake MORG_LK_01 Puyallup-White 10 28743.733 5.444 None listed None/unknown Wetlands, waterfowl concentration areas3 Mowich River MOWI_RV_01 Puyallup-White 10 4687.601 0.888 None listed Chinook, coho, Dolly Varden/bull trout White River elk range
Mowich River MOWI_RV_02 Puyallup-White 10 22868.581 4.331 None listed Chinook, coho, Dolly Varden/bull trout White River elk rangeMowich River MOWI_RV_03 Puyallup-White 10 7764.919 1.471 None listed coho, Dolly Varden/bull trout White River elk range
Chinook, coho, Dolly Varden/bull trout, pink, sockeye, 1 Mud Mountain Lake MUDM_LK_01 Puyallup-White 10 14363.541 2.720 None listed steelhead Riparian zones, White River elk range1 Neisson Creek NEIS_CR_01 Puyallup-White 10 10712.630 2.029 None listed Chinook, coho, Dolly Varden/bull trout, steelhead White River elk range1 North Puyallup River NOPU_RV_01 Puyallup-White 10 9250.085 1.752 None listed Dolly Varden/bull trout White River elk range
1 Ohop Creek_Kapowskin OHOP_KAP_CR_01 Puyallup-White 10 15068.704 2.854 None listed coho, steelheadRiparian zones, waterfowl concentration areas, wetlands, White River elk
range1 Page Creek PAGE_CR_01 Puyallup-White 10 4005.618 0.759 None listed coho, steelhead White River elk range, riparian zones1 Pinochle Creek PINO_CR_01 Puyallup-White 10 5587.845 1.058 None listed None/unknown White River elk range2 Printz Basin PRIN_BAS_01 Puyallup-White 10 5477.928 1.037 None listed None/unknown Wetlands, waterfowl concentration areas
Printz Basin PRIN_BAS_02 Puyallup-White 10 40264.091 7.626 None listed None/unknown Waterfowl concentration areas, wetlands
13 Puyallup River PUYA_RV_01 Puyallup-White 10 5261.854 0.997
Category 5 (303(d)) - fecal coliform and mercury; Category 4C - instream flow;
Category 2 - copper, dissolved oxygen, lead, mercury, temperature, and turbidity;
Category 1 - ammonia-N, arsenic, cadmium, chromium, copper, dissolved oxygen, fecal coliform, lead, mercury,
nickel, pH, temperature, and zinc cutthroat trout, Chinook, chum, coho, Dolly Varden/bull trout,
pink, sockeye, steelhead Waterfowl concentration areas, UNOS, riparian zones, wetlands
Category 5 (303(d)) - fecal coliform and mercury; Category 4C - instream flow;
Category 2 - copper, dissolved oxygen, lead, mercury, temperature, and turbidity;
Category 1 - ammonia-N, arsenic, d i h i di l d
Puyallup River PUYA_RV_02 Puyallup-White 10 10580.085 2.004
cadmium, chromium, copper, dissolved oxygen, fecal coliform, lead, mercury,
nickel, pH, temperature, and zinc cutthroat trout, Chinook, chum, coho, Dolly Varden/bull trout,
pink, sockeye, steelhead Wetlands, waterfowl concentrations, riparian zones
Puyallup River PUYA_RV_03 Puyallup-White 10 5653.010 1.071
Category 5 (303(d)) - fecal coliform and mercury; Category 4C - instream flow;
Category 2 - copper, dissolved oxygen, lead, mercury, temperature, and turbidity;
Category 1 - ammonia-N, arsenic, cadmium, chromium, copper, dissolved oxygen, fecal coliform, lead, mercury,
nickel, pH, temperature, and zinc cutthroat trout, Chinook, chum, coho, Dolly Varden/bull trout,
pink, sockeye, steelhead None
Puyallup River PUYA_RV_04 Puyallup-White 10 20625.919 3.906
Category 5 (303(d)) - fecal coliform and mercury; Category 4C - instream flow;
Category 2 - copper, dissolved oxygen, lead, mercury, temperature, and turbidity;
Category 1 - ammonia-N, arsenic, cadmium, chromium, copper, dissolved oxygen, fecal coliform, lead, mercury,
nickel, pH, temperature, and zinc cuttroat trout, Chinook, coho, Dolly Varden/bull trout, pink,
steelhead Wetlands, UNOS, waterfowl concentration areas
Category 5 (303(d)) - fecal coliform and mercury; Category 4C - instream flow;
C t 2 di l d
Puyallup River PUYA_RV_05 Puyallup-White 10 11823.236 2.239
Category 2 - copper, dissolved oxygen, lead, mercury, temperature, and turbidity;
Category 1 - ammonia-N, arsenic, cadmium, chromium, copper, dissolved oxygen, fecal coliform, lead, mercury,
nickel, pH, temperature, and zinc cutthroat trout, Chinook, coho, Dolly Varden/bull trout, pink,
steelhead Riparian zones, waterfowl concentration areas, UNOS, wetlands
Appendix C

TABLE 6Fish Species, Habitat and Water Quality by Freshwater Reach
# Reaches by Feature Water Quality Impairments Species Use Priority HabitatReach Name Length (Mi)Reach Feature WRIA Name WRIA Number Length (Ft)
Puyallup River PUYA_RV_06 Puyallup-White 10 21467.120 4.066
Category 5 (303(d)) - fecal coliform and mercury; Category 4C - instream flow;
Category 2 - copper, dissolved oxygen, lead, mercury, temperature, and turbidity;
Category 1 - ammonia-N, arsenic, cadmium, chromium, copper, dissolved oxygen, fecal coliform, lead, mercury,
nickel, pH, temperature, and zinc cutthroat trout, Chinook, coho, Dolly Varden/bull trout, pink,
steelhead Riparian zones, wetlands, waterfowl concentration areas, UNOS
Puyallup River PUYA_RV_07 Puyallup-White 10 18829.812 3.566
Category 5 (303(d)) - fecal coliform and mercury; Category 4C - instream flow;
Category 2 - copper, dissolved oxygen, lead, mercury, temperature, and turbidity;
Category 1 - ammonia-N, arsenic, cadmium, chromium, copper, dissolved oxygen, fecal coliform, lead, mercury,
nickel, pH, temperature, and zinc Chinook, coho, Dolly Varden/bull trout, pink, steelhead UNOS, White River elk range, riparian zones
Category 5 (303(d)) - fecal coliform and mercury; Category 4C - instream flow;
Puyallup River PUYA_RV_08 Puyallup-White 10 22856.391 4.329
Category 2 - copper, dissolved oxygen, lead, mercury, temperature, and turbidity;
Category 1 - ammonia-N, arsenic, cadmium, chromium, copper, dissolved oxygen, fecal coliform, lead, mercury,
nickel, pH, temperature, and zinc Chinook, coho, Dolly Varden/bull trout, pink, steelhead White River elk range, riparian zones, wetlands
Puyallup River PUYA_RV_09 Puyallup-White 10 42292.579 8.010
Category 5 (303(d)) - fecal coliform and mercury; Category 4C - instream flow;
Category 2 - copper, dissolved oxygen, lead, mercury, temperature, and turbidity;
Category 1 - ammonia-N, arsenic, cadmium, chromium, copper, dissolved oxygen, fecal coliform, lead, mercury,
nickel, pH, temperature, and zinc Chinook, coho, Dolly Varden/bull trout, pink, rainbow trout,
steelhead Riparian zones, White River elk range
Puyallup River PUYA_RV_10 Puyallup-White 10 9154.938 1.734
Category 5 (303(d)) - fecal coliform and mercury; Category 4C - instream flow;
Category 2 - copper, dissolved oxygen, lead, mercury, temperature, and turbidity;
Category 1 - ammonia-N, arsenic, cadmium, chromium, copper, dissolved oxygen, fecal coliform, lead, mercury,
nickel, pH, temperature, and zinc Chinook, coho, Dolly Varden/bull trout, rainbow trout,
steelheead White River elk range
Puyallup River PUYA_RV_11 Puyallup-White 10 7103.978 1.345
Category 5 (303(d)) - fecal coliform and mercury; Category 4C - instream flow;
Category 2 - copper, dissolved oxygen, lead, mercury, temperature, and turbidity;
Category 1 - ammonia-N, arsenic, cadmium, chromium, copper, dissolved oxygen, fecal coliform, lead, mercury,
nickel, pH, temperature, and zinc Chinook, coho, Dolly Varden/bull trout, rainbow trout,
steelheead White River elk range, harlequin duck breeding areas
Puyallup River PUYA_RV_12 Puyallup-White 10 19600.656 3.712
Category 5 (303(d)) - fecal coliform and mercury; Category 4C - instream flow;
Category 2 - copper, dissolved oxygen, lead, mercury, temperature, and turbidity;
Category 1 - ammonia-N, arsenic, cadmium, chromium, copper, dissolved oxygen, fecal coliform, lead, mercury,
nickel, pH, temperature, and zinc Chinook, coho, Dolly Varden/bull trout, rainbow trout,
steelheead White River elk range
Category 5 (303(d)) - fecal coliform and mercury; Category 4C - instream flow;
Category 2 - copper, dissolved oxygen, lead, mercury, temperature, and turbidity;
Category 1 - ammonia-N, arsenic, d i h i di l d
Puyallup River PUYA_RV_13 Puyallup-White 10 7993.262 1.514
cadmium, chromium, copper, dissolved oxygen, fecal coliform, lead, mercury,
nickel, pH, temperature, and zinc Chinook, coho, Dolly Varden/bull trout White River elk range2 Rhode Lake RHOD_LK_01 Puyallup-White 10 8028.133 1.520 None listed None/unknown Waterfowl concentration areas, UNOS, wetlands
Rhode Lake RHOD_LK_02 Puyallup-White 10 4805.325 0.910 None listed None/unknown Waterfowl concentration areas, UNOS, wetlands1 Rushingwater Creek RUSH_CR_01 Puyallup-White 10 17091.704 3.237 None listed Chinook, coho White River elk range1 Saint Andrews Creek STAN_CR_01 Puyallup-White 10 1065.896 0.202 None listed Dolly Varden/bull trout None1 Silver Creek SILV_CR_01 Puyallup-White 10 29564.708 5.599 None listed Dolly Varden/bull trout None1 South Fork South Prairie Creek SFSP_CR_01 Puyallup-White 10 13877.684 2.628 None listed None/unknown White River elk range
Appendix C

TABLE 6Fish Species, Habitat and Water Quality by Freshwater Reach
# Reaches by Feature Water Quality Impairments Species Use Priority HabitatReach Name Length (Mi)Reach Feature WRIA Name WRIA Number Length (Ft)
4 South Prairie Creek SOPR_CR_01 Puyallup-White 10 29466.017 5.581
Category 4A - fecal coliform and temperature; Category 2 - pH; Category 1 -
ammonia-N, dissolved oxygen, fecal coliform, pH, and temperature Chinook, chum, coho, Dolly Varden/bull trout, pink, steelhead Wetlands, riparian zones, waterfowl concentration areas, UNOS
South Prairie Creek SOPR_CR_02 Puyallup-White 10 2596.455 0.492
Category 4A - fecal coliform and temperature; Category 2 - pH; Category 1 -
ammonia-N, dissolved oxygen, fecal coliform, pH, and temperature Chinook, chum, Dolly Varden/bull trout, pink, steelhead Wetlands, riparian zones
South Prairie Creek SOPR_CR_03 Puyallup-White 10 24139.229 4.572
Category 4A - fecal coliform and temperature; Category 2 - pH; Category 1 -
ammonia-N, dissolved oxygen, fecal coliform, pH, and temperature Chinook, chum, coho, Dolly Varden/bull trout, pink, steelhead UNOS, elk damage area, wetlands, riparian zones
South Prairie Creek SOPR_CR_04 Puyallup-White 10 35204.959 6.668
Category 4A - fecal coliform and temperature; Category 2 - pH; Category 1 -
ammonia-N, dissolved oxygen, fecal coliform, pH, and temperature Chinook, coho, Dolly Varden/bull trout, pink, steelhead Riparian zones, UNOS, White River elk range
2 South Puyallup River SOPU_RV_01 Puyallup-White 10 13018.891 2.466 None listed Dolly Varden/bull trout Harlequin duck breeding areas, White River elk rangeSouth Puyallup River SOPU_RV_02 Puyallup-White 10 5586.586 1.058 None listed Dolly Varden/bull trout None
1 Tolmie Creek TOLM_CR_01 Puyallup-White 10 9014.384 1.707 None listed Dolly Varden/bull trout None1 Twentyeight Mile Creek 28MI_CR_01 Puyallup-White 10 15475.923 2.931 None listed Chinook, coho, Dolly Varden/bull trout, steelhead White River elk range and winter area1 Unnamed Trib of Puyallup River UTPU_CR_01 Puyallup-White 10 2228.904 0.422 Chinook, coho, steelhead White River elk range1 Unnamed Trib of So. Puyallup R UTSP_CR_01 Puyallup-White 10 5367.041 1.016 None/unknown None1 Viola Creek VIOL_CR_01 Puyallup-White 10 8866.100 1.679 None listed coho, Dolly Varden/bull trout, steelhead None
2 Voight Creek VOIG_CR_01 Puyallup-White 10 35546.812 6.732 Category 2 - pH, temperature Chinook, chum, coho, steelheadWhite River elk range and damage areas, riparian zones, wetlands,
Carbon River bald eagle use areasVoight Creek VOIG_CR_02 Puyallup-White 10 47983.643 9.088 Category 2 - pH, temperature None/unknown Riparian zones, White River elk range
2 West Fork White River WFWR_RV_01 Puyallup-White 10 36657.450 6.943Category 4A - course sediment; Category 1
- temperature chum, Chinook, coho, Dolly Varden/bull trout, steelhead White River elk range and winter range, harlequin duck breeding area
West Fork White River WFWR_RV_02 Puyallup-White 10 23683.339 4.485Category 4A - course sediment; Category 1
- temperature chum, Chinook, coho, Dolly Varden/bull trout, steelhead White River elk range
10 White River WHIT_RV_01 Puyallup-White 10 17529.600 3.320
Category 5 (303(d)) - fecal coliform, pH, and temperature; Category 2 - fecal
coliform, pH, temperature and dissolved oxygen; Category 1 - ammonia-N, arsenic, dissolved oxygen, fecal coliform, mercury,
pH, and temperature cutthroat trout, Chinook, chum, coho, Dolly Varden/bull trout,
pink, sockeye, steelhead None
White River WHIT_RV_02 Puyallup-White 10 2935.648 0.556
Category 5 (303(d)) - fecal coliform, pH, and temperature; Category 2 - fecal
coliform, pH, temperature and dissolved oxygen; Category 1 - ammonia-N, arsenic, dissolved oxygen, fecal coliform, mercury,
pH, and temperature cutthroat trout, Chinook, chum, coho, Dolly Varden/bull trout,
pink, sockeye, steelhead Wetlands, waterfowl concentration areasCategory 5 (303(d)) - fecal coliform, pH,
and temperature; Category 2 - fecal coliform, pH, temperature and dissolved
C t 1 i N i
White River WHIT_RV_03 Puyallup-White 10 47467.200 8.990
oxygen; Category 1 - ammonia-N, arsenic, dissolved oxygen, fecal coliform, mercury,
pH, and temperature cutthroat trout, Chinook, chum, coho, Dolly Varden/bull trout,
pink, sockeye, steelhead Wetlands, waterfowl concentration areas, riparian zones
White River WHIT_RV_04 Puyallup-White 10 22281.600 4.220
Category 5 (303(d)) - fecal coliform, pH, and temperature; Category 2 - fecal
coliform, pH, temperature and dissolved oxygen; Category 1 - ammonia-N, arsenic, dissolved oxygen, fecal coliform, mercury,
pH, and temperature Chinook, chum, coho, Dolly Varden/bull trout, sockeye,
steelhead Riparian zones, White River elk range
White River WHIT_RV_06 Puyallup-White 10 7497.600 1.420
Category 5 (303(d)) - fecal coliform, pH, and temperature; Category 2 - fecal
coliform, pH, temperature and dissolved oxygen; Category 1 - ammonia-N, arsenic, dissolved oxygen, fecal coliform, mercury,
pH, and temperature chum, Chinook, coho, Dolly Varden/bull trout, pink, sockeye,
steelhead White River elk range, riparian zones, harlequin duck breeding areas
White River WHIT_RV_07 Puyallup-White 10 55387.200 10.490
Category 5 (303(d)) - fecal coliform, pH, and temperature; Category 2 - fecal
coliform, pH, temperature and dissolved oxygen; Category 1 - ammonia-N, arsenic, dissolved oxygen, fecal coliform, mercury,
pH, and temperature chum, Chinook, coho, Dolly Varden/bull trout, pink, sockeye,
steelheadWhite River elk range and winter range, harlequin duck breeding areas,
riparian zonesCategory 5 (303(d)) - fecal coliform, pH,
and temperature; Category 2 - fecal coliform, pH, temperature and dissolved
C t 1 i N i
White River WHIT_RV_08 Puyallup-White 10 18638.400 3.530
oxygen; Category 1 - ammonia-N, arsenic, dissolved oxygen, fecal coliform, mercury,
pH, and temperature chum, Chinook, coho, Dolly Varden/bull trout, pink, steelheadWhite River elk range and winter range, harlequin duck breeding areas,
riparian zones
White River WHIT_RV_09 Puyallup-White 10 24657.600 4.670
Category 5 (303(d)) - fecal coliform, pH, and temperature; Category 2 - fecal
coliform, pH, temperature and dissolved oxygen; Category 1 - ammonia-N, arsenic, dissolved oxygen, fecal coliform, mercury,
pH, and temperature chum, Chinook, coho, Dolly Varden/bull trout, steelheadWhite River elk range and winter range, wetlands, harlequin duck breeding
areas
Appendix C

TABLE 6Fish Species, Habitat and Water Quality by Freshwater Reach
# Reaches by Feature Water Quality Impairments Species Use Priority HabitatReach Name Length (Mi)Reach Feature WRIA Name WRIA Number Length (Ft)
White River WHIT_RV_10 Puyallup-White 10 77140.800 14.610
Category 5 (303(d)) - fecal coliform, pH, and temperature; Category 2 - fecal
coliform, pH, temperature and dissolved oxygen; Category 1 - ammonia-N, arsenic, dissolved oxygen, fecal coliform, mercury,
pH, and temperature chum, Chinook, coho, Dolly Varden/bull trout, steelhead White River elk range and winter range, harlequin duck breeding areas
White River WHIT_RV_11 Puyallup-White 10 11352.000 2.150
Category 5 (303(d)) - fecal coliform, pH, and temperature; Category 2 - fecal
coliform, pH, temperature and dissolved oxygen; Category 1 - ammonia-N, arsenic, dissolved oxygen, fecal coliform, mercury,
pH, and temperature chum, Chinook, coho, Dolly Varden/bull trout White River elk range
5 Wilkeson Creek WILK_CR_01 Puyallup-White 10 21972.173 4.161Category 4A - temperature; Category 1 -
copper, fecal coliform, pH, and temperature Chinook, chum, coho, pink, steelhead Riparian zones
Wilkeson Creek WILK_CR_02 Puyallup-White 10 1319.832 0.250Category 4A - temperature; Category 1 -
copper, fecal coliform, pH, and temperature Chinook, coho, pink, steelhead None
Wilkeson Creek WILK_CR_03 Puyallup-White 10 10981.507 2.080Category 4A - temperature; Category 1 -
copper, fecal coliform, pH, and temperature Chinook, coho, pink, steelhead Riparian zones, White River elk range
Wilkeson Creek WILK_CR_04 Puyallup-White 10 7007.172 1.327Category 4A - temperature; Category 1 -
copper, fecal coliform, pH, and temperature coho, pink, steelhead White River elk range, riparian zones
Appendix C

TABLE 7 Contaminated Sites, Marine
Reach ID # of
Facilities Status Type Name S. Key Peninsula + Islands
AND IS 1 0
AND IS 2 1 Active TIER2: Emergency/Haz Chem Rpt TIER2 CENTURYTEL ANDERSON ISLAND
AND IS 3 1 Inactive HWG: Hazardous Waste Generator Anderson Island Abandoned Mercury Site
AND IS 4 0 AND IS 5 1 Inactive UST: Underground Storage Tank MCMILLIN RESERVOIR KTRN IS 0 MCN IS 1 0 MCN IS 2 0 MCN IS 3 0 MCN IS 4 0 SKEY 1 0 SKEY 2 1 Inactive HWG: Hazardous Waste Generator Longbranch Drug Lab SKEY 3 0
Carr Inlet - Henderson Bay CI-HB 1 0 CI-HB 10 1 Active HWG: Hazardous Waste Generator Hinshaws Auto Body CI-HB 11 0 CI-HB 12 0 CI-HB 13 2 Inactive UST: Underground Storage Tank JOHNSON BULLDOZING CO
Active UST: Underground Storage Tank LAKEBAY MARINA CI-HB 2 0 CI-HB 3 0 CI-HB 4 0 CI-HB 5 2 Inactive SCS: State Cleanup Site ROSEDALE BRIDGE
Active UST: Underground Storage Tank ISLAND VIEW MARKET CI-HB 6 0 CI-HB 7 2 Inactive HWG: Hazardous Waste Generator PENINSULA HIGH SCHOOL
Active UST: Underground Storage Tank PURDY 76 CI-HB 8 2 Inactive HWG: Hazardous Waste Generator Henderson Bay Drum
Active UST: Underground Storage Tank WAUNA POST OFFICE & STORE
CI-HB 9 1 Active UST: Underground Storage Tank WA DFW MINTER CREEK SALMON HATCHERY
Case Inlet CI-1 0 CI-10 0 CI-11 0 CI-2 1 Inactive HWG: Hazardous Waste Generator Rains Drug Lab CI-3 0 CI-4 0 CI-5 0 CI-6 0 CI-7 0 CI-8 0
Appendix C

TABLE 7 Contaminated Sites, Marine
Appendix C
Reach ID # of
Facilities Status Type Name CI-9 0
Colvos Passage - Tacoma Narrows CP-TN 1 0 CP-TN 2 0 CP-TN 3 0 CP-TN 4 0
Dash Point DP 0
Hale Pass Wollochet Bay HP-WB 1 0 HP-WB 2 0 HP-WB 3 0
Nisqually
NISQ_01 1 Inactive TIER2: Emergency/Haz. Chem. Rpt TIER2 AT&T WIRELESS MOUNTS RD
Source: Washington Department of Ecology statewide GIS database, October 2007

TABLE 8 Contaminated Sites, Freshwater
Reach ID # of
Facilities Status Type Name WRIA 12: Chambers-Clover
AME_LK_01 0 CHAM_CR_01 0
CLOV_CR_01 10 InactiveHWG: Hazardous Waste Generator
Car Wash Enterprises CWE Tacoma
InactiveHWG: Hazardous Waste Generator Pacific Import Auto Tacoma
InactiveHWG: Hazardous Waste Generator Goodyear Service Center 8336
Active SCS: State Cleanup Site SUBURBAN REALTY INC
InactiveHWG: Hazardous Waste Generator Shell Station 120602
Inactive UST: Underground Storage Tank BROOKDALE SERVICE INC Inactive SCS: State Cleanup Site PARKLAND GAS SPILL
Inactive UST: Underground Storage Tank PHILLIPS 66 COMPANY SS 071078
Inactive UST: Underground Storage Tank MISTER MUFFLER OF PARKLAND
Active UST: Underground Storage Tank BROWN BEAR CAR WASH PARKLAND
SPAN_CR_01 1 Inactive UST: Underground Storage Tank PRIVATE RESIDENCE SPAN_LK_01 0
WRIA 15: Kitsap BAY_LK_01 0
BUTT_RES_01 0 CARN_LK_01 0 CRES_LK_01 0 FLOR_LK_01 0 JACK_LK_01 0 JOSE_LK_01 0 MINT_LK_01 0
MINT_CR_01 1 Active UST: Underground Storage Tank WA DFW MINTER CREEK SALMON HATCHERY
ROCK_CR_01 0 STAN_LK_01 0
WRIA 11: Nisqually ALD_LK_01 0
BEAV_CR_01 0 BENB_LK_01 0 BUSY_CR_01 0 CLEA_LK_01 0 COPP_CR_01 0 CRAN_LK_01 0 HART_LK_01 0 HORN_CR_01 0 KREG_LK_01 0
LAGR_RES_01 0 LITT_LK_01 0
Appendix C

TABLE 8 Contaminated Sites, Freshwater
# of
Reach ID Facilities Status Type Name LMAS_RV_01 0 LMAS_RV_02 1 Active UST: Underground Storage Tank RJ SWANSON INC LMAS_RV_03 0 LYNC_CR_01 0 LYNC_CR_02 0 LYNC_CR_03 0 LYNC_CR_04 1 Inactive UST: Underground Storage Tank Venture Bank MASH_RV_01 0 MASH_RV_02 0 MASH_RV_03 0 MASH_RV_04 0 MASH_RV_05 0 MASH_RV_06 0 MASH_RV_07 0 MIDW_CR_01 0 MUCK_CR_01 0 MUCK_LK_01 0 MUD_LK_01 0 NISQ_RV_01 1 Active UST: Underground Storage Tank FLYING M NISQ_RV_02 0 NISQ_RV_03 0 NISQ_RV_04 0 NISQ_RV_05 0
NISQ_RV_06 1 InactiveVOLCLNST: Voluntary Cleanup Sites TAHOMA WOODS
NISQ_RV_07 0 NISQ_RV_08 0
OHOP_LK_CR 0 OHOP_NIS_CR_01 0 OHOP_NIS_CR_02 0 OHOP_NIS_CR_03 0 OHOP_NIS_CR_04 0
OHOP_LK_01 1 InactiveHWG: Hazardous Waste Generator Orville Rd MP 4.5
RAPJ_LK_01 0 SILV_LK_01 0
SOUT_CR_01 0 SFLM_RV_01 0 TANW_CR_01 0 TANW_LK_01 0 TROU_LK_01 0 TULE_LK_01 0 25MI_CR_01 0 TWEN_LK_01 0 TWIN_LK_01 0 UNNA_LK_01 0 UNNA_LK1_01 0
Appendix C

TABLE 8 Contaminated Sites, Freshwater
# of
Reach ID Facilities Status Type Name UTMR_CR_01 0 WHIT_LK_01 0
WRIA 10: Puyallup-White BEAR_CR_01 0 CANY_CR_01 0 CARB_RV_01 0 CARB_RV_02 1 Inactive UST: Underground Storage Tank BUS GARAGE UST 6917
CARB_RV_03 1 Active TIER2: Emergency/Haz Chem Rpt TIER2 ORTING WWT PLANT
CARB_RV_04 3 InactiveHWG: Hazardous Waste Generator
SQUARE D COMPANY NELCO PLANT
InactiveHWG: Hazardous Waste Generator US DEA 180th St Orting
Active HWG: Hazardous Waste Generator WA ECY 175th St Ct Drug Lab
CARB_RV_05 0 CARB_RV_06 0 CARB_RV_07 0 CARB_RV_08 0 CAYA_CR_01 0 CHEN_CR_01 0
CLAR_CR_01 1 InactiveTIER2: Emergency/Haz Chem Rpt TIER2 AMERIGAS PUYALLUP
CLEA_RV_01 0 CLEA_RV_02 0 DEER_CR_01 0 EFSP_CR_01 0 ECHO_LK_01 0 ELEA_CR_01 0 EVAN_CR_01 0 FENN_CR_01 0 GALE_CR_01 0 GEOR_CR_01 0 GOAT_CR_01 0 GREE_RV_01 0 GREE_RV_02 0 GREE_RV_03 0 GREE_RV_04 0 GREE_RV_05 0 HUCK_CR_01 0 HUCK_CR_02 0 HUCK_CR_03 0 HYLE_CR_01 0 KAPO_LK_01 0 KAPO_CR_01 0 KAPO_CR_02 0 KING_CR_01 0
Appendix C

TABLE 8 Contaminated Sites, Freshwater
# of
Reach ID Facilities Status Type Name TAPP_LK_01 0
TAPP_LK_02 1 InactiveHWG: Hazardous Waste Generator
Pierce Cnty Fire Dist 22 Lake Tapps
TAPP_LK_03 0 TAPP_LK_04 0 TAPP_LK_05 2 Active UST: Underground Storage Tank LAKE TAPPS GROCERY
Active UST: Underground Storage Tank LAKE TAPPS COUNTY PARK TAPP_LK_06 0 LEAK_LK_01 0
LOST_GR_CR_01 0 LOST_HC_CR_01 0
MAGG_CR_01 0 MEAD_CR_01 0 MILK_CR_01 0 MORG_LK_01 1 Inactive UST: Underground Storage Tank KAPOWSIN AIR SPORTS LTD MOWI_RV_01 0 MOWI_RV_02 0 MOWI_RV_03 0 MUDM_LK_01 0 NEIS_CR_01 0 NOPU_RV_01 0
OHOP_KAP_CR_01 0 PAGE_CR_01 0 PINO_CR_01 0 PRIN_BAS_01 0 PRIN_BAS_02 0
PUYA_RV_01 4 InactiveHWG: Hazardous Waste Generator River Road Dump Site
InactiveHWG: Hazardous Waste Generator
Pierce Cnty Public Works Melroy B
InactiveHWG: Hazardous Waste Generator
Wes Pac Transportation Co Inc Puyallup
InactiveHWG: Hazardous Waste Generator RTW Division of MTH
PUYA_RV_02 4 Inactive UST: Underground Storage Tank B & B AUTO SALES UST 1919
Inactive UST: Underground Storage Tank GOLDEN ROSE MOBILE HOME PARK
Active SCS: State Cleanup Site RIVER ROAD LANDSCAPING Active UST: Underground Storage Tank JACKPOT FOOD MART 316
PUYA_RV_03 0
PUYA_RV_04 1 InactiveHWG: Hazardous Waste Generator
WA ECY 96th & McCutcheon Dump Site
PUYA_RV_05 1 Inactive UST: Underground Storage Tank CHARLES YEHL
PUYA_RV_06 3 InactiveHWG: Hazardous Waste Generator SOLDIERS HOME & COLONY
InactiveHWG: Hazardous Waste Generator Carbon River Drums
Inactive UST: Underground Storage Tank SILVERNAIL
Appendix C

TABLE 8 Contaminated Sites, Freshwater
# of
Reach ID Facilities Status Type Name CONSTRUCTION INC
PUYA_RV_07 0 PUYA_RV_08 0 PUYA_RV_09 0 PUYA_RV_10 0 PUYA_RV_11 0 PUYA_RV_12 0 PUYA_RV_13 0
RHOD_LK_01 1 InactiveHWG: Hazardous Waste Generator Bonney Lake Resin Drum
RHOD_LK_02 0 RUSH_CR_01 0 STAN_CR_01 0 SILV_CR_01 0 SFSP_CR_01 0 SOPR_CR_01 0 SOPR_CR_02 0
SOPR_CR_03 1 InactiveHWG: Hazardous Waste Generator DJs Waste Oil Service
SOPR_CR_04 0 SOPU_RV_01 0 SOPU_RV_02 0 TOLM_CR_01 0 28MI_CR_01 0 UTPU_CR_01 0 UTSP_CR_01 0 VIOL_CR_01 0
VOIG_CR_01 1 Active TIER2: Emergency/Haz Chem Rpt TIER2
WA DFW VOIGHTS CREEK HATCHERY
VOIG_CR_02 0 WFWR_RV_01 0 WFWR_RV_02 0
WHIT_RV_01 2 Inactive UST: Underground Storage Tank SUMNER TRACTOR & EQUIPMENT CO INC
Active HWG: Hazardous Waste Generator Waynes Roofing Inc
WHIT_RV_02 3 Active HWG: Hazardous Waste Generator Robison Construction Inc
InactiveHWG: Hazardous Waste Generator Corliss Co Truck Shop
InactiveHWG: Hazardous Waste Generator Arayco Inc Sumner Yard
WHIT_RV_03 1 InactiveHWG: Hazardous Waste Generator Bullet Freight Systems
WHIT_RV_04 0 WHIT_RV_06 0 WHIT_RV_07 0 WHIT_RV_08 0
Appendix C

TABLE 8 Contaminated Sites, Freshwater
Appendix C
Reach ID # of
Facilities Status Type Name WHIT_RV_09 0 WHIT_RV_10 0 WHIT_RV_11 0 WILK_CR_01 0 WILK_CR_02 0 WILK_CR_03 0 WILK_CR_04 0
Source: Washington Department of Ecology statewide GIS database, October 2007

TABLE 9ALand Use by Marine Reach
Management Units Reach NameWRIA Name
WRIA Number
Length (miles) Description
Shoreline Env. Design. Zoning OtherInventoried resources
Listed sites
S.Key Peninsula + Islands AND IS 1 Kitsap 15 5.079 NE Shore, Anderson Isl., Eagle Isl. CONS, NAT (spit), CONS (Eagle Isl.) R10 (96%) No* No *S.Key Peninsula + Islands AND IS 2 Kitsap 15 5.802 SE Shore, Anderson Isl - Oro Bay Rural, NAT R10 (61%), ARL (39%) No* No *S.Key Peninsula + Islands AND IS 3 Kitsap 15 5.639 SW Shore, Anderson Isl. - Carson Bay CONS, NAT (spit) R10 (70%), ARL (30%) No* No *S.Key Peninsula + Islands AND IS 4 Kitsap 15 1.356 Anderson Isl. - Amsterdam Bay Rural, NAT R10 (98%), ARL (2%) No* No *S.Key Peninsula + Islands AND IS 5 Kitsap 15 3.184 NW Shore, Anderson Island CONS, NAT (spit) R10 (72%), ARL (28%) No* No *
Carr Inlet - Henderson Bay CI-HB 1 Kitsap 15 5.540 Fox Island (SW) CONS, except NAT (spit, Nears Pt) R10 (100%) No* No*Carr Inlet - Henderson Bay CI-HB 10 Kitsap 15 1.830 Key Penin, Minter Bay to Glen Cove Rural, CONS, except NAT (spit) R10 (100%) No* No*Carr Inlet - Henderson Bay CI-HB 11 Kitsap 15 1.694 Key Penin, Glen Cove CONS, NAT R10 (95%). ARL (5%) No* No*Carr Inlet - Henderson Bay CI-HB 12 Kitsap 15 4.436 Key Penin, Henderson Bay CONS, small section RR, CONS (spit) R10 (100%) No* No*Carr Inlet - Henderson Bay CI-HB 13 Kitsap 15 9.107 Von Geldern, Mayo Coves, Delano Bay RR, Rural, CONS (points), NAT R10 (73%), ARL (27%) No* No*Carr Inlet - Henderson Bay CI-HB 2 Kitsap 15 2.270 Gig Harbor P. - Green Pt. CONS, RR, NAT (spit, Shaws Cove) R10 (100%) No* No*Carr Inlet Henderson Bay CI HB 3 Kitsap 15 2 887 Gig Harbor P Horsehead Bay RR except NAT (spit) R10 (100%) No* No*
Historic/Cultural Resources Environment Designations, Zoning, and UGA
Appendix C
Carr Inlet - Henderson Bay CI-HB 3 Kitsap 15 2.887 Gig Harbor P. - Horsehead Bay RR, except NAT (spit) R10 (100%) No* No*Carr Inlet - Henderson Bay CI-HB 4 Kitsap 15 1.844 Gig Harbor P. & Cutts Island RR, CONS, CONS (Cutts Isl) R10 (87%), ARL (13%) No* No*Carr Inlet - Henderson Bay CI-HB 5 Kitsap 15 7.446 Gig Harbor P. incl. Lay Inlet, Raft Isl. RR, NAT (Ray Nash Cr), CONS (Raft Isl) R10 (69%), RSR (30%) No* No*Carr Inlet - Henderson Bay CI-HB 6 Kitsap 15 5.818 Gig Harbor P., Henderson Bay RR, small areas NAT R10 (11%) R10 (55%) No* No*Carr Inlet - Henderson Bay CI-HB 7 Kitsap 15 6.767 Burley Lagoon URB (E side), RR (W side), NAT (spit) R10 (24%) R10 (81%) No* No*Carr Inlet - Henderson Bay CI-HB 8 Kitsap 15 3.345 Key Pen., Purdy spit to Minter Bay CONS, RR, Rural, NAT (Purdy spit) R10 (100%) No* No*Carr Inlet - Henderson Bay CI-HB 9 Kitsap 15 3.610 Key Pen., Minter Bay CONS, Rural, except NAT (spit) R10 (92%), ARL (8%) No* No*
Case Inlet CI-1 Kitsap 15 1.430 Key Penin, Devils Head Rural, NAT, CONS R10 (87%), ARL (13%) No* No*Case Inlet CI-10 Kitsap 15 3.054 Key Penin, E shore, Rocky Bay Rural, NAT R10 (99%) No* No*Case Inlet CI-11 Kitsap 15 1.093 Key Penin, W Shore, Rocky Bay Rural R10 (100%) No* No*Case Inlet CI-2 Kitsap 15 1.213 Key Penin, Taylor Bay Rural R10 (80%), ARL (20%) No* No*Case Inlet CI-3 Kitsap 15 1.086 Key Penin, Taylor Bay to Whitman Cv Rural, NAT R10 (85%), ARL (15%) No* No*Case Inlet CI-4 Kitsap 15 2.486 Key Penin, Whitman Cove CONS R10 (100%) No* No*Case Inlet CI-5 Kitsap 15 8.123 Key Penin, W Shore, Herron Isl. NAT, Rural R10 (100%) No* No*Case Inlet CI-6 Kitsap 15 5.261 Key Penin, W Shore, Dutchers Cove RR, Rural, NAT R10 (100%) No* No*Case Inlet CI-7 Kitsap 15 2.228 Key Penin, W Shore, to Vaughn Bay Rural, NAT (mouth of Vaughn Bay) R10 (96%), ARL (4%) No* No*Case Inlet CI-8 Kitsap 15 3.512 Vaughn Bay Rural R10 (78%), ARL (22%) No* No*Case Inlet CI-9 Kitsap 15 0.865 Vaugh to Rocky Bay Rural, NAT R10 (100%) No* No*Case Inlet CI 9 Kitsap 15 0.865 Vaugh to Rocky Bay Rural, NAT R10 (100%) No No
Colvos Pass-Tacoma Narrows CP-TN 1 Kitsap 15 2.273 Colvos Passage (N of Richmond Pt.) RR (50%), CONS(50%) R10 (19%) No* No*Colvos Pass-Tacoma Narrows CP-TN 2 Kitsap 15 4.027 Colvos Passage (S of Richmond Pt.) CONS (90%), RR, NAT (Lighthouse) R10 (14%) No* No*Colvos Pass-Tacoma Narrows CP-TN 3 Kitsap 15 3.999 North Gig Harbor RR MSF (20%), GIG H (17%) No* No*Colvos Pass-Tacoma Narrows CP-TN 4 Kitsap 15 5.895 Gig Harbor Pen. - Tacoma Narrows CONS R10 (11%) No* No*
Dash Point DP Kitsap 15 3.212 Dash/Browns Pt. URB, CONS (Browns Point County Park) per SMSF (16%) None Yes
Hale Pass Wollochet Bay HP-WB 1 Kitsap 15 7.838 Wollochet Bay RR (75%), CONS, NAT R10 (17%) No* No*Hale Pass Wollochet Bay HP-WB 2 Kitsap 15 4.519 Gig Harbor Pen. - Hale Pass. RR (80%), CONS R10 (17%) No* No*Hale Pass Wollochet Bay HP-WB 3 Kitsap 15 10.178 Fox Island (NE) RR (80%), CONS - Fox Island R10 (22%) No* No*
S.Key Peninsula + Islands KTRN IS Kitsap 15 3.164 Ketron Island CONS R10 (15%) No* No*S.Key Peninsula + Islands MCN IS 1 Kitsap 15 1.212 McNeil Isl. - Puget Sound NAT R40 (25%) No* No*S.Key Peninsula + Islands MCN IS 2 Kitsap 15 4.698 McNeil Isl. - Balch Passage NAT, CONS, RR R40 (18%) No* No*S.Key Peninsula + Islands MCN IS 3 Kitsap 15 2.217 McNeil Isl. - Pitt Passage NAT R40 (15%) No* No*S.Key Peninsula + Islands MCN IS 4 Kitsap 15 4.564 McNeil Isl. - Carr Inlet NAT R40 (21%) No* No*S.Key Peninsula + Islands SKEY 1 Kitsap 15 3.476 Key Pen.- Pitt Passage Rural, CONS, NAT (spits) R10 (18%), ARL (11%) No* No*S.Key Peninsula + Islands SKEY 2 Kitsap 15 6.208 Filucy Bay Rural, RR, NAT R10 (33%), ARL (11%) No* No*S.Key Peninsula + Islands SKEY 3 Kitsap 15 3.287 Key Pen.- Drayton Passage Rural, except NAT (spits) R10 (19%) No* No*
*Recorded pre-contact materials and campsitesSummary
Total # Reaches
111341
Total 45
Management UnitCarr InletCase Inlet - Henderson BayColvos Pass-Tacoma NarrowsDash Point
Appendix C

Table 9BLand Use by Freshwater Reach
# Reaches by Feature Reach Feature Reach Name WRIA Name
WRIA Number
Length (Mi)
Shoreline Env. Design. Zoning OtherInventoried resources Listed sites
1 Chambers Creek CHAM_CR_01 Chambers-Clover 12 0.365 CONS, NAT MSF (99%) from tables not text No*** No***1 Clover Creek CLOV_CR_01 Chambers-Clover 12 3.515 Urban, Rural MSF (87%) from tables not text No*** No***1 Spanaway Creek SPAN_CR_01 Chambers-Clover 12 2.354 Urban MSF (99%) from tables not text No*** No***1 Spanaway Lake SPAN_LK_01 Chambers-Clover 12 0.081 Urban, CONS MSF (100%) from tables not text No*** No***
1 Bay Lake BAY_LK_01 Kitsap 15 5.818 CONS R10 (82%), ARL (18%) No No1 Butterworth Reservoir BUTT_RES_01 Kitsap 15 2.501 CONS R40 (100%) No No1 Carney Lake CARN_LK_01 Kitsap 15 1.218 Rural R10 (100%) No No1 Crescent Lake CRES_LK_01 Kitsap 15 4.218 RR, CONS RSR (98%) No No
Historic/Cultural ResourcesEnvironment Designations, Zoning, and UGA
_ _ p , ( )1 Florence Lake FLOR_LK_01 Kitsap 15 2.596 CONS R10 (100%) No No1 Jackson Lake JACK_LK_01 Kitsap 15 3.267 None R10 (100%) No No1 Josephine Lake JOSE_LK_01 Kitsap 15 2.505 RR R10 (100%) No No1 Lake Minterwood MINT_LK_01 Kitsap 15 2.155 RR R10 (100%)1 Minter Creek MINT_CR_01 Kitsap 15 1.470 None R10 (90%), ARL (10%) Yes No1 Rocky Creek ROCK_CR_01 Kitsap 15 0.121 None R10 (98%) No No1 Stansberry Lake STAN_LK_01 Kitsap 15 1.464 RR R10 (100%) No No
1 Alder Lake ALD_LK_01 Nisqually 11 0.031 CONS R10 (84%) No No1 Beaver Creek BEAV_CR_01 Nisqually 11 5.828 CONS, None FL (94%) No No1 Benbow Lakes BENB_LK_01 Nisqually 11 1.745 None R10 (100%) outside CUGA No No1 Busy Wild Creek BUSY_CR_01 Nisqually 11 7.545 None per map, CONS per SFL (100%) No No1 Clear Lake CLEA_LK_01 Nisqually 11 2.498 RR R10 (100%) No No1 Copper Creek COPP_CR_01 Nisqually 11 0.767 None R10 (70%), R40 (22%) No No1 Cranberry Lake CRAN_LK_01 Nisqually 11 2.665 NAT ARL (78%), R10 (22%) No Noy _ _ q y ( ), ( )1 Harts Lake HART_LK_01 Nisqually 11 7.039 Rural, None R10 (77%), ARL (23%) No No1 Horn Creek HORN_CR_01 Nisqually 11 2.421 None R10 (54%), ARL (46%) No No1 Kreger Lake KREG_LK_01 Nisqually 11 5.207 Rural R10 (51%), ARL (49%) No No1 La Grande Reservoir LAGR_RES_01 Nisqually 11 6.343 None R10 (64%), ARL (36%) No No1 Little Lake LITT_LK_01 Nisqually 11 2.400 None R10 (76%), ARL (24%) No No3 Little Mashel River LMAS_RV_01 Nisqually 11 0.317 Rural MSF (100%) No No
Little Mashel River LMAS_RV_02 Nisqually 11 2.005 Rural R10 (67%), ARL (33%) No NoLittle Mashel River LMAS_RV_03 Nisqually 11 1.701 CONS, RR R10 (49%), R20 (37%), ARL (14%) No No
5 Lynch Creek LYNC_CR_01 Nisqually 11 0.172 CONS ARL (97%) No*** No***Lynch Creek LYNC_CR_02 Nisqually 11 0.561 CONS FL (100%) No*** No***Lynch Creek LYNC_CR_03 Nisqually 11 0.338 None R10 (95%) No*** No***Lynch Creek LYNC_CR_04 Nisqually 11 2.909 None FL (79%), R20 (20%) No*** No***
7 Mashel River MASH_RV_01 Nisqually 11 3.639 NAT, CONS R10 (100%) No*** No***Mashel River MASH_RV_02 Nisqually 11 1.033 CONS MSF (100%) No*** No***Mashel River MASH_RV_03 Nisqually 11 1.173 Rural, RR MSF (84%), FL (16%) No*** No***_ _ q y , ( ), ( )Mashel River MASH_RV_04 Nisqually 11 4.044 CONS, RR FL (100%) No*** No***Mashel River MASH_RV_05 Nisqually 11 4.395 CONS, None FL (100%) No*** No***Mashel River MASH_RV_06 Nisqually 11 1.281 None FL (100%) No*** No***Mashel River MASH_RV_07 Nisqually 11 2.408 None FL (100%) No*** No***
1 Midway Creek MIDW_CR_01 Nisqually 11 0.769 None R10 (82%), ARL (18%) No No1 Muck Creek MUCK_CR_01 Nisqually 11 2.589 None R10 (100%) No No1 Muck Lake MUCK_LK_01 Nisqually 11 2.261 RR R10 (100%) No No
Appendix C

Table 9BLand Use by Freshwater Reach
# Reaches by Feature Reach Feature Reach Name WRIA Name
WRIA Number
Length (Mi)
Shoreline Env. Design. Zoning OtherInventoried resources Listed sites
Historic/Cultural ResourcesEnvironment Designations, Zoning, and UGA
1 Mud Lake MUD_LK_01 Nisqually 11 3.512 Rural ARL (91%) No No8 Nisqually River NISQ_RV_01 Nisqually 11 3.717 CONS R10 (77%) No*** No***
Nisqually River NISQ_RV_02 Nisqually 11 2.475 Rural, CONS R10 (88%) No*** No***Nisqually River NISQ_RV_03 Nisqually 11 2.641 CONS R10 (87%) No*** No***Nisqually River NISQ_RV_04 Nisqually 11 1.287 NAT R10 (83%) No*** No***Nisqually River NISQ_RV_05 Nisqually 11 1.602 NAT R10 (92%) No*** No***Nisqually River NISQ_RV_06 Nisqually 11 6.511 CONS R40 (72%) No*** No***Nisqually River NISQ_RV_07 Nisqually 11 0.059 None R40 (35%) No*** No***Nisqually River NISQ_RV_08 Nisqually 11 0.186 None R40 (16%) No*** No***q y _ _ q y ( )
1 Ohop Creek_Nis OHOP_LK_CR Nisqually 11 2.072 Rural R10 (67%), ARL (33%) No No4 Ohop Creek_Nis (ReachOHOP_NIS_CR_01 Nisqually 11 6.137 Rural ARL (71%), R10 (29%) No Yes
Ohop Creek_Nis OHOP_NIS_CR_02 Nisqually 11 MSF (100%) No YesOhop Creek_Nis OHOP_NIS_CR_03 Nisqually 11 Rural R10 (95%) No YesOhop Creek_Nis OHOP_NIS_CR_04 Nisqually 11 2.437 None ARL (86%) No Yes
1 Ohop Lake OHOP_LK_01 Nisqually 11 8.495 RR, CONS R10 (99%) No No1 Rapjohn Lake RAPJ_LK_01 Nisqually 11 4.707 Rural R10 (64%), ARL (36%) No No1 Silver Lake SILV_LK_01 Nisqually 11 3.438 Rural, CONS R10 (60%), ARL (40%) No No1 South Creek SOUT_CR_01 Nisqually 11 9.633 Rural, None R10 (72%), ARL (28%) No No1 South Fork Little Mashe SFLM_RV_01 Nisqually 11 0.341 None R10 (100%) No No1 Tanwax Creek TANW_CR_01 Nisqually 11 8.137 CONS R10 (95%) No No1 Tanwax Lake TANW_LK_01 Nisqually 11 17.330 RR, CONS, Not Designated R10 (77%), ARL (23%) No No1 Trout Lake TROU_LK_01 Nisqually 11 2.466 None R10 (100%) No No1 Tule Lake TULE_LK_01 Nisqually 11 9.923 CONS, Not Designated R10 (100%) No No1 Twentyfive Mile Creek 25MI_CR_01 Nisqually 11 1.593 CONS R20 (71%), R10 (21%) No Noy _ _ q y ( ), ( )1 Twentyseven Lake TWEN_LK_01 Nisqually 11 1.268 CONS R10 (100%) No No1 Twin Lakes TWIN_LK_01 Nisqually 11 1.380 R10 (100%) No No1 Unnamed Lake UNNA_LK_01 Nisqually 11 0.740 None ARL (93%) No No1 Unnamed Lake1 UNNA_LK1_01 Nisqually 11 7.871 None R10 (92%) No No1 Unnamed Trib of Mashe UTMR_CR_01 Nisqually 11 2.925 None FL (100%) No*** No***1 Whitman Lake WHIT_LK_01 Nisqually 11 3.465 RR R10 (100%) No No
1 Bear Creek BEAR_CR_01 Puyallup-White 10 0.560 CONS per map, none per S FL (100%) No No1 Canyon Creek Two CANY_CR_01 Puyallup-White 10 1.332 None FL (100%) No No8 Carbon River CARB_RV_01 Puyallup-White 10 0.949 Rural R10 (99%) No*** No***
Carbon River CARB_RV_02 Puyallup-White 10 0.734 CONS EBPC (66%), R10 (34%) No*** No***Carbon River CARB_RV_03 Puyallup-White 10 1.455 CONS, Rural R10 (87%), EBPC (12%) No*** No***Carbon River CARB_RV_04 Puyallup-White 10 1.746 CONS, Rural R10 (79%), ARL (12%) No*** No***Carbon River CARB_RV_05 Puyallup-White 10 12.846 Rural, NAT, CONS FL (43%), R10 (37%), R20 (20%) outside CUGA No*** No***Carbon River CARB_RV_06 Puyallup-White 10 3.657 CONS, None FL (70%), R20 (30%) outside CUGA No*** No***_ _ y p , ( ), ( )Carbon River CARB_RV_07 Puyallup-White 10 3.864 None FL (100%) outside CUGA No*** No***Carbon River CARB_RV_08 Puyallup-White 10 1.015 None FL (100%) outside CUGA No*** No***
1 Cayada Creek CAYA_CR_01 Puyallup-White 10 1.683 None FL (100%) outside CUGA No No
1 Chenuis Creek CHEN_CR_01 Puyallup-White 10 4.133 None FL (100%)In National Forest No No
1 Clarks Creek CLAR_CR_01 Puyallup-White 10 2.364 Rural MSF (62%), ARL (20%) PI (11%) No*** No***2 Clearwater River CLEA_RV_01 Puyallup-White 10 5.325 CONS FL (100%) No No
Appendix C

Table 9BLand Use by Freshwater Reach
# Reaches by Feature Reach Feature Reach Name WRIA Name
WRIA Number
Length (Mi)
Shoreline Env. Design. Zoning OtherInventoried resources Listed sites
Historic/Cultural ResourcesEnvironment Designations, Zoning, and UGA
Clearwater River CLEA_RV_02 Puyallup-White 10 4.311 CONS, None FL (100%) No No1 Deer Creek DEER_CR_01 Puyallup-White 10 4.261 None FL (100%) outside CUGA No No1 East Fork South Prairie EFSP_CR_01 Puyallup-White 10 3.409 None FL (100%) No No1 Echo Lake ECHO_LK_01 Puyallup-White 10 0.424 None FL (100%) No*** No***1 Eleanor Creek ELEA_CR_01 Puyallup-White 10 0.773 None FL (100%) No
y (Listed historic
1 Evans Creek EVAN_CR_01 Puyallup-White 10 5.695 CONS, None FL (100%) outside CUGA No No1 Fennel Creek FENN_CR_01 Puyallup-White 10 2.414 None R10 (40%), Rsv5 (39%), ARL (20%) No No1 Gale Creek GALE_CR_01 Puyallup-White 10 4.780 CONS, None FL (100%) No No1 George Creek GEOR_CR_01 Puyallup-White 10 1.330 None FL (100%) No No1 George Creek GEOR_CR_01 Puyallup White 10 1.330 None FL (100%) No No1 Goat Creek GOAT_CR_01 Puyallup-White 10 1.213 None FL (100%) No No5 Greenwater River GREE_RV_01 Puyallup-White 10 4.711 CONS, None FL (62%) No*** No***
Greenwater River GREE_RV_02 Puyallup-White 10 5.066 None FL (53%) No*** No***Greenwater River GREE_RV_03 Puyallup-White 10 2.587 None FL (37%) No*** No***Greenwater River GREE_RV_04 Puyallup-White 10 0.813 None FL (100%) No*** No***Greenwater River GREE_RV_05 Puyallup-White 10 5.275 None FL (100%) No*** No***
3 Huckleberry Creek HUCK_CR_01 Puyallup-White 10 3.654 None FL (100%) No NoHuckleberry Creek HUCK_CR_02 Puyallup-White 10 2.701 None FL (100%) No NoHuckleberry Creek HUCK_CR_03 Puyallup-White 10 0.922 None FL (100%) No No
1 Hylebos Creek HYLE_CR_01 Puyallup-White 10 1.235 None MSF (87%) No No1 Kapowsin Lake KAPO_LK_01 Puyallup-White 10 1.150 CONS, NAT R10 (38%), R20 (35%), FL (24%) outside CUGA No No2 Kapowskin Creek KAPO_CR_01 Puyallup-White 10 3.337 Rural, CONS, NAT R20 (42%), ARL (36%), R10 (22%) outside CUGA No No
Kapowskin Creek KAPO_CR_02 Puyallup-White 10 0.613 CONS FL (76%), R20 (12%), ARL (11%) outside CUGA No No1 Kings Creek KING_CR_01 Puyallup-White 10 0.315 None FL (100%) outside CUGA No No6 Lake Tapps TAPP LK 01 Puyallup-White 10 0.270 RR MSF (100%) No*** No***6 Lake Tapps TAPP_LK_01 Puyallup White 10 0.270 RR MSF (100%) No No
Lake Tapps TAPP_LK_02 Puyallup-White 10 2.149 RR MSF (88%), NC (10%) No*** No***Lake Tapps TAPP_LK_03 Puyallup-White 10 6.925 RR MSF (100%) No*** No***Lake Tapps TAPP_LK_04 Puyallup-White 10 0.283 RR MSF (100%) No*** No***Lake Tapps TAPP_LK_05 Puyallup-White 10 25.651 RR, except CONS (Island B R10 (100%) No*** No***Lake Tapps TAPP_LK_06 Puyallup-White 10 0.620 RR MSF (100%) No*** No***
1 Leaky Lake LEAK_LK_01 Puyallup-White 10 3.407 None R10 (100%) No No1 Lost Creek_Greenwater LOST_GR_CR_01 Puyallup-White 10 2.376 None FL (100%) No No1 Lost Creek_Huckleberry LOST_HC_CR_01 Puyallup-White 10 0.441 None FL (100%) No No1 Maggie Creek MAGG_CR_01 Puyallup-White 10 0.441 None FL (100%) No No
1 Fennel Creek (called Me MEAD_CR_01 Puyallup-White 10 1.213 None FL (100%)Majority in National Forest No No
1 Milky Creek MILK_CR_01 Puyallup-White 10 1.557 CONS FL (100%) No No1 Morgan Lake MORG_LK_01 Puyallup-White 10 5.444 Rural R10 (60%), ARL (40%) outside CUGA No No3 Mowich River MOWI_RV_01 Puyallup-White 10 0.888 CONS FL (100%) outside CUGA No No
M i h Ri MOWI RV 02 P ll Whit 10 4 331 CONS N FL (100%) t id CUGA N NMowich River MOWI_RV_02 Puyallup-White 10 4.331 CONS, None FL (100%) outside CUGA No NoMowich River MOWI_RV_03 Puyallup-White 10 1.471 None FL (100%) outside CUGA No No
1 Mud Mountain Lake MUDM_LK_01 Puyallup-White 10 2.720 None FL (75%) No No1 Neisson Creek NEIS_CR_01 Puyallup-White 10 2.029 CONS, None FL (93%) outside CUGA No No1 North Puyallup River NOPU_RV_01 Puyallup-White 10 1.752 None FL (100%) outside CUGA No No1 Ohop Creek_Kapowsin OHOP_KAP_CR_01 Puyallup-White 10 2.854 CONS FL (100%) No No1 Page Creek PAGE_CR_01 Puyallup-White 10 0.759 CONS FL (95%) No No
Appendix C

Table 9BLand Use by Freshwater Reach
# Reaches by Feature Reach Feature Reach Name WRIA Name
WRIA Number
Length (Mi)
Shoreline Env. Design. Zoning OtherInventoried resources Listed sites
Historic/Cultural ResourcesEnvironment Designations, Zoning, and UGA
1 Pinochle Creek PINO_CR_01 Puyallup-White 10 1.058 None FL (100%) No No2 Printz Basin PRIN_BAS_01 Puyallup-White 10 1.037 None MSF (100%) No No
Printz Basin PRIN_BAS_02 Puyallup-White 10 7.626 CONS (south end), None R10 (50%), ARL (37%). Rsv5 (13%) No No
13 Puyallup River PUYA_RV_01 Puyallup-White 10 0.997 Urban, Rural Rsep (53%), ARL (42%)outside CUGA ~ Puyallup Res No*** No***
Puyallup River PUYA_RV_02 Puyallup-White 10 2.004 Urban, Rural MSF (76%), MUD (11%) inside CUGA No*** No***
Puyallup River PUYA_RV_03 Puyallup-White 10 1.071 CONS EC (71%), MSF (29%) inside CUGA No*** No***
P ll Ri PUYA RV 04 P ll Whit 10 3 906 R l CONS R10 (87%) ARL (13%) t id CUGA N *** N ***Puyallup River PUYA_RV_04 Puyallup-White 10 3.906 Rural, CONS R10 (87%), ARL (13%) outside CUGA No*** No***Puyallup River PUYA_RV_05 Puyallup-White 10 2.239 Rural R10 (88%), ARL (12%) outside CUGA No*** No***
Puyallup River PUYA_RV_06 Puyallup-White 10 4.066 Rural R10 (55%), ARL (43%)Orting UGA directly to east No*** No***
Puyallup River PUYA_RV_07 Puyallup-White 10 3.566 Rural R10 (77%), R20 (18%) outside CUGA No*** No***Puyallup River PUYA_RV_08 Puyallup-White 10 4.329 CONS R20 (57%), FL (36%) outside CUGA No*** No***Puyallup River PUYA_RV_09 Puyallup-White 10 8.010 CONS R20 (78%), FL (22%) outside CUGA No*** No***Puyallup River PUYA_RV_10 Puyallup-White 10 1.734 CONS R20 (68%), FL (32%) outside CUGA No*** No***Puyallup River PUYA_RV_11 Puyallup-White 10 1.345 CONS R20 (62%) FL (38%) outside CUGA No*** No***Puyallup River PUYA_RV_12 Puyallup-White 10 3.712 CONS, None FL (100%) outside CUGA No*** No***Puyallup River PUYA_RV_13 Puyallup-White 10 1.514 None FL (100%) outside CUGA No*** No***
2 Rhode Lake RHOD_LK_01 Puyallup-White 10 1.520 None MSF (100%) No**** NoRhode Lake RHOD_LK_02 Puyallup-White 10 0.910 None Rsv5 (100%) No**** No
1 Rushingwater Creek RUSH_CR_01 Puyallup-White 10 3.237 CONS, None FL (100%) outside CUGA No No1 Saint Andrews Creek STAN_CR_01 Puyallup-White 10 0.202 None FL (100%) outside CUGA No No1 Sil C k SILV CR 01 P ll Whit 10 5 599 N FL (100%) N N1 Silver Creek SILV_CR_01 Puyallup-White 10 5.599 None FL (100%) No No1 South Fork South Prairie SFSP_CR_01 Puyallup-White 10 2.628 None FL (100%) No No4 South Prairie Creek SOPR_CR_01 Puyallup-White 10 5.581 CONS ARL (54%), R10 43%, No*** No***
South Prairie Creek SOPR_CR_02 Puyallup-White 10 0.492 CONS R10 (100%) No*** No***South Prairie Creek SOPR_CR_03 Puyallup-White 10 4.572 CONS R10 (49%), R20 (40%) No*** No***South Prairie Creek SOPR_CR_04 Puyallup-White 10 6.668 CONS, None FL (88%), R20 (12%) No*** No***
2 South Puyallup River SOPU_RV_01 Puyallup-White 10 2.466 None FL (100%) outside CUGA No NoSouth Puyallup River SOPU_RV_02 Puyallup-White 10 1.058 None FL (100%) outside CUGA No No
1 Tolmie Creek TOLM_CR_01 Puyallup-White 10 1.707 None FL (100%) outside CUGA No No1 Twentyeight Mile Creek 28MI_CR_01 Puyallup-White 10 2.931 None FL (100%) No*** No***1 Unnamed Trib of Puyallu UTPU_CR_01 Puyallup-White 10 0.422 None R20 (94%) outside CUGA No No
1 Unnamed Trib of So. Pu UTSP_CR_01 Puyallup-White 10 1.016 None FL (100%)National Forest land No No
1 Viola Creek VIOL_CR_01 Puyallup-White 10 1.679 None FL (100%) No No2 Voight Creek VOIG CR 01 Puyallup-White 10 6.732 Rural, CONS R20 (50%), FL (24%), R10 (14%), ARoutside CUGA No*** No***2 Voight Creek VOIG_CR_01 Puyallup White 10 6.732 Rural, CONS R20 (50%), FL (24%), R10 (14%), ARoutside CUGA No No
Voight Creek VOIG_CR_02 Puyallup-White 10 9.088 CONS, None FL (100%) outside CUGA No*** No***2 West Fork White River WFWR_RV_01 Puyallup-White 10 6.943 CONS, None FL (100%) No No
West Fork White River WFWR_RV_02 Puyallup-White 10 4.485 None FL (100%) No No10 White River WHIT_RV_01 Puyallup-White 10 3.320 CONS MSF (100%) No*** No***
White River WHIT_RV_02 Puyallup-White 10 0.556 Rural EC (100%) No*** No***White River WHIT_RV_03 Puyallup-White 10 8.990 CONS R10 (85%), ARL (10%) No*** No***White River WHIT_RV_04 Puyallup-White 10 4.220 CONS R20 (53%), FL (29%), No*** No***
Appendix C

Table 9BLand Use by Freshwater Reach
# Reaches by Feature Reach Feature Reach Name WRIA Name
WRIA Number
Length (Mi)
Shoreline Env. Design. Zoning OtherInventoried resources Listed sites
Historic/Cultural ResourcesEnvironment Designations, Zoning, and UGA
White River WHIT_RV_05 Puyallup-White 10 1.420 No*** No***White River WHIT_RV_06 Puyallup-White 10 1.420 CONS FL (93%) No*** No***White River WHIT_RV_07 Puyallup-White 10 10.490 CONS FL (88%) No*** No***White River WHIT_RV_08 Puyallup-White 10 3.530 CONS FL (96%) No*** No***White River WHIT_RV_09 Puyallup-White 10 4.670 CONS, None FL (66%), R20 (34%) No*** No***White River WHIT_RV_10 Puyallup-White 10 14.610 None FL (100%) No*** No***White River WHIT_RV_11 Puyallup-White 10 2.150 None FL (100%) No*** No***
5 Wilkeson Creek WILK_CR_01 Puyallup-White 10 4.161 CONS R10 (89%), ARL (11%) No*** No***Wilkeson Creek WILK_CR_02 Puyallup-White 10 0.250 CONS R10 (100%) No*** No***_ _ y p ( )Wilkeson Creek WILK_CR_03 Puyallup-White 10 2.080 CONS R20 (67%), R10 (27%) No*** No***Wilkeson Creek WILK_CR_04 Puyallup-White 10 1.327 None FL (100%) No*** No***
185 ***Recorded pre-contact materials and campsites****Recorded pre-contact materials
Appendix C

Table 10AParks and Public Access by Marine Reach
AND IS 1 S.Key Peninsula + Islands 15 YES Yoman Ferry Landing YES Eagle Island St Park, north of Anderson Steilacom-Anderson FerryAND IS 2 S.Key Peninsula + Islands 15 No NoAND IS 3 S.Key Peninsula + Islands 15 No NoAND IS 4 S.Key Peninsula + Islands 15 No NoAND IS 5 S.Key Peninsula + Islands 15 No No
CI-HB 1 Carr Inlet - Henderson Bay 15 No NoCI-HB 10 Carr Inlet - Henderson Bay 15 No NoCI-HB 11 Carr Inlet - Henderson Bay 15 No No Glen CoveCI-HB 12 Carr Inlet - Henderson Bay 15 No NoCI-HB 13 Carr Inlet - Henderson Bay 15 YES Von Geldern Cove YES Penrose Point State Park Penrose Point Camprgd.CI-HB 2 Carr Inlet - Henderson Bay 15 No No
CommentsID Boat Launch LocationBoat Launch/ Ferry?Feature Name Park NamePublic
Park?WRIA
yCI-HB 3 Carr Inlet - Henderson Bay 15 YES Horsehead Bay NoCI-HB 4 Carr Inlet - Henderson Bay 15 No YES Kopachuck State Park Cutts Island, to westCI-HB 5 Carr Inlet - Henderson Bay 15 No NoCI-HB 6 Carr Inlet - Henderson Bay 15 No NoCI-HB 7 Carr Inlet - Henderson Bay 15 YES western end of park YES Purdy Sand Spit ParkCI-HB 8 Carr Inlet - Henderson Bay 15 No NoCI-HB 9 Carr Inlet - Henderson Bay 15 No No Minter Bay
CI-1 Case Inlet 15 No NoCI-10 Case Inlet 15 No NoCI-11 Case Inlet 15 No NoCI-2 Case Inlet 15 No NoCI-3 Case Inlet 15 No NoCI-4 Case Inlet 15 No YES Joemma Beach State Park includes campgroundCI-5 Case Inlet 15 No YES Public dock, Herron Bay No park, Herron IslandCI-6 Case Inlet 15 No NoCI-7 Case Inlet 15 No NoCI-8 Case Inlet 15 YES Vaughn Bay No Off Hall RoadCI-9 Case Inlet 15 No No
CP-TN 1 Colvos Pass-Tacoma Narrows 15 No NoCP-TN 2 Colvos Pass-Tacoma Narrows 15 No YES Sunrise Beach County Park several parcels of landCP-TN 3 Colvos Pass-Tacoma Narrows 15 YES Gig Harbor YES Lighthouse Park (at mouth of Gig Harbor) Randall Dr. NWCP-TN 4 Colvos Pass-Tacoma Narrows 15 No YES Narrows Park south of bridge
DP Dash Point / Browns Point 10 No YES Dash Pt Park, Browns Pt Lighthouse Park Tacoma Metro Parks
HP-WB 1 Hale Pass - Wollochet Bay 15 YES Point Fosdick No 10th St. NWHP-WB 2 Hale Pass - Wollochet Bay 15 No NoHP-WB 3 Hale Pass - Wollochet Bay 15 YES Towhead Isl. Boat Launch YES Fox Island Fishing Pier (south end) on Fox Island
KTRN IS S.Key Peninsula + Islands 15 No No Ketron Island FerryMCN IS 1 S.Key Peninsula + Islands 15 No NoMCN IS 2 S.Key Peninsula + Islands 15 No NoMCN IS 3 S.Key Peninsula + Islands 15 No NoMCN IS 4 S.Key Peninsula + Islands 15 No NoSKEY 1 S.Key Peninsula + Islands 15 No NoSKEY 2 S.Key Peninsula + Islands 15 No NoSKEY 3 S.Key Peninsula + Islands 15 YES 72nd St. KPS No
Appendix C

TABLE 10BParks and Public Access by Freshwater Reach
BEAR_CR_01 Bear Creek 10 No NoCANY_CR_01 Canyon Creek Two 10 No NoCARB_RV_01 Carbon River 10 No NoCARB_RV_02 Carbon River 10 No NoCARB_RV_03 Carbon River 10 No NoCARB_RV_04 Carbon River 10 No NoCARB_RV_05 Carbon River 10 No NoCARB_RV_06 Carbon River 10 No NoCARB_RV_07 Carbon River 10 No NoCARB_RV_08 Carbon River 10 No NoCAYA_CR_01 Cayada Creek 10 No No National Forest landCHEN_CR_01 Chenuis Creek 10 No No National Forest landCLAR_CR_01 Clarks Creek 10 No NoCLEA_RV_01 Clearwater River 10 No NoCLEA_RV_02 Clearwater River 10 No NoDEER_CR_01 Deer Creek 10 No NoECHO_LK_01 Echo Lake 10 No No National Forest landEFSP_CR_01 E Fork South Prairie 10 No NoELEA_CR_01 Eleanor Creek 10 No No National Forest landEVAN_CR_01 Evans Creek 10 No No National Forest landFENN_CR_01 Fennel Creek 10 No NoGALE_CR_01 Gale Creek 10 No YES Wilkeson Creek County ParkGEOR_CR_01 George Creek 10 No No National Forest land
CommentsPublic Park? Park NameID Feature Name Boat
Launch?Boat Launch
LocationWRIA
_ _ gGOAT_CR_01 Goat Creek 10 No No National Forest landGREE_RV_01 Greenwater River 10 No No National Forest landGREE_RV_02 Greenwater River 10 No No National Forest landGREE_RV_03 Greenwater River 10 No No National Forest landGREE_RV_04 Greenwater River 10 No No National Forest landGREE_RV_05 Greenwater River 10 No No National Forest landHUCK_CR_01 Huckleberry Creek 10 No No National Forest landHUCK_CR_02 Huckleberry Creek 10 No No National Forest landHUCK_CR_03 Huckleberry Creek 10 No No National Forest landHYLE_CR_01 Hylebos Creek 10 No NoKAPO_CR_01 Kapowskin Creek 10 No NoKAPO_CR_02 Kapowskin Creek 10 No NoKAPO_LK_01 Kapowsin Lake 10 YES Northern shore No New WDFW boat ramp, dock
Appendix C

TABLE 10BParks and Public Access by Freshwater Reach
CommentsPublic Park? Park NameID Feature Name Boat
Launch?Boat Launch
LocationWRIA
KING_CR_01 Kings Creek 10 No NoLEAK_LK_01 Leaky Lake (Hidden Lake) 10 No NoLOST_GR_CR_01 Lost Creek_Greenwater 10 No No National Forest landLOST_HC_CR_01 Lost Creek_Huckleberry 10 No No National Forest landMAGG_CR_01 Maggie Creek 10 No No National Forest landMEAD_CR_01 Meadow Creek 10 No No National Forest landMILK_CR_01 Milky Creek 10 No No National Forest landMORG_LK_01 Morgan Lake 10 No NoMOWI_RV_01 Mowich River 10 No NoMOWI_RV_02 Mowich River 10 No NoMOWI_RV_03 Mowich River 10 No NoNEIS_CR_01 Neisson Creek 10 No NoNOPU_RV_01 North Puyallup River 10 No NoOHOP_KAP_CR_0 Ohop Creek_Kapowskin 10 No NoPAGE_CR_01 Page Creek 10 No NoPINO_CR_01 Pinochle Creek 10 No No National Forest landPRIN_BAS_01 Printz Basin 10 No NoPRIN_BAS_02 Printz Basin 10 No NoPUYA_RV_01 Puyallup River 10 No NoPUYA_RV_02 Puyallup River 10 No NoPUYA_RV_03 Puyallup River 10 No NoPUYA_RV_04 Puyallup River 10 No YES Riverside County Park Riverside Dr and 78 St. EPUYA RV 05 Puyallup River 10 No NoPUYA_RV_05 Puyallup River 10 No NoPUYA_RV_06 Puyallup River 10 No NoPUYA_RV_07 Puyallup River 10 No No
PUYA_RV_08 Puyallup River 10 No NoHigh Cedars Golf Club, private
coursePUYA_RV_09 Puyallup River 10 No NoPUYA_RV_10 Puyallup River 10 No NoPUYA_RV_11 Puyallup River 10 No NoPUYA_RV_12 Puyallup River 10 No NoPUYA_RV_13 Puyallup River 10 No NoRHOD_LK_01 Rhode Lake 10 No NoRHOD_LK_02 Rhode Lake 10 No NoRUSH_CR_01 Rushingwater Creek 10 No No
Appendix C

TABLE 10BParks and Public Access by Freshwater Reach
CommentsPublic Park? Park NameID Feature Name Boat
Launch?Boat Launch
LocationWRIA
SFSP_CR_01 S Fork South Prairie 10 No NoSILV_CR_01 Silver Creek 10 No No National Forest landSOPR_CR_01 South Prairie Creek 10 No NoSOPR_CR_02 South Prairie Creek 10 No NoSOPR_CR_03 South Prairie Creek 10 No NoSOPR_CR_04 South Prairie Creek 10 No NoSOPU_RV_01 South Puyallup River 10 No No National Forest landSOPU_RV_02 South Puyallup River 10 No NoSTAN_CR_01 Saint Andrews Creek 10 No NoTAPP_LK_01 Lake Tapps 10 No YES Jenks Park, West Tapps Dr. Boat launch, Bonney LkTAPP_LK_02 Lake Tapps 10 No N0TAPP_LK_03 Lake Tapps 10 No YES Small unnamed park/open space 182nd Avenue ETAPP_LK_04 Lake Tapps 10 YES NE shore YES North Park Lake TappsTAPP_LK_05 Lake Tapps 10 No YES Tapps Island Golf CourseTAPP_LK_06 Lake Tapps 10 No NoTOLM_CR_01 Tolmie Creek 10 No No National Forest land28MI_CR_01 Twentyeight Mile Creek 10 No No National Forest landUTPU_CR_01 Un. Trib. Puyallup 10 No NoUTSP_CR_01 Un. Trib.S. Puyallup 10 No No National Forest landVIOL_CR_01 Viola Creek 10 No No National Forest landVOIG_CR_01 Voight Creek 10 No NoVOIG_CR_02 Voight Creek 10 No NoWFWR RV 01 West Fork White River 10 No No National Forest landWFWR_RV_01 West Fork White River 10 No No National Forest landWFWR_RV_02 West Fork White River 10 No No National Forest landWHIT_RV_01 White River 10 No NoWHIT_RV_02 White River 10 No NoWHIT_RV_03 White River 10 No NoWHIT_RV_04 White River 10 No NoWHIT_RV_06 White River 10 No NoWHIT_RV_07 White River 10 No NoWHIT_RV_08 White River 10 No NoWHIT_RV_09 White River 10 No NoWHIT_RV_10 White River 10 No NoWHIT_RV_11 White River 10 No NoWILK_CR_01 Wilkeson Creek 10 No No
Appendix C

TABLE 10BParks and Public Access by Freshwater Reach
CommentsPublic Park? Park NameID Feature Name Boat
Launch?Boat Launch
LocationWRIA
WILK_CR_02 Wilkeson Creek 10 No NoWILK_CR_03 Wilkeson Creek 10 No NoWILK_CR_04 Wilkeson Creek 10 No NoALD_LK_01 Alder Lake 11 YES Northern shore YES Alder Lake Park, Bogucki Island (2) Boat launch on Mtn. Hwy.BEAV_CR_01 Beaver Creek 11 No NoBENB_LK_01 Benbow Lakes 11 No NoBUSY_CR_01 Busy Wild Creek 11 No NoCLEA_LK_01 Clear Lake 11 YES Northern shore NoCOPP_CR_01 Copper Creek 11 No No National Forest landCRAN_LK_01 Cranberry Lake 11 No NoHART_LK_01 Harts Lake 11 YES Northern shore NoHORN_CR_01 Horn Creek 11 No NoKREG_LK_01 Kreger Lake 11 No NoLAGR_RES_01 La Grande Reservoir 11 No NoLITT_LK_01 Little Lake 11 No NoLMAS_RV_01 Little Mashel River 11 No NoLMAS_RV_02 Little Mashel River 11 No NoLMAS_RV_03 Little Mashel River 11 No NoLYNC_CR_01 Lynch Creek 11 No NoLYNC_CR_02 Lynch Creek 11 No NoLYNC_CR_03 Lynch Creek 11 No NoLYNC_CR_04 Lynch Creek 11 No NoMASH RV 01 Mashel River 11 No NoMASH_RV_01 Mashel River 11 No NoMASH_RV_02 Mashel River 11 No NoMASH_RV_03 Mashel River 11 No NoMASH_RV_04 Mashel River 11 No NoMASH_RV_05 Mashel River 11 No NoMASH_RV_06 Mashel River 11 No NoMASH_RV_07 Mashel River 11 No NoMIDW_CR_01 Midway Creek 11 No NoMUCK_CR_01 Muck Creek 11 No NoMUCK_LK_01 Muck Lake 11 No NoMUD_LK_01 Mud Lake 11 No NoMUDM_LK_01 Mud Mountain Lake 11 No NoNISQ_RV_01 Nisqually River 11 No No
Appendix C

TABLE 10BParks and Public Access by Freshwater Reach
CommentsPublic Park? Park NameID Feature Name Boat
Launch?Boat Launch
LocationWRIA
NISQ_RV_02 Nisqually River 11 No NoNISQ_RV_03 Nisqually River 11 No NoNISQ_RV_04 Nisqually River 11 No NoNISQ_RV_05 Nisqually River 11 No NoNISQ_RV_06 Nisqually River 11 No NoNISQ_RV_07 Nisqually River 11 No NoNISQ_RV_08 Nisqually River 11 No NoOHOP_LK_01 Ohop Lake 11 YES Southern shore No WDFW boat rampOHOP_LK_CR Ohop Creek_Nis 11 No NoOHOP_NIS_CR_01Ohop Creek_Nis 11 No NoOHOP_NIS_CR_02Ohop Creek_Nis 11 No NoOHOP_NIS_CR_03Ohop Creek_Nis 11 No NoOHOP_NIS_CR_04Ohop Creek_Nis 11 No No
RAPJ_LK_01 Rapjohn Lake 11 YES Western shore NoWDFW boat ramp, off of 384th St. E
SFLM_RV_01 S Fork Little Mashel 11 No No
SILV_LK_01 Silver Lake 11 YES NE shore NoPrivate resort provides boat
ramp, dockSOUT_CR_01 South Creek 11 No NoTANW_CR_01 Tanwax Creek 11 No NoTANW_LK_01 Tanwax Lake 11 YES Southern shore No WDFW boat launchTROU_LK_01 Trout Lake 11 No NoTULE LK 01 Tule Lake 11 No NoTULE_LK_01 Tule Lake 11 No No25MI_CR_01 Twentyfive Mile Creek 11 No NoTWEN_LK_01 Twentyseven Lake 11 No NoTWIN_LK_01 Twin Lakes 11 No NoUNNA_LK_01 Unnamed Lake 11 No NoUNNA_LK1_01 Unnamed Lake1 11 No NoUTMR_CR_01 Un. Trib. Little Mashel 11 No NoWHIT_LK_01 Whitman Lake 11 YES Eastern shore NoAME_LK_01 American Lake 12 YES SE shore No WDFW ramp off Portland Ave.CHAM_CR_01 Chambers Creek 12 No YES Brookdale Golf CourseCLOV_CR_01 Clover Creek 12 No YES Unnamed, Yakima Ave. SSPAN_CR_01 Spanaway Creek 12 No NoSPAN_LK_01 Spanaway Lake 12 YES NE shore YES Spanaway County Park Bresemann Forest
Appendix C

TABLE 10BParks and Public Access by Freshwater Reach
CommentsPublic Park? Park NameID Feature Name Boat
Launch?Boat Launch
LocationWRIA
BAY_LK_01 Bay Lake 15 YES Northern shore No Sanford Road KPS, WDFWBUTT_RES_01 Butterworth Reservoir 15 No No
CARN_LK_01 Carney Lake 15 YES SE shore NoWDFW, no internal combustion
enginesCRES_LK_01 Crescent Lake 15 YES Northern shore YES Crescent Lake Co. ParkFLOR_LK_01 Florence Lake 15 YES North shore YES Lowell Johnson Co. Park boat launch undevelopedJACK_LK_01 Jackson Lake 15 YES NW shore NoJOSE_LK_01 Josephine Lake 15 No NoMINT_CR_01 Minter Creek 15 No NoMINT_LK_01 Lake Minterwood 15 No NoROCK_CR_01 Rocky Creek 15 No NoSTAN_LK_01 Stansberry Lake 15 No No
Appendix C

Table 11 - Conservation Futures by Reach
Reach Name Project Name Parcel Number Year Selected Acre(s)CARB_RV_04 Foothills Trail (Guy West) 0519342039 1993 5.00HYLE_CR_01 Milton Freeway Tracts 0420053008 1994 8.60SOPR_CR_03 Foothills Trail (Caviezel) 0619171051 1994 30.74NISQ_RV_01 Trent Shoreline 0217174004 1994 19.80CLOV_CR_01 Clover Creek Wetland 0319222073 1994 2.24CLOV_CR_01 Clover Creek (Dietrich) 0319164077 1995 10.75CLOV_CR_01 & SPAN_CR_01 Schibig-Lakeview Natural Preserve 0319083033 1999 10.00SOPR_CR_01 Wetland Replacement Site 0519233002 2001 ~MASH_RV_03 Anderson/Mashel River (5 Parcels) 0416133040 2004 45.31CARB_RV_05 Carbon River Valley 0618043004 2004 452.00CARB_RV_06 Marsh Project Mt Rainier Nat'l Exp. 0717062050 2004 203.00PUYA_RV_06 Orting Community Park 0519304034 2004 19.80OHOP_NIS_CR_01 Witt/Marshel-Ohop Corridor 0416184010 2004 35.59SOPR_CR_01 Soler Farms Development Rights 0519144703 2004 96.58
Muncipal PropertiesCity Name Project Name Parcel Number Year Selected Acre(s)Orting Orting City Park 0519293126 1993 3.90Milton Hylebos Creek Trail 0420053023 1993 16.65University Place Chambers Creek Canyon (Dyer) 0220285023 1993 2.50Puyallup Puyallup River Levee Trail 4920000011 1995 1.40Lakewood Chambers Creek Canyon (Davis) 0220272012 1995 21.38University Place Chambers Creek Canyon (Hartley) 0220271008 1995 8.20Fife Hylebos Creek Park 0420062208 2001 ~University Place Kobayashi Preserve 0220271072 2002 ~Lakewood Chambers Creek-Baldwin 0220271013 2004 1.25Orting Orting City Park 0519304034 2004 19.80

Pierce County Shoreline Inventory and Characterization Report
June 2009 Page D-1
GLOSSARY
- A -
Accretion means the gradual or imperceptible increase or extension of land by natural forces
acting over a long period of time.
Adfluvial fish means fish species that spend most of their lifecycle in a lacustrine environment,
but return to rivers and streams to reproduce.
Advance outwash sands means a soil type deposited as glacial ice receded from the Puget Sound
lowlands which are typically highly permeable and generally contain significant amounts of
groundwater.
Adverse impact means an impact that can be measured or is tangible and has a reasonable
likelihood of causing moderate or greater harm to ecological functions or processes or other
elements of the shoreline environment.
Aggradation means the accumulation of sediment in rivers and nearby landforms. Aggradation
occurs when sediment supply exceeds the ability of a river to transport the sediment.
Algal bloom means a proliferation of one species of algae in a lake, stream, or pond to the
exclusion of other algal species.
Alluvial fan means a fan-shaped deposit of sediment and organic debris formed where a stream
flows or has flowed out of a mountainous upland onto a level plain or valley floor because of a
sudden change in sediment transport capacity (e.g. significant change in slope or confinement).
Alluvium means a general term for clay, silt, sand, gravel, or similar other unconsolidated detrital
materials, deposited during comparatively recent geologic time by a stream or other body of
running water, as a sorted or semi-sorted sediment in the bed of the stream or on its floodplain or
delta.
Alteration means any human induced change in an existing condition. Alterations include, but are
not limited to grading, filling, channelizing, dredging, clearing (vegetation), draining,
construction, compaction, excavation, or any other activity that changes the character of the area.
Anadromous fish means fish species that spend most of their lifecycle in saltwater, but return to
freshwater to reproduce.
Anthropogenic sources means the result or occurrence originated from the activity of humans.
Anthropogenic sources include industry, agriculture, mining, transportation, construction, and
habitations.
Appurtenance means development that is necessarily connected to the use and enjoyment of a
single-family residence and is located landward of the OHWM and/or the perimeter of a wetland.
Appurtenances include a garage, deck, driveway, utilities, fences and grading which does not
exceed 250 cubic yards (except to construct a conventional drainfield).
Aquifer means an underground layer of water-bearing permeable rock or unconsolidated
materials (gravel, sand, silt, or clay) from which groundwater can be usefully extracted using a
well.

Pierce County Shoreline Inventory and Characterization Report
Page D-2 June 2009
Aquitard means a geologic formation that may contain ground water but is incapable of
transferring that water to the surface.
Archaeological Object means an object that comprises the physical evidence of an indigenous
and subsequent culture including material remains of past human life including monuments,
symbols, tools, facilities, graves, skeletal remains and technological byproducts.
Archaeology means systematic, scientific study of the human past through time.
Armoring means the addition of structures or material along the shoreline to decrease the impact
of waves and currents or to prevent the erosion of banks or bluffs.
Artifact means a human-made object, such as a tool, weapon or ornament, especially those of
archaeological or historical interest.
Assimilative capacity means the capacity of a natural body of water to receive wastewater or
toxic materials without deleterious effects and without damage to aquatic life or humans who
consume the water.
Associated wetlands means wetlands that are in proximity to and either influence or are
influenced by a stream, lake or tidal water. This influence includes but is not limited to one of
more of the following: periodic inundation, location within a floodplain, or hydraulic continuity
(WAC 173-22-040).
Avulsion means an abrupt channel change to a river or stream, usually caused by a flood event.
- B -
Backshore is the accretion or erosion zone, located landward of the line of ordinary high tide,
which is normally wetted only by storm tides. It may take the form of a more or less narrow storm
berm (ridge of wave heaped sand and/or gravel) under a bluff or it may constitute a broader
complex of berms, marshes, meadows, or dunes landward of the line of ordinary high tide. It is
part of the littoral drift process along its seaward boundary.
Basin means the area drained by a river and its tributaries or a depressed area with no surface
outlet.
Bathymetry means the measurement of ocean depths and the charting of the topography of the
ocean floor.
Bedlands means those submerged lands below the line of navigability of navigable lakes and
rivers.
Bed load means the part of the total stream load this is moved on or immediately above the stream
bed, such as the larger or heavier particles (i.e., boulders/gravel).
Bedrock means a general term for rock, typically hard, consolidated geologic material that
underlies soil or other unconsolidated, superficial material or is exposed at the surface.
Berm means one or several accreted linear mounds of sand and gravel generally paralleling the
shore at or landward of OHWM; berms are normally stable because of material size or vegetation,
and are naturally formed by littoral drift.

Pierce County Shoreline Inventory and Characterization Report
June 2009 Page D-3
Best management practices means conservation practices or systems of practices and
management measures that: control soil loss, reduce water quality degradation, minimize impacts
to surface waters, and control site runoff.
Bioengineered shoreline stabilization means biostructural and biotechnical alternatives to
hardened structures (bulkheads, walls) for protecting slopes or other erosive features.
Bioengineered stabilization uses vegetation, geotextiles, geosynthetics and similar materials. An
example is Vegetated Reinforced Soil Slopes (VRSS), which uses vegetation arranged and
imbedded in the ground to prevent shallow-mass movement and surficial erosion.
Biological oxygen demand means the amount of oxygen required for the oxidation of the organic
matter in a water sample or a water body.
Biotic means relating to life and living organisms, or caused by living organisms.
Biotoxin means a toxic substance of biological origin.
Boat ramp means an inclined slab, set of pads, rails, planks, or graded slope used for launching
boats with trailers or occasionally by hand.
Boathouse means any roofed and enclosed structure built onshore or offshore for storage of
watercraft or floatplanes.
Bog means a type of wetland dominated by mosses that form peat. Bogs are very acidic, nutrient
poor systems, fed by precipitation rather than surface inflow, with specially adapted plant
communities.
Brackish marshes means a coastal wetland in which salt water, usually through tidal action, has
occasional interaction with freshwater within the wetland.
Braided channel means to branch and rejoin repeatedly to form a intricate pattern or network of
small interlacing stream channels.
Branch means a small stream that flows into another, usually larger, stream.
Buffer (buffer zone) means the area adjacent to a shoreline and/or critical area that separates and
protects the area from adverse impacts associated with adjacent land uses.
Bulkhead means a wall-like structure such as a revetment or seawall that is placed parallel to
shore (at or near the OHWM) primarily for retaining uplands and fills prone to sliding or sheet
erosion, and to protect uplands and fills from erosion by wave action.
- C -
Candidate means a species considered for listing as threatened or endangered under the US
Endangered Species Act, indicating that there is a possibility that the species has potential to be at
risk of becoming threatened or endangered in the foreseeable future.
Cascade means a waterfall, especially a small fall or one of a series of small falls descending over
steeply slanting rocks; a shortened rapid.
Catchment area means an area surrounded by a continuous ridge within which all runoff is
expected to join into a single stream, wand which extends to the point of junction of the stream
with the ridge.

Pierce County Shoreline Inventory and Characterization Report
Page D-4 June 2009
Channel migration zone means the area along a river or stream within which the channel can
reasonably be expected to migrate over time as a result of normally occurring processes. It
encompasses that area of current and historic lateral stream channel movement that is subject to
erosion, bank destabilization, rapid stream incision, and/or channel shifting, as well as adjacent
areas that are susceptible to channel erosion.
Channelization means the straightening, relocation, deepening or lining of stream channels,
including construction of continuous revetments or levees for the purpose of preventing gradual,
natural meander progression.
Coastal bluff is a scarp or steep face of rock, decomposed rock, sediment or soil resulting from
erosion, faulting, folding or excavation of the land mass and exceeding 10 feet in height.
Colluvium is a general term applied to any loose, heterogeneous, and incoherent mass of soil
material and/or rock fragments deposited by rainwash, sheetwash or slow continuous downslope
creep, usually collecting at the base of gentle slopes or hillsides.
Comprehensive plan means the guiding policy document for all land use and development
regulations in a defined area, and for regional services throughout the area including transit,
sewers, parks, trails and open space.
Confluence means a place of meeting of two or more streams; the point where a tributary joins
the main stream.
Conservation means the prudent management of rivers, streams, wetlands, wildlife and other
environmental resources in order to preserve and protect them. This includes the careful use of
natural resources to prevent depletion or harm to the environment.
Conservation easement means a legal agreement that the property owner enters into to restrict
uses of the land for purposes of natural resources conservation. The easement is recorded on a
property deed, runs with the land, and is legally binding on all present and future owners of the
property.
Contaminant means any chemical, physical, biological, or radiological substance that does not
occur naturally in ground water, air, or soil or that occurs at concentrations greater than those in
the natural levels.
County means Pierce County, Washington.
Critical aquifer recharge area means areas designated by WAC 365-190-080(2) that are
determined to have a critical recharging effect on aquifers (i.e., maintain the quality and quantity
of water) used for potable water as defined by WAC 365-190-030(2).
Critical areas The following areas as designated in the Chapter 21A.50 of the City’s code: critical
aquifer recharge areas, wetlands, geologically hazardous areas, frequently flooded areas, and fish
and wildlife habitat conservation areas.
Critical habitat means habitat areas with which endangered, threatened, sensitive or monitored
plant, fish, or wildlife species have a primary association (e.g., feeding, breeding, rearing of
young, migrating). Such areas are identified herein with reference to lists, categories, and
definitions promulgated by the Washington Department of Fish and Wildlife as identified in WAC
232-12-011 or 232-12-014; in the Priority Habitat and Species (PHS) program of the Department

Pierce County Shoreline Inventory and Characterization Report
June 2009 Page D-5
of Fish and Wildlife; or by rules and regulations adopted by the U.S. Fish and Wildlife Service,
National Marine Fisheries Service, or other agency with jurisdiction for such designations.
- D -
Dam means a barrier across a stream or river to confine or regulate flow or raise water levels for
purposes such as flood or irrigation water storage, erosion control, power generation, or collection
of sediment or debris.
Delta means the low, nearly flat, alluvial tract of land at or near the mouth of a river, commonly
forming a triangular or fan-shaped plain of considerable area, crossed by many distributaries of
the main river, perhaps extending beyond the general trend of the coast, and resulting from the
accumulation of sediment supplied by the river in such quantities that it is not removed by tides,
waves, and currents.
Debris flow means a moving mass of rock fragments, soil, and mud; more than half of the
particles being larger than sand size; a general term that describes a mass movement of sediment
mixed with water and air that flows readily on low slopes.
Deciduous means falling off or shed seasonally or at a certain stage of development in the life
cycle, as in plant leaves.
Deepwater habitats means permanently flooded lands. Deepwater habitats include environments
where surface water is permanent and often deep, so that water, rather than air, is the principal
medium in which the dominant organisms live. The boundary between wetland and deepwater
habitat in the riverine and lacustrine systems lies at a depth of two meters (6.6 feet) below low
water; however, if emergent vegetation, shrubs, or trees grow beyond this depth at any time, their
deepwater edge is the boundary.
Degradation means the lowering of a stream bed, due to such factors as increased scouring.
Deposition means the laying, pacing, or accumulation of any material.
Detrital is the adjective form of “Detritus” which is loose rock or mineral material that is worn
off or removed by mechanical means; especially fragmented material such as sand, silt, and clay,
that is derived from older rocks and moved from its place of origin.
Development means a use consisting of the construction or exterior alteration of structures,
dredging, drilling, dumping, filling; removal of any sand, gravel or minerals; bulkheading; driving
of piling; placing of obstructions; or any project of a permanent or temporary nature that interferes
with the normal public use of the surface of the waters overlying lands subject to the Act at any
state of water level.
Dike means an artificial wall, embankment, ridge, or mound, usually of earth or rock fill, built
around a relatively flat, low lying area to protect it from flooding.
Dissolved oxygen means the amount of oxygen, in parts per million by weight, dissolved in water,
now generally expressed in mg/L.
Distinct population segment means a subgroup of a vertebrate species that is treated as a species
for purposes of listing under the Endangered Species Act. It is required that the subgroup be
separable from the remainder of and significant to the species to which it belongs.

Pierce County Shoreline Inventory and Characterization Report
Page D-6 June 2009
Dock means all platform structures or anchored devices in or floating upon water bodies to
provide moorage for pleasure craft or landing for water-dependent recreation including but not
limited to floats, swim floats, float plane moorages, and water ski jumps. Excluded are launch
ramps.
Downcutting means stream erosion in which the cutting is directed in a downward direction.
Drift cell, drift sector, or littoral cell means a particular reach of marine shore in which littoral
drift may occur without significant interruption and which contains any natural sources of such
drift and also accretion shore forms created by such drift.
- E -
Ecological Functions or Shoreline Functions means the work performed or role played by the
physical, chemical, and biological processes that contribute to the maintenance of the aquatic and
terrestrial environments that constitute the shoreline's natural ecosystem. See WAC 173-26-200
(2)(c). Functions include, but are not limited to, habitat diversity and food chain support for fish
and wildlife, ground water recharge and discharge, high primary productivity, low flow stream
water contribution, sediment stabilization and erosion control, storm and flood water attenuation
and flood peak desynchronization, and water quality enhancement through biofiltration and
retention of sediments, nutrients, and toxicants. These beneficial roles are not listed in order of
priority.
Ecoregion means the next smallest ecologically and geographically defined area beneath "realm"
or "ecozone". Ecoregions cover relatively large area of land or water, and contain characteristic,
geographically distinct assemblage of natural communities and species.
Ecosystem Processes, or Ecosystem-wide processes means the suite of naturally occurring
physical and geologic processes of erosion, transport, and deposition; and specific chemical
processes that shape landforms within a specific shoreline ecosystem and determine both the types
of habitat and the associated ecological functions.
Eelgrass or Eelgrass beds are areas where Eelgrass (Zostera marina) grows in beds (clusters) in
low intertidal and shallow subtidal sandy mudflats. Like a coral reef or kelp forest, the physical
structure of the eelgrass beds provides increased living substrate and cover for myriad
invertebrates and fish. The beds also generate food and nutrients for the soft bottom community
through primary productivity and plant decay. Unlike kelp, eelgrass is a flowering, marine
vascular plant.
Embankment means a linear structure, usually of earth or gravel, constructed so as to extend
above the natural ground surface and designed to hold back water from overflowing a level tract
of land, etc.
Embayment means a bay, either the deep indentation or recess of a shoreline, or the large body of
water thus formed.
Emergent means non-woody, erect wetland plant species that typically grow emerging from
flooded areas and shallow marshes.
Emergent wetland means a wetland with at least thirty percent (30%) of the surface area covered
by erect, rooted, herbaceous vegetation as the uppermost vegetative strata.

Pierce County Shoreline Inventory and Characterization Report
June 2009 Page D-7
Endangered means listed and protected under the US Endangered Species Act, indicating that the
described species is in danger of extinction throughout all or a significant portion of its range.
Enhancement means actions performed within an existing degraded shoreline, critical area and/or
buffer to intentionally increase or augment one or more functions or values of the existing area.
Enhancement actions include, but are not limited to, increasing plant diversity and cover,
increasing wildlife habitat and structural complexity (snags, woody debris), installing
environmentally compatible erosion controls, or removing nonindigenous plant or animal species.
Erosion means a process whereby wind, rain, water and other natural agents mobilize, and
transport, and deposit soil particles.
Erosion hazard areas means lands or areas underlain by soils identified by the U.S. Department
of Agriculture Natural Resource Conservation Service (NRCS) as having
Severe or Very severe means erosion hazards and areas subject to impacts from lateral erosion
related to moving water such as river channel migration and shoreline retreat.
ESA means Endangered Species Act.
Estuaries are the zones or areas of water in which freshwater and saltwater mingle and water is
usually brackish due to the daily mixing of fresh and salt water.
Estuarine means related to estuaries (see above).
Eutrophic means having waters rich in mineral and organic nutrients that promote a proliferation
of plant life, especially algae, which reduces the dissolved oxygen content and often causes the
extinction of other organisms.
Eutrophication is the process by which water become more “eutrophic”; especially the artificial
or natural enrichment of a lake by an influx of nutrients required for the growth of aquatic plants
such as algae that are vital for fish and animal life.
Evolutionary significant unit means a population of organisms that is considered distinct for
purposes of conservation. Delineating ESUs is important when considering conservation action.
This term can apply to any species, subspecies, geographic race, or population.
Excavation means the disturbance, displacement and/or disposal of unconsolidated earth material
such as silt, sand, gravel, soil, rock or other material from all areas landward of OHWM.
- F -
Feeder bluff means a primary sediment input areas that can feed miles of beaches.
Fetch is a term used in wave-forecasting for the area of the open ocean over the surface of which
the wind blows with constant speed and direction, thereby creating a wave system.
Fill material means any solid or semi-solid material, including rock, sand, soil, clay, plastics,
construction debris, wood chips, overburden from mining or other excavation activities, and
materials used to create any structure or infrastructure, that when placed, changes the grade or
elevation of the receiving site.
Filling means the act of transporting or placing by any manual or mechanical means fill material
from, to, or on any soil surface, including temporary stockpiling of fill material.

Pierce County Shoreline Inventory and Characterization Report
Page D-8 June 2009
Fish and wildlife habitat conservation areas are areas important for maintaining species in
suitable habitats within their natural geographic distribution so that isolated populations are not
created, as designated in WCC 16.16.
Fish habitat means a complex of physical, chemical, and biological conditions that provide the
life supporting and reproductive needs of a species or life stage of fish. Although the habitat
requirements of a species depend on its age and activity, the basic components of fish habitat in
rivers, streams, ponds, and nearshore areas include, but are not limited to, the following:
Clean water and appropriate temperatures for spawning, rearing, and holding;
Adequate water depth and velocity for migrating, spawning, rearing, and holding,
including off-channel habitat;
Abundance of bank and instream structures to provide hiding and resting areas and
stabilize stream banks and beds;
Appropriate substrates for spawning and embryonic development. For stream and
lake dwelling fishes, substrates range from sands and gravel to rooted vegetation or
submerged rocks and logs. Generally, substrates must be relatively stable and free of
silts or fine sand;
Presence of riparian vegetation as defined in this article. Riparian vegetation creates a
transition zone, which provides shade, and food sources of aquatic and terrestrial
insects for fish;
Unimpeded passage (i.e. due to suitable gradient and lack of barriers) for upstream
and downstream migrating juveniles and adults.
Fisheries means all species of fish and shellfish commonly or regularly originating or harvested
commercially or for sport in Lake Sammamish and its tributary freshwater bodies, together with
the aquatic plants and animals and habitat needed for continued propagation and growth of such
species.
Fisheries Enhancement means actions taken to rehabilitate, maintain or create fisheries habitat,
including but not limited to hatcheries, spawning channels, lake rehabilitation, planting of
fisheries stocks. Fisheries Enhancement differs from Aquaculture in that the increase in fisheries
stocks eventually becomes available for public harvest.
Fjord means a long narrow winding glacially-eroded inlet or arm of the sea, U-shaped and steep-
walled, generally several hundred meters deep, between high rocky cliffs or slopes along a
mountainous coast.
Float means a floating platform similar to a dock that is anchored or attached to pilings.
Flood or Flooding mean a general and temporary condition of partial or complete inundation of
normally dry land areas from the overflow of inland waters and/or the unusual and rapid
accumulation of runoff of surface waters from any source.
Flood insurance rate map or FIRM means the map that displays the floodplains in a town or
area. Such maps are used in town planning, in the insurance industry, and by individuals who
want to avoid moving into a home at risk of flooding or to know how to protect their property.
Flooding regime means the temporal pattern during which flooding occurs.
Floodplain, FEMA means all lands along a river or stream that may be inundated by the base
flood of such river or stream.

Pierce County Shoreline Inventory and Characterization Report
June 2009 Page D-9
Floodplain Management means a long term program to reduce flood damages to life and
property and to minimize public expenses due to floods through a comprehensive system of
planning, development regulations, building standards, structural works, and monitoring and
warning systems.
Flume means an artificial inclined channel used for conveying water for industrial purposes, such
as power production.
Fluvial influences is of or pertaining to a river. The system is influenced by a river or rivers.
Forage Fish means small fish which breed prolifically and serve as food for predatory fish.
Forest Land means all land that is capable of supporting a merchantable stand of timber and is
not being actively used, developed, or converted in a manner that is incompatible with timber
production.
Forest Practices mean any activity conducted on or directly pertaining to forest land and relating
to growing, harvesting, or processing of timber; including, but not limited to: (1) road and trail
construction; (2) fertilization; (3) prevention and suppression of diseases and insects; or other
activities that qualify as a use or development subject to the Act. Excluded from this definition is
preparatory work such as tree marking, surveying and removal of incidental vegetation such as
berries, greenery, or other natural products whose removal cannot normally be expected to result
in damage to shoreline natural features. Also excluded from this definition is preparatory work
associated with the conversion of land for non-forestry uses and developments. Log storage away
from forest land is considered under Industry.
Fork means a place where too or more streams join to form a larger waterway.
Freeboard means the additional height above the recorded or design high-water mark of an
engineering structure, such as a dam, seawall, flume, or culvert, that represents an allowance
against overtopping by transient disturbances, including wave induced by waves or landslides.
Frequently flooded areas means lands in the floodplain subject to a one percent (1%) or greater
chance of flooding in any given year and those lands that provide important flood storage,
conveyance and attenuation functions, as determined by the County in accordance with WAC
365-190-080(3). Classifications of frequently flooded areas include, at a minimum, the 100-year
floodplain designations of the Federal Emergency Management Agency and the National Flood
Insurance Program, as designated in WCC 16.16.
Fry means juvenile fish.
Function assessment or Functions and values assessment mean a set of procedures, applied by
a qualified consultant, to identify the ecological functions being performed in a shoreline or
critical area, usually by determining the presence of certain characteristics, and determining how
well the area is performing those functions. Function assessments can be qualitative or
quantitative and may consider social values potentially provided by area. Function assessment
methods must be consistent with Best Available Science.

Pierce County Shoreline Inventory and Characterization Report
Page D-10 June 2009
- G -
Gabions means works composed of masses of rock, rubble, or masonry tightly enclosed usually
by wire mesh so as to form massive blocks. They are used to form walls on beaches to retard
wave erosion or as foundations for breakwaters or jetties.
Game fish means those species of fish that are classified by the Washington Department of Fish
and Wildlife as game fish (WAC 232-12-019).
Gastropod means a mollusks (as snails and slugs) usually with a univalve shell or none and a
distinct head bearing sensory organs.
Geologically hazardous areas means areas designated in WCC 16.16 that, because of their
susceptibility to erosion, sliding, earthquake, or other geological events, pose unacceptable risks to
public health and safety and may not be suited to commercial, residential, or industrial
development.
Geologically Unstable means the relative instability of a shoreform or land form for development
purposes over the long term or the intended life of any proposed structure. Soil, slope, ground or
surface water, other geologic conditions, vegetation and effects of development are common
factors that contribute to instability. Areas characterized by banks or bluffs composed of
unconsolidated alluvial or glacial deposits (till and drift material), severely fractured bedrock,
active and substantial erosion, substantially deformed trees and shrubs, or active or inactive earth
slides are likely to be considered geologically unstable.
Geomorphic mean pertaining to or like the form or figure of the earth.
Glacial outwash means the stratified detritus (chiefly sand and gravel) removed from a glacier by
meltwater streams and deposited in front of or beyond the end moraine or the margin of an active
glacier.
Glacial drift means drift transported by glacier or icebergs, and deposited directly on land or in
the sea.
Glaciation means having been covered with a glacier or subject to glacial epochs.
Glide means a gently flowing, calm reach of shallow water in a stream.
Gorge means a narrow, deep valley with nearly vertical rocky walls, enclosed by mountains,
smaller than a canyon, and more steep-sided than a ravine.
Gradient means a degree of inclination, or a rate of ascent or descent, of an inclined part of the
earth's surface with respect to the horizontal; the steepness of a slope. It is expressed as a ratio
(vertical to horizontal), a fraction (such as meters/ kilometers or feet/miles), a percentage (of
horizontal distance), or an angle (in degrees).
Grading means the movement or redistribution of the soil, sand, rock, gravel, sediment, or other
material on a site in a manner that alters the natural contour of the land.
Groins means wall-like structures extending on an angle waterward from the shore. Their purpose
is to build or preserve an accretion shoreform or berm on their updrift side by trapping littoral
drift. Groins are relatively narrow in width but vary greatly in length. Groins are sometimes built
in series as a system, and may be permeable or impermeable, high or low, and fixed or adjustable.

Pierce County Shoreline Inventory and Characterization Report
June 2009 Page D-11
Ground water means all water that exists beneath the land surface or beneath the bed of any
stream, lake or reservoir, or other body of surface water within the boundaries of the state,
whatever may be the geological formation or structure in which such water stands or flows,
percolates or otherwise moves.
Growth Management Act means RCW 36.70A, and 36.70B, as amended.
- H -
Hazardous Area means any shoreline area which is hazardous for intensive human use or
structural development due to inherent and/or predictable physical conditions; such as but not
limited to geologically hazardous areas, frequently flooded areas, and coastal high hazard areas.
Hazardous substance means any liquid, solid, gas, or sludge, including any material, substance,
product, commodity, or waste, regardless of quantity, that exhibits any of the physical, chemical
or biological properties described in WAC 173-303-090 or 173-303-100.
Headland means the source of a stream.
Headwater means the source and upper part of a stream, especially of a large stream or river,
including the upper drainage basin.
Historic Site means those sites that are eligible or listed on the Washington Heritage Register,
National Register of Historic Places or any locally developed historic registry formally adopted by
the Sammamish City Council.
Hydric soil means a soil that is saturated, flooded or ponded long enough during the growing
season to develop anaerobic conditions in the upper part. The presence of hydric soil shall be
determined following the methods described in the Washington State Wetland Identification and
Delineation Manual (RCW 36.70A.175).
Hydrologic soil groups means soils grouped according to their runoff-producing characteristics
under similar storm and cover conditions. Properties that influence runoff potential are depth to
seasonally high water table, intake rate and permeability after prolonged wetting, and depth to a
low permeable layer. Hydrologic soil groups are normally used in equations that estimate runoff
from rainfall, but can be used to estimate a rate of water transmission in soil. There are four
hydrologic soil groups:
Low runoff potential and a high rate of infiltration potential;
Moderate infiltration potential and a moderate rate of runoff potential;
Slow infiltration potential and a moderate to high rate of runoff potential; and
High runoff potential and very slow infiltration and water transmission rates.
Hydrophytic vegetation means macrophytic plant life growing in water or on a substrate that is
at least periodically deficient in oxygen as a result of excessive water content.
Hyporheic zone means the saturated zone located beneath and adjacent to streams that contain
some proportion of surface water from the surface channel mixed with shallow groundwater. The
hyporheic zone serves as a filter for nutrients, as a site for macroinvertebrate production important
in fish nutrition and provides other functions related to maintaining water quality.

Pierce County Shoreline Inventory and Characterization Report
Page D-12 June 2009
- I -
Igneous means rock or mineral that solidified from molten or partly molten material; magma.
Impervious surface means a hard surface area that either prevents or retards the entry of water
into the soil mantle as under natural conditions prior to development or that causes water to run
off the surface in greater quantities or at an increased rate of flow compared to natural conditions
prior to development. Common impervious surfaces may include, but are not limited to, roof tops,
walkways, patios, driveways, parking lots or storage areas, concrete or asphalt paving, gravel
roads, packed earthen materials, and oiled macadam or other surfaces which similarly impede the
natural infiltration of storm water. Impervious surfaces do not include surface created through
proven low impact development techniques.
Infiltration means the downward entry of water into the immediate surface of soil.
Incised stream means a river that has cut its channel through the bed of the valley floor, as
opposed to one flowing on a flood plain.
Intermittently means coming and going at intervals; not continuous.
Intertidal is the substratum from the extreme low water of spring tides to the upper limit of spray
or influence of ocean-driven salts. It includes all land that is sometimes submerged, but sometimes
exposed to air.
Inundation means a rising of water and its spreading over land not normally submerged.
Invasive species means a species that is 1) non-native (or alien) to King County and 2) whose
introduction causes or is likely to cause economic or environmental harm or harm to human
health. Invasive species can be plants, animals, and other organisms (e.g., microbes). Human
actions are the primary means of invasive species introductions.
- J -
Juvenile salmon are immature salmon; fry.
- K -
Kelp are large seaweeds (algae), belonging to the brown algae and classified in the order
Laminariales. Kelp grows in underwater forests (kelp forests) in clear, shallow oceans, requiring
nutrient-rich water below about 20 °C. It offers protection to some sea creatures, or food for
others.
- L -
Lacustrine means pertaining to lakes.
Lagoon means a narrow water body that is parallel to the shore and is between the mainland and a
barrier and parallel to the shore.
Lahar means a rapidly flowing mixture of rock debris and water that originates on the slopes of a
volcano.

Pierce County Shoreline Inventory and Characterization Report
June 2009 Page D-13
Lake means a body of standing water in a depression of land or expanded part of a stream, of
twenty acres or greater in total area. A lake is bounded by the OHWM, or where a stream enters
the lake, the extension of the lake's OHWM within the stream.
Landslide means a general term covering a wide variety of mass movement landforms and
processes involving the downslope transport, under gravitational influence of soil and rock
material en masse; included are debris flows, debris avalanches, earthflows, mudflows, slumps,
mudslides, rock slides, and rock falls.
Landslide hazard areas means areas that, due to a combination of site conditions like slope
inclination and relative soil permeability are susceptible to mass wasting.
Leeward means the direction downwind from the point of reference.
Levee means a natural or artificial embankment on the bank of a stream for the purpose of
keeping floodwaters from inundating adjacent land. Some levees have revetments on their sides.
Limnetic means relating to the pelagic or open part of a body of fresh water.
Liquefaction means a phenomenon in which the strength and stiffness of a soil is reduced by
earthquake shaking or other rapid loading.
Lithic scatter means a surface scatter of cultural artifacts and debris that consists entirely of lithic
(i.e., stone) tools and chipped stone debris.
Littoral means living on, or occurring on, the shore.
Littoral drift means material, such as gravel and sand, that is moved along the shore by a littoral
current.
Lodgment till is the glacial debris that has been smeared onto the deformable bed from the
movement of the glacier. This process occurs where the frictional drag between the bed and debris
is more than the shear stress implied by the moving ice. This stress is then great enough to inhibit
further movement of the till. The lodgment process can occur for small minute particles or for
large areas of debris rich basal ice.
LWD means large, woody debris; pieces of wood, often tree trunks, placed in a stream to help
create habitat complexity.
- M -
Macrophytic algae are algae that are distinguished by differentiation of cells into complex
'tissues' and 'organs' more similar to higher plants. These forms are usually attached via a
specialized 'holdfast'.
Main stem means the principal course of a stream.
Marine means of or relating to the sea.
Marine catch area means the geographic area, defined by Washington Department of Fish and
Wildlife, where fishing occurs.
Marine riparian means vegetated lands on the banks of marine water.

Pierce County Shoreline Inventory and Characterization Report
Page D-14 June 2009
Marsh means a low flat wetland area on which the vegetation consists mainly of herbaceous
plants such as cattails, bulrushes, tules, sedges, skunk cabbage or other hydrophytic plants.
Shallow water usually stands on a marsh, at least during part of the year.
Mass wasting means downslope movement of soil and rock material by gravity. This includes
soil creep, erosion, and various types of landslides, not including bed load associated with natural
stream sediment transport dynamics.
Mean annual flow means the average flow of a river, or stream (measured in cubic feet per
second) from measurements taken throughout the year. If available, flow data for the previous ten
(10) years should be used in determining mean annual flow.
Meander means one of a series of regular freely developing sinuous curves, bends, loops, or
windings in the course of a stream.
Meltwater means the water derived from the melting of snow or ice, especially glacial stream
flowing in, under, or from melting glacier ice.
Mesotrophic is a lake classification describing middle-aged bodies of water; between
oligotrophic (young) and eutrophic (old) classifications. A body of water having a moderate
amount of dissolved nutrients.
MHHW means Mean Higher High Water; a tidal datum. The average of the higher high water
height of each tidal day observed over the National Tidal Datum Epoch. For stations with shorter
series, simultaneous observational comparisons are made with a control tide station in order to
derive the equivalent datum of the National Tidal Datum Epoch.
MLLW means Mean Lower Low Water; a tidal datum. The average of the lower low water height
of each tidal day observed over the National Tidal Datum Epoch. For stations with shorter series,
simultaneous observational comparisons are made with a control tide station in order to derive the
equivalent datum of the National Tidal Datum Epoch.
Mitigation means individual actions that may include a combination of the following measures,
listed in order of preference:
Avoiding an impact altogether by not taking a certain action or parts of actions;
Minimizing impacts by limiting the degree or magnitude of an action and its
implementation;
Rectifying impacts by repairing, rehabilitating, or restoring the affected environment;
Reducing or eliminating an impact over time by preservation and maintenance
operations during the life of the action;
Compensating for an impact by replacing or providing substitute resources or
environments; and
Monitoring the mitigation and taking remedial action when necessary.
Mooring means a vessel is fastened to a fixed object such as a pier or quay, or to a floating object
such as an anchor buoy.
Mud Flats means a wide area of fine sediment exposed at low tide, on the seaward side of a coast
in sheltered waters.

Pierce County Shoreline Inventory and Characterization Report
June 2009 Page D-15
- N -
Natal is pertaining to birth.
Nearshore habitats is the habitat that lies along the shoreline and includes the strip of shallow
water and the land immediately adjacent to shoreline.
Net-shore drift is the measurement over time of shore drift, or littoral drift, which is the process
by which beach sediment is moved along the shoreline. Drift results primarily from the oblique
approach of wind-generated waves and can therefore change in response to short-term (daily,
weekly, or seasonally) shifts in wind direction. Over the long term, however, many shorelines
exhibit a single direction of net shore drift. Net shore-drift is determined through geomorphologic
analysis of beach sediment patterns and of coastal landforms.
Native vegetation means plant species that are indigenous to the King County and the local area.
No net loss means the maintenance of the aggregate total of the City’s shoreline ecological
functions. The no net loss standard requires that the impacts of shoreline development and/or use,
whether permitted or exempt, be identified and mitigated such that there are no resulting adverse
impacts on ecological functions or processes. Each project shall be evaluated based on its ability
to meet the no net loss goal.
Non-point source means a diffuse source of containments without a single point of origin or not
introduced into a receiving stream from a specific outlet.
- O -
Off-channel habitat means areas distinctly separate from the main channel that lie outside the
main channel cross-sectional profile; such as sloughs, meander cutoffs, and secondary or
abandoned channels
Oligotrophic means lacking in plant nutrients and having a large amount of dissolved oxygen
throughout.
Open Space means any parcel or area of land or water not covered by structures, hard surfacing,
parking areas and other impervious surfaces except for pedestrian or bicycle pathways, or where
otherwise provided by this title or other county ordinance and set aside, dedicated, for active or
passive recreation, visual enjoyment or critical area development buffers.
Ordinary High Water Mark or OHWM on all lakes and streams means that mark that will be
found by examining the bed and banks and ascertaining where the presence and action of waters
are so common and usual, and so long continued in all ordinary years, as to mark upon the soil a
character distinct from that of the abutting upland, in respect to vegetation as that condition exists
on June 1, 1971, as it may naturally change thereafter, or as it may change thereafter in
accordance with approved development; provided that, in any area where the OHWM cannot be
found, the OHWM adjoining fresh water shall be the line of mean high water. For braided
streams, the OHWM is found on the banks forming the outer limits of the depression within which
the braiding occurs.
Oxbow means a closely looping stream meander resembling the U-shaped frame embracing an
ox’s neck, having an extreme curvature such that only a neck of land is left between two parts of
the stream.

Pierce County Shoreline Inventory and Characterization Report
Page D-16 June 2009
- P -
Pacific Sand Lance are schooling forage fish that, as the name suggests, are distinguished by a
slender sword-shaped body, 5-8 inches in length.
Palustrine means wetlands that include inland marshes and swamps as well as bogs, fens, tundra
and floodplains. Palustrine systems include any inland wetland which lacks flowing water,
contains ocean derived salts in concentrations of less than .05%, and is nontidal.
Peat means an accumulation of partially decayed vegetation matter.
Pelagic habitats are habitats that found in zones of open sea or ocean that are not near the coast.
Perched aquifer means ground water separated from an underlying body of ground water by an
unsaturated zone.
Perennial means present at all seasons of the year.
Permeability means the property or capacity of a porous rock, sediment, or soil for transmitting a
fluid; it is a measure of the relative ease of fluid flow under unequal pressure and is a function
only of the medium.
Plug means a mass of sediment filling the part of a stream channel abandoned by the formation of
a cutoff.
Pocket estuaries are small sub-estuaries and are the result of mid to small-scale (as compared to
large river deltas) interactions between marine and freshwater influence at low elevations along
the shoreline. These processes create and sustain a physical structure that appears similar to large
river deltas in that pocket estuaries usually contain emergent marsh, sand or mudflats, a channel
structure, uplands and open water in close proximity. These features may or may not contain
freshwater input.
Point source means a stationary location or fixed facility from which contaminants are
discharged; any single identifiable source of contamination.
Pool / riffle means an areas of stream or river habitat, in which a pool is where water flows
through the channel without any change in surface gradient and a riffle is where water flows
through the channel at a higher velocity with a moderate gradient.
Pre-contact materials mean such as continued to exist ¡n any tribe down to the time when they
were touched by the presence of the trade of the whites.
Preservation means actions taken to ensure the permanent protection of existing, ecologically
important areas that the County has deemed worthy of long term protection.
Priority habitat means a habitat type with unique or significant value to one or more species. An
area classified and mapped as priority habitat must have one or more of the following attributes:
Comparatively high fish or wildlife density; comparatively high fish or wildlife species diversity;
fish spawning habitat; important wildlife habitat; important fish or wildlife seasonal range;
important fish or wildlife movement corridor; rearing and foraging habitat; refuge; limited
availability; high vulnerability to habitat alteration; unique or dependent species; or shellfish bed.
A priority habitat may be described by a unique vegetation type or by a dominant plant species
that is of primary importance to fish and wildlife (such as oak woodlands or eelgrass meadows). A
priority habitat may also be described by a successional stage (such as, old growth and mature

Pierce County Shoreline Inventory and Characterization Report
June 2009 Page D-17
forests). Alternatively, a priority habitat may consist of a specific habitat element (such as talus
slopes, caves, snags) of key value to fish and wildlife. A priority habitat may contain priority
and/or non-priority fish and wildlife (WAC 173-26-020(24).
Priority species means wildlife species of concern due to their population status and their
sensitivity to habitat alteration, as defined by the Washington Department of Fish and Wildlife.
Public Access means the public's right to get to and use the State's public waters, both saltwater
and freshwater, the water/land interface and associated shoreline area. It includes physical access
that is either lateral (areas paralleling the shore) or perpendicular (an easement or public corridor
to the shore), and/or visual access facilitated by scenic roads and overlooks, viewing towers and
other public sites or facilities.
- Q -
Quaternary means the geologic time period from the end of the Pliocene Epoch roughly 1.806
million years ago to the present.
- R -
Ravine means a small narrow deep depression, smaller than a gorge or a canyon but larger than a
gully, usually carved by running water; especially the narrow excavated channel of a mountain
stream.
Reach means a segment of shoreline and associated planning area that is mapped and described as
a unit (for purposes of inventorying conditions) due to homogenous characteristics that include
land use and/or natural environment characteristics.
Rearing habitat means areas where juvenile fish grow and mature.
Recessional outwash sediments deposited as the glaciers receded which lie on top of glacial till,
and are usually found in terraces along the margins of stream valleys.
Recharge means the process involved in the absorption and addition of water from the
unsaturated zone to ground water.
Recreation means an experience or activity in which an individual engages for personal
enjoyment and satisfaction. Most shore-based recreation outdoor recreation such as: fishing,
hunting, clamming, beach combing, and rock climbing; various forms of boating, swimming,
hiking, bicycling, horseback riding, camping, picnicking, watching or recording activities such as
photography, painting, bird watching or viewing of water or shorelines, nature study and related
activities.
Re-establishment means measures taken to intentionally restore an altered or damaged natural
feature or process including:
Active steps taken to restore damaged wetlands, streams, protected habitat, and/or
their buffers to the functioning condition that existed prior to an unauthorized
alteration;
Actions performed to re-establish structural and functional characteristics of the
critical area that have been lost by alteration, past management activities, or other
events; and

Pierce County Shoreline Inventory and Characterization Report
Page D-18 June 2009
Restoration can include restoration of wetland functions and values on a site where
wetlands previous existed, but are no longer present due to lack of water or hydric
soils.
Refuge means a place that provides shelter or protection from danger or distress.
Rehabilitation means a type of restoration action intended to repair natural or historic functions
and processes. Activities could involve breaching a dike to reconnect wetlands to a floodplain or
other activities that restore the natural water regime.
Resident fish means a fish species that completes all stages of its life cycle within freshwater and
frequently within a local area.
Residential Development means buildings, earth modifications, subdivision and use of land
primarily for human residence; including, but not limited to: single family and multifamily
dwellings, mobile homes and mobile home parks, boarding homes, family daycare homes, adult
family homes, retirement and convalescent homes, together with accessory uses common to
normal residential use. Camping sites or clubs, recreational vehicle parks, motels, hotels and other
transient housing are not included in this definition.
Restore, Restoration or Ecological Restoration means the re-establishment or upgrading of
impaired ecological shoreline processes or functions. This may be accomplished through measures
including, but not limited to, revegetation, removal of intrusive shoreline structures and removal
or treatment of toxic materials. Restoration does not imply a requirement for returning the
shoreline area to aboriginal or pre- European settlement conditions.
Restoration also means any activity that ensures that the watershed processes associated with a
key area are reinstated.
Retention means that part of the precipitation falling on a drainage area that does not escape as
surface runoff during a given period.
Revetment means a facing (as of stone or concrete) to sustain an embankment.
Rip Rap means dense, hard, angular rock free from cracks or other defects conductive to
weathering used for revetments or other flood control works.
Riparian corridor or Riparian zone mean the area adjacent to a water body (stream, lake or
marine water) that contains vegetation that influences the aquatic ecosystem, nearshore area
and/or and fish and wildlife habitat by providing shade, fine or large woody material, nutrients,
organic debris, sediment filtration, and terrestrial insects (prey production). Riparian areas include
those portions of terrestrial ecosystems that significantly influence exchanges of energy and
matter with aquatic ecosystems (i.e., zone of influence). Riparian zones provide important wildlife
habitat. They provide sites for foraging, breeding and nesting; cover to escape predators or
weather; and corridors that connect different parts of a watershed for dispersal and migration.
Riparian vegetation means vegetation that tolerates and/or requires moist conditions and periodic
free flowing water thus creating a transitional zone between aquatic and terrestrial habitats which
provides cover, shade and food sources for aquatic and terrestrial insects for fish species. Riparian
vegetation and their root systems stabilizes stream banks, attenuates high water flows, provides
wildlife habitat and travel corridors, and provides a source of limbs and other woody debris to
terrestrial and aquatic ecosystems, which, in turn, stabilize stream beds.

Pierce County Shoreline Inventory and Characterization Report
June 2009 Page D-19
River mile means the distance measured from the mouth of a river, traveling upstream.
Riverine located on or inhabiting the banks of a river.
Runoff means surface waters that flow overland during rain events and storms.
- S -
Salmon or salmonid is the common name for several species of fish of the family Salmonidae.
Typically, salmon are anadromous: they are born in fresh water, migrate to the ocean, then return
to fresh water to reproduce.
Salt marsh is the transitional zone between land and salty or brackish water (e.g., sloughs, bays,
estuaries).
Scour means the powerful and concentrated clearing and digging action of flowing water or ice,
especially the downward erosion by stream water in sweeping away mud and silt on the outside
curve of a bend, or during time of flood.
Sediment load means the material that is moved or carried by a natural transporting agent, such
as a stream, waves, tides, and currents.
Sediment transport is the movement and carrying away of sediment by natural agents; especially
the conveyance by stream.
Sedimentary rock means rock resulting from the consolidation of loose sediment that has
accumulated in layers.
Seep means an area, generally small, where water or oil percolates slowly to the land surface.
Seismic means of, subject to, or caused by an earthquake; also : of or relating to an earth
vibration.
Shell middens means places where the debris from eating shellfish and other food has
accumulated over time. They can contain shellfish remains; bones of fish, birds, and land and sea
mammals used for food; charcoal from campfires; and tools made from stone, shell, and bone.
Shoreline Environment Designation means existing designations in the County for currently
regulated shorelines specifically: Rural, Rural Residential, Urban, Conservancy, and Natural.
Shoreline Modification means any human activity that changes the structure, hydrology, habitat,
and/or functions of a shoreline. Bulkheads, piers, docks, shoreline stabilization systems, berms,
and dikes are all examples of shoreline modifications
Shoreline Stabilization are structural or non-structural modifications to the existing shoreline
intended to reduce or prevent erosion of uplands or beaches. They are generally located parallel to
the shoreline at or near the OHWM. Other construction classified as shore defense works include
groins, jetties and breakwaters, which are intended to influence wave action, currents and/or the
natural transport of sediments along the shoreline.
Shorelands or Shoreland areas mean those lands extending landward for 200 feet in all
directions as measured on a horizontal plane from the ordinary high water mark; floodways and
contiguous floodplain areas landward 200 feet from such floodways; and all wetlands and river
deltas associated with the streams, lakes and tidal waters which are subject to the provisions of
Chapter 90.58 RCW.

Pierce County Shoreline Inventory and Characterization Report
Page D-20 June 2009
Shorelines are all of the water areas of the state as defined in RCW 90.58.030, including
reservoirs and their associated shorelands, together with the lands underlying them except:
Shorelines of statewide significance;
Shorelines on segments of streams upstream of a point where the mean annual flow is
twenty cubic feet per second (20 cfs) or less and the wetlands associated with such
upstream segments; and
Shorelines on lakes less than twenty (20) acres in size and wetlands associated with
such small lakes.
Shoreline Administrator means the Director of the Planning & Development Services
Department or staff member designated by the Director to perform the review functions required
in this program.
Shoreline Jurisdiction means all shorelines of the state and shorelands.
Shorelines of Statewide Significance means the following shorelines in the City of Sammamish:
those lakes, whether natural, artificial, or a combination thereof, with a surface acreage of 1,000
acres or more measured at the ordinary high water mark including Lake Sammamish.
Shorelines of the State means the total of all “Shorelines” and “Shorelines of Statewide
Significance” within the State.
Sill means in geology, a tabular pluton that has intruded between older layers of sedimentary rock,
beds of volcanic lava or tuff, or even along the direction of foliation in metamorphic rock.
Site means any parcel or combination of contiguous parcels, or right-of-way or combination of
contiguous rights-of-way under the applicant’s/proponent’s ownership or control where the
proposed project impacts an environmentally critical area.
Slope means thee inclined surface of any part of the earth's surface, delineated by establishing its
toe and top and measured by averaging the inclination over at least 10 feet of vertical relief.
Smolt means a young salmon or sea trout about two years old that is at the stage of development
when it assumes the silvery color of the adult and is ready to migrate to the sea.
Snag means a standing, partly or completely dead tree, often missing a top or most of the smaller
branches in forest ecology, while in freshwater ecology it refers to trees, branches and other pieces
of naturally occurring wood found in a sunken form in rivers and streams.
Species of concern means an informal term, not defined in the federal Endangered Species Act.
The term commonly refers to species that are declining or appear to be in need of concentrated
conservation actions. Many agencies and organizations maintain lists of these at-risk species.
Spit means a deposition landform found off coasts. A spit is a type of bar or beach that develops
where a re-entrant occurs, such as at a cove, headlands and known as longshore drift.
Spring means a place where ground water flows naturally from a rock or the soil onto the land
surface or into a body of surface water.
Stormwater means water that accumulates on land as a result of storms, and can include runoff
from urban areas such as roads and roofs.
Streams are those areas where surface waters produce a defined channel or bed. A defined
channel or bed is an area that demonstrates clear evidence of the annual passage of water and

Pierce County Shoreline Inventory and Characterization Report
June 2009 Page D-21
includes, but is not limited to, bedrock channels, gravel beds, sand and silt beds, and defined
channel swales. The channel or bed need not contain water year round. This definition includes
drainage ditches or other artificial water courses where natural streams existed prior to human
alteration, and/or the waterway is used by anadromous or resident salmonid or other fish
populations.
Substantially Degrade means to cause significant ecological impact.
Substrate means the underlying bed layer that makes up the bottom of a lake or stream,
frequently composed of rock, gravel, sand, organic material, or a combination of these materials.
Subtidal is any substratum that is constantly submersed.
Surf smelt are a schooling fish found in shallow nearshore waters along Puget Sound.
Suspended solids means insoluble solids that either float on the surface of, or are in suspension
in, water, wastewater, or other liquids.
- T -
Talus means rock fragments of any size or shape (usually coarse or angular) derived from and
lying at the base of a cliff or very steep, rocky slope.
Threatened means listed and protected under the US Endangered Species Act, indicating that the
described species is likely to become endangered in the foreseeable future.
Tidal flats means areas of nearly flat, barren mud periodically covered by tidal waters. Normally
these places have an excess of soluble salt.
Tidewater means water that overflows the land during flood tide; water that covers the tideland.
Till means dominantly unsorted and unstratified drift, generally unconsolidated, deposited directly
by and underneath a glacier without subsequent reworking by meltwater, and consisting of a
heterogeneous mixture of lay, silt, sand, gravel, and boulders ranging widely in size and shape.
Toe means the lowest part of a slope or cliff; the downslope end of an alluvial fan, landslide, etc.
Top means the top of a slope; or in this chapter it may be used as the highest point of contact
above a landslide hazard area.
Total Maximum Daily Load or TMDL is a calculation of the maximum amount of a pollutant
that a waterbody can receive and still meet water quality standards, and an allocation of that
amount to the pollutant's sources. Water quality standards are set by States, Territories, and
Tribes. They identify the uses for each waterbody, for example, drinking water supply, contact
recreation (swimming), and aquatic life support (fishing), and the scientific criteria to support that
use. A TMDL is the sum of the allowable loads of a single pollutant from all contributing point
and nonpoint sources.
Tributary means a stream feeding, joining, or flowing into a larger stream or into a lake.
Trophic of or relating to nutrition; “Trohpic level” means the position that an organism occupies
in a food chain.
Turbidity means the state, condition, or quality of opaqueness or reduced clarity of a fluid, due to
the presence of suspended matter.

Pierce County Shoreline Inventory and Characterization Report
Page D-22 June 2009
- U -
Unconsolidated material means loosely arranged; not stratified.
Unincorporated means a region of land that is not a part of any municipality. To "incorporate" in
this context means to form a municipal corporation, i.e., a city or town with its own government.
Thus, an unincorporated community is usually not subject to or taxed by a city government.
Upland means dry lands landward of OHWM.
Urban growth boundary means a local government regulatory measure for delineating limits for
urban growth over a period of time. Land within the UGB is made available for urban
development while land outside the UGB remains primarily rural for farming, forestry, or low-
density residential development
Utilities means all lines and facilities used to distribute, collect, transmit, or control electrical
power, natural gas, petroleum products, information (telecommunications), water, and sewage.
- V -
Vegetative Stabilization means planting of vegetation to retain soil and retard erosion, reduce
wave action, and retain bottom materials. It also means utilization of temporary structures or
netting to enable plants to establish themselves in unstable areas.
Volcaniclastic means all volcanic particles regardless of their origin
- W -
Water Body means a body of still or flowing water, fresh or marine, bounded by the OHWM.
Water Quality means the characteristics of water, including flow or amount and related, physical,
chemical, aesthetic, recreation-related, and biological characteristics.
Watershed means a geographic region within which water drains into a particular river, stream or
body of water.
Weir means a structure in a stream or river for measuring or regulating stream flow.
Wetlands means areas that are inundated or saturated by surface water or ground water at a
frequency and duration sufficient to support, and that under normal circumstances support, a
prevalence of vegetation typically adapted for life in saturated soil conditions. Wetlands generally
include swamps, marshes, bogs and similar areas. Wetlands do not include those artificial
wetlands intentionally created for non-wetland sites, including, but not limited to, irrigation and
drainage ditches, grass lines swales, canals, detention facilities, wastewater treatment facilities,
farm ponds, and landscape amenities or those wetlands created after July 1, 1990, that were
unintentionally created as a result of the construction of a road, street, or highway. Wetlands may
include those artificial wetlands intentionally created from non-wetland areas to mitigate the
conversion of wetlands.
Wetland buffer means a designated area contiguous or adjacent to a wetland that is required for
the continued maintenance, function, and ecological stability of the wetland.
Wetland class means the general appearance of the wetland based on the dominant vegetative life
form or the physiography and composition of the substrate. The uppermost layer of vegetation that
possesses an aerial coverage of thirty percent (30%) or greater of the wetland constitutes a

Pierce County Shoreline Inventory and Characterization Report
June 2009 Page D-23
wetland class. Multiple classes can exist in a single wetland. Types of wetland classes include
forest, scrub/shrub, emergent, and open water.
Wetland enhancement See " mitigation."
Windthrow means a natural process by which trees are uprooted or sustain severe trunk damage
by the wind.
WRIA means Water Resource Inventory Area.

Pierce County Shoreline Inventory and Characterization Report
June 2009 Appendix E
APPENDIX E:
FRESHWATER RIVER FUNCTIONAL ASSESSMENT TABLES


Pierce County Shoreline Inventory and Characterization Report
June 2009 Page E-1
APPENDIX E: FRESHWATER RIVER FUNCTIONAL ASSESSMENT TABLES TABLE OF CONTENTS
WRIA 10 Analysis
WRIA 11 Analysis
WRIA 12 Analysis
WRIA 15 Analysis

Pierce County Shoreline Inventory and Characterization Report
June 2009 Appendix E – WRIA 10, Page 1 of 28
WRIA 10 – Puyallup River Shoreline
Name Ecosystem Process &
Shoreline Function Level of Alteration Potential Protection and Restoration Measures and Opportunities
Puyallup River
Hydrology: Channel migration and floodplain connection
Moderate to High Degree of channel modification increases from upstream to downstream entering into urbanized areas. The mouth of the Puyallup River is highly altered through Tacoma and Port of Tacoma industrial lands. The remainder of the Lower Puyallup flows through leveed agricultural and urban lands upstream of Tacoma to the confluence with the Carbon River at Orting. Levees have resulted in modified hydrology, water quality, habitat, and organic processes. High flows that had engaged a broad floodplain through riparian and floodplain forests now are trapped within a hardened channel. Lack of floodplain connection has resulted in increase sediments in the channel bottom, thereby raising the water level and threatening levee integrity.
High Restore natural floodplain and channel migration zone by levee setbacks and levee removal where possible.
Hydrology: Aquifer recharge
Low to Moderate The upper Puyallup River is largely undeveloped with only 2% of land area in impervious surface with 89% of watershed in forest cover, grasslands, or undeveloped. The mid-Puyallup River is 40% developed and only 42% of the basin area remaining in forest cover or grassland.
High Preservation of natural vegetated cover will preserve infiltration abilities in the upper watershed. Prevent development that intercepts shallow subsurface flows, including ditches, roads and foundations.

Pierce County Shoreline Inventory and Characterization Report
Appendix E – WRIA 10, Page 2 of 28 June 2009
Shoreline Name
Ecosystem Process & Shoreline Function Level of Alteration Potential Protection and Restoration
Measures and Opportunities Hydrology:
Flood flow retention
High Key alterations to hydrology include the installation of dams on the White River and the Puyallup, which changed the timing and volume of flows in the Puyallup River. The Mud Mountain Dam was installed in 1962 changing high flows in the White River. The Electron Dam was installed in 1904 changing high flows in the Puyallup. Also, an increasing demand in groundwater has reduced the summer low flows on the Puyallup (Kerwin, 1999).
Due to aggradation of sediments caused by lack of floodplain connection, and coupled with the increase of sediments from the White River, flood flow retention is diminishing over time in the river channel. Pierce County is studying sediment aggradation in the Puyallup.
Moderate Increase floodplain connections in lower Puyallup River. Implement levee setback projects and restore associated wetlands to increase flood flow retention.
Sediment Generation and Transport: Upland sediment generation
Moderate to High The lack of connection to the floodplain, coupled with significant coarse sediment loading from the White and Carbon Rivers, has resulted in overall channel aggradation in portions of the Lower Puyallup. This process had historically been offset by in-channel gravel removal. Gravel removal has not been allowed since 1997, so the channel capacity within the levees will be reduced over time (GeoEngineers, 2003). Levees prevent sediment transport to the Puyallup from upland sources. Channel avulsion of the White River into the Puyallup River, potentially doubling flow and sediment load in the lower Puyallup (Kerwin, 1999, King County, 2006).
High Implementation and retrofit of water quality BMPs to the existing stormwater system can reduce fine sediment loading. Land use measures for upper watershed – encourage sustainable forest practices and limit road crossings. The County is currently studying the sediment transport issue in the Puyallup River to determine alternatives for reducing load.

Pierce County Shoreline Inventory and Characterization Report
June 2009 Appendix E – WRIA 10, Page 3 of 28
Shoreline Name
Ecosystem Process & Shoreline Function Level of Alteration Potential Protection and Restoration
Measures and Opportunities Water Quality:
Removal of pollutants through sedimentation and adsorption and temperature regulation.
Moderate Wetlands along the lower Puyallup have been altered through industrial uses, urban development and agricultural practices. Sediment and pollutant sources are filtered in these wetlands. Puyallup River has two 303(d) listings (Category 5 listings) for impaired water quality: fecal coliform and mercury. In addition, the river has one Category 4C listing for instream flow; six Category 2 listings: copper, dissolved oxygen, lead, mercury, temperature, and turbidity; and thirteen Category 1 listings: ammonia-N, arsenic, cadmium, chromium, copper, dissolved oxygen, fecal coliform, lead, mercury, nickel, pH, temperature, and zinc (Department of Ecology, 2004). The Clean Water Act Section 305(b) Report published by Ecology in 1992 indicated that the Puyallup River, along with the White River and Hylebos Creek, had water quality impairments due to high fecal coliform counts. One of the sources for this water quality impairment was discharge by municipalities and industries.
High Encouraging the preservation of riverine and other wetlands within the contributing basin can increase water contact time with soil. Implement measures to reduce non-point sources of pollution such as replacing failing septic systems, developing BMPs for agricultural operations, and replanting riparian zones. Treat surface water runoff from urban and urbanizing areas that serve as a source of heavy metals to the Puyallup River.
Habitat: Shoreline riparian habitat for wildlife; vegetation provides habitat structure and food sources.
Moderate Native riparian vegetation has been removed in reaches within developed areas and agricultural lands in the mid-Puyallup Basin. Levees have separated shoreline vegetation from the river. However, many sections of the upper river retain the natural riparian vegetation.
Moderate to High Replanting and enhancement of riparian buffers and associated wetlands can increase habitat values for wildlife.

Pierce County Shoreline Inventory and Characterization Report
Appendix E – WRIA 10, Page 4 of 28 June 2009
Shoreline Name
Ecosystem Process & Shoreline Function Level of Alteration Potential Protection and Restoration
Measures and Opportunities Habitat:
Source and delivery of LWD
Moderate White River is an important river in Pierce County for salmonid migration and rearing. Spawning does not occur; however, juvenile fish use the Puyallup river estuary in Commencement Bay for rearing and adults migrate upstream to spawning habitat on the White River and South Prairie Creek. A total of 5 salmonid species are documented to migrate or rear within the Puyallup River including coho, fall chum, pink salmon, winter steelhead and fall Chinook. LWD is lacking as is instream habitat for salmonids within the lower sections of the White River.
High The potential exists to re-introduce LWD, either through planting or placement. Forested riparian cover is lacking in agricultural zones and where levees exist. Implement measures to encourage riparian re-vegetation and tree planting.

Pierce County Shoreline Inventory and Characterization Report
June 2009 Appendix E – WRIA 10, Page 5 of 28
WRIA 10 – White River Shoreline
Name Ecosystem Process &
Shoreline Function Level of Alteration Potential Protection and Restoration Measures and Opportunities
White River All reaches: including tributaries such as Clearwater and West Fork White
Hydrology: Channel migration and floodplain connection
Moderate The mid White River retains a wide channel migration zone. However, levees are documented in the lower sections of the river. Levees have resulted in modified hydrology, water quality, habitat, and organic processes. High flows that had engaged a broad floodplain through riparian and floodplain forests now are trapped within a hardened channel. Further flow diversion for water supply to Lake Tapps also affects the river’s ability to maintain flows for channel migration actions.
High Preserve natural floodplain and channel migration zone. Restore channel through levee setbacks and levee removal where possible. Maintaining adequate flow in the White River helps preserve the river’s ability to migrate.
Hydrology: Aquifer recharge
Moderate The White has an undeveloped upper basin with only 14% of land area in impervious surface with 38% of watershed in forest cover, grasslands, or undeveloped.
High Preservation of natural vegetated cover will preserve infiltration abilities in the upper watershed. Prevent development that intercepts shallow subsurface flows, including ditches, roads and foundations.
Hydrology: Flood flow retention
High Key alterations to hydrology include the installation of dams on the White River and the Puyallup, which changed the timing and volume of flows in both the White and the Puyallup River. The Mud Mountain Dam was installed in 1962 changing high flows in the White River (Kerwin, 1999).
Moderate Increase floodplain connections in lower White River Implement levee setback projects and restore associated wetlands to increase flood flow retention.
Sediment Generation and Transport: Upland sediment generation
Moderate to High Significant coarse sediment loading occurs from the White and Carbon Rivers due to the dynamic river systems that they are. This process had historically been offset by in-channel gravel removal. Levees prevent sediment transport to the river from upland sources. Channel avulsion of the White River into the Puyallup River, potentially doubling flow and sediment load in the lower Puyallup (Kerwin, 1999, King County, 2006)
High Implementation and retrofit of water quality BMPs to the existing stormwater system can reduce fine sediment loading. Land use measures for upper watershed – encourage sustainable forest practices and limit road crossings.

Pierce County Shoreline Inventory and Characterization Report
Appendix E – WRIA 10, Page 6 of 28 June 2009
Shoreline Name
Ecosystem Process & Shoreline Function Level of Alteration Potential Protection and Restoration
Measures and Opportunities Water Quality:
Removal of pollutants through sedimentation and adsorption and temperature regulation.
Moderate Wetlands along the lower White River have been altered through industrial uses, urban development and agricultural practices. Sediment and pollutant sources are filtered in these wetlands. White River has two 303(d) listings (Category 5 listings) for impaired water quality: fecal coliform, pH and temperature. The Clean Water Act Section 305(b) Report published by Ecology in 1992 indicated that the White River and Hylebos Creek had water quality impairments due to high fecal coliform counts. One of the sources for this water quality impairment was discharge by municipalities and industries.
High Encouraging the preservation of riverine and other wetlands within the contributing basin can increase water contact time with soil. Implement measures to reduce non-point sources of pollution such as replacing failing septic systems, developing BMPs for agricultural operations, and replanting riparian zones. Treat surface water runoff from urban and urbanizing areas that serve as a source of heavy metals to the White River.
Habitat: Shoreline riparian habitat for wildlife; vegetation provides habitat structure and food sources.
Moderate Native riparian vegetation has been removed in reaches within developed areas and agricultural lands in the mid-White River Basin. Levees have separated shoreline vegetation from the river. However, many sections of the upper river retain the natural riparian vegetation.
Moderate to High Replanting and enhancement of riparian buffers and associated wetlands can increase habitat values for wildlife.
Habitat: Source and delivery of LWD
Moderate The mainstem White River is generally unconfined and contains many braided complex channels forming abundant spawning gravels. Habitat is limited in the lower 11 miles where levees occur. A total of 7 salmonid species are documented to migrate or rear or spawn within the White River. The River provides rearing habitat for spring Chinook, and spawning and rearing habitat for coho and winter steelhead. LWD is lacking as is instream habitat for salmonids within the lower sections of the White River.
High The potential exists to re-introduce LWD, either through planting or placement. Forested riparian cover is lacking in agricultural zones and where levees exist. Implement measures to encourage riparian re-vegetation and tree planting.

Pierce County Shoreline Inventory and Characterization Report
June 2009 Appendix E – WRIA 10, Page 7 of 28
WRIA 10 – Hylebos
Shoreline
Name
Ecosystem Process & Shoreline Function Level of Alteration Potential Protection and Restoration
Measures and Opportunities
Hylebos Creek All reaches
Hydrology: Channel migration and floodplain connection
Moderate The lower miles of the Hylebos have been channelized. Where these channel containments exist, the stream is inhibited for occupying historical floodplain areas within these reaches. However, the large 62-acre wetland at Interstate 5 provides floodplain connection.
Low to Moderate Restore natural floodplain and channel migration zone removal of structures where possible.
Hylebos-Frontal Commencement Bay Sub-basin
Hydrology: Aquifer recharge
High Sub-basin is highly urbanized with 39% of land area developed (impervious surface) with 14% of watershed in forest cover, grasslands, or undeveloped.
High Restore native riparian vegetation. Remove impervious surface where practical and use low impact development techniques to infiltrate stormwater.
Hydrology: Flood flow retention
Moderate Channel-floodplain interaction is modified at the mouth; however, the natural connection to the river floodplain exists near Milton where a large wetland acts as a regional detention pond.
Moderate Preserve floodplains along shoreline of Hylebos. Restore associated wetlands to increase flood flow retention.
Sediment Generation and Transport: Upland sediment generation
Low to Moderate Sediment loading to Hylebos occurs due to urban development, thereby negatively affecting water quality and habitat.
Moderate Implementation and retrofit of water quality BMPs to the existing stormwater system can reduce fine sediment loading.
Water Quality: Removal of pollutants through sedimentation and adsorption and temperature regulation.
Moderate Wetlands along Hylebos serve to filter pollutants from stormwater runoff. Hylebos is on the Category 5, 303d list for fecal coliform. Water is also contaminated with heavy metals such as copper, zinc and lead.
High Encouraging the preservation of riverine and other wetlands within the contributing basin can increase water contact time with soil. Retrofitting stormwater systems to include higher levels of water improvement required Implement measures to reduce non-point sources of pollution such as replacing failing septic systems, developing BMPs for agricultural operations, and replanting riparian zones.
Habitat: Shoreline riparian habitat for wildlife; vegetation provides habitat structure and food sources.
Moderate to High Native riparian vegetation has been removed most of the shoreline area
Moderate to High Replanting and enhancement of riparian buffers and associated wetlands can increase habitat values for wildlife.

Pierce County Shoreline Inventory and Characterization Report
Appendix E – WRIA 10, Page 8 of 28 June 2009
Shoreline
Name
Ecosystem Process & Shoreline Function Level of Alteration Potential Protection and Restoration
Measures and Opportunities
Habitat: Source and delivery of LWD
High The Hylebos provides rearing and spawning habitat for a total of 5 salmonid species including coho, fall chum, pink salmon, winter steelhead and fall Chinook. These fish species have been observed spawning in the Hylebos although the distribution maps do not show this. LWD is limited due to the urban nature of the stream and the associated wetlands which are dominated by reed canarygrass.
Moderate to High The potential to re-introduce LWD, either through planting or placement, exists. Forested riparian cover is lacking in urban zones. Implement measures to encourage riparian revegetation and tree planting. Revise tree ordinance to allow for LWD delivery to the creek.

Pierce County Shoreline Inventory and Characterization Report
June 2009 Appendix E – WRIA 10, Page 9 of 28
WRIA 10 – South Prairie Creek
Shoreline
Name
Ecosystem Process & Shoreline Function Level of Alteration Potential Protection and Restoration
Measures and Opportunities
South Prairie Creek All reaches
Hydrology: Channel migration and floodplain connection
Low to Moderate The lower 5 miles of South Prairie Creek has either been channelized or are contained within constricting levees or revetments. Where these channel containments exist, the stream is inhibited for occupying historical floodplain areas within these reaches.
Moderate to High Restore natural floodplain and channel migration zone by levee setbacks and levee removal where possible.
South Prairie Creek Sub-basin Includes South and East Forks
Hydrology: Aquifer recharge
Low Sub-basin has only 2% of land area developed (impervious surface) with 90% of watershed in forest cover, grasslands, or undeveloped.
High Preservation of natural vegetated cover will preserve infiltration abilities in the upper watershed. Prevent development that intercepts shallow subsurface flows, including ditches, roads and foundations.
Hydrology: Flood flow retention
Low Channel-floodplain interaction is modified through the town of Wilkeson and South Prairie; however, the natural connection to the river floodplain exists in the upper watershed
Moderate Preserve floodplains along shoreline of South Prairie creek and limit new development. Implement levee setback projects and restore associated wetlands to increase flood flow retention.
Sediment Generation and Transport: Upland sediment generation
Low to Moderate Fine sediment loading to South Prairie Creek occurs due to agricultural and forest practices, thereby negatively affecting water quality and habitat.
High Implementation and retrofit of water quality BMPs to the existing stormwater system can reduce fine sediment loading. Land use measures for upper watershed – encourage sustainable forest practices and limit road crossings.
Water Quality: Removal of pollutants through sedimentation and adsorption and temperature regulation.
Low to Moderate Wetlands along South Prairie Creek have been altered through agricultural practices. Sediment and pollutant sources are filtered in these wetlands. South Prairie Creek is on the Category 4, 303d list for fecal coliform and temperature exeedances. In 2003 Ecology completed a Total Maximum Daily Load (TMDL) process to address temperature and fecal coliform bacteria impairments in South Prairie Creek. Point sources of fecal coliform and temperature include the Wilkeson wastewater treatment plant and the South Prairie wastewater treatment plant.
High Encouraging the preservation of riverine and other wetlands within the contributing basin can increase water contact time with soil. Implement measures to reduce non-point sources of pollution such as replacing failing septic systems, developing BMPs for agricultural operations, and replanting riparian zones.

Pierce County Shoreline Inventory and Characterization Report
Appendix E – WRIA 10, Page 10 of 28 June 2009
Shoreline
Name
Ecosystem Process & Shoreline Function Level of Alteration Potential Protection and Restoration
Measures and Opportunities
Habitat: Shoreline riparian habitat for wildlife; vegetation provides habitat structure and food sources.
Moderate to Low Native riparian vegetation has been removed in reaches within developed areas and agricultural lands. However, many sections of the river retain the natural riparian vegetation.
Moderate to High Replanting and enhancement of riparian buffers and associated wetlands can increase habitat values for wildlife.
Habitat: Source and delivery of LWD
Low to Moderate South Prairie Creek is considered one of the most productive streams in the Puyallup/White River Watershed, and is one of the index streams that the WDFW surveys for Chinook, pink salmon, and steelhead (Marks et. al, 2005). South Prairie Creek produces almost half of all of the wild steelhead in the Puyallup River system, and has the only significant run of pink salmon in the Puyallup River. The stream also has healthy returns of Chinook, coho and chum salmon, and sea-run cutthroat trout (Kerwin, 1999). There is an anadromous fish blockage at RM 15.7 where the City of Buckley has constructed a water diversion dam. Atotal of 5 salmonid species are documented to spawn within the creek including coho, fall chum, pink salmon, winter steelhead and fall Chinook.
Moderate to High The potential to re-introduce LWD, either through planting or placement, exists. Forested riparian cover is lacking in agricultural zones. Implement measures to encourage riparian revegetation and tree planting. Revise tree ordinance to allow for LWD delivery to the creek. Preservation of existing habitat is of high priority to support existing salmon spawning.
WRIA 10 – South Prairie Creek

Pierce County Shoreline Inventory and Characterization Report
June 2009 Appendix E – WRIA 10, Page 11 of 28
WRIA 10 – Wilkeson Creek
Shoreline
Name
Ecosystem Process & Shoreline Function Level of Alteration Potential Protection and Restoration
Measures and Opportunities
Wilkeson Creek All reaches
Hydrology: Channel and floodplain connection
Low No levees noted in the Wilkeson Creek system and the channel is well-connected to natural floodplain.
High Preserve natural floodplain and channel migration zone on Wilkeson Creek. Restoration opportunities are low.
South Prairie Creek Sub-basin
Hydrology: Aquifer recharge
Low Watershed has only 2% of land area developed (impervious surface) with 90% of watershed in forest cover, grasslands, or undeveloped.
High Preservation of natural vegetated cover will preserve infiltration abilities in the upper watershed. Prevent development that intercepts shallow subsurface flows, including ditches, roads and foundations.
Hydrology: Flood flow retention
Low Channel-floodplain interaction is modified through the town of Wilkeson; however, over areas the natural connection to the river floodplain exists.
Moderate Flood flow is retained within the floodplain.
Sediment Generation and Transport: Upland sediment generation
Low to Moderate Fine sediment loading to Wilkeson Creek occurs due to forest practices and negatively affecting water quality and habitat.
Moderate Implementation and retrofit of water quality BMPs to the existing stormwater system can reduce fine sediment loading. Land use measures for upper watershed – encourage sustainable forest practices and limit road crossings.
Water Quality: Removal of pollutants through sedimentation and adsorption and temperature regulation.
Low Wetlands remain largely unaltered along Wilkeson Creek. Sediment and pollutant sources are filtered in these wetlands. Water quality parameters are good for Wilkeson Creek. The stream is on the 303d list for temperature exeedances.
High Encouraging the preservation of riverine and associated wetlands within the contributing basin can increase water contact time with soil.
Habitat: Shoreline riparian habitat for wildlife; vegetation provides structure and food sources.
Low Native riparian vegetation has been removed in reaches within the town of Wilkeson and downstream through agricultural areas. However, many sections of the river retain the natural riparian vegetation.
Moderate Replanting and enhancement of riparian buffers and associated wetlands can increase habitat values for wildlife.
Habitat: Source and delivery of LWD providing in channel habitat for fish and aquatic species.
Low to Moderate Up to 94% of the shoreline area within the sub-basin is currently forested, grassland or undeveloped. However, forested cover is lacking in the lower section of Wilkeson Creek.
Moderate The potential to re-introduce LWD, either through planting or placement, exists.

Pierce County Shoreline Inventory and Characterization Report
Appendix E – WRIA 10, Page 12 of 28 June 2009
WRIA 10 – Gale Creek
Shoreline
Name
Ecosystem Process & Shoreline Function Level of Alteration Potential Protection and Restoration
Measures and Opportunities
Gale Creek All reaches
Hydrology: Channel and floodplain connection
Low No levees noted in the Wilkeson Creek system and the channel is well-connected to natural floodplain.
High Preserve natural floodplain and channel migration zone on Wilkeson Creek. Restoration opportunities are low.
South Prairie Creek Sub-basin
Hydrology: Aquifer recharge
Low Watershed has only 2% of land area developed (impervious surface) with 90% of watershed in forest cover, grasslands, or undeveloped.
High Preservation of natural vegetated cover will preserve infiltration abilities in the upper watershed. Prevent development that intercepts shallow subsurface flows, including ditches, roads and foundations.
Hydrology: Flood flow retention
Low Channel-floodplain interaction is modified through the town of Wilkeson; however, over areas the natural connection to the river floodplain exists.
Moderate Flood flow is retained within the floodplain.
Sediment Generation and Transport: Upland sediment generation
Low to Moderate Fine sediment loading to Wilkeson Creek occurs due to forest practices and negatively affecting water quality and habitat.
Moderate Implementation and retrofit of water quality BMPs to the existing stormwater system can reduce fine sediment loading. Land use measures for upper watershed – encourage sustainable forest practices and limit road crossings.
Water Quality: Removal of pollutants through sedimentation and adsorption and temperature regulation.
Low Wetlands remain largely unaltered along Wilkeson Creek. Sediment and pollutant sources are filtered in these wetlands. Water quality parameters are good for Wilkeson Creek. The stream is on the 303d list for temperature exeedances.
High Encouraging the preservation of riverine and associated wetlands within the contributing basin can increase water contact time with soil.
Habitat: Shoreline riparian habitat for wildlife; vegetation provides structure and food sources.
Low Native riparian vegetation has been removed in reaches within the town of Wilkeson and downstream through agricultural areas. However, many sections of the river retain the natural riparian vegetation.
Moderate Replanting and enhancement of riparian buffers and associated wetlands can increase habitat values for wildlife.
Habitat: Source and delivery of LWD providing in channel habitat for fish and aquatic species.
Low to Moderate Up to 94% of the shoreline area within the sub-basin is currently forested, grassland or undeveloped. Gale Creek supports three salmonid species including coho, pink salmon and winter steelhead.
Moderate The potential to re-introduce LWD, either through planting or placement, exists.

Pierce County Shoreline Inventory and Characterization Report
June 2009 Appendix E – WRIA 10, Page 13 of 28
WRIA 10 – Page Creek
Shoreline Name
Ecosystem Process & Shoreline Function Level of Alteration Potential Protection and Restoration
Measures and Opportunities
Page Creek All reaches
Hydrology: Channel and floodplain connection
Low No levees noted in the Page Creek system and the channel is well-connected to natural floodplain.
High Preserve natural floodplain and channel migration zone on Page Creek. Restoration opportunities are low.
South Prairie Creek Sub-basin
Hydrology: Aquifer recharge
Low Watershed has only 2% of land area developed (impervious surface) with 90% of watershed in forest cover, grasslands, or undeveloped.
High Preservation of natural vegetated cover will preserve infiltration abilities in the upper watershed. Prevent development that intercepts shallow subsurface flows, including ditches, roads and foundations.
Hydrology: Flood flow retention
Low Channel-floodplain interaction is largely unmodified.
Moderate Flood flow is retained within the floodplain.
Sediment Generation and Transport: Upland sediment generation
Low to Moderate Fine sediment loading to Page Creek occurs due to forest practices and negatively affecting water quality and habitat. Grand Coulee Maintenance Road and other logging roads cross this creek within timber lands.
Moderate Implementation and retrofit of water quality BMPs to the existing stormwater system can reduce fine sediment loading. Land use measures for upper watershed – encourage sustainable forest practices and limit road crossings.
Water Quality: Removal of pollutants through sedimentation and adsorption and temperature regulation.
Low Few wetlands occur along Page Creek. Water quality parameters are presumed good for Page Creek; it is not listed for any water quality impairments.
High Encouraging the preservation of riverine and associated wetlands within the contributing basin can increase water contact time with soil.
Habitat: Shoreline riparian habitat for wildlife; vegetation provides structure and food sources.
Moderate Most of the riparian zone along this creek has converted to shrub or deciduous forest. Timber harvest has removed mature forest within the basin and shoreline area.
Moderate Replanting and enhancement of riparian buffers and associated wetlands can increase habitat values for wildlife.
Habitat: Source and delivery of LWD providing in channel habitat for fish and aquatic species.
Low to Moderate Up to 94% of the shoreline area within the sub-basin is currently forested, grassland or undeveloped. Page Creek supports three salmonid species including coho, pink salmon and winter steelhead. Large wood delivery is impaired due to timber removal.
Moderate The potential to re-introduce LWD, either through planting or placement, exists.

Pierce County Shoreline Inventory and Characterization Report
Appendix E – WRIA 10, Page 14 of 28 June 2009
WRIA 10 – Carbon River
Shoreline Name
Ecosystem Process & Shoreline Function Level of Alteration Potential Protection and Restoration
Measures and Opportunities
Carbon River All reaches
Hydrology: Channel migration and floodplain connection
Low to Moderate Carbon River has an active channel migration zone from 150 to 600 feet wide in the lower watershed. Levies near the City of Orting confine the river channel but reaches upstream of Carbnado are unconfined.
High Restore natural floodplain and channel migration zone by levee setbacks and levee removal where possible.
Carbon River Sub-basin South Prairie Voight Creek Chenuis Creek Cayada Creek Tolmie Creek Evans creek
Hydrology: Aquifer recharge
Low Sub-basin has only 2% of land area developed (impervious surface) with 90% of watershed in forest cover, grasslands, or undeveloped.
High Preservation of natural vegetated cover will preserve infiltration abilities in the upper watershed. Prevent development that intercepts shallow subsurface flows, including ditches, roads and foundations.
Hydrology: Flood flow retention
Low Channel-floodplain interaction is modified through Orting; however, the natural connection to the river floodplain exists in the upper watershed. Timber harvest in the upper watershed results in an increase in flood flows downstream.
Moderate Preserve floodplain and active channel migration zone and limit new development. Implement levee setback projects and restore associated wetlands to increase flood flow retention. Replant riparian zones in the upper watershed.
Sediment Generation and Transport: Upland sediment generation
Low to Moderate In the upper watershed, glacier meltwater supplies sediments from Mount Rainier and Carbon Glacier. In the lower watershed, sediment loading occurs due to agricultural and forest practices, thereby negatively affecting water quality and habitat.
High Land use measures for upper watershed – encourage sustainable forest practices and limit road crossings.
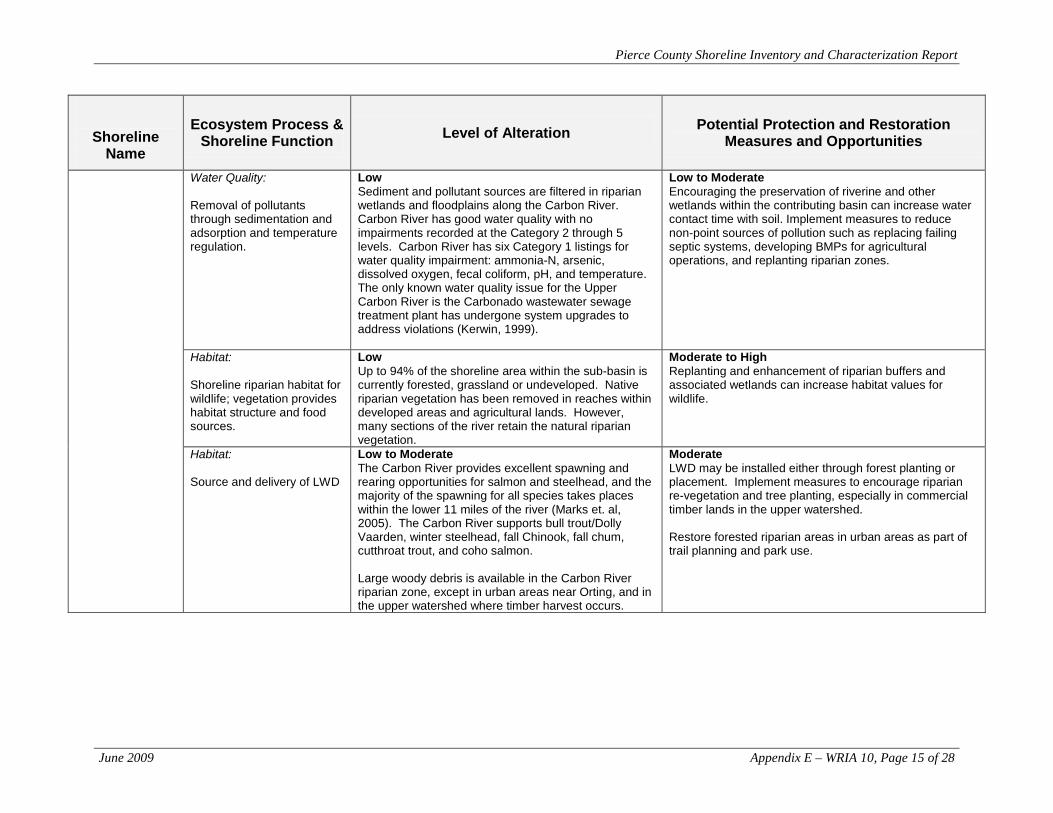
Pierce County Shoreline Inventory and Characterization Report
June 2009 Appendix E – WRIA 10, Page 15 of 28
Shoreline
Name
Ecosystem Process & Shoreline Function Level of Alteration Potential Protection and Restoration
Measures and Opportunities
Water Quality: Removal of pollutants through sedimentation and adsorption and temperature regulation.
Low Sediment and pollutant sources are filtered in riparian wetlands and floodplains along the Carbon River. Carbon River has good water quality with no impairments recorded at the Category 2 through 5 levels. Carbon River has six Category 1 listings for water quality impairment: ammonia-N, arsenic, dissolved oxygen, fecal coliform, pH, and temperature. The only known water quality issue for the Upper Carbon River is the Carbonado wastewater sewage treatment plant has undergone system upgrades to address violations (Kerwin, 1999).
Low to Moderate Encouraging the preservation of riverine and other wetlands within the contributing basin can increase water contact time with soil. Implement measures to reduce non-point sources of pollution such as replacing failing septic systems, developing BMPs for agricultural operations, and replanting riparian zones.
Habitat: Shoreline riparian habitat for wildlife; vegetation provides habitat structure and food sources.
Low Up to 94% of the shoreline area within the sub-basin is currently forested, grassland or undeveloped. Native riparian vegetation has been removed in reaches within developed areas and agricultural lands. However, many sections of the river retain the natural riparian vegetation.
Moderate to High Replanting and enhancement of riparian buffers and associated wetlands can increase habitat values for wildlife.
Habitat: Source and delivery of LWD
Low to Moderate The Carbon River provides excellent spawning and rearing opportunities for salmon and steelhead, and the majority of the spawning for all species takes places within the lower 11 miles of the river (Marks et. al, 2005). The Carbon River supports bull trout/Dolly Vaarden, winter steelhead, fall Chinook, fall chum, cutthroat trout, and coho salmon. Large woody debris is available in the Carbon River riparian zone, except in urban areas near Orting, and in the upper watershed where timber harvest occurs.
Moderate LWD may be installed either through forest planting or placement. Implement measures to encourage riparian re-vegetation and tree planting, especially in commercial timber lands in the upper watershed. Restore forested riparian areas in urban areas as part of trail planning and park use.

Pierce County Shoreline Inventory and Characterization Report
Appendix E – WRIA 10, Page 16 of 28 June 2009
WRIA 10 – Cayada, Chenuis and Tolmie Creeks
Shoreline
Name
Ecosystem Process & Shoreline Function Level of Alteration Potential Protection and Restoration
Measures and Opportunities
Cayada Creek Chenuis Creek Tolmie Creek
Hydrology: Channel migration and floodplain connection
Low No levees occur on these creeks found in the upper watershed of the Carbon River. However, the steep terrain with in upper basin limits channel migration and floodplain width.
High Preserve natural floodplain areas.
Carbon River sub-basin, upper tributaries
Hydrology: Aquifer recharge
Low Sub-basin has only 2% of land area developed (impervious surface) with 90% of watershed in forest cover, grasslands, or undeveloped. Creeks lie within commercial forestry lands or Nation Forest and timber is being harvested.
Moderate Preservation of natural vegetated cover will preserve infiltration abilities in the upper watershed.
Hydrology: Flood flow retention
Low Natural connection to the river floodplain exists in the upper watershed, although basins are steep sided in narrow ravines, which limits natural flood flow retention volumes.
Low to Moderate Preserve ravines in upper watershed.
Sediment Generation and Transport: Upland sediment generation
Low to Moderate Gravel timber roads lie within close proximity to the streams. Fine sediment loading to creek occurs due to forest practices, thereby negatively affecting water quality and habitat.
High Land use measures for upper watershed – encourage sustainable forest practices, limit road crossings, and remove failing culverts.
Water Quality: Removal of pollutants through sedimentation and adsorption and temperature regulation.
Low to Moderate No wetlands are identified along these creeks due to steep terrain. None of the creeks are listed on the 303d List of Impaired Waterbodies.
High Implement measures to reduce non-point sources of pollution such as replacing failing culverts, developing BMPs for forest practices operations, and replanting riparian zones.
Habitat: Shoreline riparian habitat for wildlife; vegetation provides habitat structure and foods.
Low Up to 94% of the shoreline area within the sub-basin is currently forested, grassland or undeveloped. These tributaries are located in commercial timber lands and within the Mt. Baker-Snoqualmie National Forest. Timber harvesting has affected forest cover within the riparian zones.
Moderate to High Replanting and enhancement of riparian buffers and associated wetlands can increase habitat values for wildlife.

Pierce County Shoreline Inventory and Characterization Report
June 2009 Appendix E – WRIA 10, Page 17 of 28
Shoreline
Name
Ecosystem Process & Shoreline Function Level of Alteration Potential Protection and Restoration
Measures and Opportunities
Habitat: Source and delivery of LWD
Moderate Much of the riparian forest has been harvested along these creeks limiting the source of LWD. Fish distribution maps indicate that Tolmie and Cayada Creeks have a presumed presence of Dolly Varden/bull trout.
High The potential for riparian forest restoration is high. The opportunity exists to re-introduce LWD, either through planting or placement.

Pierce County Shoreline Inventory and Characterization Report
Appendix E – WRIA 10, Page 18 of 28 June 2009
WRIA 10 – Evans Creek
Shoreline Name
Ecosystem Process & Shoreline Function Level of Alteration Potential Protection and Restoration
Measures and Opportunities
Evans Creek
Hydrology: Channel migration and floodplain connection
Low to Moderate The Evans Creek channel is unmodified. However, the steep terrain with in upper basin limits naturally channel migration and floodplain width. The creek lies in commercial timber lands, primarily within the Champion Pacific tree farm. Logging roads, erosion, and large storm events have caused impacts to the stream channel (Kerwin 1999).
High Preserve natural floodplain areas.
Carbon River sub-basin
Hydrology: Aquifer recharge
Low Sub-basin has only 2% of land area developed (impervious surface) with 90% of watershed in forest cover, grasslands, or undeveloped.
High Preservation of natural vegetated cover will preserve infiltration abilities in the upper watershed.
Hydrology: Flood flow retention
Low Natural connection to the river floodplain exists in the upper watershed. However, flood flow retention is reduced due to steep terrain and logging.
Moderate Replant riparian zones and clearcuts in upper basin.
Sediment Generation and Transport: Upland sediment generation
Moderate Fine sediment loading to creek occurs due to forest practices, thereby negatively affecting water quality and habitat. Many clearcuts in basin.
High Land use measures for upper watershed – encourage sustainable forest practices, replace failing culverts, replant riparian areas, and limit road crossings.
Water Quality: Removal of pollutants through sedimentation and adsorption and temperature regulation.
Low to Moderate Few associated wetlands are identified due to steep terrain. Sediment and pollutant sources are filtered in these wetlands. Not on the 303d List of impaired waterbodies.
High Implement measures to reduce non-point sources of pollution such as replacing failing culverts, developing BMPs for forest practices operations, and replanting riparian zones.
Habitat: Shoreline riparian habitat for wildlife; vegetation provides habitat structure and food.
Low to Moderate Up to 94% of the shoreline area within the sub-basin is currently forested, grassland or undeveloped. However, timber harvesting has affected forest cover in the upper basin and removed trees within the shoreline jurisdiction.
Moderate to High Replanting and enhancement of riparian buffers and associated wetlands can increase habitat values for wildlife.

Pierce County Shoreline Inventory and Characterization Report
June 2009 Appendix E – WRIA 10, Page 19 of 28
Shoreline
Name
Ecosystem Process & Shoreline Function Level of Alteration Potential Protection and Restoration
Measures and Opportunities
Habitat: Source and delivery of LWD
Moderate Evans Creek lies in commercial forest lands. Much of the forest has been cleared along this creek limiting the source of LWD. Fish distribution maps (WDFW, 2007) indicate that Evans Creek supports coho and contains spawning habitat for coho salmon within its lower reach.
High The potential for riparian forest restoration is high. The opportunity to re-introduce LWD exists by restoring riparian areas.

Pierce County Shoreline Inventory and Characterization Report
Appendix E – WRIA 10, Page 20 of 28 June 2009
WRIA 10 – Voight Creek
Shoreline
Name
Ecosystem Process & Shoreline Function Level of Alteration Potential Protection and Restoration
Measures and Opportunities
Voight Creek All reaches
Hydrology: Channel and floodplain connection
Low No levees noted in the Voight Creek system and the channel is well-connected to natural floodplain. Large floodplain extending up Waterhole Creek.
High Preserve and protect natural floodplain and channel migration zone on Voight Creek. Restoration opportunities are low.
Lower Carbon River: Sub-basin
Hydrology: Aquifer recharge
Moderate Watershed has only 1% of land area developed (impervious surface) with 97% of watershed in forest cover, grasslands, or undeveloped. However, much of the upper watershed of Voight Creek has been clear-cut or logged.
Moderate to High Restore riparian forests and replant clearcut areas in the upper basin to slow surface water runoff and improve aquifer recharge capabilities.
Hydrology: Flood flow retention
Low No levees are documented for Voight Creek and channel is unmodified.
Moderate Flood flow is retained within the floodplain. Preserve and protect natural floodplain and channel migration zone on Voight Creek.
Sediment Generation and Transport: Upland sediment generation
Low to Moderate Fine sediment loading to Voight Creek occurs due to forest practices and negatively affecting water quality and habitat.
Moderate Land use measures for upper watershed – encourage sustainable forest practices and limit road crossings.
Water Quality: Removal of pollutants through sedimentation and adsorption and temperature regulation.
Low Wetlands remain largely unaltered along Voight Creek. Sediment and pollutant sources are filtered in these wetlands. According to the 2004 Washington State Water Quality Assessment, Voight Creek has two Category 2 listings for impairment: pH and temperature.
High Encouraging the preservation of riverine and associated wetlands within the contributing basin can increase water contact time with soil.
Habitat: Shoreline riparian habitat for wildlife; vegetation provides structure and food sources.
Moderate Native riparian vegetation has been removed within forest resource lands. Approximately 100 feet of forested riparian zone is maintained on each side of the stream, but clear-cuts exist beyond the 100 feet.
Moderate Replanting and enhancement of riparian buffers and associated wetlands can increase habitat values for wildlife.

Pierce County Shoreline Inventory and Characterization Report
June 2009 Appendix E – WRIA 10, Page 21 of 28
Shoreline
Name
Ecosystem Process & Shoreline Function Level of Alteration Potential Protection and Restoration
Measures and Opportunities
Habitat: Source and delivery of LWD providing in channel habitat for fish and aquatic species.
Low to Moderate Riparian zones are lacking in LWD and delivery to the creek is reduced. Logging in the upper watershed has removed timber in the 200 foot riparian zone. Fish distribution maps (WDFW, 2007) indicate that Voight Creek supports fall Chinook, fall chum, coho, and winter steelhead. All of these species have a documented presence within the stream and fall Chinook and coho have rearing habitat. Voight Creek has designated Critical habita for Puget Sound ESU Chinook salmon in Voight Creek (Federal Register, 2005a).
Moderate Replant and reforest the shoreline riparian zone to enhance LWD delivery to Voight Creek.

Pierce County Shoreline Inventory and Characterization Report
Appendix E – WRIA 10, Page 22 of 28 June 2009
WRIA 10 – Bear Creek
Shoreline
Name
Ecosystem Process & Shoreline Function Level of Alteration Potential Protection and Restoration
Measures and Opportunities
Bear Creek
Hydrology: Channel migration and floodplain connection
Low The Bear Creek channel is unmodified. A large alluvial wetland lies at the confluence of Bear Creek and Voight Creek. The floodplain widens to approximately 600 feet in this area.
High Preserve natural floodplain areas and associated wetlands within the floodplain.
Lower Carbon River sub-basin
Hydrology: Aquifer recharge
Low Sub-basin has only 2% of land area developed (impervious surface) with 90% of watershed in forest cover, grasslands, or undeveloped.
High Preservation of natural vegetated cover will preserve infiltration abilities in the upper watershed. Replant areas that have been clear-cut.
Hydrology: Flood flow retention
Low Natural connection to the river floodplain exists. However, flood flow retention is reduced due to steep terrain and logging.
Moderate Replant riparian zones and clearcuts in upper basin.
Sediment Generation and Transport: Upland sediment generation
Moderate Fine sediment loading to creek occurs due to forest practices, thereby negatively affecting water quality and habitat. Many large tract clear-cuts in basin. Gravel roads parallel both sides of Bear Creek and its alluvial wetland.
High Land use measures for upper watershed – encourage sustainable forest practices, replace failing culverts, replant riparian areas, and limit road crossings.
Water Quality: Removal of pollutants through sedimentation and adsorption and temperature regulation.
Low to Moderate Large associated wetland likely has peat-derived soils. Sediment and pollutant sources are filtered in these wetlands. Bear Creek is not on the 303d List of impaired waterbodies.
Moderate Implement measures to reduce non-point sources of pollution such as replacing failing culverts, developing BMPs for forest practices operations, and replanting riparian zones.
Habitat: Shoreline riparian habitat for wildlife; vegetation provides habitat structure and food sources.
Low to Moderate Up to 94% of the shoreline area within the sub-basin is currently forested, grassland or undeveloped. However, timber harvesting has affected forest cover in the upper basin and removed trees within the shoreline jurisdiction..
Moderate Replanting and enhancement of riparian buffers and associated wetlands can increase habitat values for wildlife.

Pierce County Shoreline Inventory and Characterization Report
June 2009 Appendix E – WRIA 10, Page 23 of 28
Shoreline
Name
Ecosystem Process & Shoreline Function Level of Alteration Potential Protection and Restoration
Measures and Opportunities
Habitat: Source and delivery of LWD
Moderate Bear Creek lies in commercial forest lands. Much of the forest has been cleared along this creek limiting the source of LWD. Fish distribution maps (WDFW, 2007) indicate that Bear Creek does not provide habitat for any salmonid species.
High The potential for riparian forest restoration is high. The opportunity to re-introduce LWD exists by restoring riparian areas.

Pierce County Shoreline Inventory and Characterization Report
Appendix E – WRIA 10, Page 24 of 28 June 2009
WRIA 10 – Mowich Creek
Shoreline
Name
Ecosystem Process & Shoreline Function Level of Alteration Potential Protection and Restoration
Measures and Opportunities
Mowich River Also including tributaries: Mead Creek and Rushingwater Creek
Hydrology: Channel migration and floodplain connection
Low to Moderate Mowich River and its tributaries are unmodified. However, the steep terrain with in upper basin limits naturally channel migration and floodplain width. Logging roads, erosion, and large storm events have caused impacts to the stream channel.
High Preserve natural floodplain areas.
Carbon River sub-basin
Hydrology: Aquifer recharge
Low Sub-basin has only 1% of land area developed (impervious surface) with 99% of watershed in forest cover, grasslands, or undeveloped.
High Preservation of natural vegetated cover will preserve infiltration abilities in the upper watershed.
Hydrology: Flood flow retention
Low Natural connection to the river floodplain exists in the upper watershed. However, flood flow retention is reduced due to steep terrain and logging.
Moderate Replant riparian zones and clear-cuts in upper basin.
Sediment Generation and Transport: Upland sediment generation
Moderate Fine sediment loading to creek occurs due to forest practices, thereby negatively affecting water quality and habitat. Many clear-cuts in basin.
High Land use measures for upper watershed – encourage sustainable forest practices, replace failing culverts, replant riparian areas, and limit road crossings.
Water Quality: Removal of pollutants through sedimentation and adsorption and temperature regulation.
Low to Moderate Few associated wetlands are identified due to steep terrain. Sediment and pollutant sources are filtered in riparian zones. Mowich River and its tributaries are not listed for any water quality impairments.
High Implement measures to reduce non-point sources of pollution such as replacing failing culverts, developing BMPs for forest practices operations, and replanting riparian zones.
Habitat: Shoreline riparian habitat for wildlife; vegetation provides habitat structure and food sources.
Low to Moderate Up to 94% of the shoreline area within the sub-basin is currently forested, grassland or undeveloped. However, timber harvesting has affected forest cover in the upper basin and removed trees within the shoreline jurisdiction.
Moderate to High Replanting and enhancement of riparian buffers and associated wetlands can increase habitat values for wildlife.

Pierce County Shoreline Inventory and Characterization Report
June 2009 Appendix E – WRIA 10, Page 25 of 28
Shoreline
Name
Ecosystem Process & Shoreline Function Level of Alteration Potential Protection and Restoration
Measures and Opportunities
Habitat: Source and delivery of LWD
Moderate Mowich River and Rushingwater River lie in designated commercial forest lands. Mead creek lies in National Forest lands. Much of the forest has been cleared along these creeks limiting the source of LWD. The Mowich River supports bull trout/Dolly Varden, coho, and fall Chinook. The Mowich River provides a small segment of spawning habitat for fall Chinook, near the fork Rushingwater Creek fork (WDFW, 2007). A fish ladder, the Electron fish ladder, located at RM 41.7 has restored anadromous fish passage through the river.
High The potential for riparian forest restoration is high. The opportunity to re-introduce LWD exists by restoring riparian areas.

Pierce County Shoreline Inventory and Characterization Report
Appendix E – WRIA 10, Page 26 of 28 June 2009
WRIA 10 – North and South Puyallup Rivers
Shoreline Name
Ecosystem Process & Shoreline Function Level of Alteration Potential Protection and Restoration
Measures and Opportunities
North and South Puyallup River Also including tributaries: Deer Creek Saint Andrews Creek, and Unnamed Trib. to the South Puyallup
Hydrology: Channel migration and floodplain connection
Low to Moderate North and South Puyallup Rivers and their tributaries are unmodified. However, the steep terrain with in upper basin limits naturally channel migration and floodplain width. Logging roads, erosion, and large storm events have caused impacts to the stream channels (Kerwin 1999). Sediment and runoff from road construction and maintenance activities associated with logging continue to be of concern.
High Preserve natural floodplain areas.
Hydrology: Aquifer recharge
Low Sub-basin has only 1% of land area developed (impervious surface) with 99% of watershed in forest cover, grasslands, or undeveloped.
High Preservation of natural vegetated cover will preserve infiltration abilities in the upper watershed. Replanting of harvested areas will improve infiltration.
Hydrology: Flood flow retention
Low Natural connection to the river floodplain exists in the upper watershed. However, flood flow retention is reduced due to steep terrain and logging.
Moderate Replant riparian zones and clear-cuts in upper basin.
Sediment Generation and Transport: Upland sediment generation
High Fine sediment loading to creek occurs due to forest practices, thereby negatively affecting water quality and habitat. Many clear-cuts in basin. The upper Puyallup River basin has 686 road crossings indicating that forest roads are a significant contributor to sediment loading.
High Land use measures for upper watershed – encourage sustainable forest practices, replace failing culverts, replant riparian areas, and limit road crossings.
Water Quality: Removal of pollutants through sedimentation and adsorption and temperature regulation.
Low to Moderate Few associated wetlands are identified due to steep terrain. Sediment and pollutant sources are filtered in riparian zones. North Puyallup and South Puyallup and their tributaries are not listed for any water quality impairments.
High Implement measures to reduce non-point sources of pollution such as replacing failing culverts, developing BMPs for forest practices operations, and replanting riparian zones.

Pierce County Shoreline Inventory and Characterization Report
June 2009 Appendix E – WRIA 10, Page 27 of 28
Shoreline
Name
Ecosystem Process & Shoreline Function Level of Alteration Potential Protection and Restoration
Measures and Opportunities
Habitat: Shoreline riparian habitat for wildlife; vegetation provides habitat structure and food.
Low to Moderate Timber harvesting has affected forest cover in the upper basin and removed trees within the shoreline jurisdiction.
Moderate to High Replanting and enhancement of riparian buffers and associated wetlands can increase habitat values for wildlife.
Habitat: Source and delivery of LWD
Low All of these rivers lie largely in designated commercial forest lands. Much of the forest has been cleared along these creeks limiting the source of LWD. However, LWD is present in the upstream river sections in Mt. Rainier National Park. Fish distribution maps (WDFW, 2007) indicate that both the North and South Puyallup Rivers have a documented presence of bull trout/Dolly Vaarden. Critical habitat for bull trout has been designated within the South Puyallup River (Federal Register, 2005b).
Low to Moderate The opportunity to re-introduce LWD exists by restoring riparian areas.

Pierce County Shoreline Inventory and Characterization Report
Appendix E – WRIA 10, Page 28 of 28 June 2009
WRIA 10 – Kapowsin Creek
Shoreline Name
Ecosystem Process & Shoreline Function Level of Alteration Potential Protection and Restoration
Measures and Opportunities
Kapowsin Creek Also including tributaries
Hydrology: Channel migration and floodplain connection
Low to Moderate No levees noted in the Kapowsin Creek system and the channel is well-connected to natural floodplain.
High Preserve natural floodplain areas.
Kapowsin sub-basin
Hydrology: Aquifer recharge
Low Sub-basin has only 2% of land area developed (impervious surface) with 91% of watershed in forest cover, grasslands, or undeveloped.
High Preservation of natural vegetated cover will preserve infiltration abilities in the upper watershed.
Hydrology: Flood flow retention
Low Natural connection to the river floodplain exists in the upper watershed. However, flood flow retention is reduced due to channelization and agriculture.
Moderate Preserve floodplains along shoreline of creek and limit new development. Restore associated wetlands to increase flood flow retention.
Sediment Generation and Transport: Upland sediment generation
Moderate Fine sediment loading to creek occurs due to agricultural practices, thereby negatively affecting water quality and habitat. Many clear-cuts in upper basin.
High Land use measures for upper watershed – encourage sustainable forest practices, replace failing culverts, replant riparian areas, and limit road crossings.
Water Quality: Removal of pollutants through sedimentation and adsorption and temperature regulation.
Low to Moderate Sediment and pollutant sources are filtered in riparian zones. River and its tributaries are not listed for any water quality impairments.
High Implement measures to reduce non-point sources of pollution such as replacing failing culverts, developing BMPs for forest practices operations, and replanting riparian zones.
Habitat: Shoreline riparian habitat for wildlife; vegetation provides habitat structure and food sources.
Low to Moderate Up to 94% of the shoreline area within the sub-basin is currently forested, grassland or undeveloped. However, timber harvesting has affected forest cover in the upper basin and removed trees within the shoreline jurisdiction.
Moderate to High Replanting and enhancement of riparian buffers and associated wetlands can increase habitat values for wildlife.
Habitat: Source and delivery of LWD
Moderate Much of the riparian zone has been cleared along these creeks limiting the source of LWD. Kapowsine River supports coho, fall Chinook, fall chum, pink salmon, and winter steelhead. It is also presumed to support bull trout/Dolly Varden.
High The potential for riparian forest restoration is high. The opportunity to re-introduce LWD exists by restoring riparian areas.

Pierce County Shoreline Inventory and Characterization Report
June 2009 Appendix E – WRIA 11, Page 1 of 28
WRIA 11 – Nisqually River
Shoreline Name
Ecosystem Process & Shoreline Function Level of Alteration Potential Protection and Restoration
Measures and Opportunities
Nisqually River
Hydrology: Channel migration and floodplain connection
Low to Moderate Channel migration is actively occurring in the Nisqually River as evidenced by the channel sinuosity in many sections of the river. The headwaters of the Nisqually River are protected in the Mt. Rainier National Park and its river delta at the mouth is protected by the Nisqually Wildlife Refuge. However, major process and channel modifications exist throughout the basin including land conversion from forest to harvested forest, cleared military lands or agricultural uses (mainly pasture), Gravel mining, levees and revetments, a water diversion feature and parallel water flume on the Thurston County side of the river, two hydroelectric projects associated with La Grande Dam and Alder Lake Dam, The two dams capture sediment and cause downstream depletion of gravels and sediments.
High Restore natural floodplain and channel migration zone by levee setbacks and levee removal where possible.
Hydrology: Aquifer recharge
Low to Moderate The upper Nisqually River is largely undeveloped with only 8% of land area in impervious surface with 80% of watershed in forest cover, grasslands, or undeveloped. The mid- Nisqually River is 9% developed and only 77% of the basin area remaining in forest cover or grassland.
High Preservation of natural vegetated cover will preserve infiltration abilities in the upper watershed. Prevent development that intercepts shallow subsurface flows, including ditches, roads and foundations.
Hydrology: Flood flow retention
Moderate Key alterations to hydrology include the installation of La Grande Dam and Alder Lake Dam, which changed the timing and volume of flows in the Nisqually River. Flood control dikes have been installed in the Middle Nisqually near RM 21.8 and in the Upper Nisqually Mainstem between RM 26.2 to 42.5.
Moderate Increase floodplain connections in mid-Nisqually River. Implement levee setback projects and restore associated wetlands to increase flood flow retention.

Pierce County Shoreline Inventory and Characterization Report
Appendix D – WRIA 11, Page 2 of 28 June 2009
Shoreline
Name
Ecosystem Process & Shoreline Function Level of Alteration Potential Protection and Restoration
Measures and Opportunities
Sediment Generation and Transport: Upland sediment generation
Moderate to High The La Grande Dam and Alder Lake Dam capture sediment and cause downstream depletion of gravels and sediments. Flood control dikes in the Middle Nisqually near RM 21.8 and in the Upper Nisqually Mainstem between RM 26.2 to 42.5 further limit sediment transport to the Nisqually from upland sources.
High

Pierce County Shoreline Inventory and Characterization Report
June 2009 Appendix E – WRIA 11, Page 3 of 28
Shoreline
Name
Ecosystem Process & Shoreline Function Level of Alteration Potential Protection and Restoration
Measures and Opportunities
Water Quality: Removal of pollutants through sedimentation and adsorption and temperature regulation.
Moderate Wetlands along the lower Nisqually have been altered through industrial uses, urban development and agricultural practices. Sediment and pollutant sources are filtered in these wetlands. The Nisqually River has one Category 4C listing for habitat impairment due to invasive exotic species. In addition, the river has three Category 2 listings for water quality impairment for chromium, fecal coliform, and total PCBs. The Nisqually River also has multiple Category 1 listings for dissolved oxygen, fecal coliform, mercury, pH, temperature, and other parameters such as aldrin, DDT, and dieldrin. (Department of Ecology, 2004). Water quality monitoring data from the Nisqually Indian Tribe for the 1990’s indicates that the overall quality of the Nisqually River was good, with dissolved oxygen concentrations, fecal coliform bacteria concentrations, and temperature all within State standards (Watershed Professionals Network, et al, 2002). During 2002 and 2003, the Department of Ecology conducted a total maximum daily load (TMDL) study for fecal coliform bacteria in the Nisqually River, including several other waterbodies. The results from this study indicate that the Nisqually River met water quality standards for fecal coliform, and because of this, no load reductions were recommended for the river (Department of Ecology, 2005b).
High Encouraging the preservation of riverine and other wetlands within the contributing basin can increase water contact time with soil. Implement measures to reduce non-point sources of pollution such as replacing failing septic systems, developing BMPs for agricultural operations, and replanting riparian zones. Treat surface water runoff from urban and urbanizing areas that serve as a source of heavy metals to the Nisqually River.
Habitat: Shoreline riparian habitat for wildlife; vegetation provides habitat structure and food sources.
Moderate Native riparian vegetation has been removed in reaches within developed areas and agricultural lands in the mid-Nisqually Basin. In some areas, levees have separated shoreline vegetation from the river. However, many sections of the upper river and the mouth retain the natural riparian vegetation.
Moderate to High Replanting and enhancement of riparian buffers and associated wetlands can increase habitat values for wildlife.

Pierce County Shoreline Inventory and Characterization Report
Appendix D – WRIA 11, Page 4 of 28 June 2009
Shoreline
Name
Ecosystem Process & Shoreline Function Level of Alteration Potential Protection and Restoration
Measures and Opportunities
Habitat: Source and delivery of LWD
Moderate The Lower Nisqually Mainstem from RM 4.5 to 12. 7 is the only reach in the system with good large woody debris (LWD) (Watershed Professionals Network, 2002). In other areas, trees are often separated from the river channel by levees; although some cottonwood have established waterward of the river levees. The LaGrande and Alder Dams limit habitat by intercepting spawning-sized gravels and LWD from the upper basin (Watershed Professionals Network, 2002). The Nisqually River supports the following species: pink salmon, winter chum, winter steelhead, Dolly Varden/bull trout, coastal cutthroat trout, sockeye, coho, fall Chinook, and rainbow trout. Pink salmon have a documented presence in the river, with presence/migration, and spawning and rearing habitat. Winter chum, winter steelhead, coho, and fall Chinook have a documented presence with presence/migration and spawning habitat within the river. Coastal cutthroat trout, sockeye, and rainbow trout have a documented presence within the river, with presence/migration designated. Dolly Varden/bull trout have a documented historic presence with migration use designated (WDFW, 2007). Priority species supported by freshwater bodies in the Nisqually River shoreline planning area include: Dolly Varden/bull trout, chum salmon, Chinook salmon, steelhead, and coho salmon (WDFW, 2007). Dolly Varden/bull trout have critical habitat designated in the Nisqually River.
High The potential exists to re-introduce LWD, either through planting or placement. Forested riparian cover is lacking in agricultural zones and where levees exist. Implement measures to encourage riparian re-vegetation and tree planting.

Pierce County Shoreline Inventory and Characterization Report
June 2009 Appendix E – WRIA 11, Page 5 of 28
WRIA 11 – Beaver Creek
Shoreline Name
Ecosystem Process & Shoreline Function Level of Alteration Potential Protection and Restoration
Measures and Opportunities
Beaver Creek All reaches
Hydrology: Channel migration and floodplain connection
Low No levees noted in the Beaver Creek system and the channel is well-connected to natural floodplain.
Mashel River Sub-basin
Hydrology: Aquifer recharge
Low Total areas of impermeable surface in the sub-basin is very low with only 5% of land area zoned as Rural 20 and 95% Designated Forest Land.
High Preservation of natural vegetated cover will preserve infiltration abilities in the watershed. Prevent development that intercepts shallow subsurface flows, including ditches, roads and foundations.
Hydrology: Flood flow retention
Low The creek is connected to large unaltered wetlands, including a 341-acre wetland located in the middle reach of the stream a series of extensive wetlands and beaver dam complexes at the headwaters (Kerwin, 1999b). These wetlands and a natural connection to the creek floodplain provide flood flow retention.
Moderate Preserve wetlands and floodplains along shoreline of Beaver Creek and limit new development within the floodplain.
Sediment Generation and Transport: Upland sediment generation
Low to Moderate Fine sediment loading to Beaver Creek occurs due to forest practices, thereby negatively affecting water quality and habitat.
High Land use measures for upper watershed – encourage sustainable forest practices and limit road crossings.
Water Quality: Removal of pollutants through sedimentation and adsorption and temperature regulation.
Low Large unaltered wetlands, including a 341-acre wetland located in the middle reach of the stream a series of extensive wetlands and beaver dam complexes at the headwaters (Kerwin, 1999b), filter sediment and pollutants which results in good water quality parameters in Beaver Creek. According to the 2004 Washington State Water Quality Assessment (Department of Ecology, 2004), Beaver Creek is not listed for any water quality impairments. Lack of inclusion in the assessment does not indicate that the waterbody is not impaired; smaller streams are often not sampled and may not reflect degraded water quality standards.
High Encouraging the preservation of riverine and other wetlands within the contributing basin can increase water contact time with soil. Implement measures to reduce non-point sources of pollution such as – encourage sustainable forest practices, replanting riparian zones, restoring forested riparian areas, decommissioning timber roads or resurfacing gravel roads to reduce sedimentation inputs into streams, replacing existing culverts, and protection of associated wetlands.

Pierce County Shoreline Inventory and Characterization Report
Appendix D – WRIA 11, Page 6 of 28 June 2009
Shoreline
Name
Ecosystem Process & Shoreline Function Level of Alteration Potential Protection and Restoration
Measures and Opportunities
Habitat: Shoreline riparian habitat for wildlife; vegetation provides habitat structure and food sources.
Low Many sections of the river retain the natural riparian vegetation. However, the stream flows entirely within lands managed for commercial timber, and because of that, the riparian corridor consists of second growth conifer and hardwoods. Young second growth along the stream channel is a limiting factor for both LWD recruitment and the provision of shade.
Moderate to High Replanting and enhancement of riparian buffers and associated wetlands can increase habitat values for wildlife.
Habitat: Source and delivery of LWD
Low to Moderate Young second growth along the stream channel is a limiting factor for LWD recruitment. Beaver Creek supports coho, fall Chinook, winter steelhead, and cutthroat trout. Coho and coastal cutthroat trout have a documented presence within the stream, and fall Chinook and winter steelhead have a presumed presence. PHS data indicates that all four species are know to utilize the stream for migration. In addition, coho have spawning habitat within Beaver Creek. Coastal cutthroat trout are present throughout the subbasin and are present in large numbers in the wetland complexes located through the middle reaches of Beaver Creek. Coho are known to be present within the lower reaches (Kerwin, 1999b). There are several priority habitats associated with Beaver Creek including the White River elk range; the Mashel River wetlands, consisting of some forested, riverine, emergent marsh and scrub-shrub wetlands; waterfowl concentration areas; Mashel River riparian corridor zone consisting of conifers with hardwood patches; and an Upper Nisqually River bald eagle use area (WDFW, 2007).
Moderate to High Implement measures to encourage preservation of trees in riparian area to support existing salmon habitat through shade and LWD recruitment.

Pierce County Shoreline Inventory and Characterization Report
June 2009 Appendix E – WRIA 11, Page 7 of 28
WRIA 11 – Busy Wild Creek
Shoreline
Name
Ecosystem Process & Shoreline Function Level of Alteration Potential Protection and Restoration
Measures and Opportunities
Busy Wild Creek All reaches
Hydrology: Channel and floodplain connection
Low No levees noted in the Busy Wild Creek system and the channel is well-connected to natural floodplain. With the exception of the lower two miles of stream which flow through a valley, the gradient of Busy Wild Creek is fairly steep and the channel is confined in a narrow canyon (Kerwin, 1999b).
High Preserve natural floodplain and channel migration. Restoration opportunities are low.
Mashel River Sub-basin
Hydrology: Aquifer recharge
Low Total areas of impermeable surface in the sub-basin is very low with 100% of land area zoned as Designated Forest Land.
High Preservation of natural vegetated cover will preserve infiltration abilities in the upper watershed. Prevent development that intercepts shallow subsurface flows, including ditches, roads and foundations.
Hydrology: Flood flow retention
Low Flood flow retention is limited in Busy Wild Creek because much of the stream flows through steep canyon habitat.
NA
Sediment Generation and Transport: Upland sediment generation
Low to Moderate Busy Wild Creek flows entirely within commercial forests owned by the Washington Department of Natural Resources and Champion Pacific Timberlands (Kerwin, 1999b). Fine sediment loading to Busy Wild Creek occurs due to forest practices and negatively affecting water quality and habitat.
Moderate Land use measures– encourage sustainable forest practices and limit road crossings.
Water Quality: Removal of pollutants through sedimentation and adsorption and temperature regulation.
Low According to the 2004 Washington State Water Quality Assessment (Department of Ecology, 2004), Busy Wild Creek is not listed for any water quality impairments. Lack of inclusion in the assessment does not indicate that the waterbody is not impaired; smaller streams are often not sampled and may not reflect degraded water quality standards.
High Encouraging the preservation of riverine and associated wetlands within the contributing basin can increase water contact time with soil.

Pierce County Shoreline Inventory and Characterization Report
Appendix D – WRIA 11, Page 8 of 28 June 2009
Shoreline
Name
Ecosystem Process & Shoreline Function Level of Alteration Potential Protection and Restoration
Measures and Opportunities
Habitat: Shoreline riparian habitat for wildlife; vegetation provides structure and food sources.
Low Busy Wild Creek flows entirely within commercial forests owned by the Washington Department of Natural Resources and Champion Pacific Timberlands (Kerwin, 1999b). The riparian corridor can be characterized by young second growth which limits future LWD recruitment and the provision of shade (Watershed Professionals Network et al., 2002).
Moderate Replanting and enhancement of riparian buffers and associated wetlands can increase habitat values for wildlife.
Habitat: Source and delivery of LWD providing in channel habitat for fish and aquatic species.
Low to Moderate The riparian corridor can be characterized by young second growth which limits future LWD recruitment and the provision of shade. Busy Wild Creek supports winter steelhead, coho, channel catfish, coastal cutthroat trout, and fall Chinook. Coho, steelhead, and cutthroat salmon occur in Busy Wild Creek in low numbers (Kerwin, 1999b; Watershed Professionals Network et al., 2002). Winter steelhead, channel catfish, and cutthroat trout have a documented presence within the stream. Coho and fall Chinook have a presumed presence within the stream. PHS data indicate that all species utilize the stream for migration, and only winter steelhead has spawning habitat within the stream. There are several priority habitats associated with Busy Wild Creek: a large waterfowl concentration area, White River elk range areas, an Upper Nisqually River bald eagle use area, and the Mashel River riparian corridor, composed of conifers with patches of hardwoods intermixed (WDFW, 2007). Up to 94% of the shoreline area within the sub-basin is currently forested, grassland or undeveloped. However, forested cover is lacking in the lower section of Wilkeson Creek.
Moderate Implement measures to encourage preservation of trees in riparian area to support existing salmon habitat through shade and LWD recruitment.

Pierce County Shoreline Inventory and Characterization Report
June 2009 Appendix E – WRIA 11, Page 9 of 28
WRIA 11 – Little Mashel River
Shoreline Name
Ecosystem Process & Shoreline Function Level of Alteration Potential Protection and Restoration
Measures and Opportunities
Little Mashel River
Hydrology: Channel migration and floodplain connection
Low No levees or channel confinements are documented. Although creek is channelized in portions of the 0.32 mile reach that runs through the town of Eatonville.
Moderate Preserve existing natural channel migration zones. Restore natural channel configuration in lower reach.
Mashel River Sub-basin
Hydrology: Aquifer recharge
Low Total area of impermeable surface in the sub-basin is low with The Little Mashel River (Reaches 1 through 3) containing rural and agricultural use areas as well as areas with residential development. Approximately 136 acres (44 percent) of the Little Mashel River planning area is mapped as wetland based on the County GIS data.
High Preservation of natural vegetated cover and wetlands will preserve infiltration abilities in the watershed.
Hydrology: Flood flow retention
Low Natural connection to the river floodplain exists throughout the watershed.
Moderate Preserve floodplains along shoreline of creek and limit new development.
Sediment Generation and Transport: Upland sediment generation
Low to Moderate Fine sediment loading to the Little Mashel occurs due to agricultural and forest practices, thereby negatively affecting water quality and habitat.
High Implementation and retrofit of water quality BMPs to the existing stormwater system can reduce fine sediment loading. Land use measures for upper watershed – encourage sustainable forest practices and limit road crossings.
Water Quality: Removal of pollutants through sedimentation and adsorption and temperature regulation.
Low to Moderate Approximately 136 acres (44 percent) of the Little Mashel River planning area is mapped as wetland. Not on the 303d Ecology list of impaired waterbodies. Concentrations of total phosphorus increase in the Little Mashel River during storm events and are thought to be linked to total suspended solids present in the stream (Kerwin, 1999b).
High Encouraging the preservation and restoration of riverine and other wetlands within the contributing basin can increase water contact time with soil. Restoration of forested riparian zones.

Pierce County Shoreline Inventory and Characterization Report
Appendix D – WRIA 11, Page 10 of 28 June 2009
Shoreline
Name
Ecosystem Process & Shoreline Function Level of Alteration Potential Protection and Restoration
Measures and Opportunities
Habitat: Shoreline riparian habitat for wildlife; vegetation provides habitat structure and food sources.
Low The Little Mashel River flows through hobby farms and rural residential areas. The riparian corridor is largely intact and consists of hardwoods (Kerwin, 1999b). There are several areas of priority habitats associated with the Little Mashel River. These areas include: large waterfowl concentrations, numerous areas of the White River elk range, six Upper Nisqually River bald eagle use areas, an area of Mashel River wetlands, one small waterfowl concentration area, and several Mashel River riparian corridor habitat areas (WDFW, 2007).
Moderate to High Restoration of forested riparian areas and the protection of associated wetlands for the enhancement of waterfowl habitat.
Habitat: Source and delivery of LWD
Low to Moderate The riparian corridor is largely intact and consists of hardwoods (Kerwin, 1999b). There is a waterfall located at RM 0.8 which serves as a barrier to fish passage. The substrate of the stream is composed of cobble and boulders with limited areas of gravel (Watershed Professionals Network et al, 2002). According to PHS data, the Little Mashel River supports winter chum, winter steelhead, coho, fall Chinook, and coastal cutthroat trout. With the exception of winter chum, the rest of the species have a documented presence in the stream; winter chum have a presumed presence (WDFW, 2007). Winter steelhead and coho have known spawning areas within the Little Mashel River. Winter chum, fall Chinook and coastal cutthroat trout all have presence/migration within the river. Coastal cutthroat trout are found throughout the Little Mashel River subbasin, and coho and Chinook have been observed below the falls at RM 0.8. Only 0.8 miles of the Little Mashel River are accessible to salmonids.
Moderate The potential to re-introduce LWD through planting of conifers in the riparian zone.

Pierce County Shoreline Inventory and Characterization Report
June 2009 Appendix E – WRIA 11, Page 11 of 28
WRIA 11 – South Fork Little Mashel
Shoreline Name
Ecosystem Process & Shoreline Function Level of Alteration Potential Protection and Restoration
Measures and Opportunities
South Fork Little Mashel River
Hydrology: Channel migration and floodplain connection
Low No levees or channel confinements are documented.
Moderate Preserve existing natural channel migration zones.
Mashel River Sub-basin
Hydrology: Aquifer recharge
Low The South Fork of the Little Mashel River contains rural residential and agricultural use areas. There is no existing shoreline designation for the South Fork of the Little Mashel River. County zoning and Comprehensive Plan designations largely follow existing land use patterns, indicating that the reach is 100% Rural 10.
High Preservation of natural vegetated cover will preserve infiltration abilities in the upper watershed.
Hydrology: Flood flow retention
Low Natural connection to the river floodplain exists in the watershed.
Moderate Preserve floodplains along shoreline of creek and limit new development.
Sediment Generation and Transport: Upland sediment generation
Low to Moderate Fine sediment loading to the South Fork Little Mashel occurs due to agricultural and forest practices, thereby negatively affecting water quality and habitat.
High
Water Quality: Removal of pollutants through sedimentation and adsorption and temperature regulation.
Low to Moderate The Little Mashel River is not listed for any water quality impairments in the 2004 Washington State Water Quality Assessment (Department of Ecology, 2004). One area of special interest is an Ecology-identified suspected contaminated site in Reach 2 of Little Mashel Creek. This is an UST, which is listed as being actively used.
Low to Moderate
Habitat: Shoreline riparian habitat for wildlife; vegetation provides habitat structure and food sources.
Low There are several priority habitat areas associated with the South Fork of the Little Mashel River. These include small and large waterfowl concentration areas, an Upper Nisqually River bald eagle use area, several areas of the White River elk range, and areas included as part of the Mashel River riparian corridor habitat areas (WDFW, 2007).
Moderate Riparian forest restoration for long-term introduction of LWD and habitat improvements.

Pierce County Shoreline Inventory and Characterization Report
Appendix D – WRIA 11, Page 12 of 28 June 2009
Shoreline
Name
Ecosystem Process & Shoreline Function Level of Alteration Potential Protection and Restoration
Measures and Opportunities
Habitat: Source and delivery of LWD
Moderate PHS data does not specifically indicate the fish species that are supported in the South Fork of the Little Mashel River. Therefore, those species supported by the Little Mashel River are assumed to be supported by the South Fork.
Moderate Implement measures to encourage riparian revegetation and tree planting.

Pierce County Shoreline Inventory and Characterization Report
June 2009 Appendix E – WRIA 11, Page 13 of 28
WRIA 11 – Mashel River
Shoreline Name
Ecosystem Process & Shoreline Function Level of Alteration Potential Protection and Restoration
Measures and Opportunities
Mashel River
Hydrology: Channel migration and floodplain connection
Low No levies or other significant shoreline modifications are mapped along Mashel River.
High Preserve natural floodplain and channel migration.
Mashel River Sub-basin
Hydrology: Aquifer recharge
Low Approximately 129 acres (12 percent) of the Mashel River planning area is mapped as wetland based on GIS data.
High Preservation of natural vegetated cover will preserve infiltration abilities in the upper watershed. Prevent development that intercepts shallow subsurface flows, including ditches, roads and foundations.
Hydrology: Flood flow retention
Low The river lies mostly within agricultural and forest resource lands.
Moderate Restoration opportunities for Mashel Creek shorelines include restoring forested riparian areas where they are degraded due to agricultural practices and timber harvest.
Sediment Generation and Transport: Upland sediment generation
Low to Moderate Fine sediment loading to the Mashel River occurs due to agricultural and forest practices, thereby negatively affecting water quality and habitat.
Moderate Restoration opportunities include decommissioning timber roads or resurfacing gravel roads to reduce sedimentation inputs into streams, and replacing existing culverts, where appropriate

Pierce County Shoreline Inventory and Characterization Report
Appendix D – WRIA 11, Page 14 of 28 June 2009
Shoreline
Name
Ecosystem Process & Shoreline Function Level of Alteration Potential Protection and Restoration
Measures and Opportunities
Water Quality: Removal of pollutants through sedimentation and adsorption and temperature regulation.
Low According to the 2004 Washington State Water Quality Assessment (Department of Ecology, 2004), the Mashel River has one Category 5 (303(d)) listing for water quality impairment for temperature. The river also has a Category 2 listing for temperature and four Category 1 listings for dissolved oxygen, fecal coliform, pH, and temperature. Data from the Nisqually Indian Tribe’s water quality database from the 1990s indicates that minimum dissolved oxygen concentrations in the stream were above the State standard. In addition, temperature standards were exceeded at monitoring stations along the stream (Watershed Professionals Network et al, 2002). Forestry has been listed as probable sources for the temperature departures from the State standard. Forestry has also been listed as a probably source for elevated TSS concentrations in the stream during the wet season (Watershed Professionals Network et al, 2002).In addition, the Town of Eatonville operates a secondary treatment sewage plant that discharges into the Mashel River at RM 5.4. This facility is thought to be a source of elevated total phosphorus within the river.
High Encouraging the preservation of riverine and other wetlands within the contributing basin can increase water contact time with soil. Implement measures to reduce non-point sources of pollution such as – encourage sustainable forest practices, replanting riparian zones, restoring forested riparian areas, decommissioning timber roads or resurfacing gravel roads to reduce sedimentation inputs into streams, replacing existing culverts, and protection of associated wetlands.
Habitat: Shoreline riparian habitat for wildlife; vegetation provides habitat structure and food sources.
Low There are numerous priority habitats associated with the mainstem of the Mashel River. These habitats are inclusive of: Upper Nisqually bald eagle use areas; large waterfowl concentration areas; White River elk range; old growth habitat; snag rich habitat; candidate open space areas; and Mashel River riparian habitat, which is an assortment of large and small conifers with hardwoods interspersed that provide valuable habitat and fish resource protection (WDFW, 2007).
Moderate Restoration opportunities for Mashel Creek shorelines include restoring forested riparian areas where they are degraded due to agricultural practices and timber harvest.

Pierce County Shoreline Inventory and Characterization Report
June 2009 Appendix E – WRIA 11, Page 15 of 28
Shoreline
Name
Ecosystem Process & Shoreline Function Level of Alteration Potential Protection and Restoration
Measures and Opportunities
Habitat: Source and delivery of LWD
Low to Moderate LWD is noted to be lacking in the stream; restoration efforts by the Nisqually Tribe are underway and are successful (Leischner et al., 2006). The Mashel River subbasin has limited spawning areas. The upper portion of the basin is located in a steep canyon where spawning-sized material would not be expected to be found in large quantities. The lower portion of the mainstem (below RM 6.0) has a more moderate gradient and thus contains good quantities of spawning substrate (Watershed Professionals Network et al, 2002). There are small areas of spawning gravels found throughout the lower 3.2 river miles, but the dominant substrate is composed of small boulders and cobble (Kerwin, 1999b). A naturally occurring falls is present at RM 15.4 which blocks access to salmonids. The majority of the Mashel River flows through forested lands containing second growth timber. The lower 3.2 miles of the river are confined within a narrow canyon. The Mashel River is riprapped and channelized between RM 5.1 and RM 6.0. Upstream of RM 6.6, the river banks are unstable and failing in certain locations. In addition, low quantities of LWD exist along the river and because the riparian corridor is composed of young growth, future LWD recruitment and the provision of shade is limited (Watershed Professionals Network et al, 2002). Mashel River supports winter chum, winter steelhead, fall chum, coho, coastal cutthroat trout, channel catfish, sockeye, and pink salmon (WDFW, 2007).
Moderate The Nisqually Indian Tribe, South Puget Sound Salmon Enhancement Group, and Northwest Indian Fisheries Commission have worked together to enhance and monitor salmonid habitat in the Mashel River (Leischner et al., 2006). Large woody debris and log jams were installed in the lower 1.6 miles of the Mashel River in 2004 to improve instream fish habitat. In 2005, the stream was monitored to determine the success of these habitat structures. Fish surveys conducted in 2005 indicated that a large number of pink salmon and Chinook redds were counted in the lower Mashel River.

Pierce County Shoreline Inventory and Characterization Report
Appendix D – WRIA 11, Page 16 of 28 June 2009
WRIA 11 – Horn Creek
Shoreline
Name
Ecosystem Process & Shoreline Function Level of Alteration Potential Protection and Restoration
Measures and Opportunities
Horn Creek
Hydrology: Channel migration and floodplain connection
Low to Moderate
High
Drains directly to Nisqually River
Hydrology: Aquifer recharge
Low The shoreline planning area for Horn Creek is characterized by rural and agricultural land use patterns.
High Restoration of forested riparian areas, protection of associated wetlands for the enhancement of waterfowl and wildlife habitat, restoration of wetlands to enhance water quality improvement, and protection of stream water quality through use of best management practices for agricultural businesses and hobby farms in the basin.
Hydrology: Flood flow retention
Low Alterations to this reach include lack of a forested riparian zone and nutrient inputs from agricultural land uses.
Moderate
Sediment Generation and Transport: Upland sediment generation
Moderate Fine sediment loading to Horn Creek occurs due to agricultural and forest practices, thereby negatively affecting water quality and habitat.
High Encourage the use of best management practices to reduce sediment loss during agricultural lands uses, and replacing existing culverts where appropriate.
Water Quality: Removal of pollutants through sedimentation and adsorption and temperature regulation.
Low to Moderate According to the 2004 Washington State Water Quality Assessment (Department of Ecology, 2004), Horn Creek is not listed for any water quality impairments. Water quality in Horn Creek is thought to be adversely affected by the large commercial agricultural use and hobby farms present within the drainage basin. These agricultural uses are assumed to contribute higher levels of nutrients, such as phosphorus, to the waterbodies within the drainage basin (Kerwin, 1999b). Riparian wetlands are mapped along lower Horn Creek and where the stream joins the Nisqually River. Wetlands are mapped to comprise approximately 66 percent of the shoreline planning area.
High

Pierce County Shoreline Inventory and Characterization Report
June 2009 Appendix E – WRIA 11, Page 17 of 28
Shoreline
Name
Ecosystem Process & Shoreline Function Level of Alteration Potential Protection and Restoration
Measures and Opportunities
Habitat: Shoreline riparian habitat for wildlife; vegetation provides habitat structure and food sources.
Low to Moderate There are several priority habitat areas associated with Horn Creek. There are three Nisqually River wetland areas, comprised of various wetland types, including forested, riverine, emergent marsh and scrub-shrub. In addition, there are three small Pierce County waterfowl concentrations, and two large waterfowl concentration areas (WDFW, 2007).
Moderate to High
Habitat: Source and delivery of LWD
Moderate Although no formal investigations have been done on riparian habitat within this drainage basin, the lower reaches of Horn Creek have been reported to contain large amounts of LWD, due to the contribution of active beaver colonies. In addition, other data indicates that the riparian habitat along Horn Creek can be generally characterized as being composed of moderate aged hardwoods and some second growth conifers (Kerwin, 1999b). This stream supports populations of coho, fall Chinook, pink salmon, winter chum, winter steelhead, and cutthroat trout. All of these species have a documented presence within the stream. According to PHS data, coho have presence/migration, known spawning and known juvenile rearing in portions of the stream. Winter steelhead have presence/migration in the stream. Fall Chinook have presence/migration and known juvenile rearing. Winter chum have known spawning areas within the stream, and pink salmon have presence/migration within the stream (WDFW, 2007). Fall Chinook, coho and chum have been observed spawning in the lower reaches of Horn Creek (Kerwin, 1999b).
High

Pierce County Shoreline Inventory and Characterization Report
Appendix D – WRIA 11, Page 18 of 28 June 2009
WRIA 11 – Lynch Creek and Twenty-five Mile Creek
Shoreline
Name
Ecosystem Process & Shoreline Function Level of Alteration Potential Protection and Restoration
Measures and Opportunities
Lynch Creek and Twenty-five Mile Creek
Hydrology: Channel and floodplain connection
Low No levees or other significant shoreline modifications are mapped along Lynch Creek or Twenty-five Mile Creek.
High Preserve and protect natural floodplain and channel migration zone.
Ohop Creek Sub-basin
Hydrology: Aquifer recharge
Moderate Both creeks pass from timberland in upper reaches, through rural and agricultural areas in the lower reaches.
Moderate to High Restore riparian forests and replant clearcut areas in the upper basin to slow surface water runoff and improve aquifer recharge capabilities.
Hydrology: Flood flow retention
Low A narrow forested riparian corridor is maintained surrounding Lynch Creek.
Moderate Restoration opportunities include restoring forested riparian areas where they are degraded due to timber harvest and gravel mining.
Sediment Generation and Transport: Upland sediment generation
Low to Moderate Forestry has been listed as a probably cause of the elevated levels of total suspended solids (TSS) within Lynch Creek. Stormwater drainage from an abandoned clay mine is thought to be a contributor of additional sediments to the lower reaches of the Twenty-five Mile Creek.
Moderate Revegetation of riparian areas, decommissioning forest roads that cause siltation of streams, slope stabilization, and mine restoration.

Pierce County Shoreline Inventory and Characterization Report
June 2009 Appendix E – WRIA 11, Page 19 of 28
Shoreline
Name
Ecosystem Process & Shoreline Function Level of Alteration Potential Protection and Restoration
Measures and Opportunities
Water Quality: Removal of pollutants through sedimentation and adsorption and temperature regulation.
Low According to the 2004 Washington State Water Quality Assessment (Department of Ecology, 2004), Lynch Creek is not listed for any water quality impairments, and Twenty-five Mile Creek has one Category 2 listing for water quality impairment. Lynch Creek receives discharge from the Town of Eatonville’s stormwater collection, which contributes to a sediment load that is 17% above background values in the stream (Watershed Professionals Network et al, 2002). Forestry has been listed as a probably cause of the elevated levels of total suspended solids (TSS) within the stream. One area of special interest is an Ecology-identified suspected contaminated site in Reach 4 of Lynch Creek.
High Encouraging the preservation and restoration of riverine and associated wetlands within the contributing basin can increase water contact time with soil.
Habitat: Shoreline riparian habitat for wildlife; vegetation provides structure and food sources.
Moderate Priority habitat areas associated with Lynch Creek and Smith Creek include: Puyallup steep open spaces (urban natural open space); White River elk range; Ohop Creek riparian corridor areas which are comprised of an assortment of conifer, mixed trees, and broadleaf shrub riparian habitat; waterfowl concentration areas; and Upper Nisqually River bald eagle use area; and Ohop Creek wetland areas, comprised of forested, riparian, shrub, and agricultural wetlands (WDFW, 2007). Both creeks flow through commercially-owned timberlands, to rural residential areas and hobby farms throughout the lower mile of the stream. There is also an abandoned clay mine on Twenty-five Mile Creek (Watershed Professionals Network et al, 2002).
Moderate Replanting and enhancement of riparian buffers and associated wetlands can increase habitat values for wildlife.

Pierce County Shoreline Inventory and Characterization Report
Appendix D – WRIA 11, Page 20 of 28 June 2009
Shoreline
Name
Ecosystem Process & Shoreline Function Level of Alteration Potential Protection and Restoration
Measures and Opportunities
Habitat: Source and delivery of LWD providing in channel habitat for fish and aquatic species.
Low to Moderate Riparian zones are lacking in LWD and delivery to the creek is reduced. Logging in the upper watershed has removed timber in the 200 foot riparian zone. Lynch Creek supports channel catfish, coastal cutthroat trout, coho, pink salmon, winter steelhead, fall Chinook, winter chum, and sockeye. Twenty-five Mile Creek supports coho, winter steelhead, pink salmon, and coastal cutthroat trout.
Moderate Replant and reforest the shoreline riparian zone to enhance LWD delivery to both creeks.

Pierce County Shoreline Inventory and Characterization Report
June 2009 Appendix E – WRIA 11, Page 21 of 28
WRIA 11 – Ohop Creek
Shoreline Name
Ecosystem Process & Shoreline Function Level of Alteration Potential Protection and Restoration
Measures and Opportunities
Ohop Creek
Hydrology: Channel migration and floodplain connection
Low to Moderate Downstream of Ohop Lake, the effects of channelization associated with past agricultural activities are evident in the form of little or no off-channel rearing opportunities and meanders, and a lack of riparian area (Kerwin, 1999b).
High Preserve natural floodplain areas.
Ohop Creek sub-basin
Hydrology: Aquifer recharge
Low Ohop Creek passes through predominantly rural and agricultural areas, although areas of forestry use also occur.
High Restore vegetated cover to preserve infiltration abilities in the watershed.
Hydrology: Flood flow retention
Low Channel-floodplain interaction is modified in some sections; however, the natural connection to the river floodplain exists in the upper watershed
Moderate Revegetation of riparian areas and restore associated wetlands.
Sediment Generation and Transport: Upland sediment generation
Moderate Because of the low gradient of the stream, there are high sediment concentrations throughout, and spawning locations have been documented to contain more than 17% fines.
High Restoration of forested riparian areas, using best management practices to reduce sediment loss during agricultural lands uses.
Water Quality: Removal of pollutants through sedimentation and adsorption and temperature regulation.
Low to Moderate Approximately 682 acres (70 percent) of the Ohop Creek planning area consists of wetland, based on GIS data. According to the 2004 Washington State Water Quality Assessment (Department of Ecology, 2004), Ohop Creek has one Category 5 (303(d)) listing for fecal coliform. In addition, Ohop Creek has four Category 1 listings for temperature, dissolved oxygen, and pH. There is low dissolved oxygen present throughout the stream, due in part to the lack of riparian corridor.
High Implement measures to reduce non-point sources of pollution such as replacing failing culverts, developing BMPs for forest practice and agricultural operations, and replanting riparian zones.
Habitat: Shoreline riparian habitat for wildlife; vegetation provides habitat structure and food sources.
Low to Moderate Ohop Creek has varying riparian habitat along different reaches of the stream including: a narrow hardwood riparian corridor, channelized creek with no intact riparian corridor present, small areas of pools and riffles formed by the woody inputs of the riparian area, and a portion of the creek flows through Ohop Lake.
Moderate to High Replanting and enhancement of riparian buffers and associated wetlands can increase habitat values for wildlife, and replacing existing culverts where appropriate to improve fish passage.

Pierce County Shoreline Inventory and Characterization Report
Appendix D – WRIA 11, Page 22 of 28 June 2009
Shoreline
Name
Ecosystem Process & Shoreline Function Level of Alteration Potential Protection and Restoration
Measures and Opportunities
Habitat: Source and delivery of LWD
Moderate Due to the limited riparian corridor, instream LWD is low and water temperatures within the stream are high. Ohop Creek supports the following fish species: winter steelhead, coho, sockeye, coastal cutthroat trout, channel catfish, pink salmon, winter chum, and fall Chinook.
High The potential for riparian forest restoration is high. The opportunity to re-introduce LWD exists by restoring riparian areas.

Pierce County Shoreline Inventory and Characterization Report
June 2009 Appendix E – WRIA 11, Page 23 of 28
WRIA 11 – Muck Creek and South Creek
Shoreline
Name
Ecosystem Process & Shoreline Function Level of Alteration Potential Protection and Restoration
Measures and Opportunities
Muck Creek and South Creek
Hydrology: Channel migration and floodplain connection
Low A large portion of Muck Creek and its tributaries have been channelized and cleared, leading to a narrow, confined stream channel with limited floodplains. The combination of channel constriction, straightening, and clearing serves to increase water velocity and significantly degrades habitat quality for salmon, specifically a loss of quality pool habitat (Pierce County Public Works and Utilities, 2003).
High Implement measures to encourage riparian revegetation and placement of LWD where appropriate.
Muck Creek sub-basin
Hydrology: Aquifer recharge
Low Approximately 85 acres (43 percent) of the Muck Creek planning area is wetland, based on County GIS data. Rural residential development and agricultural land uses with narrow riparian forested wetlands in some areas occur along much of Muck Creek upstream of Fort Lewis. The South Creek shoreline planning area contains extensive wetlands.
High Implement measures to encourage restoration of wetlands and reforestation.
Hydrology: Flood flow retention
Low There are numerous reaches of the main stem of Muck Creek and its tributaries with no riparian vegetation other than grasses. Where riparian vegetation does exist, it is dominated by species such as alders, maples, cottonwood, salmonberry, and reed canarygrass (Pierce County Public Works and Utilities, 2003). Reed canarygrass is a significant problem in the overall Muck Creek Basin, as it has a widespread occurrence and fills small channels and can serve to confine larger channels, which ultimately leads to reduced channel conveyance capacity and flooding hazards (Pierce County Public Works and Utilities, 2003).
Moderate Restoring forested riparian areas, using best management practices to reduce sediment loss during agricultural lands uses, and replacing existing culverts, where appropriate to improve fish passage. Removal and control of invasive plant species such as reed canarygrass is also an opportunity for shoreline restoration.

Pierce County Shoreline Inventory and Characterization Report
Appendix D – WRIA 11, Page 24 of 28 June 2009
Shoreline
Name
Ecosystem Process & Shoreline Function Level of Alteration Potential Protection and Restoration
Measures and Opportunities
Sediment Generation and Transport: Upland sediment generation
Moderate Sedimentation, primarily caused by unrestricted livestock access to the stream, has been found to be heavy in glide areas and moderate in areas with intermediate gradients. This sedimentation has led to a lack of suitable stream substrate for fish spawning. Sedimentation and bank stability area issues are areas of special interest for Muck Creek.
High Encourage sustainable agricultural practices including the exclusion of cattle from the riparian zone, replace failing culverts, replant riparian areas, and limit road crossings.
Water Quality: Removal of pollutants through sedimentation and adsorption and temperature regulation.
Low to Moderate There are two major water quality issues occurring in the Muck Creek Basin: temperature and bacteria, and the water quality standards for these two parameters are frequently exceeded (Pierce County Public Works and Utilities, 2003). According to the 2004 Washington State Water Quality Assessment (Department of Ecology, 2004), Muck Creek has two Category 2 listings for dissolved oxygen and fecal coliform, and two Category 1 listings for pH and temperature. South Creek is not listed for any water quality impairments. However, according to recent water quality data for Muck Creek (2000-2001), the chemical quality of the stream is reasonably good, and observations have indicated that Muck Creek was least impacted by nonpoint source pollution out of the major streams in the Lower Nisqually River Basin (Pierce County Public Works and Utilities, 2003).
Moderate Encourage sustainable agricultural practices including the exclusion of cattle from the riparian zone and the revegetation of riparian areas.
Habitat: Shoreline riparian habitat for wildlife; vegetation provides habitat structure and food sources.
Low to Moderate There are several priority habitats associated with Muck Creek. There are two large waterfowl concentration areas; Muck Creek wetland areas which are composed of forested, emergent, and scrub-shrub wetlands; and areas of Muck Creek riparian habitats, which include some riverine wetlands (WDFW, 2007). The lower section of South Creek, above 8th Avenue, has been classified as having highly suitable habitat (Pierce County Public Works and Utilities, 2003).
Moderate Replanting and enhancement of riparian buffers and associated wetlands can increase habitat values for wildlife.

Pierce County Shoreline Inventory and Characterization Report
June 2009 Appendix E – WRIA 11, Page 25 of 28
Shoreline
Name
Ecosystem Process & Shoreline Function Level of Alteration Potential Protection and Restoration
Measures and Opportunities
Habitat: Source and delivery of LWD
Moderate Muck Creek supports the following species: winter chum, winter steelhead, coho, coastal cutthroat trout, fall Chinook, and pink salmon (WDFW, 2007). There are no known man-made barriers to salmon migration on Muck Creek (Kerwin, 1999b).
High The potential for riparian forest restoration is high. The opportunity to re-introduce LWD exists by restoring riparian areas.

Pierce County Shoreline Inventory and Characterization Report
Appendix D – WRIA 11, Page 26 of 28 June 2009
WRIA 11 – Tanwax Creek
Shoreline
Name
Ecosystem Process & Shoreline Function Level of Alteration Potential Protection and Restoration
Measures and Opportunities
Tanwax Creek Tributary to Nisqually River
Hydrology: Channel migration and floodplain connection
Low to Moderate The stream has been channelized in the past and upstream of RM 6.5, the effects of past channelization are present (Watershed Professionals Network et al, 2002).
High Restoration includes returning the creek to original channels and eliminating ditching and draining of wetlands.
Hydrology: Aquifer recharge
Low Land use in the lower portion of Tanwax Creek is comprised of forested area, agricultural land use is primarily found within the middle reach, and non-rural recreational and residential homes are located within the upper reach along the lakes associated with the stream (Watershed Professionals Network et al, 2002).
High Wetlands associated with Tanwax Creek should be re-habilitated and forested cover restored.
Hydrology: Flood flow retention
Low Flood flow retention in limited due to the lack of forested cover throughout much of the riparian area.
Moderate Replant riparian zones and disturbed wetlands.
Sediment Generation and Transport: Upland sediment generation
Moderate Fine sediment load is high within the stream due to actively eroding sites and the historical agricultural activities taking place within the basin (Kerwin, 1999b). These fine sediments are deposited in downstream wetland areas.
High Restoration of forested riparian areas and using best management practices to reduce sediment loss and erosion during agricultural practices.

Pierce County Shoreline Inventory and Characterization Report
June 2009 Appendix E – WRIA 11, Page 27 of 28
Shoreline
Name
Ecosystem Process & Shoreline Function Level of Alteration Potential Protection and Restoration
Measures and Opportunities
Water Quality: Removal of pollutants through sedimentation and adsorption and temperature regulation.
Low to Moderate The upper portion of Tanwax Creek flows through a series of small lakes and wetlands containing a variety of wetland habitat types. According to the 2004 Washington State Water Quality Assessment (Department of Ecology, 2004), Tanwax Creek has four Category 1 listings for dissolved oxygen, fecal coliform, pH and temperature. The system of open water wetlands along the stream are believed to be a contributor to the elevated water temperatures in the stream (Kerwin, 1999b). The Nisqually Indian Tribe’s water quality database indicates that for monitoring conducted between 1991 and 1997, the creek had dissolved oxygen levels that exceeded state standards, and that were more pronounced during the summer months. In further studies, fecal coliform levels were found to exceed the State standard (Watershed Professionals Network et al, 2002).
High Wetlands associated with Tanwax Creek should be re-habilitated and forested cover restored to reduce instream temperatures and improve fish habitat.
Habitat: Shoreline riparian habitat for wildlife; vegetation provides habitat structure and food sources.
Low to Moderate There are several priority habitats associated with Tanwax Creek. These habitat areas include old growth/mature forest habitat; Tanwax Creek riparian corridor habitat, comprised of mixed trees, broadleaf trees, shrubs, and agricultural areas; candidate open space areas (urban natural open space); Lower Nisqually River riparian habitat, which is located below the Alder Dam and has been designated to preserve wild fish populations; multiple Upper Nisqually River bald eagle use areas; small and large waterfowl concentration areas; snag rich habitats; and Tanwax Creek riparian areas, comprised of a mix of forested, emergent marsh, scrub-shrub, and riverine wetland areas (WDFW, 2007).
Moderate to High Replanting and enhancement of riparian buffers and associated wetlands can increase habitat values for wildlife.

Pierce County Shoreline Inventory and Characterization Report
Appendix D – WRIA 11, Page 28 of 28 June 2009
Shoreline
Name
Ecosystem Process & Shoreline Function Level of Alteration Potential Protection and Restoration
Measures and Opportunities
Habitat: Source and delivery of LWD
Low Sources for LWD are lacking throughout much of the sub-basin due to the lack of forested cover. Tanwax Creek supports Kokanee, coho, coastal cutthroat trout, winter steelhead, winter chum, pink, and fall chum. All of these species have a document presence within the stream, with the exception of winter steelhead, which has a presumed presence (WDFW, 2007). Kokanee, coastal cutthroat trout, winter steelhead, pink, and fall Chinook have presence/migration within the stream.
Low to Moderate The opportunity to re-introduce LWD exists by restoring riparian areas.

Pierce County Shoreline Inventory and Characterization Report
June 2009 Appendix E – WRIA 12, Page 1 of 7
WRIA 12 – Chambers Creek
Shoreline Name Ecosystem Process &
Shoreline Function Level of Alteration Potential Protection and Restoration Measures and Opportunities
Chambers Creek
Hydrology: Channel and floodplain connection
Moderate Near RM 2.0, portions of the stream are channelized with concrete bulkheads. Shoreline modifications are associated with areas where residential development is closest to Chambers Creek, likely constructed to protect homes, accessory structures, and upland property. Chambers Creek is deeply incised into an upland plateau that limits natural channel migration and floodplain width.
Moderate Preserve existing natural channel migration zones. Remove structures from bulkheaded or channelized sections.
Hydrology: Aquifer recharge
High Limited recharge due to groundwater extraction and use has modified the amount of water available, particularly during low flow periods. Sub-basin is highly urbanized with 43% of land area developed (impervious surface) with 11% of watershed in forest cover, grasslands, or undeveloped.
Moderate Restore native riparian vegetation. Remove impervious surface where practical and use low impact development techniques to infiltrate stormwater.
Hydrology: Flood flow retention
Low to Moderate Flood hazards that occur along Chambers Creek are associated with streamflow and the interaction with the shallow groundwater table in the region.
Moderate Preserve floodplains along shoreline of creek and limit new development.
Sediment Generation and Transport: Upland sediment generation
Moderate Urbanization of the Chambers Creek basin has resulted in increased sediment loading from stormwater runoff.
Moderate Implementation and retrofit of water quality BMPs to the existing stormwater system can reduce fine sediment loading.

Pierce County Shoreline Inventory and Characterization Report
Appendix E – WRIA 12, Page 2 of 7 June 2009
Shoreline Name Ecosystem Process &
Shoreline Function Level of Alteration Potential Protection and Restoration Measures and Opportunities
Water Quality: Removal of pollutants through sedimentation and adsorption and temperature regulation.
High Much of the Chambers-Clover Creek Watershed has been urbanized and, as a result, associated streams have incurred impacts such as extreme water level fluctuations (increased flooding and summer low-flow levels) and increased temperatures. Chambers Creek has one 303(d) listing (Category 5 listing) for impaired water quality: fecal coliform. In addition, Chambers Creek contains a Category 4A listing for copper; two Category 2 listings for pH and temperature; and ten Category 1 listings for ammonia-N, arsenic, copper, dissolved oxygen, lead, mercury, pH, total PCBs, zinc, and temperature.
Low to Moderate Encouraging the preservation of riverine and other wetlands within the contributing basin can increase water contact time with soil. Implement measures to reduce non-point sources of pollution such as replacing failing septic systems, developing BMPs for existing stormwater systems, and replanting riparian zones.
Habitat: Shoreline riparian habitat for wildlife; vegetation provides structure and food sources.
Low Approximately 23 acres (94 percent) of the Chambers Creek shoreline planning area consists of wetlands. The lower 2 miles of Chambers Creek is surrounded mainly by undeveloped riparian forest, which is protected as the Chambers Creek Canyon Park; however, a private golf course, the Oakbrook Golf Course, is located directly south of Chambers Creek Canyon Park.
High The potential for riparian forest restoration is high. The opportunity to re-introduce LWD, either through planting or placement, exists.
Habitat: Source and delivery of LWD providing in channel habitat for fish and aquatic species.
Moderate to High Outside of Chambers Creek Canyon Park, moderate density single-family residential development limit woody debris input.
Moderate The potential to re-introduce LWD, either through planting or placement, exists. Implement measures to encourage riparian revegetation and tree planting.

Pierce County Shoreline Inventory and Characterization Report
June 2009 Appendix E – WRIA 12, Page 3 of 7
WRIA 12 – Clover Creek
Shoreline Name
Ecosystem Process & Shoreline Function Level of Alteration Potential Protection and Restoration
Measures and Opportunities
Clover Creek
Hydrology: Channel migration and floodplain connection
High The stream has experienced significant modifications over many years. These included rechanneling the stream into two large canals for irrigation; dredging and diking on the McChord Air Force base; and other modifications resulting from the construction of stream-fed ponds in the eastern and central portions of the basin. In places the stream has connections with wetlands and a vegetated buffer typically greater than 100 feet wide to both sides, but a channelized asphalt lined creek bottom or culverts are common.
Low Preserve existing natural channel migration zones. However, significant stream modifications limit restoration opportunities.
Hydrology: Aquifer recharge
Moderate to High Vertical culverts that divert high flows into deeper aquifers have been installed; however, groundwater extraction and use has modified the amount of water available, particularly during low flow periods.
Low Preservation of natural vegetated cover will preserve infiltration abilities in the upper watershed, limit water use during summer months.
Hydrology: Flood flow retention
Moderate Flood hazards occur along Clover Creek and are associated with streamflow and the interaction with the shallow groundwater table in the region. Flooding associated with groundwater can occur throughout the large outwash channel, generally south of Clover Creek within WRIA 12. Installation of large regional retention facilities and in-line and off-line privately-held ponds have increased flood flow retention.
Moderate Preserve floodplains along shoreline of creek and limit new development.
Sediment Generation and Transport: Upland sediment generation
High Land conversion from forest to pasture, lawn, or impervious surfaces.
High Implementation and retrofit of water quality BMPs to the existing stormwater system can reduce fine sediment loading.

Pierce County Shoreline Inventory and Characterization Report
Appendix E – WRIA 12, Page 4 of 7 June 2009
Shoreline
Name
Ecosystem Process & Shoreline Function Level of Alteration Potential Protection and Restoration
Measures and Opportunities
Water Quality: Removal of pollutants through sedimentation and adsorption and temperature regulation.
High Clover Creek has three 303(d) listings (Category 5 listings) for impaired water quality: dissolved oxygen, fecal coliform, and temperature. Reaches of Clover Creek also contain six Category 2 listings for dissolved oxygen, fecal coliform, lead, mercury, pH, and temperature. In addition, various reaches of Clover Creek contain Category 1 listings for ammonia-N, arsenic, cadmium, chromium, copper, nickel, pH, and zinc.
The northwestern portion of the basin is highly urbanized and the majority of the eastern half of the basin relies on septic tanks and drainfields for sewage disposal. Stormwater outfalls and runoff from commercial and industrial uses, as well as sources such as the Brookdale Golf Course, are all potential sources of water quality degradation.
Low Encouraging the preservation of riverine and other wetlands within the contributing basin can increase water contact time with soil. Implement measures to reduce non-point sources of pollution such as replacing culverts, developing BMPs for existing stormwater systems, and replanting riparian zones.
Habitat: Shoreline riparian habitat for wildlife; vegetation provides habitat structure and food sources.
Moderate to High Approximately 88 acres (32 percent) of the Clover Creek planning area is mapped as wetland. The majority of the stream reaches have been modified with a variety of structures, including weirs, asphalt substrate, bank armoring, culverts, bridges, and dams. Due to these alterations, no reaches were found to have highly suitable habitat use. Riparian vegetation consists in large part of non-native species.
Low The potential for riparian forest restoration is low. The opportunity to re-introduce LWD, either through planting or placement, exists.

Pierce County Shoreline Inventory and Characterization Report
June 2009 Appendix E – WRIA 12, Page 5 of 7
Shoreline
Name
Ecosystem Process & Shoreline Function Level of Alteration Potential Protection and Restoration
Measures and Opportunities
Habitat: Source and delivery of LWD
High The combination of limited to no woody debris, the removal of LWD, and the majority of the stream reaches being modified with a variety of armoring, reduce available sources of woody debris.
Low Implement measures to encourage riparian revegetation and tree planting, where possible.

Pierce County Shoreline Inventory and Characterization Report
Appendix E – WRIA 12, Page 6 of 7 June 2009
WRIA 12 – Spanaway Creek
Shoreline Name
Ecosystem Process & Shoreline Function Level of Alteration Potential Protection and Restoration
Measures and Opportunities
Spanaway Creek
Hydrology: Channel migration and floodplain connection
Moderate The upper third of Spanaway Creek, within the park/open space area, has not been modified. Downstream of the park, portions of the stream are channelized and modified with concrete and other hard banks to protect homes. The uppermost two reaches have unchannelized sections with connections to side channels and wetlands; however, the uppermost reach, beginning at the outlet of Spanaway Lake, has banks hardened with riprap. A stream diversion into an asphalt-lined ditch occurs around Pacific Lutheran University. The lower two-thirds of the creek pass through low to areas with predominantly low to moderate density single-family residential land use.
Moderate Preserve existing natural channel migration zones.
Hydrology: Aquifer recharge
Moderate to High Vertical culverts that divert high flows into deeper aquifers have been installed. Groundwater extraction and use has modified the amount of water available during low flow periods.
Low Preservation of natural vegetated cover will preserve infiltration abilities in the upper watershed, limit water use during summer months.
Hydrology: Flood flow retention
Low to Moderate Installation of a weir 2,200 feet downstream of the Spanaway Lake outlet affects flood flow retention in the stream. Other alterations include n-line and off-line privately-held ponds.
Low Preserve floodplains along shoreline of creek and limit new development.
Sediment Generation and Transport: Upland sediment generation
Low to Moderate The upper third section of Spanaway Creek passes through Bresemann Forest and Spanaway Park.
Moderate to High Implementation and retrofit of water quality BMPs to the existing stormwater system can reduce fine sediment loading. Land use measures for upper watershed – encourage open space.

Pierce County Shoreline Inventory and Characterization Report
June 2009 Appendix E – WRIA 12, Page 7 of 7
Shoreline
Name
Ecosystem Process & Shoreline Function Level of Alteration Potential Protection and Restoration
Measures and Opportunities
Water Quality: Removal of pollutants through sedimentation and adsorption and temperature regulation.
Low to Moderate Spanaway Creek was not listed on the 303(d) list for any water quality parameters in 2004. However, a segment of the stream did contain a Category 2 listing for temperature. Sources of nutrient and waste accumulation include on-site sewerage systems that pose an elevated risk for groundwater contamination because of the permeable soils and dry wells belonging to businesses along the Pacific Avenue corridor that are used for disposal of wastewater and stormwater.
Moderate Encouraging the preservation of riverine and other wetlands within the contributing basin can increase water contact time with soil. Implement measures to reduce non-point sources of pollution such as updating septic systems, developing BMPs for existing stormwater systems, and replanting riparian zones.
Habitat: Shoreline riparian habitat for wildlife; vegetation provides habitat structure and food sources.
Low Approximately 88 acres (51 percent) of the Spanaway Creek shoreline planning area consists of wetlands. Spanaway Creek is documented as a riparian zone because it provides a riparian corridor in connection with Chambers Creek and its fish hatcheries. The vegetated riparian buffer around Spanaway Creek is largely maintained throughout the residential areas. The upper third of the creek lies in Spanaway Park.
Moderate to High The potential for riparian forest restoration is high. The opportunity to re-introduce LWD, either through planting or placement, exists.
Habitat: Source and delivery of LWD
Low to Moderate In the middle reach, pools were observed, along with woody debris and a connected wetland. In the uppermost reach, beginning at the outlet of Spanaway Lake, very few pieces of woody debris and no pool habitat were observed.
Moderate Implement measures to encourage riparian revegetation and tree planting.
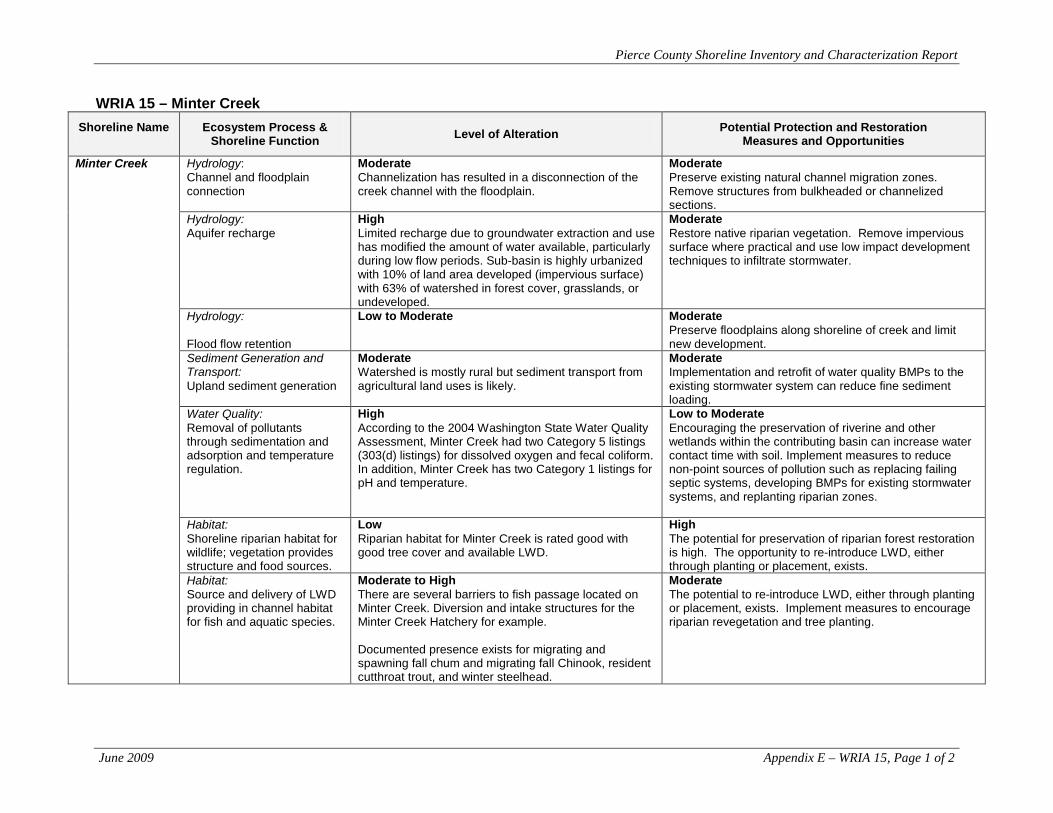
Pierce County Shoreline Inventory and Characterization Report
June 2009 Appendix E – WRIA 15, Page 1 of 2
WRIA 15 – Minter Creek Shoreline Name Ecosystem Process &
Shoreline Function Level of Alteration Potential Protection and Restoration Measures and Opportunities
Minter Creek
Hydrology: Channel and floodplain connection
Moderate Channelization has resulted in a disconnection of the creek channel with the floodplain.
Moderate Preserve existing natural channel migration zones. Remove structures from bulkheaded or channelized sections.
Hydrology: Aquifer recharge
High Limited recharge due to groundwater extraction and use has modified the amount of water available, particularly during low flow periods. Sub-basin is highly urbanized with 10% of land area developed (impervious surface) with 63% of watershed in forest cover, grasslands, or undeveloped.
Moderate Restore native riparian vegetation. Remove impervious surface where practical and use low impact development techniques to infiltrate stormwater.
Hydrology: Flood flow retention
Low to Moderate
Moderate Preserve floodplains along shoreline of creek and limit new development.
Sediment Generation and Transport: Upland sediment generation
Moderate Watershed is mostly rural but sediment transport from agricultural land uses is likely.
Moderate Implementation and retrofit of water quality BMPs to the existing stormwater system can reduce fine sediment loading.
Water Quality: Removal of pollutants through sedimentation and adsorption and temperature regulation.
High According to the 2004 Washington State Water Quality Assessment, Minter Creek had two Category 5 listings (303(d) listings) for dissolved oxygen and fecal coliform. In addition, Minter Creek has two Category 1 listings for pH and temperature.
Low to Moderate Encouraging the preservation of riverine and other wetlands within the contributing basin can increase water contact time with soil. Implement measures to reduce non-point sources of pollution such as replacing failing septic systems, developing BMPs for existing stormwater systems, and replanting riparian zones.
Habitat: Shoreline riparian habitat for wildlife; vegetation provides structure and food sources.
Low Riparian habitat for Minter Creek is rated good with good tree cover and available LWD.
High The potential for preservation of riparian forest restoration is high. The opportunity to re-introduce LWD, either through planting or placement, exists.
Habitat: Source and delivery of LWD providing in channel habitat for fish and aquatic species.
Moderate to High There are several barriers to fish passage located on Minter Creek. Diversion and intake structures for the Minter Creek Hatchery for example. Documented presence exists for migrating and spawning fall chum and migrating fall Chinook, resident cutthroat trout, and winter steelhead.
Moderate The potential to re-introduce LWD, either through planting or placement, exists. Implement measures to encourage riparian revegetation and tree planting.

Pierce County Shoreline Inventory and Characterization Report
Appendix E – WRIA 15, Page 2 of 2 June 2009
WRIA 15 – Rocky Creek Shoreline Name Ecosystem Process &
Shoreline Function Level of Alteration Potential Protection and Restoration Measures and Opportunities
Rocky Creek
Hydrology: Channel and floodplain connection
Moderate Channelization has resulted in a disconnection of the creek channel with the floodplain.
Moderate Preserve existing natural channel migration zones. Remove structures from bulkheaded or channelized sections.
Hydrology: Aquifer recharge
High Limited recharge due to groundwater extraction and use has modified the amount of water available, particularly during low flow periods. Sub-basin is highly urbanized with 2% of land area developed (impervious surface) with 84% of watershed in forest cover, grasslands, or undeveloped.
Moderate Restore native riparian vegetation. Remove impervious surface where practical and use low impact development techniques to infiltrate stormwater.
Hydrology: Flood flow retention
Low to Moderate Flood hazards that occur along Rocky Creek are associated with streamflow and the interaction with the shallow groundwater table in the region.
Moderate Preserve floodplains along shoreline of creek and limit new development.
Sediment Generation and Transport: Upland sediment generation
Moderate Sediment loading occurs due to agricultural and residential uses.
Moderate Implementation and retrofit of water quality BMPs to the existing stormwater system can reduce fine sediment loading.
Water Quality: Removal of pollutants through sedimentation and adsorption and temperature regulation.
Low Rocky Creek has one Category 2 listing for dissolved oxygen and one Category 1 listing for temperature.
Low to Moderate Encouraging the preservation of riverine and other wetlands within the contributing basin can increase water contact time with soil. Implement measures to reduce non-point sources of pollution such as replacing failing septic systems, developing BMPs for existing stormwater systems, and replanting riparian zones.
Habitat: Shoreline riparian habitat for wildlife; vegetation provides structure and food sources.
Low The lower 2 miles of Chambers Creek is surrounded mainly by undeveloped riparian forest, which is protected as the Chambers Creek Canyon Park; however, a private golf course, the Oakbrook Golf Course, is located directly south of Chambers Creek Canyon Park.
High The potential for riparian forest restoration is high. The opportunity to re-introduce LWD, either through planting or placement, exists.
Habitat: Source and delivery of LWD providing in channel habitat for fish and aquatic species.
Moderate to High Rocky Creek supports several salmonid species: Chinook, chum, coho, steelhead, and cutthroat trout (Pierce County, 2005e). Rocky Creek is known to support spawning summer chum and is documented as providing suitable habitat for migrating summer chum. Fall chum are known to be present during migration and spawning.
Moderate The potential to re-introduce LWD, either through planting or placement, exists. Implement measures to encourage riparian revegetation and tree planting.