picometer-scale surface roughness measurements inside ... · picometer-scale surface roughness...
TRANSCRIPT

Picometer-scale surface roughness measurements inside
hollow glass fibres
C Brun, X Buet, B Bresson, M.S. Capelle, M Ciccotti, A Ghomari, P
Lecomte, J.P. Roger, M.N. Petrovitch, F Poletti, et al.
To cite this version:
C Brun, X Buet, B Bresson, M.S. Capelle, M Ciccotti, et al.. Picometer-scale surface roughnessmeasurements inside hollow glass fibres. Optics Express, Optical Society of America, 2014,optics express, 22 (24), pp.29554-29567. <10.1364/OE.22.029554>. <hal-01240868>
HAL Id: hal-01240868
https://hal.archives-ouvertes.fr/hal-01240868
Submitted on 5 Jul 2016
HAL is a multi-disciplinary open accessarchive for the deposit and dissemination of sci-entific research documents, whether they are pub-lished or not. The documents may come fromteaching and research institutions in France orabroad, or from public or private research centers.
L’archive ouverte pluridisciplinaire HAL, estdestinee au depot et a la diffusion de documentsscientifiques de niveau recherche, publies ou non,emanant des etablissements d’enseignement et derecherche francais ou etrangers, des laboratoirespublics ou prives.

Picometer-scale surface roughness
measurements inside hollow glass fibres
C. Brun1,2, X. Buet1,3, B. Bresson4, M.S. Capelle1,2, M. Ciccotti4, A.
Ghomari3, P. Lecomte1,2, J.P. Roger2, M. N. Petrovich5, F. Poletti5, D.
J. Richardson5, D. Vandembroucq1, G. Tessier2,3
1 Laboratoire PMMH, ESPCI, CNRS UMR 7636, Univ. Paris 6 UPMC, Univ. Paris 7 Diderot,
10 rue Vauquelin 75231 Paris cedex 05, France 2 Institut Langevin, ESPCI, CNRS UMR 7587, 1 rue Jussieu, 75238 Paris cedex 05, France
3 Neurophotonics Laboratory, CNRS UMR 8250, Univ. Paris Descartes, Paris, France 4 Laboratoire PPMD-SIMM, ESPCI, CNRS UMR 7615, Univ. Paris 6 UPMC,
10 rue Vauquelin 75231 Paris cedex 05, France 5 Optoelectronics Research Centre, Univ. Southampton,
Highfield, Southampton, SO17 1BJ, UK
Abstract: A differential profilometry technique is adapted to the problem of measuring the roughness of hollow glass fibres by use of immersion objectives and index-matching liquid. The technique can achieve picometer level sensitivity. Cross validation with AFM measurements is obtained through use of vitreous silica step calibration samples. Measurements on the inner surfaces of fiber-sized glass capillaries drawn from high purity suprasil F300 tubes show a sub-nanometer roughness, and the roughness
power spectrum measured in the range [5 · 10−3µm−1 − 10−1µm−1] is consistent with the description of the glass surface as a superposition of frozen capillary waves. The surface roughness spectrum of two capillary tubes of differing compositions can be quantitatively distinguished.
OCIS codes: 120.6660 surface measurements, roughness; 120.4290 nondestructive testing; 060.5295 Photonic crystal fibres; 240.5770 roughness
References and links
1. F. Poletti, M. N. Petrovich, and D. J. Richardson, “Hollow core photonic bandgap fibres; technology and appli- cations,” Nanophotonics 2, 315–340 (2013).
2. V. A. J. M. Sleiffer, J. Yongmin, N. K. Baddela, J. Surof, M. Kuschnerov, V. Veljanowski, J. R. Hayes, N. V. Wheeler, E. R. N. Fokoua, J. P. Wooler, D. R. Gray, N. H. L. Wong, F. R. Parmigiani, S. U. Alam, M. N. Petrovich, F. Poletti, D. J. Richardson, and H. D. Waardt, “High capacity mode-division multiplexed optical transmission in a novel 37-cell hollow-core photonic bandgap fiber,” J. Lightwave Technol. 32, 854 (2014).
3. P. J. Roberts, F. Couny, H. Sabert, B. J. Mangan, D. P. Williams, L. Farr, M. W. Mason, A. Tomlinson, T. A. Birks, J. C. Knight, and P. S. Russell, “Ultimate low loss of hollow-core photonic crystal fibres,” Opt. Express 13, 237 (2005).
4. E. N. Fokoua, F. Poletti, and D. J. Richardson, “Analysis of light scattering from surface roughness in hollow-core photonic bandgap fibers,” Opt. Exp. 20, 20980 (2012).
5. N. V. Wheeler, M. N.Petrovich, R. Slav ık, N. Baddela, E. J. R. Hayes, D. Gray, F. Poletti, and D. J. Richardson, “Wide-bandwidth, low-loss, 19-cell hollow core photonic band gap fiber and its potential for low latency data transmission,” in “National Fiber Optic Engineers Conference,” (OSA, 2012).
6. F. Poletti, N. V. Wheeler, N. Baddela, E. N. Fokoua, J. R. Hayes, R. Slav ık, and D. J. Richardson, “Towards high-capacity fibre-optic communications at the speed of light in vacuum,” Nat. Photon. 7, 279–284 (2013).
7. J. Jackle and K. Kawazaki, “Intrinsic roughness of glass surfaces,” J. Phys. Condens. Matter 7, 4351–4358 (1995).

8. T. Sarlat, A. Lelarge, E. Søndergard, and D. Vandembroucq, “Frozen capillary waves on glass surfaces: an AFMstudy,” Eur. Phys. J. B 54, 121–127 (2006).
9. M. C. Phan-Huy, J. M. Moison, J. A. Levenson, S. Richard, G. Melin, M. Douay, and Y. Quiquempois, “Surfaceroughness and light scattering in a small effective area microstructured fiber,” J. Lightwave Technol. 27, 1597–1604 (2009).
10. A. Tay, C. Thibierge, D. Fournier, C. Fretigny, F. Lequeux, C. Monteux, J. P. Roger, and L. Talini, “Probingthermal waves on the free surface of various media: Surface fluctuation specular reflection spectroscopy,” Rev.Sci. Instrum. 79 (2008).
11. B. Pottier, G. Ducouret, C. Fretigny, F. Lequeux, and L. Talini, “High bandwidth linear viscoelastic properties ofcomplex fluids from the measurement of their free surface fluctuations,” Soft Matter 7, 7843–7850 (2011).
12. A. Raudsepp, C. Fretigny, F. Lequeux, and L. Talini, “Two beam surface fluctuation specular reflection spec-troscopy,” Rev. Sci. Instrum. 83 (2012).
13. P. Gleyzes and A. C. Boccara, “Interferometric polarization picometric profile .1. single detector approach,” J.Opt. 25, 207–224 (1994).
14. http://www.bruker.com/products/surface-analysis/atomic-force-microscopy/dimension-icon/technical-details.html.15. D. Derks, D. G. A. L. Aarts, D. Bonn, H. N. W. Lekkerkerker, and A. Imhof, “Suppression of thermally excited
capillary waves by shear flow,” Phys. Rev. Lett. 97, 038301 (2006).16. M. Thiebaud and T. Bickel, “Nonequilibrium fluctuations of an interface under shear,” Phys. Rev. E 81, 031602
(2010).
1. Introduction
Hollow core-photonic bandgap fibres (HC-PBGFs), in which a periodic cladding made of airholes allows light to be guided in a central air core, are of great interest as a potential transmis-sion medium in next-generation optical communication systems. Their nonlinearity and latencyare much lower compared to classical solid-core [1, 2], and they offer reduced Rayleigh scatte-ring and absorption by impurities or phonons. However, losses in these fibres are still one orderof magnitude higher than in typical single mode fibres. Scattering at the numerous air/glassinterfaces present in these structures, particularly those at the hollow core boundary, has beenidentified as a major loss mechanism [3]. In particular, short spatial frequencies (i.e. below 1µm−1) seem to have the highest impact on losses [4]. Longitudinally, roughness should there-fore be characterized over distances of up to several hundreds of micrometers.
The optimization of multi-mode propagation offers a way to control and manage the inter-action of light with interfaces [5], and reduce losses [4, 6]. Enlarging the air core or movingto lower wavelengths are known ways to reduce roughness scattering losses. Nevertheless, inorder for PBGFs to compete with classical solid-core fibers in long haul communications, theability to measure and reduce glass surface roughness is essential.
The amorphous structure of a glass reflects the liquid state. In the same way, the glass sur-face inherits its roughness from the fluctuations of the liquid surface. During the fibre drawingprocess, the vitreous liquid goes through a glass transition in which the surface capillary waves(SCWs) that are thermally excited in the liquid state are suddenly frozen [3, 7, 8]. Accordingto this scenario, the roughness statistics of a glass surface are therefore the same as those of asnapshot of the liquid surface taken at the glass transition temperature Tg.
This fundamental thermodynamical process imposes the ultimate limit to roughness inglasses, and in HC-PBGFs in particular. The resulting roughness is extremly low. It is con-trolled by the competition between the thermal noise at the glass transition kBTG (where kBis the Boltzmann constant) and the surface tension γ . Typical values of the RMS roughnessamount to σ ≈
√kBTG/γ ≈ 0.4nm for amorphous silica. This global estimate actually results
from the superposition of surface capillary waves modes with spatial wavelengths that mayextend from the nanometric to the millimetric range [8].
Pushed close to their instrumental limits, AFM microscopes have proven their ability to mea-sure sub-nanometer roughness on flat glass surfaces, and to obtain roughness density spectrawhich are well described by theory [8]. In HC-PBGF, however, such measurements are much
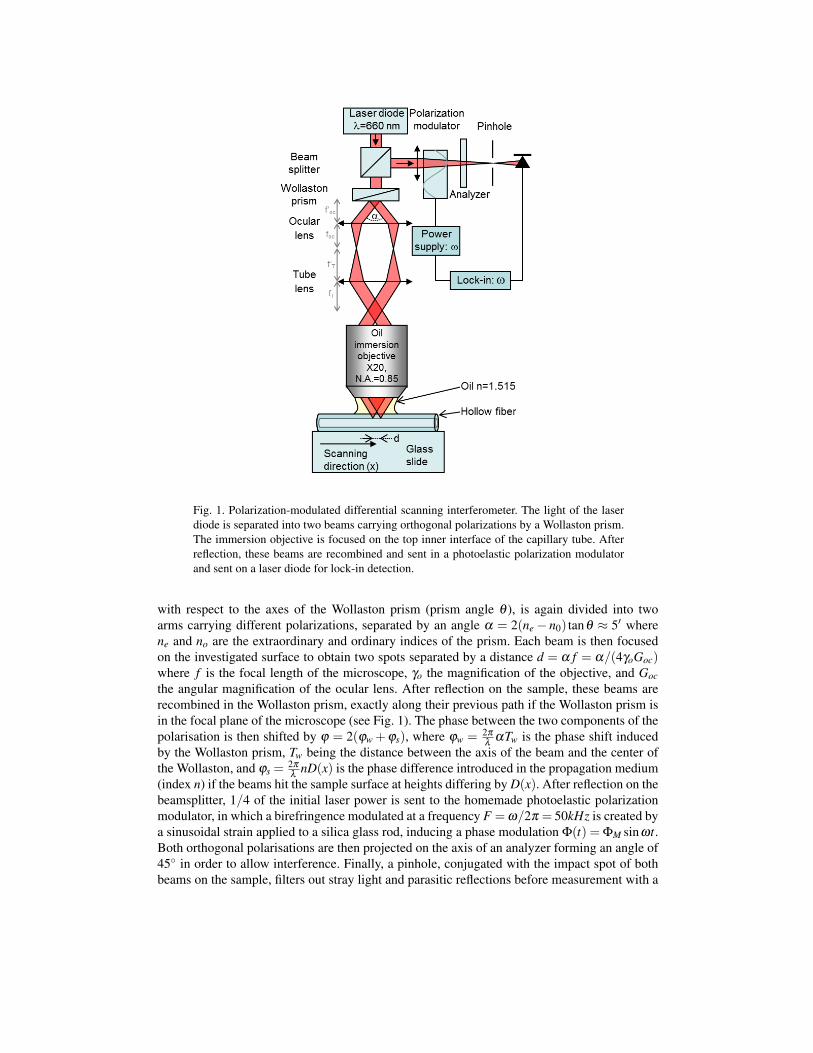
Fig. 1. Polarization-modulated differential scanning interferometer. The light of the laserdiode is separated into two beams carrying orthogonal polarizations by a Wollaston prism.The immersion objective is focused on the top inner interface of the capillary tube. Afterreflection, these beams are recombined and sent in a photoelastic polarization modulatorand sent on a laser diode for lock-in detection.
with respect to the axes of the Wollaston prism (prism angle θ ), is again divided into twoarms carrying different polarizations, separated by an angle α = 2(ne− n0) tanθ ≈ 5′ wherene and no are the extraordinary and ordinary indices of the prism. Each beam is then focusedon the investigated surface to obtain two spots separated by a distance d = α f = α/(4γoGoc)where f is the focal length of the microscope, γo the magnification of the objective, and Gocthe angular magnification of the ocular lens. After reflection on the sample, these beams arerecombined in the Wollaston prism, exactly along their previous path if the Wollaston prism isin the focal plane of the microscope (see Fig. 1). The phase between the two components of thepolarisation is then shifted by ϕ = 2(ϕw +ϕs), where ϕw = 2π
λαTw is the phase shift induced
by the Wollaston prism, Tw being the distance between the axis of the beam and the center ofthe Wollaston, and ϕs =
2π
λnD(x) is the phase difference introduced in the propagation medium
(index n) if the beams hit the sample surface at heights differing by D(x). After reflection on thebeamsplitter, 1/4 of the initial laser power is sent to the homemade photoelastic polarizationmodulator, in which a birefringence modulated at a frequency F =ω/2π = 50kHz is created bya sinusoidal strain applied to a silica glass rod, inducing a phase modulation Φ(t) = ΦM sinωt.Both orthogonal polarisations are then projected on the axis of an analyzer forming an angle of45◦ in order to allow interference. Finally, a pinhole, conjugated with the impact spot of bothbeams on the sample, filters out stray light and parasitic reflections before measurement with a
photodiode (Thorlabs PD100). The resulting signal is processed by a lock-in amplifier.In our analysis, the surface of the glass samples are assumed to be optically homogeneous,
i.e. exempt of local refractive index variations, and the reflection coefficients, r, are assumedidentical for both beams. The intensity on the detector can thus be written as:
I(t) = rE20 [1+ cosϕ cosΦ(t)− sinϕ sinΦ(t)] (1)
≈ rE20 [1+ J0(ΦM)cosϕ−2J1(ΦM)sinϕ sinωt +2J2(ΦM)cosϕ cos2ωt + ...]
where Jn are Bessel functions of the first kind. The third term, at the angular frequency ω , isisolated by the lock-in to obtain a signal proportional to sinϕ thus to ϕs and D(x). The value ofthe proportionality factor, which is necessary in order to quantitatively measure D(x), is easilyobtained by translating the Wollaston prism to change ϕw and measuring the amplitude signalfor positions corresponding to sinϕ = sin2(ϕw +ϕs) equal to 1 or -1.
If we assume no overlap between the two spots, this measurement therefore delivers theheight difference D(x) between the two spots; the case of overlapping Gaussian laser spots isslightly more complex and will be described later.
In order to be able to measure inside hollow glass fibres, we use an oil immersion objective(Olympus X20, N.A. = 0.85). A section of the fibre is fixed on a glass slide and immersedin a silica index matching oil. The outer interface of the fibre is then optically invisible, andapproximately 4% of the incident light is reflected off the first glass/air interface, i.e. the upperinner surface of the glass fibre.
An important question is whether a portion of the transmitted beam can be collected aftermultiple reflections inside the hollow cylinder, as this might affect the measurement. Since weuse a pinhole to filter out non-confocal light, light can only be collected if it emerges fromthe illuminated point, which has a radius r = 1.22λ/(2N.A.) = 500nm. This is only possiblefor beams lying in a plane perpendicular to the axis of the fibre, so the problem is actuallythat of a 2D reflection at a circular surface. If a beam enters the circle at an incidence anglei, its reflections inside will all form the same angle i. After k reflections, the beam impingeson the inner surface of the cylinder at an azimuthal position given by the angle k.(π − 2.i),with relative intensities given by [Rs(i)]k and [Rp(i)]k, where Rs(i) and Rp(i) are the Fresnelcoefficients for the s and p polarisations, respectively. These beams can only be collected bythe confocal microscope if they emerge, after k reflections, at the illuminated point (radius r).We have verified numerically that, for a fibre with an internal diameter of 200µm, the collectedintensity for both polarizations is lower than the precision of our calculations, and is thereforenegligible. This holds true down to fibre radiuses of the order of the wavelength, i.e. a fewhundreds of nanometers, at which this geometrical approach is no longer valid.
The sample is then scanned relative to the beams using a motorized stage (PI M-126-2S1),to obtain a line scan D(x). The differential interferometer is mostly insensitive to unwantedvertical movements, but pitch or yaw angular tilts are crucial, since a sample rotation of e.g. ρ =10−6rad. results in an apparent differential displacement ρd = 3pm. However, if the scanningdirection is kept constant, most good quality stages can provide this kind of precision.
An important characteristic of this type of interferometer is that, since the angle α is small(5′), both beams follow very similar paths and are affected in similar ways by air-flow andvibrations. This makes the instrument relatively immune to these sources of noise.
The ultimate noise limit, which is driven by photon and detector noise, is of the order of10−14m for a lock-in integration time of τ = 100ms, but it is in practice limited to higher valuesby vibrations and thermal drifts. In order to estimate this noise experimentally, we have carriedout repeated measurements on a fixed region for different types of samples, measuring thefluctuations of the signal. Figure 2 depicts the results obtained. The noise level is plotted as afunction of one over the square root of the time constant of the lock-in amplifier. As in most

Fig. 2. Current performances Noise levels measured on different kinds of samples. τ isthe time constant of the lock-in amplifier.
lock-in detection systems, drifts also appear in the amplitude signal. In all the experimentspresented in this report, we adopted the conservative assumption that these drifts were linear,substracting a linear fit over the raw measurements.
On a perfectly reflecting surface such as a mirror, the noise level reaches the practical noiselimit, which is around 4pm for τ = 100ms. Since glasses only reflect about 4% of the incominglight, the available number of photons is notably decreased and the signal to noise ratio istherefore decreased. However by increasing the power of the laser diode until we obtain areflected signal which has the same intensity as on a mirror, we find the same noise levels.However, immersion measurements on capillary fibres lead to higher noise levels which mightbe caused by movements in the oil, and by the very low depth of field of immersion objectives.
Within the time constant range used to measure differential profiles (a few ms), the noise lev-els are around six to ten picometers. This allows precise measurements of the glass roughness.Moreover, we note that, even though the lateral resolution of the differential profilometer is asexpected lower than that of an atomic force microscope, the vertical noise level of immersionmeasurements is at least three times lower than that of an AFM that typically amounts to 30 pmfor the low noise commercial instrument used in the present study [14].
3. Response function
In the following sections we present results obtained on two different kinds of samples. Testsilica samples that exhibit a deterministic step height profile of nanometric amplitude will firstbe examined. Hollow silica tubes characterized by a sub-nanometric random roughness willthen be studied. In both cases, results will be quantitatively compared either with independentexperimental results (AFM measurements on the silica steps) or with theoretical expectations(frozen capillary waves for the inner roughness of capillary tubes). While the quantitative anal-ysis of a deterministic height profile naturally resorts to the real space, the characterization of arandom roughness will be more practical in the Fourier space.
Before coming to the experimental results we give here more details on the experimentalresponse function and its effects on the measurements. The two cases above discussed are pre-sented and both the real space and the Fourier space representations of the response functionsare discussed.
As presented in the above section, differential profilometry gives access to a local phasedifference ϕs(x) = (2πn/λ )D(x) on the sample surface due to the difference of optical pathbetween the two reflected beams. If the distance d separating the two beams is significantly

larger than the beam waist w, d >> w we expect that the measured signal directly gives theheight difference between the two points of refllection:
D(x)≈ h(x+d/2)−h(x+d/2)≈ d.h′(x) (2)
In practice however, measurements are performed with a separation between the two beams ofthe same order of magnitude as the beam waist, d/w ≈ 1− 3 and the two beams can partiallyoverlap. For small values of d, the response of the profilometer is thus smeared out, essentiallydue to the diffraction limit which sets the diameter of the spots.
3.1. Step geometry–Real space response function
Let us first consider the case of a step profile of height M. The height difference D measuredby the profilometer writes:
D(x) =λ
4πarcsin
[A(x)sin
(4πM
λ
)]. (3)
In particular the maximum of the signal Dmax = D(0) is corrected by a factor A(0) which isequal to unity when the two beams are fully separated and takes lower and lower values whenthe beams overlap. A Gaussian hypothesis for the shape of the beams leads to:
A(x) =12
[erf(
x+d/2w
)− erf
(x−d/2
w
)]. (4)
For steps of small height M� λ , linearization gives:
D(x)≈MA(x) =M2
[erf(
x+d/2w
)− erf
(x−d/2
w
)]. (5)
Here, A(x) is thus nothing but the linear response function of the experimental set-up to aunit step. The main effect of the response function in this experimental configuration is anunderestimate of the step height M. The maximum of the signal Dmax = D(0) is corrected by afactor A(0) which is equal to unity when the two beams are fully separated and takes lower andlower values when the beams overlap.
3.2. Random roughness–Fourier space response function
Following Eq.(4) the linear response function of the experimental set-up to a height Dirac is:
R(x) = A′(x) = G(x+d/2)−G(x−d/2) , (6)
where G is the normalized Gaussian function of width w:
G(x) =1
w√
πexp[−( x
w
)2]. (7)
The Fourier transform of the response function thus writes:
R( f ) = 2ie−π2 f 2w2sin(π f d) , (8)
where the Fourier transform is defined as:
g( f ) =∫
∞
−∞
g(x)e2iπ f xdx . (9)

Fig. 3. Response function |R( f )|2 for a beam waist w = 1.3µm and a beam separationd = 3.4µm. At low frequency, the profilometer acts as a differential operator and and we getthe parabolic behavior |R( f )|2 ∝ f 2. In addition to the diffraction effect at high frequency,the zero induced by the differential operator is clearly visible at frequency fd = 1/d =0.29µm−1, and can provide an experimental determination of d.
At low frequencies, f << 1/d, one retrieves the Fourier transform of the differential operatorR( f ) ≈ 2iπ f d. Note here that the attenuation factor A(0) discussed in the previous subsectionfor the measurements of the steps results from the low pass filter and not from a mechanismthat would attenuate all frequencies.
The differential nature of the measurement set-up has another important feature. In Fig. 3we have plotted the square modulus of the Fourier transform of the response function, |R( f )|2,using the beam waist value w = 1.3µm (determined from experimental measurements). Largervalues of w (i.e. larger laser spots in case of e.g. imperfect focusing) will decrease the sensitiv-ity to high spatial frequencies. As can be seen in Fig. 3, |R( f )|2 has a sharp minimum corre-sponding to the spatial frequency fd = 1/d, the frequency to which our measurement system isentirely blind. This frequency therefore provides a way to measure accurately the beam separa-tion. We get fd = 0.29µm−1 for immersion measurements, the corresponding value d = 3.4µmwas used throughout our analysis.
If we denote h(x) and h( f ) the random height profile under measurement and its Fouriertransform respectively, we get for the differential signal:
D( f ) = R( f ) · h( f ) = 2ie−π2 f 2w2sin(π f d)h( f ) (10)
While the integration of the differential measurement would require a simple division by theresponse function in the Fourier space, the blindness of the set-up at fd = 1/d makes thisoperation numerically hazardous. Since it involves a division by zero, integration in the Fourierspace is thus only permitted in a frequency range strictly below fd = 1/d [13]. While thisoperation is possible it obviously reduces the range of accessible frequencies.
Another procedure consists in accounting for the response function and trying to directlyanalyze the bare differential signal. Let us consider a random height profile h(x). Such a randomsignal can be characterized by its statistical distribution and by its spatial correlation C(x). The

power spectral density (PSD) of the differential signal will thus simply writes:
|D( f )|2 = |R( f )|2C( f ) (11)
= 4|sin(π f d)|2e−2π2 f 2w2 |h( f )|2 (12)
where we have C( f ) = |h( f )|2.For the sake of simplicity let us distinguish two different cases: short-range gaussian cor-
relations and long-range correlation. In the first case the width of the distribution is given bythe RMS roughness σ and the height-height correlation function C(x) = σ2 exp(−x2/τ2) isadditionally characterized by the correlation length τ . We thus get:
C( f ) =√
πσ2τe−π2 f 2τ2
(13)
|D( f )|2 = 4√
πσ2τ|sin(π f d)|2e−π2 f 2(2w2+τ2) (14)
Here the RMS roughness level simply gives a multiplicative factor while the gaussian correla-tion induces a low pass filter only measurable if the correlation length τ is significantly largerthan the beam separation d. In particular at low frequency we expect in such a case to get aparabolic dependence of the PSD to the frequency: |D( f )|2 ≈ 4π5/2σ2τd2 f 2.
Let us now consider a second case of roughness that exhibits long range correlations. Glasssurfaces obtained by a quench from liquid state show an ultra-low (sub-nanometric) rough-ness. It appears that this roughness can be quantitatively described as a superposition of frozencapillary waves [3, 7, 8]. In the same way as the bulk structure of glass can be regarded as asnapshot of the liquid at the temperature of glass transition TG, glass surface is here regardedas a snapshot of the thermal fluctuations of the liquid interface at TG. If we call hSCW the heightfluctuations induced by surface capillary waves, the power spectral density expected over 1Dprofiles can be expresssed as:
|hSCW ( f )|2 = kbTG
2πγ f, (15)
where kB is the Boltzmann constant, TG the glass transition and γ the surface tension. HerekbTG/γ has the dimension of the square of a length and its square root gives a good estimate ofthe width of the interface. After accounting for the response function we get for the PSD of thedifferential signal:
|DSCW ( f )|2 = 4e−2π2 f 2w2 |sin(π f d)|2 kbTG
2πγ f, (16)
≈ 2πd2 kbTG
γf if f � 1
d. (17)
Here we see that while a short range correlated roughness does not alter the low freqencybehavior of the differential signal, the situation is very different in the case of the long-rangecorrelated roughness induced by frozen capillary waves. The PSD shows now a linear frequencybehavior.
In the following sections we make use of Eq. (5) and (16) to fit the results obtained on adeterministic silica step sample and on the inner roughness of hollow capillary silica tubes,respectively.
4. Tests on textured silica surfaces
In order to investigate the performance of our setup on representative test samples we performedmeasurements of textured silica wafers. We used 100 µm thick amorphous silica wafers (Corn-ing 7980 Fused silica UV grade), with a standard surface finish (Optically polished both sides <
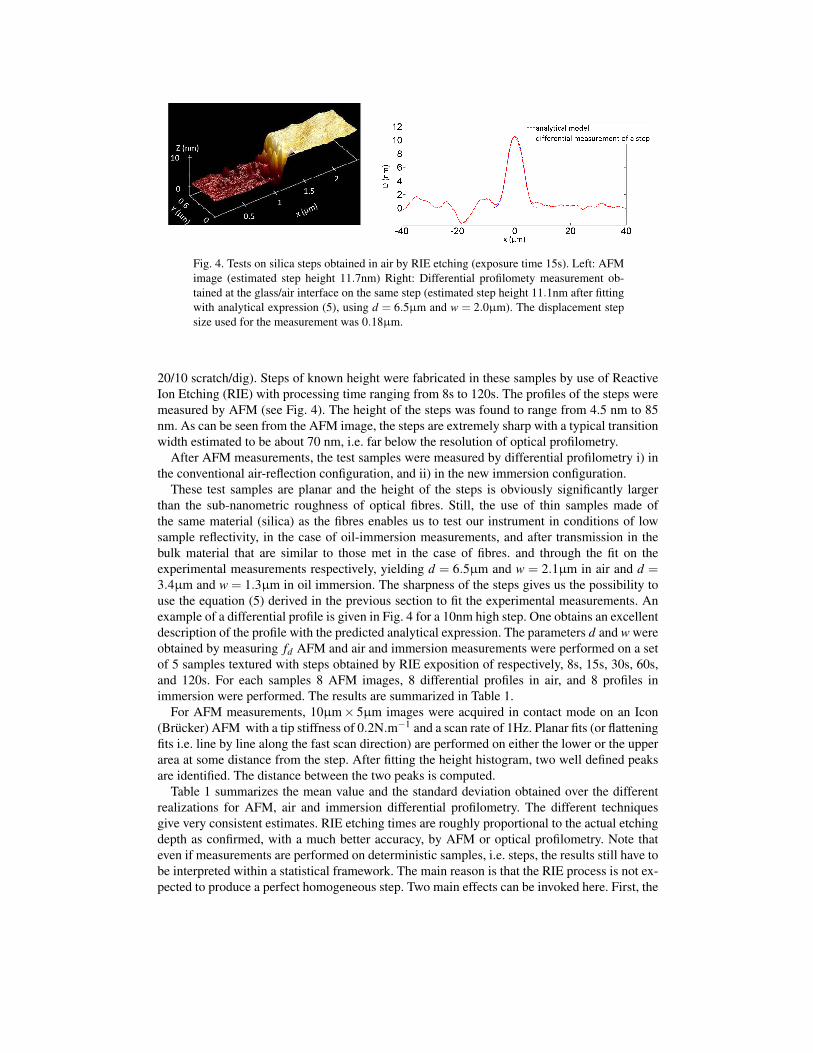
Fig. 4. Tests on silica steps obtained in air by RIE etching (exposure time 15s). Left: AFMimage (estimated step height 11.7nm) Right: Differential profilomety measurement ob-tained at the glass/air interface on the same step (estimated step height 11.1nm after fittingwith analytical expression (5), using d = 6.5µm and w = 2.0µm). The displacement stepsize used for the measurement was 0.18µm.
20/10 scratch/dig). Steps of known height were fabricated in these samples by use of ReactiveIon Etching (RIE) with processing time ranging from 8s to 120s. The profiles of the steps weremeasured by AFM (see Fig. 4). The height of the steps was found to range from 4.5 nm to 85nm. As can be seen from the AFM image, the steps are extremely sharp with a typical transitionwidth estimated to be about 70 nm, i.e. far below the resolution of optical profilometry.
After AFM measurements, the test samples were measured by differential profilometry i) inthe conventional air-reflection configuration, and ii) in the new immersion configuration.
These test samples are planar and the height of the steps is obviously significantly largerthan the sub-nanometric roughness of optical fibres. Still, the use of thin samples made ofthe same material (silica) as the fibres enables us to test our instrument in conditions of lowsample reflectivity, in the case of oil-immersion measurements, and after transmission in thebulk material that are similar to those met in the case of fibres. and through the fit on theexperimental measurements respectively, yielding d = 6.5µm and w = 2.1µm in air and d =3.4µm and w = 1.3µm in oil immersion. The sharpness of the steps gives us the possibility touse the equation (5) derived in the previous section to fit the experimental measurements. Anexample of a differential profile is given in Fig. 4 for a 10nm high step. One obtains an excellentdescription of the profile with the predicted analytical expression. The parameters d and w wereobtained by measuring fd AFM and air and immersion measurements were performed on a setof 5 samples textured with steps obtained by RIE exposition of respectively, 8s, 15s, 30s, 60s,and 120s. For each samples 8 AFM images, 8 differential profiles in air, and 8 profiles inimmersion were performed. The results are summarized in Table 1.
For AFM measurements, 10µm× 5µm images were acquired in contact mode on an Icon(Brucker) AFM with a tip stiffness of 0.2N.m−1 and a scan rate of 1Hz. Planar fits (or flatteningfits i.e. line by line along the fast scan direction) are performed on either the lower or the upperarea at some distance from the step. After fitting the height histogram, two well defined peaksare identified. The distance between the two peaks is computed.
Table 1 summarizes the mean value and the standard deviation obtained over the differentrealizations for AFM, air and immersion differential profilometry. The different techniquesgive very consistent estimates. RIE etching times are roughly proportional to the actual etchingdepth as confirmed, with a much better accuracy, by AFM or optical profilometry. Note thateven if measurements are performed on deterministic samples, i.e. steps, the results still have tobe interpreted within a statistical framework. The main reason is that the RIE process is not ex-pected to produce a perfect homogeneous step. Two main effects can be invoked here. First, the
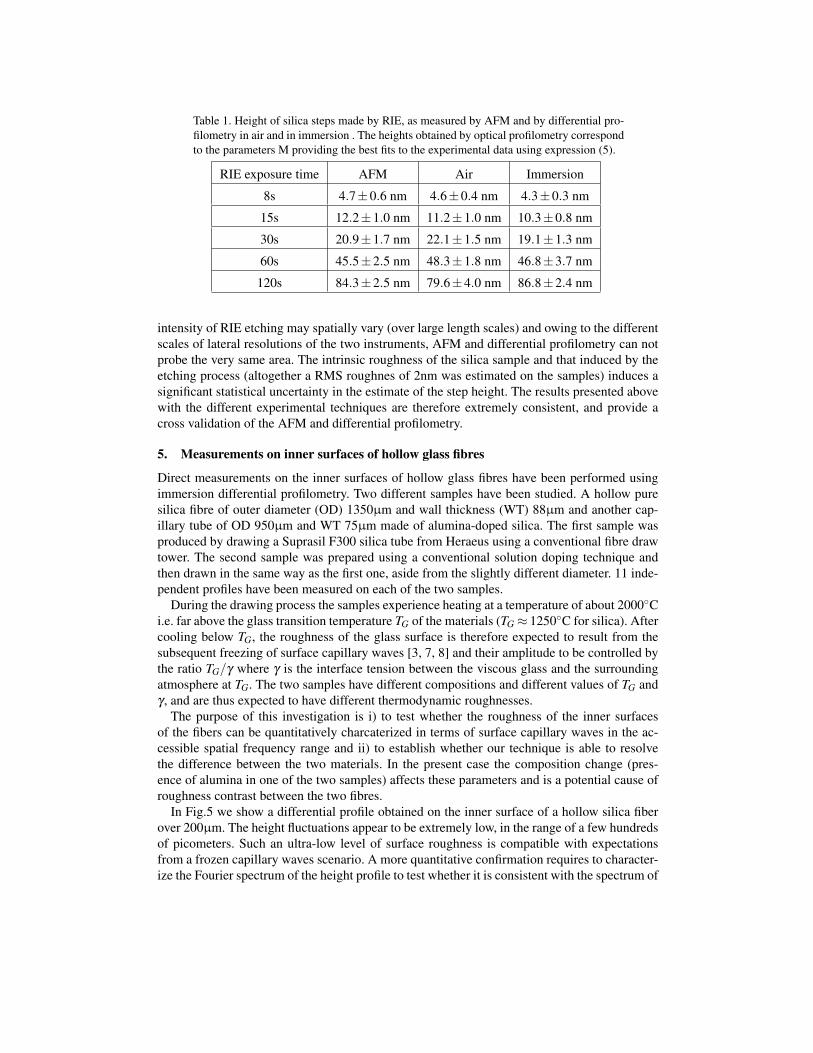
Table 1. Height of silica steps made by RIE, as measured by AFM and by differential pro-filometry in air and in immersion . The heights obtained by optical profilometry correspondto the parameters M providing the best fits to the experimental data using expression (5).
RIE exposure time AFM Air Immersion
8s 4.7±0.6 nm 4.6±0.4 nm 4.3±0.3 nm
15s 12.2±1.0 nm 11.2±1.0 nm 10.3±0.8 nm
30s 20.9±1.7 nm 22.1±1.5 nm 19.1±1.3 nm
60s 45.5±2.5 nm 48.3±1.8 nm 46.8±3.7 nm
120s 84.3±2.5 nm 79.6±4.0 nm 86.8±2.4 nm
intensity of RIE etching may spatially vary (over large length scales) and owing to the differentscales of lateral resolutions of the two instruments, AFM and differential profilometry can notprobe the very same area. The intrinsic roughness of the silica sample and that induced by theetching process (altogether a RMS roughnes of 2nm was estimated on the samples) induces asignificant statistical uncertainty in the estimate of the step height. The results presented abovewith the different experimental techniques are therefore extremely consistent, and provide across validation of the AFM and differential profilometry.
5. Measurements on inner surfaces of hollow glass fibres
Direct measurements on the inner surfaces of hollow glass fibres have been performed usingimmersion differential profilometry. Two different samples have been studied. A hollow puresilica fibre of outer diameter (OD) 1350µm and wall thickness (WT) 88µm and another cap-illary tube of OD 950µm and WT 75µm made of alumina-doped silica. The first sample wasproduced by drawing a Suprasil F300 silica tube from Heraeus using a conventional fibre drawtower. The second sample was prepared using a conventional solution doping technique andthen drawn in the same way as the first one, aside from the slightly different diameter. 11 inde-pendent profiles have been measured on each of the two samples.
During the drawing process the samples experience heating at a temperature of about 2000◦Ci.e. far above the glass transition temperature TG of the materials (TG ≈ 1250◦C for silica). Aftercooling below TG, the roughness of the glass surface is therefore expected to result from thesubsequent freezing of surface capillary waves [3, 7, 8] and their amplitude to be controlled bythe ratio TG/γ where γ is the interface tension between the viscous glass and the surroundingatmosphere at TG. The two samples have different compositions and different values of TG andγ , and are thus expected to have different thermodynamic roughnesses.
The purpose of this investigation is i) to test whether the roughness of the inner surfacesof the fibers can be quantitatively charcaterized in terms of surface capillary waves in the ac-cessible spatial frequency range and ii) to establish whether our technique is able to resolvethe difference between the two materials. In the present case the composition change (pres-ence of alumina in one of the two samples) affects these parameters and is a potential cause ofroughness contrast between the two fibres.
In Fig.5 we show a differential profile obtained on the inner surface of a hollow silica fiberover 200µm. The height fluctuations appear to be extremely low, in the range of a few hundredsof picometers. Such an ultra-low level of surface roughness is compatible with expectationsfrom a frozen capillary waves scenario. A more quantitative confirmation requires to character-ize the Fourier spectrum of the height profile to test whether it is consistent with the spectrum of

Fig. 5. Differential profile obtained on the inner surface of a silica capillary tube over alength of 200 µm. Height fluctuations are extremely low, in the range of a few hundreds ofpicometers.
Fig. 6. Differential profilometry measurements on inner surfaces of two hollow glass fibres(silica and alumina doped silica). The power spectral densities of the differential heightsignal are represented as continuous lines. The dashed lines are fits obtained with the an-alytical expression (16). The linear trend observed at low frequency is consistent with ascenario of frozen capillary waves at the glass surface.
capillary waves. In particular, as discussed above the latter is expected to show a 1/ f behavior(where f is the spatial frequency).
Here we first show the comparison of the power spectral density of the bare differentialsignal |D( f )|2 with the theoretical expectation |DSCW ( f )|2 obtained in Eq. (16) for a spectrumof surface capillary waves accounting for the experimental response.
The average power spectral densities of the differential signal obtained for the silica fibreand the alumina-doped fibre are displayed in Fig. 6. The linear trend (see Eq. (17)) expectedfor frozen capillary waves is clearly visible in the range [5·10−3µm−1−5·10−2µm−1]. But as

Fig. 7. Roughness measurements on inner surfaces of two hollow glass fibres (silica andalumina doped silica). The power spectral densities of the height signal are obtained afterdivision by the response function. The dashed and dotted lines are fits obtained with theanalytical expression (15). The clear 1/ f trend observed at low frequency is consistentwith a scenario of frozen capillary waves at the glass surface.
shown in Fig. 6, beyond this linear trend, the expression (16) accounting for the experimentalresponse function appears to capture quantitatively the experimental power spectral densitiesover most of the accessible range of spatial frequencies. In practice an excellent agreementis found in the range [5·10−3µm−1− 10−1µm−1] as shown by the dashed lines in Fig. 6. Athigher frequencies the signal is filtered by diffraction. To our knowledge, this is the first timethat frozen capillary waves are identified in this frequency range on glass surfaces. A largermagnification may slightly enlarge the accessible frequency range toward high frequencies atthe price of a reduced signal-to-noise ratio. At low frequencies (below 5·10−3µm−1) the signalis dominated by contributions of the nanometric scale vertical fluctuations of the motorizedstage.
In order to make the expected 1/ f behavior of the roughnes spectrum even more visible wehave also performed a division by the response function in the frequency range [2·10−3µm−1−5·10−1µm−1]. As shown in Fig. 7, a very clear 1/ f behavior is obtained at low frequency. Athigher frequency the proximity of the zero of the response function at fd = 1/d induces a highlevel of noise.
The power spectral density of the differential profiles obtained on the inner surfaces of thehollow glass fibers can thus be quantitatively accounted for by a superposition of frozen surfacecapillary waves. It is then possible to extract a single parameter TG/γ quantifying the amplitudeof the surface capillary modes.
From the quantitative point of view, we obtain as a central value TG/γ = 450± 200 for thesilica fibre and TG/γ = 1400±500 for the alumina-silica fibre. The error bars have been eval-uated after identifying lower and upper values bounding the fluctuations of the power spectraldensity in the range [5·10−3µm−1−5·10−2µm−1].
The measurement clearly indicates a substantial difference in surface roughness for the twoanalyzed samples, and we speculate that the difference is a consequence of their different com-positions, since both the temperature of glass transition and the interface tension are expectedto depend on composition.
Still we remark that the two values are well below the equilibrium value estimate for amor-phous silica TG/γ ≈ 5000 obtained from the standard values for the temperature fo glass tran-

sition TG ≈ 1500K and surface tension γ ≈ 0.3J.m−1. Note that low values of TG/γ had alreadybeen reported in [3]. In this work, AFM measurements on a fragment of photonic band gapfiber led to estimate the ratio TG/γ in the range [500−5000] with a central value TG/γ = 1500.A possible origin of this lower than expected surface roughness of glass fibers may lie in thedrawing process. Recent experimental and numerical results suggest indeed that capillary wavesmay be attenuated under flowing conditions [15, 16].
6. Conclusion
We have presented an optical, non-contact method able to characterize the roughness of ultra-smooth glass surfaces with sensitivities down to 10pm, and have validated its ability to de-liver quantitative height measurements on model samples. On flat glass surfaces, the capil-lary wave-driven sub-nanometer roughness has been obtained in a new spatial frequency range[5·10−3µm−1−10−1µm−1] with a quantitative statistical charactarization of the spatial corre-lations. These measurements compare well to glass physics models as well as to AFM measure-ments [8]. Beyond its excellent sensitivity, which provides a significant improvement over mostcurrent AFM performances regarding height measurements, one strength of this method residesin its ability to obtain measurements over distances of the order of hundreds of micrometers.Using an oil immersion technique, we show that these measurements can be performed at adistant glass/air interface, either on the back side of thin glass plates or, more interestingly,inside hollow glass tubes. This immersion-based method allows the study of unopened hollowfibres, thus avoiding the necessity to mechanically open the fibre and therefore preserving thepristine cleanness of the surface, which is essential considering the extremely low roughnesslevels measured here. The ability to access the inner surface of glass tubes, associated to theability to measure a previously unexplored range of spatial frequencies attaining very high sen-sitivity presented here is expected to be of great interest for the study of roughness and lossmechanisms in photonic bandgap fibers, providing valuable input to their understanding andoptimization.
Acknowledgements
This work was supported by the EU 7th Framework Programme under grant agreement 228033(MODE-GAP). X.B. acnowledges the support of Programme DIM OxyMORE, Ile de France.The authors thank the technology center MIMENTO, Femto ST institute, for the realization ofthe silica steps.