pic simulation of the coaxial magnetron for low...
TRANSCRIPT

PIC SIMULATION OF THE COAXIAL MAGNETRON linearFOR LOW ENERGY X-BAND LINEAR ACCELERATORS
Jiaqi Qiu ∗, Huaibi Chen, Chuanxiang TangAccelerator Laboratory, Department of Engineering Physics, Tsinghua University, Beijing 100084
Abstract
For the miniaturization of low energy linear accelerators,X-band pulsed magnetron with a stable output of 1.5 MWpeak power is being developed, and this paper presents the3D particle-in-cell (PIC) simulation of an X-band coax-ial magnetron. In simulation, a pattern of N/2 spokes ofthe time evolved electron flow shows the generation ofπ-mode, and the mode competition in the startup processmanifests itself in the spectra.
INTRODUCTION
Low energy electron linacs have been widely used innondestructive testing, radiation therapy and radiation pro-cessing. Extremely small accelerator structures with highshunt impedance are needed for medical and industrial ap-plications. X-band electron linac can meet these require-ments.
The Accelerator Laboratory at Tsinghua Universitystarted R&D of X-band standing wave(SW) electron linacssince 1991, and have developed a 6 MeV X-BAND SW ac-celerating guide in 2004 [1]. However,the development ofthe X-band linac subjects to the X-band microwave powersources. In order to reduce side and weight of accelerator,magnetron is adopted as microwave power source for X-band linac, so 1.5MW X-band coaxial magnetron is beingdeveloped in the Accelerator Laboratory.
Magnetron is known as a successful device with high-efficiency in the centimeter wavelength. However the non-linear beam-wave interaction mechanism of magnetron isnot well understand [2]. Recently, Simulation of mag-netron has been developed by using particle-in-cell(PIC)code, such as MAGIC, 3DPIC, QUICKSILVER and soon [3, 4, 5]. Many structures such as multi-cavity system,rising-sun system, strapped system are modeled, and the3D simulation studies were found to be in good agreementwith experimental results.
In this paper, a 3D model of X-band coaxial magnetronis simulated , in which time evolved spoke formation andpower extracted from the output port indicate the genera-tion of π-mode.
SIMULATION MODEL DESCRIPTION
A coaxial magnetron is composed of an inner and anouter resonant system. The inner system includes a plu-rality of anode vanes mounted on a cylindrical wall mem-
ber which is normally designed to operate in the π modeand around a cathode. The outer system is presented as acoaxial cavity which oscillates in the TE011 mode. Thistwo systems are coupled by the means of the sew. The highQ outer cavity made the magnetron with high frequencystability, so coaxial structure was wildly used since 1960s.The two sectional views of the magnetron model are de-
outputport
(a)
anodeblock
outer
cavity
cathode
DCvoltage
inputport
z
r
(b)
Figure 1: (a)Sectional view of the coaxial magnetron in therθ plane. (b) Sectional view of the coaxial magnetron inthe rz plane.
picted in Fig.1. The microwave power is extracted fromthe outer cavity to the rectangular waveguide through thecoupling slot and the impendence transformer. In the com-puter modeling, the impendence transformer and ceramicwindow are neglected for simplicity. Two attenuators madeby microwave absorbing material are fixed to suppress spu-rious modes.
According to the Hull cutoff and Buneman-Hartree res-onance conditions, the magnetron oscillation region is ob-tained, as shown in Fig.2. The upper line shows the Hull
MOPEA067 Proceedings of IPAC’10, Kyoto, Japan
232
08 Applications of Accelerators, Technology Transfer and Industrial Relations
U05 Applications, Other

cutoff conditions above what there is no oscillation, be-cause the electron will directly pass through the DC gapwithout interaction with the RF field. On the Buneman-Hartree line, the drift velocity of the electron is equal withthe angular phase velocity of the π-mode, then an elec-tron bunching is formed due to accelerating and deceler-ating phases of the electron clouds. So the magnetron mustoperate between this two lines [6]. In Fig.2, the operat-ing point on which the simulations are performed is alsomarked as the DC voltage of 41kV and an axial magneticfield of 4800Gs.
0 0.1 0.2 0.3 0.4 0.5 0.60
5
10
15
20
25
30
35
40
45
Magnetic field / T
DC
vol
tage
/ kV
Hull condition π mode B−H condition operating point
Figure 2: Hull cutoff condition and Buneman-Hartree res-onance condition of the magnetron
HOT TEST SIMULATION RESULT
Fig.3 shows the applied DC voltage and the predefinedemission current of the cathode.
The inner and outer conductors compose a coaxial trans-mission line. The DC voltage is applied as a TEM modewave traveling through this transmission line. Because ofthe open end of this line, the voltage is applied as half ofthe required value. The rise time of the voltage is set as2ns.
Magnetron often operates with both thermionic and sec-ondary emission. In this paper, the current density of theemission zone is predefined as J = 22.83A/cm2 and therise time as 10ns. The total emission current from the cath-ode is about 140A. Secondary emission on the cathode sur-face is not included in the simulation.
The uniform magnetic field is applied in the axially di-rection.
The PIC simulation time is defined as 400nanoseconds.Time evolved electron distribution at 100, 200, 300, and400 ns are plotted in Fig.4. At 100, 200ns, there is no oscil-lation in the interaction space. After the oscillation started,electron spokes formed. The number of spokes in the elec-tron flow is determined by the operating mode. As shownin Fig.4, the 20 spokes are formed azimuthally around thecathode, so the mode is so-called the π-mode when the in-ner system includes 40 vanes. This proves the π-mode os-cillation in the magnetron.
0 5 10 15 20 25 30 35 40 45 500
5
10
15
20
25
30
35
40
45
50
Vol
tage
/ kV
Time / ns0 5 10 15 20 25 30 35 40 45 50
−150
−100
−50
0
Em
issi
on C
urre
nt /
A
Voltage Emission Current
Figure 3: Applied DC voltage and emission current fromthe cathode
Figure 4: Time evolved electron distribution at 100ns,200ns, 300ns, 400ns
Fig. 5 shows the azimuthal electric field at a point inthe outer cavity varying with time from 0ns to 400ns. Asshown in the figure, there is strong mode competition be-fore 200ns, and the electric field get Saturation after 360ns.From the Fourier transformation of this time-varying elec-tric fields, the frequency of π-mode oscillating is obtainedas about 9.303GHz. There are also several unknown modeswith frequency of 11.320GHz, 11.440GHz and 7.960GHz,which is denoted in Fig. 6. Further simulation need to beendone on these modes.
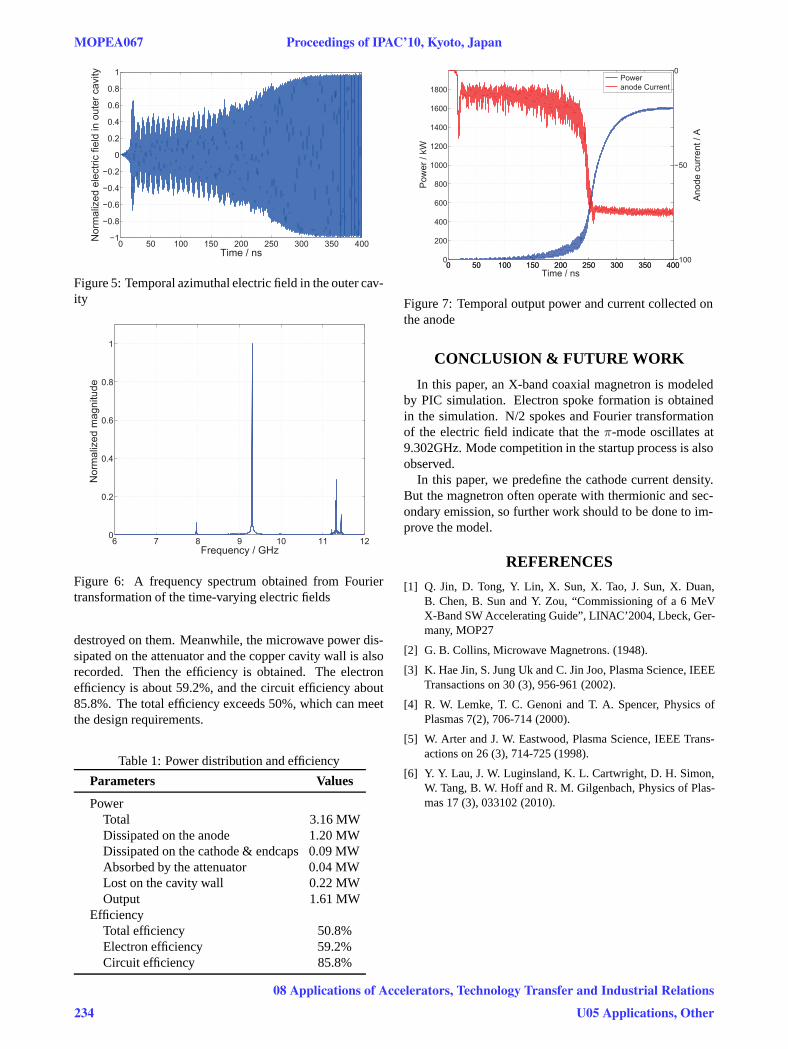
The power exacted from the slot on the outer cavity wallis plotted in Fig.7. The anode current is also presented. Thecurrent reaches the steady state of about 75A at 260ns, andthe output power becomes stable of 1.61MW after 360ns.As shown in the figure, the output power rises rapidly afterthe anode current reached steady state.
The power being dissipated on the anode and the cathodeis obtained from calculating the kinetic energy of electron
Proceedings of IPAC’10, Kyoto, Japan MOPEA067
08 Applications of Accelerators, Technology Transfer and Industrial Relations
U05 Applications, Other 233
0 50 100 150 200 250 300 350 400−1
−0.8
−0.6
−0.4
−0.2
0
0.2
0.4
0.6
0.8
1
Time / ns
Nor
mal
ized
ele
ctric
fiel
d in
out
er c
avity
Figure 5: Temporal azimuthal electric field in the outer cav-ity
6 7 8 9 10 11 120
0.2
0.4
0.6
0.8
1
Frequency / GHz
Nor
mal
ized
mag
nitu
de
Figure 6: A frequency spectrum obtained from Fouriertransformation of the time-varying electric fields
destroyed on them. Meanwhile, the microwave power dis-sipated on the attenuator and the copper cavity wall is alsorecorded. Then the efficiency is obtained. The electronefficiency is about 59.2%, and the circuit efficiency about85.8%. The total efficiency exceeds 50%, which can meetthe design requirements.
Table 1: Power distribution and efficiency
Parameters Values
PowerTotal 3.16 MWDissipated on the anode 1.20 MWDissipated on the cathode & endcaps 0.09 MWAbsorbed by the attenuator 0.04 MWLost on the cavity wall 0.22 MWOutput 1.61 MW
EfficiencyTotal efficiency 50.8%Electron efficiency 59.2%Circuit efficiency 85.8%
0 50 100 150 200 250 300 350 4000
200
400
600
800
1000
1200
1400
1600
1800
Pow
er /
kW
Time / ns0 50 100 150 200 250 300 350 400
−100
−50
0
Ano
de c
urre
nt /
A
Power anode Current
Figure 7: Temporal output power and current collected onthe anode
CONCLUSION & FUTURE WORK
In this paper, an X-band coaxial magnetron is modeledby PIC simulation. Electron spoke formation is obtainedin the simulation. N/2 spokes and Fourier transformationof the electric field indicate that the π-mode oscillates at9.302GHz. Mode competition in the startup process is alsoobserved.
In this paper, we predefine the cathode current density.But the magnetron often operate with thermionic and sec-ondary emission, so further work should to be done to im-prove the model.
REFERENCES
[1] Q. Jin, D. Tong, Y. Lin, X. Sun, X. Tao, J. Sun, X. Duan,B. Chen, B. Sun and Y. Zou, “Commissioning of a 6 MeVX-Band SW Accelerating Guide”, LINAC’2004, Lbeck, Ger-many, MOP27
[2] G. B. Collins, Microwave Magnetrons. (1948).
[3] K. Hae Jin, S. Jung Uk and C. Jin Joo, Plasma Science, IEEETransactions on 30 (3), 956-961 (2002).
[4] R. W. Lemke, T. C. Genoni and T. A. Spencer, Physics ofPlasmas 7(2), 706-714 (2000).
[5] W. Arter and J. W. Eastwood, Plasma Science, IEEE Trans-actions on 26 (3), 714-725 (1998).
[6] Y. Y. Lau, J. W. Luginsland, K. L. Cartwright, D. H. Simon,W. Tang, B. W. Hoff and R. M. Gilgenbach, Physics of Plas-mas 17 (3), 033102 (2010).
MOPEA067 Proceedings of IPAC’10, Kyoto, Japan
234
08 Applications of Accelerators, Technology Transfer and Industrial Relations
U05 Applications, Other