physiotherapy workforce analysis wrha - … regional health authority allied health workforce...
TRANSCRIPT

Winnipeg Regional Health Authority Allied Health Workforce Analysis
Physiotherapy Workforce Analysis June 2002 1
Physiotherapy Workforce Analysis
I. Introduction The purpose of this project was to determine the current and projected physiotherapy workforce for the Winnipeg Regional Health Authority (WRHA) facilities in Winnipeg and in doing so to predict the likelihood of a balance between supply and demand in the future.1 In particular; it was deemed important to identify potential workforce deficiencies with the idea to mitigate such shortages. Originally the intention was to review the available data and develop a document similar to the WRHA RN Required Supply Model document.2 Due to the numerous challenges unique to the Allied Health Professions it was determined that as well as attempting to determine an accurate workforce prediction it was extremely important to develop an understanding of the factors affecting supply and demand. Throughout the process these factors have been noted, to assist in formulating potential strategies to alter the future situation favorably.
It became evident that the data required to make projections was not readily available and so a primary focus of the project became the development, implementation, and maintenance of the appropriate tools for projecting and monitoring the workforce so that the process was repeatable, if desired, and could remain ongoing.
The overall aim of the project was to contribute to achieving and maintaining an optimal and stable Allied Health Workforce.

Winnipeg Regional Health Authority Allied Health Workforce Analysis
Physiotherapy Workforce Analysis June 2002 2
II. Methodology The first task was to define the type of data required and to determine how best to utilize the data to provide a projection of workforce.1 Secondly it was determined that, as the prediction of workforce balance will be based on a relatively small sample size it was important to further clarify the issues affecting workforce supply and demand. The findings and observations noted in this discussion paper are based on a review of the current literature and related reports as well as interviews with a variety of sources. The literature that had been used in formulating the RN Required Supply Model was reviewed.2,3,4,5,6,7,8 Medline was searched using workforce and the discipline, in this case physiotherapy, health human resources, health manpower, and human resource planning.1,9,10,11 Data was collected from the licensing organization - College of Physiotherapists of Manitoba (CPM), professional organization - Canadian Physiotherapy Association (CPA), and educational institution - University of Manitoba, School of Medical Rehabilitation (U of M, SMR). The information reported by the licensing organization is self reported data. Reports formulated by other interest groups were reviewed and key points identified.
The position vacancy data was obtained through the WRHA's collection system and clarified by the physiotherapy management representatives. This data has only been collected on a quarterly basis for the period of February 2001-December 2001. Information regarding retirement, ages, and years of service was obtained through the payroll systems (Ceridian, Health Sciences Centre, and St. Boniface General Hospital), as the HEPP database was not usable due to varied union affiliations and a lack of common labour codes among the physiotherapy employees.
Information regarding the number of physiotherapy graduates was obtained from the University of Manitoba (U of M), School of Medical Rehabilitation. Data regarding the employment and registration patterns of graduating classes for the past five years was obtained from the College of Physiotherapists of Manitoba (CPM).

Winnipeg Regional Health Authority Allied Health Workforce Analysis
Physiotherapy Workforce Analysis June 2002 3
The data collected was analyzed to determine whether there would be an appropriate supply of physiotherapists in the future. The model used to predict future workforce was similar to that used by the nursing model - the supply included numbers of graduates retained and new registrants, the current workforce required was obtained through the position/vacancy data collection, and attrition numbers were based on data from the licensing body. The retirement information, using the Magic 80 and age ranges, was presented although not used specifically in the analysis. The projected vacant positions were matched against the projected change in supply to determine whether the attrition rate would be offset by the supply. The number of physiotherapists working within the WRHA amounts to approximately 262 positions. Considering these low numbers, as well as the influence of the private sector, caution must be used when interpreting the data. For the purposes of this project the need or requirement side of the equation has simply been based on the current requirement of the Winnipeg region, that is, the number of physiotherapists currently employed by the WRHA at the current time. The requirements are based on the current level of service delivery and future needs or variations to these needs have not been considered. The identification of trends and issues affecting the physiotherapy workforce as well as factors affecting work life, recruitment, and retention have been outlined. Recommendations, gleaned from the review of numerous sources, have been included for consideration.

Winnipeg Regional Health Authority Allied Health Workforce Analysis
Physiotherapy Workforce Analysis June 2002 4
III. Profession Description Physiotherapists are self-regulated professionals and are able to work as primary health care providers in all provincial jurisdictions.12 Physician referral is not required based on the Physiotherapy Act (Appendix 3) but may be required by particular health care facilities. The training physiotherapists receive enables them to make autonomous decisions regarding treatment plans and goals.13
Legislation exists that outlines scope of practice, education requirements, requirements for maintaining licensure, complaint and discipline procedures, and practice standards.
Physiotherapists must have a university education.14 In the province of Manitoba approximately 12% of practicing physiotherapists have a diploma, 65% have a degree, 27% have both a diploma and a degree, and 1% of have a Masters degree. The profession remains predominately female (see Table 1). 15 Table 1: Male/Female Distribution of Practicing Physiotherapists in Manitoba15,16
1997 1998 1999 2000 2001 # % # % # % # % # % Female 365 79.5 370 79.9 381 79.4 387 77.6 383 76.6Male 94 20.5 93 20.1 99 20.6 112 22.4 117 23.4Total 459 463 480 499 500
Physiotherapists work in a variety of settings including hospitals, rehabilitation centres, clinics, extended care facilities, schools, community health organizations, work sites, and client's homes. A high proportion of physiotherapists work in private practice (see Table 2). 15,16 Nationally, 25% of therapists report that they are self-employed and this portion of workers has increased significantly over the last 10 years. 17 In Manitoba in 2000, 36% of practicing physiotherapists list private practice as their primary place of employment and an additional 10% indicate that their secondary place of employment is in a private practice. 15 The number of therapists working in private practice in Manitoba has increased an average of 9% per year. 15 Private practice is viewed by many therapists as a preferred areas of practice. Salaries are generally higher and the hours tend to be very flexible. Employment growth in the public sector has not occurred with the exception of 1999-2000 in which the number

Winnipeg Regional Health Authority Allied Health Workforce Analysis
Physiotherapy Workforce Analysis June 2002 5
increased by 4.4%. 17 Over 21% of therapists indicate a secondary place of employment at the time of registration.
Table 2: Location of Principal Employment 15,16
1997 1998 1999 2000 2001
1st 2nd 1st 2nd 1st 2nd 1st 2nd 1st 2nd Hospital 229 23 227 28 226 29 236 28 244 31 Ext Care 23 0 26 1 26 0 26 1 27 2 Private 149 42 162 47 166 46 182 45 175 35 University 10 8 7 10 8 15 11 16 10 20 Other 37 7 36 14 36 8 44 13 49 19 Total 448 80 458 100 462 98 499 103 505 107
Areas of practice include; neurology, orthopedics, cardio-respiratory health, pediatrics, sports injuries, etc. Therapists work in both acute and chronic care settings. A primary role for physiotherapy is that of an educator in all areas of practice.
The profession has a high percentage of workers who work part-time. In Manitoba, approximately 60% of physiotherapists work full-time, 36% work part-time, and 3% work casual. 15 This compares to a national average of physiotherapy part-time workers of 29% and a national average of 19% part-time workers for all occupations. 17 Physiotherapists have one of the lowest unemployment rates for professional occupations and for occupations in the healthcare sector with the national rate averaging 1.1% from 1996 to 1998, compared to the national average of 6.0%. 17
Human Resource Development Canada states that the average earnings for physiotherapy are among the lowest for professional occupations but are comparable to other occupations in the healthcare sector. 17

Winnipeg Regional Health Authority Allied Health Workforce Analysis
Physiotherapy Workforce Analysis June 2002 6
IV. Literature Review
A number of reports describing the physiotherapy workforce experience have been generated in recent years and key points from these reports and articles are provided.
i. Profile of the Allied Health Workforce
(Winnipeg Hospital Authority - September 1999) The Winnipeg Hospital Authority prepared this report in September of 1999.13 It was designed to provide a comprehensive overview of each allied health profession employed in the Winnipeg hospital system. It identified a number of important issues common to the allied health professions such as wage rates, recruitment and retentions issues, scope of practice concerns, student education and enrollment, program management, seven-day week coverage, relief budgets, and workload measurement standards. Specific to physiotherapy it was identified that a shortage of physiotherapists was likely in the near future and that recruitment and retention were difficult due to low salaries, the national exam process, an insufficient supply of graduates, and an aging workforce. Other concerns expressed included; lack of opportunities for continuing education, difficulty providing education to students because of increased caseloads, lack of peer support and mentoring opportunities, minimal opportunities for research, minimal availability of a relief budget, limited access to a casual pool of workers, and a scarcity of opportunities for career laddering.

Winnipeg Regional Health Authority Allied Health Workforce Analysis
Physiotherapy Workforce Analysis June 2002 7
ii. Physiotherapy in Manitoba (Manitoba Branch Canadian Physiotherapy Association August 2000)
The Manitoba Branch of the Canadian Physiotherapy Association conducted a survey in May 2000 with all physiotherapists in the province to gather salary, recruitment, and retention information.18 The survey return rate was 60% with 70.1% being from therapists in public practice and 21.8% from those in the private sector. The most common factors reported by physiotherapists that would influence their decision to stay in Manitoba and increase job satisfaction were increased salaries, better working environments, increased continuing education opportunities including paid leave, decreased caseloads, and increased relief budgets, and improved opportunities for career advancement. Physiotherapy salary scales were identified as not being in line with other professions with similar responsibilities and education. The effect of the program management model was reviewed. The alignment of physiotherapists with the healthcare program has resulted in separation from their colleagues, less peer contact, and decreased learning opportunities. Requests for continuing education funds are considered along with other program employees and may result in fewer or greater opportunities for physiotherapists depending on the facility. There also exists a perception that allied health professionals are excluded from management positions. Under servicing in government funded facilities was felt to exist, making it difficult for clinicians to provide new and innovative patient care. The lack of physiotherapy involvement in public education programs was also noted. The review cited data from the Association of Physiotherapists of Manitoba in which Manitoban graduates comprise 83% of the current workforce with only an average of 56% of each graduating class remaining in Manitoba. The report noted that approximately 10% of physiotherapists come from out of province to practice in Manitoba - mostly as a result of spousal transfers.

Winnipeg Regional Health Authority Allied Health Workforce Analysis
Physiotherapy Workforce Analysis June 2002 8
In the executive summary recommendations included, among others: • Development of a strategy to ensure competitive salaries and incentives for students. • Development of an initiative to recruit therapists from outside the province. • Appointment of one bargaining unit for all publicly funded therapists. • Opportunities for career advancement. • Increased university enrollment. • Provision of a coordinator of continuing education.

Winnipeg Regional Health Authority Allied Health Workforce Analysis
Physiotherapy Workforce Analysis June 2002 9
iii. 1999-2001 Job Choice Survey Summary Report (University of Manitoba School of Medical Rehabilitation 2001) This survey was compiled in August 2001.19 University of Manitoba physiotherapy and occupational therapy graduates were surveyed in the spring of their graduation year to identify factors that might influence job choice and work life. The overall response rate was 61% with a 72.2% response from occupational therapy students and 48.9% for physiotherapy.
Key Points
• 80% of physiotherapists planned to practice in Manitoba after graduation.
• 100% of those surveyed wanted salaries competitive with other provinces.
• 95.2% stated that a competitive salary or a higher salary would keep them working in the province.
• Common factors identified in determining place of employment after graduation for physiotherapy were; opportunity for full-time employment, ability to gain professional experience, working conditions, educational advancement opportunities, and salary levels.
• Preferences for practice areas were general hospital, private practice, rehabilitation centre, and public school system.
• Only 39% indicated that they intended to practice full-time for their entire career. The intentions expressed were 13.6%
would move to part-time after one-five years and 22.7% intend to work for 6 -10 years before moving to part-time.

Winnipeg Regional Health Authority Allied Health Workforce Analysis
Physiotherapy Workforce Analysis June 2002 10
iv. Statistics and Demographics of Physiotherapists and Physiotherapy Practice in Manitoba 1978-1996 (December 1996) The objective of this survey was to review physiotherapy resources in the Manitoba, to provide data to aid forward planning, and to provide information to assist in determining enrollment quotas for physiotherapy.20 In compiling this report the authors reviewed registration data provided by the Association of Physiotherapists of Manitoba. Key Points • Private practice was identified as the major growth sector of
physiotherapy employment in Manitoba. • 83% of the physiotherapy workforce in Manitoba are former
graduates of the U of M. • Of the 79% of U of M graduates entering the workforce in 1992-
1995 only an average of 56% remain registered in Manitoba 1996. • Retention of foreign educated graduates is poor. Only 37% of foreign educated physiotherapists who entered practice in Manitoba since 1990 remain in the province in 1996. • Part time employment is increasing. In 1986, 67.5% of therapists
were working full-time and 26.6% were working part-time compared to in 1996 when 59.9% were full-time and 37.3 % were part-time. • In 1982 only 11% of all practicing physiotherapists were older than
45 years of age. In 1996, 48.4% were older that 40 years of age. • Only a small portion of physiotherapists (1.6%) work beyond age
60. .
Winnipeg Regional Health Authority Allied Health Workforce Analysis
Physiotherapy Workforce Analysis June 2002 11
v. Physiotherapy Entry-Level Education (National Physiotherapy Advisory Group May 2001) A discussion paper compiled by the National Physiotherapy Advisory Group provided information about the current status of physiotherapy entry-level education in Canada as well as future directions.21 The evolution of physiotherapy practice to more independent settings requires a higher level of autonomy and a need for more mature students capable of advanced critical thinking and evidence based practice. Increased management and administrative abilities are required in these more independent settings. Universities must maintain their reputations and competitiveness to compete in attracting future students. In the USA all programs will move to a Master's level entry by January 1, 2002. The move to a Master's level entry would maintain cross-border eligibility with the USA. At a recent Canadian Physiotherapy Association Congress it was stated that all programs should be Master's level by the year 2010. Five Canadian programs have announced the decision to move to the entry level of Master's in 2000 while the other programs are targeted to commence between 2001-2004. McMaster University will graduate physiotherapists with a Master's degree in the fall of 2002. Concerns identified regarding this move towards Master's level entry include insufficient government funding to support the higher education level and augmented salary expectations. This may result in a decreased supply of students and attrition of physiotherapists may result. Some opinions support improving access to affordable and effective services over increased qualifications. Concern has also been expressed that if physiotherapists become over qualified and underpaid for defined roles, increased dissatisfaction, turnover and attrition may develop. If remuneration exceeds the ability of clients to pay, worker substitution may result. Potential benefits include enhancement of professional status, enhancement of research capability, improved preparation for labour force, increased remuneration, and improved autonomy which supports the program management model's need for more independent mature workers. A Master's level would also more accurately reflect the length, scope, and rigor of program.

Winnipeg Regional Health Authority Allied Health Workforce Analysis
Physiotherapy Workforce Analysis June 2002 12
vi. Labour Mobility (Canadian Alliance of Physiotherapy Regulators - 1999) The Canadian Alliance of Physiotherapy Regulators developed a paper describing the labour mobility of physiotherapists and the factors affecting this mobility.22 The annual mobility rate for physiotherapists is estimated to be less than 2%. At the time of publication, the Physiotherapy Competency Examination (PCE) was required in BC, AB, and ON and was not required in SK and NB. The exam is used by BC, AB, ON, NS, PEI, Newfoundland, and Labrador for Canadian educated graduates. In Manitoba the exam is required for all 2002 graduates. All provinces except Quebec use the exam as part of the registration process for non Canadian-educated candidates. The PCE is taken by approximately 70.1% of graduates of the 13 Canadian accredited physiotherapy programs. The Physiotherapy Competency Examination is perceived to be a significant labour barrier and yet the impact of having to complete this exam has potentially only affected 22 physiotherapists over the five years the exam has been in existence as reported in this paper. All provincial regulators use and plan to continue using temporary licenses to minimize labour barriers. Overall physiotherapists do not appear to be a highly mobile group (less than 2%) and the exam does not appear to be a major factor in regards to mobility. Another issue affecting mobility is practice hour requirements. All jurisdictions except Quebec are considering a common practice hour standard of 1200 hours over 5 years. Again, temporary licenses may be issued until local requirements are met. A suggested strategy to offset any perceived barriers may be to provide funding to cover the costs of the exam contingent on completing a designated period of employment.18

Winnipeg Regional Health Authority Allied Health Workforce Analysis
Physiotherapy Workforce Analysis June 2002 13
vii. Literature review A review of the current literature identified few articles specifically addressing workforce issues and many were not based on the Canadian experience. The following summarizes the most applicable articles. Beggs and Noh (1991) surveyed physiotherapists working in Northern Ontario in an attempt to identify factors affecting retention.23 A previous study had identified that a major source of shortages was the high rate of staff turnover with one study reporting that physiotherapists in the United States change jobs every two years or less.24 Among the factors resulting in a decrease in turnover were personal factors such as family proximity and partner's employment, longer tenure lengths, salary, opportunities for promotion, and elements of job satisfaction.23,25 Insufficient salaries and lack of opportunities for advancement had been previously identified as sources of dissatisfaction for physical therapists. 24 Beggs and Noh identified factors that were strongly associated with staff remaining in a particular position. 23 Those felt to be amenable to intervention included opportunities for career development such as availability of continuing education, professional recognition, and opportunities for promotion. As the cost of replacing an employee may be as high as 50% of a first year salary, it is justified that resources be directed to develop strategies to retain staff rather than using resources to recruit. 23
The retention and attrition of physiotherapists in Canada was more recently studied by Wolpert and Yoshida. They identified numerous factors contributing to attrition including; lack of recognition and autonomy, few opportunities for promotion and upward mobility, and low salary. They identified career advancement opportunities, support for continuing education, professional recognition, the chance for promotion, and flexible hours as important factors influencing physiotherapy work patterns.26 A survey conducted by Daniels (1986) had previously reported similar findings and recommended that educational programs be expanded, education and training opportunities be increased, and consideration be given to ensuring that salaries were competitive.27
Winnipeg Regional Health Authority Allied Health Workforce Analysis
Physiotherapy Workforce Analysis June 2002 14
Gwyer noted that job tenure was positively correlated with a high commitment to the profession, job satisfaction, and satisfaction with wages.28 She also identified that the profession tended to be one in which entry level salaries were relatively attractive but the rates of increases do not keep pace over the lifetime of the career. This may increase the difficulty of keeping therapists over the lifetime of a career. The trend of new graduates entering institution-based settings after graduation but then moving into private practice later on in their careers may be as a result of this pattern of compressed benefits. In a survey conducted of hospitals in North Carolina 64% of new graduates entered hospital practice initially but only 37% of practicing therapists remained in hospital practice.1 Gwyer observed that men tend to work longer than women and that students selecting the career of physiotherapy indicated that an interrupted work pattern was likely. 28 This was substantiated by the School of Medical Rehabilitation (2001) survey in which only 39% of students surveyed indicated their intention to work full-time for their entire career. 19 The trend towards greater specialization of practice has the potential to positively and negatively affect workforce. It tends to decrease the interchangeability of workers and may increase the numbers needed but may also enhance work life and positively affect retention. 28 A review paper completed by Mobley (1979) summarized a number of studies examining employee turnover.29 He described a negative relationship between turnover and tenure, job satisfaction, and satisfaction with supervision. Higher salaries generally resulted in higher tenure and in situations where salaries were high, if there was a perceived difference between the expected and the actual salary, tenure was shorter. The perception of status within the organization, generally demonstrated by knowledge of the organizational procedures and a perception of control, were associated with longer tenure. Mobley also noted that the availability of alternative jobs was positively associated with turnover. The role of physiotherapy has been altered somewhat by changes within the healthcare sector such as decreased length of hospital stays and moves towards more chronic care and outpatient coverage. Selker

Winnipeg Regional Health Authority Allied Health Workforce Analysis
Physiotherapy Workforce Analysis June 2002 15
(1995) noted these changes and emphasized the need for increased use of outcome measures and the promotion of evidence based practice as essential when determining future directions in regards to care.9 There has been identified a trend for less rigor in pursuit of evidence based practice in careers in which practice is interrupted, particularly in female dominated professions. The promotion of a more scientifically based approach to treatment is to be encouraged. An environment that supports continuous life long learning may also hold greater appeal for new graduates and serve as an incentive to remain at a particular job. Abelson identified the need to determine why staff leave and whether or not the departure is avoidable or unavoidable, desirable or undesirable.30 He described factors that positively affect turnover such as ambiguity, conflict, and job tension. Individual factors that reduce turnover are age and tenure as well as employees having greater family responsibility. Factors that are inversely related to turnover include organizational and professional commitment and positive leader behavior. Identifying units with high turnover and planning for future needs may assist in decreasing turnover. Other managerial strategies included decreasing job pressures, implementing career development programs, providing more job autonomy and responsibility as desired by staff, and having appropriate levels of flexibility and rigidity. In regards to salary, Abelson has determined that the amount has the most influence at the entry level and decreases after that. Employees who are satisfied with most other important factors are not inclined to leave an organization, even if the pay is a little less than that at other locations.
Robinson and Compton31 discussed the effect of decentralization of allied health services, specifically physiotherapy. It was their experience that although there were benefits to this structure which included increased input into management and decision making, enhanced team approach to patient care, and satisfaction associated with clinical issues and continuity of care there were also many difficulties. These difficulties included lack of staff development plans, problems with recruitment, inflexibility in scheduling staff to ensure adequate coverage, and budget management issues. As a result of these concerns the hospital's management revised the structure and developed a division of clinical support services based on professional lines of responsibility. This restructuring resulted in higher staffing

Winnipeg Regional Health Authority Allied Health Workforce Analysis
Physiotherapy Workforce Analysis June 2002 16
levels for the physiotherapy department and an effort was made to ensure that the advantages of the decentralization structure were maintained.
Selby Smith and Crowley32 reviewed issues surrounding labour force planning for Allied Health in Australia. They identified the need to refine the tools of analysis and to continue to identify factors affecting supply and demand. They noted the high proportion of women in allied health professions, which was associated with greater demands in regards to child rearing and responsibilities in the home.

Winnipeg Regional Health Authority Allied Health Workforce Analysis
Physiotherapy Workforce Analysis June 2002 17
viii. Interview Information Discussion took place with the Physiotherapy Management Group, the Winnipeg Regional Health Authority (WRHA) Physiotherapy Professional Leader, the Canadian Physiotherapy Association- Manitoba Branch President, the College of Physiotherapists of Manitoba Director, and other WRHA physiotherapy managers. Continuing Education Concerns expressed included that funding and opportunities for educational purposes were not consistent throughout the region. Only 37.7% of physiotherapists working in the public sector were satisfied with opportunities for continuing education.18 Coverage for staff attending courses is not generally available as part of a relief budget. As availability of continuing education was identified as a critical factor affecting recruitment and retention it was suggested that provisions be made for leave to attend courses, financial support for attending courses, relief budgets to provide replacement staff, and funding to support a continuing education coordinator.18 Discussion took place regarding the need for a regional continuing education program and a regional library service. Program Management There was concern expressed regarding the inconsistent manner in which the program management model has been implemented across the region. At certain facilities the professional leaders may be required to carry a full caseload while at others facilities the position may more closely resemble a management position. The perceived lack of career advancement opportunities as a result of the disabling of physiotherapy departments was of concern.
Relief Budgets Vacancy data was not felt to accurately reflect the true staffing situation as many facilities have little or no relief budget to cover absences. Long-term employees have accrued extended vacation time and sick benefits. Coverage for these absences is generally not available and this results in decreased coverage and increased workloads for other staff. Overtime is generally recorded and taken back as time, not in salary, again resulting in a decrease in coverage.

Winnipeg Regional Health Authority Allied Health Workforce Analysis
Physiotherapy Workforce Analysis June 2002 18
Any new programs that are implemented do have relief budgets associated with them, but a gap exists at present. The need to have adequate and equitable relief budgets as well as a WRHA float pool of therapists available for relief work was identified. Table 3:Physiotherapy Relief Budgets (as reported by facilities) CGH GGH HSC SBGH SOGH VGH DLC MHC RVC RCC
EFT 1.46 1.66 0.0 1.56 0.9 0.9 0.0 0.51 0.16 0.0 Staff Mix Having long term staff members also discourages younger staff from entering the workforce at a particular facility as it may be difficult to obtain particular caseloads in facilities where positions are not part of a rotation schedule and desirable vacation times may not be easily obtained. At many centres longer-term employees have accumulated vacation time and sick leave such that without adequate relief budgets coverage of workload becomes increasingly difficult (see Table 4). This imposes additional stress on all employees. Table 4: Years of Service and Weeks Vacation CGH GGH HSC SBGH SO VGH DLC MHC RVHC 0-3 15 12 23 13 7 11 4 2 34-9 2 8 24 14 4 2 3 2 310-19 9 4 18 19 5 2 2 3 120+ 1 4 7 6 1 1 0 1 3#Staff 27 28 72 52 17 16 9 8 10Weeks 104 112 297 226 68 57 34 35 44
o Data from Community Therapy Services/ Rehabilitation Centre for Children/ Personal Care Homes was not available.
Scope of Practice It was pointed out that community based practice has not been well developed for physiotherapy. Shorter hospital stays result in increased demand for outpatient services and home based care. The role of physiotherapy in preventative health is felt to be underdeveloped and is currently less than 1%. 18 Concern has been expressed regarding wait time for physiotherapy outpatient services provided in hospitals. Wait lists are an issue in regards to service delivery as well as job satisfaction

Winnipeg Regional Health Authority Allied Health Workforce Analysis
Physiotherapy Workforce Analysis June 2002 19
Research As health care funding is being more critically associated with evidence based practice the availability of a research budget was specified as being essential in ensuring that treatment is effective and based on best practice.

Winnipeg Regional Health Authority Allied Health Workforce Analysis
Physiotherapy Workforce Analysis June 2002 20
V. Other Factors Affecting Recruitment and Retention
Student Supervision The ability to provide supervised clinical practice for students is an important factor in the recruitment of new graduates. The ability to provide student placements affords the facility an opportunity to preview performance of potential staff members. When students have positive experiences they are more likely to apply for employment at that facility. It is extremely important to create a vision of a good working environment for students as an aid to recruitment. The supervision of students requires a commitment of time as well as a manageable caseload. In situations where staff shortages may exist or caseloads are high, staff may view the supervision of students as a hardship. It may be particular important to compete for internships during which time students can assist somewhat with caseloads and may be more actively assessing and seeking out work experiences. At present, students often select private practice placements as their final clinical placement experience as clinics are amenable to this and hospitals are not offering incentives for placements.
Salaries and Union Affiliations Specific salaries will not be discussed in this document. It is important to note though that salary scales and union or non-union affiliations may vary from facility to facility. As well, the earning potential in the private sector is greater. The School of Medical Rehabilitation recruits top students and the salary is relatively poor at graduation when compared to other professions with similar responsibilities and education.18 The paper published by the Canadian Physiotherapy Association reported that 76.1% of therapists surveyed were dissatisfied with their salary relative to the salary of physiotherapists in other provinces and 83.2% were dissatisfied with their salary relative to other professions. 18 In a survey of physiotherapy salary scales completed by the Human Resources Department of the Health Sciences Centre (HSC) in April 1997 the salary scale at the HSC was deemed one of the lowest in Canada. 18
Winnipeg Regional Health Authority Allied Health Workforce Analysis
Physiotherapy Workforce Analysis June 2002 21
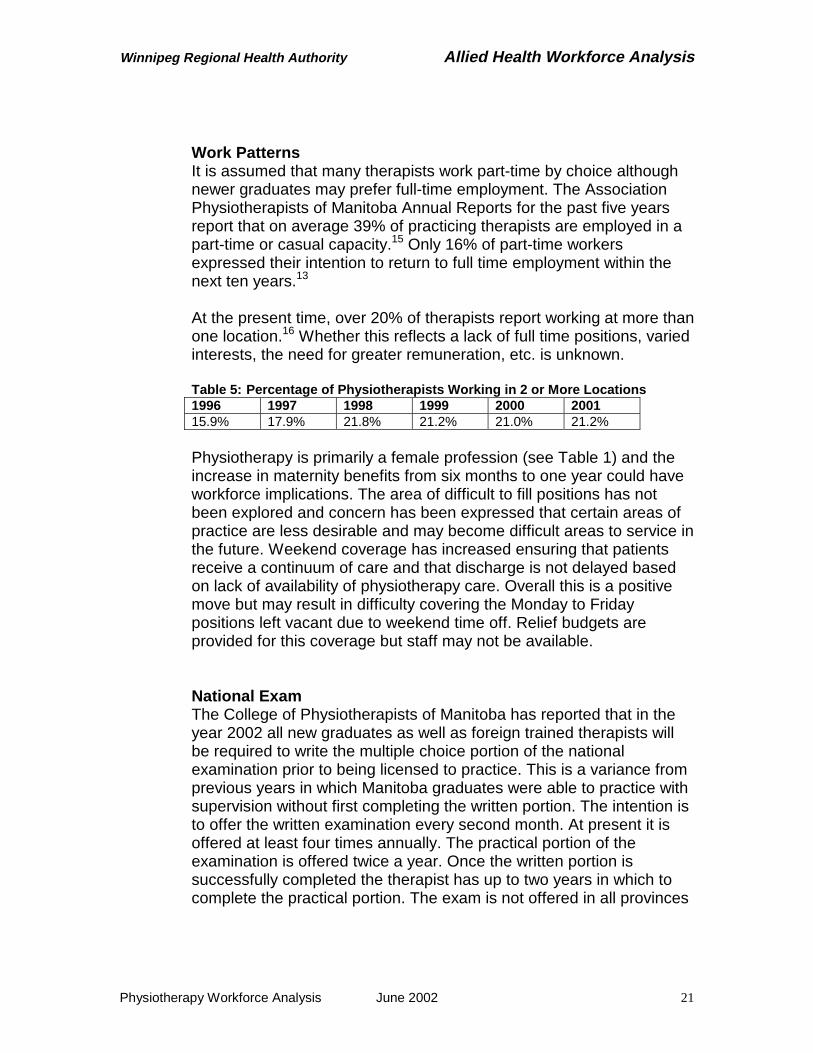
Work Patterns It is assumed that many therapists work part-time by choice although newer graduates may prefer full-time employment. The Association Physiotherapists of Manitoba Annual Reports for the past five years report that on average 39% of practicing therapists are employed in a part-time or casual capacity.15 Only 16% of part-time workers expressed their intention to return to full time employment within the next ten years.13 At the present time, over 20% of therapists report working at more than one location.16 Whether this reflects a lack of full time positions, varied interests, the need for greater remuneration, etc. is unknown. Table 5: Percentage of Physiotherapists Working in 2 or More Locations 1996 1997 1998 1999 2000 2001 15.9% 17.9% 21.8% 21.2% 21.0% 21.2% Physiotherapy is primarily a female profession (see Table 1) and the increase in maternity benefits from six months to one year could have workforce implications. The area of difficult to fill positions has not been explored and concern has been expressed that certain areas of practice are less desirable and may become difficult areas to service in the future. Weekend coverage has increased ensuring that patients receive a continuum of care and that discharge is not delayed based on lack of availability of physiotherapy care. Overall this is a positive move but may result in difficulty covering the Monday to Friday positions left vacant due to weekend time off. Relief budgets are provided for this coverage but staff may not be available.
National Exam The College of Physiotherapists of Manitoba has reported that in the year 2002 all new graduates as well as foreign trained therapists will be required to write the multiple choice portion of the national examination prior to being licensed to practice. This is a variance from previous years in which Manitoba graduates were able to practice with supervision without first completing the written portion. The intention is to offer the written examination every second month. At present it is offered at least four times annually. The practical portion of the examination is offered twice a year. Once the written portion is successfully completed the therapist has up to two years in which to complete the practical portion. The exam is not offered in all provinces

Winnipeg Regional Health Authority Allied Health Workforce Analysis
Physiotherapy Workforce Analysis June 2002 22
so it may be necessary to travel to take the practical exam and the cost is high (approximately $1500.00). 13 Private Practice The growth rate in private practice remains in the range of 9% per year with no remarkable increase in the number of practicing therapists in public service. A high percentage of therapists work in both public and private service. Although exact salaries are unknown, it is generally accepted that wages are higher in the private sector. The ability to specialize in the practice of orthopedics remains a huge draw for many therapists.
Winnipeg Regional Health Authority Allied Health Workforce Analysis
Physiotherapy Workforce Analysis June 2002 23
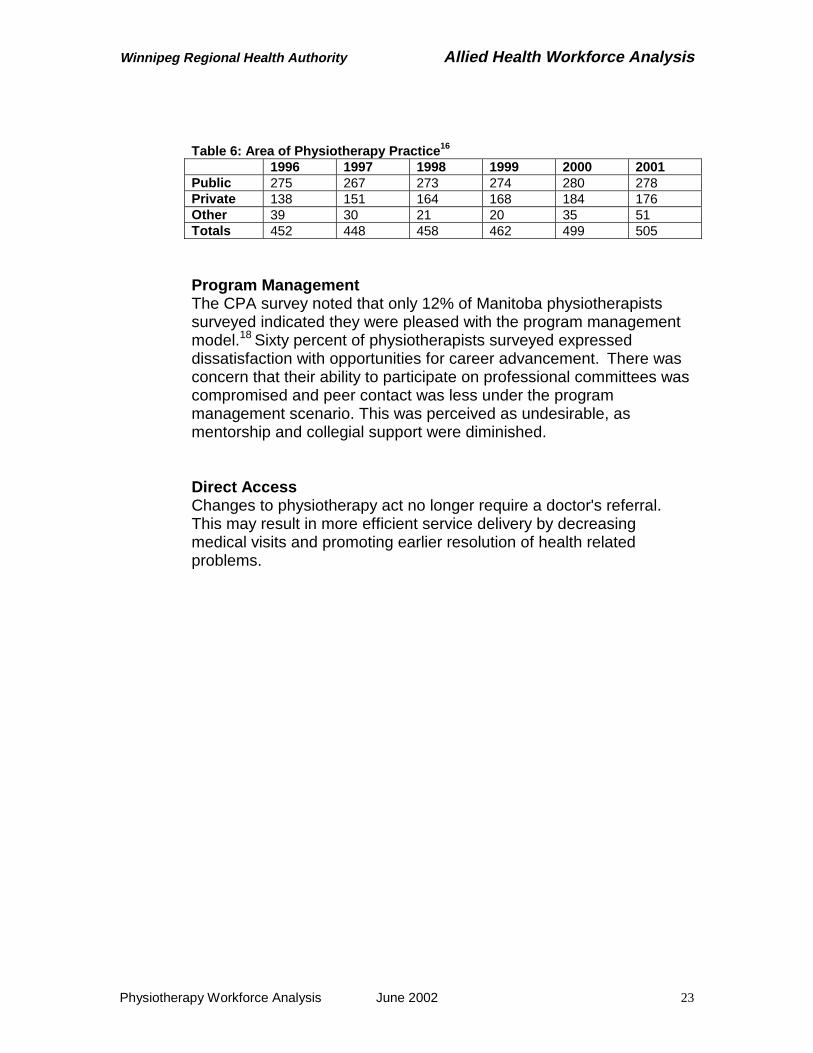
Table 6: Area of Physiotherapy Practice16 1996 1997 1998 1999 2000 2001 Public 275 267 273 274 280 278 Private 138 151 164 168 184 176 Other 39 30 21 20 35 51 Totals 452 448 458 462 499 505
Program Management The CPA survey noted that only 12% of Manitoba physiotherapists surveyed indicated they were pleased with the program management model.18 Sixty percent of physiotherapists surveyed expressed dissatisfaction with opportunities for career advancement. There was concern that their ability to participate on professional committees was compromised and peer contact was less under the program management scenario. This was perceived as undesirable, as mentorship and collegial support were diminished.
Direct Access Changes to physiotherapy act no longer require a doctor's referral. This may result in more efficient service delivery by decreasing medical visits and promoting earlier resolution of health related problems.

Winnipeg Regional Health Authority Allied Health Workforce Analysis
Physiotherapy Workforce Analysis June 2002 24
VI. Education
In the past enrollment at the University of Manitoba, School of Medical Rehabilitation, Physiotherapy Division has been 30 students per year. Entrance requirements for the school are very competitive with the average GPA for the years 1993-2000 being 3.855 out of a maximum of 4.5.18 Enrollment has been increased and in the year 2004 the graduating class will be 40 and for the years 2005 and 2006 graduates will number 50 (see Table 7). Table 7: Manitoba Graduates 2002-2006 Year 2002 Year 2003 Year 2004 Year 2005 Year 2006 Graduates 30 30 40 50 50
The School of Medical Rehabilitation has been discussing the need for a greater diversity in the make-up of the students selected for the program and the need to recruit students from rural and northern Manitoba and those with Aboriginal ancestry has been identified. 33
The annual tuition fees and costs for books/supplies are substantial. The required clinical placements and internships not only incur costs for the students but also decrease their earning power over the summer break. The annual fees including supplies, books, and clinical placements costs are as follows; Year 1 - $6059.90, Year 2 - $7016.80, and Year 3 - $6820.95.34 These amounts do not include the cost of their first year of university, which is required prior to entry into the program. Many students who enter have already completed degrees or more than one year of university education. Clinical placements are an integral part of the education of physiotherapy students. The average number of student placements required annually are 175 placements with 80% of these placements occurring in WRHA facilities.34,35 First years students participate in a two-week orientation session that provides general exposure to clinical practice followed by a five-week cardio-respiratory placement. The majority of the cardio-respiratory placements take place in public facilities although a few placements are provided within the community.

Winnipeg Regional Health Authority Allied Health Workforce Analysis
Physiotherapy Workforce Analysis June 2002 25
During their second year students participate in two four-week musculoskeletal placements. These may take place in public facilities or private practices. Third year students have two four-week neurological placements, which are hospital based. As well, students are required to complete an eight-week internship prior to graduation. These internships can be at any site and frequently students select private practice for this final placement. Over the course of their program the students must have placements in variety of settings including community, acute care, rehabilitation, and a rural setting. Students are provided funding to cover accommodation and transportation for placements in rural Manitoba. The University of Manitoba is the only university in Canada to provide this kind of support. Students pay a registration fee for their clinical placement. The school has recently explored hiring existing hospital staff to supervise three to four students at one time. The staff member's position is filled for the period of the placement using funding provided by the university. It is evident from Table 8 that the majority of physiotherapists practicing in Manitoba are graduates of the University of Manitoba (87.3%).15 The location of graduation indicated reflects the location at which the therapist received their first degree in physiotherapy allowing them to practice. The graduates may have gone on to receive degrees at higher levels at the University of Manitoba or other universities. The University of Manitoba has continued to offer the degree completion program and many of the foreign and Canadian trained graduates may have initially registered in Manitoba at the time they came to complete their degrees.
Table 8: Educational Background of Practicing Physiotherapists in Manitoba
Location of Graduation Number Registered Percentage Manitoba 446 87.3 Canada 38 7.4 Foreign 27 5.3 Total 511 100

Winnipeg Regional Health Authority Allied Health Workforce Analysis
Physiotherapy Workforce Analysis June 2002 26
VII. Age Distributions and Retirement Information
Early retirement is becoming more common and this is particularly true for the public sector with 55 being the most popular retirement age for that group. As well, women tend to retire earlier that men, likely as a result of the age difference between spouses.36 Information from the Healthcare Employees Pension Plan indicates that 20% of members with Magic 80 at age 50 retire. Canadian healthcare providers are, on average, getting older. The Canadian Institute for Health Information (CIHI) reports that from 1994-2000 the average age has risen almost 2 years from 39.1 to 40.8 years.37 This appears to be true for the physiotherapy profession as well (see Table 9 & 10). For the years 1991-1995 2.2% of therapists worked past the age of 60 years and 7.8% worked past age 50. A previous review of age distribution suggested that 5% or less of the physiotherapy workforce continued to work past the age of 55 years.20
For the years 1996-2000 only 1.4% of therapists worked past age 60 and 15.3% were still working past age 50 indicating a slight increase in physiotherapists working in the 50-59 age range.
Table 9: Age Distribution of Practicing Physiotherapists 1991-1995 20 Year Total 20-29 30-39 40-49 50-59 60-69 70-79 # % # % # % # % # % # % 1991 368 87 23.6 173 47.0 81 22.0 15 4.1 5 1.4 7 1.9
1992 392 81 20.7 165 42.1 120 30.6 18 4.6 5 1.3 3 0.8 1993 418 89 21.3 161 38.5 136 32.5 22 5.3 7 1.7 3 0.7 1994 440 78 17.7 179 40.7 150 34.1 26 5.9 4 0.9 3 0.7 1995 448 78 17.4 166 37.1 161 35.9 37 8.3 3 0.7 3 0.7 Avg 20.1 41.1 31.0 5.6 1.2 1.0
Table 10: Age Distribution of Practicing Physiotherapists 1996-200116
Year Total 20-29 30-39 40-49 50-59 60-69 70-79 # % # % # % # % # % # % 1996 457 79 17.3 157 34.4 172 37.6 42 9.2 4 0.9 3 0.7 1997 452 75 16.6 143 31.6 175 38.7 51 11.3 5 1.1 3 0.7 1998 459 76 16.6 139 30.3 174 37.9 64 13.9 3 0.7 3 0.7 1999 463 72 15.6 137 29.6 176 38.0 71 15.3 3 0.6 4 0.9 2000 499 95 19.0 146 29.3 170 34.1 81 16.2 4 0.8 3 0.6 2001 503 94 18.7 145 28.8 169 33.6 89 17.7 4 0.8 2 0.4 Avg 17.3 30.6 36.7 13.9 0.8 0.6
Employees are entitled to an unreduced pension benefit once their age plus years of service total 80. Table 11 indicates the number of employees at each site that will reach Magic 80 over the next five years.

Winnipeg Regional Health Authority Allied Health Workforce Analysis
Physiotherapy Workforce Analysis June 2002 27
Table 11: Number of Employees Attaining Magic 80 Year CGH GGH HSC SBGH SO VGH DLC MHC RVHC Totals2002 2 2 1 5 2003 1 1 2 2004 1 1 3 1 1 7 2005 1 1 1 1 4 2006 2 1 1 1 1 1 7 Totals 3 3 6 6 1 2 0 2 2 25
Data from Community Therapy Services/ Rehabilitation Centre for Children/ Personal Care Homes was not available.
Table 12: Age Distribution
Table 13: Age Distribution of WRHA Physiotherapists 2001 and Percentages of Age Ranges for 1991-1995 and 1996-2001 for All Manitoba Age Ranges in Years
WRHA #
WRHA %
1991-1995%
1996-2001%
20-29 56 23.1 20.1 17.330-39 71 29.3 41.1 30.640-49 77 31.8 31.0 36.750-59 37 15.3 5.6 13.960-69 1 0.4 1.2 0.870+ 0.0 0.0 1.0 0.6Total 242 Data from Community Therapy Services/ Rehabilitation Centre for Children/ Personal Care Homes was not available.
Tables 12 and 13 depict a fairly even distribution until the age category 50-59 at which time there is a marked decrease in numbers. At this time there is only one physiotherapist working past the age of 60 years. The cohort of therapists age 40-49 may be indicative of the years during which the university's enrollment was 40 students. In 1979 enrollment decreased to 16 students.
Age Distribution of WRHA Physiotherapists
0
20
40
60
80
100
29 39 49 59 69 MoreAge Range
Fre
quen
cy

Winnipeg Regional Health Authority Allied Health Workforce Analysis
Physiotherapy Workforce Analysis June 2002 28
Table 14: Number of WRHA Physiotherapists Age 55 and 60 Year Age 55 Age 60 2002 13 12003 6 02004 5 22005 8 42006 6 2Totals 38 9
Data from Community Therapy Services/ Rehabilitation Centre for Children/ Personal Care Homes was not available.
Table 14 indicates the year at which WRHA physiotherapists will reach age 55 and age 60.

Winnipeg Regional Health Authority Allied Health Workforce Analysis
Physiotherapy Workforce Analysis June 2002 29
VIII. Determination of Future Workforce
In an attempt to project future workforce it was necessary to accurately determine the number of physiotherapist presently required by the WRHA, the available supply of licensed workers, and the attrition/retirement rate for this group.
The predicted number of graduates for the years 2002-2006 was provided by the University of Manitoba and based on a review of the behaviour of previous graduates (see Appendix 1), an estimate of the number of graduates that were likely to enter the urban public workforce was determined (see Table 15). Recruitment rates of new U of M graduates over the last five years have been 46% on average at the time of graduation with a retention rate of 41% overtime. Table15: Predicted Recruitment Numbers of University of Manitoba Graduates for Public Service In Winnipeg Year 2002 Year 2003 Year 2004 Year 2005 Year 2006 Initial 14 14 18 23 23 Over time 12 12 16 21 21
Position/vacancy data has been collected by the WRHA for one year and this data was used to determine the current requirement as well as the existing vacancies (see Appendix 2). The total number of vacant positions is 22 representing 13.1 EFTs. This data was based on the most recent sampling, December 2001, as using this number was felt to be most relevant to the analysis and there was little variation in the numbers over the course of the year. Table 16: Current Required Supply December 2001 Area Positions Vacancies Term Vacancies Pos. EFT Pos. EFT Pos. EFT
Acute 200 151.7 9 4.9 5 2.5 LTC 31 22.3 3 2.0 2 2.0 Other 31 19.1 2 1.2 1 0.5 Totals 262 193.1 14 8.1 8 5.0 Overtime has not been considered in this analysis as it is generally taken as time back and has not been recorded on a regular basis. It is also not known whether any of these positions are currently filled by therapists working at more than one location. Based on the reported

Winnipeg Regional Health Authority Allied Health Workforce Analysis
Physiotherapy Workforce Analysis June 2002 30
number of paid positions (payroll data) and the number of reported positions (position/vacancy data) it is assumed that there may be as many as 20 physiotherapists working at more than one WRHA facility. This number would also include those therapists in casual positions.
Retirement/age data for the region was obtained through the payroll systems and the ages and Magic 80 numbers are depicted in Tables 11 to14. The College of Physiotherapists of Manitoba collects data regarding therapists that do not register or become non-practicing. This information is shown in Table17. This data was used to depict the flow of physiotherapists in and out of public service. As these number would include retiring therapists the retirement/age data in Tables 11-14 is presented to provide a clearer picture of the current and projected workforce but this data was not used in the analysis to avoid duplication of the retiring therapists. Table 17 shows the numbers and percentages of therapists not registering or moving to non-practicing status for the past five years. To re-register once therapists have become non-practicing they are now required to have; proof of membership in good standing from their previous licensing body, proof of liability insurance, a criminal record check, 1200 practice hours over the last five years, a job offer, and if their year of graduation is 2001 or later they must show a Physiotherapy Competency Exam certificate. Table 17: Non- Registered and Non-Practicing Physiotherapists Last Known Place of Employment
Year Total Public Private Unknown Urban Rural Urban Rural # % # % # % # %
1997 22 221998 32 11 50.0 2 9.1 9 40.9 0 0 101999 44 17 63.0 1 3.7 7 25.9 2 7.4 172000 42 13 59.1 0 0 9 40.9 0 0 202001 31 14 60.9 1 4.3 8 34.8 0 0 8Average % 58.3 4.3 35.6 1.9 Totals 171 55 4 33 2 77
The "unknown" category in Table 17 includes physiotherapists who did not report their place of employment. It was determined that of therapists who do not register or do not practice each year 58.3% are
Winnipeg Regional Health Authority Allied Health Workforce Analysis
Physiotherapy Workforce Analysis June 2002 31
from urban public settings, 35.6% from urban private, 4.3% from rural public, and 1.9% from rural private settings. The numbers listed in the unknown category were then divided into each category using the calculated average percentages. Using this calculation Table 18 was created and an average number of therapists leaving public service each year was determined. On average 20 physiotherapists leave urban public service each year. Of these, approximately two return each year. The number of new registrants for urban public service each year, not including students, is approximately two physiotherapists (see Table 19). The total gain on average, not including students is four.

Winnipeg Regional Health Authority Allied Health Workforce Analysis
Physiotherapy Workforce Analysis June 2002 32
Table 18: Number Non- Registered and Non-Practicing Physiotherapists 1997-2001 (including those from category previously unknown)
Year Total Public Private Urban Rural Urban Rural
1997 22 13 1 8 0 1998 32 17 1 13 1 1999 44 27 2 13 1 2000 42 25 2 16 1 2001 31 19 1 11 1 Totals 171 101 7 61 4 Table 19: New Registrants - Not Students
Year Total Public Private Urban Rural Urban Rural
1997 4 3 1 1998 5 1 3 1999 10 4 5 1 2000 2 0 2 2001 4 3 1 Totals 25 11 12 1 This data was combined with the information about recruitment and attrition of new graduates (Table 15) to determine the likely flow of physiotherapists in and out of public service (Table 20 and 21). To determine the overall attrition rate the average number of physiotherapists leaving (20) was added to the loss of new graduates from each year (2) for a net loss of 22 therapists annually from urban public service. The calculation used to make this determination of future workforce was as follows:
Current Vacancies - Attrition (22) + New Registrants (2) + Returning Therapists (2) + New Graduates Recruited = Projected Workforce
This calculation was used to determine workforce for 2002-2006 by position as well as by EFT. For the calculation of EFT, it was assumed that all persons employed were full time. The calculations were completed for permanent positions and EFT as well term plus permanent positions by position and EFT.

Winnipeg Regional Health Authority Allied Health Workforce Analysis
Physiotherapy Workforce Analysis June 2002 33
The vacancy numbers by position and EFT continue to increase until the year 2005 and 2006 at which time there is some improvement due to increased enrollment at the University of Manitoba (see Tables 20 to 23). The calculations for Table 20 and 21 take into account only permanent vacancies. Tables 22 and 23 are calculated using both term and permanent vacancies by position and EFT. Table 20: Predicated Workforce by Positions (Permanent Vacancies) Year Vacancies Attrition Gain Graduates Workforce 2002 -14 -22 +4 +14 -182003 -18 -22 +4 +14 -222004 -22 -22 +4 +18 -222005 -22 -22 +4 +23 -172006 -17 -22 +4 +23 -12 Table 21: Predicated Workforce by EFT (Permanent Vacancies) Year Vacancies Attrition Gain Graduates Workforce 2002 -8.1 -22 +4 +14 -12.12003 -12.1 -22 +4 +14 -16.12004 -16.1 -22 +4 +18 -16.12005 -16.1 -22 +4 +23 -11.12006 -11.1 -22 +4 +23 -6.1 Table 22: Predicated Workforce by Positions (Permanent and Term Vacancies) Year Vacancies Attrition Gain Graduates Workforce 2002 -22 -22 +4 +14 -262003 -26 -22 +4 +14 -302004 -30 -22 +4 +18 -302005 -30 -22 +4 +23 -252006 -25 -22 +4 +23 -20
Table 23: Predicated Workforce by EFT (Permanent and Term Vacancies) Year Vacancies Attrition Gain Graduates Workforce 2002 -13.1 -22 +4 +14 -17.12003 -17.1 -22 +4 +14 -21.12004 -21.1 -22 +4 +18 -21.12005 -21.1 -22 +4 +23 -16.12006 -16.1 -22 +4 +23 -11.1

Winnipeg Regional Health Authority Allied Health Workforce Analysis
Physiotherapy Workforce Analysis June 2002 34
Table 24: Percentage of Vacancy by Position and EFT Year Permanent Term Total Pos. EFT Pos. EFT Pos. EFT
2001 5.3% 4.2% 3.1% 2.4% 8.4% 6.8% 2002 6.9% 6.3% 3.0% 2.6% 9.9% 8.9% 2003 8.4% 8.3% 3.1% 2.6% 11.5% 10.9% 2004 8.4% 8.3% 3.1% 2.6% 11.5% 10.9% 2005 6.5% 5.7% 3.0% 2.6% 9.5% 8.3% 2006 4.6% 3.2% 3.0% 2.5% 7.6% 5.7% Average 6.7% 6.0% 3.1% 2.6% 9.2% 8.6% The predicted vacancy percentage is shown in Table 24. The term vacancy percentage for positions and EFTs is constant at 3.0% -3.1% and 2.4%- 2.6% respectively. The overall vacancy rate (permanent and term) by position is 9.2% and by EFT 8.6%.

Winnipeg Regional Health Authority Allied Health Workforce Analysis
Physiotherapy Workforce Analysis June 2002 35
IX. Discussion
The analysis of projected workforce indicates that it is likely that vacancies will persist if strategies to recruit and retain physiotherapists are not actively pursued. Vacancies rates for permanent positions will range from 12-22 positions over the next five years. Total rates of vacancies including both term and permanent vacancies range from 20-30 positions. This reflects a 9.2% vacancy rate.
The number of physiotherapists graduating in Manitoba will increase over the coming years. Efforts must be directed to improving the current recruitment rate of 46% as well as ensuring that these workers remain in the system. The analysis demonstrates that approximately 20 therapists leave urban public service each year. The reasons for this attrition are at this time unknown. Relocation, retirement, career change, maternity leaves, and educational pursuits are likely some of the reasons behind the departures from practice. Further information about these departures and possible incentives for continuing to practice need to be obtained, as it is likely that recruitment alone will not result in a stable workforce. The high cost of turnover should be acknowledged and resources directed towards retention of existing staff as well as recruitment of new employees. The analysis indicates that there will be an increase in vacancies until the year 2006 at which time the situation will improve yet a deficit will remain. This improvement over time is a result of the School of Medical Rehabilitation increasing enrollment over the next few years. The predicted vacancy rate is high and it should be noted that this vacancy rate does not take into consideration the "vacancies" created by minimal or non-existent relief budgets, which further decreases staffing. As well, overtime has not been considered in this equation. The possible effect of the increased maternity benefits is also likely to increase the term vacancy rates. There is concern that the number of retirees may increase substantially once the larger classes of the 1970s attain retirement age or Magic 80. The classes of 40 students ended in 1979. After that time the school only graduated 16-20 students annually. This group is reflected in the age range 40-49 years, which represents 77 WRHA employees, 31.8% of the current workforce.

Winnipeg Regional Health Authority Allied Health Workforce Analysis
Physiotherapy Workforce Analysis June 2002 36
It must be remembered that the results of the analysis may be influenced by many factors. It will be important to continue to maintain the tools of the analysis and to monitor the predications. Exit tracking of employees would assist in more accurate assessment of career movement. The possible limitations of this analysis include: 1. Position /vacancy information is based on one year of data only.
2. The impact of the availability of work within the private sector, with
the likelihood of increased salary and greater flexibility, is difficult to measure.
3. Graduate data is based on five years of experience with complete
data only being available for the 1997 graduating class. 4. Overall, the numbers on which the predication is based are small
therefore the potential exists that minor variations may lead to discrepancies over time.
5. The vacancy information, licensing body information, and the
graduating class data only reflect the status at one point in time.
6. The retirement and age data for Community Therapy Services, the Rehabilitation Centre for Children, and the Personnel Care Homes was not included in the analysis.
7. The determination of attrition is based on past years experience
and the assumption that the "unknown" category has proportionate distribution in regards to public/private workplace.
8. There has been no consideration regarding the possibility of
increased demands based on aging populations. The analysis is based on requirements for the year 2001.

Winnipeg Regional Health Authority Allied Health Workforce Analysis
Physiotherapy Workforce Analysis June 2002 37
X. Recommendations
There are many strategies that may positively impact on workforce. The following strategies have been cited by numerous sources as potentially having a positive influence on retention and recruitment of physiotherapists and health care professionals. The American Hospital Association Commission on Workforce for Hospitals and Health Services has created a document that presents the recommendations of the Commission for changes that will result in a long-term solution to the shortages of health care workers.38 A number of these recommendations are included in the list of possible strategies. Their recommendations fall into five categories; foster meaningful work, improve the culture of the workforce, attract and retain a diverse workforce, work with others, and build support within the broader society. This report notes that careers in health care are viewed as less attractive. The reasons for this falling out of favour must be explored and resources dedicated to improving the image of work in healthcare. The report emphasizes the need to retain workers as well as recruit new employees. The Commission advocates making human resources a priority within healthcare and that reports should be developed that measure the vacancy, retention, and turnover successes as well as problem areas.
Recruitment and Retention Strategies
1. Create an environment where staff are kept informed of new procedures, work processes, etc. to promote their involvement in decision making and ensure they feel part of the organization. 38
2. Continue to assess worker satisfaction and to identify factors affecting
satisfaction by conducting surveys, utilizing performance evaluation systems that would capture these factors, etc. 38 Determine the characteristics of meaningful work and direct resources to meeting the needs of staff in this regard. The Work Life Survey, which is being undertaken at this time, should provide the basis for this recommendation.
3. Develop and provide management education programs for interested
physiotherapists with the intention of developing leaders in the field.

Winnipeg Regional Health Authority Allied Health Workforce Analysis
Physiotherapy Workforce Analysis June 2002 38
4. Create excellence in management by providing existing managers with mentors, appropriate education, and time to perform the job well.
5. Develop a strategy to ensure competitive salaries based on education,
experience, and competencies.
6. Recognize that physiotherapy student placements can provide an excellent opportunity for staff recruitment. Promote student supervision by ensuring that the supervising therapist's caseload is manageable and that staff are provided incentives to provide this service. The provisions of stipends, return for services agreements, and other incentives should be investigated to attract students from other provinces and to ensure University of Manitoba graduates are encouraged to stay in Manitoba for their internships.
7. Provide incentives for graduates such as assistance with national
exam fee funds in lieu of service commitment, relocation allowances, etc.
8. Provide equitable relief budgets to allow for adequate coverage as well
as providing the ability to accurately assess workload. 9. Develop a regional plan for continuing education including funding to
cover workload and course fees, appointment of a coordinator to develop programs, and a system to provide access to library resources. This will assist in the development of an evidence-based approach to practice as well as meet the need for ongoing continuing education. The development of an evidence-based approach to practice may also result in a more manageable approach to caseloads.
10. Review the program management model and its affect on staff. Review
implementation across the region and determine what aspects are working best and areas that are problematic.
11. Explore the feasibility of developing a casual pool of workers for the
region or developing relief workers with special training and remuneration.
12. Continue to provide a variety of employment opportunities including
full-time and part-time positions and the possibility of flexible hours and job sharing situations.

Winnipeg Regional Health Authority Allied Health Workforce Analysis
Physiotherapy Workforce Analysis June 2002 39
13. Use the position/vacancy system to track retention, turnover, reasons
for leaving, etc.
14. Attempt to retain older workers by ensuring that work opportunities exist that are not too physically demanding, provide opportunities for the mentoring of less experienced employees, and adjust retirement plans to allow for part-time/casual work that will not affect pension benefits.38
15. Provide salary incentives for long service as well as rewarding long
term employees in other ways.
16. Provide assistance with childcare either through on-site daycare or financial support. 7
17. Attempt to track difficult to fill positions and areas of practice which
may be perceived as less attractive to new graduates and develop strategies to promote these areas of practice. Identify areas where vacancies have not been an issue as well as difficult to fill positions and determine the factors affecting these scenarios.
18. Create a line of funding that would specifically address issues affecting
recruitment and retention.
19. Continue to direct resources towards the development and refinement of tools to permit meaningful data collection and further analysis of workforce to ensure the availability of an adequate physiotherapy workforce in the future.
20. Encourage all interested parties to work together to monitor trends and
develop strategies to deal with physiotherapy workforce issues.7
Winnipeg Regional Health Authority Allied Health Workforce Analysis
Physiotherapy Workforce Analysis June 2002 40
XI. Conclusion
The likelihood of an ongoing shortage of physiotherapists has been proposed. Efforts must be directed towards mitigating this situation quickly and with a vision to continually monitor and adjust efforts as required. There is a need to better understand the movement patterns of physiotherapists throughout their careers and to continue to monitor the many factors that may influence retention and recruitment. Analysis of the reasons for attrition is required to determine if the departure of an employee is avoidable or unavoidable, desirable or undesirable.30 It must be accepted that a certain portion of physiotherapists ultimately desire to work in private endeavors and that their departure is unavoidable. What is not known is which therapists would leave regardless and which would be retainable under different working conditions. Through the use of the position/vacancy reporting system and data from the College of Physiotherapists of Manitoba a greater understanding of work patterns can be developed. Continued efforts should be directed towards identifying factors that influence workforce entry and retention. As strategies are implemented assessment of their effectiveness must be ongoing.
A better understanding of the nature of the workforce patterns and the factors that motivate maximum participation in the work force will improve personnel supply estimates of the future.
This process should be seen, as a continuous quality improvement process in which there are regular up-to-date estimates, including developments occurring on both the supply and requirement side. This continuous process will allow for further identification of trends in recruitment and retention of the Winnipeg Regional Health Authority's physiotherapy workforce.

Winnipeg Regional Health Authority Allied Health Workforce Analysis
Physiotherapy Workforce Analysis June 2002 41
Bibliography
1. Hack LM, Konrad TR. Determination of supply and requirements in physical therapy: some considerations and examples. Phys Ther 1995 Jan;75(1):47-55.
2. Winnipeg Regional Health Authority, Manitoba Nursing Research Institute, College of Registered Nurse of Manitoba. WRHA RN Required Supply Model, October 200.
3. Markham B, Birch S. Back to the future: a framework for estimating health-care human resource requirements. CJONA 1997 Jan.-Feb.: 7-23.
4. Lavis JN, Birch S. The answer is ….., now what was the question? Applying alternative approaches to estimating nurse requirements. CJONA 1997 Jan.-Feb.: 24-23.
5. Dixon CR. Assessing allied health data needs. J AHIMA 1995 Apr;66(4):44-6.
6. Feil EC, Welch HG, Fisher ES. Why estimates of physician supply and requirements disagree. JAMA 1993 May 26;269(20):2659-63.
7. Selvam A. the state of the health care workforce. Hosp Health Netw 2001 Aug;75(8):41, 43-6.
8. Shih YC. Growth and geographic distribution of selected health profession, 1971-1996. J Allied Health 1999 Summer;28(2):61-70.
9. Selker LG. Human resources in physical therapy: opportunities fro service in a rapidly changing health system. Phys Ther 1995 Jan; 75(1) 31-37.
10. MacKinnon JR, Stark AJ. An approach to estimating future manpower requirements in physical and occupational therapy. Physiother. Can 1984 Nov-Dec;36(6):321-5.
11. Jacoby I. Forecasting requirements for physical therapists. Phys Ther 1995 Jan;75(1):38-44.
12. Canadian Alliance of Physiotherapy Regulators (1999), Occupation Group - Physiotherapist, 1-6. www.alliancept.org/bulletins/index.html.
13. Winnipeg Hospital Authority. Profile of the Allied Health Workforce, September 1999.
14. Canadian Physiotherapy Association, Alliance of Physiotherapy Regulatory Boards. A Vision for Physiotherapy Service Delivery - A Report of the Joint CPA/Alliance Adjustment Service Committee. September 1992.
15. The Association of Physiotherapists of Manitoba. Annual Report, 2001-2002.
16. College of Physiotherapists of Manitoba. Membership database 1996-2001.

Winnipeg Regional Health Authority Allied Health Workforce Analysis
Physiotherapy Workforce Analysis June 2002 42
17. Human Resources Development Canada. Jobs, Workers, Training and Careers. www.hrdc-dmc.gc.ca.
18. Manitoba Branch Canadian Physiotherapy Association. Physiotherapy in Manitoba, August 2000.
19. North T. University of Manitoba School of Medical Rehabilitation 1999-2001 Job Choice Survey Summer Report, August 2001.
20. Loveridge B, Pereira G, McKechnie B, Pruden K. Statistics and Demographics of Physiotherapists and Physiotherapy Practice in Manitoba1978-1996, December 1996.
21. National Physiotherapy Advisory Group, Discussion Paper, Physiotherapy Entry-Level Education in Canada …Issues, Options, and Models, May 2001. www.alliancept.org/bulletins/index.html.
22. Canadian Alliance of Physiotherapy Regulators (1999), Labour Mobility of Physiotherapists, 1-13. www.alliancept.org/bulletins/index.html.
23. Beggs CE, Noh S. Retention factors for physiotherapists in an underserviced area: an experience in northern Ontario. Physiother Can 1991 Apr; 43(2): 15-21.
24. Harkson D, Unterreiner A, Shepard K. Factors related to job turnover in physical therapy. Phys Ther 1982:62:1465-1470.
25. Atwood CA, Woolf DA. Job satisfaction of physical therapists. HCM Review Winter 1982; 81-86.
26. Wolpert R, Yoshida K. Attrition survey of physiotherapists in Ontario. Physiother Can 1992 Spring;44(2):17-24.
27. Daniels LA. Results of a physical therapy manpower survey. 1986 Hosp Top May/June, 28-32.
28. Gwyer J. Personnel resources in physical therapy: an analysis of supply, career patterns, and methods to enhance availability. Phys Ther 1995 Jan;75(1):62-71.
29. Mobley WH, Griffeth RW, hand HH, Meglino BM. Review and conceptual analysis of the employee turnover process. Psychol Bull 1979 Vol 86 No 3. 493-522.
30. Abelson MA. Strategic management of turnover: a model for the health service administrator. 1986 HCMR 11(2), 61-71.
31. Robinson M, Compton J. Decentralized management structures - the physiotherapy experience at John Hunter Hospital. Aust Physio 1996;42(4):317-320.
32. Selby Smith C, Crowley S. Labor force planning issues for allied health in Australia. J Allied Health 1995 Fall: 249-265.
33. The University of Manitoba SMRAA Medical Rehabilitation Alumni Association Newsletter. Spring 2002. News from the Director, page 1.
Winnipeg Regional Health Authority Allied Health Workforce Analysis
Physiotherapy Workforce Analysis June 2002 43
34. 2001/2002 Program Information (02R/02S), School of Medical Rehabilitation, University of Manitoba, Information for Student Loan Purposes.
35. School of Medical Rehabilitation, Physical Therapy Division - Student Placement Data - 1989-1998.
36. Statistics Canada. Perspectives on Labour and Income, Winter 2001. Vol.13, No. 4. www.statcan.ca.
37. Canadian Institute for Health Information (CIHI) Canada's Health Care Providers. Nov.2001. www.cihi.ca
38. In Our Hands - How Hospital Leaders can Build A Thriving Workforce. AHA Commission on Workforce for Hospitals and Health Systems. April 2002.
39. Canadian Alliance of Physiotherapy Regulators (2000), A Scan of the Health Care Environment, 1-5. www.alliancept.org/bulletins/index.html.
40. Shepard D. The collaborative roles of universities and hospitals in addressing the allied health manpower shortages. J Allied Health. 1990;19:287-295.
41. Burda D. Vacancy rates drop for most allied health professions. Mod Healthc 1992 May 4;22(18):16.
42. Buske L. Number of health care workers lags behind population growth. CMAJ 2000 Aug 8;163(3):323.
43. Elwood TW. Overview of allied health personnel shortages. J Allied Health 1991 Winter;20(1):47-62.
44. Morris LV, Palmer HT. Rural and urban differences in employment and vacancies in ten allied health professions. J Allied Health 1994 Summer;23(3):143-53.
45. O'Brien-Pallas L, Baumann A, Donner G, Murphy GT, Lochhaas-Gerlach J, Luba M. Forecasting models for human resources in health care. J Adv Nurs 2001 Jan;33(1):120-9.
46. O'Brien-Pallas L, Baumann A, Donner G, Lochhaas-Gerlach J, Luba M, Lakats L, Amarsi, Y, Malette, C. Health Human Resources: An Analysis of Forecasting Models. Canadian Nurses Association and Health Canada, June 1998.

Winnipeg Regional Health Authority Allied Health Workforce Analysis
Physiotherapy Workforce Analysis June 2002 44
Acknowledgements The cooperation and assistance of the following individuals is gratefully acknowledged.
Dr. J. Cooper, Director, School of Medical Rehabilitation, University of Manitoba Brenda McKechnie, Registrar/Executive Director, College of Physiotherapists of Manitoba Lilah Dufault, Office Manager/Registration Secretary, College of Physiotherapists of Manitoba Mary Lessing-Turner, WRHA Physiotherapy Professional Leader Physiotherapy Management Group Lynda Loucks, President of the Manitoba Branch of the Canadian Physiotherapy Association Peggy Mignaca, WRHA RN Supply Model Jason Marchand, Human Resources, VGH

Winnipeg Regional Health Authority Allied Health Workforce Analysis
Physiotherapy Workforce Analysis June 2002 45
Appendix Appendix 1 Physiotherapy Graduating Class Data Appendix 2 WRHA Position Vacancy Data Appendix 3 Physiotherapists Act

Winnipeg Regional Health Authority Allied Health Workforce Analysis
Physiotherapy Workforce Analysis June 2002 46
Appendix 1 Graduating Class Work Life Data
1997 Graduating Class #32 26 Register 6 No 1997 1998 1999 2000 2001 Urban # % # % # % # % # % Public FT 8 25 12 38 11 34 10 31 10 31 Public PT 7 22 4 13 4 13 3 9 3 9 Private FT 4 13 1 3 3 9 5 16 5 16 Private PT 2 6 3 9 0 0 1 3 2 6 Rural Public FT 1 3 1 3 1 3 1 3 1 3 Public PT 0 0 0 0 0 0 0 0 0 0 Private FT 1 3 1 3 2 6 3 9 1 3 Private PT 3 9 2 6 3 9 1 3 2 6
Not reg/prac. 6 19 8 25 8 25 8 25 8 25 Left province (4) (4) (4) (4) (4)
1998 Graduating Class #28 17 Register 11 No 1997 1998 1999 2000 2001 Urban # % # % # % # % Public FT 9 32 3 11 3 11 3 11 Public PT 3 11 3 11 1 4 1 4 Private FT 1 4 2 7 3 11 4 14 Private PT 2 7 5 18 3 11 2 7 Rural Public FT 1 4 1 4 1 4 1 4 Public PT 0 0 0 0 0 0 0 0 Private FT 0 0 0 0 1 4 1 4 Private PT 1 4 0 0 0 0 0 0 Not reg/prac 11 39 14 50 16 57 16 57 Left province (2) (2) (2) (2)

Winnipeg Regional Health Authority Allied Health Workforce Analysis
Physiotherapy Workforce Analysis June 2002 47
1999 Graduating Class #31 24 Register 7 No 1997 1998 1999 2000 2001 Urban # % # % # % Public FT 12 39 14 45 13 42 Public PT 3 10 0 0 0 0 Private FT 4 13 5 16 5 16 Private PT 4 13 2 6 2 6 Rural Public FT 0 0 0 0 0 0 Public PT 0 0 0 0 0 0 Private FT 1 3 0 0 0 0 Private PT 0 0 1 3 0 0 Not reg/prac 7 23 9 29 11 35 Left province (1) (1) (1)
2000 Graduating Class #29 26 Register 3 No 1997 1998 1999 2000 2001 Urban # % # % Public FT 9 31 8 28 Public PT 3 10 5 18 Private FT 8 28 6 21 Private PT 3 10 5 18 Rural Public FT 1 3 1 3 Public PT 0 0 0 0 Private FT 1 3 1 3 Private PT 1 3 1 3 Not reg/prac 3 10 2 7
2001Graduating Class #27 22 Register 5 No 1997 1998 1999 2000 2001 Urban # % Public FT 10 37 Public PT 3 11 Private FT 5 19 Private PT 1 4 Rural Public FT 1 4 Public PT 0 0 Private FT 2 7 Private PT 0 0 Not reg/prac 5 19 Left province (4)
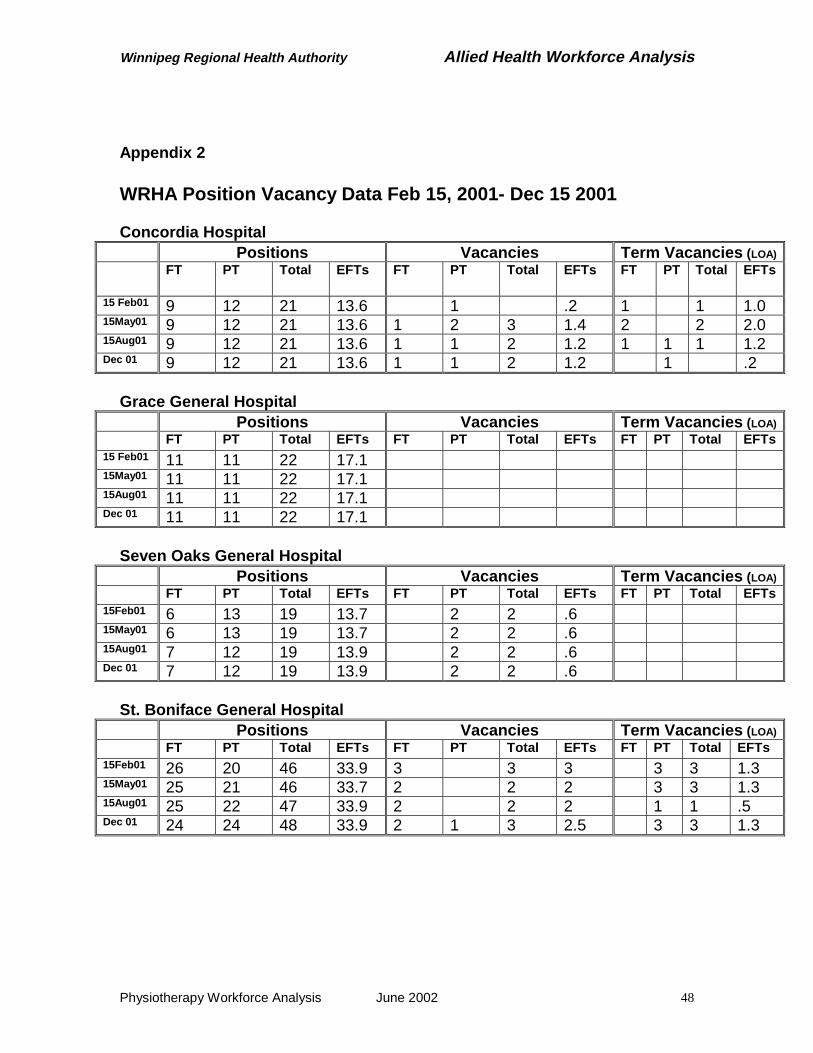
Winnipeg Regional Health Authority Allied Health Workforce Analysis
Physiotherapy Workforce Analysis June 2002 48
Appendix 2 WRHA Position Vacancy Data Feb 15, 2001- Dec 15 2001 Concordia Hospital
Positions Vacancies Term Vacancies (LOA)
FT PT Total EFTs FT PT Total EFTs FT PT
Total EFTs
15 Feb01 9 12 21 13.6 1 .2 1 1 1.0 15May01 9 12 21 13.6 1 2 3 1.4 2 2 2.0 15Aug01 9 12 21 13.6 1 1 2 1.2 1 1 1 1.2 Dec 01 9 12 21 13.6 1 1 2 1.2 1 .2
Grace General Hospital
Positions Vacancies Term Vacancies (LOA)
FT PT Total EFTs FT PT Total EFTs FT PT Total EFTs15 Feb01 11 11 22 17.1 15May01 11 11 22 17.1 15Aug01 11 11 22 17.1 Dec 01 11 11 22 17.1
Seven Oaks General Hospital
Positions Vacancies Term Vacancies (LOA)
FT PT Total EFTs FT PT Total EFTs FT PT Total EFTs15Feb01 6 13 19 13.7 2 2 .6 15May01 6 13 19 13.7 2 2 .6 15Aug01 7 12 19 13.9 2 2 .6 Dec 01 7 12 19 13.9 2 2 .6
St. Boniface General Hospital
Positions Vacancies Term Vacancies (LOA)
FT PT Total EFTs FT PT Total EFTs FT PT Total EFTs 15Feb01 26 20 46 33.9 3 3 3 3 3 1.3 15May01 25 21 46 33.7 2 2 2 3 3 1.3 15Aug01 25 22 47 33.9 2 2 2 1 1 .5 Dec 01 24 24 48 33.9 2 1 3 2.5 3 3 1.3

Winnipeg Regional Health Authority Allied Health Workforce Analysis
Physiotherapy Workforce Analysis June 2002 49
Victoria General Hospital Positions Vacancies Term Vacancies (LOA)
FT PT Total EFTs FT PT Total EFTs FT PT Total EFTs 15Feb01 7 6 13 10.7 15May01 7 6 13 10.7 15Aug01 7 6 13 10.7 1 1 .2 Dec 01 7 6 13 10.7 1 1 .2
Health Sciences Centre - Core Department
Positions Vacancies Term Vacancies (LOA) FT PT Total EFTs FT PT Total EFTs FT PT Total EFTs15 Feb01 3 3 3.0 15May01 3 3 3.0 15Aug01 3 3 3.0 Dec 01 3 3 3.0
Health Sciences Centre - Children's
Positions Vacancies Term Vacancies (LOA) FT PT Total EFTs FT PT Total EFTs FT PT Total EFTs15 Feb01 9 9 18 13.6 1 1 .2 15May01 9 9 18 13.5 1 1 .2 15Aug01 9 9 18 13.5 1 1 .2 1 1 1.0 Dec 01 9 9 18 13.6 1 1 .2 1 1 1.0
Health Sciences Centre - Rehabilitation and Geriatrics
Positions Vacancies Term Vacancies (LOA) FT PT Total EFTs FT PT Total EFTs FT PT Total EFTs15 Feb01 14 7 21 18.0 15May01 14 7 21 18.0 15Aug01 15 5 20 18.0 1 1 1.0 Dec 01 15 6 21 18.0
Health Sciences Centre - Medicine and Surgery
Positions Vacancies Term Vacancies (LOA) FT PT Total EFTs FT PT Total EFTs FT PT Total EFTs15 Feb01 22 13 35 28.3 3 3 .8 15May01 22 11 33 28.3 1 1 2 1.5 1 1 .6 15Aug01 22 11 33 28.3 2 2 2.0 1 1 .6 Dec 01 20 15 35 27.9

Winnipeg Regional Health Authority Allied Health Workforce Analysis
Physiotherapy Workforce Analysis June 2002 50
Health Sciences Centre - Totals
Positions Vacancies Term Vacancies (LOA) FT PT Total EFTs FT PT Total EFTs FT PT Total EFTs15 Feb01 48 29 77 62.9 4 4 1.0 15May01 48 27 75 62.8 1 2 3 1.7 1 1 .6 15Aug01 49 25 74 62.8 3 1 4 3.2 1 1 2 1.6 Dec 01 47 30 77 62.5 0 1 1 .2 1 1 1.0

Winnipeg Regional Health Authority Allied Health Workforce Analysis
Physiotherapy Workforce Analysis June 2002 51
Deer Lodge Centre Positions Vacancies Term Vacancies (LOA)
FT PT Total EFTs FT PT Total EFTs FT PT Total EFTs15 Feb01 9 2 11 10.5 15May01 9 2 11 10.5 1 1 1.0 1 1 1.0 15Aug01 9 2 11 10.5 1 1 1.0 1 1 1.0 Dec 01 9 2 11 10.5 1 1 1.0 1 1 1.0
Misericordia Hospital
Positions Vacancies Term Vacancies (LOA)
FT PT Total EFTs FT PT Total EFTs FT PT Total EFTs15Feb01 2 7 9 5.4 2 2 1.2 15May01 2 6 8 4.6 1 1 .4 15Aug01 2 6 8 4.6 1 1 .4 Dec 01 2 6 8 4.6
Riverview Centre
Positions Vacancies Term Vacancies (LOA)
FT PT Total EFTs FT PT Total EFTs FT PT Total EFTs 15Feb01 6 6 12 9.2 15May01 6 6 12 9.2 15Aug01 7 5 12 8.2 1 1.0 Dec 01 5 7 12 7.2 2 2 1.0 1 1 1.0

Winnipeg Regional Health Authority Allied Health Workforce Analysis
Physiotherapy Workforce Analysis June 2002 52
PCH Facilities Positions Vacancies Term Vacancies (LOA)
FT PT Total EFTs FT PT Total EFTs FT PT Total EFTs15Feb01 5 5 2.45 15May01 5 5 2.45 15Aug01 5 5 2.45 Dec 01 5 5 2.45
CTS
Positions Vacancies Term Vacancies (LOA)
FT PT Total EFTs FT PT Total EFTs FT PT Total EFTs15Feb01 1 9 10 5.6 1 1 2 1.8 15May01 1 9 10 5.6 1 1 2 2 15Aug01 1 9 10 5.6 1 1 2 2 Dec 01 3 6 9 6.4 2 2 1.2 1 1 .5
Health Action Centre
Positions Vacancies Term Vacancies (LOA)
FT PT Total EFTs FT PT Total EFTs FT PT Total EFTs15Feb01 1 0 1 15May01 1 0 1 15Aug01 1 0 1 Dec 01 1 0 1
RCC
Positions Vacancies Term Vacancies (LOA)
FT PT Total EFTs FT PT Total EFTs FT PT Total EFTs15Feb01 2 14 16 10.2 15May01 2 14 16 10.2 15Aug01 2 14 16 10.2 Dec 01 2 14 16 10.2

Winnipeg Regional Health Authority Allied Health Workforce Analysis
Physiotherapy Workforce Analysis June 2002 53
Current Required Physiotherapy Supply December 2001 Positions Vacancies Term Vacancies (LOA)
FT PT Total EFTs FT PT Total EFTs FT PT Total EFTsAcute 105 95 200 151.7 3 6 9 4.9 1 4 5 2.5LTC 16 15 31 22.3 1 2 3 2.0 2 0 2 2.0Other 6 25 31 19.1 0 2 2 1.2 0 1 1 .5Totals 127 135 262 193.1 4 10 14 8.1 3 5 8 5.0
Total Vacant Positions and EFTs December 2001 Vacant Positions Vacant EFT
22 13.1 Percentage Vacancy Rates December 2001
Permanent Term Overall Position EFT Position EFT Position EFT Acute 4.5 3.2 2.5 1.6 7.0 4.8LTC 9.7 9.0 6.5 9.0 16.2 18.0Other 6.5 6.3 3.2 2.6 9.7 8.9Totals 5.3 4.2 3.1 2.6 8.4 6.8

Winnipeg Regional Health Authority Allied Health Workforce Analysis
Physiotherapy Workforce Analysis June 2002 54
Appendix 3 Physiotherapists Act