physiologically motivated image fusion for object detection using a pulse coupled neural network
TRANSCRIPT

554 IEEE TRANSACTIONS ON NEURAL NETWORKS, VOL. 10, NO. 3, MAY 1999
Physiologically Motivated Image Fusion for ObjectDetection using a Pulse Coupled Neural Network
Randy P. Broussard, Steven K. Rogers,Fellow, IEEE, Mark E. Oxley, and Gregory L. Tarr
Abstract—This paper presents the first physiologically moti-vated pulse coupled neural network (PCNN)-based image fusionnetwork for object detection. Primate vision processing princi-ples, such as expectation driven filtering, state dependent modu-lation, temporal synchronization, and multiple processing pathsare applied to create a physiologically motivated image fusionnetwork. PCNN’s are used to fuse the results of several objectdetection techniques to improve object detection accuracy. Imageprocessing techniques (wavelets, morphological, etc.) are used toextract target features and PCNN’s are used to focus attentionby segmenting and fusing the information. The object detectionproperty of the resulting image fusion network is demonstratedon mammograms and Forward Looking Infrared Radar (FLIR)images. The network removed 94% of the false detections withoutremoving any true detections in the FLIR images and removed46% of the false detections while removing only 7% of the truedetections in the mammograms. The model exceeded the accuracyobtained by any individual filtering methods or by logical ANDingthe individual object detection technique results.
Index Terms—Automatics target recognition, breast cancer,CAD, CADx, computer-aided diagnosis, image fusion, neuralnetworks, object detection, pulse coupled network, segmentation,wavelets.
I. INTRODUCTION
DIGITAL image processing is being investigated for objectdetection in applications such as breast cancer detection,
and automatic target recognition [1]–[6]. Image processing isused to reduce unwanted information from an image withthe hope that the improved signal-to-noise ratio will allowa pattern recognition process to detect and possibly identifythe desired object. In general, no single image processingtechnique can be selective to all patterns for a given object, andstill perform well at removing the many possible variations ofunwanted information. Often, several techniques are used andthe results are combined.
To perform this information fusion, primate vision pro-cessing principles are used to design a pulse coupled neu-ral network (PCNN) based image fusion network for thepurpose of improved object detection. Observed biologicalphenomenon such as temporal synchronization and state-
Manuscript received January 28, 1997; revised February 10, 1998.R. P. Broussard is with the Air Force Research Laboratory, Sensors
Directorate, Wright-Patterson AFB, OH 45433-7303 USA.S. K. Rogers is with the Battelle Memorial Institute, Columbus, OH 43201-
2693 USA.M. E. Oxley is with the Department of Mathematics and Statistics, Air
Force Institute of Technology, Wright-Paterson AFB, OH 45433-7765 USA.G. L. Tarr is with the Air Force Research Laboratory, Directed Energy
Directorate, Kirkland AFB, NM 87117 USA.Publisher Item Identifier S 1045-9227(99)03876-X.
dependent modulation are theorized as methods the visionsystem uses to combine the information and focus attentionon an object [7]–[9]. The role these biological phenomenaperform in information fusion and in the image fusion networkis discussed. The PCNN is chosen as an architecture for thefusion network because it performs information linking atthe neuronal pulse level. Through a combination of imagesegmentation, information fusion, and attention focus an objectdetection property emerges from the PCNN fusion network.Last, actual infrared and mammographic images are used todemonstrate the object detection accuracy of the network.
II. A B IOLOGICAL FOUNDATION FOR A FUSION NETWORK
Despite the enormous complexity of the primate corticalvisual system, studies suggest it can be modeled by two basichierarchical pathways, the parvocellular pathway and the mag-nocellular pathway [10]. The former pathway predominantlyprocesses color information, and the later processes form andmotion.
A. A Simplified Model of the Primate Vision System
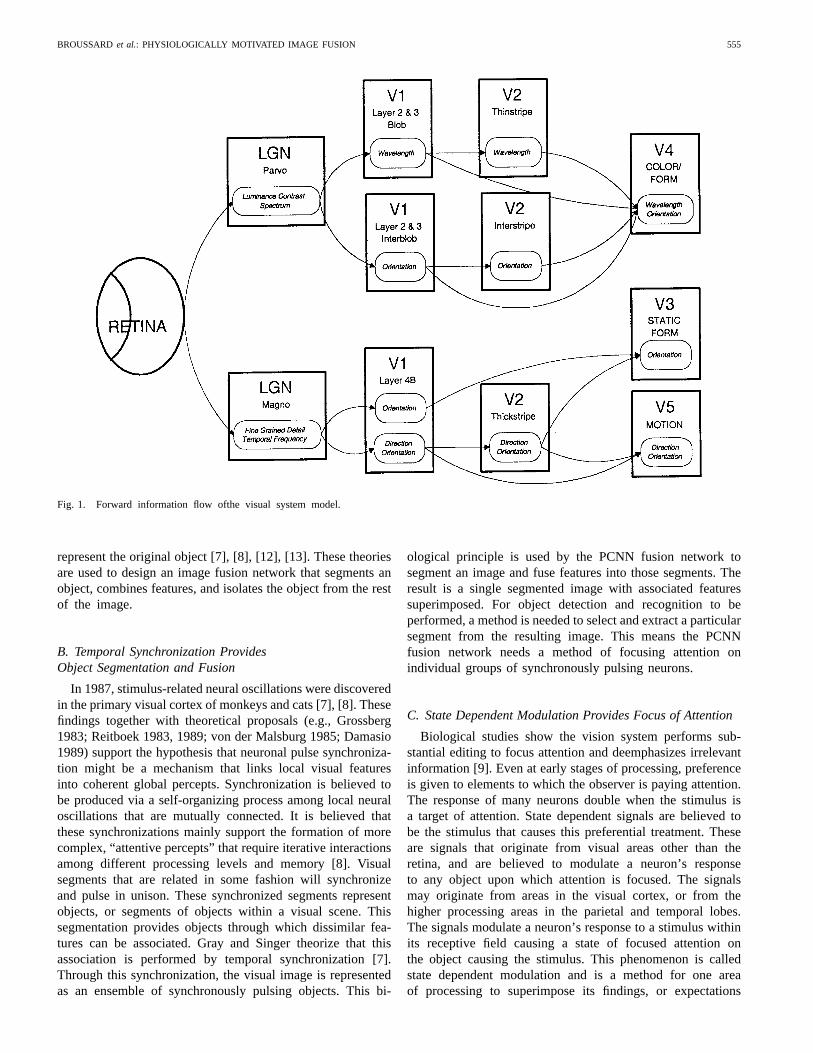
Fig. 1 shows a model of these two pathways. The boxesrefer to areas of the visual cortex which are believed to processdistinct types of visual information [11]. The ovals denote thespecific type of information processed within each area. Thevisual areas are almost fully connected in each direction offlow, but for clarity, only the stronger forward connectionsare shown. The entry point of an image into the model isthe retina. The area marked LGN models the biological lateralgeniculate nucleus. The areas of the model labeled with namesstarting with the letter V model specific areas in the humanvisual cortex. Each of these areas is believed to maintainone or more processed, topographically correct images of thelight pattern that falls upon the retina. Areas V3, V4, and V5are called specialty areas and it is believed that they processonly selective information such as form, color, and motion,respectively.
As can be seen in Fig. 1, the information contained withina visual image is separated into various visual features. Thespecialty areas are of particular interest because they representthe final stages of the visual cortex and the visual features theyproduce are still separate. There is no known single place inthe brain where these features (color, form, and motion) arebrought back together and combined. Many current theoriespropose that the neuronal pulses that transport these featuressynchronize in a way which combines the information to
U.S. government work not protected by U.S. copyright.
BROUSSARDet al.: PHYSIOLOGICALLY MOTIVATED IMAGE FUSION 555
Fig. 1. Forward information flow ofthe visual system model.
represent the original object [7], [8], [12], [13]. These theoriesare used to design an image fusion network that segments anobject, combines features, and isolates the object from the restof the image.
B. Temporal Synchronization ProvidesObject Segmentation and Fusion
In 1987, stimulus-related neural oscillations were discoveredin the primary visual cortex of monkeys and cats [7], [8]. Thesefindings together with theoretical proposals (e.g., Grossberg1983; Reitboek 1983, 1989; von der Malsburg 1985; Damasio1989) support the hypothesis that neuronal pulse synchroniza-tion might be a mechanism that links local visual featuresinto coherent global percepts. Synchronization is believed tobe produced via a self-organizing process among local neuraloscillations that are mutually connected. It is believed thatthese synchronizations mainly support the formation of morecomplex, “attentive percepts” that require iterative interactionsamong different processing levels and memory [8]. Visualsegments that are related in some fashion will synchronizeand pulse in unison. These synchronized segments representobjects, or segments of objects within a visual scene. Thissegmentation provides objects through which dissimilar fea-tures can be associated. Gray and Singer theorize that thisassociation is performed by temporal synchronization [7].Through this synchronization, the visual image is representedas an ensemble of synchronously pulsing objects. This bi-
ological principle is used by the PCNN fusion network tosegment an image and fuse features into those segments. Theresult is a single segmented image with associated featuressuperimposed. For object detection and recognition to beperformed, a method is needed to select and extract a particularsegment from the resulting image. This means the PCNNfusion network needs a method of focusing attention onindividual groups of synchronously pulsing neurons.
C. State Dependent Modulation Provides Focus of Attention
Biological studies show the vision system performs sub-stantial editing to focus attention and deemphasizes irrelevantinformation [9]. Even at early stages of processing, preferenceis given to elements to which the observer is paying attention.The response of many neurons double when the stimulus isa target of attention. State dependent signals are believed tobe the stimulus that causes this preferential treatment. Theseare signals that originate from visual areas other than theretina, and are believed to modulate a neuron’s responseto any object upon which attention is focused. The signalsmay originate from areas in the visual cortex, or from thehigher processing areas in the parietal and temporal lobes.The signals modulate a neuron’s response to a stimulus withinits receptive field causing a state of focused attention onthe object causing the stimulus. This phenomenon is calledstate dependent modulation and is a method for one areaof processing to superimpose its findings, or expectations

556 IEEE TRANSACTIONS ON NEURAL NETWORKS, VOL. 10, NO. 3, MAY 1999
Fig. 2. PCNN fusion architecture used to fuse breast cancer and FLIRimages.
Fig. 3. Feeding and linking connections of a single PCNN neuron.
on another area [9]. The modulatory effect of state depen-dent modulations are believed to focus attention by elevatingthe perception of objects of interest effectively suppressingunneeded information in a visual scene. The PCNN fusionnetwork uses this biological principle to focus attention onobjects that best fit the criteria of a desired object. By usingthe relative presence of a desired feature as a state dependentmodulation signal, the networks response to the desired objectis elevated. This elevated response facilitates detecting andisolating of a particular object in a visual scene.
III. A PCNN IMAGE FUSION
NETWORK FOR OBJECT DETECTION
A. The PCNN Fusion Network
To perform object detection, the PCNN fusion network takesan original and several filtered versions of a gray-scaled imageand outputs a single image in which the desired objects arethe brightest and thus easily detected. Fig. 2 shows the PCNNfusion network which is the connection architecture used tofuse the original and filtered images. Each PCNN has oneneuron per input image pixel. The pulse rate of each neuron inthe center PCNN is used as a brightness value for the pixels inthe output image. The neurons within the PCNN are arrangedas a single two dimensional layer network with lateral linking.Fig. 3 shows the feeding and linking connections of a single
TABLE IFILTERS THAT CAN APPROXIMATE FUNCTIONS PERFORMED IN THEVISION MODEL
neuron within the PCNN. Every neuron receives linking inputsfrom all neighboring neurons within a radius of three (radiusof one is shown in Fig. 3 for clarity). Each neuron receivesfeeding inputs which are the intensity of the correspondingpixels in the input image. The pulse based linking mechanismsof the PCNN use temporal synchronization to segment theoriginal image. The outer PCNN’s provide state dependentmodulation signals used to focus attention on segments ofinterest.
Fig. 4 shows the inputs and output of the fusion processwhen used on a small portion of a mammogram which containsmicrocalcifications. The pulse rate of each output neuronis used as a brightness value for the pixels in the outputimage. Fig. 4(a)–4(c) is the images used as input to the fusionnetwork. The fusion results are shown in Fig. 4(d). A thresholdhas been applied to remove the background and lower intensitysegments. The segments that remain are the desired objects.
B. Using Image Processing Filters to Extract Features
To simulate biological information fusion, we need to simu-late the output information of the specialty areas (V3, V4, andV5) and then fuse the information. To simulate the performedfeature extraction, we will observe the hypothesis that neuronalprocessing units are best described as filters that are selectivealong multiple stimulus directions [14]. Information extractedby filters is used as features in the PCNN fusion network.Table I gives a list of possible filters that can be used toapproximate each visual area of the static form pathway.Included in the table are the references that cite these filters.
Since all images used in this paper (mammogram andFLIR) are static and gray scaled, only the static form pathwayis included in this table. Wavelet, morphological (hit-and-miss), and difference-of-Gaussian (DoG) filters are chosen toprovide features because they have been used successfully todetect breast cancer in mammograms [19]–[21] and in FLIRimages [6]. These filters are used to separate visual informationinto various size and wavelength components. The filteredcomponents serve as individual features which will be fused bythe PCNN fusion network into a single image which combinesyet exploits the selectivity of each individual filter.
When applied to the mammograms, the filters are tunedto be selective to microcalcifications which can be an earlyindication of cancerous growth [2]. For the FLIR images, thefilters are tuned for selectivity to features of a mobile SCUDmissile launcher. Since these filters are selective to a particularobject, the outputs can be used as state dependent modulation

BROUSSARDet al.: PHYSIOLOGICALLY MOTIVATED IMAGE FUSION 557
(a) (b)
(c) (d)
Fig. 4. 128-by-128 pixel region containing microcalcifications (segmented from a 1000-by-2000 pixel mammogram). (a) Original image. (b) hit-and-missfiltered image. (c) wavelet filtered image. (d) PCNN fused image after a threshold has been applied.
Fig. 5. The Eckhorn model neuron in a PCNN.

558 IEEE TRANSACTIONS ON NEURAL NETWORKS, VOL. 10, NO. 3, MAY 1999
Fig. 6. PCNN segmentation (output pulse periods produced by a PCNN with a linear zero to one input).
signals where the current state of attention is focused ondetecting objects that resemble the target object.
C. The Pulse Coupled Neural Network
The heart of the fusion network is the PCNN. The PCNNis a physiologically motivated artificial neural network thatis composed of artificial spiking neurons which are intercon-nected via multiplicative links. The PCNN uses the Eckhornmodel spiking neuron [8] which is shown in block diagramform in Fig. 5. The neuron models the pulse height, duration,repetition rate, and modulatory interneural linking observedin biological dendrites. This neuron model is chosen becauseit contains the modulatory pulse-based linking necessary tosimulate the temporal synchronization and state dependentmodulation observed in the primate visual cortex. The mostnotable aspects of the neuron are the dendritic branch andthe pulse generator sections. The dendritic branch containsfeeding inputs which are modulated by linking inputs. Eachinput contains a leaky integrator which models a dendriticsynapse. The leaky integrator converts incoming pulses into apersistent signal. The time constant (or ) of the leakyintegrator models the decay rate of neurotransmitters withinthe synapse. The pulse generator section is an oscillator thatproduces an output pulse train of very short duration pulseswhose frequency is based on input magnitude. The pulsegenerator time constant models the refractory period thatoccurs after a biological dendrite fires. For detailed discussionof the inner workings of the PCNN see Eckhorn [8] andJohnson [22]–[24].
As used in this model, a PCNN neuron receives feedinginputs from a gray-scaled image and receives linkinginputs from neighboring neurons, and neurons in otherPCNN’s (Fig. 3).
1) Pulse Coupling Performs Temporal Synchronization:Pulse based synchronization is the key characteristic thatdistinguishes the PCNN from other types of neural networks.The image segmentation property of the PCNN comes fromthis synchronization. Neurons with similar inputs pulse insynchrony to represent a segment of the input image. Neuronswith related feeding input characteristics (color, intensity,etc.) have similar pulsing rates. The linking connections causeneurons, in close proximity and with related characteristics,to pulse in unison (synchronization). The PCNN links pixelsbased on similarity. This similarity is defined by an imagepixel’s intensity value relative to the intensity values of theneighboring pixels within its linking radius. A pixel is similarto any pixel that is within its linking radius and has an intensityvalue within greater than its own, where is the totalfeeding input value to the neuron, is the total linking inputvalue, and is the value of the linking strength betweenneurons. Shown in equation form, a pixel with an intensity of
is similar to a pixel with intensity of if
(1)
Because of the multiplicative linking connections, this relationis not as simple and straight forward as it first appears. Thefollowing discussion will make some simplifying assumptionsto demonstrate the complexity of determining which neuronsare similar.
The pulse period of a digitally simulated neuron withconstant linking inputs is defined by the equation
(2)
where the neuron’s internal activity is defined asand denotes the ceiling function. Without any
linking inputs , bandwidth limitations of the neuron

BROUSSARDet al.: PHYSIOLOGICALLY MOTIVATED IMAGE FUSION 559
would cause input values between zero and one to fire innonoverlapping logarithmic sized groups as shown in Fig. 6(much higher values of are typically used). Notice that if
, is equal to the total feeding inputs. The scaleof the output pulse period axis is time units where one unitis the maximum pulse firing rate the neuron bandwidth willsupport. For a digital implementation, each unit would be onetime-step on the simulation clock. The values ofthat pulseeach time slice (without linking present) are shown by thebold lines. The set is defined to be the values of thatpulse at time when no linking is present. Adding a constantlinking input to a neuron extends the lower limit of by
(shown as the thin line in Fig. 6). The set of realnumbers that are added to due to linking is defined to bethe synchronization range of a PCNN neuron
(3)
This synchronization range defines the similarity in pixelintensity which will cause neurons to synchronize and forma segment. A neuron that would not normally fire at timewill fire in synchrony with other neurons that fire at timeif
(4)
This criteria must be met for a neuron to synchronize withother neurons pulsing at a particular pulse frequency .
Notice in Fig. 6 the total pulse range for eachtime overlaps the total pulse range for time . This meansa neuron with internal activity value in the overlappingregion can fire at either timeor depending on linkinginputs. So will a particular neuron fire at time or ?Expanding the earlier constant linking input signal assumptionto state linking inputs originate as the constant outputs ofneighboring neurons as shown in Fig. 3, makesa functionof the feeding and linking inputs of neighboring neuron’s.Since the value of originates as the output of neighboringneurons and the synchronization rangeis a function of
, (3) implies segmentation is image content dependent. Fortwo adjacent neurons that are linked, the output of eachneuron is dependent upon the output of the other. Sincelinked neurons are dependent upon one another, finding theoutput pulse period of a particular neuron requires solvingsimultaneous equations. For example, the output period ofneurons connected in a 3 3 array is described by thefollowing matrix (assuming ) shown at the bottom ofthe page. Since the value of eachis dependent on the outputperiod of neighboring neurons, finding the output of any singleneuron requires solving the nine equalities simultaneously.In essence, this is what the PCNN does. The assumption ofa constant linking input simplifies the problem significantly.Since the PCNN is based on a spiking neuron, all linkingsignals are pulses which means linking inputs are not constant.
The actual operation of the PCNN is more complex than thissimplified example, but the functional concept is the same.
The actual PCNN solves the interneuron dependencies ina unique way. No linking signals are present until the firstneuron fires. The brightest points within an image causetheir corresponding neurons to fire first. This firing initiatesa linking signal (linking wave) which travels through themultiplicative linking interconnects causing other neurons withsimilar inputs to fire [22]. Since linking fields overlap, pixelgrouping occurs beyond the limits of a neuron’s linking radius.A single neuron can fire and cause a domino effect thatcontinues until all neurons with similar inputs fire in phasesynchrony with the first neuron. This group of synchronouslyfiring neurons represents a distinct segment within the image.The segmentation process repeats each time step, on neuronsthat have not fired, until all neurons within the PCNN havefired and the image is completely segmented.
2) Pulse-Based Multiplicative Linking Performs State De-pendent Modulation:As shown in the Fig. 5, the total inputto a PCNN neuron can be describe by the multiplicativeequation
(5)
where is the value of total linking inputs from sourcesexternal to the PCNN (possibly other PCNN’s). The signalfeeds directly into the pulse generator section of the PCNNwhich produces the output pulse train. The output frequencyof pulses produced by the pulse generator is
(6)
which is the reciprocal of the output period shown in (2).From (5) it can be seen that the linking inputs of the PCNNmodulate the feeding inputs. This modulatory property of thePCNN can be used to simulate the state dependent modulationobserved in the visual system. Without linking inputs,wouldequal and the feeding input would drive the pulse generatorsection. A positive linking input would increase thevalue of which would increase the frequency of the outputpulse train (2). If filter outputs that are selective to featuresof a desired target are used as linking inputs, then neuronsconnected to image areas that resemble the desired targetwould have greater linking inputs than those that do not. Thefilter outputs represent the state dependent modulation signalswhen the current state of the PCNN is a focus of attention onthe desired target. The neurons whose inputs most match thedesired target would have the greatest modulatory input, thushaving the highest frequency output. This increased outputeffectively separates the neurons from the rest of the image.
For the PCNN fusion network, this modulatory mecha-nism provides a method of associating filtered features withsegments in the original image. It also provides a focus of

560 IEEE TRANSACTIONS ON NEURAL NETWORKS, VOL. 10, NO. 3, MAY 1999
attention to isolate the segment. Segments with a greaternumber of desired features present will be more active thanother segments, therefore the most active segments are thosethat fulfill more of the target criteria. These segments are easilyseparable from the rest of the image.
D. How Information Is Fused
The cornerstone of the PCNN fusion network is the segmen-tation performed by the pulse synchronizations. This temporalsynchronization groups the image pixels into individual, dis-joint segmented regions (objects) that pulse in different timesteps. These individual regions represent either the desiredtarget(s) (cancer or SCUD), or other objects such as thebackground. The fusion process exploits the fact that anobject of interest is represented as a group of pixels. Thisallows dissimilar and possibly spatially disjoint features suchas brightness, edges, and gradients to be mapped into asingle region of space that represents the object. This allowsfusion of several dissimilar features of an object into a singlerepresentation of an object that contains more information thanany individual feature, or subgroup of features. In a search fora specific object, size alone may remove many segments fromconsideration.
In the PCNN fusion network, the original image is used asa basis for object segmentation, and the filtered versions of theoriginal image are used as the dissimilar features. The filtersare selective to particular features of the desired object, thusthe filtered images represent selective image information witha focus of attention on the desired object. The outer PCNN’s(Fig. 2) convert the filtered images into pulsed signals for useas state dependent modulation signals. These pulsed signals arelinked to the original image using the center PCNN’s linkinginputs. These signals both fuse features into its associatedsegment, and modulate the center PCNN’s neuronal responseto the object of interest. The modulation signal increasesthe pulsing frequency of the synchronous group of neuronseffectively separating the desired object from the background.The segments of the original image that best fulfill the selectivecriteria of the filters will be represented by the fastest pulsinggroups of output neurons. An output image is created by usingthe output neuron pulse frequencies as pixel intensity values.Only simple thresholding of the fused output image is neededto extract the group of pixels that contain the desired objects.
E. The PCNN Produces a Time Signal as an Added Benefit
With many image fusion/object detection techniques avail-able, why use a method based on a PCNN? The PCNNprovides an additional benefit which is unique. The pulsedoutput of the PCNN forms a time signal that can be used asa translation, rotation, scale, distortion, and intensity invariantsignature for each object in the image [23], [24]. This signalcan be used for identification purposes on any object detectedby the PCNN fusion network. The time signal is inherentlyproduced during PCNN operation and thus requires no ad-ditional processing. The time signal was not utilized in thisproject, but could have been. The next stage of this researchwill use the signature property of the time signal to increaseobject detection accuracy.
TABLE IIMOBILE SCUD LAUNCHER DETECTION
RESULTS USING THE PCNN FUSION NETWORK
IV. DETECTION RESULTS ON CANCER AND RADAR IMAGES
One hundred FLIR images, from aircraft training runs, wereused to calibrate and test the object detection capability of thePCNN fusion network. Fifty images were used to calibrate thePCNN weights, linking radius, and threshold parameters.Each image contained a single SCUD mobile missile launcher,a truck, a van, and four surrounding flash pods to mark thetarget location. The flash pods function as a guide for thephotographer and are not used by the detection algorithms.After PCNN calibration, the object detection capability of thefusion network was tested on the remaining 50 FLIR images.The goal of the test was to detect the SCUD launcher whileminimizing the number of false alarms. Since only one targetis present, and the output of the PCNN fusion network canbe processed by a pattern recognition engine for additionalidentification, a large false alarm rate is preferable to a missedtarget. For this reason, all filters were tuned conservativelyto ensure SCUD detection. Any detected object other thanthe SCUD, truck, van, pods, and image edge effects wereconsidered false targets. Detection of the truck, van, and flashpods was considered optional.
Table II presents the detection accuracy achieved by eachmethod (only 12 representative images shown). Fig. 7 showsan example binary (thresholded) image used as input and theresulting output of the PCNN fusion network. For every imageinside the desired target detection range (ranges of interestfrom a munitions release perspective), the selective filters andthe PCNN fusion network detected the SCUD mobile missilelauncher. As can be seen in Fig. 7(a) and 7(b), conservativetuning can cause the selective filter routines to produce a largenumber of false alarms. The Hit/Miss filter algorithm averaged8.2 false targets per image, the DoG filter algorithm averaged20.3 false targets per image, and PCNN network averaged0.6 false alarms per image. When compared to the best filteraccuracy, the PCNN network removed 94% of the false alarmswithout removing any true detections. The accuracy producedby the PCNN network also exceeds the accuracy produced byANDing the binary filter outputs.
In the second test, the algorithms were used to detect mi-crocalcifications in mammograms. Microcalcification density

BROUSSARDet al.: PHYSIOLOGICALLY MOTIVATED IMAGE FUSION 561
(a) (b)
(c) (d)
Fig. 7. Input and output images of a mobile SCUD launcher and flash pods. (a) Original FLIR Image. (b) DoG filtered image. (c) Morphological (Hit/miss)filtered image. (d) PCNN fusion network output image.
is often used by computer aided diagnosis (CADx) systemsfor early detection of cancerous breast regions [1]. Microcal-cifications are present in healthy tissue, but a high density(5 per square centimeter) can be an early indication ofcancer. In this test, the selective filters were tuned to detectradiologist identified microcalcifications. The goal of the testwas to maximize the detection of identified microcalcificationswhile minimizing the number of other detections. All detectedobjects that did not represent an identified microcalcificationwere considered false targets. The identified microcalcifica-tions were visually detectable, but others may exist. Since thistest does not attempt to detect all microcalcifications, but onlyones identified by radiologist, the resulting accuracy shouldnot be directly compared to other cancer detection algorithms.The purpose of the test is to demonstrate information fusionby a PCNN.
Thirty 256 256 pixel regions segmented from full breastmammograms were used to test microcalcification detection.Eighteen of the regions were used to calibrate the PCNNnetwork and the filter algorithms, and the remaining 12 were
TABLE IIIDETECTION RESULTS OF MICROCALCIFICATIONS IN
MAMMOGRAMS USING THE PCNN FUSION NETWORK
used to test the detection accuracy. Table III presents the de-tection accuracy achieved by each algorithm. Since the PCNNnetwork fuses the results of the selective filters, no additional
562 IEEE TRANSACTIONS ON NEURAL NETWORKS, VOL. 10, NO. 3, MAY 1999
true detections were expected or achieved. The results do showthat the number of false detections were significantly reducedwith only a small reduction in true detections. The Hit/Missalgorithm averaged 1.3 false detections for each true detectionand the DoG algorithm averaged 1.7 false detections per trueone. The PCNN network reduced these ratios to 0.8 falsedetections per true detection. When compared to the best filterresult, the PCNN network removed 46 percent of the falsedetections while removing only 7% of the true detections.
V. CONCLUSION
The fusion network provided a greater accuracy increaseon the FLIR images than on the mammogram images. Thenetwork reduced the false alarm rate from 8.2 to 0.6 falsealarms per image in the FLIR images and from 1.7 to 0.8false detections per true detections in the mammograms. Inthe fusion process, the PCNN network does not add truedetections to the output, but instead removes false detections.Since the FLIR images contained many objects such as treesand roads that were larger than the target, the PCNN couldeasily segment and remove the large objects. Because themammograms contained few large objects with consistentbrightness and boundaries, the PCNN segmented the imageinto many small objects which prevented any significantobject removal based on size. The majority of the informationremoval was performed by the state dependent modulation.These results imply the PCNN fusion network is better suitedfor processing images which contain structures that differ insize from the targets. The PCNN was able to map manyfalse detections, such as road and forest edges, into the largeroriginal object and subsequently remove the false detections.The tests have shown the network is suitable for removingfalse detections from conservatively tuned filter outputs whilepreserving a majority of the true detections. The networkremoved 94% of the false detections without removing anytrue detections in the FLIR images and removed 46% of thefalse detections while removing only 7% of the true detectionsin the mammograms.
In general, the PCNN fusion network provides a methodof improving object detection accuracy by fusing the outputsof multiple object detection algorithms. The accuracy of thefusion network surpassed the accuracy provided by the resultsof any single filtered output, or the logical AND of allfilter results. The network inputs pixel-based information andproduces an object-based output with a time signal that canbe used as an identification signature for each object. Thebrightness values of the objects in the output image representthe degree to which each object matches the characteristics ofthe desired object. The PCNN also provides a good computerarchitecture for implementing physiologically-based fusionand other pulse-based physiologically observed phenomenon.
REFERENCES
[1] M. L. Giger, “Computer-aided diagnosis,”RSNA Categorical CoursePhysics, pp. 283–298, 1993.
[2] R. M. Nishikawa, M. L. Giger, K. Doi, C. Mete, F. Yin, C. Vyborny,and R. Schmidt, “Computer-aided detection and diagnosis of masses
and clustered microcalcification from digital mammograms,”SPIE, vol.1905, pp. 422–432, 1994.
[3] R. N. Strickland and H. I. Hahn, “Wavelet transforms for detectingmicrocalcifications in mammograms,”IEEE Trans. Med. Imag., vol. 15,pp. 218–229, 1995.
[4] A. Laine and S. Schuler, “Hexagonal wavelet processing of digitalmammography,”SPIE Image Processing, vol. 1898, 1993.
[5] A. Laine, S. Schuler, J. Fan, and W. Huda, “Mammographic featureenhancement by multiscale analysis,”IEEE Trans. Med. Imag., vol. 13,Dec. 1994.
[6] S. K. Rogers, J. M. Colombi, C. E. Martin, J. C. Gainey, K. H. Fielding,T. J. Burns, D. W. Ruck, M. Kabrisky, and M. Oxley, “Neural networksfor automatic target recognition,”IEEE Trans. Neural Networks, vol. 8,pp. 1153–1184, 1995.
[7] C. M. Gray, P. Konig, A. K. Engel, and W. Singer, “Oscillatory re-sponses in cat visual cortex exhibit intercolumnar synchronization whichreflects global stimulus properties,”Nature, vol. 338, pp. 334–337, Mar.1989.
[8] R. Eckhorn, H. J. Reitboeck, M. Arndt, and P. Dicke, “Feature linkingvia synchronization among distributed assemblies: Simulations of resultsfrom cat visual cortex,”Neural Comput., vol. 2, pp. 293–307, 1990.
[9] J. H. R. Maunsell, “The brain’s visual world: Representation of visualtargets in cerebral cortex,”Science, vol. 270, pp. 764–768, 1995.
[10] M. P. Young, “The large scale organization of the primate cortical visualsystem,”SPIE, vol. 2054, pp. 185–193, 1994.
[11] S. Zeki,A Vision of the Brain. Oxford, U.K.: Blackwell, 1993.[12] H. Neven and A. Aertsen, “Rate coherence and event coherence in the
visual cortex: A neuronal model of object recognition,”Biol. Cybern.,vol. 67, pp. 309–322, 1992.
[13] M. T. Wallace, M. A. Meredith, and B. E. Stein, “Integration of multiplesensory modalities in cat cortex,”Experimental Brain Res., vol. 91, no.3, pp. 484–488, 1992.
[14] D. C. Van Essen, C. H. Anderson, and D. J. Felleman, “Information pro-cessing in the primate visual system: An integrated systems perspective,”Science, vol. 255, pp. 419–422, 1992.
[15] S. Grossberg,Neural Networks and Natural Intelligence, Massachusetts:MIT Press, Cambridge, 1988.
[16] S. Grossberg and E. Mingolia, “Neural dynamics of perceptual group-ing: Textures, boundaries and emergent segmentation’s,”PerceptionPsychophys., vol. 38, no. 2, pp. 141–171, 1985.
[17] G. A. Carpenter, S. Grossberg, and C. Mehanian, “Invariant recognitionof cluttered scenes by a self-organizing art architecture: Cort-x boundarysegmentation,”Neural Networks, vol. 2, pp. 169–181, 1989.
[18] M. R. Turner, “Texture discrimination by gabor functions,”Biol. Cy-bern., vol. 55, pp. 71–82, 1986.
[19] R. Dauk, S. Rogers, J. Hoffmeister, D. Ruck, and R. Raines, “Acomparative study of texture measures for the classification of breasttissue,” AFIT Tech. Rep., Jan. 1996.
[20] D. McCandless, S. Rogers, J. Hoffmeister, D. Ruck, and R. Raines,“Model based detection of clustered microcalcifications using waveletsand phantom derived images,”IEEE Trans. Med. Imag., 1996.
[21] W. Polakowski, S. Rogers, D. Ruck, J. Hoffmeister, and R. Raines,“Computer aided breast cancer detection and diagnosis of masses usingdifference of gaussians and derivative-based feature saliency,”IEEETrans. Med. Imag., vol. 16, pp. 811–819, 1997.
[22] J. L. Johnson, “Pulse coupled neural networks,” inProc. SPIE Int. Symp.Opt. Eng. Photonics Aerospace Sensing, Conf. Adaptive Comput.: Math.,Electron. Opt. (Critical Reviews), Orlando, FL, 1994.
[23] J. L. Johnson, “Pulse-coupled neural nets: Translation, rotation, scale,distortion, and intensity signal invariance for images,”Appl. Opt., vol.33, no. 26, pp. 6239–6253, 1994.
[24] J. L. Johnson, “Time signatures of images,” inProc. IEEE Int. Conf.Neural Networks, Orlando, FL., 1994.
Randy P. Broussard, Major, USAF, received the B.S. degree in electricalengineering from Tulane University, New Orleans, LA, in 1986, and theM.S. degree in computer engineering from Florida Institute of Technology,Melbourne, in 1991, and the Ph.D. degree in electrical engineering from theAir Force Institute of Technology, Wright-Patterson Air Force Base, OH, in1997.
He presently works in the Air Force Research Laboratory, Sensors direc-torate, Reconnaissance, Strike, and Combat ID branch. His research interestsare neural networks, computer vision, and pattern recognition.

BROUSSARDet al.: PHYSIOLOGICALLY MOTIVATED IMAGE FUSION 563
Steven K. Rogers(S’76–M’78–SM’95’F’98) received the B.S. degree inelectrical engineering/computer science from the University of Colorado,Boulder, the M.S. degree in electrical engineering from the Air Force Instituteof Technology, Wright-Patterson Air Force Base, OH, and the Ph.D. degreein electrical engineering from the University of Colorado.
He is a Professor of Electrical Engineering in the Department of Electricaland Computer Engineering, Air Force Institute of Technology. He is presentlyconducting an extensive research program on neural networks and patternrecognition. The research program addresses the problems inherent in makingsmart weapons. He has published more than 200 papers in the areas of neuralnetworks, pattern recognition, and optical information processing and severaltextbooks includingIntroduction to Biological and Artificial Neural Networksfor Pattern Recognition.
Dr. Rogers is an SPIE Fellow.
Mark E. Oxley received the B.S. degree in mathematics in 1978 from Cum-berland College, Williamsburg, KY, the M.S. degree in applied mathematicsin 1980 from Purdue University, West Lafayette, IN, and the Ph.D. degree inmathematics in 1987 from North Carolina State University, Raleigh.
He is an Associate Professor of Mathematics in the Department of Mathe-matics and Statistics at the Air Force Institute of Technology, Wright-PattersonAir Force Base, OH. His current research interests include neural networks,wavelet analysis, functional analysis, and nonlinear partial differential equa-tions.
Dr. Oxley is a member of Pi Mu Epsilon, the American MathematicalSociety (AMS), the Society for Industrial and Applied Mathematics (SIAM),the American Geophysical Union (AGU), and SPIE the International Societyfor Optical Engineering.
Gergory L. Tarr , photograph and biography not available at the time ofpublication.