physics/revision/1. section a... · web viewinvestigation of the relationship between periodic time...
TRANSCRIPT
Section A Study Guide plus all exam questions and solutions
This has a lot of pages so please remember to photocopy 4 pages onto one sheet by going A3→A4 and using back-to-back on the photocopier.
This booklet contains every Section A exam question that has appeared on a Leaving Cert paper between 2014 and 2002, at both higher and ordinary level.
Quick CheckFor each experiment check that you can do can do each of the following:(i) Draw a fully labelled diagram which includes all essential apparatus (have you included
the apparatus necessary to obtain values for both variables?)(ii)Be able to state how the two sets of values were obtained (this is a very common
question)(iii) Describe what needs to be adjusted to give a new set of data(iv) Write down the relevant equation if there is one associated with the experiment(v)Be able to state how the data in the table will need to be adjusted.(vi) Be able to list three sources of error/precautions
If the experiment involves a graph(vii) Know how the data provided will need to be adjusted(viii) Know what goes on each axis(ix) Know how to use the slope of the graph to obtain the desired answer
Note that all documents can be found in the revision page of www.thephysicsteacher.ie
1
Contents PageList of all experiments 2Section A exam technique 3Drawing the graph 4What goes on what axis 5Summary of the graphs 6Experiment questions by year 7Section A popular theory questions 8Past paper questions and solutions 13

Experiment Page
1. Measurement of the focal length of a concave mirror2. Snell’s law of refraction3. Measurement of the focal length of a convex lens4. Measurement of velocity and acceleration5. Measurement of acceleration due to gravity (g) using the freefall method6. To show that acceleration is proportional to the force which caused it (F = ma)7. To verify the principle of conservation of momentum8. Verification of Boyle’s Law 9. Investigation of the laws of equilibrium for a set of co-planar forces10. Investigation of the relationship between periodic time and length for a simple
pendulum and hence calculation of g.11. To calibrate a thermometer using the laboratory mercury thermometer as a
standard12. Measurement of the specific heat capacity of water13. Measurement of the specific latent heat of fusion of ice14. Measurement of the specific latent heat of vaporisation of water15. To measure the speed of sound in air16. Investigation of the variation of fundamental frequency of a stretched string
with length17. Investigation of the variation of fundamental frequency of a stretched string
with tension18. Measurement of the wavelength of monochromatic light19. To measure the resistivity of the material of a wire20. To investigate the variation of the resistance of a metallic conductor with
temperature21. To investigate the variation of the resistance of a thermistor with temperature22. To investigate the variation of current (I) with potential difference (V) for a thin
metallic conductor23. To investigate the variation of current (I) with potential difference (V) for a
filament bulb 24. To investigate the variation of current (I) with potential difference (V) for
copper electrodes in a copper-sulphate solution25. To investigate the variation of current (I) with potential difference (V) for a
semiconductor diode26. To verify Joule’s Law
2

SECTION A EXAM TECHNIQUEYou must know all mandatory experiments inside out
You will be given a set of results and will be asked to do some of the following:1. Draw a labelled diagram.2. Explain how the values were obtained.3. To calculate some quantity (e.g. Specific Heat Capacity) or to verify a Law (e.g. Conservation of
Momentum, Snell’s Law etc).4. Some shorter questions on sources of error, precautions etc in relation to the performance of the
experiment.5. At least one of the questions will require a graph to be drawn. In such cases the slope of the graph will
usually have to be calculated. The significance of the slope of the graph is determined by comparing it to a relevant formula (which links the two variables on the graph).
NoteThe data given will frequently have to be modified in some way (e.g. you may need to square one set of values or find the reciprocal etc) before the graph is drawn. This modification is determined by comparing it to the relevant formula which links the two variables.
When revising Section A make sure that you can do each of the following for every experiment: Draw a labelled diagram of the experimental set-up, including all essential apparatus.
The first step in the procedures should then read “we set up the apparatus as shown in the diagram”. Describe how to obtain values for both sets of variables Describe what needs to be adjusted to give a new set of data Say what goes on the graph, and which variable goes on which axis Know how to use the slope of the graph to obtain the desired answer (see below). List two or three precautions; if you are asked for two precautions, give three - if one is incorrect it will
simply be ignored. List two or three sources of error.
Misc Points The graph question is usually well worth doing. Learn the following line off by heart as the most common source of error: “parallax error associated with
using a metre stick to measure length / using a voltmeter to measure volts etc”. Make sure you understand the concept of percentage error; it’s the reason we try to ensure that what
we’re measuring is as large as possible. There is a subtle difference between a precaution and a source of error – know the distinction. When asked for a precaution, do not suggest something which would result in giving no result, e.g.
“Make sure the power-supply is turned on” (a precaution is something which could throw out the results rather than something which negates the whole experiment).
To verify Joule's Law does not involve a Joulemeter To verify the Conservation of Momentum – the second trolley must be at rest. To verify the laws of equilibrium - the phrase ‘spring balance’ is not acceptable for ‘newton-metre’. To measure the Focal length of a Concave Mirror or a Convex Lens:
Note that when given the data for various values of u and v, you must calculate a value for f in each case, and only then find an average. (As opposed to averaging the u’s and the v’s and then just using the formula once to calculate f). Apparently the relevant phrase is “an average of an average is not an average”.
3

DRAWING THE GRAPH
You must use graph paper and fill at least THREE QUARTERS OF THE PAGE.
Use a scale which is easy to work with i.e. the major grid lines should correspond to natural divisions of the overall range.
LABEL THE AXES with the quantity being plotted, including their units.
Use a sharp pencil and mark each point with a dot, surrounded by a small circle (to indicate that the point is a data point as opposed to a smudge on the page.
Generally all the points will not be in perfect line – this is okay and does not mean that you should cheat by putting them all on the line. Examiners will be looking to see if you can draw a best-fit line – you can usually make life easier for yourself by putting one end at the origin. The idea of the best-fit line is to imagine that there is a perfect relationship between the variables which should theoretically give a perfect straight line. Your job is to guess where this line would be based on the available points you have plotted.
Buy a TRANSPARENT RULER to enable you to see the points underneath the ruler when drawing the best-fit line. Make that a LONG transparent ruler. See next point.
BE VERY CAREFUL drawing a line if your ruler is too short to allow it all to be drawn at once.Nothing shouts INCOMPETENCE more than two lines which don’t quite match.
DO NOT JOIN THE DOTS if a straight line graph is what is expected. Make sure that you know in advance which graphs will be curves.
Note that examiners are obliged to check that each pint is correctly plotted, and you will lose marks if more than or two points are even slightly off.
When calculating the slope choose two points that are far apart; usually the origin is a handy point to pick (but only if the line goes through it).
When calculating the slope DO NOT TAKE DATA POINTS FROM THE TABLE of data supplied (no matter how tempting!) UNLESS the point also happens to be on the line. If you do this you will lose beaucoup des marks and can kiss goodbye any chance of an A grade.Do you understand why you cannot do this?
4
WHAT GOES ON WHAT AXIS?Option oneTo show one variable is proportional to another, the convention is to put the independent variable on the x–axis, and the dependant variable on the y-axis, (from y = fn (x), meaning y is a function of x). The independent variable is the one which you control.
Option twoIf the slope of the graph needs to be calculated then we use a difference approach, one which often contradicts option one, but which nevertheless must take precedence. In this case we compare a formula (the one which connects the two variables in question) to the basic equation for a line: y = mx.
See if you can work out what goes on what axis for each of the following examples and in each case establish the significance of the slope of the graph (they get progressively trickier):1. To Show Force is proportional to Acceleration2. Ohm’s Law3. Snell’s Law4. Acceleration due to gravity by the method of free-fall5. Acceleration due to gravity using a Pendulum6. Frequency proportional to length7. Frequency proportional to tension
There is usually a follow-up question like the following; “Draw a suitable graph on graph paper and explain how this verifies Snell’s Law”. There is a standard response to this; “The graph of Sin i against Sin r resulted in a straight line through the origin (allowing for experimental error), showing Sin i is directly proportional to Sin r, and therefore verifying Snell’s Law”.
If you are asked any questions to do with the information in the table, you are probably being asked to first find the slope of the graph, and use this to find the relevant information.
And always, always, label your axes.
5

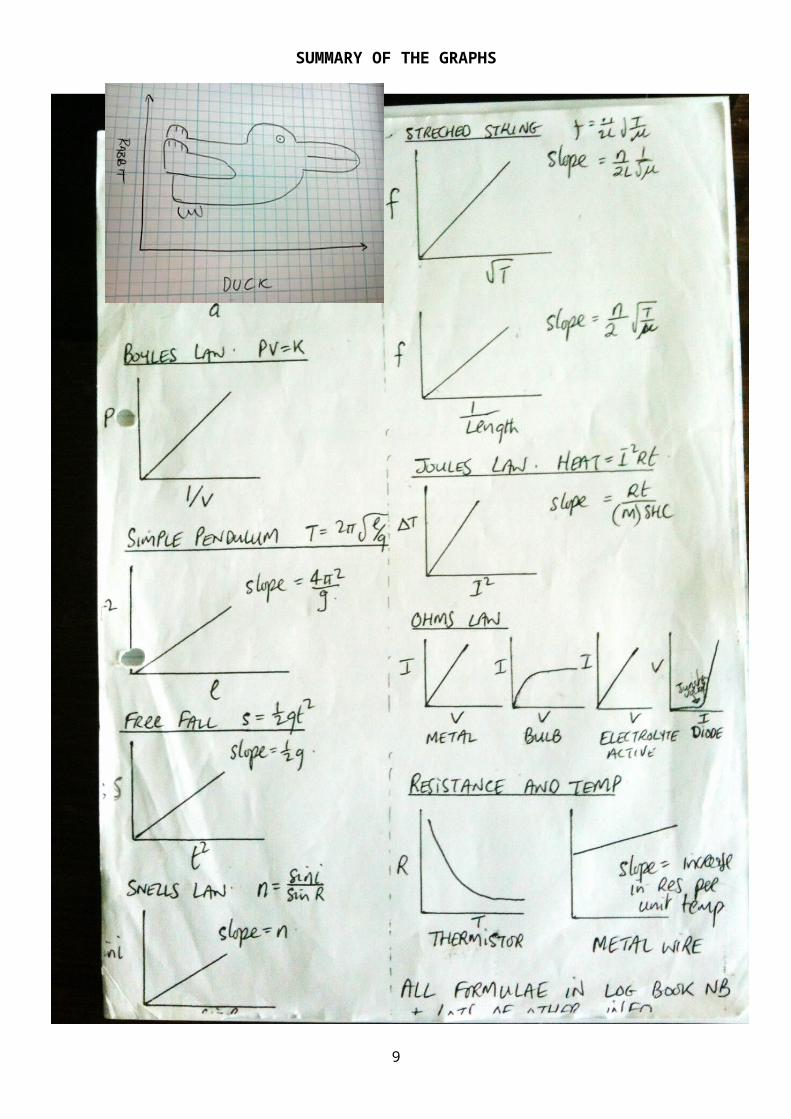
SUMMARY OF THE GRAPHS
6

EXPERIMENT QUESTIONS (SECTION A) BY YEAR
Experiment Title 14 13 12 11 10 09 08 07 06 05 04 03 02Concave Mirror 3 3
Convex Lens 2 2 3
Refractive Index 2 3 3
Verify F = Ma 1
g by free-fall 1 1
Conservation of Momentum 1 1 1
Measurement of g using Simple Pendulum
1 1 1
Calibration Curve
Specific Heat Capacity 2
Latent Heat of Vapourisation 2 2 2
Latent Heat of Fusion 2 2
Boyle’s Law 2 2 1
Laws of Equilibrium 1 1 1
Speed of Sound 3 3
Natural Frequency and Length 3 3
Natural Frequency and Tension 3 3 3
Wavelength of Light 3 3 2 2
Joule’s Law 4 4 4
Ohm’s Law 4
V I for a Filament Bulb 4
V I for copper sulphate 4 4
Semiconductor Diode 4 4
R versus Temp for a Metal 4
R versus Temp for Thermistor 4
Resistivity 4 4
7

Section A popular theory questionsMost of the questions in Section A are repetitive; the following represent some of the
most common questions asked.
The standard questions will usually be followed by one or two tricky questions which are looking to test for a deeper understanding of what’s going on.
I have highlighted the most common of these below.Note that some questions are common to many experiments and so the answers should be learned off like a mantra. Some examples:
Why is it important to keep (variable X) constant throughout the experiment?Answer:You can only investigate the relationship between two variables at any one time and variable X would be a third variable.
Why should room temperature be approximately half-way between initial and final temperature (for Heat experiments)?Answer:So that the heat lost to the environment when the system is above room temperature will cancel out the heat taken in from the environment when the system is below room temperature.
What is the advantage in keeping the length/time/mass as large as possible?Answer:A larger length/time/mass would result in a smaller percentage error.
Be careful / specific when referring to parallax error“To avoid the error of parallax when measuring the length with a metre stick” is acceptable.“To avoid parallax error” is not.
All of the following are taken from past papers.Make sure when answering these that you check your answer against the appropriate marking scheme; knowing the answer in your head and writing it down in such a way that you get full marks in an exam are two very, very different things.
I was going to help you in this regard by including the appropriate answer, but I think the process of digging out the answer from your notes or marking schemes would actually result in you being more likely to remember it.
8
Measurement of the focal length of a concave mirror
(i) How was an approximate value for the focal length found?(ii) What was the advantage of finding the approximate value for the focal length?
Verification of Snell’s law of refraction / to measure the refractive index of a glass block(i) Why would smaller values lead to a less accurate result?
Measurement of the focal length of a convex lens(i) Why is it difficult to measure the image distance accurately?(ii) Give two precautions that should be taken when measuring the image distance.(iii) What difficulty would arise if the student placed the object 10 cm from the lens?
Measurement of acceleration due to gravity (g) using the freefall method(i) Indicate the distance s on your diagram.(ii) Describe how the time interval t was measured. (iii) Give two ways of minimising the effect of air resistance in the experiment. To show that acceleration is proportional to the force which caused it(i) How was the effect of friction reduced in the experiment?(i) Using your graph, find the mass of the body.(ii) On a trial run of this experiment, a student found that the graph did not go through the origin.
Suggest a reason for this.(iii) Describe how the apparatus should be adjusted, so that the graph would go through the origin. To verify the principle of conservation of momentum(i) How could the accuracy of the experiment be improved?(ii) How did the student know that body A was moving at constant velocity?(iii) How were the effects of friction and gravity minimised in the experiment? Verification of Boyle’s law(i) Why should there be a delay between adjusting the pressure of the gas and recording its value? (ii) Describe how the student ensured that the temperature of the gas was kept constant. Investigation of the laws of equilibrium for a set of co-planar forces(i) Describe how the centre of gravity of the metre stick was found. (ii) How did the student know that the metre stick was in equilibrium? (iii) Why was it important to have the spring balances hanging vertically?
Investigation of the relationship between periodic time and length for a simple pendulum and hence calculation of g(i) Give two factors that affect the accuracy of the measurement of the periodic time.(ii) Why did the student measure the time for 30 oscillations instead of measuring the time for one? (iii) How did the student ensure that the length of the pendulum remained constant when the pendulum
was swinging? (iv)Explain why a small heavy bob was used.(v) Explain why the string was inextensible.(vi)Describe how the pendulum was set up so that it swung freely about a fixed point.
Measurement of the specific heat capacity of water(i) Explain why adding a larger mass of copper would improve the accuracy of the experiment.
9

Measurement of the specific latent heat of fusion of ice(i) Why was melting ice used? (ii) Why was dried ice used? (iii) Explain why warm water was used. (iv)What should be the approximate room temperature to minimise experimental error? (v) What was the advantage of having the room temperature approximately halfway between the initial
temperature of the water and the final temperature of the water?
Measurement of the specific latent heat of vaporisation of water(i) How was the water cooled below room temperature?(ii) How was the steam dried?(iii) Why was dry steam used? (iv)Why was a sensitive thermometer used?(v) A thermometer with a low heat capacity was used to ensure accuracy. Explain why.
To measure the speed of sound in air(i) How was it known that the air column was vibrating at its first harmonic?
Investigation of the variation of fundamental frequency of a stretched string with length(i) How did the student know that the string was vibrating at its fundamental frequency?
Investigation of the variation of fundamental frequency of a stretched string with tension(i) Why was it necessary to keep the length constant? (ii) How did the student know that the string was vibrating at its fundamental frequency? (iii) How did the student know that resonance occurred? (iv)Use your graph to calculate the mass per unit length of the string. Measurement of the wavelength of monochromatic light(i) What effect would each of the following changes have on the bright images formed: using a monochromatic light source of longer wavelength using a diffraction grating having 200 lines per mm using a source of white light instead of monochromatic light?(ii) Calculate the maximum number of images that are formed on the screen. (iii) The laser is replaced with a source of white light and a series of spectra are formed on the screen.
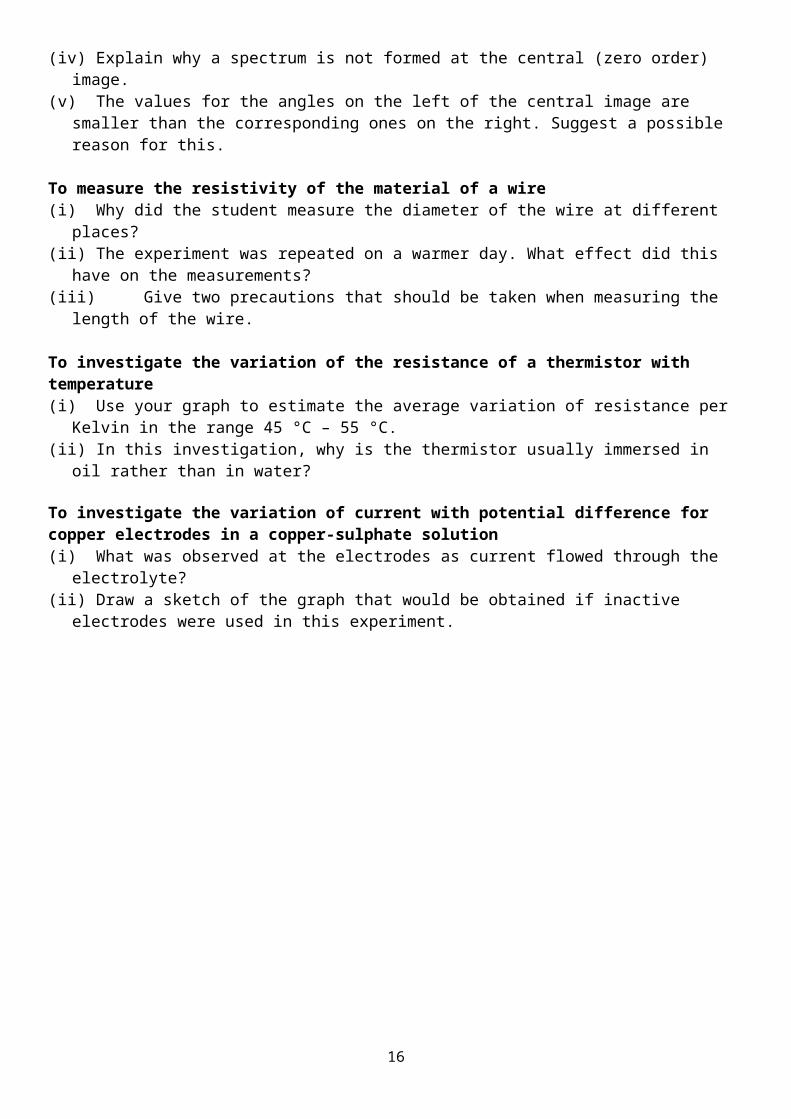
Explain how the diffraction grating produces a spectrum.(iv)Explain why a spectrum is not formed at the central (zero order) image. (v) The values for the angles on the left of the central image are smaller than the corresponding ones on the
right. Suggest a possible reason for this.
To measure the resistivity of the material of a wire(i) Why did the student measure the diameter of the wire at different places?(ii) The experiment was repeated on a warmer day. What effect did this have on the measurements?(iii) Give two precautions that should be taken when measuring the length of the wire.
To investigate the variation of the resistance of a thermistor with temperature(i) Use your graph to estimate the average variation of resistance per Kelvin in the range 45 °C – 55 °C.(ii) In this investigation, why is the thermistor usually immersed in oil rather than in water? To investigate the variation of current with potential difference for copper electrodes in a copper-sulphate solution (i) What was observed at the electrodes as current flowed through the electrolyte?(ii) Draw a sketch of the graph that would be obtained if inactive electrodes were used in this experiment.
10

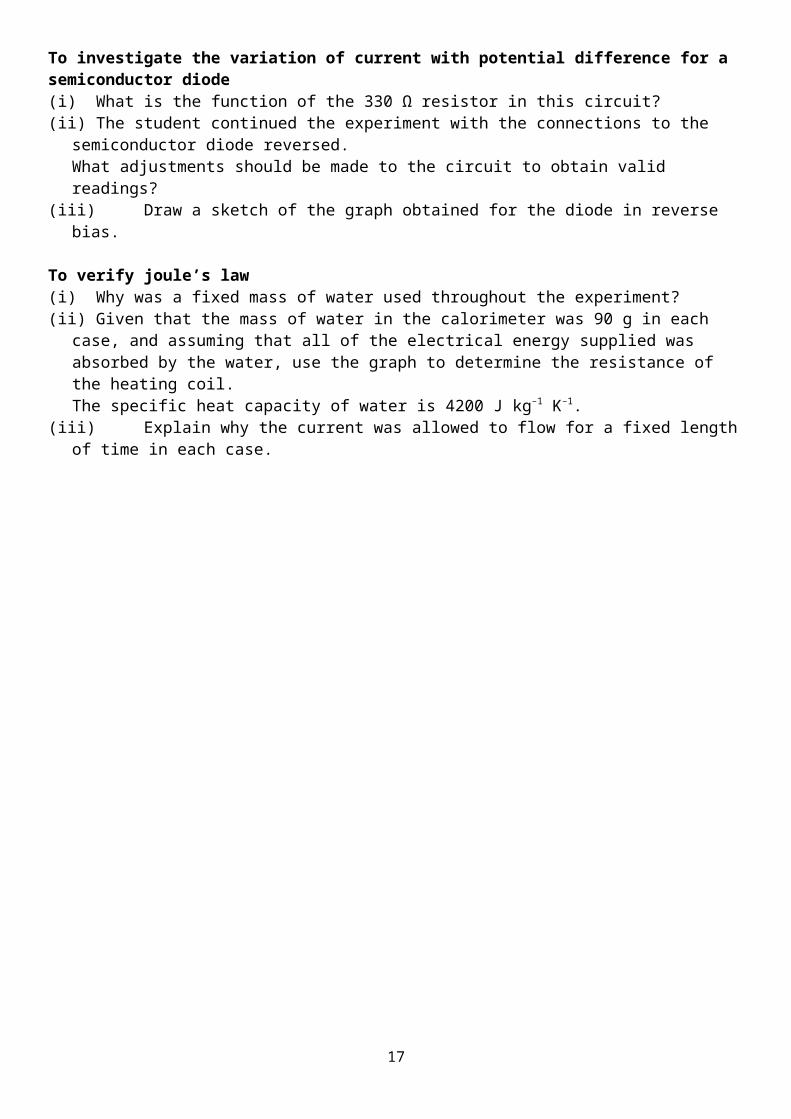
To investigate the variation of current with potential difference for a semiconductor diode(i) What is the function of the 330 Ω resistor in this circuit? (ii) The student continued the experiment with the connections to the semiconductor diode reversed.
What adjustments should be made to the circuit to obtain valid readings?(iii) Draw a sketch of the graph obtained for the diode in reverse bias.
To verify joule’s law(i) Why was a fixed mass of water used throughout the experiment?(ii) Given that the mass of water in the calorimeter was 90 g in each case, and assuming that all of the
electrical energy supplied was absorbed by the water, use the graph to determine the resistance of the heating coil. The specific heat capacity of water is 4200 J kg–1 K–1.
(iii) Explain why the current was allowed to flow for a fixed length of time in each case.
11

12

MEASUREMENT OF THE FOCAL LENGTH OF A CONCAVE MIRROR
1. [2010 OL] A student carried out an experiment to measure the focal length of a concave mirror.The student placed an object in front of the mirror so that a real image was formed.The student repeated the experiment by placing the object at different positions and each time recorded the object distance u and the image distance v.The table shows the data recorded by the student.(i) Draw a labelled diagram showing how the apparatus was arranged.(ii) Mark the distances u and v on your diagram. (iii) How was the position of the real image located? (iv) Calculate the value for the focal length f of the mirror using the data. (v) Why did the student repeat the experiment?
2. [2002 OL]A student carried out an experiment to measure the focal length of a concave mirror. The student placed an object at different positions in front of the mirror so that a real image was formed in each case. The table shows the measurements recorded by the student for the object distance u and the image distance v.
u/cm 20 30
40 50
v/cm 64 43
41 35
(i) Draw a labelled diagram showing how the apparatus was arranged. (ii) Describe how the student found the position of the image. (iii) Show on your diagram the object distance u and the image distance v.
(iv) Using the formula or otherwise and the above data, find an average value for the focal length f of the mirror.
3. [2007]In an experiment to measure the focal length of a concave mirror, an approximate value for the focal length was found. The image distance v was then found for a range of values of the object distance u. The following data was recorded.
(i) How was an approximate value for the focal length found?
(ii) What was the advantage of finding the approximate value for the focal length?
(iii) Describe, with the aid of a labelled diagram, how the position of the image was found. (iv) Calculate the focal length of the concave mirror based on the recorded data.
4. [2013]The following is part of a student’s report on an experiment to measure the focal length of a concave mirror.“I started with the object 6 cm from the mirror but couldn’t get an image to form on the screen. I moved the object back a few centimetres and tried again, but I couldn’t get an image to form on the screen until the object was 24 cm from the mirror. From then on I moved the object back 8 cm each time and measured the corresponding image distances.I wrote my results in the table.”(i) Draw a labelled diagram of the apparatus used. (ii) Give two precautions that should be taken when measuring the
image distance.(iii) Explain why the student was unable to form an image on the screen when the object was close to the mirror.(iv) Use all of the data in the table to calculate a value for the focal length of the mirror.
13
u/cm 20 30 50v/cm 65 32 23
u/cm
15.0 20.0 25.0 30.0 35.0 40.0
v/cm
60.5 30.0 23.0 20.5 18.0 16.5
u/cm 24.0 32.0 40.0 48.0v/cm 72.5 40.3 33.0 27.9

(v) Describe how the student could have found an approximate value for the focal length of the mirror before starting the experiment.
14

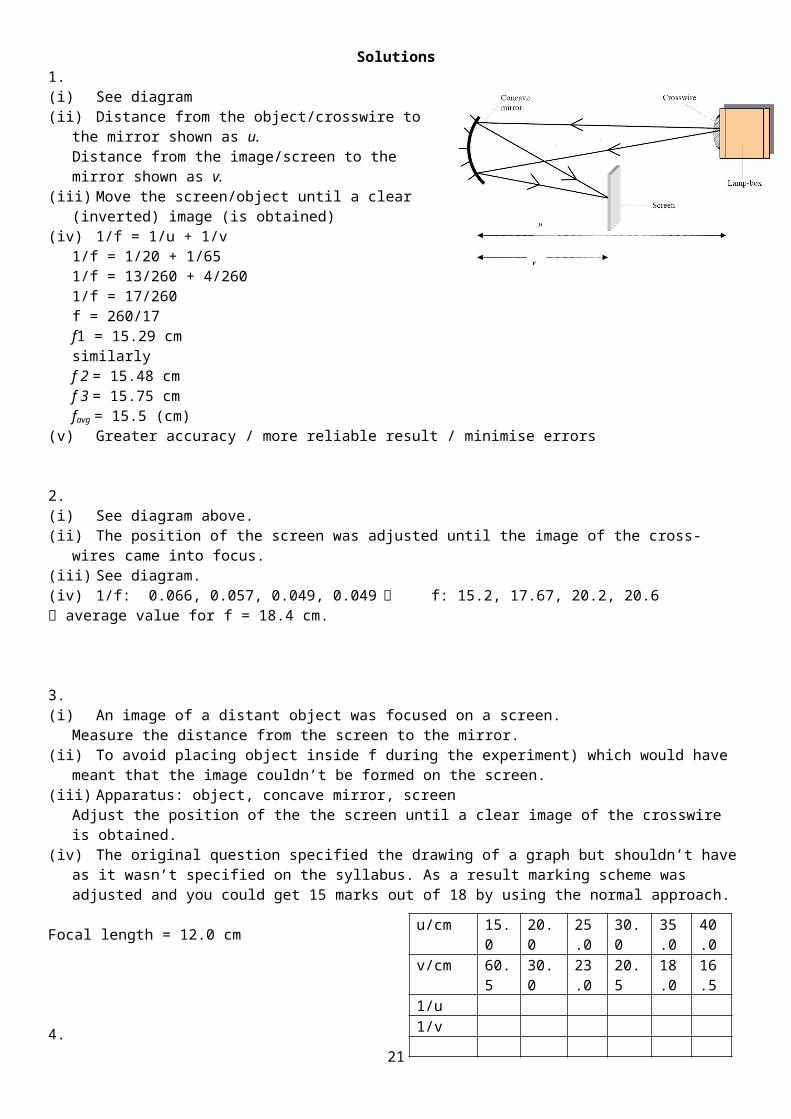
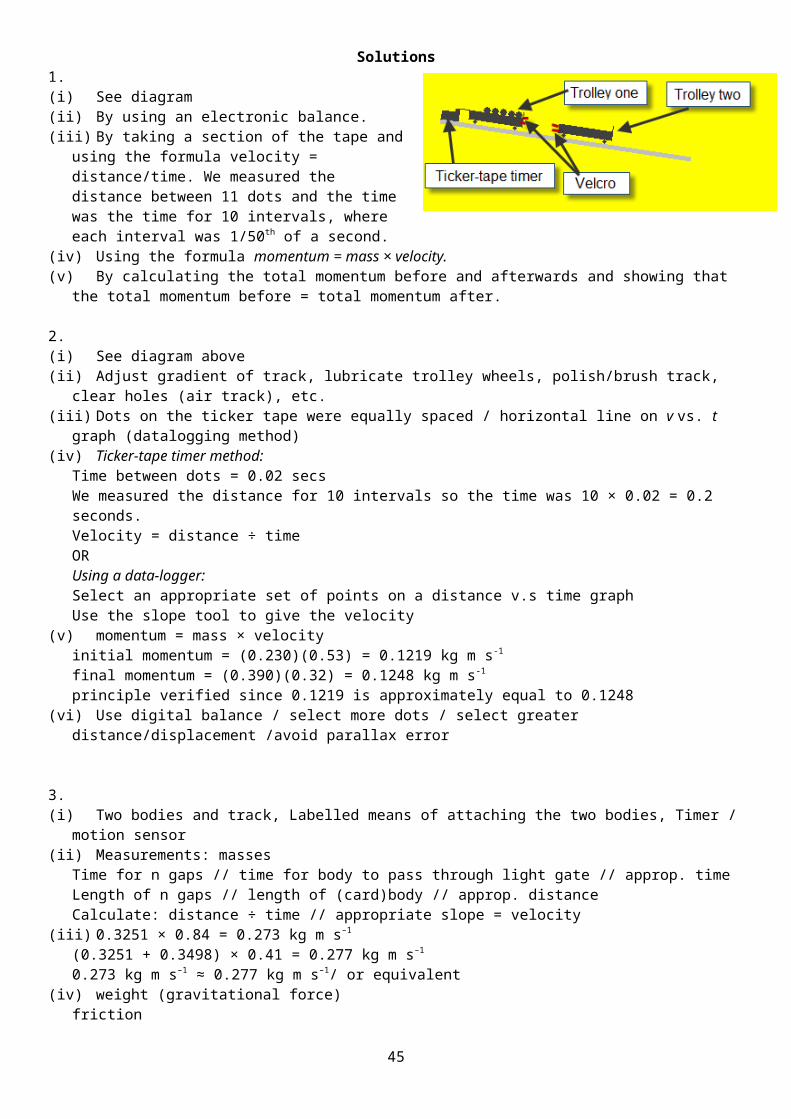
Solutions1.(i) See diagram(ii) Distance from the object/crosswire to the mirror shown as u.
Distance from the image/screen to the mirror shown as v.(iii) Move the screen/object until a clear (inverted) image (is
obtained) (iv) 1/f = 1/u + 1/v
1/f = 1/20 + 1/651/f = 13/260 + 4/2601/f = 17/260f = 260/17f1 = 15.29 cmsimilarly f 2 = 15.48 cmf 3 = 15.75 cmfavg = 15.5 (cm)
(v) Greater accuracy / more reliable result / minimise errors
2.(i) See diagram above.(ii) The position of the screen was adjusted until the image of the cross-wires came into focus.(iii) See diagram.(iv) 1/f: 0.066, 0.057, 0.049, 0.049 f: 15.2, 17.67, 20.2, 20.6 average value for f = 18.4 cm.
3.(i) An image of a distant object was focused on a screen.
Measure the distance from the screen to the mirror.(ii) To avoid placing object inside f during the experiment) which would have meant that the image couldn’t be
formed on the screen.(iii) Apparatus: object, concave mirror, screen
Adjust the position of the the screen until a clear image of the crosswire is obtained. (iv) The original question specified the drawing of a graph but shouldn’t have as it wasn’t specified on the syllabus.
As a result marking scheme was adjusted and you could get 15 marks out of 18 by using the normal approach.
Focal length = 12.0 cm
4.(i) Apparatus: e.g. bulb, mirror, screen 3 (components
appropriately consistent and each labelled) correct arrangement and correct shape of mirror (ii) Measure from the back of the mirror / measure from the centre (pole) of the mirror / avoid parallax error / ensure
image is sharp / have both screen and mirror vertical, etc. (iii) The object was inside the focal length / virtual image formed(iv)
f ≈ 17.9 cm
(vi) Focus the image of a distant object onto a screen.Measure the distance from the mirror to the screen.
15
u/cm 15.0 20.0 25.0
30.0 35.0 40.0
v/cm 60.5 30.0 23.0
20.5 18.0 16.5
1/u 1/v
u/cm 24.0 32.0 40.0 48.01/u 0.042 0.03
10.025 0.021
v/cm 72.5 40.3 33.0 27.91/v 0.014 0.02
50.030 0.036
1f=1
u+ 1
v
VERIFICATION OF SNELL’S LAW OF REFRACTIONOr
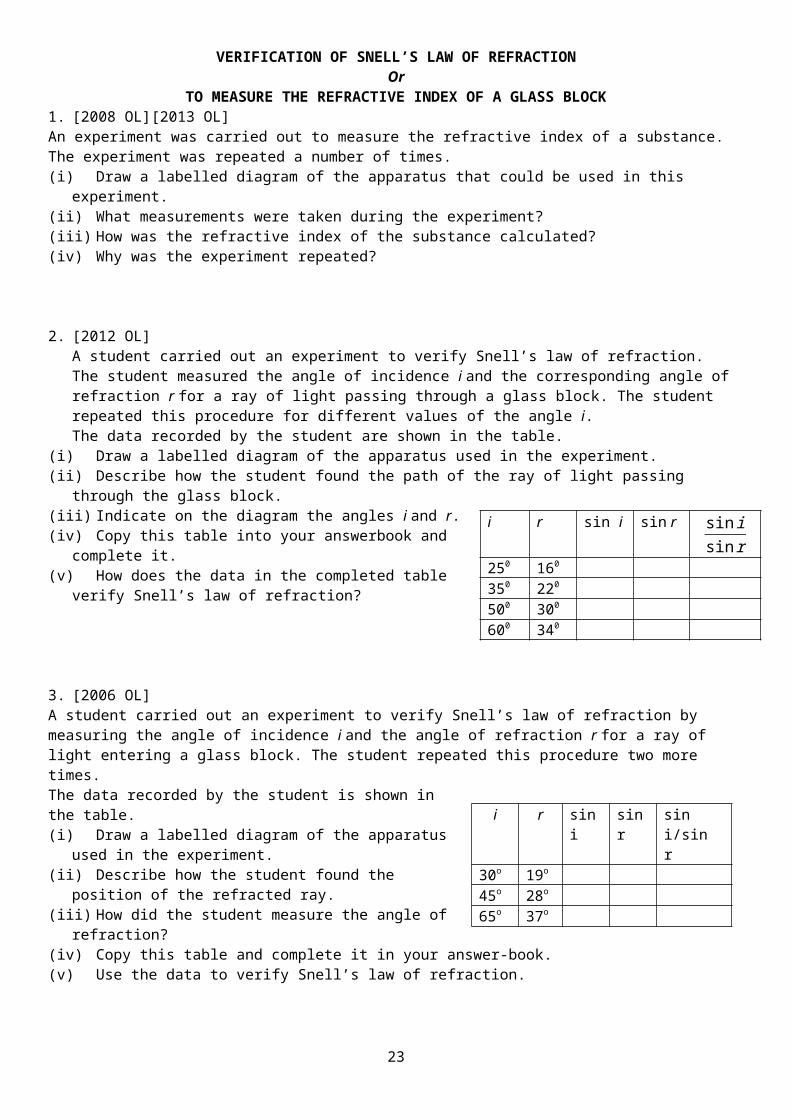
TO MEASURE THE REFRACTIVE INDEX OF A GLASS BLOCK1. [2008 OL][2013 OL]An experiment was carried out to measure the refractive index of a substance.The experiment was repeated a number of times.(i) Draw a labelled diagram of the apparatus that could be used in this experiment. (ii) What measurements were taken during the experiment? (iii) How was the refractive index of the substance calculated? (iv) Why was the experiment repeated?
2. [2012 OL]A student carried out an experiment to verify Snell’s law of refraction. The student measured the angle of incidence i and the corresponding angle of refraction r for a ray of light passing through a glass block. The student repeated this procedure for different values of the angle i.The data recorded by the student are shown in the table.
(i) Draw a labelled diagram of the apparatus used in the experiment. (ii) Describe how the student found the path of the ray of light passing through the glass block. (iii) Indicate on the diagram the angles i and r. (iv) Copy this table into your answerbook and complete it.(v) How does the data in the completed table verify Snell’s law of
refraction?
3. [2006 OL]A student carried out an experiment to verify Snell’s law of refraction by measuring the angle of incidence i and the angle of refraction r for a ray of light entering a glass block. The student repeated this procedure two more times. The data recorded by the student is shown in the table.(i) Draw a labelled diagram of the apparatus used in the experiment. (ii) Describe how the student found the position of the refracted ray. (iii) How did the student measure the angle of refraction? (iv) Copy this table and complete it in your answer-book. (v) Use the data to verify Snell’s law of refraction.
4. [2014]In an experiment to measure the refractive index of a substance, a student used a rectangular block of the substance to measure the angle of incidence i and the corresponding angle of refraction r for a ray of light as it passed from air into the substance. The student repeated the procedure for a series of different values of the angle of incidence and recorded the following data.
i (degrees) 20 30 40 50 60 70 80r (degrees) 13 20 27 23 36 40 43
(i) One of the recorded angles of refraction is inconsistent with the others. Which one? (ii) Describe, with the aid of a labelled diagram, how the student found the angle of refraction. (iii) Calculate a value for the refractive index of the substance by drawing a suitable graph based on the recorded data. (iv) Using a graph to calculate a value for the refractive index is a more accurate method than calculating the refractive
index for each pair of angles and then finding the mean.Give two reasons for this.{It’s easy to guess the first reason. The second reason is a load of cobblers and shouldn’t have been looked for – in my opinion}.
16
i r sin i sin r sin isin r
250 160
350 220
500 300
600 340
i r sin i sin r sin i/sin r30o 19o
45o 28o
65o 37o
5. [2010]In an experiment to verify Snell’s law, a student recorded the following data.(ii) Draw a labelled diagram of the apparatus used. (iii) Using the recorded data, draw a suitable graph (iv) Explain how your graph verifies Snell’s law.(v) Using your graph, find the refractive index(vi) The student did not record any values of i below 30°, give two reasons why?
6. [2005]In an experiment to verify Snell’s law, a student measured the angle of incidence i and the angle of refraction r for a ray of light entering a substance. This was repeated for different values of the angle of incidence. The following data was recorded.(i) Describe, with the aid of a diagram, how the student obtained the angle of refraction. (ii) Draw a suitable graph on graph paper and explain how your graph verifies Snell’s law. (iii) From your graph, calculate the refractive index of the substance. (iv) The smallest angle of incidence chosen was 200.
Why would smaller values lead to a less accurate result?
17
i / ° 30 40 50 55 60 65 70r / ° 19 26 30 33 36 38 40
i/degrees 20
30 40 50 60 70
r/degrees
14
19 26 30 36 40

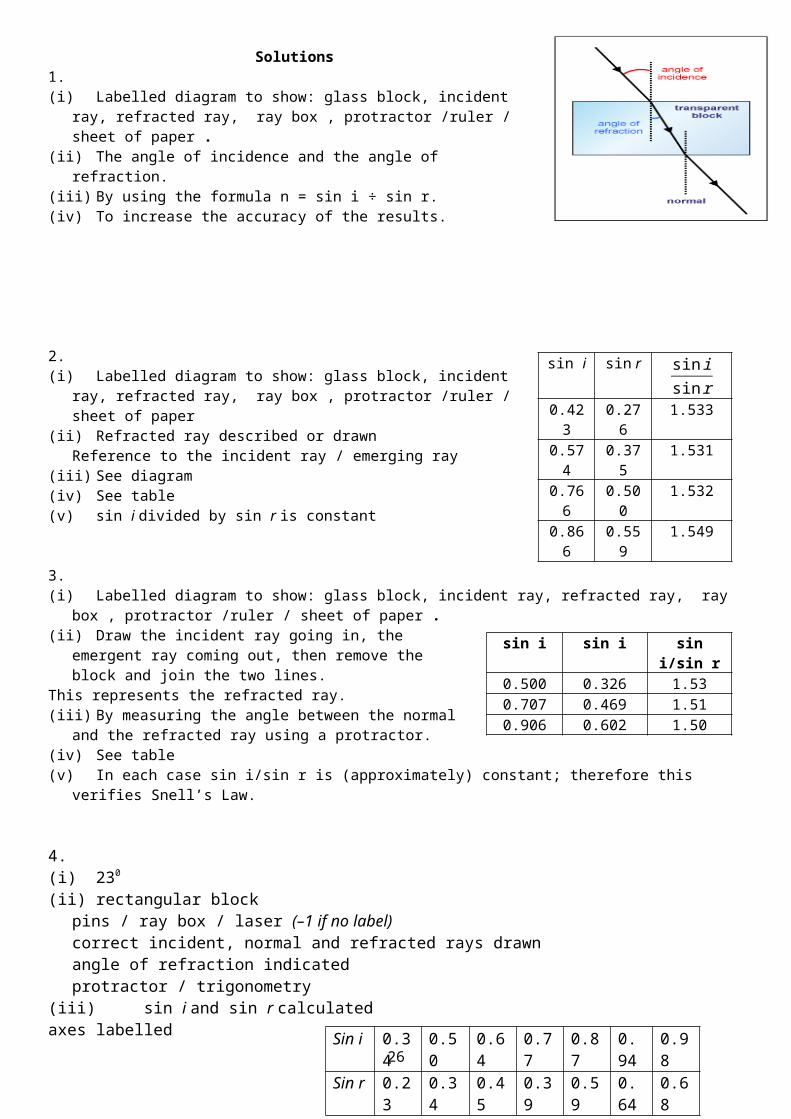
Solutions1.(i) Labelled diagram to show: glass block, incident ray, refracted ray, ray box ,
protractor /ruler / sheet of paper .(ii) The angle of incidence and the angle of refraction.(iii) By using the formula n = sin i ÷ sin r.(iv) To increase the accuracy of the results.
2.(i) Labelled diagram to show: glass block, incident ray, refracted ray, ray box ,
protractor /ruler / sheet of paper (ii) Refracted ray described or drawn
Reference to the incident ray / emerging ray (iii) See diagram(iv) See table(v) sin i divided by sin r is constant
3.(i) Labelled diagram to show: glass block, incident ray, refracted ray, ray box , protractor /ruler / sheet of paper .(ii) Draw the incident ray going in, the emergent ray coming out, then
remove the block and join the two lines. This represents the refracted ray.(iii) By measuring the angle between the normal and the refracted ray
using a protractor.(iv) See table(v) In each case sin i/sin r is (approximately) constant; therefore this verifies Snell’s Law.
4.(i) 230
(ii) rectangular block pins / ray box / laser (–1 if no label) correct incident, normal and refracted rays drawn angle of refraction indicated protractor / trigonometry
(iii) sin i and sin r calculated axes labelled 6 points plotted
straight line with good fit method for finding slope slope = n ≈ 1.44
(iv)outliers can be identified / slope gives weighted mean / reference to origin / reference to Tan θ
18
sin i sin r sin isin r
0.423 0.276 1.5330.574 0.375 1.5310.766 0.500 1.5320.866 0.559 1.549
sin i sin i sin i/sin r0.500 0.326 1.530.707 0.469 1.510.906 0.602 1.50
Sin i 0.34 0.50 0.64 0.77 0.87 0.94 0.98Sin r 0.23 0.34 0.45 0.39 0.59 0.64 0.68

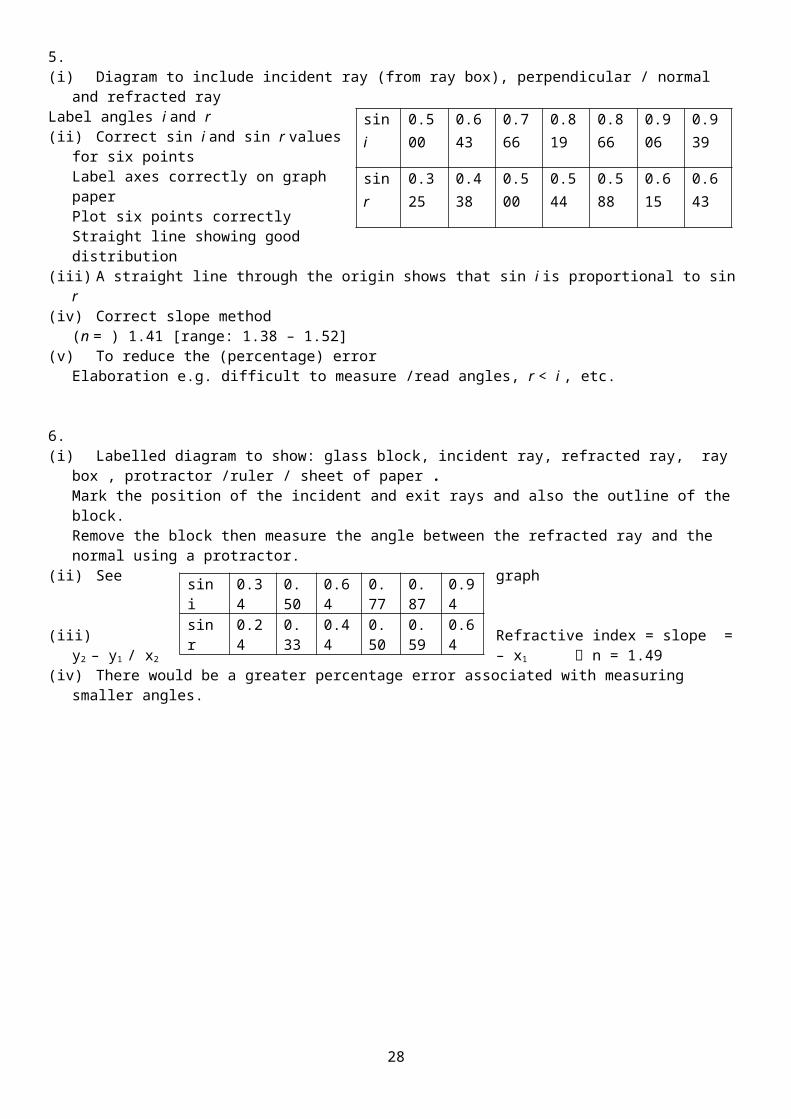
5.(i) Diagram to include incident ray (from ray box), perpendicular / normal and refracted rayLabel angles i and r(ii) Correct sin i and sin r values for six points
Label axes correctly on graph paper Plot six points correctly Straight line showing good distribution
(iii) A straight line through the origin shows that sin i is proportional to sin r (iv) Correct slope method
(n = ) 1.41 [range: 1.38 – 1.52](v) To reduce the (percentage) error
Elaboration e.g. difficult to measure /read angles, r < i , etc.
6.(i) Labelled diagram to show: glass block, incident ray, refracted ray, ray box , protractor /ruler / sheet of paper .
Mark the position of the incident and exit rays and also the outline of the block.Remove the block then measure the angle between the refracted ray and the normal using a protractor.
(ii) See graph
(iii) Refractive index = slope = y2 – y1 / x2 – x1 n = 1.49 (iv) There would be a greater percentage error associated with measuring smaller angles.
19
sin i 0.500 0.643 0.766 0.819 0.866 0.906 0.939
sin r 0.325 0.438 0.500 0.544 0.588 0.615 0.643
sin i 0.34 0.50 0.64 0.77 0.87 0.94sin r 0.24 0.33 0.44 0.50 0.59 0.64

MEASUREMENT OF THE FOCAL LENGTH OF A CONVEX LENS
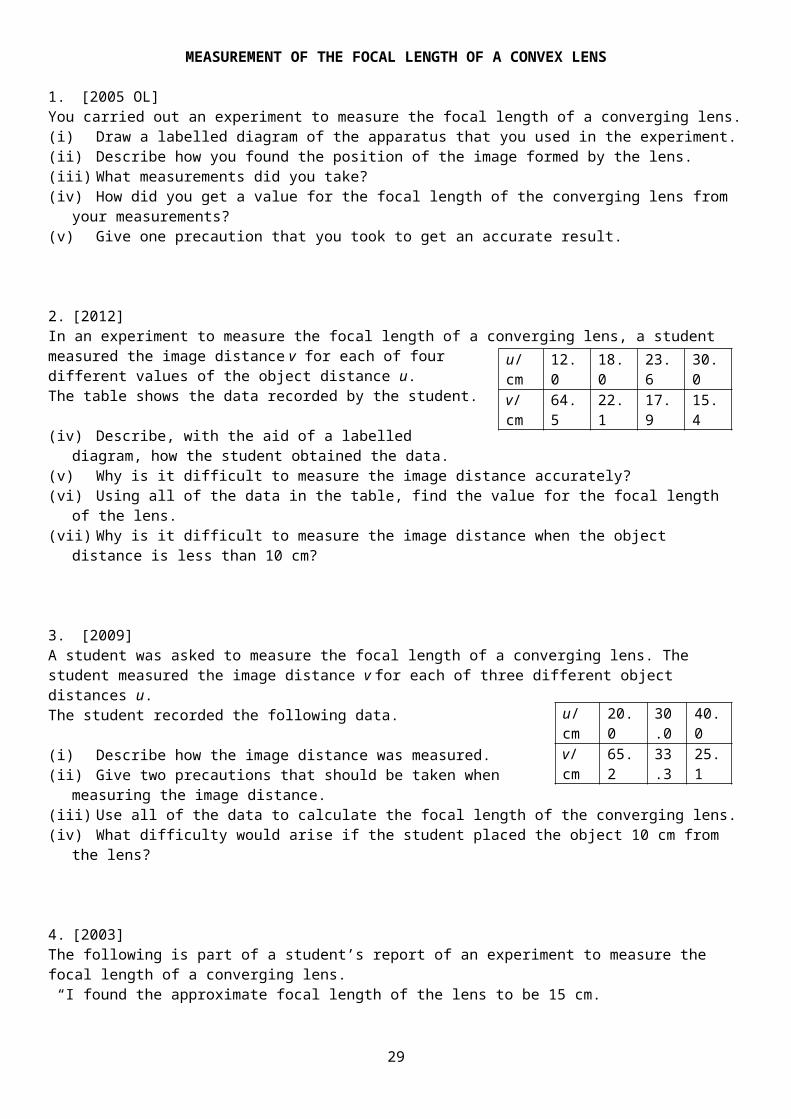
1. [2005 OL]You carried out an experiment to measure the focal length of a converging lens.(i) Draw a labelled diagram of the apparatus that you used in the experiment. (ii) Describe how you found the position of the image formed by the lens.(iii) What measurements did you take?(iv) How did you get a value for the focal length of the converging lens from your measurements?(v) Give one precaution that you took to get an accurate result.
2. [2012]In an experiment to measure the focal length of a converging lens, a student measured the image distance v for each of four different values of the object distance u.The table shows the data recorded by the student.
(iv) Describe, with the aid of a labelled diagram, how the student obtained the data.(v) Why is it difficult to measure the image distance accurately?(vi) Using all of the data in the table, find the value for the focal length of the lens.(vii) Why is it difficult to measure the image distance when the object distance is less than 10 cm?
3. [2009]A student was asked to measure the focal length of a converging lens. The student measured the image distance v for each of three different object distances u. The student recorded the following data.
(i) Describe how the image distance was measured.(ii) Give two precautions that should be taken when measuring the image distance.(iii) Use all of the data to calculate the focal length of the converging lens. (iv) What difficulty would arise if the student placed the object 10 cm from the lens?
4. [2003]The following is part of a student’s report of an experiment to measure the focal length of a converging lens. “I found the approximate focal length of the lens to be 15 cm. I then placed an object at different positions in front of the lens so that a real image was formed in each case.”The table shows the measurements recorded by the student for the object distance u and the image distance v.
(i) How did the student find an approximate value for the focal length of the lens? (ii) Describe, with the aid of a labelled diagram, how the student found the position of the image. (iii) Using the data in the table, find an average value for the focal length of the lens. (iv) Give two sources of error in measuring the image distance and state how one of these errors can be reduced.
20
u/cm 12.0 18.0 23.6 30.0v/cm 64.5 22.1 17.9 15.4
u/cm 20.0 30.0 40.0v/cm 65.2 33.3 25.1
u/cm 20.0 25.0 35.0 45.0v/cm 66.4 40.6 27.6 23.2
Solutions
1.(i) See diagram. Include a metre-stick.(ii) We kept the ray-box and the lens fixed and moved the screen
until there was a clear image formed on the screen.(iii) We measured the distance from object (cross-wires) to the lens
(u) and the distance from the lens to the screen (v).
(iv) By substituting the values for u and v into the formula 1f= 1
u+ 1
v .(v) Ensure that the crosshairs are in focus, repeat and find the average, avoid error of parallax.
2.(i) Arranged as in diagram above.
Adjust to get image in sharp focus Measure u and v Repeat for different positions of object
(ii) Difficult to locate sharp image / centre of lens(iii) Average f ( = 10.0 ± 0.2) cm (iv)Image is virtual / no image formed on screen
3.(i) Object, (converging) lens, screen /search pin
Sharp image (state/imply) // no parallax (between image and search pin)Measure (distance) from image/screen to (centre of) lens
(ii) Measure from the centre of the lens (to the screen) / measure perpendicular distance /avoid parallax error (iii) 1/u + 1/v = 1/f
Correct substitution f = 15.3 cm, 15.8 cm, 15.4 cm fave = (15.5 ± 0.4) cm
(iv) Object would be inside the focal point so an image cannot be formed on a screen Alternative (graphical method):Inverse values for u and for vPlot points Read intercept(s)f = (15.87 ± 0.40) cm
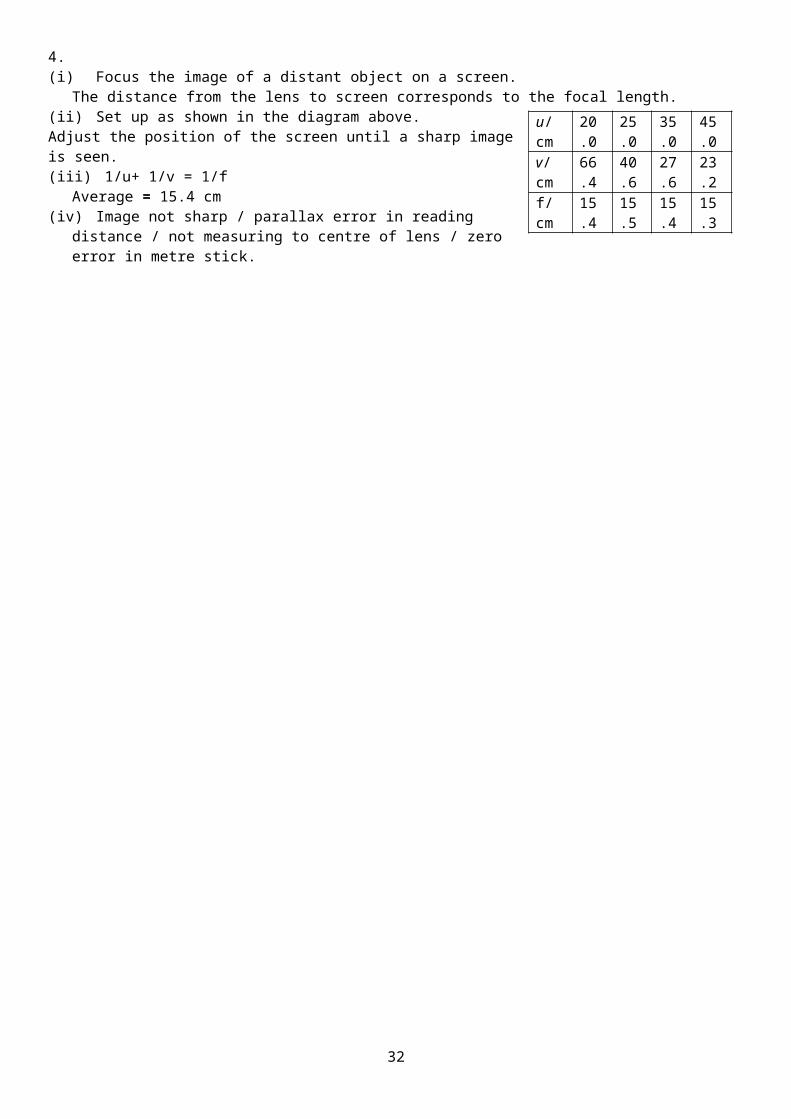
4.(i) Focus the image of a distant object on a screen.
The distance from the lens to screen corresponds to the focal length.(ii) Set up as shown in the diagram above.Adjust the position of the screen until a sharp image is seen.(iii) 1/u+ 1/v = 1/f
Average = 15.4 cm (iv) Image not sharp / parallax error in reading distance / not measuring to centre of lens / zero error in metre stick.
21
1/u 0.050 0.033 0.0251/v 0.0153 0.0300 0.0398
u/cm 20.0 25.0 35.0 45.0v/cm 66.4 40.6 27.6 23.2f/cm 15.4 15.5 15.4 15.3

MEASUREMENT OF VELOCITY AND ACCELERATION
1. [2004 OL]Describe an experiment to measure the velocity of a moving object.
2. [2012 OL]A student carried out an experiment to measure the acceleration of a moving trolley.The student measured the initial velocity of the trolley and the final velocity of the trolley, along with another measurement. The student used these measurements to find the acceleration of the trolley.
(i) Draw a diagram to show how the student got the trolley to accelerate. (ii) Describe how the student measured the final velocity of the trolley. (iii) What other measurement did the student take? (iv) How did the student use the measurements to calculate the acceleration of the trolley? (v) Give a precaution the student took to ensure an accurate result.
3. [2008 OL]A student carried out an experiment to find the acceleration of a moving trolley.The student measured the velocity of the trolley at different times and plotted a graph which was then used to find its acceleration. The table shows the data recorded.
(i) Describe, with the aid of a diagram, how the student measured the velocity of the trolley. (ii) Using the data in the table, draw a graph on graph paper of the trolley’s velocity against time. Put time on the
horizontal axis (X-axis). (iii) Find the slope of your graph and hence determine the acceleration of the trolley.
22
Velocity/ m s-1 0.9 1.7 2.5 3.3 4.1 4.9Time/s 0 2 4 6 8 10
Solutions
1. We set up as shown, turned on the ticker tape timer and released the trolley. We measured the distance between 11 dots on the tape. The time taken to cover that distance corresponded to the time for 10
intervals, where each interval was 1/50th of a second. We calculated velocity using the formula velocity = distance/time.
2.(i) Diagram to show: trolley and runway // air track and glider
Tilt runway, apply force, ticker timer, motion sensor (ii) Using a motion sensor // distance between (eleven) dots divided by time(iii) Distance, time(iv) Acceleration = change in velocity divided by time(v) Oil the wheels, clean the runway, ignore the initial tickertape dots, reduce the friction, etc.
3.(i)
He measured the distance between 11 dots on the tape. The time taken to cover that distance corresponded to the time for 10 intervals, where each interval was 1/50 th
of a second. He calculated velocity using the formula
velocity = distance/time. (ii) See graph
(iii) The acceleration corresponds to the slope of the velocity-time graph.Take any two points e.g. (0, 0.9) and (10, 4.9) and use the formula: slope = y2 – y1 / x2 – x1
Slope = acceleration = 0.4 m s-2
23

MEASUREMENT OF ACCELERATION DUE TO GRAVITY (g) USING THE FREEFALL METHOD
1. [2002 OL][2009 OL][2013 OL]You carried out an experiment to measure g, the acceleration due to gravity.(i) Draw a labelled diagram of the apparatus you used. (ii) State what measurements you took during the experiment. (iii) Describe how you took one of these measurements. (iv) How did you calculate the value of g from your measurements? (v) Give one precaution that you took to get an accurate result.
2. [2009]In an experiment to measure the acceleration due to gravity, the time t for an object to fall from rest through a distance s was measured. The procedure was repeated for a series of values of the distance s. The table shows the recorded data.
(i) Draw a labelled diagram of the apparatus used in the experiment.(ii) Indicate the distance s on your diagram.(iii) Describe how the time interval t was measured. (iv) Calculate a value for the acceleration due to gravity by drawing a suitable graph based on the recorded data. (v) Give two ways of minimising the effect of air resistance in the experiment.
3. [2004]In an experiment to measure the acceleration due to gravity g by a free fall method, a student measured the time t for an object to fall from rest through a distance s. This procedure was repeated for a series of values of the distance s.The table shows the data recorded by the student.
s/cm 30 40 50 60 70 80 90t/ms 244 291 325 34
2371 409 420
(i) Describe, with the aid of a diagram, how the student obtained the data. (ii) Calculate a value for g by drawing a suitable graph. (iii) Give two precautions that should be taken to ensure a more accurate result.
24
s/ cm 30 50 70 90 110 130 150t/ms 247 310 377 435 473 514 540

Solutions1.(i) See diagram(ii) Distance s as shown on the diagram, time for the object
to fall.(iii) Measure length from the bottom of the ball to the top of
the trapdoor as shown using a metre stick.The time is measured using the timer which switches on when the ball is released and stops when the ball hits the trap-door.
(iv) Plot a graph of s against t2; the slope of the graph corresponds to g/2.Alternatively substitute (for t and s) into g = 2s/t2
(v) Use the smallest time value recorded for t, repeat the experiment a number of times
2.(i) Timer, ball, release mechanism, trap door(ii) (Perpendicular) distance indicated between bottom of ball and top of trap door.(iii) Timer starts when ball leaves release mechanismTimer stops when ball hits trap door.(iv)
Axes correctly labelled points correctly plotted Straight line with a
good distribution Correct slope method Slope = 5.02 // 0.198 g = (10.04 ± 0.20) m
s–2 (v) Small (object)/ smooth(object)/ no draughts/ in vacuum/ distances relatively short / heavy (object) / dense /
spherical/ aerodynamic .
3.(i) The clock starts as sphere is released and stops when the sphere hits the trapdoor.S is the distance from solenoid to trap-door.Record distance s and the time t
(ii) Calculation of t2(at least five correct values) Axes s and t2 labelled At least five points correctly plotted Straight line with good fit Method for slopeCorrect substitution g = 10.0 ± 0.2 m s−2
(iii) Measure from bottom of sphere; avoid parallax error; for each value of s take several values for t / min t reference;); adjust ‘sensitivity’ of trap door; adjust ‘sensitivity’ of electromagnet (using paper between sphere and core); use large values for s (to reduce % error); use millisecond timer
25
s/ cm 30 50 70 90 110 130 150t/ms 247 310 377 435 473 514 540t 2 / s2 0.0610 0.0961 0.1421 0.1892 0.2237 0.2642 0.2916
s/cm 30 40 50 60 70 80 90t/ms 244 291 325 342 371 409 420t2 /s2 0.060 0.085 0.106 0.117 0.138 0.167 0.176
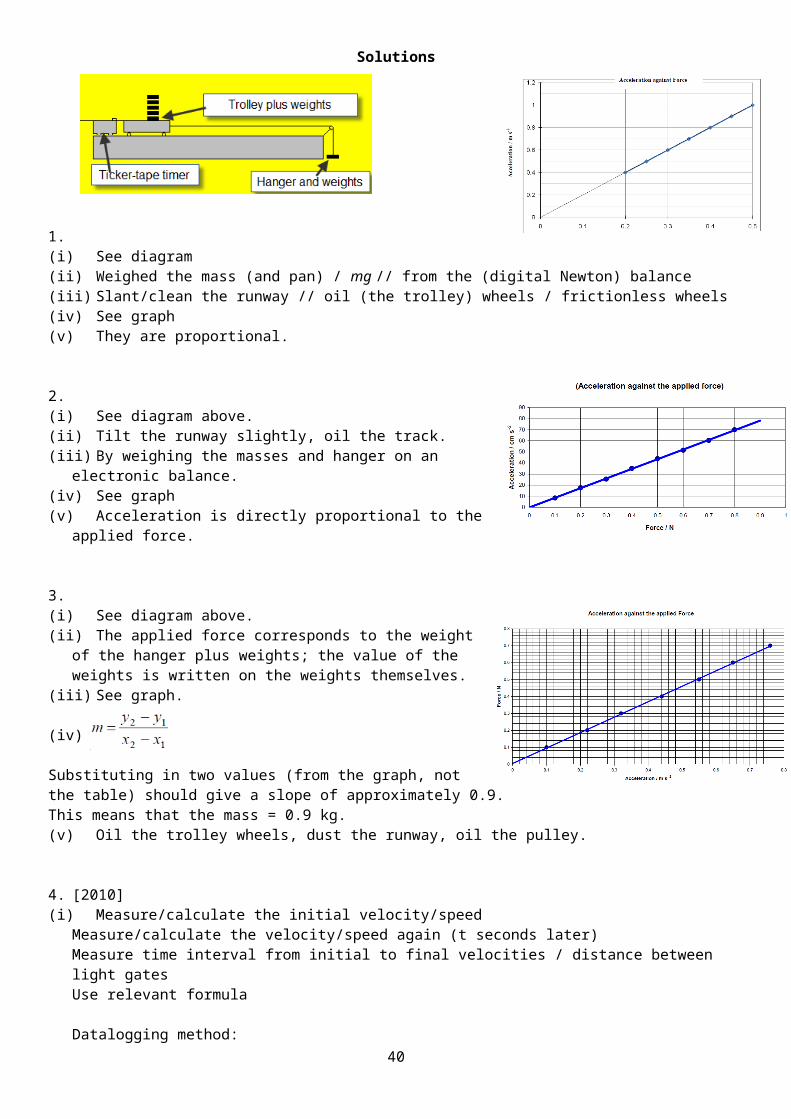
TO SHOW THAT ACCELERATION IS PROPORTIONAL TO THE FORCE WHICH CAUSED IT
1. [2010 OL]You carried out an experiment to investigate the relationship between the acceleration of a body and the force applied to it. You did this by applying a force to a body and measuring the resulting acceleration. The table shows the data recorded during the experiment.
(i) Draw a labelled diagram of the apparatus you used
(ii) How did you measure the applied force?(iii) How did you minimise the effect of friction during the experiment? (iv) Plot a graph on graph paper of the body’s acceleration against the force applied to it(v) What does your graph tell you about the relationship between the acceleration of the body and the force applied to
it?
2. [2003 OL]A student carried out an experiment to investigate the relationship between the force applied to a body and the acceleration of the body. The table shows the measurements recorded by the student.
Force /N 0.1 0.2 0.3 0.4 0.5 0.6 0.7 0.8Acceleration /cm s–2 8.4 17.6 25.4 35.0 43.
951.5 60.4 70.0
(ii) Draw a labelled diagram of the apparatus used in the experiment.(iii) How was the effect of friction reduced in the experiment?(iv) Describe how the student measured the applied force.(v) Plot a graph, on graph paper, of the acceleration against the applied force. (vi) What does your graph tell you about the relationship between the acceleration of the body and the force applied to
it?
3. [2005 OL]In an experiment to investigate the relationship between force and acceleration a student applied a force to a body and measured the resulting acceleration. The table shows the measurements recorded by the student.
Force /N 0.1 0.2 0.3 0.4 0.5 0.6 0.7acceleration /m s–2 0.10 0.22 0.32 0.44 0.55 0.65 0.76
(i) Draw a labelled diagram of the apparatus used in the experiment.(ii) Outline how the student measured the applied force. (iii) Plot a graph, on graph paper of the acceleration against the applied force. Put acceleration on the horizontal axis
(X-axis). (iv) Calculate the slope of your graph and hence determine the mass of the body.(v) Give one precaution that the student took during the experiment.
4. [2010]In an experiment to investigate the relationship between the acceleration of a body and the force applied to it, a student recorded the following data.
(iv) Describe the steps involved in measuring the acceleration of the body.(v) Using the recorded data, plot a graph to show the relationship between the acceleration of the body and the force
applied to it. (vi) What does your graph tell you about this relationship?(vii) Using your graph, find the mass of the body.(viii) On a trial run of this experiment, a student found that the graph did not go through the origin. Suggest a reason for this.(ix) Describe how the apparatus should be adjusted, so that the graph would go through the origin.
26
Force / N 0.20
0.25 0.30 0.35 0.40 0.45 0.50
acceleration / m s−2 0.4 0.5 0.6 0.7 0.8 0.9 1.0
F/N 0.20 0.40 0.60 0.80 1.00 1.20 1.40a/m s–2 0.08 0.18 0.28 0.31 0.45 0.51 0.60

Solutions
1.(i) See diagram(ii) Weighed the mass (and pan) / mg // from the (digital Newton) balance (iii) Slant/clean the runway // oil (the trolley) wheels / frictionless wheels (iv) See graph(v) They are proportional.
2.(i) See diagram above.(ii) Tilt the runway slightly, oil the track.(iii) By weighing the masses and hanger on an electronic balance.(iv) See graph(v) Acceleration is directly proportional to the applied force.
3.(i) See diagram above.(ii) The applied force corresponds to the weight of the hanger plus
weights; the value of the weights is written on the weights themselves.
(iii) See graph.
(iv)
Substituting in two values (from the graph, not the table) should give a slope of approximately 0.9.This means that the mass = 0.9 kg.(v) Oil the trolley wheels, dust the runway, oil the pulley.
4. [2010](i) Measure/calculate the initial velocity/speed
Measure/calculate the velocity/speed again (t seconds later) Measure time interval from initial to final velocities / distance between light gates Use relevant formula
Datalogging method:Align motion sensor with body (e.g. trolley) / diagram Select START and release body(Select STOP and) display GRAPH of ‘a vs. t’ // ‘v vs. t’(Use tool bar to) find average value for a // use slope (tool) to find a (= dv /dt)
(ii) Label axes correctly on graph paper Plot six points correctly Straight line Good distribution
(iii) Acceleration is proportional to the applied force.(iv) The mass of the body corresponds to the slope of the graph = 2.32 kg [range: 2.1 - 2.4 kg](v) Friction / dust on the track slowing down the trolley.(vi) Elevate/adjust the track/slope
27
TO VERIFY THE PRINCIPLE OF CONSERVATION OF MOMENTUM
1. [2006 OL][2011 OL]In a report of an experiment to verify the principle of conservation of momentum, a student wrote the following:“I assembled the apparatus needed for the experiment. During the experiment I recorded the mass of the trolleys and I took measurements to calculate their velocities. I then used this data to verify the principle of conservation of momentum.”(i) Draw a labelled diagram of the apparatus used in the experiment. (ii) How did the student measure the mass of the trolleys? (iii) Explain how the student calculated the velocity of the trolleys.(iv) How did the student determine the momentum of the trolleys? (v) How did the student verify the principle of conservation of momentum?
2. [2011]A student carried out an experiment to verify the principle of conservation of momentum.The student adjusted the apparatus till a body A was moving at a constant velocity u.It was then allowed to collide with a second body B, which was initially at rest, and the two bodies moved off together with a common velocity v.
The following data were recorded:(i) Draw a labelled diagram of the apparatus used in the experiment.(ii) What adjustments did the student make to the apparatus so that body A
would move at constant velocity?(iii) How did the student know that body A was moving at constant velocity?(iv) Describe how the student measured the velocity v of the bodies after the collision.(v) Using the recorded data, show how the experiment verifies the principle of conservation of momentum.(vi) How could the accuracy of the experiment be improved?
3. [2014]The following is part of a student’s report on an experiment to verify the principle of conservation of momentum.“I ensured that no net external forces acted on body A or body B. When I released body A it was moving at a constant velocity; body B was at rest. I allowed body A to collide with body B and they moved off together after the collision.”
The following data was recorded:
Mass of body A = 325.1 gMass of body B = 349.8 gVelocity of body A before the collision = 0.84 m s–1
Velocity of bodies A and B after the collision = 0.41 m s–1
(i) Draw a labelled diagram of the apparatus used in the experiment.(ii) State what measurements the student took and how these measurements were used to calculate the
velocities.(iii) Using the recorded data, show how the experiment verifies the principle of conservation of
momentum.(iv)When carrying out this experiment the student ensures that there is no net external force acting on the
bodies.What are the two forces that the student needs to take account of to ensure this?
(v) Describe how the student reduced the effects of these forces.
28
mass of body A
230 g
mass of body B 160 gvelocity u 0.53 m s–1
velocity v 0.32 m s–1
29

4. [2005]In an experiment to verify the principle of conservation of momentum, a body A was set in motion with a constant velocity. It was then allowed to collide with a second body B, which was initially at rest and the bodies moved off together at constant velocity.The following data was recorded.
Mass of body A = 520.1 gMass of body B = 490.0 gDistance travelled by A for 0.2 s before the collision = 10.1 cmDistance travelled by A and B together for 0.2 s after the collision = 5.1 cm
(i) Draw a diagram of the apparatus used in the experiment. (ii) Describe how the time interval of 0.2 s was measured. (iii) Using the data calculate the velocity of the body A before and after the collision.(iv) Show how the experiment verifies the principle of conservation of momentum. (v) How were the effects of friction and gravity minimised in the experiment?
30

Solutions1.(i) See diagram (ii) By using an electronic balance.(iii) By taking a section of the tape and using the formula
velocity = distance/time. We measured the distance between 11 dots and the time was the time for 10 intervals, where each interval was 1/50th of a second.
(iv) Using the formula momentum = mass × velocity.(v) By calculating the total momentum before and afterwards
and showing that the total momentum before = total momentum after.
2.(i) See diagram above(ii) Adjust gradient of track, lubricate trolley wheels, polish/brush track, clear holes (air track), etc.(iii) Dots on the ticker tape were equally spaced / horizontal line on v vs. t graph (datalogging method)(iv) Ticker-tape timer method:
Time between dots = 0.02 secsWe measured the distance for 10 intervals so the time was 10 × 0.02 = 0.2 seconds.Velocity = distance ÷ timeORUsing a data-logger:Select an appropriate set of points on a distance v.s time graphUse the slope tool to give the velocity
(v) momentum = mass × velocityinitial momentum = (0.230)(0.53) = 0.1219 kg m s-1
final momentum = (0.390)(0.32) = 0.1248 kg m s-1
principle verified since 0.1219 is approximately equal to 0.1248(vi) Use digital balance / select more dots / select greater distance/displacement /avoid parallax error
3.(i) Two bodies and track, Labelled means of attaching the two bodies, Timer / motion sensor(ii) Measurements: masses
Time for n gaps // time for body to pass through light gate // approp. time Length of n gaps // length of (card)body // approp. distance Calculate: distance ÷ time // appropriate slope = velocity
(iii) 0.3251 × 0.84 = 0.273 kg m s–1 (0.3251 + 0.3498) × 0.41 = 0.277 kg m s–1 0.273 kg m s–1 ≈ 0.277 kg m s–1/ or equivalent
(iv) weight (gravitational force) friction
(v) horizontal (air)track / cushion of air / (small) slope / polish runway / oil wheels
4.(i) See diagram(ii) It corresponded to 10 intervals on the ticker-tape.(iii) Velocity before: v = s/t = 0.101/0.2
v = 0.505 m s-1 ≈ 0.51 m s-1
Velocity after: v = 0.051/0.2v = 0.255 m s-1 ≈ 0.26 m s-1
(iv) Momentum before:p = mv = (0.5201)(0.505) = 0.263 ≈ 0.26 kg m s-1
Momentum after:p = mv = (0.5201 + 0.4900)(0.255)p = 0.258 ≈ 0.26 kg m s-1
Momentum before ≈ momentum after (v) Friction: sloped runway // oil wheels or clean track
Gravity: horizontal track // frictional force equal and // tilt track so that trolley moves with constant velocity
31
32

VERIFICATION OF BOYLE’S LAW1. [2004 OL]In an experiment to verify Boyle’s law, a student measured the volume of a gas at different pressures. The table shows the measurements recorded by the student.
(i) Draw a labelled diagram of the apparatus used in this experiment.(ii) Copy this table and fill in the last row by calculating 1/ volume for each measurement. (iii) Plot a graph on graph paper of pressure against 1/volume.(iv) Explain how your graph verifies Boyle’s law.(v) Give one precaution that the student took in carrying out the experiment.
2. [2011]During an experiment to verify Boyle’s law, the pressure of a fixed mass of gas was varied. A series of measurements of the pressure p and the corresponding volume V of the gas was recorded as shown. The temperature was kept constant.
p/kPa 325 300 275 250 200 175 150 125V/cm3 12.1 13.0 14.2 15.5 19.6 22.4 26.0 31.1
(iii) Draw a labelled diagram of the apparatus used in the experiment.(iv) How was the pressure of the gas varied during the experiment?(v) Describe how the pressure and the volume of the gas were measured.(vi) Why should there be a delay between adjusting the pressure of the gas and recording its value? (vii) Draw a suitable graph to show the relationship between the pressure and the volume of a fixed mass of gas. (viii) Explain how your graph verifies Boyle’s law.
3. [2003]In an experiment to verify Boyle’s law, a student measured the volume V of a gas at different values of the pressure p. The mass of the gas was not allowed to change and its temperature was kept constant.The table shows the data recorded by the student.
(i) Describe with the aid of a diagram how the student obtained this data. (ii) Draw a suitable graph on graph paper to show the relationship between the pressure of the gas and its volume. (iii) Explain how your graph verifies Boyle’s law.(iv) Describe how the student ensured that the temperature of the gas was kept constant.
4. [2013]In an experiment to verify Boyle’s law, a student took the set of readings given in the table below.
(i) What physical quantities do X and Y represent?(ii) Name the units used when measuring these quantities.(iii) Draw a labelled diagram of the apparatus that the student used in the experiment.(iv) Describe the procedure he used to obtain these readings. (v) Use the data in the table to draw an appropriate graph on graph paper.(vi) Explain how your graph verifies Boyle’s law.
33
Pressure /kPa 100 111 125 143 167 200 250Volume /cm3 5.0 4.5 4.0 3.5 3.0 2.5 2.01/Volume /cm-3 0.25
p/ kPa 120 180 220 280 320 380 440V/cm3 9.0 6.0 5.0 4.0 3.5 3.0 2.5
X 120 160 200 240 280 320Y 52 39.1 31.1 25.9 22.2 19.6

Solutions1.(i) See diagram.(ii) See table
(iii) See graph below.
(iv) A straight line through the origin shows that pressure is proportional to 1/volume(v) After changing pressure wait a short time before taking readings / read the volume scale at eye level.
2.(i) See diagram above (it must include a pressure gauge, scale for reading volume and
means of adjusting p or V,(ii) We rotated the wheel(iii) The pressure was measured using the pressure gauge; the volume was read from the
scale on the container.(iv) To allow for the gas to cool (reach thermal equilibrium with the environment)(v) See graph.(vi) We got a straight line through the origin, verifying that pressure is inversely
proportional to volume.
3.(i) See diagram above.
Note the pressure of the gas from the pressure-gauge and the volume from the graduated scale.Turn the screw to decrease the volume and increase the pressure. Note the new readings and repeat to get about seven readings.
(ii) Axes labelled6 points plotted correctly
Straight lineGood fit
(iii) A straight line through the origin verifies that pressure is inversely proportional to volume(iv) Release the gas pressure slowly, allow time between readings.
4.(i) Pressure and volume (or height)(ii) N m–2 kPa, Pa, // cm3 (m3, mm3, cm, etc.) (iii) The diagram must include the following:
gas labelled in container with graduations, labelled pressure gauge, labelled means of adjusting pressure or volume (iv) Method used to noting pressure and volume readings
Method of changing pressure or volume (e.g. piston)Note (new) pressure and volume reading
(v) Use the data in the table to draw an appropriate graph on graph paper.
(vi)A straight line through the origin implies
pressure is inversely proportional to volume
34
Pressure /kPa 100 111 125 143 167 200 250Volume /cm3 5.0 4.5 4.0 3.5 3.0 2.5 2.01/Volume /cm-3 0.20 0.22 0.25 0.28 0.33 0.4
00.50
1/V 0.0826 0.0769 0.0704 0.0645 0.0510 0.0446 0.0385 0.0322
p/ kPa 120 180 220 280 320 380 4401/V/cm-3 0.111 0.16
70.200 0.25
00.286 0.33
30.400
X 120 160 200 240 280 3201/X 0.0083 0.00625 0.005 0.0042 0.0036 0.0031Y 52 39.1 31.1 25.9 22.2 19.6
1/Y 0.019 0.026 0.032 0.039 0.045 0.051

INVESTIGATION OF THE LAWS OF EQUILIBRIUM FOR A SET OF CO-PLANAR FORCES
1. [2007 OL]A student investigated the laws of equilibrium for a set of co-planar forces acting on a metre stick. The weight of the metre stick was 1.2 N and its centre of gravity was at the 50 cm mark.The student applied the forces shown to the metre stick until it was in equilibrium.
(i) How did the student know the metre stick was in equilibrium? (ii) Copy the diagram and show all the forces acting on the metre stick. (iii) Find the total upward force acting on the metre stick.(iv) Find the total downward force acting on the metre stick.(v) Explain how these values verify one of the laws of equilibrium. (vi) Find the sum of the anticlockwise moments of the upward forces about the 0 mark.(vii) Find the sum of the clockwise moments of the downward forces about the 0 mark.(viii) Explain how these values verify the other law of equilibrium.
2. [2014 OL]A student investigated the laws of equilibrium for a set of co-planar forces acting on a metre stick. The weight of the metre stick was 1.5 N and its centre of gravity was at the 50 cm mark. The student applied the forces shown to the metre stick until it was in equilibrium.
(i) How did the student measure the upward forces? (ii) Copy the diagram and show all the forces acting on the metre stick. (iii) Find the total upward force acting on the metre stick.(iv) Find the total downward force acting on the metre stick.(v) Explain how these values verify one of the laws of equilibrium. (vi) Find the sum of the anticlockwise moments of the upward forces about the 0 mark.(vii) Find the sum of the clockwise moments of the downward forces about the 0 mark.(viii) Explain how these values verify the other law of equilibrium.
35

3. [2002]A student investigated the laws of equilibrium for a set of co-planar forces acting on a metre stick. The weight of the metre stick was 1 N and its centre of gravity was found to be at the 50.5 cm mark. Two spring balances and a number of weights were attached to the metre stick. Their positions were adjusted until the metre stick was in horizontal equilibrium, as indicated in the diagram. The reading on the spring balance attached at the 20 cm mark was 2 N and the reading on the other spring balance was 4 N.
The other end of each spring balance was attached to a fixed support.
(i) Calculate the sum of the upward forces and the sum of the downward forces acting on the metre stick. (ii) Explain how these experimental values verify one of the laws of equilibrium for a set of co-planar forces. (iii) Calculate the sum of the clockise moments and the sum of the anticlockwise moments about an axis through the
10 cm mark on the metre stick. (iv) Explain how these experimental values verify the second law of equilibrium for a set of co-planar forces. (v) Describe how the centre of gravity of the metre stick was found. (vi) Why was it important to have the spring balances hanging vertically?
4. [2007]A student investigated the laws of equilibrium for a set of co-planar forces acting on a metre stick.The student found that the centre of gravity of the metre stick was at the 50.4 cm mark and its weight was 1.2 N.(i) How did the student find the centre of gravity?(ii) How did the student find the weight, of the metre stick?(iii) Why is the centre of gravity of the metre stick not at the 50.0 cm mark?(iv) The student applied vertical forces to the metre stick and adjusted them until the metre stick was in equilibrium.How did the student know that the metre stick was in equilibrium?
The student recorded the following data.
(v) Calculate the net force acting on the metre stick.(vi) Calculate the total clockwise moment about a vertical axis of the metre stick.(vii) Calculate the total anti-clockwise moment about a vertical axis of the metre stick.(viii) Use these results to verify the laws of equilibrium
36
position on metre stick/cm 11.5 26.2 38.3 70.4 80.2magnitude of force/N 2.0 4.5 3.0 5.7 4.0direction of force down up down up down

5. [2013]The laws of equilibrium for a set of co-planar forces acting on a metre stick were investigated by a student. She first found the centre of gravity of the metre stick and then determined its weight as 1.3 N.(i) How did the student find the centre of gravity of the metre stick? (ii) The centre of gravity was at the 50.3 cm mark rather than the mid-point of the metre stick. Explain.(iii) The metre stick was suspended from two spring balances graduated in newtons. The student made use of a set of
three weights, which she hung from the metre stick. She adjusted them until the metre stick was at equilibrium. How did the student ensure that the system was at equilibrium?
(iv) Draw a diagram of the experimental arrangement that the student used.
The student recorded the positions of the forces acting on the metre stick and the direction in which each force was acting.
Taking the moments of the forces about the mid-point of the metre stick (50 cm mark), use the student’s data to calculate(v) the total of the clockwise moments(vi) the total of the anti-clockwise moments.(vii) Explain how these results verify the laws of equilibrium.
Solutions1.(i) It was level / horizontal / no movement.(ii) As in the diagram, but there should also be the weight of the metre stick (1.2 N) shown at the 50 cm mark.(iii) 20.2 N(iv) 15 + 4 + 1.2 = 20.2 N(v) The sum of forces is zero / the upward forces = the downward forces(vi) Moment = F × d: (0.3 × 10) + (0.9 × 10.2) = 12.18 N m(vii) Moment = F × d: (0.27 × 4) + (0.5 × 1.2) + (0.7 × 15) = 12.18 N m(viii) The sum of the moments is zero (sum of clockwise moments = sum of anti-clockwise moments)
2.(i) Using a newton-balance(ii) See diagram(iii) 9 + 12.5 = 21.5 N(iv) 5 + 15 + 1.5 = 21.5 N(v) Forces are equal // sum of acting forces is zero // forces up = forces
down(vi) (9)(0.2) + (12.5)(0.9) = 1.8 + 11.25 = 13.05 N m(vii) (5)(0.36) + (1.5)(0.5) + (0.7)(15) = 1.8 + 0.75 + 10.5 = 13.05 N m (viii) moments are equal // sum of the moments equals zero
37
Position of force on metre stick / cm
11.4 21.8 30.3 65.4 80.0
Force / N 2.0 3.0 5.7 4.6 4.0Direction downward downward upward upward downward

3.(i) Up = 2 +4 = 6 (N)
Down = 2 +1 +1.8 + 1.2 = 6 (N)(ii) The vector sum of the forces in any direction is zero (forces up = forces down).(iii) Moment = force × distance
Sum of anticlockwise moments = 2.8 N mSum of clockwise moments = 2.8 N m
(iv) The sum of the moments about any point is zero.(v) Hang the metre stick on a string and adjust the position until the metre stick balances.
Note the position.(vi) Moment of a force = force × perpendicular distance, so if the readings on the metre stick are to correspond to
these perpendicular distances then the metre stick must be perpendicular to the spring balances, and if the metre stick is horizontal then the spring balances should be vertical.
4.(i) By hanging the metre stick on a thread support and adjusting the position of the thread until the metre stick
remained horizontal.(ii) By putting it on an electronic balance.(iii) The material is not of perfectly uniform density.(iv) The metre stick was at rest.(v) Fup = 4.5 + 5.7 = 10.2 N and Fdown = 2 + 3 +1.2 +4 = 10.2 N net force = 0 (vi) (through zero) Moment = 2(0.115) + 3(0.383) +1.2(0.504) +4.0(0.802) = 0.23+1.149+0.6048+3.208 = 5.2 N m (vii) (through zero) Moment = 4.5(0.262) +5.7(0.704) = 5.1918 N m = 5.2 N(viii) Fup = Fdown
Total clockwise moments = Total anti-clockwise moments
5.(i) Balanced (horizontally) at a point (fulcrum) / suspended (horizontally) from a string (ii) Metre stick not uniform / stick chipped / extra material on one end (iii) The system was not moving(iv) Similar to diagram (metre stick horizontal and suspended from two spring
balances) but with three weights suspended from stick (v) Moment = force ×distance (= F × d)
(5.7 × 0.197) + (1.3 × 0.003) + (4.0 × 0.3) = 1.1229 + 0.0039 + 1.2 = 2.3268 N m
(vi) (2.0 × 0.386) + (3.0 × 0.282) + (4.6 × 0.154) = 0.772 + 0.846 + 0.7084 = 2.3264 N m
(vii) Forces up = forces down (= 10.3 N) total clockwise moments ≈ total anticlockwise moments
38

INVESTIGATION OF THE RELATIONSHIP BETWEEN PERIODIC TIME AND LENGTH FOR A SIMPLE PENDULUM AND HENCE CALCULATION OF g
1. [2012]In an experiment to measure the acceleration due to gravity using a simple pendulum, a student obtained values for the length l of the pendulum and the corresponding values for the periodic time T.The student plotted the following points, based on the recorded data.
(vii) Describe how the student obtained a value for the length of the pendulum and its corresponding periodic time.
(viii) Draw the appropriate graph on this examination paper and use it to calculate a value for g, the acceleration due to gravity.
(ix) Give two factors that affect the accuracy of the measurement of the periodic time.
2. [2008]A student investigated the relationship between the period and the length of a simple pendulum. The student measured the length l of the pendulum. The pendulum was then allowed to swing through a small angle and the time t for 30 oscillations was measured. This procedure was repeated for different values of the length of the pendulum. The student recorded the following data:
l /cm 40.0 50.0 60.0 70.0 80.0 90.0 100.0 t /s 38.4 42.6 47.4 51.6 54.6 57.9 60.0
(i) Why did the student measure the time for 30 oscillations instead of measuring the time for one? (ii) How did the student ensure that the length of the pendulum remained constant when the pendulum was swinging? (iii) Using the recorded data draw a suitable graph to show the relationship between the period and the length of a
simple pendulum. (iv) What is this relationship? (v) Use your graph to calculate the acceleration due to gravity.
3. [2006]In investigating the relationship between the period and the length of a simple pendulum, a pendulum was set up so that it could swing freely about a fixed point. The length l of the pendulum and the time t taken for 25 oscillations were recorded. This procedure was repeated for different values of the length.The table shows the recorded data.
l/cm 40.0 50.0
60.0 70.0 80.0
90.0 100.0
t/s 31.3 35.4
39.1 43.0 45.5
48.2 50.1
The pendulum used consisted of a small heavy bob attached to a length of inextensible string.(i) Explain why a small heavy bob was used.(ii) Explain why the string was inextensible.(iii) Describe how the pendulum was set up so that it swung freely about a fixed point.(iv) Give one other precaution taken when allowing the pendulum to swing.(v) Draw a suitable graph to investigate the relationship between the period of the simple pendulum and its length. (vi) What is this relationship? (vii) Justify your answer.
39
40

Solutions1.(i) Length: Measure length (l) from fixed point to top of bob (using metre stick) Measure diameter/radius Length = l + r (stated or implied) Reference to metre rule and Vernier calipers (or micrometer)
Periodic time: measure time for n oscillations Divide (total time) by n(ii) See graph
Correct method for slope (–1 if (0,0) chosen as point on graph)
Slope: 3.47 m 4.14
g = 9.5 g 11.0 m s–2
(iii) Number of oscillations selected / the precision of the timer / repetition (of measurement for average) / smaller % error in T with longer lengths / nature of the string e.g. ‘inextensible string’
2.(i) To reduce percentage error in measuring the periodic time.(ii) Use an inextensible string, string suspended at fixed point (e.g. split
cork or two coins) (iii) See graph {remember to convert length to metres and to also to
square t}(iv) t2 is proportional to l (v) Slope = 0.25 (ms–2) [range: 0.24 – 0.25 m s–2] g = 9.72 m s–2 [range: 9.4 – 9.9 m s–2]
3.(i) To reduce air resistance and to keep the string taut(ii) So that length remains constant because length would be another variable. (iii) The string was placed between two coins (or a split cork). (iv) Make sure that there are no draughts / make sure it oscillates in one plane only.(v) Draw a suitable graph {remember to convert length to metres and to also to square t}
Values of t divided by 25 to get T Axes correctly labelled T2 vs. l At least six points plotted correctly Straight line drawn Good distribution (about straight line)
(vi) T2 is proportional to l (vii) The graph resulted in a straight line through the origin
41
time for 25 swings /s 31.3 35.4 39.1 43.0 45.5 48.2 time for 1 swing/s 1.25 1.42 1.56 1.72 1.82 1.93 t2/s2 1.57 2.01 2.45 2.96 3.31 3.72 l/m .40 .50 .60 .70 .80 .90

TO CALIBRATE A THERMOMETER USING THE LABORATORY MERCURY THERMOMETER AS A STANDARD
1. [2012 OL]You carried out an experiment to establish the calibration curve of a thermometer.
(i) Describe, with the aid of a diagram, the procedure you used in the experiment. (ii) Name the thermometric property of the thermometer you calibrated and describe how the value of this property
was measured. (iii) The following table shows the data obtained in an experiment to establish the calibration curve of a thermometer.
Using the data in the table, draw a graph on graph paper to establish the calibration curve. Put temperature on the horizontal axis.
(iv) Use your calibration curve to determine the temperature when the value of the thermometric property is 60.
2. [2007 OL]A student carried out an experiment to obtain the calibration curve of a thermometer.The following is an extract from her report.I placed the thermometer I was calibrating in a beaker of water along with a mercury thermometer which I used as the standard. I recorded the value of the thermometric property of my thermometer and the temperature of the water as shown on the mercury thermometer. I repeated this procedure at different temperatures. The following is the table of results that I obtained.
(i) Draw a labelled diagram of the apparatus used in the experiment.(ii) Using the data in the table, draw a graph on graph paper of the value of the thermometric property against its
temperature. Put temperature on the horizontal axis (X-axis). (iii) Use your graph to estimate the temperature when the value of the thermometric property is 50.(iv) Give an example of a thermometric property. (v) How was the value of this thermometric property measured?
42
Temperature/ 0C 0 20 40 60 80 100Value of thermometric property
5 14 29 48 80 130
Temperature/°C 0 20 40 60 80 100Value of thermometric property 4 12 24 40 64 150

Solution
1. (i) Dagram to show: container and water thermometer (in water) // temperature sensor heat source; hot plate / Bunsen
record at least two thermometric property measurements detail e.g. stirrer, ruler, 2nd thermometer, means of recording thermometric property, datalogger, etc.
(ii) length of column of mercury: measure length with ruler Resistance (of thermistor): measure resistance with ohmmeter etc.
(iii)
(iv) 70 +- 3 0C
2.(i) See diagram(ii) See graph
(iii)
700 C {Accept 68 – 72 0C} (iv) Length of a column of liquid/ Resistance / emf / voltage / colour / volume / pressure, etc.(v) Metre stick/ / ohmmeter / multimeter etc.
43

MEASUREMENT OF THE SPECIFIC HEAT CAPACITY OF WATER
1. [2010 OL]A student carried out an experiment to measure the specific heat capacity of a substance.The following is an extract from her report.“I set up the apparatus. I took a series of measurements before I heated the substance. I then took further measurements. I used these measurements to find the specific heat capacity of the substance.”
(i) Draw a labelled diagram of the apparatus used in the experiment.(ii) Describe how the mass of the substance was determined. (iii) What other measurements did the student take during the experiment? (iv) Give the formula used to calculate the specific heat capacity of the substance. (v) Give a precaution that the student should have taken to get an accurate result.
2. [2004 OL]In a report of an experiment to measure the specific heat capacity of a substance (e.g. water or a metal), a student wrote the following.“I assembled the apparatus needed for the experiment.During the experiment I took a number of measurements of mass and temperature.I used these measurements to calculate the specific heat capacity of the substance.”(i) Draw a labelled diagram of the apparatus used. (ii) What measurements of mass did the student take during the experiment?(iii) What temperature measurements did the student take during the experiment?(iv) Give a formula used to calculate the specific heat capacity of the substance. (v) Give one precaution that the student took to get an accurate result.
3. [2007]The specific heat capacity of water was found by adding hot copper to water in a copper calorimeter. This was not the method most students would have used to carry out the experiment so there was much annoyance when it appeared on the paper. Nevertheless it does differentiate between those students who understand the underlying principles and those who have just learned off a formula.
The following data was recorded:
(ii) Describe how the copper was heated and how its temperature was measured.
(iii) Using the data, calculate the energy lost by the hot copper(iv) Using the data, calculate the specific heat capacity of water. (v) Give two precautions that were taken to minimise heat loss to the surroundings.(vi) Explain why adding a larger mass of copper would improve the accuracy of the experiment.
44
mass of calorimeter 55.7 gmass of calorimeter + water 101.2 gmass of copper + calorimeter + water 131.4 ginitial temperature of water 16.5 oCtemperature of hot copper 99.5 oCfinal temperature of water 21.0 oC
Solutions
1.(i) See diagram:(ii) mass of calorimeter and warm water - mass of calorimeter (iii) initial/minimum temperature
final/maximum temperaturejoules supplied mass of calorimeter
(iv) E = mcΔθ (v) Initial temperature below room temperature (to help
compensate for heat loss), repeat and get an average, insulate, etc.
2.(i) See diagram above(ii) Mass of calorimeter, mass of calorimeter + water, (iii) Initial temperature of water, final temperature of water.(iv) Energy supplied = (mcΔθ)cal + (mcΔθ)water where Δθ is the change in temperature and ccal is known.(v) Lagging, use sensitive thermometer, ensure that heating coil is completely immersed in the liquid, stir the liquid,
large temperature change, etc.
3.(i) It was heated using a hot-plate and temperature was measured using a thermometer.(ii) E = mcΔθ
E = (3.02 × 10⁻²)(390)(78.5) = 924.6 J(iii) Heat lost by hot copper = heat gained by calorimeter + water
924.57 = (0.0557)(390)(4.5) + (0.0455)(cw)(4.5) 924.57 = 97.75 + 0.2048 cw cw = 4.04 ×10³ J kg-1 K-1
(iv) Insulate calorimeter /use lid /transfer copper pieces quickly / use cold water (below room temperature) / polish calorimeter / low heat capacity thermometer
(v) A larger mass of copper would result in a larger temperature change and therefore smaller percentage error.
45

MEASUREMENT OF THE SPECIFIC LATENT HEAT OF FUSION OF ICE
1. [2003 OL][2009 OL][2013 OL][2014 OL]In a report of an experiment to measure the specific latent heat of fusion of ice, a student wrote the following.“Ice at 0 0C was added to water in a calorimeter.When the ice had melted measurements were taken.The specific latent heat of fusion of ice was then calculated.”(i) Draw a labelled diagram of the apparatus used.(ii) What measurements did the student take before adding the ice to the water?(iii) What did the student do with the ice before adding it to the water?(iv) How did the student know the ice was at 0 0C?(v) How did the student find the mass of the ice?(vi) Why did the student use warm water in the experiment?(vii) Give one precaution that the student took to get an accurate result.(viii) How was the ice crushed? (ix) Why was the ice crushed? (x) Why was the experiment repeated?
2. [2008]In an experiment to measure the specific latent heat of fusion of ice, warm water was placed in a copper calorimeter. Dried, melting ice was added to the warm water and the following data was recorded.
Mass of calorimeter 60.5 g Mass of calorimeter + water 118.8 g Temperature of warm water 30.5 oC Mass of ice 15.1 g Temperature of water after adding ice 10.2 oC
(vi) Explain why warm water was used. (vii) Why was dried ice used?(viii) Why was melting ice used? (ix) Describe how the mass of the ice was found.(x) What should be the approximate room temperature to minimise experimental error? (xi) Calculate the energy lost by the calorimeter and the warm water.(xii) Calculate the specific latent heat of fusion of ice.
3. [2002]In an experiment to measure the specific latent heat of fusion of ice, warm water was placed in an aluminium calorimeter. Crushed dried ice was added to the water. The following results were obtained.
Mass of calorimeter.......................................= 77.2 gMass of water.................................................= 92.5 gInitial temperature of water...........................= 29.4 0CTemperature of ice ........................................= 0 0CMass of ice.....................................................= 19.2 gFinal temperature of water.............................= 13.2 0CRoom temperature was 21 0C.
(i) What was the advantage of having the room temperature approximately halfway between the initial temperature of the water and the final temperature of the water?
(ii) Describe how the mass of the ice was found. (iii) Calculate a value for the specific latent heat of fusion of ice(iv) The accepted value for the specific latent heat of fusion of ice is 3.3 × 10⁵ J kg-1; suggest two reasons why your
answer is not this value.
46
mass of calorimeter 55.7 gmass of calorimeter + water 101.2 gmass of copper + calorimeter + water 131.4 ginitial temperature of water 16.5 oCtemperature of hot copper 99.5 oCfinal temperature of water 21.0 oC
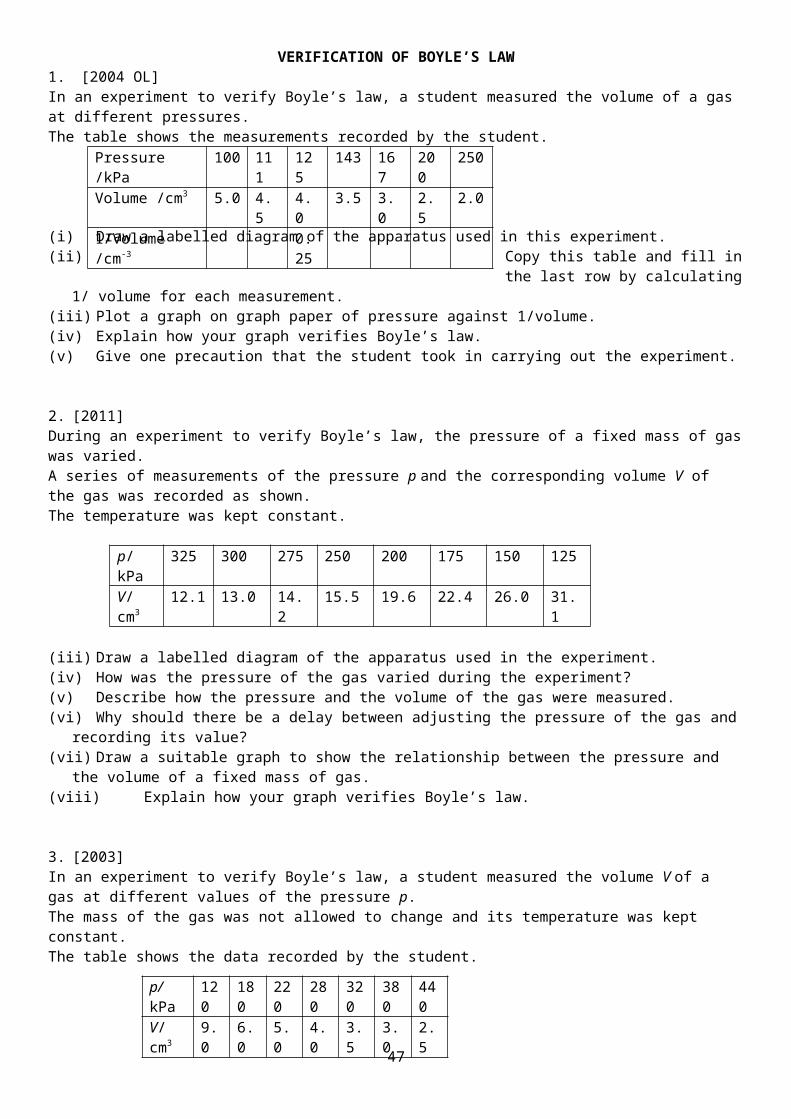
Solutions1.(i) See diagram
(ii) Mass of calorimeterMass of calorimeter and warm waterMass of calorimeter and warm water and iceTemperature of water beforeTemperature of water and melted ice after
(iii) It was crushed and then dried.(iv) By using melting ice.(v) (mass of calorimeter + water + ice) – (mass of calorimeter + water)(vi) So that the heat lost to the environment when the system is above room temperature is balanced by the heat taken
in from the environment when the system is below room temperature.(vii) Insulation, crush, dry, repeat and take average, use lots of ice, transfer ice quickly.(viii) place in a plastic bag/towel and hit with a hammer // blended(ix) to ensure all the ice is 0 °C // crushed ice melts faster // reference to larger surface area (x) increase accuracy // to get average
2.(i) To speed up the melting of the ice / in order to melt a larger mass of ice / (concept of) balancing energy losses
before and after the experiment.(ii) To remove any water/melted ice // melted ice would have already gained latent heat //so that only ice is added // so
that no water is added (iii) Melting ice is at 0 oC. (iv) Final mass of calorimeter + contents minus mass of calorimeter + water.(v) 20 0C / midway between initial and final temperatures (of the water in the calorimeter) (vi) {energy lost = } (mcΔθ )cal + (mcΔθ )warm water = (0.0605)(390)(20.3) + (0.0583)(4200)(20.3) = 5449.6365 / 5449.6 J (vii) {Energy gained by ice and by melted ice =} (ml)ice + (mcΔθ )melted ice / (0.0151)l + (0.0151)(4200)(10.2) / 0.0151 l + 646.884 (equate:) 0.0151 l + 646.884 = 5449.6365 l = 3.181 × 10⁵ ≈ 3.2 × 10⁵ J kg–1
3. (i) Heat lost to surroundings when the system is above room temperature would cancel out the heat taken in from the
surroundings when the system was below room temperature.(ii) Final mass (of calorimeter + water + ice) - initial mass (of calorimeter + water)(iii) mcΔθAl + mcΔθwater = mlice +mcΔθmelted ice
Fall in temperature = 16.2 oC Ans = 3.2 × 10⁵ J kg-1
(iv) Thermometer not sensitive enough, lack of insulation, lack of stirring, heat loss/gain to surroundings, too long for ice to melt, inside of calorimeter tarnished, splashing, heat capacity of thermometer
47

MEASUREMENT OF THE SPECIFIC LATENT HEAT OF VAPORISATION OF WATER
1. [2005 OL]In a report of an experiment to measure the specific latent heat of vaporisation of water, a student wrote the following.“Steam at 100 oC was added to cold water in a calorimeter.When the steam had condensed, measurements were taken.The specific latent heat of vaporisation of water was then calculated.”(i) Draw a labelled diagram of the apparatus used. (ii) List two measurements that the student took before adding the steam to the water.(iii) How did the student find the mass of steam that was added to the water?(iv) How did the student make sure that only steam, and not hot water, was added to the calorimeter?(v) Give one precaution that the student took to prevent heat loss from the calorimeter.
2. [2011 OL]During an experiment to measure the specific latent heat of vaporisation of water, cold water was placed in an insulated copper calorimeter. Dry steam was passed into the water causing a rise in temperature of the water and the calorimeter. The following data were recorded.Mass of calorimeter = 73.40 gMass of cold water = 67.50 gInitial temperature of water + calorimeter = 10 0CTemperature of steam = 100 0CMass of steam added = 1.03 gFinal temperature of water + calorimeter = 19 0C
(i) Draw a labelled diagram of the apparatus used in the experiment.(ii) What was the rise in temperature of the water in the experiment? (iii) Describe how the mass of the cold water was found. (iv) How was the steam dried? (v) Calculate:(a) the heat gained by the water and the calorimeter(b) the heat lost by the condensed steam(c) the latent heat of vaporisation of water. (specific heat capacity of copper = 390 J Kg−1 K−1 ; specific heat capacity of water = 4180 J Kg−1 K−1)
3. [2010]In an experiment to measure the specific latent heat of vaporisation of water, a student used a copper calorimeter containing water and a sensitive thermometer. The water was cooled below room temperature before adding dry steam to it. The following measurements were recorded.
Mass of copper calorimeter = 34.6 gInitial mass of calorimeter and water = 96.4 gMass of dry steam added = 1.2 gInitial temperature of calorimeter and cooled water = 8.2 °CFinal temperature of calorimeter and water = 20.0 °C
(vi) How was the water cooled below room temperature?(vii) How was the steam dried?(viii) Describe how the mass of the steam was determined.(ix) Why was a sensitive thermometer used?(x) Using the data, calculate the specific latent heat of vaporisation of water.
48

4. [2005]In an experiment to measure the specific latent heat of vaporisation of water, cool water was placed in an insulated copper calorimeter. Dry steam was added to the calorimeter. The following data was recorded.
Mass of calorimeter = 50.5 gMass of calorimeter + water = 91.2 gInitial temperature of water = 10 oCTemperature of steam = 100 oCMass of calorimeter + water + steam = 92.3 gFinal temperature of water = 25 oC
(i) Calculate a value for the specific latent heat of vaporisation of water. (ii) Why was dry steam used? (iii) How was the steam dried? (iv) A thermometer with a low heat capacity was used to ensure accuracy. Explain why.
5. [2003]In an experiment to measure the specific latent heat of vaporisation of water, cold water was placed in a copper calorimeter. Steam was passed into the cold water until a suitable rise in temperature was achieved. The following results were obtained:
Mass of the calorimeter........................... = 73.4 gMass of cold water .................................. = 67.5 gInitial temperature of water..................... = 10 °CTemperature of the steam........................ = 100 °CMass of steam added ............................... = 1.1 gFinal temperature of water ...................... = 19 °C
(i) Describe how the mass of the steam was found.(ii) Using the data, calculate a value for the specific latent heat of vaporisation of water. (iii) Why is the rise in temperature the least accurate value? (iv) Give two ways of improving the accuracy of this value.
49

Solutions1.(i) See diagram.(ii) Mass of calorimeter, mass of water, mass of calorimeter + water,
initial temperature of water, initial temperature of steam.(iii) Final mass of water + calorimeter minus initial mass of water +
calorimeter.(iv) Allow steam to flow for some time before inserting it into water,
slope delivery tube back to steam generator, use a steam trap. (v) Lagging, insulation, lid, carry out measurements quickly.
2.(i) See diagram above(ii) 19 – 10 = 90 C(iii) (mass of calorimeter and cold water) - (mass of calorimeter)(iv) Using a steam trap or having the delivery tube sloping upward.a) mwcwΔθw+ mcccΔθc
(0.0675)(4180)(9) + (0.0734)(390)(9)= 2539.4 + 257.6 = 2797 J
b) mcscwΔθcs = (0.00103)(4180)(81) = 348.7 Jc) (1.03×10⁻³)( lv) = 2797 - 348.7
(1.03×10⁻³)( lv) = 2448 lv = 2.37 × 10⁶ J kg-1
3.(i) Ice was added to the water / the water was taken from fridge(ii) By using a steam trap (or ensure that the delivery tube is sloped upwards)(iii) Final mass of calorimeter plus contents – initial mass of calorimeter and contents(iv) For greater accuracy / to reduce (%) error / more significant figures / e.g. to read to 0.1 oC (v) ms = 1.2×10⁻³ kg mw = 6.18 × 10⁻² kg Δθs = 80 (K) and Δθw (= Δθcu) = 11.8 (K)
[heat lost by steam = heat gained by water and calorimeter] (ml)s + (mcΔθ )s = (mcΔθ )w + (mcΔθ )cu
(1.2×10⁻³)l + (1.2×10⁻³)(4180)(80) = (6.18 × 10⁻²)(4180)(11.8) + (3.46 × 10⁻²)(11.8)(390)(1.2×10⁻³)l + 401.3 = 3048.2 + 159.2
l = 2.34 × 10⁶ J Kg-1
4.(i) mslw + mscwΔθs = mwcwΔθw+ mcccΔθc
Δθs = 75 0C and Δθw (= Δθc) = 15 0C (0.0011) lw + (0.0011)(4200)(75) = (0.0407)(4200)(15) + (0.0505)(390)(15) [(0.0011) lw + 346.5 = 2564.1 + 295.425] lw = 2.28 × 10⁶ J kg-1
(ii) Calculations assume that only steam is added, not water.(iii) Use a steam trap / insulated delivery tube / sloped delivery tube / allow steam to issue freely initially(iv) It absorbs little heat from system in calorimeter and calculations assume that no energy is transferred to the
thermometer.
5.(i) Final mass of (calorimeter + water + condensed steam) – Initial mass of (calorimeter + water)(ii) (ml) steam + (mc∆ϑ) steam = (mc∆ϑ) water + (mc∆ϑ) cal
∆ϑwater = 90C, ∆ϑcal= 90C∆ϑ) steam = 810CAnswer = 2.2 × 10⁶ J kg-1
(iii) Read only to one significant figure {the concept of significant figures is not on the syllabus and shouldn’t have got asked. It hasn’t appeared since.]
(iv) Use a digital thermometer, use more steam, use less water, insulation, cover, stirring, steam trap
50

51

TO MEASURE THE SPEED OF SOUND IN AIR1. [2011 OL][2008 OL][2003 OL]You carried out an experiment to measure the speed of sound in air by measuring the frequency and wavelength of a sound wave.(i) Draw a labelled diagram of the apparatus that you used.(ii) How did you find the frequency of the sound wave? (iii) How was the wavelength of the sound wave measured? (iv) How did you use the measurements to calculate the speed of the sound wave?(v) Why should you repeat the experiment?
2. [2006]A cylindrical column of air closed at one end and three different tuning forks were used in an experiment to measure the speed of sound in air. A tuning fork of frequency f was set vibrating and held over the column of air.The length of the column of air was adjusted until it was vibrating at its first harmonic and its length l was then measured. This procedure was repeated for each tuning fork.Finally, the diameter of the column of air was measured. The following data was recorded.Diameter of column of air = 2.05 cm.(ii) Describe how the length of the column of air was adjusted.(iii) Describe how the frequency of the column of air was measured.(iv) Describe how the diameter of the column of air was measured. (v) How was it known that the air column was vibrating at its first harmonic?(vi) Using all of the data, calculate the speed of sound in air.
3. [2014]A student used a cylindrical column of air closed at one end and a tuning fork of frequency 512 Hz in an experiment to measure the speed of sound in air.The following data was recorded:
Length of column of air for first position of resonance = 16.2 cmDiameter of air column = 1.15 cm
(i) Draw a labelled diagram of the apparatus used in the experiment.(ii) Describe how the first position of resonance was found. (iii) Using the recorded data, calculate the speed of sound in air. (iv) Why was it necessary to measure the diameter of the air column?
(v) Another student carried out the experiment. She measured the length of the column of air for each of the first two positions of resonance but she did not measure the diameter of the air column.Explain how this second student would find the speed of sound in air.
52
f/Hz 512 480 426l/cm 16.0 17.
219.4

Solutions1.(i) See diagram(ii) We adjusted the length of the inner tube until resonance occurred.
We then read the frequency from the tuning fork which was used to create the sound wave.
(iii) We measured the diameter of the inner tube using digital callipers (d).We measured the length of the inner tube above the water (l).We then used the formula λ = 4(l + 0.3d) to calculate the wavelength.
(iv) Substituted frequency and wavelength into the formula c=f λ(v) Get an average to ensure greater accuracy
2.(i) The inner pipe was raised while immersed in water.(ii) The frequency was read from the tuning fork which caused the vibration.(iii) Using a digital calipers (iv) The inner tube was raised until a loud sound could be heard. (v) v = f λ
λ = 4( l +0.3 d) v1 = 340(.3) m s-1; v2 = 342(.0) m s-1 ; v3 = 341(.1) m s-1
vavg = 341(.13) m s-1
3.(i) See diagram above: (Vibrating) tuning fork , Column of air
Means of changing length of column / metre stick and callipers(ii) Hold (vibrating) fork over column
Increase length of column (from zero) Until (loudest) sound is heard (from column)
(iii) v = 4f(l + 0.3d) v = 4f(0.16545) v = 338.8 m s–1
(iv) Because the wave exists partially above the top of the tube(v) Find distance between first two positions of resonance / l2 – l1
Double this distance for wavelength / λ = 2 (l2-l1) Multiply wavelength by frequency (for speed) / (v =) fλ
53

INVESTIGATION OF THE VARIATION OF FUNDAMENTAL FREQUENCY OF A STRETCHED STRING WITH LENGTH
1. [2006 OL]A student carried out an experiment to investigate how the fundamental frequency of a stretched string varied with its length. The following is an extract from her report.I set the string vibrating and adjusted its length until it was vibrating at its fundamental frequency. I then recorded the length of the vibrating string and its fundamental frequency. I repeated this procedure for different lengths of the stretched string.Finally, I plotted a graph of the fundamental frequency of the vibrating string against the inverse of its length.(ii) Draw a labelled diagram of the apparatus used in the experiment. Indicate on your diagram the length of the string that was measured. (iii) Describe how the student set the string vibrating.(iv) How did the student know that the string was vibrating at its fundamental frequency?(v) Draw a sketch of the graph expected in this experiment.
2. [2014 OL]An experiment was set up to investigate how the fundamental frequency of a stretched string varied with its length. The length, l, of the string and its fundamental frequency, f, were recorded. The procedure was repeated for different values of f and l.(i) Draw a labelled diagram of the apparatus used in the experiment. (ii) Indicate on your diagram the length of the string that was measured. (iii) Describe how the string could have been set vibrating. (iv) How was the frequency determined?
The following results were recorded during the experiment.
(v) Copy and complete the table into your answer book. (vi) Draw a graph on graph paper of f on the X-axis against 1/l on the Y-axis. (vii) What conclusion can be drawn from your graph?
3. [2002 OL)In a report of an experiment to investigate the variation of fundamental frequency of a stretched string with length, a student wrote the following. “The wire was set vibrating at a known frequency. The length of the wire was adjusted until it vibrated at its fundamental frequency. The length was recorded. A different frequency was applied to the wire and new measurements were taken. This procedure was repeated a few times.” (i) How was the wire set vibrating? (ii) How was the length adjusted? The table shows the measurements recorded by the student.
(iii) Copy the table and complete the last row by calculating 1/ length1for each measurement.
(iv) Plot a graph on graph paper of fundamental frequency against 1/ length. Put fundamental frequency on the vertical axis.
(v) What does the graph tell you about the relationship between fundamental frequency and length?
54
f (Hz) 256 288 320 341 384 480l (m) 0.80 0.71 0.64 0.60 0.53 0.431/l (m-1)
f (Hz) 650 395 290 260 192 174 163length/ (m) 0.20 0.33 0.4
50.50 0.6
60.75 0.80
1/length (m-1)

4. [2009 OL]In an experiment, a student investigated the variation of the fundamental frequency f of a stretched string with its length l. During the experiment the student kept the tension in the string constant. The table shows the data recorded by the student.(i) Describe, with the aid of a diagram, how the
student obtained the data. (ii) Why was the tension in the string kept constant
during the experiment?(iii) Copy this table and fill in the last row by calculating 1/l for each measurement. (iv) Plot a graph on graph paper to show the relationship between the fundamental frequency and the length of the
stretched string (put 1/l on the X-axis). (v) What does your graph tell you about the relationship between the fundamental frequency of a stretched string and
its length?
5. [2012]In an experiment to investigate the variation of the fundamental frequency f of a stretched string with its length l, the following data were recorded.
(i) How was the data obtained?(ii) Using the data, draw a
suitable graph on graph paper to show the relationship between the fundamental frequency of the stretched string and its length.
(iii) The fundamental frequency of a stretched string depends on factors other than its lengthName on these factors and give its relationship with the fundamental frequency.(iv) If you were doing an experiment to establish the relationship between the fundamental frequency of a stretched
string and this other factor, how would you obtain the relevant data?
55
f/Hz 100 150 200 250 300 350 400l/m 0.50 0.33 0.25 0.20 0.166 0.142 0.1251/l (m− 1) 7.04
f/Hz 95 102 114 126 141 165 194 232l/m 0.603 0.553 0.503 0.453 0.403 0.353 0.303 0.253

Solutions1.(i) See diagram.(ii) By turning on the signal generator.(iii) The paper rider starts to vibrate
vigorously.(iv) See diagram.
2.(i) tuning fork(s) // signal generator
bridge(s) and metre stick / detail // bridges and magnet (ii) distance between bridges indicated(iii) place a vibrating tuning fork on bridge // send signal from signal generator through
it(iv) read off the tuning fork(v) See table(vi) Graph:(vii) f and l are inversely proportional
3.(i) See diagram above. We used a signal generator in series with a metal wire which
had a magnet around it.(ii) By moving the position of one of the bridges.(iii) See table
(iv) See graph(v) The straight line through the origin shows that frequency is inversely proportional
to length.
56
f (Hz) 256 288 320 341 384 480l (m) 0.80 0.71 0.64 0.60 0.53 0.431/l (m-1) 1.25 1.41 1.56 1.67 1.89 2.33
1/l (m-1) 5.0 3.0 2.2 2.0 1.5 1.3 1.25
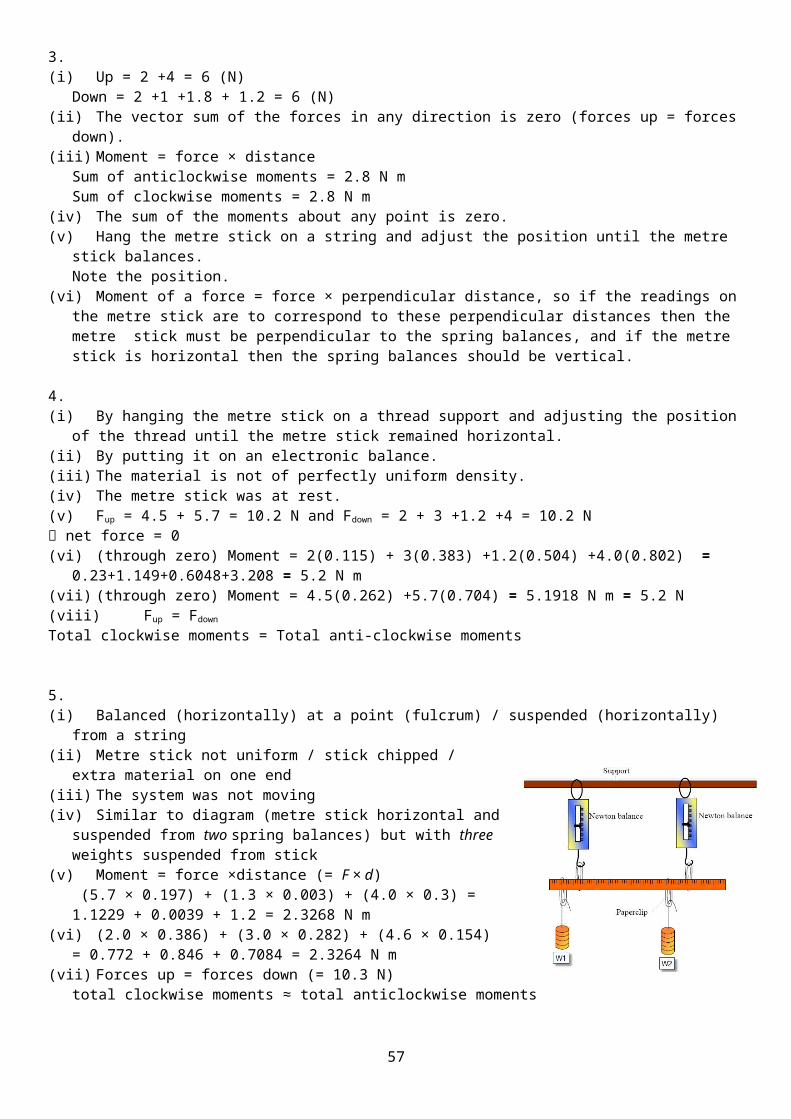
4.(i) See diagram aboveAdjust frequency until the paper rider falls off (resonance occurs)Record the frequency on the signal generator and measure the length between the bridges.Adjust the distance between the bridges and repeat.(ii) Because frequency also depends on tension and you can only
investigate the relationship between two variables at a time.(iii) See table
(iv) See graph(v) Fundamental frequency is inversely proportional to length
5.(i) Arrangement: see diagram above vibrating fork placed on bridge adjust length until resonance occurs /rider falls measure length (between nodes / bridges) repeat with forks of different frequencies (ii)
(iii)Tension: Frequency is proportional to the square root of tension.
Mass per unit area: Frequency is proportional to 1/√μ(iv) Find resonance for a fork f by changing tension Method for changing/measuring tension // keep l fixed Repeat for forks of different frequencies
57
1/l (m− 1) 2.00 3.03 4.00 5.00 6.02 7.04 8.00
1/length 1.66 1.81 1.99 2.21 2.48 2.83 3.30 3.95
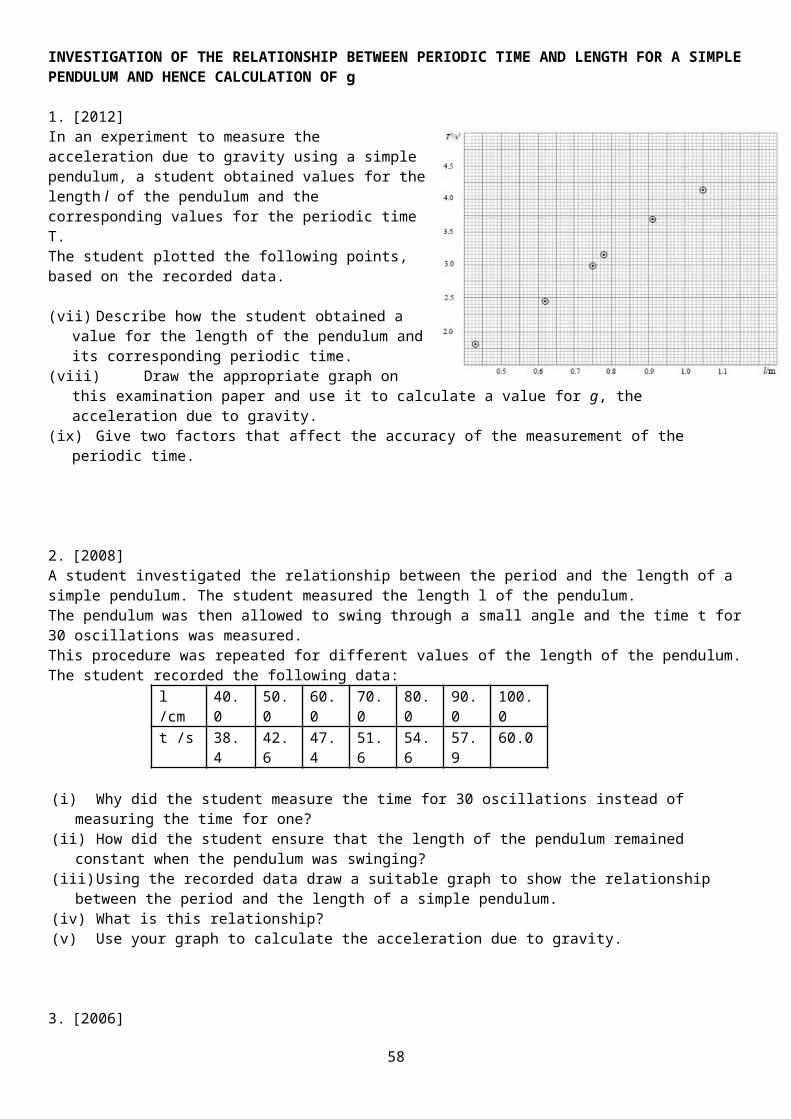
INVESTIGATION OF THE VARIATION OF FUNDAMENTAL FREQUENCY OF A STRETCHED STRING WITH TENSION
1. [2004]A student investigated the variation of the fundamental frequency f of a stretched string with its length l.(v) Draw a labelled diagram of the apparatus used in this experiment. Indicate on the diagram the points between
which the length of the wire was measured.
The student drew a graph, as shown, using the data recorded in the experiment, to illustrate the relationship between the fundamental frequency of the string and its length.(vi) State this relationship and explain how the graph verifies it.(vii) The student then investigated the variation of the fundamental frequency f of the
stretched string with its tension T. The length was kept constant throughout this investigation.
How was the tension measured? (viii) What relationship did the student discover? (ix) Why was it necessary to keep the length constant? (x) How did the student know that the string was vibrating at its fundamental frequency?
2. [2009]A student investigated the variation of the fundamental frequency f of a stretched string with its tension T. The following is an extract of the student’s account of the experiment.“I fixed the length of the string at 40 cm. I set a tuning fork of frequency 256 Hz vibrating and placed it by the string. I adjusted the tension of the string until resonance occurred. I recorded the tension in the string. I repeated the experiment using different tuning forks.”(i) How was the tension measured? (ii) How did the student know that resonance occurred?
The following data were recorded.
(iii) Draw a suitable graph to show the relationship between the fundamental frequency of a stretched string and its tension.
(iv) State this relationship and explain how your graph verifies it.(v) Use your graph to estimate the fundamental frequency of the string when its tension is 11 N(vi) Use your graph to calculate the mass per unit length of the string.
3. [2002]A student obtained the following data during an investigation of the variation of the fundamental frequency f of a stretched string with its tension T. The length of the string was kept constant.
(i) Describe, with the aid of a diagram, how the student obtained the data.
(ii) Why was the length of the string kept constant during the investigation? (iii) Plot a suitable graph on graph paper to show the relationship between fundamental frequency and tension for the
stretched string. From your graph, estimate the tension in the string when its fundamental frequency is 380 Hz.
58
f /Hz 256 288 320 341 384 480 512T /N 2.4 3.3 3.9 4.3 5.7 8.5 9.8
T/N 15 20 25 30 35 40 45f /Hz
264 304 342
371 402 431
456
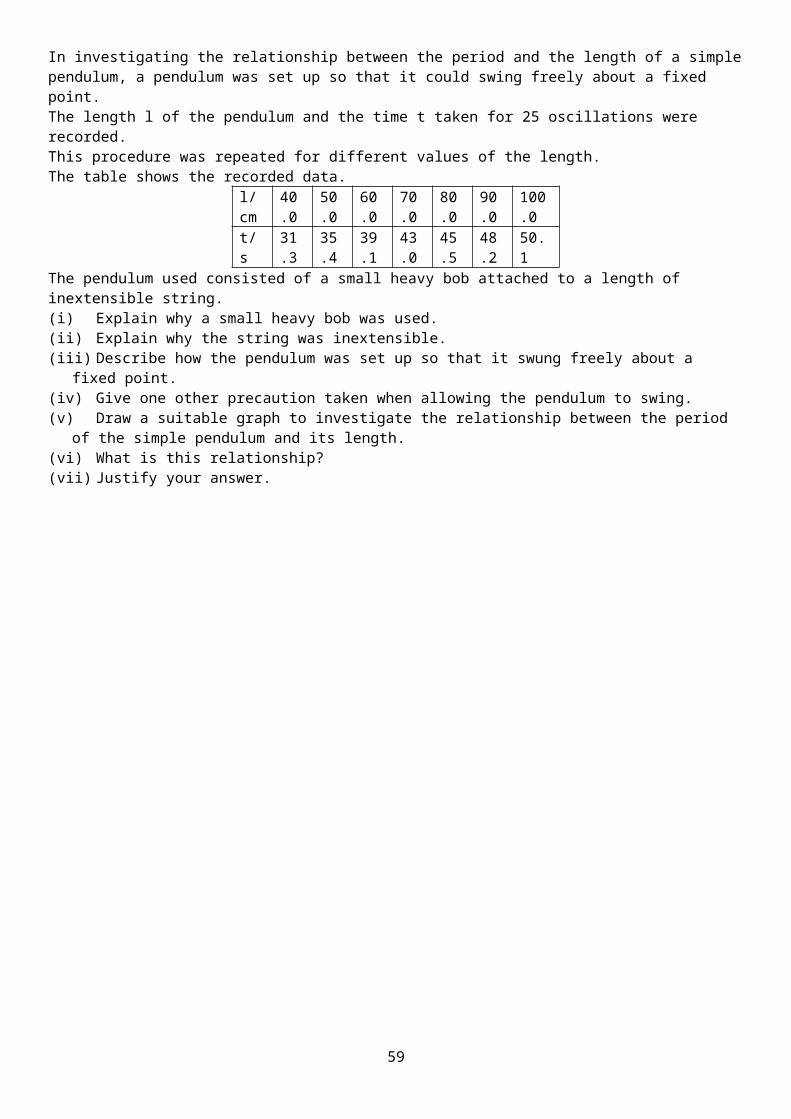
Solutions1.(i) See diagram(ii) f is proportional to 1/l.A straight line through the origin verifies this.(iii) Using a newton-balance / pan with weights /
suspended weights (iv) Frequency is proportional to Tension.(v) Because length is a third variable and you can only
investigate the relationship between two variables at a time.
(vi) The paper rider on the string falls off.
2.(i) A newton balance // weight of pan + contents (ii) Paper rider jumped vigorously / the string vibrated at maximum amplitude (iii)
Six correct values for T Both axes correctly labelled Six points correctly plotted Straight line with a good fit
(iv) f is proportional to square root of T because the graph was a straight line through the origin.(v) If tension is 11 N T = 3.32 Use the graph to get f = 542 Hz(vi)
Compare to the formula y = mx slope = 1/(2lμ), where l = 0.4 mMass per unit length (μ) = 5.86 × 10⁻⁵ kg m–1
3.(i)
Slowly increase the frequency on the signal generator until resonance occurs. Note the frequency on the signal generator and the tension on the Newton balance. Change tension and repeat. (ii) Because length is a third variable and you can only investigate the relationship between two variables at a time.(iii) Square root of tension / frequency squared Label axesPlot 6 points correctlyStraight lineGood fit(iv) At a frequency of 380 the square root of tension = 5.6 T = 30.3 N
59
f= 12l √T
μ
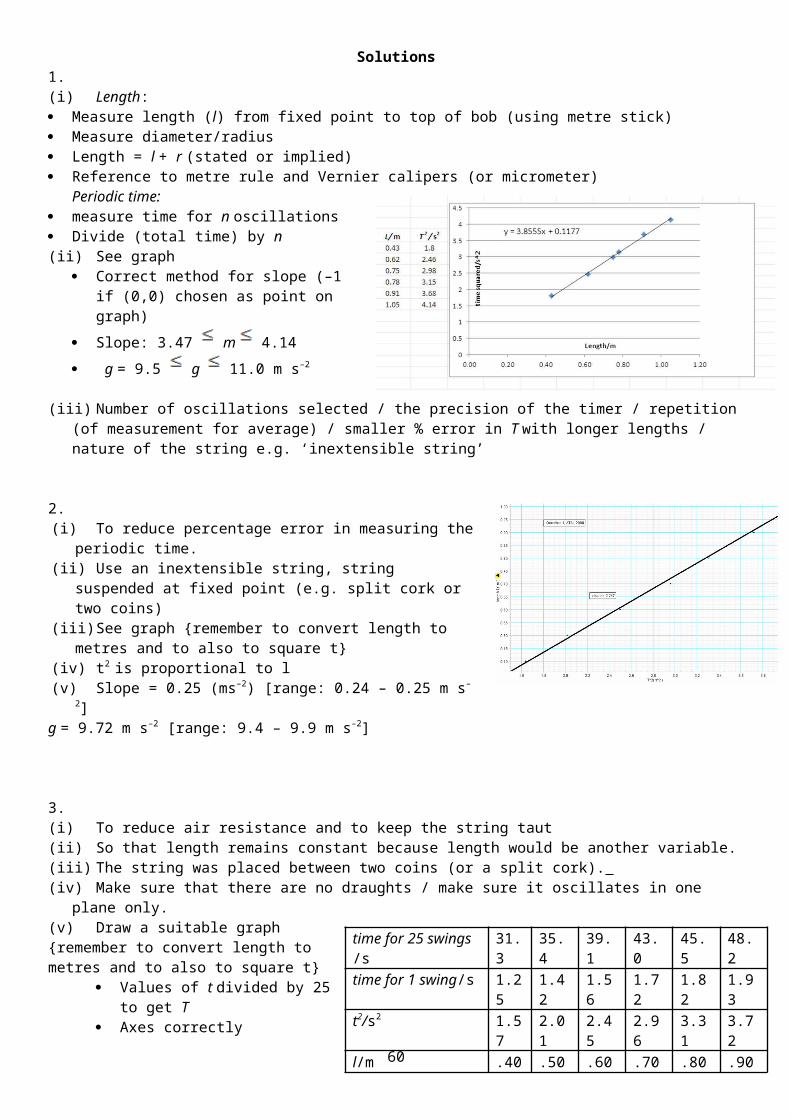
MEASUREMENT OF THE WAVELENGTH OF MONOCHROMATIC LIGHT
1. [2007 OL]You carried out an experiment to measure the wavelength of a monochromatic light source using a diffraction grating. The diffraction grating had 600 lines per mm.(i) Draw a labelled diagram of the apparatus you used. (ii) Name a source of monochromatic light. (iii) State what measurements you took during the experiment. (iv) What is the distance between each line on the diffraction grating? (v) How did you determine the wavelength of the light? (vi) Give one precaution that you took to get an accurate result.
2. [2004 OL]You carried out an experiment to measure the wavelength of a monochromatic light source.(i) Name a monochromatic light source. (ii) Draw a labelled diagram of the apparatus that you used in the experiment. (iii) What readings did you take during the experiment?(iv) What formula did you use to calculate the wavelength of the light?(v) Give one precaution that you took to get an accurate result.
3. [2011]In an experiment to measure the wavelength of a monochromatic light source, a narrow beam of light was incident normally on a diffraction grating having 400 lines per mm.A number of bright images were observed. The angles θ between the central bright image and the first two images to the left and right of it were measured and recorded in a table, as shown.
(ii) Name a source of monochromatic light.(iii) Describe, with the aid of a diagram, how the data were obtained.(iv) Using the data, calculate the wavelength of the monochromatic light. (24)(v) What effect would each of the following changes have on the bright images formed:(v) using a monochromatic light source of longer wavelength(vi) using a diffraction grating having 200 lines per mm(vii) using a source of white light instead of monochromatic light?
4. [2009 Section B](i) An interference pattern is formed on a screen when green light from a laser passes normally through a diffraction
grating. The grating has 80 lines per mm and the distance from the grating to the screen is 90 cm. The distance between the third order images is 23.8 cm.Calculate the wavelength of the green light.
(ii) Calculate the maximum number of images that are formed on the screen. (iii) The laser is replaced with a source of white light and a series of spectra are formed on the screen.
Explain how the diffraction grating produces a spectrum.(iv) Explain why a spectrum is not formed at the central (zero order) image.
60
2nd image to leftof central image
1st image to leftof central image
1st image to rightof central image
2nd image to rightof central image
θ / ° 30.98 14.90 14.81 31.01

5. [2008]In an experiment to measure the wavelength of monochromatic light, a diffraction pattern was produced using a diffraction grating with 500 lines per mm. The angle between the first order images was measured. This was repeated for the second and the third order images. The table shows the recorded data:
(i) Draw a labelled diagram of the apparatus used in the experiment.
(ii) Explain how the first order images were identified. (iii) Describe how the angle between the first order images was measured. (iv) Use the data to calculate the wavelength of the monochromatic light.
6. [2006]In an experiment to measure the wavelength of monochromatic light, a narrow beam of the light fell normally on a diffraction grating. The grating had 300 lines per millimetre. A diffraction pattern was produced. The angle between the second order image to the left and the second order image to the right of the central bright image in the pattern was measured.The angle measured was 40.60.(i) Describe, with the aid of a labelled diagram, how the data was obtained. (ii) How was a narrow beam of light produced? (iii) Use the data to calculate the wavelength of the monochromatic light. (iv) Explain how using a diffraction grating of 500 lines per mm leads to a more accurate result. (v) Give another way of improving the accuracy of this experiment.
7. [2004]In an experiment to measure the wavelength of monochromatic light, the angle θ between a central bright image (n = 0) and the first and second order images to the left and the right was measured. A diffraction grating with 500 lines per mm was used.The table shows the recorded data.
n 2 1 0 1 2θ /degrees 36.2 17.1 0 17.2 36.3
(i) Describe, with the aid of a diagram, how the student obtained the data. (ii) Use all of the data to calculate a value for the wavelength of the light. (iii) Explain how using a diffraction grating with 100 lines per mm leads to a less accurate result.(iv) The values for the angles on the left of the central image are smaller than the corresponding ones on the right.
Suggest a possible reason for this.
61
Angle between first order images
Angle between second order images
Angle between third order images
34.20 71.60 121.60

Solutions1.(i) See diagram(ii) The laser(iii) Distance from grating to screen
Distance between dots on the screen(iv) 600 lines per mm = 600000 lines per metre.
d = (1/ number of lines per metre) = (1/600000) = 1.67 × 10⁻⁶ m.(v) Using the formula nλ = d sin , where d was d was calculated
above, n was the order of the dots on either side and corresponded to the angle shown in the diagram.
(vi) Ensure that the diffraction grating is perpendicular to the (monochromatic) light, use a grating with a large number of lines, ensure D is large, repeat for different orders and take the average, etc.
2.(i) A laser or a sodium lamp.(ii) See diagram.(iii) Distance from grating to screen
Distance between dots on the screen(iv) nλ = d sin (v) Ensure that the diffraction grating is perpendicular to the (monochromatic) light, use a grating with a large number
of lines, ensure D is large, repeat for different orders and take the average, etc.
3.(i) Sodium lamp / laser(ii)
Set up as shown on diagram above. Measure the distance between the n = 0 and the n= 1 images. Measure the distance D Tan ϴ = x/D Repeat for all orders on both sides
(iii) n = d Sin d = 1/400,000λavg = 642.3 nm
(iv)1. Larger ϴ therefore the images would be more spaced out.2. Smaller ϴ therefore the images would be closer together.3. Each image would be a spectrum of white light.
4.(i) d = 1/80000 = 1.25 × 10⁻⁵ m
= tan-1 (0.238/0.90) Technically the .238 should have been divided by 2, because it represents the distance between the third order images either side of the central image, but they gave full marks either way).n = 3n = d sin = d sin /n = 551 (± 5) × 10-9 m.
(ii) For maximum number = 900 sin = 1n = d sin n = d n = d/ n = 22.7 so the greatest whole number of images is 22. But this is on one side only. In total there will be 22 on either side, plus one in the middle, so total = 45
(iii) Different colours have different wavelengths so constructive interference occurs at different positions for each separate wavelength.
(iv) At central image = 0 so constructive interference occurs for all separate wavelengths at the same point so no separation of colours.
5.
62

(i) See diagram. Plus metre stick(ii) Nearest on either side of the central (zero order) image. (iii) Measure x between 1st order images
Measure D from screen to grating = tan-1 (x/D)
(iv) Use nλ = d sinθ(n=1) λ = sin (17.1)/[(5 × 105)(1)] = 5.8808 × 10⁻⁷ ≈ 5.88 × 10⁻⁷m(n=2) λ = sin (35.8)/[(5 × 105)(2)] = 5.8496 × 10⁻⁷ ≈ 5.85 × 10⁻⁷m(n=3) λ = sin (60.8)/[(5 × 105)(3)] = 5.8195 × 10⁻⁷ ≈ 5.82 × 10⁻⁷mλ = 5.85 × 10⁻⁷ m = 585 nm
6.(i) The apparatus was set up as shown.
To get a value for the distance x was measured between the centre image and the second order image, then the distance D between grating and screen was measured. = Tan-1 (x/D)We did the same for the other side and got an average value for .
(ii) Use a laser. (iii) nλ = d sin θ
n = 2 d = 1/(3.00 x105) m = 3.33 x 10⁻⁶ m = 3.33 x 10⁻³ cm = 1/300 mmθ = 20.30
λ = 5.78 x 10⁻⁷ m (= 578 ≈ 580 nm) (iv) This would result in a greater angle for each order image and therefore a smaller percentage error in measuring the
angle. (v) Repeat and get average value for the wavelength , repeat for higher orders.
7.(i) See diagram, plus metre stick.
Measure distance x from central fringe for n = ±1, ±2 Measure distance D from grating to screen and calculate θ in each case using tan θ = x/D
(ii) nλ = d sinθ d = 1/500000 d = 2 × 10⁻⁶
n=1, λL= 588.1 nm, λR= 591.4 nm n=2, λL= 590.6 nm, λR= 592.0 nmCalculated average wavelength = 590 nm.
(iii) It would result in a smaller value for which would mean larger percentage errors.(iv) The grating may not be perpendicular to the incident light
63

TO MEASURE THE RESISTIVITY OF THE MATERIAL OF A WIRE
1. [2010 OL]In an experiment to determine the resistivity of the material of a wire, a student measured the length, diameter and resistance of a sample of nichrome wire.The table shows the data recorded by the student.
(iv) Describe how the student measured the resistance of the wire.(v) Describe how the length of the wire was measured. (vi) What instrument did the student use to measure the diameter of the wire? (vii) Why did the student measure the diameter of the wire at different places?(viii) Using the data, calculate the cross-sectional area of the wire. (ix) Find the resistivity of nichrome.
2. [2005 OL]In an experiment to measure the resistivity of the material of a wire, a student measured the length, diameter and the resistance of a sample of nichrome wire.The table shows the measurements recorded by the student.
(i) Describe how the student measured the resistance of the wire.(ii) Name the instrument used to measure the diameter of the wire.(iii) Why did the student measure the diameter of the wire in three
different places? (iv) Using the data, calculate the diameter of the wire.(v) Hence calculate the cross-sectional area of the wire. (vi) Calculate the resistivity of nichrome.(vii) Give one precaution that the student took when measuring the length of the wire.
3. [2009]In an experiment to measure the resistivity of nichrome, the resistance, the diameter and appropriate length of a sample of nichrome wire were measured.The following data were recorded:Resistance of wire = 7.9 ΩLength of wire = 54.6 cmAverage diameter of wire = 0.31 mm(i) Describe the procedure used in measuring the length of the sample of wire. (ii) Describe the steps involved in finding the average diameter of the wire. (iii) Use the data to calculate the resistivity of nichrome. (iv) The experiment was repeated on a warmer day. What effect did this have on the measurements?
4. [2004] The following is part of a student’s report of an experiment to measure the resistivity of nichrome wire.“The resistance and length of the nichrome wire were found. The diameter of the wire was then measured at several points along its length.”The following data was recorded.
Resistance of wire = 32.1 ΩLength of wire = 90.1 cmDiameter of wire = 0.19 mm, 0.21 mm, 0.20 mm, 0.21 mm, 0.20 mm
(i) Name an instrument to measure the diameter of the wire and describe how it is used. (ii) Why was the diameter of the wire measured at several points along its length? (iii) Using the data, calculate a value for the resistivity of nichrome. (iv) Give two precautions that should be taken when measuring the length of the wire.
64
R/Ω 20.2
l/cm 48.8
d/mm 0.21 0.20 0.18
resistance of the wire/ Ω 26.4
length of the wire /mm 685
diameter of the wire /mm 0.20 0.19 0.21

Solutions1.(i) Ohmmeter / (digital) multimeter / measure V and I and hence determine R (ii) Ensure the wire is taut and measure the length between the crocodile clips using a metre-stick.(iii) Micrometer / digital callipers(iv) To get average (diameter) as wire may not be uniform (v) Average diameter = 0.197 mm r = 0.0001m
A = π(0.1 × 10⁻³)2
A = 3.03 – 3.14 × 10⁻⁸ m2
(vi) Ƿ = RA/lǷ = (20.2)(3.14 × 10⁻⁸)/(0.488)Ƿ = 1.25 – 1.29 × 10⁻⁶ Ω m)
2.(i) Using an multimeter set to measure resistance, the ends of the multimeter wire were connected to the ends of the
wire in question.(ii) A digital callipers.(iii) To calculate an average diameter because the diameter of the wire is not uniform. (iv) Average diameter = (0.20 + 0.19 + 0.21)/3 diameter = 0.60 ÷ 30 diameter = 20 mm (v) r = 0.1 mm = 0.0001 m
A = πr2 A = π (0.0001)2
A = 3.14 × 10⁻⁸ m2
(vi) ρ = (26.4)( 3.14 × 10⁻⁸) ÷ 0.685 ρ = 1.21 × 10⁻⁶ Ω m.
(vii) Avoid parallax error when using metre stick, keep wire straight (no kinks), measure only the length of wire between leads to ohmmeter.
3.(i) Straighten the wire, clamp it to a bench and measure the distance between the points for which the resistance
was measured.(ii)
Zero the micrometer / digital callipers Place wire between jaws Tighten jaws and take reading Repeat at different points on wire Get average diameter
(iii) A = πr2 A = π(0.155 × 10⁻³)2 = 7.55 × 10⁻⁸ m2
= RA/l = (7.9)(7.55 × 10⁻⁸)/0.546) = 1.09 × 10⁻⁶ m(iv) Resistance increased / length increased (or wire expands) / diameter increased
4.(i) Digital callipers
Place the wire between the jaws Tighten the jawsRead the callipers
(ii) To get an average because the material is not of uniform density.(iii) Average diameter = 0.202 mm
A = πr 2 = 3.2 ×10⁻⁸ m2 ρ =RA/Lρ = (32.1)(3.2 × 10⁻⁸)/0.901)ρ = 1.1×10⁻⁶ Ω m
(iv) Ensure no kinks in wire, only measure length whose R value was measured, avoid parallax error, etc.
65

TO INVESTIGATE THE VARIATION OF THE RESISTANCE OF A METALLIC CONDUCTOR WITH TEMPERATURE
1. [2006 OL]In an experiment to investigate the variation of resistance with temperature for a metallic conductor in the form of a wire, a student measured the resistance of the conductor at different temperatures. The table shows the measurements recorded by the student.(i) How did the student measure the
resistance of the wire? (ii) Describe, with the aid of a diagram, how
the student varied the temperature of the wire. (iii) Using the data in the table, draw a graph on graph paper of the resistance of the conductor against its temperature.
Put temperature on the horizontal axis (X-axis). (iv) Use the graph to estimate the temperature of the conductor when its resistance is 50 Ω.(v) What does your graph tell you about the relationship between the resistance of a metallic conductor and its
temperature?
2. [2008]A student investigated the variation of the resistance R of a metallic conductor with its temperature θ. The student recorded the following data.(i) Describe, with the aid of a labelled diagram, how the data
was obtained. (ii) Draw a suitable graph to show the relationship between the resistance of the metal conductor and its temperature. (iii) Use your graph to estimate the resistance of the metal conductor at a temperature of –20 oC.(iv) Use your graph to estimate the change in resistance for a temperature increase of 80 oC.(v) Use your graph to explain why the relationship between the resistance of a metallic conductor and its temperature
is linear.
66
Temperature / oC 20 30 40 50 60 70 80Resistance / Ω 45.
649.2 52.8 57.6 60.0 63.6 68.4
θ/oC 20 30 40 50 60 70 80 R/Ω 4.6 4.9 5.1 5.4 5.6 5.9 6.1
Solutions1.(i) By using a multimeter set to measure resistance.(ii) See diagram.
The temperature was varied by allowing the wire to be heated.(iii) See graph
(iv) Use the graph to estimate the temperature of the conductor when its resistance is 50 Ω.(v) What does your graph tell you about the relationship between the resistance of a metallic conductor and its
temperature?
2.(i) The resistance was read from the ohmmeter, the temperature was read from the thermometer and the readings
were varied using the heat source. See diagram(ii) See graph(iii) Continue (extrapolate) the graph on the left hand side and then read off the resistance value that corresponds to the
temperature of – 20 0C. R = 3.6 Ω
(iv) y-intercept value ≈ 4.12 Ω change in resistance ≈ 2 Ω(v) A straight line is obtained.
67

TO INVESTIGATE THE VARIATION OF THE RESISTANCE OF A THERMISTOR WITH TEMPERATURE
1. [2009 OL]In an experiment to investigate the variation of the resistance R of a thermistor with its temperature θ, a student measured the resistance of the thermistor at different temperatures.The table shows the measurements recorded by the student.
θ/ 0C 20 30 40 50 60 70 80R/Ω 2000 1300 800 400 200 90 40
(i) Draw a labelled diagram of the apparatus used in this experiment. (ii) How did the student measure the resistance of the thermistor? (iii) Plot a graph on graph paper to show the relationship between the resistance R of the thermistor and its temperature
θ (put θ on the X-axis). (iv) Use your graph to estimate the temperature of the thermistor when its resistance is 1000 Ω. (v) What does your graph tell you about the relationship between the resistance of a thermistor and its temperature?
2. [2002 OL][2013 OL]The circuit diagram shows a thermistor connected to a meter M. A student used the circuit to measure the resistance R of the thermistor at different temperatures θ. (i) Name the meter M used to measure the resistance of the thermistor. (ii) Explain, with the aid of a labelled diagram, how the student varied the temperature of the
thermistor.(iii) How did the student measure the temperature of the thermistor?(iv) The table shows the measurements recorded by the
student.Draw a graph on graph paper of resistance R against temperature θ. Put temperature on the horizontal axis.(v) Using your graph, estimate the temperature of the thermistor when the meter M read 740 Ω.
3. [2010]In an experiment to investigate the variation of the resistance R of a thermistor with its temperature θ, a student measured its resistance at different temperatures.The table shows the measurements recorded.
(iii) Draw a labelled diagram of the apparatus used.(iv) How was the resistance measured?(v) Describe how the temperature was varied.(vi) Using the recorded data, plot a graph to show the variation of the resistance of a thermistor with its temperature.(vii) Use your graph to estimate the average variation of resistance per Kelvin in the range 45 °C – 55 °C.(viii) In this investigation, why is the thermistor usually immersed in oil rather than in water?
68
/ 0C 20 30 40 50 60 70 80 90R/ Ω 1300 900 640 460 340 260 200 150
θ /°C 20 30 40 50 60 70 80R/Ω 2000 1300 800 400 200 90 40
Solutions1.(i) See diagram(ii) Using an ohmmeter as shown(iii) See graph(iv) 35 0C to 36.50 C(v) Resistance goes down with increased temperature and the
relationship is not linear.
2.(i) Ohmmeter(ii) The apparatus was placed over a hot plate which heated the water
and then the glycerol and the thermistor.(iii) Using a thermometer.(iv) See graph(v) 35 0C.
3.(i) Thermistor, thermometer in waterbath/oil, thermistor connected to labelled ohmmeter/(digital) multimeter(ii) The thermistor is connected to the ohmmeter and the value of the resistance was read from the ohmmeter.(iii) By allowing the apparatus to heat up over a bunsen burner.(iv) Label axes correctly on graph paper
Plot six points correctlySmooth curve Good distribution
(v) Range: 28↔ 32 Ω (0C–1) or Ω (K–1) (vi) Oil is a better conductor of heat / water contains air / (impure) water conducts electricity/good thermal contact
69

TO INVESTIGATE THE VARIATION OF CURRENT (I) WITH POTENTIAL DIFFERENCE (V) FOR A THIN METALLIC CONDUCTOR
1. [2013]A student was asked to investigate the variation of current with potential difference for a thin metallic conductor. The student set up a circuit using appropriate equipment. The student recorded the values of the current I passing through the conductor for the corresponding values of potential difference V. The recorded data are shown in the table.
(i) Draw and label the circuit diagram used by the student.(ii) Name the device in the circuit that is used to vary the potential difference across the conductor.(iii) Explain how the student used this device to vary the potential difference. (iv) Use the data in the table to draw a graph on graph paper to show the variation of current with potential difference. (v) Use your graph to find the value of the resistance of the conductor when the current is 0.7 A. (vi) Explain the shape of your graph.
70
V/V 1.0 2.0 3.0 4.0 5.0 6.0I/A 0.17 0.34 0.50 0.64 0.77 0.88

1.(i) apparatus: p.s.u. / battery, ammeter, voltmeter
ammeter in series with conductorvoltmeter in parallel with conductor
(ii) Variable p.s.u. / variable resistor (rheostat) / potential divider (iii) Rotated the dial, moved the sliding contact(iv) See graph(v) V ≈ 4.5 V (when I = 0.7 A on graph)
R ≈ 6.4 Ω (vi) Resistance (of conductor) increases with increasing
temperature Or appropriate reference to Ohm‟s law and to resistance
71

TO INVESTIGATE THE VARIATION OF CURRENT (I) WITH POTENTIAL DIFFERENCE (V) FOR A FILAMENT BULB
1. [2011 OL] The diagram shows a circuit used to investigate the variation of current with potential difference for a filament lamp.
(i) Name the instrument X. What does it measure?(ii) Name the component Y. What does it do?
The table shows the values recorded for the current and the potential difference during the investigation.
Potential difference/ V 1 2 3 4 5 6 7Current/A 0.9 1.6 2.1 2.5 2.8 3.0 3.1
(iii) Draw a graph, on graph paper, of the current against the potential difference.(iv) What does your graph tell you about the variation of current with potential difference for a filament lamp? (v) Using your graph, calculate the resistance of the lamp when the potential difference across the lamp is 5.5 V.
2. [2003 OL]The diagram shows the circuit used by a student to investigate the variation of current with potential difference for a filament bulb.(i) Name the apparatus X. What does it measure? (ii) Name the apparatus Y. What does it do?
The table shows the values obtained for the current and the potential difference during the experiment.
Potential difference /V 2.0 3.0 4.0 5.0 6.0 7.0
8.0 9.0
Current /A 1.0 1.5 1.9 2.3 2.6 2.9
3.2 3.5
(iii) Draw a graph, on graph paper, of the current against the potential difference. (iv) Use your graph to find the resistance of the bulb when the current is 3 A. (v) The resistance of the bulb is 2.0 Ω when the current is 1.5 A
Explain why the resistance of the bulb when the current is 1.5 A is different from its resistance when the current is 3 A.
3. [2005]A student investigated the variation of the current I flowing through a filament bulb for a range of different values of potential difference V.
(i) Draw a suitable circuit diagram used by the student. (ii) Describe how the student varied the potential difference. (iii) The student drew a graph, as shown, using data recorded in the
experiment.With reference to the graph, explain why the current is not proportional to the potential difference.
(iv) With reference to the graph, calculate the change in resistance of the filament bulb as the potential difference increases from 1 V to 5 V.
72

(v) Give a reason why the resistance of the filament bulb changes.
73

Solutions1.(i) Voltmeter/multimeter - measures
voltage (ii) Rheostat / (variable) resistor /
potential divider / potentiometerChanges resistance / voltage / current
(iii) See graph(iv)The relationship between current
and potential difference for a filament lamp is non linear / not proportional
(v) R = 5.5 ÷ 2.9 = 1.9 ± 0.2 Ω
2.(i) X is an ammeter. It measures current.(ii) Y is a voltmeter. It measures volts.(iii) See graph(iv) When the current is 3 A the voltage is 7.2 V, so using V = IR results in R = 2.4 .(v) Because the resistance of the bulb increases with temperature, and temperature is greater when the current is
greater.
3.(i) See diagram(ii) By adjusting the voltage on the power supply.(iii) Because the graph is not a straight line.(iv) At 1 V: R = V/I = 1/0.028 = 35.7 Ω
At 5 V: R = (5/0.091) = 54.9 Ω Change in resistance (= 54.9 – 35.7) = 19.2 Ω
(v) As current increases the temperature of filament increases, therefore the filament gets hotter and it gets more difficult for electrons to pass through due to increased vibration of the metal atoms.
74
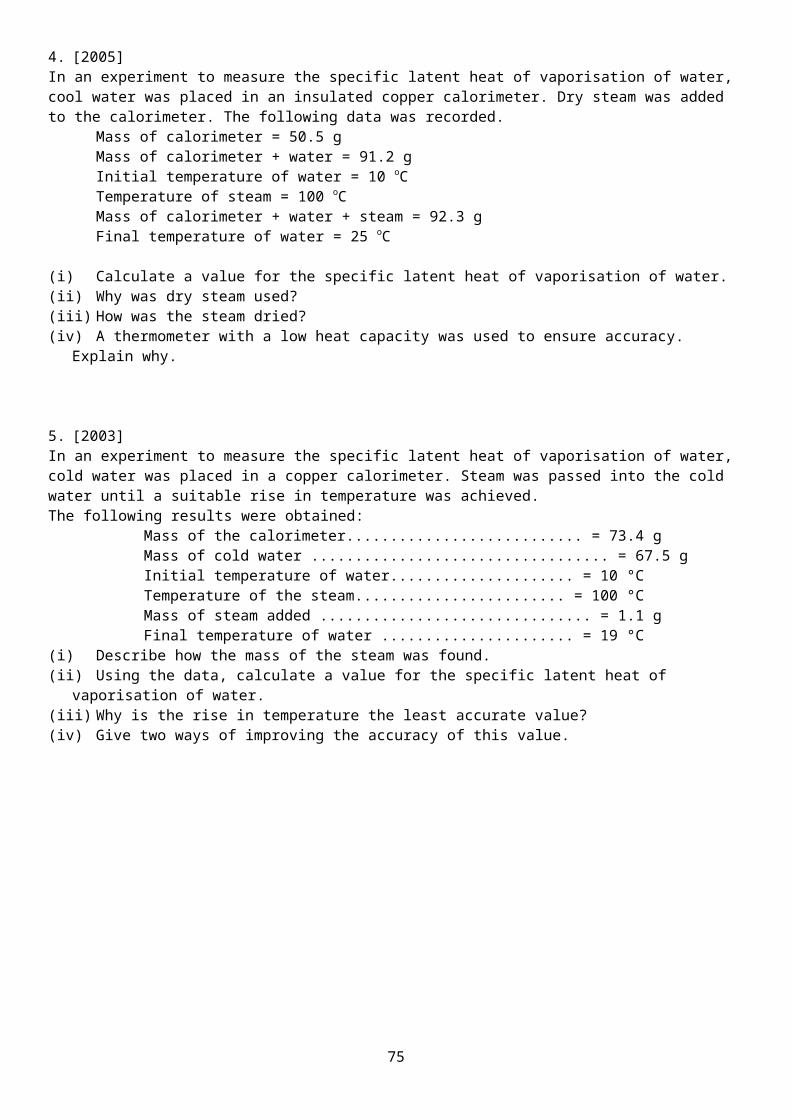
TO INVESTIGATE THE VARIATION OF CURRENT (I) WITH POTENTIAL DIFFERENCE (V) FOR COPPER ELECTRODES IN A COPPER-SULPHATE SOLUTION
1. [2012 OL]In an experiment to investigate the variation of current I with potential difference V for a copper sulfate solution, the following apparatus was used.
(i) Name the instrument X. (ii) Name the apparatus Y and give its function in the
experiment. (iii) How was the potential difference measured in the
experiment?
The following table shows the values recorded for the current I and the corresponding potential difference V during the experiment.
(iv) Using the data in the table, draw a graph on graph paper to show the variation of current with potential difference. (v) Calculate the slope of your graph.(vi) Use this value to determine the resistance of the copper sulfate solution.
2. [2004 OL]The diagram shows a circuit used to investigate the variation of current with potential difference for a copper sulfate solution.
(i) Name the instrument used to measure the current.(ii) How was the potential difference measured in the experiment?(iii) Name the apparatus Y and give its function in the experiment.
The following table shows the values recorded for the current and the potential difference during the experiment.
Using the data in the table, draw a graph on graph paper of the current against the potential difference. Put current on the horizontal axis.
(iv) Calculate the slope of your graph and hence determine the resistance of the copper sulphate solution.
3. [2011]A student investigated the variation of the current I through an electrolyte as the potential difference V across the electrolyte was changed. The electrolyte used was a solution of copper sulfate. The electrodes used were made of copper.The student recorded the following data:
(i) Draw a suitable circuit diagram for this investigation and label the components.(ii) How was the potential difference changed during the investigation? (iii) Draw a suitable graph to show the relationship between the current and the potential difference in this
investigation.(iv) Use your graph to calculate the resistance of the electrolyte. (v) What was observed at the electrodes as current flowed through the electrolyte?
75
V/V 0 1.0 2.0 3.0 4.0 5.0 6.0I/A 0 0.4 0.8 1.2 1.6 2.0 2.4
Potential Difference /V 0 0.5 1.0 1.5 2.0 2.5 3.0Current /A 0 0.3 0.6 0.9 1.2 1.5 1.8
V/V 0 1 2 3 4 5 6I/mA 0 30 64 93 122 160 195

4. [2002]In an experiment to investigate the variation of current I with potential difference V for a copper sulfate solution, the following results were obtained.
(i) Draw a diagram of the apparatus used in this experiment, identifying the anode and the cathode.
(ii) Draw a suitable graph on graph paper to show how the current varies with the potential difference. (iii) Using your graph, calculate the resistance of the copper sulfate solution. (Assume the resistance of the electrodes
is negligible.)(iv) Draw a sketch of the graph that would be obtained if inactive electrodes were used in this experiment.
76
V /V 0.5 1.0 1.5 2.0 2.5 3.0 3.5 4.0 4.5 5.0I /mA
24 48 79 102 120 143 185 195 215 263
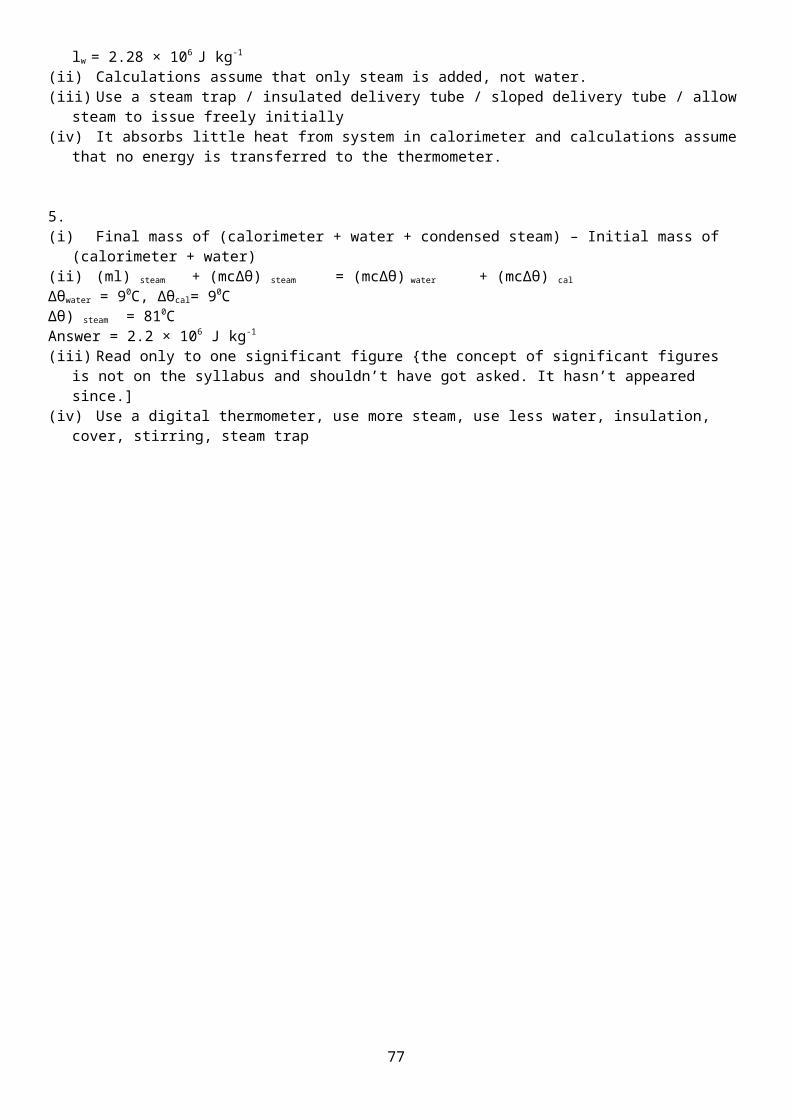
Solutions1.(i) X is an ammeter.(ii) Y is a potentiometer; it is used to vary the voltage.(iii) Using a voltmeter(iv) See graph(v)
slope=y2− y1
x2−x1=5−0
2−0
slope = 2.5
(vi) R = 2.5 Ω
2.(i) An ammeter(ii) Using a voltmeter.(iii) Y is a rheostat which is a variable resistor; by adjusting it you
vary the resistance which in turn varies the resistance and current.
(iv) See graph
(v) Take any two points and use the formula
Slope = resistance = 1.67 Ω.
3.(i) power suppy unit, ammeter, voltmeter, electrolyte,
electrodes(ii) Adjust the dial / selector on the variable power supply unit
(or adjust the rheostat).(iii) See graph(iv) Slope = 0.0323
R = 1/slope = 30.96 Ω(v) The cathode got heavier / coated with fresh copper
The anode got lighter
77

4.(i) See diagram. Cathode = negative electrode, anode = positive electrode(ii) Axes labelled
6 points plotted correctly Straight line Good fit
(iii) Resistance = slope of graph = 19.5 to 20.5 Ohms(iv) Straight line starting at v > 0
78
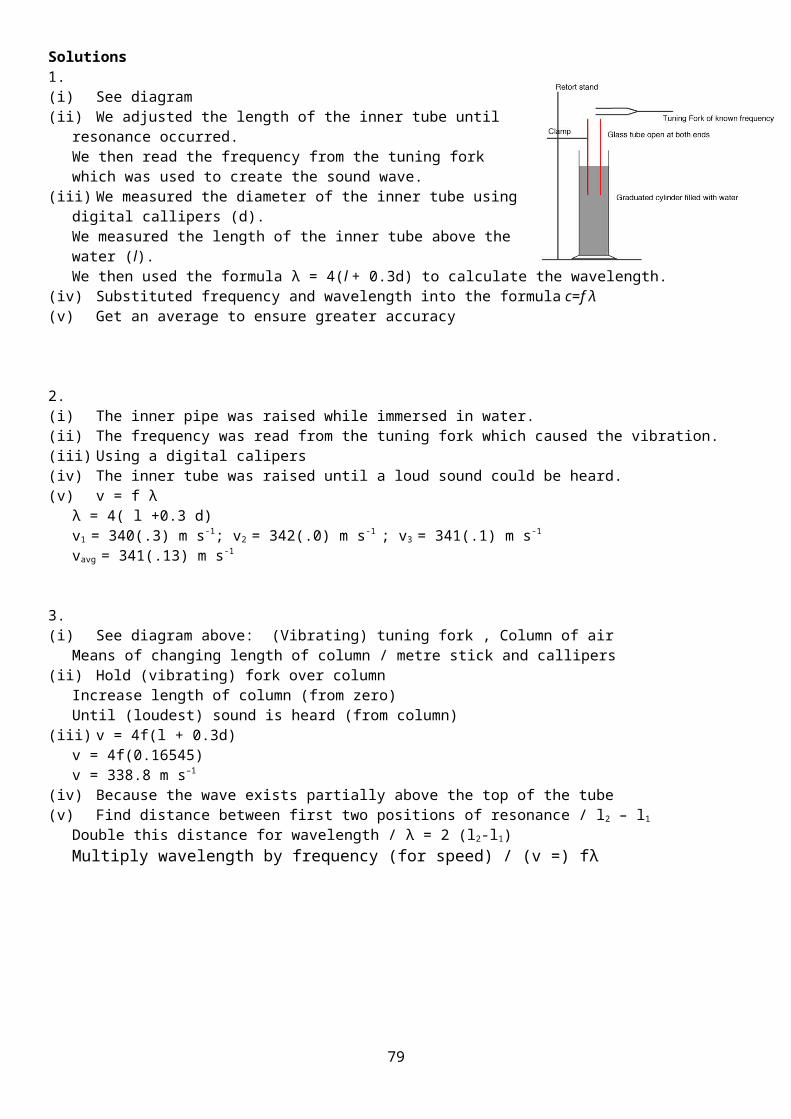
TO INVESTIGATE THE VARIATION OF CURRENT (I) WITH POTENTIAL DIFFERENCE (V) FOR A SEMICONDUCTOR DIODE
1. [2008 OL][2014 OL]The diagram shows a circuit used to investigate the variation of current with potential difference for a semiconductor diode in forward bias.
(i) Name the apparatus X. What does it measure?(ii) Name the apparatus Y. What does it do?(iii) What is the function of the 330 Ω resistor in this circuit? (iv) How would a student connect the diode in reverse bias? (v) The table shows the values of the potential difference used and its corresponding current recorded during the
experiment.Using the data in the table, draw a graph on graph paper of the current against the potential difference. Put potential difference on the horizontal axis (X-axis). (vi) What does the graph tell you about the variation of current with potential difference for a semiconductor diode?
2. [2012]The following is part of a student’s report on an experiment to investigate the variation of the current I with potential difference V for a semiconductor diode.
(vi) Draw a circuit diagram used by the student.(vii) How did the student vary and measure the
potential difference?(viii) Using the data, draw a graph to show how the current varies with the potential difference for the
semiconductor diode.(ix) Does the resistance of the diode remain constant during the investigation?
Justify your answer.(x) The student continued the experiment with the connections to the semiconductor diode reversed.
What adjustments should be made to the circuit to obtain valid readings?
3. [2007]The following is part of a student’s report of an experiment to investigate of the variation of current I with potential difference V for a semiconductor diode.I put the diode in forward bias as shown in the circuit diagram. I increased the potential difference across the diode until a current flowed. I measured the current flowing for different values of the potential difference.I recorded the following data.
(i) Draw a circuit diagram used by the student.(ii) How did the student vary and measure the potential
difference? (iii) Draw a graph to show how the current varies with the potential difference.(iv) Estimate from your graph the junction voltage of the diode. (v) The student then put the diode in reverse bias and repeated the experiment.
What changes did the student make to the initial circuit?(vi) Draw a sketch of the graph obtained for the diode in reverse bias.
79
potential difference/V 0 0.2 0.4 0.6 0.8 1.0current/mA 0 3 6 14 50 100
V/V 0 0.50 0.59 0.65 0.68 0.70 0.72
I/mA 0 3.0 5.4 11.7 17.4 27.3 36.5
V/V 0.60 0.64
0.68 0.72 0.76 0.80
I /mA 2 4 10 18 35 120

Solutions1.(i) Ammeter. It measures amps.(ii) Rheostat / variable resistor / potential divider
It changes the resistance which in turn changes the voltage.(iii) It protects the diode by limiting the current.(iv) switch the polarity of battery / diode(v) See graph(vi) They are not proportional because the current rises rapidly after the
potential difference reaches 0.6 V.
2.(i) See diagram(ii) Vary using rheostat /variable resistor / dial on (variable) p.s.u. measure p.d. from voltmeter ( across diode – stated or implied)(iii) See graph(iv) No
I is not proportional to V or ‘graph is not a straight line through origin’.
(v) microammeter used (instead of ammeter/milliammeter) // voltmeter placed across diode and microammeter, etc.
3.(i) See diagram above(ii) Adjust rheostat / potential divider /variable power supply unit.To measure p.d. a voltmeter was used as shown in the diagram.(iii) See graph(iv) Junction voltage = 0.60 ↔0.78 V (very difficult to be more specific).(v) Reverse connections to the power supply, replace mA with μA.(vi) Correct shape (i.e. showing little or no current as V is increased negatively
and maybe indicating a breakdown.
80
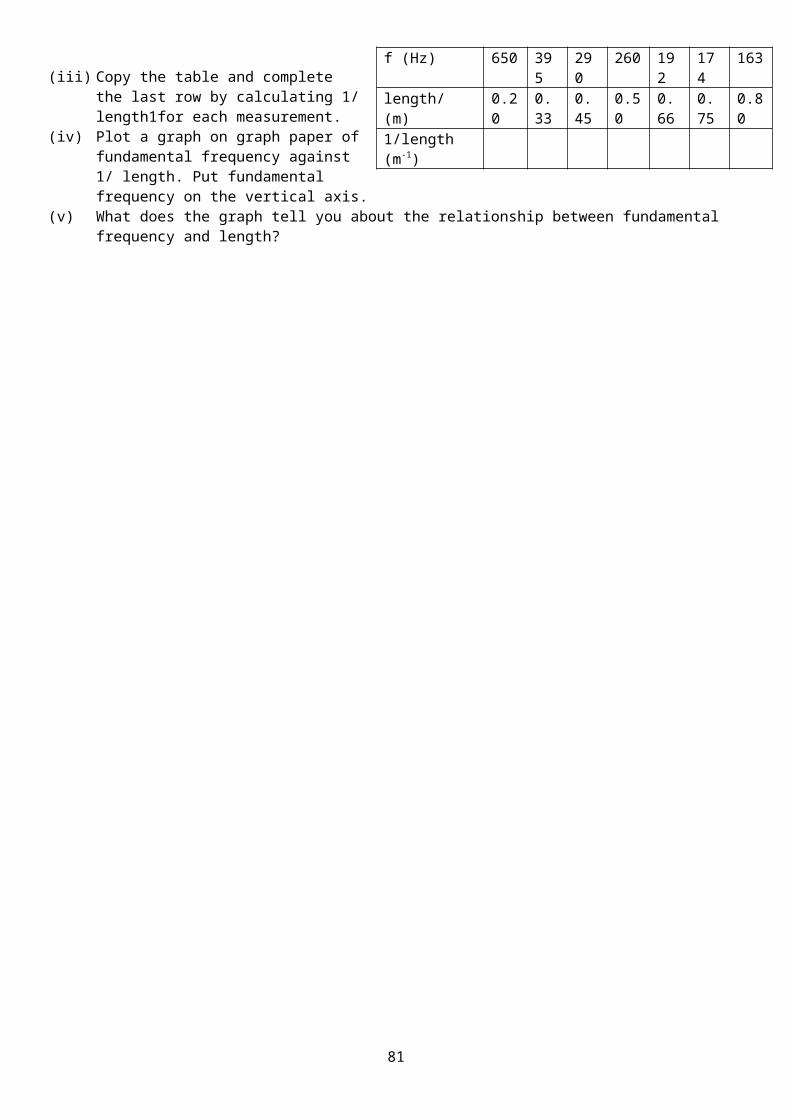
TO VERIFY JOULE’S LAW1. [2007 OL]
In an experiment to verify Joule’s law, a heating coil was placed in a fixed mass of water.A current I was allowed to flow through the coil for a fixed length of time and the rise in temperature Δθ was recorded. This was repeated for different values of I.The table shows the data recorded.
(i) Draw a labelled diagram of the apparatus used. (ii) How was the current changed during the
experiment? (iii) Copy the table and complete it in your answerbook. (iv) Using the data in the completed table, draw a graph on graph paper of Δθ against I2.
Put I2 on the horizontal axis (X-axis). (v) Explain how your graph verifies Joule’s law (Δθ α I2).
2. [2006]In an experiment to verify Joule’s law a student passed a current through a heating coil in a calorimeter containing a fixed mass of water and measured the rise in temperature Δθ for a series of different values of the current I. The student allowed the current to flow for three minutes in each case.
(iii) Describe, with the aid of a labelled diagram, how the student arranged the apparatus.
(iv) Why was a fixed mass of water used throughout the experiment?(v) The student drew a graph, as shown. Explain how this graph verifies Joule’s law.(vi) Given that the mass of water in the calorimeter was 90 g in each case, and
assuming that all of the electrical energy supplied was absorbed by the water, use the graph to determine the resistance of the heating coil. The specific heat capacity of water is 4200 J kg–1 K–1.
3. [2003]In an experiment to verify Joule’s law, a heating coil was placed in a fixed mass of water.The temperature rise Δθ produced for different values of the current I passed through the coil was recorded.
In each case the current was allowed to flow for a fixed length of time.The table shows the recorded data.(i) Describe, with the aid of a labelled diagram, how the
apparatus was arranged in this experiment. (ii) Using the given data, draw a suitable graph on graph paper and explain how your graph verifies Joule’s law. (iii) Explain why the current was allowed to flow for a fixed length of time in each case. (iv) Apart from using insulation, give one other way of reducing heat losses in the experiment.
4. [2014]In an experiment to verify Joule’s law, a fixed mass of water was heated in an insulated cup. ϴ, the highest temperature reached, was recorded for different values of current, I. In each case the current flowed for 4 minutes and the initial temperature of the water was 20.0 °C. The recorded data is shown in the table.
I (A) 1.0 1.5 2.0 2.5 3.0 3.5ϴ (°C) 22.0 24.5 28.5 34.0 38.5 45.5
(i) Draw a labelled diagram of the apparatus used in the experiment.(ii) Draw a suitable graph to verify Joule’s law. (iii) Explain how the graph verifies Joule’s law. (iv) Use your graph to estimate the highest temperature of the water when a current of 1.6 A flows through the coil for
4 minutes.(v) Explain why a fixed mass of water was used.
81
I/A 1.0 1.5 2.0 2.5 3.0 3.5 4.0I 2/A2 4Δθ/°C 2.2 5.0 8.8 13.8 20.0 26.0 35.2
I /A 1.5 2.0 2.5 3.0 3.5 4.0 4.5Δθ / °C 3.5 7.0 10.
815.0 21.2 27.
533.0

Solutions1.(i) See diagram below.(ii) Adjust the (variable) power supply // adjust the
(variable) resistor(iii) See table(iv) See graph(v)
We got a straight line through the origin showing that Δθ α I2
2.(i) See diagram.(ii) The mass of water would be a third variable and you can only investigate the relationship between two variables at
a time. (iii) Straight line graph through origin Δθ α I2 P α I2 (iv) Electrical energy in = Heat energy out
RI2 t = mcΔθ Rt = mc(Δθ/ I2) Rt = mc(slope) R = mc(slope)/t = (.09)(4200)(3.8)/180R = (7.8 ↔ 8.2) Ω
3.(i) See diagram.(ii)
Label axesAt least 6 correct points
Straight lineGood fitA straight line through origin shows that ∆ϑ ∝ I2 which verifies Joule’s Law.(iii) You can only investigate the relationship between two variables at a time and time is a third variable.(iv) Start with cold water, change the water for each run, use a lid, shorter time interval, polish calorimeter.
4.(i) See diagram. Must include coil in water , Power supply or battery with variable resistor, ammeter, Thermometer
Correct circuit diagram(ii) six I2 values calculated
axes labelled 6 points plotted straight line with good fit
(iii) straight line through origin / I2 proportional to rise in temperature / P proportional to I2
(iv) I2 = 2.56 highest temperature ≈ 25.3 °C
82
I/A 1.0 1.5 2.0 2.5 3.0 3.5 4.0I 2/A2 1 2.25 4 6.25 9 12.25 16Δθ/°C 2.2 5.0 8.8 13.8 20.0 26.0 35.2
I /A 1.5 2.0
2.5 3.0 3.5 4.0 4.5
Δθ / °C 3.5 7.0
10.8 15.0 21.2 27.5 33.0
I2 /A2 2.25 4.0
6.25 9.0 12.25 16.0 20.25
I2 (A2) 1 2.25 4 6.25 9 12.25Δϴ (K) 2.0 4.5 8.5 14.0 18.5 25.5
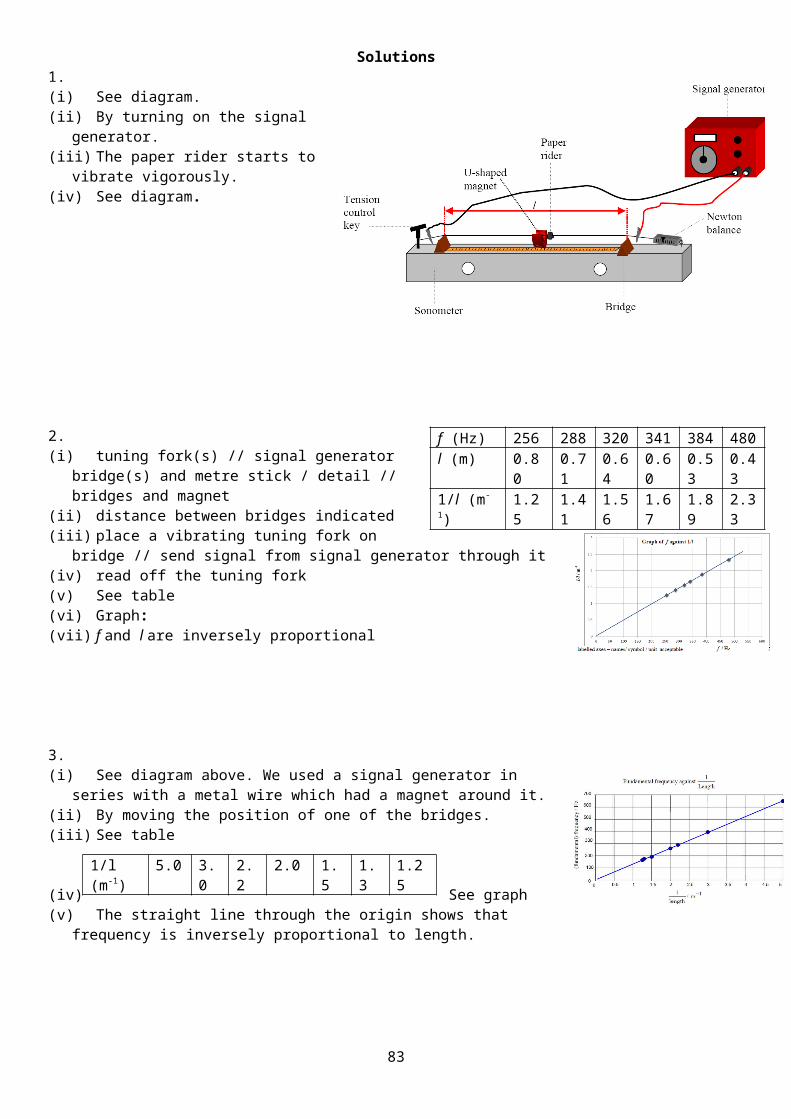
(v) (power required for) temperature rise is proportional to mass / otherwise there would be too many variables
83