physicochemical parameter analysis of perennial river flow
TRANSCRIPT
International Journal of Lakes and Rivers.
ISSN 0973-4570 Volume 13, Number 2 (2020), pp. 155-165
© Research India Publications
http://www.ripublication.com/ijlr.htm
Physicochemical Parameter Analysis of Perennial
River Flow of Thamiraparani in Tirunelveli and
Tuticorin Districts
Esakkimuthu T* and Dr. Marykutty Abraham
*Research Scholar, Sathyabama University, Rajiv Gandhi Salai, Chennai - 600119, India.
(Corresponding Author)
Associate Professor/Scientist E , SathyabamaUniversity, Rajiv Gandhi Salai, Chennai – 600119, India.
Abstract
One of the very basic requirements for mankind is water. Not only for human
being, water is the most indispensable requirement needed for every living
creature in the world. Although the major portion of the Earth is surrounded
by water body called Ocean, the fresh water source is always attributed to
rivers, lakes, ponds etc. Water quality is the most important aspect need to be
looked for the purpose of human utilization.The present research work is
aimed to find out the various physico-chemical parameters present in the river
Thamirabarani, in southern Tamilnadu. Water samples are collected at eight
stations starting from the major city, Tirunelveli till the point called
Punnaikayal, the point at which the river reaches the sea (Bay of Bengal). The
physico-chemical parameters such as pH, TDS, temperature, dissolved
oxygen, total hardness and chloride were determined. The samples were tested
on the sample sites and at the environmental lab in Government College Of
Engineering (GCE), Tirunelveli.
Keywords: water samples, physico-chemical parameters, water quality, water
testing
INTRODUCTION
Water is one of most precious gifts presented to the mankind by the almighty. Not
only human beings almost all living organisms depend on water for different means.
Industrial waste discharge, domestic waste disposal and untreated sewage when

156 Esakkimuthu T and Dr. Marykutty Abraham
disposed to water bodies, the various water sources getting contaminated and hence
the life of aquatic organisms are put into mess. Also the above said factors make
water unfit for human consumption and agriculture (Saluja DS 2019).Since many
industries find water bodies as the best place for their effluent discharge, the water
quality getting worse and the naturally occurring equilibrium of the ecosystem getting
disturbed (ThillaiArasu P 2007). The prediction given by world water assessment
program warns the human society that quality of water available to everyone will be
reduced by 30% in another two decades (KolheBharati G, Shinde Satish M 2014).
One of the richest fresh water sources used for human consumption and utilization is
river water.Rivers play a vital role in meeting the demands of local water supplies,
industries, agriculture, etc. Quality and quantity of river water are determined by
different factors like amount of rainfall, temperature, and weathering of rocks in that
surface area (Soranam R et al, 2016). Quality of the river water also depends on
various factors such as temperature, various discharges from the industries, human
activities in that area. Therefore monitoring and evaluation of different physcio
chemical factors gets its importance to derive the present condition of the water body
(Kolhe Bharati G, 2014 and Rajkamal R et al, 2016). The physcio-chemical
parameters of the water such as hardness, chloride content, temperature, turbidity,
dissolved oxygen, etc impacts the growth of various aquatic lives present in the river.
Tamilnadu is a heritage and cultural icon of India. While many studies reveal that the
various cultures got originated from the river banks, Tamilnadu is of no exception.
There are many rivers flowing across Tamilnadu. But Thamiraparani is one among
the very few perennial rivers flowing in Tamilnadu. Thamirabarani river originates
from the Agasthiyar hills in papanasam and this hill is situated 2000 meters above
mean sea level (ThillaiArasu P, 2007). Thamiraparani starts from the Western Ghats
situated in Papanasam and flows through various cities, villages and finally reaches
the Bay of Bengal Sea near a point called Punnaikayal.
The present study concentrates on revealing the various physcio chemical properties
of the river water such as pH, TDS, chlorides, temperature, hardness, dissolved
oxygen.Totally eight samples were collected for this study at the selected sites of
Tirunelveli and Tuticorin districts.
MATERIALS AND METHODS
Study area
Tirunelveli is situated in the southern region of state of tamilnadu. The land of
tirunulveli is flourished by the river Thamirabarani and this paves the nourishment of
irrigation sectors and hence more cultivation is being done. Tirunelveli is one of the
major cities, through which the Thamirabarani river passes. This study is mainly
concentrated on the different sites from Tirunelveli to Punnaikayal, the place where
Thamirabarani River merges with the Bay of Bengal. This study covers a distance of
around 60 kms. And also this stretch covers two districts viz Tirunelveli and
Tuticorin.

Physicochemical Parameter Analysis of Perennial River Flow of Thamiraparani… 157
Sample collection
Water samples were collected from eight sites starting from the city of Tirunelveli and
along with the passage of Thamirabbani river till the point where it reaches the sea
(Punnaikayal). Freshly cleaned plastic bottles of one litre capacity were used to
collect the water samples.
Few readings such as temperature and TDS were measured at the respective sites to
get more precise results. The geographical location of above sites is given in the
table 1 and the mapping location is given in Fig1.The stations at which the samples
were collected are given below:
Fig 1. Mapping locations of the sampling sites
Tirunelveli(S1), Karungulam(S2), Sri vaikundam(S3), Alwarthirunagari(S4),
Irattaithirupathi(S5), Mangalakurichi(S6), SenthaMangalam(S7) and Punnaikayal(S8)
158 Esakkimuthu T and Dr. Marykutty Abraham
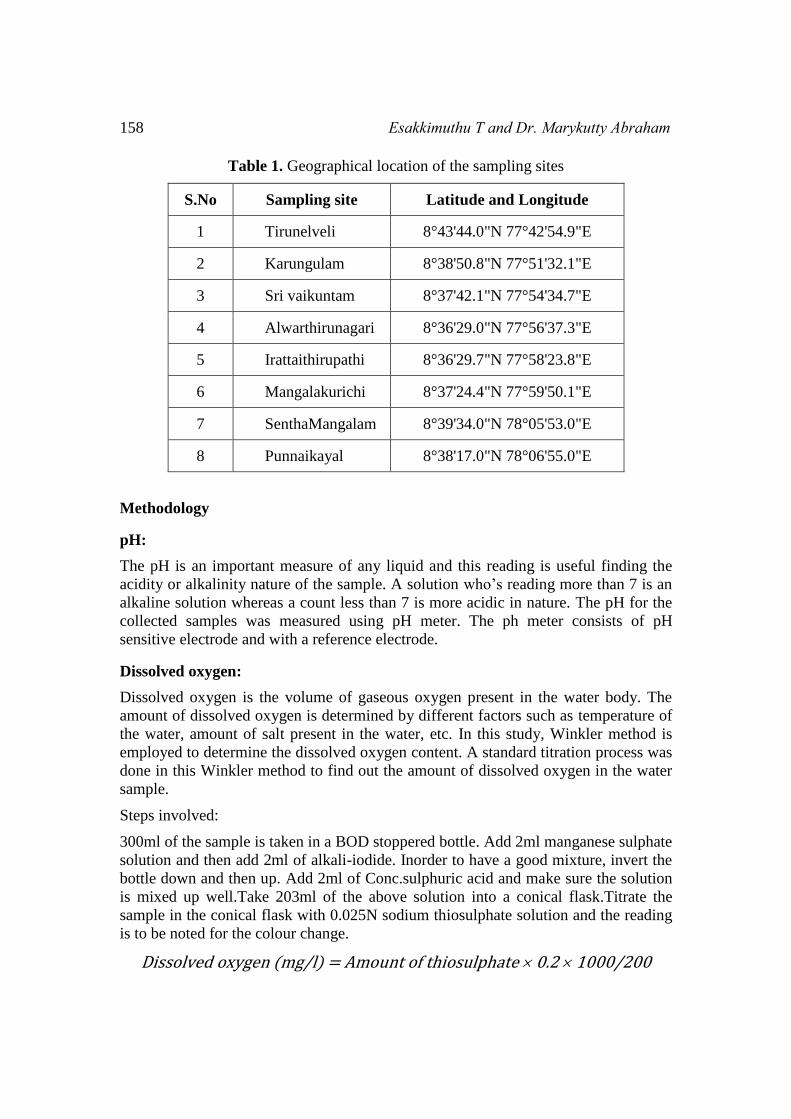
Table 1. Geographical location of the sampling sites
S.No Sampling site Latitude and Longitude
1 Tirunelveli 8°43'44.0"N 77°42'54.9"E
2 Karungulam 8°38'50.8"N 77°51'32.1"E
3 Sri vaikuntam 8°37'42.1"N 77°54'34.7"E
4 Alwarthirunagari 8°36'29.0"N 77°56'37.3"E
5 Irattaithirupathi 8°36'29.7"N 77°58'23.8"E
6 Mangalakurichi 8°37'24.4"N 77°59'50.1"E
7 SenthaMangalam 8°39'34.0"N 78°05'53.0"E
8 Punnaikayal 8°38'17.0"N 78°06'55.0"E
Methodology
pH:
The pH is an important measure of any liquid and this reading is useful finding the
acidity or alkalinity nature of the sample. A solution who’s reading more than 7 is an
alkaline solution whereas a count less than 7 is more acidic in nature. The pH for the
collected samples was measured using pH meter. The ph meter consists of pH
sensitive electrode and with a reference electrode.
Dissolved oxygen:
Dissolved oxygen is the volume of gaseous oxygen present in the water body. The
amount of dissolved oxygen is determined by different factors such as temperature of
the water, amount of salt present in the water, etc. In this study, Winkler method is
employed to determine the dissolved oxygen content. A standard titration process was
done in this Winkler method to find out the amount of dissolved oxygen in the water
sample.
Steps involved:
300ml of the sample is taken in a BOD stoppered bottle. Add 2ml manganese sulphate
solution and then add 2ml of alkali-iodide. Inorder to have a good mixture, invert the
bottle down and then up. Add 2ml of Conc.sulphuric acid and make sure the solution
is mixed up well.Take 203ml of the above solution into a conical flask.Titrate the
sample in the conical flask with 0.025N sodium thiosulphate solution and the reading
is to be noted for the colour change.
Dissolved oxygen (mg/l) = Amount of thiosulphate 0.2 1000/200
Physicochemical Parameter Analysis of Perennial River Flow of Thamiraparani… 159
Temperature:
Temperature was measured using water proof TDS and temperature meter. The
temperature was measured at the sampling sites.
TDS:
TDS is one of the primary parameter. It is used to determine the inorganic salts and
other organic matters present in the sample.TDS was measured using water proof
TDS and temperature meter.
Hardness:
One of the parameter which describes the quality of the water sample taken is the total
hardness. Generally hardness can be explained by the calcium and magnesium ions
present in the water. The total hardness was measured using EDTA method.
Take 25ml of the sample in a 250ml Erlenmeyer flask.Add 25ml of distilled water in
the above same flask. This addition of distilled water will not impact the result. But
this is for getting a clear end point. Add 20 drops of the ph solution to the above said
flask. Add a pinch of indicator, so that the color of the solution will turn to red. Fill
the burette with the EDTA solution and make a note of the initial reading.Titrate the
solution until the red color changes to blue. This reading can be used for determining
the amount of calcium carbonate present in the sample and eventually this give the
hardness of the sample.
Chloride:
Gaseous chlorine combines with the metal to yield a salt compound called chloride.
Magnesium chloride and sodium chloride are some common forms of chloride.
Solutions needed:
Silver nitrate solution
Potassium chromate Indicator solution
Steps to be taken:
Take 20ml of the water sample in a 100ml volumetric flask. Add the remaining
contents of the flask with distilled water. Now the diluted water sample is prepared.
Pipette out 10ml of diluted sample in to conical flask. 50ml of distilled water is added
to this.1ml of potassium chromate indicator is added to the above solution. Titrate the
above prepared sample with 0.1mol L-1 solution of silver nitrate and note down the
reading at which the color changes.
RESULTS AND DISCUSSION
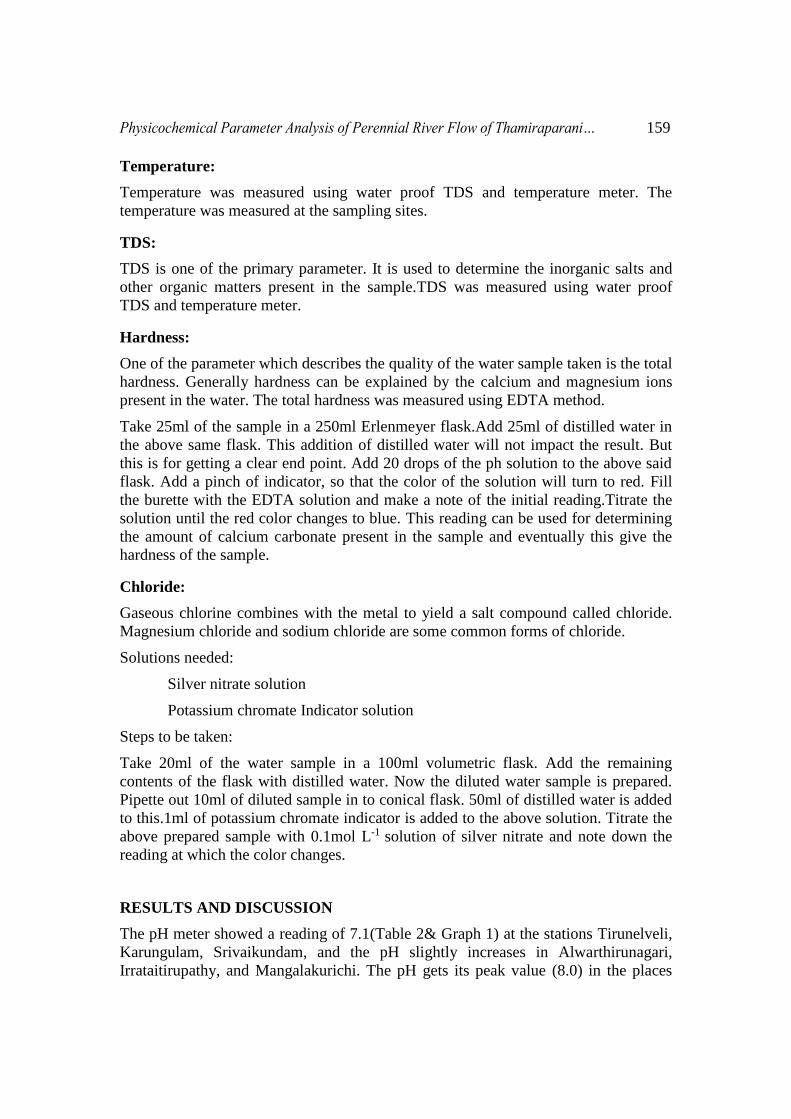
The pH meter showed a reading of 7.1(Table 2& Graph 1) at the stations Tirunelveli,
Karungulam, Srivaikundam, and the pH slightly increases in Alwarthirunagari,
Irrataitirupathy, and Mangalakurichi. The pH gets its peak value (8.0) in the places
160 Esakkimuthu T and Dr. Marykutty Abraham
where the river flows nearer to the ocean (All values were found to be within the
prescribed limits of IS10500-2012)
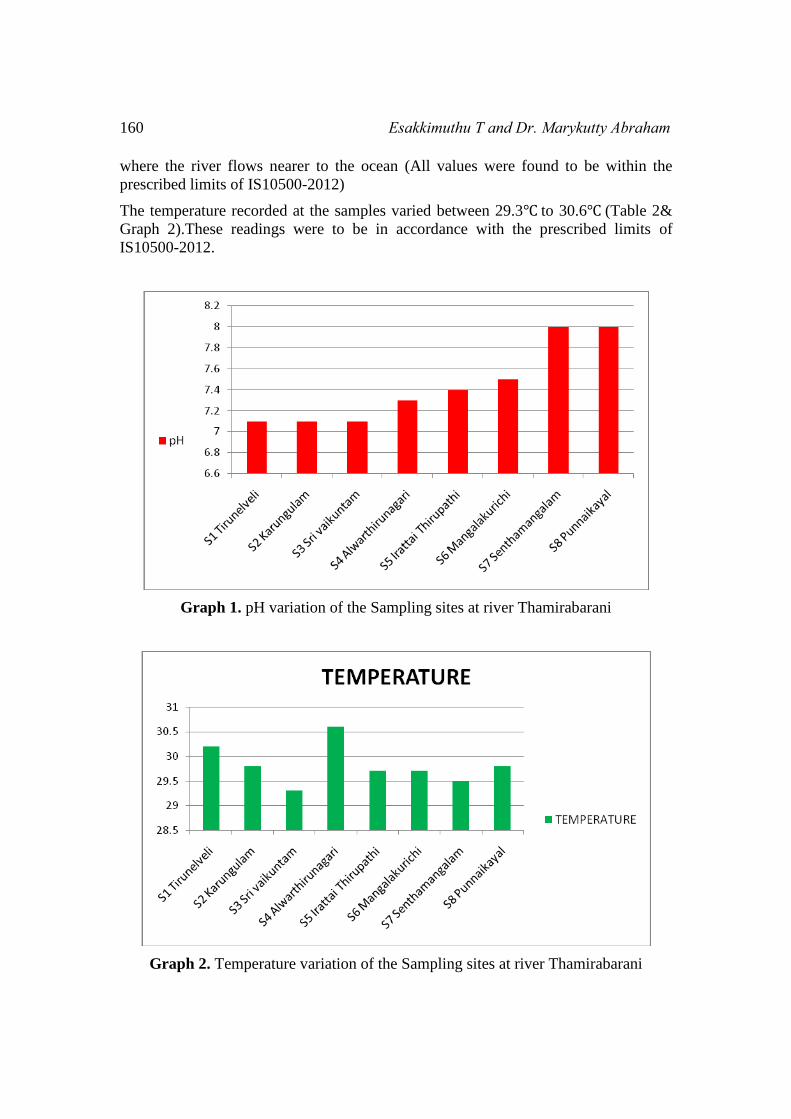
The temperature recorded at the samples varied between 29.3℃ to 30.6℃ (Table 2&
Graph 2).These readings were to be in accordance with the prescribed limits of
IS10500-2012.
Graph 1. pH variation of the Sampling sites at river Thamirabarani
Graph 2. Temperature variation of the Sampling sites at river Thamirabarani
Physicochemical Parameter Analysis of Perennial River Flow of Thamiraparani… 161
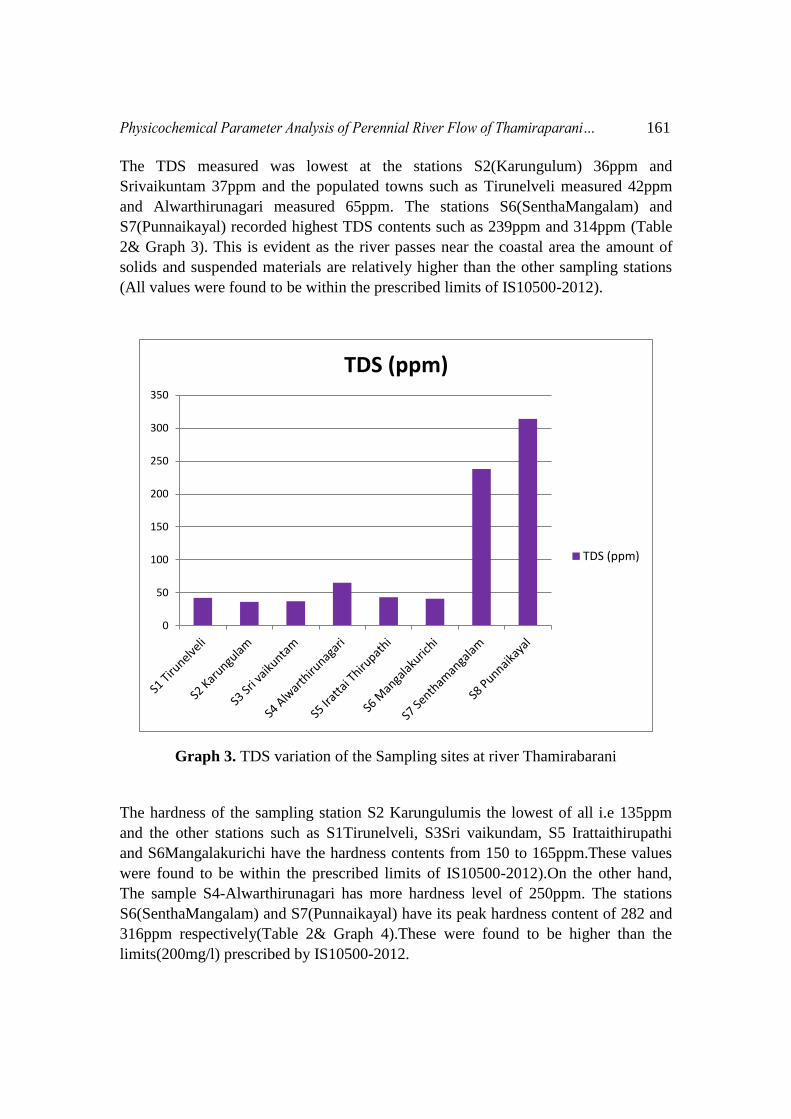
The TDS measured was lowest at the stations S2(Karungulum) 36ppm and
Srivaikuntam 37ppm and the populated towns such as Tirunelveli measured 42ppm
and Alwarthirunagari measured 65ppm. The stations S6(SenthaMangalam) and
S7(Punnaikayal) recorded highest TDS contents such as 239ppm and 314ppm (Table
2& Graph 3). This is evident as the river passes near the coastal area the amount of
solids and suspended materials are relatively higher than the other sampling stations
(All values were found to be within the prescribed limits of IS10500-2012).
0
50
100
150
200
250
300
350
TDS (ppm)
TDS (ppm)
Graph 3. TDS variation of the Sampling sites at river Thamirabarani
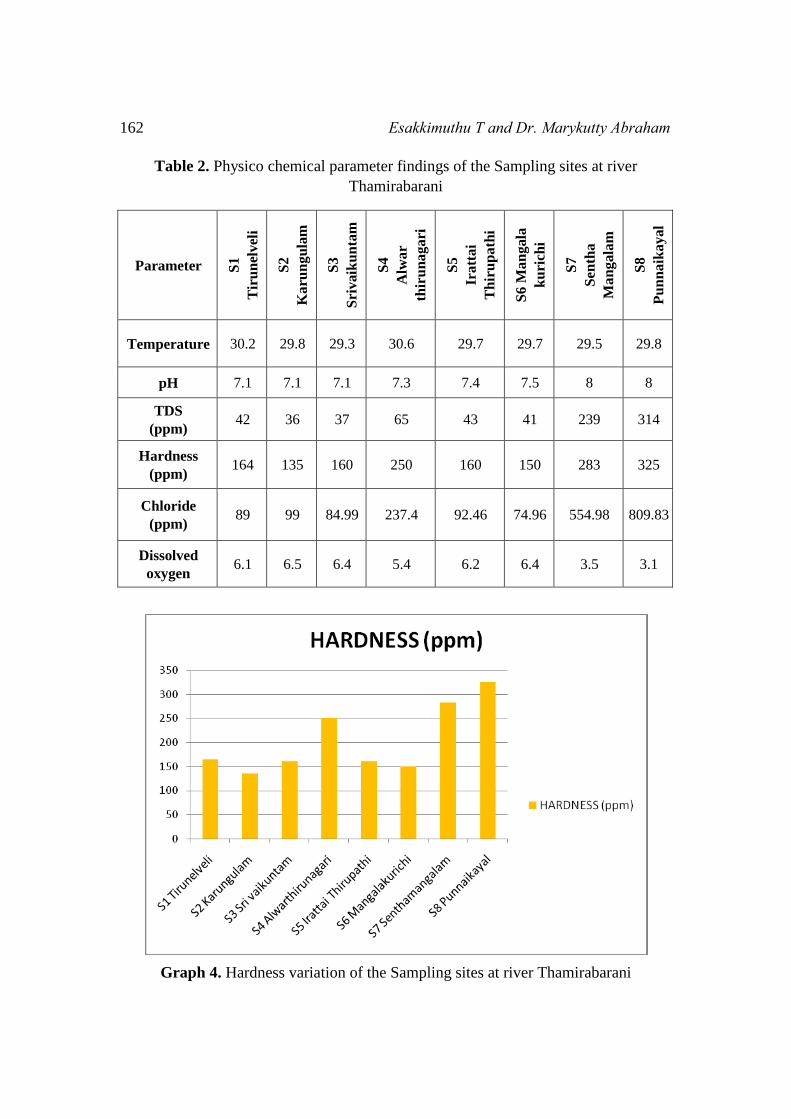
The hardness of the sampling station S2 Karungulumis the lowest of all i.e 135ppm
and the other stations such as S1Tirunelveli, S3Sri vaikundam, S5 Irattaithirupathi
and S6Mangalakurichi have the hardness contents from 150 to 165ppm.These values
were found to be within the prescribed limits of IS10500-2012).On the other hand,
The sample S4-Alwarthirunagari has more hardness level of 250ppm. The stations
S6(SenthaMangalam) and S7(Punnaikayal) have its peak hardness content of 282 and
316ppm respectively(Table 2& Graph 4).These were found to be higher than the
limits(200mg/l) prescribed by IS10500-2012.
162 Esakkimuthu T and Dr. Marykutty Abraham
Table 2. Physico chemical parameter findings of the Sampling sites at river
Thamirabarani
Graph 4. Hardness variation of the Sampling sites at river Thamirabarani
Parameter S1
Tir
un
elv
eli
S2
Ka
run
gu
lam
S3
Sri
vaik
un
tam
S4
Alw
ar
thir
un
ag
ari
S5
Ira
tta
i
Th
iru
pa
thi
S6
Ma
ng
ala
ku
rich
i
S7
Sen
tha
Ma
ng
ala
m
S8
Pu
nn
aik
ay
al
Temperature 30.2 29.8 29.3 30.6 29.7 29.7 29.5 29.8
pH 7.1 7.1 7.1 7.3 7.4 7.5 8 8
TDS
(ppm) 42 36 37 65 43 41 239 314
Hardness
(ppm) 164 135 160 250 160 150 283 325
Chloride
(ppm) 89 99 84.99 237.4 92.46 74.96 554.98 809.83
Dissolved
oxygen 6.1 6.5 6.4 5.4 6.2 6.4 3.5 3.1
Physicochemical Parameter Analysis of Perennial River Flow of Thamiraparani… 163
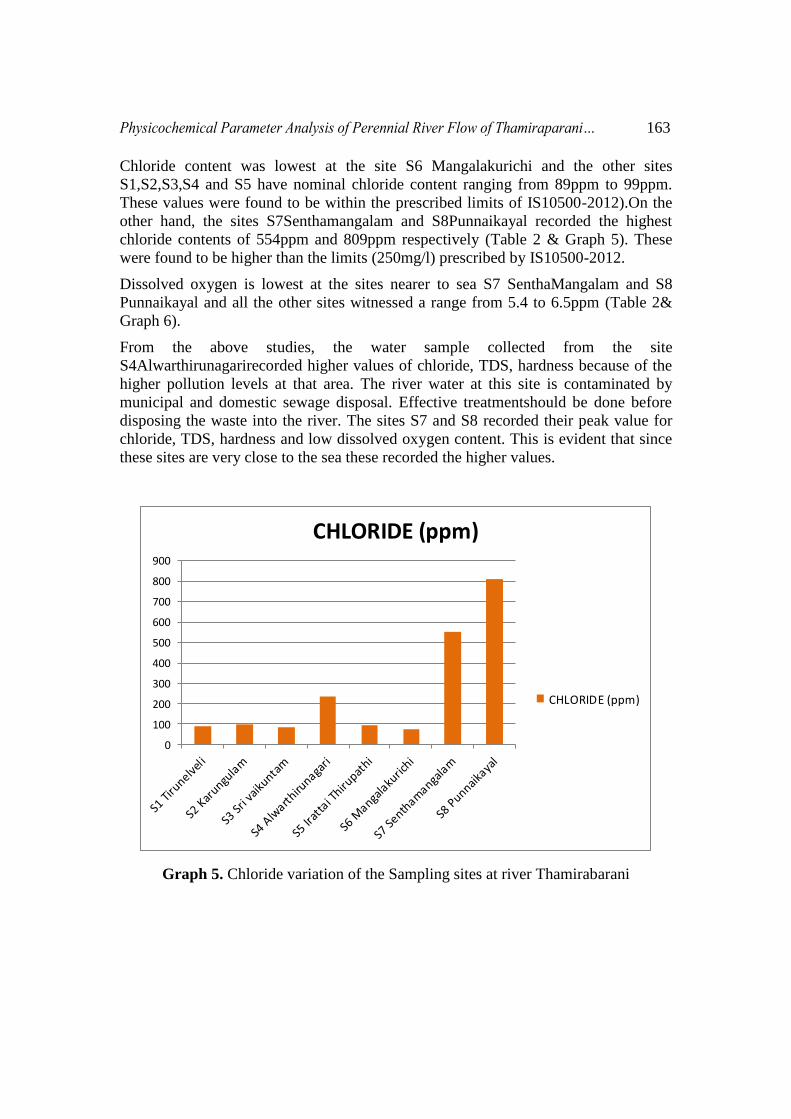
Chloride content was lowest at the site S6 Mangalakurichi and the other sites
S1,S2,S3,S4 and S5 have nominal chloride content ranging from 89ppm to 99ppm.
These values were found to be within the prescribed limits of IS10500-2012).On the
other hand, the sites S7Senthamangalam and S8Punnaikayal recorded the highest
chloride contents of 554ppm and 809ppm respectively (Table 2 & Graph 5). These
were found to be higher than the limits (250mg/l) prescribed by IS10500-2012.
Dissolved oxygen is lowest at the sites nearer to sea S7 SenthaMangalam and S8
Punnaikayal and all the other sites witnessed a range from 5.4 to 6.5ppm (Table 2&
Graph 6).
From the above studies, the water sample collected from the site
S4Alwarthirunagarirecorded higher values of chloride, TDS, hardness because of the
higher pollution levels at that area. The river water at this site is contaminated by
municipal and domestic sewage disposal. Effective treatmentshould be done before
disposing the waste into the river. The sites S7 and S8 recorded their peak value for
chloride, TDS, hardness and low dissolved oxygen content. This is evident that since
these sites are very close to the sea these recorded the higher values.
0
100
200
300
400
500
600
700
800
900
CHLORIDE (ppm)
CHLORIDE (ppm)
Graph 5. Chloride variation of the Sampling sites at river Thamirabarani

164 Esakkimuthu T and Dr. Marykutty Abraham
0
1
2
3
4
5
6
7
DISSOLVED OXYGEN
DISSOLVED OXYGEN
Graph 6. Dissolved oxygen variation of the Sampling sites at river Thamirabarani
ACKNOWLEDGMENT
Authors sincerely than Professor.S.Sidhardhan, Head of Dept, Civil Engineering for
allowing utilizing Lab facilities provided at the Environmental Lab in Government
College of Engineering (GCE), Tirunelveli.
REFERENCES
[1] Annalakshmi G and Amsath 2012. A An Assessment Of Water Quality Of
River Cauvery And Its Tributaries Arasalar With Reference To Physico-
Chemical Paremeters At Tanjore Dt, Tamilnadu, India, International Journal Of
Applied Biology And Pharmaceutical Technology, Volume: 3: Issue-1.
[2] Arasu, T.P., Hema, S., and Neelakantan, M.A. 2007. Physico-chemical analysis
of Thamirabarani river water in South India, Indian Journal of Science and
Technology, Vol.1 No.2.
[3] Badr et al., 2013. Water Quality Assessment in the Nile River, Damietta
Branch, Egypt, CATRINA 8 (1): 41-50.
[4] Bharati, K.G., Satish, S.M. 2014. Study of Some Physico-Chemical Parameters
of Godavari River Water at Ramkund, Nashik With Reference to Correlation
Study, PARIPEX - INDIAN JOURNAL OF RESEARCH, Volume : 3 |
Issue : 5.

Physicochemical Parameter Analysis of Perennial River Flow of Thamiraparani… 165
[5] Debels, P. et al, 2005. Evaluation Of Water Quality In The Chillan River ´
(Central Chile) Using Physicochemical Parameters And A Modified Water
Quality Index, Environmental Monitoring and Assessment 110: 301–322.
[6] Dubey, M. and Ujjania, N.C. 2013. Water Quality And Pollution Status Of Tapi
River, Gujarat, India, International Journal of Pure and Applied Zoology, Vol.
1, Issue 3, pp: 261-266.
[7] Kumar, S.D., Srikantaswamy, S. and Jagadish, K. 2014. An Overview On
Assessment of Cauvery River Water Quality, –International Journal for
Innovative Research in Science & Technology| Volume 1 | Issue 7 | December.
[8] Muyen et al., 2016. Assessment of water quality index: a case study in Old
Brahmaputra river of Mymensingh District in Bangladesh, Progressive
Agriculture, 27 (3): 355-361.
[9] Pentewar, M.S. 2018. Physico-chemical aspects of Godavari river at Nanded
district MS, India, Int. J. of Life Sciences, Special issue, A10; January, 174-
176.
[10] Piplode, S. and Barde, V.S. 2015. Physico-chemical Evaluation of Narmada
River Water at Khalghat MP, India, Research Journal of Chemical Sciences,
Vol. 5(5), 24-26.
[11] Rajkamal, R. et al., 2016. Assessment of water quality standards in the villages
of Kanchipuram district, Tamil Nadu, India, Int J Community Med Public
Health. Nov;3(11):3179-3183.
[12] Saluja, D.S. 2019. Physico–Chemical Study of Tapti River Water at Multai,
District - Betul (M.P.), International Journal of Science and Research (IJSR),
Volume 8 Issue 11, November, 195-197.
[13] Soranam, R., Senthilmanickam, J. and Sabaridasan, A. 2016. A Study on
Physico-Chemical Properties of Water Samples from Cauvery River of
Pallipalayam Town, Namakkal District of Tamil Nadu, India, Int. J. Adv. Sci.
Eng. Vol. 2 No.4 202-208 202.
[14] Subramanian, G.R., Subramanian, V. and Sukumar, S. 2011. Pre and Post-
Monsoon variation in PhysicoChemical characteristics in Groundwater
quality of parts of Tirunelveli District, Tamil Nadu, India, International Journal
of Geomatics and Geosciences Volume 2 Issue 1.
[15] Sureshkumar, M. et al, 2016. Analysis Of Physico-Chemical Characteristics Of
Groundwater In Kanchipuram Municipality, Tamil Nadu, India, RASĀYAN J.
Chem, Vol. 9 | No. 3 |454 - 459 | July – September.

166 Esakkimuthu T and Dr. Marykutty Abraham