physical-statistical hybrid model for mirror plant ... · physical-statistical hybrid model for...
TRANSCRIPT
Physical-Statistical Hybrid Model for MIRROR PLANT
Yokogawa Technical Report English Edition Vol.56 No.1 (2013)
Physical-Statistical Hybrid Model for MIRROR PLANTMakoto Nakaya *1 Xinchun Li *2
MIRROR PLANT uses physical plant modeling based on physical and chemical laws. However, the physical model cannot express some phenomena in plants, especially those which are not physically determined yet. We propose a hybrid model of a physical model and a statistical model based on historical plant operation data. Combining the physical model and statistical model improves the estimation accuracy of the statistical model. In addition, by applying the just-in-time (JIT) modeling to the on-line update of the statistical model, it can deliver exact estimation even during rapid changes in plant behaviors.
INTRODUCTION
MIRROR PLANT, which combines reality and a virtual world, and actively makes use of a plant model to
provide new operations, is based on the Visual Modeler dynamic process simulator of Omega Simulation Co., Ltd. With the Visual Modeler plant model, a technique known as the physical (or rigorous) model, subject to physical and chemical laws, is applied. Visual Modeler’s model library has more than 150 unit models for differing plant equipment; thus, by using them, users can build a plant model in an interactive mode on GUI.
Physical models are based on the theory, and therefore plant behaviors can be understood according to the principles and fundamental rules, and they can be used in a wide range of operations from a plant startup to its shutdown. This is a feature of the physical model. However, portions of a plant which are phenomena that are not physically analyzable cannot be modeled. There is another drawback, in that it needs much time to use past operations data for tuning parameters in physical model formulas. To solve these problems, Yokogawa has developed a physical-statistical hybrid model for the MIRROR PLANT for the cases where a physical model cannot be built, by combining a statistical model, which configures a model based on past operations data using statistical methods, with the physical model.
CURRENT SITUATIONS AND PROBLEMS OF SOFTWARE SENSORS WHICH USE STATISTICAL DATA
What is Software Sensor?Process control requires measuring key variables of
the process to secure the performance of plant equipment and quality of products. However, these key variables are often difficult or impossible to measure directly. For examples, variables in a chemical reactor such as catalyst activity, compositions of reactants and degree of conversion in reaction are related to product quality and productivity, and so they ideally have to be controlled or regulated in real time. Although gas chromatographs or other analyzers are available to measure the product components directly and on-line, measured values are not suitable for control because of a considerable delay in measurement or analysis.
Software sensors have been developed to solve this problem. In the implementation of a software sensor, a plant model is built for estimating process variables (response variables), which are impossible to measure in real time, by using general process variables (explanatory variables) such as temperatures, pressures, and flow rates, which are measured real time at a plant.
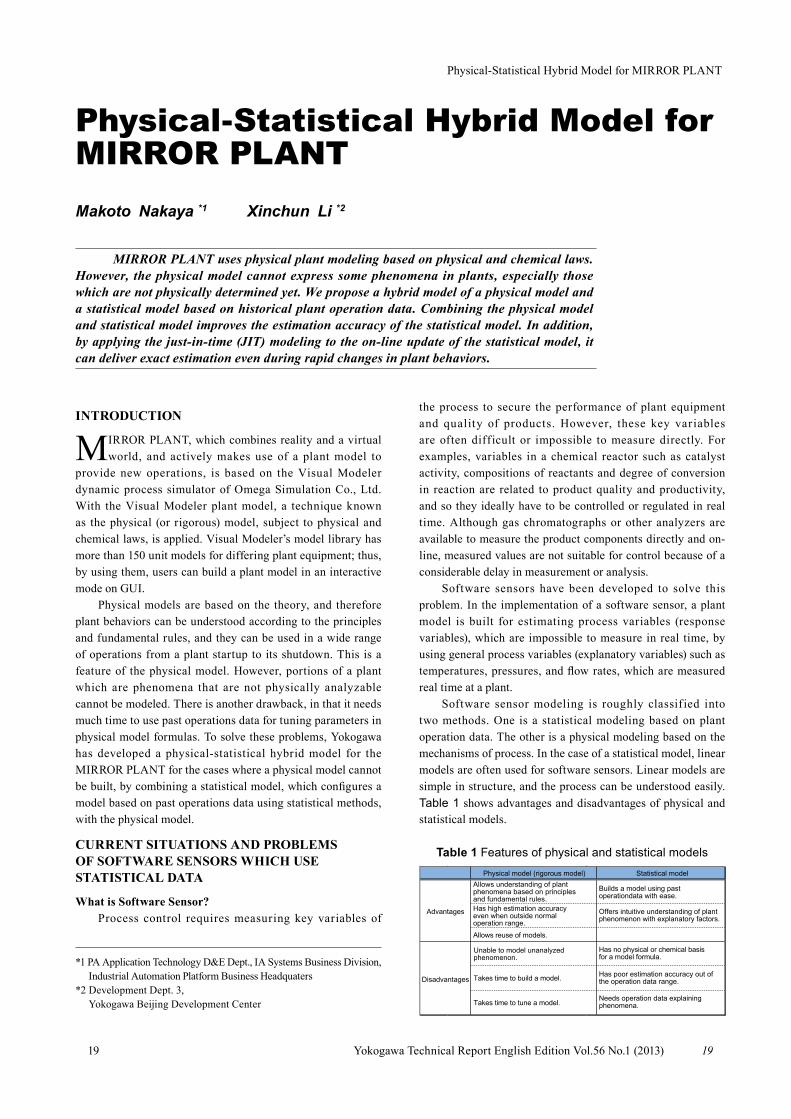
Software sensor modeling is roughly classified into two methods. One is a statistical modeling based on plant operation data. The other is a physical modeling based on the mechanisms of process. In the case of a statistical model, linear models are often used for software sensors. Linear models are simple in structure, and the process can be understood easily. Table 1 shows advantages and disadvantages of physical and statistical models.
Table 1 Features of physical and statistical modelsPhysical model (rigorous model) Statistical model
Allows understanding of plant phenomena based on principles and fundamental rules.
Builds a model using past operationdata with ease.
Offers intuitive understanding of plantphenomenon with explanatory factors.
Unable to model unanalyzed phenomenon.
Has no physical or chemical basisfor a model formula.
Takes time to build a model. Has poor estimation accuracy out ofthe operation data range.
Takes time to tune a model. Needs operation data explainingphenomena.
Advantages
Disadvantages
Has high estimation accuracy even when outside normal operation range.
Allows reuse of models.
19 19
*1 PA Application Technology D&E Dept., IA Systems Business Division, Industrial Automation Platform Business Headquaters
*2 Development Dept. 3, Yokogawa Beijing Development Center

Physical-Statistical Hybrid Model for MIRROR PLANT
Yokogawa Technical Report English Edition Vol.56 No.1 (2013) 2020
MRA and PLS Statistical Modeling TechniquesThis section describes statistical modeling that uses a
linear model.Multiple regression analysis (MRA) analyzes the relations
between response variables and multiple explanatory variables by using a statistical technique. MRA assumes that response variables and explanatory variables have a linear relation as follows:
When applying MRA, selection of explanatory variables is crucial. If variables of high mutual correlation are selected, equation (2) falls into a state known as multicollinearity, and estimation accuracy deteriorates. To avoid this, the partial least squares (PLS) method is available, in which linearly independent variables are selected from among explanatory variables as principal components. Explanatory variables are determined in consideration of correlations between the input variables and output variables of a software sensor and correlations between the input variables.
Scores T and U are extracted from explanatory variable x and response variable y respectively to build a model. Fundamental formulas are shown below:
Compared with MRA, PLS can obtain a model that can estimate more rigidly. In addition, a model can be built even when the number of descriptors is larger than that of the samples. Because PLS is a multiple linear regression analysis technique, the regression equation (1) can be obtained by deforming the above formulas.
Issues on Software Sensors Using a Statistical ModelIn the report on the questionnaire regarding advanced
process control issued by the 143rd committee of Process System Engineering of the Japan Society for the Promotion of Science (JSPS) (1), the use of software sensors in the process industries is described. Table 2 shows applied algorithms in the chemical process. In the actual process fields, linear models (such as MRA and PLS) which use statistical data are used more for software sensors than physical models are. Plant model formulas expressed by a linear equation using explanatory variables offer simple modeling and are easy to understand, and so they are widely used. Meanwhile, in reaction or
polymerization processes, because process behaviors have strong non-linearity due to multiple catalysts and other factors, approximation with a linear model is difficult.
Figure 1 shows issues regarding software sensors. The primary concern is how to cope with the deterioration of estimation accuracy due to changes in characteristics of the process, that is, maintenance of models.
Table 2 Number of modeling techniques applied
Figure 1 Issues regarding software sensors
Model Maintenance Technology for Statistical ModelsBecause phenomena in petroleum or petrochemical plants
are represented using nonlinear, time-variant and distributed parameter systems, it is difficult to describe process behaviors in a plant by linear model formulas. The MIRROR PLANT, which mainly uses physical models, identifies model parameters of physical models on-line. Similarly, with statistical models which are based on past operation data, the estimation accuracy deteriorates during on-line operations due to temporal changes in the process. Two on-line model maintenance technologies for statistical models are introduced below.
� Kalman FilterIn 1960, R.E. Kalman announced the Kalman filter, which
is being used in wide areas including car navigation systems and weather forecasting. Assuming that measured values and variables to indicate a system status generally contain noise, the Kalman filter estimates a most probable system status based on the information obtained until just before, and the data obtained at the moment.
To apply a Kalman filter to software sensors and update a model on-line, transform the model formula (1) into a state equation. The regression coefficient θ indicates a state.
(1): response variable: explanatory variable
: model coefficientSolution to least squares (2)
: model error: number of samples, : number of variables
(3)(4)
: loading, : residuals
Physicalmodel MRA PLS Neural
network Others
Distillation 20 256 41 0 14 331Reaction 5 32 43 0 6 86Polymerization 0 4 8 3 5 20Others 0 1 1 0 0 2Total 25 293 93 3 25 439
Modeling techniquesProcess Total
Deteriorating estimation accuracy Maintenance
29%
Burden for data gatheringto build a model
22%
Burden for building a model
14%
Others35%
(5)(6)
Regression coefficient Explanatory variableResponse variable State noiseMeasurement noise
and are assumed to be subject to the following distribution.

Physical-Statistical Hybrid Model for MIRROR PLANT
Yokogawa Technical Report English Edition Vol.56 No.1 (2013)
If P, Q, R, initial condition θ(0) and the latest measured output y are known, the optimum status θ can be calculated from the Kalman filter equations (7) - (11). That is, the regression coefficient θ of the model can be updated.
Prediction:
Correction:
With repetitive on-line computation and actual measured output values, the model is updated from time to time. Measured output values include compositions measured and analyzed by gas chromatographs every 20 or 30 minutes, and property values are analyzed in the laboratories.
Here, the initial condition θ(0) is determined by the least squares method. The initial values of P, Q, and R are a unit matrix. It is indispensable to update Q and R, which significantly affect the estimation accuracy. Judging from theoretical analyses and actual results, it can be said that the maximum a posteriori (MAP) shown below is effective.
� JIT Modeling TechniqueThe just-in-time (JIT) modeling is proposed to deal with
changes in characteristics and nonlinearity of the process. With this technique, only when the estimation of an output value is required, samples close to the query point are selected from accumulated data in a database to build a local model and estimate the output value.
With the conventional JIT modeling, samples for building a local model are selected depending on their distances from the query point. Meanwhile, what is expected from samples when used for building a linear regression model is not that they are merely located within a certain distance from the query point, but that they have a certain correlation. No matter how far samples are away from the query point, a reliable model can be built as long as they have the same correlation. Correlation-JIT (C-JIT) modeling is proposed based on this concept. The C-JIT modeling follows up rapid changes in characteristics of the process well, and can significantly improve the estimation performance. Such quick following up is difficult for conventional JIT modeling, which uses a Euclidian distance for estimation.
When applying the C-JIT in an off-line state, samples in a plant operation database are divided into several datasets by using a certain correlation evaluation index and the clustering technique, and each model is then built. Meanwhile, the on-line procedure for the C-JIT is as follows:1) Acquire new input data.2) Calculate the input evaluation index using new input data
for each dataset.3) Select a dataset with the minimizing index, and predict
output.4) Obtain the measured value of output corresponding to the
new input, and update datasets.5) Repeat the steps above.
The correlation evaluation index is defined in many ways. Fujiwara, et al. (2) proposed equation (14). T2 indicates the distance between input data and the center of a dataset, while Q represents non-similarity between input data and a dataset.
To enhance the adaptability of correlation judgment, Yokogawa proposes the Mahalanobis-JIT (M-JIT) modeling. This technique selects datasets by using the Mahalanobis distance method. The experimental results described later show that the estimation performance is better than that achieved with the Kalman filter.
PHYSICAL-STATISTICAL HYBRID MODEL
Hybrid Structure of Physical and Statistical ModelsAlthough physical models a re of ten used for an
analyzing process, Yokogawa has devised a hybrid physical and statistical model for the MIRROR PLANT. This model compensates modeling, which is difficult for a physical model to achieve, with a statistical model. Different from plant training simulators, the MIRROR PLANT does not cover all the range of operation from the startup to shutdown of a plant, but focuses on normal operations, including load change operations. Accordingly, there are a lot of past operation data available for building statistical models.
As shown in Figure 2, three types of hybrid structure of physical and statistical models can be considered. In the case of type 1, when input values to the plant, e.g. raw material compositions, are unknown, the statistical model compensates for them and gives the results to the physical model. Type 2 is the case where a part that cannot be expressed in a physical model exists in the plant model. In the case of type 3, differences between the output results of the physical model and the actually measured values, that is, the model errors themselves, are expressed in a statistical model and made use of.
Figure 2 Hybrid structure of physical and statistical models
Application Results of a Physical-Statistical Hybrid Model in Methane Steam Reforming
A physical-statistical hybrid model was applied to a methane steam reforming process. This model is equivalent
(7)(8)
(9)(10)(11)
(12)
(13)
(14)
Physicalmodel
Statisticalmodel
Plant model
Plant Plant Plant
+
—
(A) Hybrid Type 1 (B) Hybrid Type 2 (C) Hybrid Type 3
Physicalmodel
Physicalmodel
Statisticalmodel
Statisticalmodel
Plant model Plant model
21 21

Physical-Statistical Hybrid Model for MIRROR PLANT
Yokogawa Technical Report English Edition Vol.56 No.1 (2013)
to the type 2 in Figure 2. This process aims to obtain hydrogen from methane gas. A reformer, a shift reactor, and a preferential oxidation (PROX) reactor are connected in a series, and oxygen is supplied at the inlet of the PROX reactor for oxidation. Carbon oxide (CO), a byproduct created in the reformer, is removed by the shift reactor and PROX reactor to the orders of several tens of ppm. The specific application of the MIRROR PLANT to methane steam reforming is reported in the reference (3).
The reaction in the PROX reactor is complex because the combustion reaction of hydrogen (H2) and oxygen (O2) progresses in concurrence with the partial oxidation reaction of CO, and so the model formula for minute CO composition based on physical formulas cannot be created. Thus, a statistical model was used for estimating minute CO concentration at the PROX reactor outlet. When the estimated values such as the composition of reformed gas in the shift reactor that are calculated every second in the MIRROR PLANT were used as explanatory variables of the statistical model, the estimation accuracy of the statistical model was improved compared with that of a model which used only measured values acquired by actual sensors as explanatory variables (4).
In addition, the Kalman filter and M-JIT model were used as an online model updating technology for statistical models. As shown in Figure 3 (A), raw material feed was changed quickly in the methane steam reforming process to estimate changes in the CO concentration that determines the quality of reformed gas at the PROX reactor outlet. Figure 3 (B) shows that model updating by either the Kalman filter or M-JIT ensures the CO concentration will be properly estimated while reference signals are provided from a gas chromatograph. However, in the case where no reference signals are fed due to the maintenance of the gas chromatograph or other reasons, estimation by the M-JIT model that continuously evaluated if the current model was optimal showed better results than that by the Kalman filter as shown in Figure 3 (C).
CONCLUSION
Although many plant facilities and reaction mechanisms are expressed by physical models, Yokogawa proposes a hybrid physical and statistical model for the MIRROR PLANT, in order to cover phenomena that cannot be expressed only by physical models. This paper has also introduced the M-JIT modeling used in the MIRROR PLANT that updates statistical models on-line. Yokogawa will expand the modeling coverage of the MIRROR PLANT by using this hybrid modeling technology of physical and statistical models.
Figure 3 Estimation results in the methane steam reforming process
REFERENCES
(1) Manabu Kano, Morimasa Ogawa, “Repor t on Questionnaire regarding Advanced Process Control”, SICE 10th conference on control department, SY0004/10/0000-16121, 2010 in Japanese
(2) K.Fujiwara, M.Kano, S.Hasebe, “Cor relat ion-based spect ral clustering for f lexible process monitoring,” Journal of Process Control, Vol. 21, Issue 10, 2011, pp. 1438-1448
(3) Gentaro Fukano, Yasushi Onoe, et al., “Application of Tracking Simulator to Steam Reforming Process,” Yokogawa Technical Report English Edition, No. 43, 2007, pp. 13-16
(4) M. Nakaya, X. Li, “On-line Tracking simulator with a hybrid of physical and Just-In-Time models,” Journal of Process Control, Vol. 23, Issue 2, 2013, pp. 171-178
* VisualModeler is a registered trademark of Omega Simulation Co., Ltd.
0.9
1.1
1.3
1.5
1.7
0 50 100 150 200 250 300 350
Learning area Y: with reference signals Z: without reference signals
Time [hour]
Time [hour]
Time [hour]
CH
4 Fee
d Fl
ow R
ate
[l/m
in]
0
1
2
3
4
5
6
7
8
58 108 158 208
MeasurementKalman filterJIT
CO
con
cent
ratio
n in
PR
OX
[ppm
]
Y: with reference signals
0
1
2
3
4
5
6
7
8
225 245 265 285 305
CO
con
cent
ratio
n in
PR
OX
[ppm
]
Z: without reference signals
(A) CH4 feed flow rate
(B) Estimated CO concentration in Y zone
(C) Estimated CO concentration in Z zone
MeasurementKalman filterJIT
2222