physical setting earth science - regents …...physical setting/earth science must be available for...
TRANSCRIPT

P.S./EARTH SCIENCE P.S./EARTH SCIENCE
The University of the State of New York
REGENTS HIGH SCHOOL EXAMINATION
PHYSICAL SETTING
EARTH SCIENCEThursday, January 25, 2018 — 9:15 a.m. to 12:15 p.m., only
The possession or use of any communications device is strictly prohibited when taking this examination. If you have or use any communications device, no matter how briefl y, your examination will be invalidated and no score will be calculated for you.
Use your knowledge of Earth science to answer all questions in this examination. Before you begin this examination, you must be provided with the 2011 Edition Reference Tables for Physical Setting/Earth Science. You will need these reference tables to answer some of the questions.
You are to answer all questions in all parts of this examination. You may use scrap paper to work out the answers to the questions, but be sure to record your answers on your answer sheet and in your answer booklet. A separate answer sheet for Part A and Part B–1 has been provided to you. Follow the instructions from the proctor for completing the student information on your answer sheet. Record your answers to the Part A and Part B–1 multiple-choice questions on this separate answer sheet. Record your answers for the questions in Part B–2 and Part C in your separate answer booklet. Be sure to fi ll in the heading on the front of your answer booklet.
All answers in your answer booklet should be written in pen, except for graphs and drawings, which should be done in pencil.
When you have completed the examination, you must sign the declaration printed on your separate answer sheet, indicating that you had no unlawful knowledge of the questions or answers prior to the examination and that you have neither given nor received assistance in answering any of the questions during the examination. Your answer sheet and answer booklet cannot be accepted if you fail to sign this declaration.
Notice …
A four-function or scientifi c calculator and a copy of the 2011 Edition Reference Tables for Physical Setting/Earth Science must be available for you to use while taking this examination.
DO NOT OPEN THIS EXAMINATION BOOKLET UNTIL THE SIGNAL IS GIVEN.

P.S./E. Sci.–Jan. ’18 [2]
1 The defl ection of Earth’s planetary winds is an example of(1) the Coriolis effect(2) the Doppler effect(3) convection(4) gravitational pull
2 The universe is approximately 13.8 billion years old. Compared to the age of the solar system, the age of the universe is approximately(1) the same age as the solar system(2) two times older than the solar system(3) three times older than the solar system(4) four times older than the solar system
3 Planets that are closest to the Sun are identifi ed as(1) low-density Jovian(2) low-density terrestrial(3) high-density Jovian(4) high-density terrestrial
4 Which process of the water cycle occurs when water absorbs 2260 Joules of heat energy per gram?(1) melting of ice(2) condensation of water vapor(3) evaporation of water(4) freezing of water
5 In which temperature zone of Earth’s atmosphere is the polar jet stream located?(1) lower thermosphere(2) lower mesosphere(3) upper stratosphere(4) upper troposphere
6 Arrows in the diagram below show three methods of energy transfer labeled A, B, and C.
CA
B
Which list correctly identifi es the energy transfer processes A, B, and C?(1) A–conduction (3) A–convection B–convection B–radiation C–radiation C–conduction(2) A–convection (4) A–conduction B–conduction B–radiation C–radiation C–convection
7 What is the relative humidity of the air when the dry-bulb temperature is 4°C and the dewpoint is �4°C?(1) 42% (3) 51%(2) 46% (4) 56%
Part A
Answer all questions in this part.
Directions (1–35): For each statement or question, choose the word or expression that, of those given, best completes the statement or answers the question. Some questions may require the use of the 2011 Edition Reference Tables for Physical Setting/Earth Science. Record your answers on your separate answer sheet.

P.S./E. Sci.–Jan. ’18 [3] [OVER]
8 The diagram below represents the light spectra given off by the same element as observed under two different conditions. Spectrum A was observed when that element was heated in a laboratory. Spectrum B shows the same element as seen in the light from a distant star.
Spectrum A:(laboratory)
Spectrum B:(distant star)
Violet Red
Violet Red
The light spectrum observed from this distant star shows a(1) red shift, which indicates that the star is moving away from Earth(2) red shift, which indicates that the star is moving toward Earth(3) blue shift, which indicates that the star is moving away from Earth(4) blue shift, which indicates that the star is moving toward Earth
9 The diagrams below represent the constellations seen by an observer in New York State while looking toward the southern horizon at midnight on July 9 and January 8.
Southern horizonJuly 9
CygnusLyra
Aquila
CapricornusSagittarius
Leo
Canis Minor
Gemini Auriga
Taurus
Orion
Canis Major
Scorpius
Southern horizonJanuary 8
Which motion is mainly responsible for the difference in the constellations visible at midnight on these two dates?(1) The Sun orbits Earth. (3) The stars in the constellations orbit Earth.(2) Earth orbits the Sun. (4) Earth orbits the stars in the constellations.

P.S./E. Sci.–Jan. ’18 [4]
10 Which graph best shows the general relationship between air pressure and altitude?
Air Pressure
Alt
itu
de
( 1 )Air Pressure
Alt
itu
de
( 3 )
Air Pressure
Alt
itu
de
( 2 )Air Pressure
Alt
itu
de
( 4 )
11 Most clouds form in the atmosphere when moist air(1) rises, expands, and cools to the dewpoint(2) rises, expands, and warms to the dewpoint(3) sinks, compresses, and cools to the dewpoint(4) sinks, compresses, and warms to the dewpoint
12 Equal areas of which surface would absorb the greatest amount of insolation on a sunny day?(1) light-colored, smooth surface(2) light-colored, rough surface(3) dark-colored, smooth surface(4) dark-colored, rough surface
13 Which natural event periodically weakens western surface ocean currents in the equatorial Pacifi c Ocean, resulting in a change in air temperature and precipitation patterns in the United States?(1) El Nino (3) ocean tides(2) transpiration (4) volcanic eruptions
14 Ocean gyres in the Northern Hemisphere consist of a number of surface ocean currents that, together, generally fl ow clockwise in a roughly circular pattern. Which list contains three warm surface ocean currents that make up most of the North Atlantic Ocean gyre?(1) Kuroshio Current, North Pacifi c Current,
and California Current(2) Canary Current, North Equatorial Current,
and Equatorial Countercurrent(3) Labrador Current, North Atlantic Current,
and East Greenland Current(4) North Equatorial Current, Gulf Stream
Current, and North Atlantic Current
15 Most of the oceanic oxygen that began to enter Earth’s atmosphere in the early Proterozoic Era was probably produced by(1) formation of silicate rocks(2) photosynthesis by cyanobacteria(3) impact events on Earth’s surface(4) outgassing from volcanoes
16 During which geologic period did plants and animals fi rst appear in land environments?(1) Cambrian (3) Silurian(2) Ordovician (4) Devonian
17 Sedimentary rock layers that were deposited between 488 million and 444 million years ago are found on the surface at which two New York State locations?(1) Ithaca and Jamestown(2) Utica and Syracuse(3) Oswego and Old Forge(4) Albany and Massena
18 A volcanic ash layer is a good geologic time marker for correlating rock layers because the ash layer was deposited over a(1) limited geographic area over a short time(2) limited geographic area over a long time(3) wide geographic area over a short time(4) wide geographic area over a long time

P.S./E. Sci.–Jan. ’18 [5] [OVER]
19 The photograph below shows the results of a landslide.
This landslide is an example of(1) wind abrasion (3) wave action(2) glacial deposition (4) mass movement
20 Which cross section correctly represents a cold front and the air-mass movements associated with this front?
Warm air mass
( 1 ) ( 3 )
( 2 ) ( 4 )
Earth’s surface Earth’s surface
Earth’s surface Earth’s surface
Frontal boundary
Frontal boundaryColdair mass
Frontal boundary
Frontal boundary
Cold air mass
Warmair mass
Warm air mass
Cold air mass
Cold air mass Warm air
mass

P.S./E. Sci.–Jan. ’18 [6]
21 Earth’s interior at a depth of 3500 kilometers is believed to be(1) liquid at a temperature of approximately
4900°C(2) solid at a temperature of approximately
4900°C(3) liquid at a temperature of approximately
5400°C(4) solid at a temperature of approximately
5400°C
22 Compared to the density and composition of the oceanic crust, the continental crust is(1) less dense and more mafi c(2) less dense and more felsic(3) more dense and less mafi c(4) more dense and less felsic
23 An earthquake occurs at 10:05 a.m. At 10:09 a.m., the fi rst P-wave from this earthquake is detected at a seismic station. Approximately how many kilometers (km) from the epicenter is this seismic station located?(1) 1000 km (3) 2600 km(2) 2000 km (4) 5600 km
24 The aerial photograph below shows two streams that have been displaced by tectonic movement along the San Andreas fault. The arrows show the relative direction of movement along the fault.
Fault
This movement occurred along which type of plate boundary?(1) convergent (3) transform(2) divergent (4) complex
25 The magnitude of an earthquake is a number that represents the(1) arrival time of the fi rst P-wave(2) difference in arrival times between P- and S-
waves(3) distance to the epicenter(4) energy released by an earthquake
26 The Genesee River fl ows across both the Allegheny Plateau and the Erie-Ontario Lowlands in New York State. This river fl ows(1) northward, in the same general direction as
the Hudson River(2) northward, in the same general direction as
the Niagara River(3) southward, in the same general direction as
the Hudson River(4) southward, in the same general direction as
the Niagara River
27 What is the name of the largest sediment that can be transported by a stream moving at a velocity of 100 centimeters per second (cm/s)?(1) silt (3) pebbles(2) sand (4) cobbles
28 Which mineral is commonly used as an abrasive?(1) garnet (3) sulfur(2) halite (4) graphite
29 If a metamorphic rock bubbles when a drop of acid is placed on its surface, the rock is most likely(1) schist (3) marble(2) slate (4) quartzite
P.S./E. Sci.–Jan. ’18 [7] [OVER]
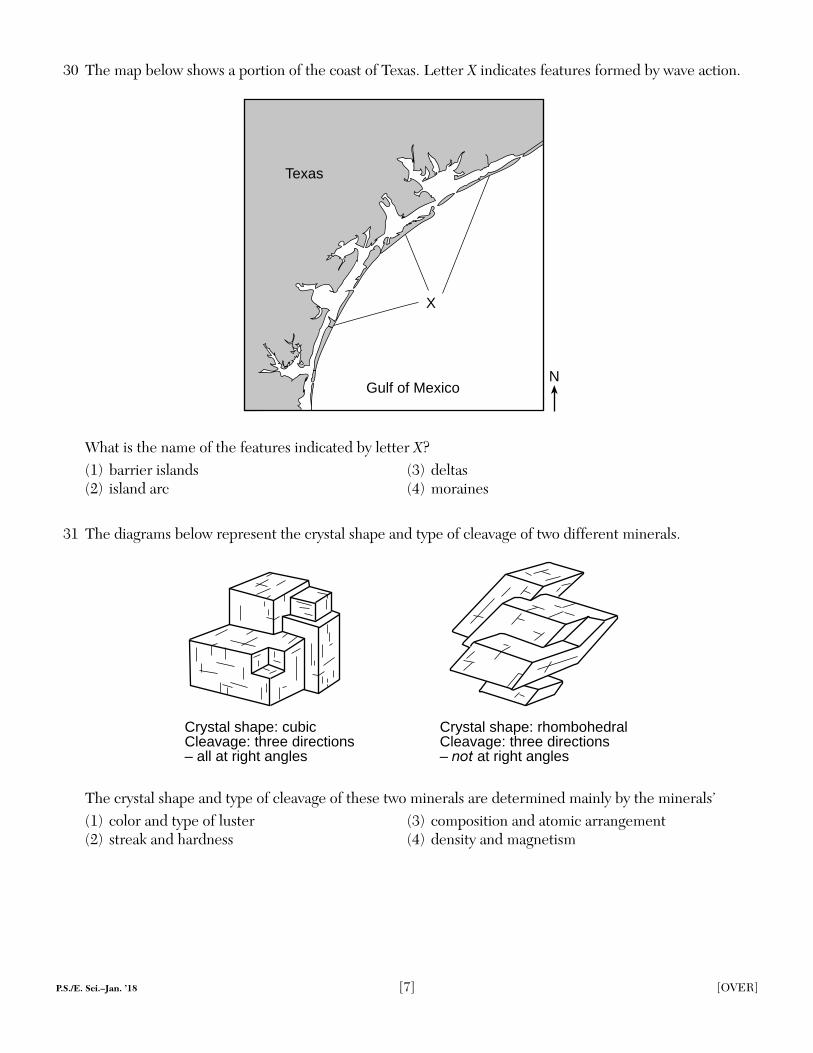
30 The map below shows a portion of the coast of Texas. Letter X indicates features formed by wave action.
N
Texas
Gulf of Mexico
X
What is the name of the features indicated by letter X?(1) barrier islands (3) deltas(2) island arc (4) moraines
31 The diagrams below represent the crystal shape and type of cleavage of two different minerals.
Crystal shape: cubicCleavage: three directions– all at right angles
Crystal shape: rhombohedralCleavage: three directions– not at right angles
The crystal shape and type of cleavage of these two minerals are determined mainly by the minerals’(1) color and type of luster (3) composition and atomic arrangement(2) streak and hardness (4) density and magnetism

P.S./E. Sci.–Jan. ’18 [8]
32 The block diagram below represents a meandering stream.
Outsideof the curve
Insideof the curve
Which table indicates where the greatest stream velocity and the greatest rate of stream erosion occur?
Greatest Stream Velocity
Greatest Stream Erosion
Greatest Stream Velocity
Greatest Stream Erosion
outside of the curve outside of the curve inside of the curve inside of the curve
( 1 ) ( 3 )
Greatest Stream Velocity
Greatest Stream Erosion
Greatest Stream Velocity
Greatest Stream Erosion
outside of the curve inside of the curve inside of the curve outside of the curve
( 2 ) ( 4 )
33 The diagram below represents the size and shape of a pebble. This pebble and 20 other pebbles having a similar size and shape were placed in a rock tumbler with water and allowed to abrade for fi ve days.
Pebble
Which diagram best represents the size and shape of this pebble after the fi ve-day period?
( 1 ) ( 2 ) ( 3 ) ( 4 )

P.S./E. Sci.–Jan. ’18 [9] [OVER]
34 The photograph below shows bedrock composed of sediments that have been deposited by wind.
This bedrock is most likely(1) sandstone (3) hornfels(2) limestone (4) granite
35 Which diagram below best represents both the relative wavelength of visible light entering a house through a window and the relative wavelength of infrared rays being given off by a table within the house?
( 4 )
WindowTable
( 3 )
WindowTable
( 1 )
WindowTable
Visiblelight
Visiblelight
( 2 )
WindowTable
Infrared ra
y
Infrared ra
y
Infrared ra
y
Infrared ra
yVisiblelight
Visiblelight

P.S./E. Sci.–Jan. ’18 [10]
Base your answers to questions 36 and 37 on the maps below and on your knowledge of Earth science. The maps show a portion of India and Southeast Asia, bordering on the Indian Ocean, during the winter and summer monsoon seasons. Large areas of high and low air pressure are shown during each season.
India
Low Low
India
High High
High Low
Winter Monsoon Summer Monsoon
36 Which two-letter symbol represents the most likely air mass formed over portions of the Indian Ocean shown on the maps?(1) mP (3) cP(2) mT (4) cT
37 The heavy monsoon rains affecting India and Southeast Asia occur during(1) winter, when winds blow from the land(2) winter, when winds blow toward the high pressure(3) summer, when winds blow from the ocean(4) summer, when winds blow toward the high pressure
Part B–1
Answer all questions in this part.
Directions (36–50): For each statement or question, choose the word or expression that, of those given, best completes the statement or answers the question. Some questions may require the use of the 2011 Edition Reference Tables for Physical Setting/Earth Science. Record your answers on your separate answer sheet.

P.S./E. Sci.–Jan. ’18 [11] [OVER]
Base your answers to questions 38 through 40 on the graph below and on your knowledge of Earth science. The graph shows the closest distance between Earth and Mars during each year from 2001 to 2035. Distances are measured in astronomical units (AU). One AU equals the average distance from Earth to the Sun.
Year
Dis
tan
ce (
AU
)
0.3
Closest Distance Each Year Between Earth and Mars
0.4
0.5
0.6
0.7
0.8
2001 2003 2005 2007 2009 2011 2013 2015 2017 2019 2021 2023 2025 2027 2029 2031 2033 2035
38 Mars reaches its closest distance to Earth approximately every(1) 16 years (3) 3 years(2) 8 years (4) 0.36 years
39 How many million kilometers is one astronomical unit?(1) 108.2 million km (3) 227.9 million km(2) 149.6 million km (4) 377.5 million km
40 The diagram below represents the positions of Earth and Mars in their orbits around the Sun when they were closest in the year 2003.
Sun Mars
Earth
(Not drawn to scale)
Which diagram represents the positions of Earth and Mars approximately one-half of an Earth year (183 days) later?
Sun
( 1 )
Mars
Earth
Sun
( 3 )
Mars
Sun
( 2 )
Earth
Mars
Sun
( 4 )
Earth
Mars
Earth

P.S./E. Sci.–Jan. ’18 [12]
Base your answers to questions 41 through 44 on the three Sun’s path diagrams below and on your knowledge of Earth science. The diagrams represent the position of the noon Sun along its apparent daily path as seen by an observer on the fi rst day of three consecutive months (X, Y, and Z). The observer was located in Utica, New York.
W
N
Month X
Noon Sun35°
E
S
Month Y
Noon Sun42°
Month Z
Noon Sun50°
Observer
W
N
E
S Observer
W
N
E
S Observer
41 Which dates are represented by months X, Y, and Z?(1) X-February 1, Y-March 1, Z-April 1 (3) X-August 1, Y-September 1, Z-October 1(2) X-May 1, Y-June 1, Z-July 1 (4) X-November 1, Y-December 1, Z-January 1
42 Which characteristic of the Sun’s apparent daily path stays constant from month X to month Z?(1) locations of sunrise and sunset(2) altitude of the noon Sun(3) length of time that the Sun moves along its apparent path(4) rate of the Sun’s movement along its apparent path
43 For an observer in the Southern Hemisphere at 43° S latitude, the highest altitude of the noon Sun occurs when the Sun is above the(1) eastern horizon (3) northern horizon(2) western horizon (4) southern horizon
44 Position A represents the position of the Sun at another time of day during month Z. What is the time of day when the Sun is at position A?
Month Z
Noon Sun50°
W
N
E
S Observer
Position A
(1) 1 p.m. (3) 7 a.m.(2) 5 p.m. (4) 11 a.m.

P.S./E. Sci.–Jan. ’18 [13] [OVER]
Base your answers to questions 45 through 47 on the geologic cross section of a portion of Earth’s crust shown below and on your knowledge of Earth science. None of the rock units has been overturned.
Gabbro
Key
Contactmetamorphism
Granite
45 The youngest rock unit shown in the cross section is(1) breccia (3) sandstone(2) conglomerate (4) shale
46 Which process most probably produced the irregularly shaped boundary between the limestone and the shale?(1) folding (3) contact metamorphism(2) faulting (4) erosion
47 Which sequence shows the relative ages of the gabbro, granite, and schist from oldest to youngest?(1) gabbro —› granite —› schist (3) schist —› granite —› gabbro(2) gabbro —› schist —› granite (4) schist —› gabbro —› granite

P.S./E. Sci.–Jan. ’18 [14]
Base your answers to questions 48 through 50 on the cross section below and on your knowledge of Earth science. The cross section represents the landscape features and rock units of the Grand Canyon region in the southwestern United States. The names and ages of some rock formations are shown.
Tapeats
Shinumo Quartzite
ColoradoRiver
Supai
Hermit
KaibabPlateau
Red Butte
PERMIAN
MISSISSIPPIAN
CAMBRIAN
RedwallCliffs
Bright Angel
PRECAMBRIAN
Muav
Coconino
Redwall
ZoroasterGranite
Algonkian WedgeDiabase
Vishnu Schist
Vishnu Schist
48 Which agent of erosion is mainly responsible for the formation of the Grand Canyon?(1) running water (3) wind(2) glacial ice (4) wave action
49 Approximately how many million years ago (mya) was the Coconino sandstone deposited as sediment?(1) 180 mya (3) 330 mya(2) 275 mya (4) 495 mya
50 If the climate of the Grand Canyon region became more humid, the rate of weathering and erosion would most likely(1) decrease, and the landscape features would become more rounded(2) decrease, and the landscape features would become more angular(3) increase, and the landscape features would become more rounded(4) increase, and the landscape features would become more angular

P.S./E. Sci.–Jan. ’18 [15] [OVER]
Base your answers to questions 51 and 52 on the diagram and data table below, and on your knowledge of Earth science. The diagram represents the laboratory materials used for an investigation of the effects of particle size on water retention. Five separate columns were fi lled to the same level with particles. The particle type is indicated for each column. The particles within each column are of uniform shape. A volume of 50 milliliters (mL) of water was poured through each column, and the amount of water retained was determined. The data table shows the results of this experiment.
(Not drawn to scale)
Screen
Empty beaker
SiltFinesand
Screen
Empty beaker
Coarsesand
Screen
Empty beaker
Finepebbles
Screen
Empty beaker
Coarsepebbles
Screen
Empty beaker
Water Retention
Particle Type(size)
Water Retained(mL)
Coarse pebbles 7
Fine pebbles 15
Coarse sand 32
Fine sand 38
Silt 46
51 Describe the general relationship between particle size and the amount of water retained. [1]
52 Name the particle type used in the investigation that most likely had the greatest permeability when the 50 milliliters of water were poured through these columns. [1]
Part B–2
Answer all questions in this part.
Directions (51–65): Record your answers in the spaces provided in your answer booklet. Some questions may require the use of the 2011 Edition Reference Tables for Physical Setting/Earth Science.

P.S./E. Sci.–Jan. ’18 [16]
Base your answers to questions 53 through 55 on the passage and the Characteristics of Stars graph below, and your knowledge of Earth science. Letters A, B, and C represent main sequence stars on the graph. The giant star Aldebaran is also shown.
Globular Star ClustersGlobular star clusters appear as small, hazy spots among the other stars. These
clusters are groups of hundreds of thousands of stars held together by gravity. Individual stars within a cluster can be seen by using powerful telescopes, allowing scientists to determine their luminosities and temperatures.
All of the stars in a given cluster formed at the same time. In young clusters, most of the stars are classifi ed as main sequence stars. As the stars in a cluster age, they eventually use up their core hydrogen and expand, changing from main sequence stars to giants. The most massive main sequence stars become supergiants. The less massive a star is in the cluster, the longer it remains a main sequence star. Over time, the number of main sequence stars in a cluster decreases.
Characteristics of Stars
Color
Surface Temperature (K)
0.0001
0.001
0.01
0.1
1
10
100
1,000
10,000
100,000
1,000,000
Lu
min
osi
ty(R
ate
at w
hich
a s
tar
emits
ene
rgy
rela
tive
to th
e S
un)
20,000 10,000 8,000 6,000 4,000 3,000
Blue Blue White White Yellow
2,000
RedOrange
SUPERGIANTS(Intermediate stage)
(Intermediate stage)GIANTS
Aldebaran
SmallStars
MassiveStars
WHITE DWARFS(Late stage)
MAIN SEQUENCE
(Early stage)
30,000
B
A
C

P.S./E. Sci.–Jan. ’18 [17] [OVER]
53 Compared to the relative amount of time that star A remains in the main sequence, state how the relative amount of time that star C remains in the main sequence is different. Explain why this amount of time is different. [1]
54 The globular star cluster containing stars A, B, and C is located in the same galaxy as our Sun. Identify the name of this galaxy. [1]
55 Identify the nuclear process that uses up a star’s core hydrogen and produces the energy released by stars in a globular cluster. [1]
Base your answers to questions 56 through 58 on the topographic map in your answer booklet and on your knowledge of Earth science. Points A and B represent locations on Earth’s surface. Elevations are shown in feet. The 50-ft and 55-ft contour lines are not shown on the map.
56 On the map in your answer booklet, draw the 50-ft and 55-ft contour lines. The contour lines must extend to the edges of the map. [1]
57 Calculate the gradient between points A and B. [1]
58 Identify the general compass direction toward which Ames Stream fl ows. Describe the contour line evidence shown on the map that supports your answer. [1]
Base your answers to questions 59 through 61 on the map in your answer booklet and on your knowledge of Earth science. The map shows an imaginary continent on a planet that has climate conditions similar to Earth. The continent is surrounded by oceans. Points A through D represent locations on the continent.
59 On the map in your answer booklet, draw one curved arrow between 0° and 30° N to indicate the direction of prevailing planetary winds between these latitudes. [1]
60 Compared to the average air temperature and the average moisture conditions at A, describe how the relative average air temperature and the relative average moisture conditions at B are different. [1]
61 Identify the primary factor that causes location C to have a colder climate than location D. [1]

P.S./E. Sci.–Jan. ’18 [18]
Base your answers to questions 62 through 65 on the map below and on your knowledge of Earth science. The map shows areas of daylight and darkness in New York State on March 21. Six locations are labeled on the map.
76°77°78°79°
Daytime-Nighttimeboundary
42°
43°
75° 74°
79° 78° 77°
76°
75° 74° 73°45°
44°
43°
42°
41°
Buffalo
Elmira
Watertown
Albany
Slide Mt.
N
Syracuse
73°
62 Identify the Earth motion that causes the daytime-nighttime boundary to appear to move. [1]
63 State the number of hours of nighttime that people in Syracuse will experience on March 21. [1]
64 State the name of the location labeled on this map where sunset will next be observed after Syracuse. [1]
65 State the altitude of Polaris as seen by an observer on Slide Mountain. [1]

P.S./E. Sci.–Jan. ’18 [19] [OVER]
Base your answers to questions 66 through 68 on the map and passage below and on your knowledge of Earth science. The map shows isolines that represent the thickness of a portion of the Greenland Ice Sheet in meters (m). Letters A and B represent points on the ice sheet’s surface.
BaffinBay
500
2500
3000
10001500
2000
2000
1500
1000
500
2500Greenland
Sea
0 0
Thickness of Greenland Ice Sheet
A B
N
Greenland Ice SheetThe Greenland Ice Sheet is a vast body of ice covering roughly 80 percent of the
surface of Greenland. The ice sheet is almost 2400 kilometers long in a north-south direction. The ice sheet, consisting of layers of snow compressed over more than 100,000 years, contains a valuable record about Earth’s past climates. The ice sheet glaciers continue to fl ow seaward and deposit sediment, but global warming has affected them. Warmer air temperatures have caused increased melting, resulting in a thinning of the ice sheet and faster glacial movement at the ice sheet edges.
66 On the grid in your answer booklet, construct a profi le along line AB by plotting the thickness of the ice sheet where each isoline crosses line AB. Thicknesses of the ice sheet at A and B have been plotted on the grid. Connect all twelve plots with a line from A to B to complete the profi le. [1]
67 Describe one glacial feature that could be found on the exposed surface bedrock of Greenland that would indicate the direction that the ice moved. [1]
68 Identify two major greenhouse gases that are inferred to contribute to global warming and increased temperatures in Greenland. [1]
Part C
Answer all questions in this part.
Directions (66–85): Record your answers in the spaces provided in your answer booklet. Some questions may require the use of the 2011 Edition Reference Tables for Physical Setting/Earth Science.

P.S./E. Sci.–Jan. ’18 [20]
Base your answers to questions 69 through 71 on the data table below, on the graph in your answer booklet, and on your knowledge of Earth science. The data table shows the percentage of the stable disintegration product produced over time by the radioactive decay of isotope X after each half-life. The graph shows the percentage of radioactive isotope X remaining over time during the radioactive decay of isotope X.
Disintegration Product of Isotope X
Percentage of StableDisintegration Product
(%)
Time(years)
Number ofHalf-Lives
0 0 0
50 5700 1
75 11,400 2
87.5 17,100 3
93.75 22,800 4
69 On the graph in your answer booklet, plot the percentage of stable disintegration product for each of the times shown on the data table and connect all fi ve plots with a line. [1]
70 Determine the number of years (y) it takes for only 25% of radioactive isotope X to remain in a sample. [1]
71 Identify radioactive isotope X and its stable disintegration product. [1]
Base your answers to questions 72 through 75 on the diagram in your answer booklet and on your knowledge of Earth science. The diagram represents two positions of the Moon as it orbits Earth. Positions 1 and 2 are on opposite sides of Earth. Point C represents the location of a crater on the Moon’s surface when the Moon is at position 1.
72 On the diagram in your answer booklet, draw a dot (•) on the Moon at position 2 to indicate the location of crater C when the Moon is at position 2. [1]
73 On the diagram in your answer booklet, place an X on the Moon’s orbit to indicate the position of the Moon when a lunar eclipse could be viewed from Earth. [1]
74 Determine the number of days needed for the Moon to move from position 1 to position 2, completing one-half of its orbit. [1]
75 On the diagram in your answer booklet, shade the portion of the Moon that is in darkness as viewed from New York State when the Moon is at position 1. [1]

P.S./E. Sci.–Jan. ’18 [21] [OVER]
Base your answers to questions 76 through 78 on the weather map below and on your knowledge of Earth science. On the weather map, the location of the center of a high-pressure system (H) and a front are shown. Isobar values are labeled in millibars (mb). Weather station models represent the weather conditions at Atlanta, Georgia, and Tampa, Florida.
H
7375 171
23258
N
1016
1012
1016
1020
1028
48Atlanta
Tampa
1024
1024
76 Complete the table in your answer booklet with the actual weather conditions represented by the weather station model at Atlanta, Georgia. [1]
77 Identify the type of front shown on the map. [1]
78 Describe one piece of evidence shown on the map that indicates that Tampa, Florida, has a high probability of precipitation. [1]

P.S./E. Sci.–Jan. ’18 [22]
Base your answers to questions 79 through 81 on the map below and on your knowledge of Earth science. The map shows the surface location of a tectonic plate boundary along the western coast of South America. The Mid-Atlantic Ridge is also shown. Points A through D represent locations on Earth’s surface.
South AmericaPacific Ocean
B C
NM
id-A
tlant
ic R
idge
Atlantic Ocean
A
Boundary
SurfaceP
late
D
79 Identify the names of the tectonic plates at locations A and B. [1]
80 Compared to the relative age of the surface oceanic bedrock at location C, state the relative age of the surface oceanic bedrock at location D. Explain why this difference in relative age occurs. [1]
81 Identify the term for the large ocean wave produced by offshore earthquakes that is hazardous to humans living along the west coast of South America. Describe one emergency action that should be taken to avoid loss of life when a warning for an approaching large wave has been given. [1]

P.S./E. Sci.–Jan. ’18 [23]
Base your answers to questions 82 through 85 on the fl owchart below and on your knowledge of Earth science. Letters A through D represent information that is missing in the chart.
Rock
Sedimentary A
Basalt Gabbro
Igneous
DPhyllite
Foliated Nonfoliated
Rock salt
Crystalline
CSandstone
Clastic Fine B
ExampleExampleExampleExampleExampleExampleExample
Bioclastic
Texture Texture Texture
82 Complete the table in your answer booklet by writing the missing information represented by letters A through D. [1]
83 Identify the two elements that make up the chemical composition of the mineral in rock salt. [1]
84 The pie graph below shows the percentages of four minerals that compose the igneous rock gabbro. Letter X represents one of the minerals.
X
Pyroxene
Amphibole
Olivine
Identify the mineral represented by letter X in the graph. [1]
85 Identify the name of one foliated rock formed when phyllite undergoes increased heat and pressure. [1]

P.S./EARTH SCIENCE P.S./EARTH SCIENCE
Printed on Recycled Paper