physical review d 112003 (2011) evidence for a mass
TRANSCRIPT
Evidence for a mass dependent forward-backward asymmetry in top quark pair production
T. Aaltonen,21 B. Alvarez Gonzalez,9,w S. Amerio,41a D. Amidei,32 A. Anastassov,36 A. Annovi,17 J. Antos,12
G. Apollinari,15 J. A. Appel,15 A. Apresyan,46 T. Arisawa,56 A. Artikov,13 J. Asaadi,51 W. Ashmanskas,15
B. Auerbach,59 A. Aurisano,51 F. Azfar,40 W. Badgett,15 A. Barbaro-Galtieri,26 V. E. Barnes,46 B. A. Barnett,23
P. Barria,44c,44a P. Bartos,12 M. Bauce,41b,41a G. Bauer,30 F. Bedeschi,44a D. Beecher,28 S. Behari,23 G. Bellettini,44b,44a
J. Bellinger,58 D. Benjamin,14 A. Beretvas,15 A. Bhatti,48 M. Binkley,15,a D. Bisello,41b,41a I. Bizjak,28,aa K. R. Bland,5
B. Blumenfeld,23 A. Bocci,14 A. Bodek,47 D. Bortoletto,46 J. Boudreau,45 A. Boveia,11 B. Brau,15,b L. Brigliadori,6b,6a
A. Brisuda,12 C. Bromberg,33 E. Brucken,21 M. Bucciantonio,44b,44a J. Budagov,13 H. S. Budd,47 S. Budd,22 K. Burkett,15
G. Busetto,41b,41a P. Bussey,19 A. Buzatu,31 C. Calancha,29 S. Camarda,4 M. Campanelli,33 M. Campbell,32 F. Canelli,12,15
A. Canepa,43 B. Carls,22 D. Carlsmith,58 R. Carosi,44a S. Carrillo,16,l S. Carron,15 B. Casal,9 M. Casarsa,15 A. Castro,6b,6a
P. Catastini,15 D. Cauz,52a V. Cavaliere,44c,44a M. Cavalli-Sforza,4 A. Cerri,26,g L. Cerrito,28,r Y. C. Chen,1 M. Chertok,7
G. Chiarelli,44a G. Chlachidze,15 F. Chlebana,15 K. Cho,25 D. Chokheli,13 J. P. Chou,20 W.H. Chung,58 Y. S. Chung,47
C. I. Ciobanu,42 M.A. Ciocci,44c,44a A. Clark,18 G. Compostella,41b,41a M. E. Convery,15 J. Conway,7 M. Corbo,42
M. Cordelli,17 C. A. Cox,7 D. J. Cox,7 F. Crescioli,44b,44a C. Cuenca Almenar,59 J. Cuevas,9,w R. Culbertson,15
D. Dagenhart,15 N. d’Ascenzo,42,u M. Datta,15 P. de Barbaro,47 S. De Cecco,49a G. De Lorenzo,4 M. Dell’Orso,44b,44a
C. Deluca,4 L. Demortier,48 J. Deng,14,d M. Deninno,6a F. Devoto,21 M. d’Errico,41b,41a A. Di Canto,44b,44a B. Di Ruzza,44a
J. R. Dittmann,5 M. D’Onofrio,27 S. Donati,44b,44a P. Dong,15 M. Dorigo,52a T. Dorigo,41a K. Ebina,56 A. Elagin,51
A. Eppig,32 R. Erbacher,7 D. Errede,22 S. Errede,22 N. Ershaidat,42,z R. Eusebi,51 H. C. Fang,26 S. Farrington,40
M. Feindt,24 J. P. Fernandez,29 C. Ferrazza,44d,44a R. Field,16 G. Flanagan,46,s R. Forrest,7 M. J. Frank,5 M. Franklin,20
J. C. Freeman,15 Y. Funakoshi,56 I. Furic,16 M. Gallinaro,48 J. Galyardt,10 J. E. Garcia,18 A. F. Garfinkel,46
P. Garosi,44c,44a H. Gerberich,22 E. Gerchtein,15 S. Giagu,49b,49a V. Giakoumopoulou,3 P. Giannetti,44a K. Gibson,45
C.M. Ginsburg,15 N. Giokaris,3 P. Giromini,17 M. Giunta,44a G. Giurgiu,23 V. Glagolev,13 D. Glenzinski,15 M. Gold,35
D. Goldin,51 N. Goldschmidt,16 A. Golossanov,15 G. Gomez,9 G. Gomez-Ceballos,30 M. Goncharov,30 O. Gonzalez,29
I. Gorelov,35 A. T. Goshaw,14 K. Goulianos,48 A. Gresele,41a S. Grinstein,4 C. Grosso-Pilcher,11 R. C. Group,55
J. Guimaraes da Costa,20 Z. Gunay-Unalan,33 C. Haber,26 S. R. Hahn,15 E. Halkiadakis,50 A. Hamaguchi,39 J. Y. Han,47
F. Happacher,17 K. Hara,53 D. Hare,50 M. Hare,54 R. F. Harr,57 K. Hatakeyama,5 C. Hays,40 M. Heck,24 J. Heinrich,43
M. Herndon,58 S. Hewamanage,5 D. Hidas,50 A. Hocker,15 W. Hopkins,15,h D. Horn,24 S. Hou,1 R. E. Hughes,37
M. Hurwitz,11 U. Husemann,59 N. Hussain,31 M. Hussein,33 J. Huston,33 G. Introzzi,44a M. Iori,49b,49a A. Ivanov,7,p
E. James,15 D. Jang,10 B. Jayatilaka,14 E. J. Jeon,25 M.K. Jha,6a S. Jindariani,15 W. Johnson,7 M. Jones,46 K.K. Joo,25
S. Y. Jun,10 T. R. Junk,15 T. Kamon,51 P. E. Karchin,57 Y. Kato,39,b W. Ketchum,11 J. Keung,43 V. Khotilovich,51
B. Kilminster,15 D.H. Kim,25 H. S. Kim,25 H.W. Kim,25 J. E. Kim,25 M. J. Kim,17 S. B. Kim,25 S. H. Kim,53 Y.K. Kim,11
N. Kimura,56 M. Kirby,15 S. Klimenko,16 K. Kondo,56 D. J. Kong,25 J. Konigsberg,16 A.V. Kotwal,14 M. Kreps,24
J. Kroll,43 D. Krop,11 N. Krumnack,5,m M. Kruse,14 V. Krutelyov,51,e T. Kuhr,24 M. Kurata,53 S. Kwang,11
A. T. Laasanen,46 S. Lami,44a S. Lammel,15 M. Lancaster,28 R. L. Lander,7 K. Lannon,37,v A. Lath,50 G. Latino,44c,44a
I. Lazzizzera,41a T. LeCompte,2 E. Lee,51 H. S. Lee,11 J. S. Lee,25 S.W. Lee,51,x S. Leo,44b,44a S. Leone,44a J. D. Lewis,15
C.-J. Lin,26 J. Linacre,40 M. Lindgren,15 E. Lipeles,43 A. Lister,18 D.O. Litvintsev,15 C. Liu,45 Q. Liu,46 T. Liu,15
S. Lockwitz,59 N. S. Lockyer,43 A. Loginov,59 D. Lucchesi,41b,41a J. Lueck,24 P. Lujan,26 P. Lukens,15 G. Lungu,48 J. Lys,26
R. Lysak,12 R. Madrak,15 K. Maeshima,15 K. Makhoul,30 P. Maksimovic,23 S. Malik,48 G. Manca,27,c
A. Manousakis-Katsikakis,3 F. Margaroli,46 C. Marino,24 M. Martınez,4 R. Martınez-Balların,29 P. Mastrandrea,49a
M. Mathis,23 M. E. Mattson,57 P. Mazzanti,6a K. S. McFarland,47 P. McIntyre,51 R. McNulty,27,j A. Mehta,27 P. Mehtala,21
A. Menzione,44a C. Mesropian,48 T. Miao,15 D. Mietlicki,32 A. Mitra,1 H. Miyake,53 S. Moed,20 N. Moggi,6a
M.N. Mondragon,15,l C. S. Moon,25 R. Moore,15 M. J. Morello,15 J. Morlock,24 P. Movilla Fernandez,15 A. Mukherjee,15
Th. Muller,24 P. Murat,15 M. Mussini,6b,6a J. Nachtman,15,n Y. Nagai,53 J. Naganoma,56 I. Nakano,38 A. Napier,54
J. Nett,58 C. Neu,55 M. S. Neubauer,22 J. Nielsen,26,f L. Nodulman,2 O. Norniella,22 E. Nurse,28 L. Oakes,40
S. H. Oh,14 Y.D. Oh,25 I. Oksuzian,55 T. Okusawa,39 R. Orava,21 L. Ortolan,4 S. Pagan Griso,41b,41a C. Pagliarone,52a
E. Palencia,9,g V. Papadimitriou,15 A.A. Paramonov,2 J. Patrick,15 G. Pauletta,52b,52a M. Paulini,10 C. Paus,30
D. E. Pellett,7 A. Penzo,52a T. J. Phillips,14 G. Piacentino,44a E. Pianori,43 J. Pilot,37 K. Pitts,22 C. Plager,8 L. Pondrom,58
K. Potamianos,46 O. Poukhov,13,a F. Prokoshin,13,y A. Pronko,15 F. Ptohos,17,i E. Pueschel,10 G. Punzi,44b,44a
J. Pursley,58 A. Rahaman,45 V. Ramakrishnan,58 N. Ranjan,46 I. Redondo,29 P. Renton,40 M. Rescigno,49a
F. Rimondi,6b,6a L. Ristori,45,15 A. Robson,19 T. Rodrigo,9 T. Rodriguez,43 E. Rogers,22 S. Rolli,54 R. Roser,15
PHYSICAL REVIEW D 83, 112003 (2011)
1550-7998=2011=83(11)=112003(23) 112003-1 � 2011 American Physical Society

M. Rossi,52a F. Rubbo,15 F. Ruffini,44c,44a A. Ruiz,9 J. Russ,10 V. Rusu,15 A. Safonov,51 W.K. Sakumoto,47
Y. Sakurai,56 L. Santi,52b,52a L. Sartori,44a K. Sato,53 V. Saveliev,42,u A. Savoy-Navarro,42 P. Schlabach,15
A. Schmidt,24 E. E. Schmidt,15 M. P. Schmidt,59,a M. Schmitt,36 T. Schwarz,7 L. Scodellaro,9 A. Scribano,44c,44a
F. Scuri,44a A. Sedov,46 S. Seidel,35 Y. Seiya,39 A. Semenov,13 F. Sforza,44b,44a A. Sfyrla,22 S. Z. Shalhout,7 T. Shears,27
P. F. Shepard,45 M. Shimojima,53,t S. Shiraishi,11 M. Shochet,11 I. Shreyber,34 A. Simonenko,13 P. Sinervo,31
A. Sissakian,13,a K. Sliwa,54 J. R. Smith,7 F. D. Snider,15 A. Soha,15 S. Somalwar,50 V. Sorin,4 P. Squillacioti,15
M. Stancari,15 M. Stanitzki,59 R. St. Denis,19 B. Stelzer,31 O. Stelzer-Chilton,31 D. Stentz,36 J. Strologas,35
G. L. Strycker,32 Y. Sudo,53 A. Sukhanov,16 I. Suslov,13 K. Takemasa,53 Y. Takeuchi,53 J. Tang,11 M. Tecchio,32
P. K. Teng,1 J. Thom,15,h J. Thome,10 G. A. Thompson,22 E. Thomson,43 P. Ttito-Guzman,29 S. Tkaczyk,15
D. Toback,51 S. Tokar,12 K. Tollefson,33 T. Tomura,53 D. Tonelli,15 S. Torre,17 D. Torretta,15 P. Totaro,52b,52a
M. Trovato,44d,44a Y. Tu,43 F. Ukegawa,53 S. Uozumi,25 A. Varganov,32 F. Vazquez,16,l G. Velev,15 C. Vellidis,3
M. Vidal,29 I. Vila,9 R. Vilar,9 M. Vogel,35 G. Volpi,44b,44a P. Wagner,43 R. L. Wagner,15 T. Wakisaka,39
R. Wallny,8 S.M. Wang,1 A. Warburton,31 D. Waters,28 M. Weinberger,51 W.C. Wester III,15 B. Whitehouse,54
D. Whiteson,43,d A. B. Wicklund,2 E. Wicklund,15 S. Wilbur,11 F. Wick,24 H.H. Williams,43 J. S. Wilson,37
P. Wilson,15 B. L. Winer,37 P. Wittich,15,h S. Wolbers,15 H. Wolfe,37 T. Wright,32 X. Wu,18 Z. Wu,5
K. Yamamoto,39 J. Yamaoka,14 T. Yang,15,o U. K. Yang,11,q Y. C. Yang,25 W.-M. Yao,26 G. P. Yeh,15 K. Yi,15,n
J. Yoh,15 K. Yorita,56 T. Yoshida,39,k G. B. Yu,14 I. Yu,25 S. S. Yu,15 J. C. Yun,15 A. Zanetti,52a
Y. Zeng,14 and S. Zucchelli6b,6a
(CDF Collaboration)
1Institute of Physics, Academia Sinica, Taipei, Taiwan 11529, Republic of China2Argonne National Laboratory, Argonne, Illinois 60439, USA
3University of Athens, 157 71 Athens, Greece4Institut de Fisica d’Altes Energies, Universitat Autonoma de Barcelona, E-08193, Bellaterra (Barcelona), Spain
5Baylor University, Waco, Texas 76798, USA6aIstituto Nazionale di Fisica Nucleare Bologna, I-40127 Bologna, Italy
6bUniversity of Bologna, I-40127 Bologna, Italy7University of California, Davis, Davis, California 95616, USA
8University of California, Los Angeles, Los Angeles, California 90024, USA9Instituto de Fisica de Cantabria, CSIC-University of Cantabria, 39005 Santander, Spain
10Carnegie Mellon University, Pittsburgh, Pennsylvania 15213, USA11Enrico Fermi Institute, University of Chicago, Chicago, Illinois 60637, USA
12Comenius University, 842 48 Bratislava, Slovakia; Institute of Experimental Physics, 040 01 Kosice, Slovakia13Joint Institute for Nuclear Research, RU-141980 Dubna, Russia
14Duke University, Durham, North Carolina 27708, USA15Fermi National Accelerator Laboratory, Batavia, Illinois 60510, USA
16University of Florida, Gainesville, Florida 32611, USA17Laboratori Nazionali di Frascati, Istituto Nazionale di Fisica Nucleare, I-00044 Frascati, Italy
18University of Geneva, CH-1211 Geneva 4, Switzerland19Glasgow University, Glasgow G12 8QQ, United Kingdom
20Harvard University, Cambridge, Massachusetts 02138, USA21Division of High Energy Physics, Department of Physics, University of Helsinki and Helsinki Institute of Physics,
FIN-00014, Helsinki, Finland22University of Illinois, Urbana, Illinois 61801, USA
23The Johns Hopkins University, Baltimore, Maryland 21218, USA24Institut fur Experimentelle Kernphysik, Karlsruhe Institute of Technology, D-76131 Karlsruhe, Germany
25Center for High Energy Physics: Kyungpook National University, Daegu 702-701, Korea; Seoul National University,Seoul 151-742, Korea; Sungkyunkwan University, Suwon 440-746, Korea; Korea Institute of Science and Technology Information,
Daejeon 305-806, Korea; Chonnam National University, Gwangju 500-757, Korea; Chonbuk National University,Jeonju 561-756, Korea
26Ernest Orlando Lawrence Berkeley National Laboratory, Berkeley, California 94720, USA27University of Liverpool, Liverpool L69 7ZE, United Kingdom
28University College London, London WC1E 6BT, United Kingdom29Centro de Investigaciones Energeticas Medioambientales y Tecnologicas, E-28040 Madrid, Spain
30Massachusetts Institute of Technology, Cambridge, Massachusetts 02139, USA
T. AALTONEN et al. PHYSICAL REVIEW D 83, 112003 (2011)
112003-2

31Institute of Particle Physics: McGill University, Montreal, Quebec, Canada H3A 2T8; Simon Fraser University, Burnaby,British Columbia, Canada V5A 1S6; University of Toronto, Toronto, Ontario, Canada M5S 1A7; and TRIUMF, Vancouver,
British Columbia, Canada V6T 2A332University of Michigan, Ann Arbor, Michigan 48109, USA
33Michigan State University, East Lansing, Michigan 48824, USA34Institution for Theoretical and Experimental Physics, ITEP, Moscow 117259, Russia
35University of New Mexico, Albuquerque, New Mexico 87131, USA36Northwestern University, Evanston, Illinois 60208, USA37The Ohio State University, Columbus, Ohio 43210, USA
38Okayama University, Okayama 700-8530, Japan39Osaka City University, Osaka 588, Japan
40University of Oxford, Oxford OX1 3RH, United Kingdom41aIstituto Nazionale di Fisica Nucleare, Sezione di Padova-Trento, I-35131 Padova, Italy
41bUniversity of Padova, I-35131 Padova, Italy42LPNHE, Universite Pierre et Marie Curie/IN2P3-CNRS, UMR7585, Paris, F-75252 France
43University of Pennsylvania, Philadelphia, Pennsylvania 19104, USA44aIstituto Nazionale di Fisica Nucleare Pisa, I-56127 Pisa, Italy
44bUniversity of Pisa, I-56127 Pisa, Italy44cUniversity of Siena, I-56127 Pisa, Italy
44dScuola Normale Superiore, I-56127 Pisa, Italy45University of Pittsburgh, Pittsburgh, Pennsylvania 15260, USA
46Purdue University, West Lafayette, Indiana 47907, USA47University of Rochester, Rochester, New York 14627, USA
48The Rockefeller University, New York, New York 10065, USA49aIstituto Nazionale di Fisica Nucleare, Sezione di Roma 1, I-00185 Roma, Italy
49bSapienza Universita di Roma, I-00185 Roma, Italy50Rutgers University, Piscataway, New Jersey 08855, USA
51Texas A&M University, College Station, Texas 77843, USA52aIstituto Nazionale di Fisica Nucleare Trieste/Udine, I-34100 Trieste, I-33100 Udine, Italy
52bUniversity of Trieste/Udine, I-33100 Udine, Italy53University of Tsukuba, Tsukuba, Ibaraki 305, Japan54Tufts University, Medford, Massachusetts 02155, USA
55University of Virginia, Charlottesville, Virginia 22906, USA
aDeceased.bWith visitor from University of MA Amherst, Amherst, MA 01003., USAcWith visitor from Istituto Nazionale di Fisica Nucleare, Sezione di Cagliari, 09042 Monserrato (Cagliari), Italy.dWith visitor from University of CA Irvine, Irvine, CA 92697., USAeWith visitor from University of CA Santa Barbara, Santa Barbara, CA 93106., USAfWith visitor from University of CA Santa Cruz, Santa Cruz, CA 95064., USAgWith visitor from CERN,CH-1211 Geneva, Switzerland.hWith visitor from Cornell University, Ithaca, NY 14853., USAiWith visitor from University of Cyprus, Nicosia CY-1678, Cyprus.jWith visitor from University College Dublin, Dublin 4, Ireland.kWith visitor from University of Fukui, Fukui City, Fukui Prefecture, Japan 910-0017.lWith visitor from Universidad Iberoamericana, Mexico D.F., Mexico.
mWith visitor from IA State University, Ames, IA 50011., USAnWith visitor from University of IA, IA City, IA 52242., USAoWith visitor from Kinki University, Higashi-Osaka City, Japan 577-8502.pWith visitor from KS State University, Manhattan, KS 66506., USAqWith visitor from University of Manchester, Manchester M13 9PL, England.rWith visitor from Queen Mary, University of London, London, E1 4NS, England.sWith visitor from Muons, Inc., Batavia, IL 60510., USAtWith visitor from Nagasaki Institute of Applied Science, Nagasaki, Japan.uWith visitor from National Research Nuclear University, Moscow, Russia.vWith visitor from University of Notre Dame, Notre Dame, IN 46556., USAwWith visitor from Universidad de Oviedo, E-33007 Oviedo, Spain.xWith visitor from TX Tech University, Lubbock, TX 79609., USAyWith visitor from Universidad Tecnica Federico Santa Maria, 110v Valparaiso, Chile.zWith visitor from Yarmouk University, Irbid 211-63, Jordan.aaOn leave from J. Stefan Institute, Ljubljana, Slovenia.
EVIDENCE FOR A MASS DEPENDENT FORWARD- . . . PHYSICAL REVIEW D 83, 112003 (2011)
112003-3

56Waseda University, Tokyo 169, Japan57Wayne State University, Detroit, Michigan 48201, USA
58University of Wisconsin, Madison, Wisconsin 53706, USA59Yale University, New Haven, Connecticut 06520, USA(Received 23 December 2010; published 8 June 2011)
We present a new measurement of the inclusive forward-backward t�t production asymmetry and its
rapidity and mass dependence. The measurements are performed with data corresponding to an integrated
luminosity of 5:3 fb�1 of p �p collisions atffiffiffis
p ¼ 1:96 TeV, recorded with the CDF-II Detector at the
Fermilab Tevatron. Significant inclusive asymmetries are observed in both the laboratory frame and the t�t
rest frame, and in both cases are found to be consistent with CP conservation under interchange of t and �t.
In the t�t rest frame, the asymmetry is observed to increase with the t�t rapidity difference, �y, and with
the invariant mass Mt�t of the t�t system. Fully corrected parton-level asymmetries are derived in two
regions of each variable, and the asymmetry is found to be most significant at large �y and Mt�t. For
Mt�t � 450 GeV=c2, the parton-level asymmetry in the t�t rest frame is At�t ¼ 0:475� 0:114 compared to a
next-to-leading order QCD prediction of 0:088� 0:013.
DOI: 10.1103/PhysRevD.83.112003 PACS numbers: 14.65.Ha, 11.30.Er, 12.38.Qk
I. INTRODUCTION
Top quark pair production in p �p collisions is a sensitiveprobe of quantum chromodynamics at high energy. Atlowest order in the standard model (SM), quark pair pro-duction is symmetric under charge conjugation. At next-to-leading order (NLO) the interference of processes thatdiffer under charge conjugation leads to a small forward-backward asymmetry of order 0:06� 0:01 when measuredinclusively in the t�t rest frame [1–3]. An analogous effect ispredicted at order �3 in QED and is confirmed in measure-ments of eþe� ! �þ�� [4]. Study of the NLO QCDasymmetry in inclusive jet events is hampered by thedifficulty of measuring the jet charge. In pair producedtop quarks with one semileptonic decay, the top can betagged according to the well-measured lepton charge, en-abling a probe of the NLO QCD effect and a test of chargeconjugation symmetry in strong interactions at highenergy.
The CDF and D0 experiments have made initial mea-surements of the t�t asymmetry in p �p collisions at
ffiffiffis
p ¼1:96 TeV at the Fermilab Tevatron [5,6]. In theCP-invariant p �p system, the NLO QCD effect appears asa charge dependent forward-backward asymmetry of thetop quark direction with respect to the proton direction.Using data samples corresponding to 1:9 fb�1 and 0:9 fb�1
respectively, CDF and D0 report positive asymmetries thatare consistent with the QCD prediction within large ex-perimental uncertainties. Recent theoretical papers suggestinteresting new physics mechanisms including axigluons,diquarks, new weak bosons, and extra-dimensions that canall produce forward-backward t�t asymmetries [7,8]. Themodel building must accommodate the observed consis-tency of the t�t cross section and total invariant massdistribution with the SM QCD prediction [9,10].
We report here on a new study of the forward-backwardasymmetry in p �p collisions at
ffiffiffis
p ¼ 1:96 TeV, using datacorresponding to an integrated luminosity of 5:3 fb�1
recorded with the CDF-II Detector. We study events withthe leptonþ jets topology, where either the t or �t hasdecayed semileptonically. The asymmetries are measuredin two variables: yh, the rapidity of the hadronically decay-ing top quark, corresponding to the top rapidity in thelaboratory (lab) frame, and �y, the difference of the rap-idities of the top and antitop quark, which is proportional tothe top quark rapidity in the t�t rest frame. We show that thet and �t asymmetries are consistent with CP conservation,and combine them to measure the total asymmetry in thesample. We measure the inclusive asymmetries, and thefunctional dependence of the t�t frame asymmetry on �yand on the total invariant mass of the t�t system, Mt�t. Weapply corrections for backgrounds, acceptance, and reso-lution to calculate parton-level measures of the inclusiveasymmetry in both the lab and t�t rest frames, and in tworegions of �y and Mt�t in the t�t frame.
II. DETECTION, EVENT SELECTIONAND RECONSTRUCTION
CDF-II is a general purpose, azimuthally and forward-backward symmetric magnetic spectrometer with calo-rimetry and muon detectors [11]. Charged particletrajectories are measured with a silicon-microstrip detectorbacked by a large open-cell drift chamber in a 1.4 Tsolenoidal magnetic field. Electromagnetic and hadroniccalorimeters located outside the solenoid provide jet andmissing energy reconstruction. Outside the calorimeter aremultilayer proportional chambers and plastic scintillatorhodoscopes that provide muon identification in the pseu-dorapidity region j � j� 1:0. We use a cylindrical coordi-nate system with origin at the detector center and z axisalong the proton direction [12].This measurement uses t�t candidate events in the
‘‘leptonþ jets’’ topology, where one top quark decayssemileptonically (t ! l�b) and the other hadronically(t ! q �q0b) [13]. We detect the lepton and four jets from
T. AALTONEN et al. PHYSICAL REVIEW D 83, 112003 (2011)
112003-4

top quark decays and quark hadronization, and an inferredneutrino based on the presence of missing energy. Thedetector is triggered by a high transverse momentum elec-tron(muon) in the central portion of the detector withETðpTÞ> 20 GeVðGeV=cÞ and j�j< 1:0. We requirefour or more hadronic jets with ET > 20 GeV andj�j< 2:0, and a large amount of missing transverse energy,ET > 20 GeV, consistent with the presence of an unde-tected neutrino. The jets are reconstructed using a cone
algorithm with �R ¼ ffiffiffiffiffiffiffiffiffiffiffiffiffiffiffiffiffiffiffiffiffiffiffiffi��2 þ ��2
p< 0:4, and calorimeter
signals are corrected for detector inefficiencies and for theenergy scale factor. The SECVTX algorithm [14] is used tofind displaced b-decay vertices using the tracks within thejet cones, and at least one jet must contain such a ‘‘b tag’’.Jets with b tags are restricted to j�j< 1:0.
The sample passing this selection contains 1260 events.The size of the non-t�t background processes in theleptonþ jetsþ b-tag selection is derived in precision mea-surements of the t�t production cross section [9]. The esti-mated background in the sample is 283:3� 91:2 events.The predominant backgrounds are from QCD-inducedW þmulti-parton events containing either b-taggedheavy-flavor jets or errantly tagged light-flavor jets.These are modeled using a simulation sample derivedfrom the ALPGEN generator [15] and a data driven tech-nique that derives tagging efficiencies, mistagging ratesand sample normalizations from direct measurement. Abackground component from QCD multijet events withfake leptons and mismeasured ET is modeled using multi-jet events with lepton candidates that are rejected by ourcuts. Other small backgrounds from electroweak processes(WW, WZ, single-top) are reliably estimated usingMonte Carlo generators. Further details on the sampleselection and background modeling can be found inRef. [9].
The reconstruction (reco) of the t�t kinematics employsthe measured momenta of the lepton and the four leadingjets in the event, along with the measured ET . The jet-parton assignment and calculation of the t�t four-vectors usea simple �2-based fit of the lepton and jet kinematics to thet�t hypothesis, allowing the jet energies to float within theirexpected uncertainties, and applying the constraints thatMW ¼ 80:4 GeV=c2, Mt ¼ 172:5 GeV=c2, and b-taggedjets are associated with b partons. This algorithm is wellunderstood in the context of precision top mass measure-ments, where the fit is performed without the top massconstraint [16], and other top-physics studies that use thetop mass constraint [10]. We study the reconstructed topquark rapidity and the difference in the reconstructed topand antitop rapidities, from which we derive the forward-backward asymmetries in the p �p (laboratory) rest frameand in the t�t rest frame.
The validity of the analysis is checked at all steps bycomparison to a standard prediction made using the PYTHIA
[17] t�t model, the CDF leptonþ jetsþ b-tag background
model, and a full simulation of the CDF-II detector. We usePYTHIA 6.2.16 with CTEQ5L parton distribution functions
[18] and Mt ¼ 172:5 GeV=c2. The background modeldeveloped in context with the precision cross section stud-ies provides good measures of both the normalizations andshapes of the non-t�t processes [9]. The veracity of thecombined PYTHIA plus background model, and, in particu-lar, its reliability for the estimation of systematic uncer-tainties, is well verified in many other top-physics studiesat CDF [5,9,10,16,19].Note that because PYTHIA does not include the NLO
QCD charge asymmetry, the standard PYTHIA prediction isnot the SM prediction for the forward-backward asymme-try. Studies with the MC@NLO generator [20] (seeSec. IVB) predict that the magnitude of the reconstructedQCD asymmetry in our sample is smaller than the currentexperimental resolution. Symmetric PYTHIA is thus a goodapproximation for SM t�t and provides an unbiased controlsample for many of our studies. We will compare ourmeasurements to the SM predictions of MC@NLO whenappropriate.
III. RAPIDITY VARIABLES ANDASYMMETRY DEFINITIONS
In the leptonþ jets decay topology of the t�t pair, there isa leptonic decay, t ! Wb ! l�b, and a hadronic decayt ! Wb ! q �q0b. The complications of the central leptonacceptance and the reconstruction of the neutrino from theET create a difference in the reconstruction resolution forthe two different kinds of decay. In order to control effectsof this kind, our treatment of top rapidity variables main-tains the distinction between the leptonic and hadronicdecay systems, with the t and �t assignments following inaccordance with the lepton charge.The most direct measurement of the top direction with
respect to the beam line is the rapidity of the hadronic topsystem in the lab frame, yh, which has acceptance out toj�j ¼ 2:0 and good directional precision. In events with anegative (positive) lepton, yh is the lab rapidity of the t
quark, yp �pt (�t quark, yp �p
�t ). If CP is a good symmetry, the
distributions of yp �p�t and yp �p
t are reflections of each other,
and we can combine both samples, weighting with thelepton charge, to use �qyh as the rapidity of the t quark
in the lab frame, yp �pt .
A frame independent measurement is available in therapidity difference of the leptonic and hadronic systems�ylh ¼ yl-yh. After multiplication by the lepton charge q,this variable measures the difference between the top andantitop rapidities: q�ylh ¼ qðyl-yhÞ ¼ yt-y�t ¼ �y. Therapidity difference �y is independent of the longitudinalmotion of the t�t system and, in the limit of small t�t systempT , is simply related to the top quark rapidity in the t�t restframe: yt�tt ¼ 1
2 �y. Since the rapidity preserves the sign of
the production angle, the asymmetry in �y is identical to
EVIDENCE FOR A MASS DEPENDENT FORWARD- . . . PHYSICAL REVIEW D 83, 112003 (2011)
112003-5

the asymmetry in the top quark production angle in the t�trest frame.
With N as the number of events with a given �y or�qyh, we define the total t�t frame asymmetry:
At�t ¼ Nð�y > 0Þ � Nð�y < 0ÞNð�y > 0Þ þ Nð�y < 0Þ
¼ Nðyt�tt > 0Þ � Nðyt�tt < 0ÞNðyt�tt > 0Þ þ Nðyt�tt < 0Þ (1)
and the total laboratory frame asymmetry, assuming CPinvariance:
Ap �p ¼ Nð�qyh > 0Þ � Nð�qyh < 0ÞNð�qyh > 0Þ þ Nð�qyh < 0Þ
¼ Nðyp �pt > 0Þ � Nðyp �p
t < 0ÞNðyp �p
t > 0Þ þ Nðyp �pt < 0Þ : (2)
Since yh and �ylh are identified with either a t or an �t bythe sign of the lepton in the event, they are the primaryvariables for defining the charge dependence of the asym-metries and testing for CP invariance. We define thecharged forward-backward charge asymmetry in the t�trest frame to be
A�lh ¼
N�ð�ylh > 0Þ � N�ð�ylh < 0ÞN�ð�ylh > 0Þ þ N�ð�ylh < 0Þ (3)
and in the laboratory frame to be
A�h ¼ N�ðyh > 0Þ � N�ðyh < 0Þ
N�ðyh > 0Þ þ N�ðyh < 0Þ (4)
where the � superscript refers to the sign of the leptoncharge q.
The laboratory and t�t frame present trade-offs for theasymmetry measurement. The laboratory frame is experi-mentally simple: the direction of the three-jet hadronic topdecay in the detector is well resolved, with uncertaintydominated by a Gaussian width �yh � 0:034, and freefrom the complications of the neutrino reconstruction[21]. The yh distribution is thus the simplest way to testfor the presence of an asymmetry. However, as the labora-tory frame includes an uncontrolled longitudinal boostfrom the rest frame of the primary q �q interaction, theinformation on the fundamental production asymmetry isdiluted.
Because the momentum scale of initial state radiation issmall compared to Mt�t, the q �q frame is well approximatedby the t�t rest frame. We measure the t�t frame rapidity in anexperimentally robust way using the difference of tworapidities in the detector frame, �y ¼ qðyl-yhÞ. But theinclusion of yl and the poorly resolved neutrino reconstruc-tion degrades the precision: the Gaussian part of the t�tframe resolution has width ��y� 0:100 and significantnon-Gaussian tails. The t�t frame has an advantage ininterpretation, but a disadvantage in resolution.
The frame dependent resolution has to be consideredagainst a possible frame dependence in the size of theasymmetry. In the case of the QCD charge asymmetry,our NLO models (see Table III) suggest that the recon-structed asymmetry is reduced by a factor of 0.6–0.7 in thetransition from the t�t to laboratory frame. This roughlybalances the resolution difference to give comparable sen-sitivities to the inclusive QCD asymmetries in the twoframes. Asymmetries generated by other processes mayproduce a different ratio between the two frames, possiblywith a �y or Mt�t dependence, and a more precise mea-surement of the ratio could help to illuminate the under-lying physics. We will return to this issue in Sec. VIII E.A summary of the rapidity variables and asymmetry
definitions used in this paper is given in Table I.
IV. PHYSICS MODELS AND EXPECTATIONS
We briefly describe the theoretical basis for the QCDasymmetry at NLO, the calculation of the theoreticalasymmetry using the MCFM program [22], and use of theMC@NLO event generator in creating a simulated NLO
sample for input to our analysis. We also describe a simplechiral color-octet model, executed in MADGRAPH [23], thatwe use to understand the response of our analysis to a larget�t asymmetry.
A. NLO QCD Theory and MCFM
The NLO QCD asymmetry arises in the interference ofq �q processes that behave differently under charge conju-gation. The gg initial state does not contribute to theasymmetry, but does dilute the average value.Early, pretop, treatments of the QCD charge asymmetry
discussed measurement of generic heavy quarks in hadroncollisions [24]. More recent treatments have focused on theparticular case of the top quark at the Tevatron and at theLHC [1–3].The asymmetry gets a positive contribution from inter-
ference of Born and box diagrams in all t�t final states, and anegative contribution from interference of initial and final-state radiation in t�tj states. The dominant diagrams for the
TABLE I. Summary of rapidity variables and asymmetries.
definition
yh rapidity of hadronic top system in lab
yl rapidity of leptonic top system in lab
�ylh rapidity difference yl-yh�y t�t rapidity difference: yt-y�t ¼ qðyl-yhÞyp �pt top quark rapidity in laboratory frame: �qyhyt�tt top quark rapidity in t�t rest frame: 1
2 �y
A�h asymmetry in yh for events with a given lepton charge
A�lh asymmetry in �ylh for events with a given lepton charge
Ap �p laboratory frame asymmetry in yp �pt (both charges)
At�t t�t frame asymmetry in yt�tt (both charges)
T. AALTONEN et al. PHYSICAL REVIEW D 83, 112003 (2011)
112003-6

two cases are shown in Fig. 1. The total inclusive asym-metry is the sum of these opposing contributions. Anintuitive picture of the first effect is that the QCD softgluon field of an incoming light quark ‘‘repels’’ the t quarkto larger (more positive) rapidities, while ‘‘attracting’’ the �tto smaller (more negative) rapidities, thus creating a posi-tive asymmetry at large y, as defined by the quark direction[25]. (Of course, the pushing and pulling refers to correc-tions to the amplitude and not to actual momentum trans-fers.) The second effect can be pictured in terms of colorflow: if the top (antitop) quark is produced in the backward(forward) region, this corresponds to a large acceleration ofthe color charges, leading to a greater probability of gluonbremsstrahlung and thus the production of a t�tþ jet event.
Predictions for the NLO QCD asymmetry are derivedusing version 5.7 of MCFM with CTEQ6.1(NLO) [18] andMt ¼ 172:5 GeV=c2. The inclusive forward-backwardasymmetry in the t�t rest frame is found to be At�t ¼ 0:058�0:009. In the laboratory frame the top quark rapidities arebroadened by the varying boost of the t�t system along thebeam line, and the inclusive asymmetry is diluted to Ap �p ¼0:038� 0:006. Our MCFM predictions are in accord withother recent calculations [1–3]. These predictions are fortop quarks as they emerge from the q �q collision, before anymodifications by event selection, detector acceptance, andresolution. We will call this the parton-level. Based on ourown studies of scale dependence in MCFM and also thestudies in the references above, we assign a 15% relativeuncertainty to all NLO MCFM predictions.
An NLO calculation for inclusive t�t production is a LOcalculation for the production of a t�tþ jet final-state, andthus a LO calculation for the asymmetry in final statescontaining an extra jet. We note that a new NLO calcula-tion for t�tj production (and thus for the asymmetry for thisfinal-state) suggests that the (negative) asymmetry in thisfinal-state is greatly reduced from that predicted by the LOcalculation [26]. However, this new result for the t�tjasymmetry can be incorporated into an analysis for theasymmetry for inclusive t�t production only within thecontext of a full NNLO calculation. Such calculations areunderway but are not complete. Threshold resummationcalculations indicate that the inclusive asymmetry atNNLO should not differ greatly from that predictedat NLO [1,25]. In this paper, we compare to the NLO
predictions for t�t production. We include a 15% scaledependence uncertainty, but note that there is an overallunknown systematic uncertainty on the theoretical predic-tion pending the completion of the NNLO calculationIn the near-threshold form of the cross section [1] the t�t
frame asymmetry can be seen to increase with the topquark production angle and velocity (�), and these arethus key variables for understanding the source of theasymmetry. In this analysis, the proxies for these variablesare the top quark rapidities and the mass Mt�t of the t�tsystem. Measurements of the rapidity and mass depen-dence of At�t are described in Sec. VI and VII.
B. NLO QCD Simulation with MC@NLO
We use the event generator MC@NLO to create a simu-lated sample that includes the QCD asymmetry as pre-dicted by the standard model at NLO. In addition toincluding the asymmetric processes this generator properlyestimates the amount of gg, and thus the dilution of theasymmetry from these symmetric processes.Some naming conventions for data-to-simulation com-
parisons are given in Table II. All of our Monte Carlo (MC)based studies will use the same conventions: the truthinformation is the parton-level; the pure top signal aftersimulation, selection, and reconstruction is the t�t level, andthe full prediction including backgrounds is t�tþ bkg level.In the case of real data, the reconstructed leptonþ jetssample is the data, subtracting the backgrounds from thedata yields the reconstructed t�t signal-level, and correctingthe signal-level for acceptance and resolution produces ameasurement at the parton-level.The MC@NLO predictions for the asymmetries at various
levels of simulation are shown in Table III. The uncertain-ties include the Monte Carlo statistics and the NLO theo-retical uncertainty. The parton-level MC@NLO asymmetriesare consistent with MCFM, as expected. After CDF detectorsimulation, event selection, and reconstruction, the asym-metries in the MC@NLO t�t signal are significantly reduced.In the laboratory frame, the expected asymmetry at thereconstructed t�tþ bkg level is consistent with zero.We will see in Sec. V that the statistical error on Ap �p and
At�t in the current data set is 0.028. Table III shows that,even after background subtraction, the central values of theexpected asymmetries are smaller than the experimental
TABLE II. Naming conventions for data and simulationsamples.
sample level definition comparable to
data data reco lþ jets
data signal data minus bkg t�t in data
data parton corrected signal t�t at creation
MC t�tþ bkg reco t�tþ bkg data
MC t�t reco t�t no bkg data signal
MC parton truth level data parton
FIG. 1. Interfering q �q ! t�t (above) and q �q ! t�tj (below)amplitudes.
EVIDENCE FOR A MASS DEPENDENT FORWARD- . . . PHYSICAL REVIEW D 83, 112003 (2011)
112003-7

resolution. This motivates the continued use of symmetricPYTHIA as our default t�tmodel (as discussed in Sec. II), but
we will also consider the MC@NLO predictions in severalspecific studies.
C. Generic Color-Octet with MADGRAPH
It is important that we test our measurement proceduresin the regime of the observed asymmetries. We have usedMADGRAPH and the model of Ref. [8] to create asymmetric
test samples that can be used as input to our analysis [27].A massive axial color-octet G mixes with the gluon to givea production cross section including pole and interferenceterms linear in cosð�Þ, where � is the t production anglein the t�t rest frame. In these models the asymmetry is anexplicit function of the production angle and momentumtransfer q, again illustrating the importance of the �y andMt�t dependence for understanding the source of theasymmetry.
We tuned the octet massMG to put the pole out of rangeand the couplings to give inclusive parton-level asymme-tries in rough agreement with the data, Ap �p ¼ 0:110and At�t ¼ 0:157, while minimizing the effect on the t�tcross section and Mt�t distribution (see the Appendix).After MADGRAPH generation, partons are showered with
PYTHIA and the sample is passed through the complete
CDF-II detector simulation. We call this sample OctetA.A second sample, OctetB, has the same couplings and
lower MG, to give larger inclusive parton-level asymme-tries Ap �p ¼ 0:205 and At�t ¼ 0:282, and larger (� 5%)increases in the t�t cross section and in the high Mt�t tail.Because OctetA is a better match to the observed asym-metries, cross section, andMt�t distribution, we consider it abetter model for understanding the experimental response,but we will appeal to both Octet models in order to spanan asymmetry range extending beyond the experimentalvalues.We emphasize that our use of the Octet models is to
study sensitivities and systematic effects in the presence oflarge asymmetries, and should not be construed as tests ofphysics hypothesis. More detail on these samples can befound in the Appendix.
V. MEASUREMENT OF THE INCLUSIVEASYMMETRIES
We now turn to the rapidity distributions in the data.The inclusive distributions of the �ylh and yh variables areshown in Fig. 2, compared to the standard PYTHIA t�tþ bkgprediction. These distributions contain the full sample of
TABLE III. NLO QCD asymmetries in two frames. Uncertainties include MC statistics andscale dependence.
model level Ap �p At�t Ap �p=At�t
MCFM parton 0:038� 0:006 0:058� 0:009 0:66� 0:10MC@NLO parton 0:032� 0:005 0:052� 0:008 0:62� 0:09MC@NLO t�t 0:018� 0:005 0:024� 0:005 0:75� 0:11MC@NLO t�tþ bkg 0:001� 0:003 0:017� 0:004 0:06� 0:01
h-yl
y
-3 -2 -1 0 1 2 3
Eve
nts
0
50
100
150
200
250
300
350
400
450data
+ bkgttbkg
0.028± = 0.008 dataA
0.003± = -0.003 +bkgtt
A
0.002± = -0.002 tt
A
0.008± = -0.009 bkgA
hy
-2.5 -2 -1.5 -1 -0.5 0 0.5 1 1.5 2 2.5
Eve
nts
0
50
100
150
200
250
300
350
400data
+ bkgttbkg
0.028± = 0.005 dataA
0.003± = -0.006 +bkgtt
A
0.002± = -0.002 tt
A
0.008± = -0.019 bkgA
FIG. 2 (color online). Rapidity distributions in data compared to predictions. The legend ‘‘t�tþ bkg’’ implies totals in those bins arethe sum of the t�t and background components. The asymmetries in the data and the predicted t�t signal, background, and combinationare shown in legends on top right of plots, using the conventions of Table II.
T. AALTONEN et al. PHYSICAL REVIEW D 83, 112003 (2011)
112003-8

both lepton signs and should be symmetric. The legend onthe top right shows the asymmetries in all components. Thedata agrees well with t�tþ bkg prediction in both variables,and, in particular, the asymmetries are consistent with zero.
A forward-backward asymmetry becomes apparentwhen the sample is separated by charge. The top row ofFig. 3 shows the �y distributions for events with negativeleptons (left) and positive leptons (right). We findA�lh ¼ �0:048� 0:039 and Aþ
lh ¼ 0:067� 0:040, where
the uncertainties are statistical only. With limited signifi-cance, the asymmetries are equal in magnitude and oppo-site in sign.
The bottom plots of Fig. 3 show the yh distributions forevents with negative leptons (left) and positive leptons(right). An indication of asymmetry is also observed inthis figure: t quarks are dominant in the forward (proton)
direction and the �t quarks in the backward ( �p) direction.The measured asymmetries are A�
h ¼ 0:076� 0:039 and
Aþh ¼ �0:070� 0:040, again equal and opposite within
uncertainties.The sign reversal of the asymmetry under interchange of
the lepton charge (or, in our formalism, under interchangeof t and �t) is consistent with CP conservation. With largersamples and improved precision, the comparison of thecharge separated distributions will provide a strict test ofCP conservation in t�t production. If we assume CP con-servation we can calculate the total asymmetry in eachframe using Eqs. (1) and (2). The distributions of thesevariables are shown in Fig. 4. The asymmetry in the t�tframe is At�t ¼ 0:057� 0:028, and in the laboratory frameis Ap �p ¼ 0:073� 0:028, where both uncertainties arestatistical.
h-yl
y-3 -2 -1 0 1 2 3
Eve
nts
0
50
100
150
200
250data (negative)
+ bkgtt
bkg
0.039± = -0.048 dataA
0.004± = 0.008 +bkgtt
A
0.003± = 0.011 tt
A
0.012± = -0.004 bkgA
h-yl
y-3 -2 -1 0 1 2 3
Eve
nts
0
50
100
150
200
250
data (positive)
+ bkgttbkg
0.040± = 0.067 dataA
0.004± = -0.015 +bkgtt
A
0.003± = -0.015 tt
A
0.012± = -0.014 bkgA
hy
-2.5 -2 -1.5 -1 -0.5 0 0.5 1 1.5 2 2.5
Eve
nts
0
50
100
150
200
250data (negative)
+ bkgtt
bkg
0.039± = 0.076 dataA
0.004± = -0.024 +bkgtt
A
0.003± = -0.011 tt
A
0.012± = -0.073 bkgA
hy
-2.5 -2 -1.5 -1 -0.5 0 0.5 1 1.5 2 2.5
Eve
nts
0
50
100
150
200
250data (positive)
+ bkgttbkg
0.040± = -0.070 dataA
0.004± = 0.013 +bkgtt
A
0.003± = 0.006 tt
A
0.012± = 0.035 bkgA
FIG. 3 (color online). Distributions of �ylh ¼ yl-yh (top) and yh (bottom) for events with negative leptons (left) and positive leptons(right).
EVIDENCE FOR A MASS DEPENDENT FORWARD- . . . PHYSICAL REVIEW D 83, 112003 (2011)
112003-9

A. The Parton-Level asymmetry
In order to compare our results to theoretical predictionswe must correct the data for backgrounds, for incompletedetector acceptance, and for the finite rapidity resolution ofthe reconstruction.
We derive the signal-level t�t distributions by subtractingthe expected background from the reconstructed data. Thiscorrection is most important in the laboratory frame,where, as shown on the right in Fig. 4, the backgroundsshow a significant negative asymmetry originating in theWproduction asymmetry in W þ jets events.
The reliability of the background model is verified in thesubset of the leptonþ jets selection that has no b-taggedjets. This ‘‘antitag’’ sample is background enriched, withS:B �0:3, and is also fully modeled in our analysis. Thepredicted and measured t�t and lab frame asymmetries inthe antitag data sample agree within their uncertainties, asshown in Table IV. The absence of asymmetry in thisbackground enriched sample, and the consistency betweenprediction and observation, suggest that the asymmetry inthe b-tagged sample is correlated with the t�t signal and notthe backgrounds.
Acceptance and resolution corrections are made with a
simple linear unfolding of the �y and yp �pt distributions
using the technique described in Ref. [5]. Let the binnedparton-level rapidity distributions be represented by thevector ~n. The ~n distribution is modified by the acceptance
and then by the smearing in the reconstruction. Thesetransformations can be expressed as matrices transformingthe distribution vector from the parton-level to our recon-structed signal: ~nsignal ¼ SA ~nparton.
The matrices A and S are derived from PYTHIA samplesby comparing distributions at the Monte Carlo truth levelto the same distributions after reconstruction. The accep-tance matrix A is diagonal. The smearing matrix S mea-sures the bin-to-bin migration arising from the finiteresolution of reconstructing the events in the t�t hypothesis.To measure the parton-level value, we subtract back-grounds to recover the signal from the data, and then invertthe transformation:
~n parton ¼ A�1S�1ð ~ndata � ~nbkgÞ: (5)
With the assumption of the A and S response as computedwith PYTHIA, this technique gives a model-independentmeasure of the parton-level asymmetry. The result wasfound to be robust and the uncertainty minimized whenthe distributions are separated into four bins with bin edges
at (0.0, �1:0) for �y and (0.0, �0:5) for yp �pt [5,28–30].
The measurement is affected by uncertainties in ourmodels for the amount and shape of the backgrounds, theamount of initial state and final-state radiation (ISR andFSR) in PYTHIA, the jet energy scale (JES) of the calorime-ter, the parton distribution functions (PDF), and the colorreconnection in the final-state. These additional systematicuncertainties are studied by repeating the analysis withreasonable variations in the model parameters. We alsotest the result of substituting the other LO generatorsHERWIG and ALPGEN for PYTHIA in the model for the matrix
unfold. The effect of these model variations on the parton-level asymmetry is small, as seen in Table V.It is conceivable that the corrections in the presence of a
large asymmetry would differ from the corrections derived
t - y
t y = y∆
-3 -2 -1 0 1 2 3
Eve
nts
0
50
100
150
200
250
300
350
400
450 data + bkgtt
bkg
0.028± = 0.057 dataA
0.003± = -0.011 +bkgtt
A
0.002± = -0.013 tt
A
0.008± = -0.005 bkgA
t = y
h-qy
-2 -1.5 -1 -0.5 0 0.5 1 1.5 2
Eve
nts
0
50
100
150
200
250
300
350
400data
+ bkgttbkg
0.028± = 0.073 dataA
0.003± = -0.019 +bkgtt
A
0.002± = -0.009 tt
A
0.008± = -0.054 bkgfbA
FIG. 4 (color online). �y and �qyh ¼ yp �pt distributions in data vs prediction.
TABLE IV. Asymmetries in the antitag sample of the data andt�tþ bkg level prediction.
selection At�t Ap �p
antitag data 0:033� 0:018 �0:016� 0:018antitag prediction 0:010� 0:007 �0:023� 0:007
T. AALTONEN et al. PHYSICAL REVIEW D 83, 112003 (2011)
112003-10

from the symmetric PYTHIA. We have studied this possi-bility by applying the PYTHIA- based response correctionsto the OctetA model, which has an asymmetry like the dataand a resemblance to the data in all other respects. We findthat the bias in the corrected inclusive asymmetries issmall, roughly 0.02, and we take this as evidence that thetechnique is essentially robust against perturbations of thiskind. Since we have no reason to prefer the prediction ofthis or any other model, we do not include a modelinguncertainty. Our inclusive results assume the correctionsand uncertainties calculated with the standard PYTHIA
model.
Figure 5 shows the �y and yp �pt distributions at all of
the correction levels in the four-bin representation. Theeffect of the background subtraction is clear. The t�t signal(squares) derived from the background subtracted data canbe directly compared with the PYTHIA signal prediction,
and continues to show the asymmetries. The correcteddistribution at the parton-level (triangles) can also be com-pared to the symmetric PYTHIA prediction.Table VI summarizes the measured asymmetries for the
different levels of correction. It is interesting that at thedata-level in the laboratory frame we compare to a modelprediction that is consistent with zero. When the back-grounds are subtracted from the reconstructed data wecan calculate the asymmetry for a pure t�t sample atthe signal-level, and compare directly to MC@NLO t�t. Thesignal uncertainty here includes the uncertainty on thebackground correction. Correcting for acceptance and re-construction resolution yields the t�t parton-level asymme-try, where the uncertainty includes the effects listed inTable V. The parton-level asymmetry may be directlycompared with the standard model prediction of MCFM.The experimentally simple laboratory frame asymmetry
exceeds the prediction by more than 2 standard deviationsat all correction levels. The t�t frame asymmetries are
t - y
ty = y∆
-3 -2 -1 0 1 2 3
Eve
nts
0
100
200
300
400
500
600
700
800 0.028±Data A = 0.057
0.036± Signal A = 0.075 tt
0.072± Parton A = 0.158 tt
0.002± Pythia A = -0.011 tt
pp
t = y
h-qy
-2 -1.5 -1 -0.5 0 0.5 1 1.5 2
Eve
nts
0
100
200
300
400
500
600 0.028±Data A = 0.073
0.036± Signal A = 0.110 tt
0.050± Parton A = 0.150 tt
0.002± Pythia A = -0.007 tt
FIG. 5 (color online). Four-bin representation of rapidity distributions for all correction levels. Solid histogram is the PYTHIA
t�t model.
TABLE V. Systematic uncertainties on parton-level asymme-tries in both frames.
effect �Ap �p �At�t
background magnitude 0.015 0.011
background shape 0.014 0.007
ISR/FSR 0.010 0.001
JES 0.003 0.007
PDF 0.005 0.005
color reconnection 0.001 0.004
LO MC generator 0.005 0.005
total 0.024 0.017
TABLE VI. Summary of inclusive asymmetries. Uncertaintiesinclude statistical, systematic, and theoretical uncertainties.
sample level At�t Ap �p
data data 0:057� 0:028 0:073� 0:028MC@NLO t�tþ bkg 0:017� 0:004 0:001� 0:003
data signal 0:075� 0:037 0:110� 0:039MC@NLO t�t 0:024� 0:005 0:018� 0:005
data parton 0:158� 0:074 0:150� 0:055MCFM parton 0:058� 0:009 0:038� 0:006
EVIDENCE FOR A MASS DEPENDENT FORWARD- . . . PHYSICAL REVIEW D 83, 112003 (2011)
112003-11

similar in magnitude to the laboratory frame, but lesssignificant because of the larger relative uncertainties.The ratio of the parton-level asymmetries in the twoframes is Ap �p=At�t ¼ 0:95� 0:41, where the error is cor-rected for the expected correlation across frames in theNLO QCD assumption. This measured ratio is consistentwith the expected SM NLO value of 0.6, but the uncer-tainty is large.
B. Cross-Checks of the inclusive asymmetry
Table VII shows the asymmetries in the data when thesample is separated according to the lepton flavor and thenumber of b-tagged jets in the event.
All of our simulated models predict asymmetries that areindependent of the lepton type. Within the large errors, thedata are consistent with this expectation.
The b-tagged sample contains 281 events with two btags. This double-tag sample is small, but has minimalbackgrounds and robust jet-parton assignment. Thedouble-tag sample is a special category of t�t decays whereboth the b and �b jet have j � j� 1:0, but all of our simu-lation models predict similar asymmetries in single tagsand double-tags. In the data the results are consistentacross single and double-tags, albeit with reduced agree-ment in Ap �p. We will discuss the double-tag consistency inthe laboratory frame in more detail in Sec. VIII E.
VI. RAPIDITY DEPENDENCE OF THEASYMMETRY IN THE t �t REST FRAME
In Sec. IV we discussed the importance of measuringthe rapidity and Mt�t dependence of the asymmetry. Thecorrelated dependence on both variables would be mostpowerful, but, given the modest statistical precision ofour current data set, we begin with separate measurementsof each. In this section we show how a �y-dependencemay be calculated from the results of Sec. VA. TheMt�t-dependence (as well as the correlation of Mt�t and�y) will be discussed in the sections following.
In the standard model at NLO the t�t frame asymmetryincreases linearly with �y. The MCFM calculation, dis-played in Fig. 6, shows the asymmetry reaching values ofroughly 20% at large �y.
The�y dependence of the asymmetry in our binned datacan be calculated in each bin i of positive �y as
At�tð�yiÞ ¼ Nð�yiÞ � Nð��yiÞNð�yiÞ þ Nð��yiÞ : (6)
A parton-level measurement of At�tð�yiÞ in two bins ofhigh and low �y is available from the corrected �y distri-bution in Fig. 5. We calculate the asymmetry separately forthe low rapidity difference inner bin pair j�yj< 1:0 andthe large rapidity difference outer bin pair j�yj � 1:0. Thesystematic uncertainties in the bin-by-bin comparison areevaluated using the same techniques as in the inclusivemeasurement. Uncertainty in the background shape andnormalization assumptions cause a significant systematicuncertainty in the high �y bin.The �y-dependent asymmetries are shown in
Table VIII. For the parton-level data, the first uncertaintyis statistical and the second is systematic. The uncertaintyon the MCFM prediction is dominated by the NLO theoryuncertainty. For j�yj< 1:0, the small data-level asymme-try maps into a small parton-level value with large error.In the large �y region the parton-level asymmetry isAt�tðj�yj � 1:0Þ ¼ 0:611� 0:270 (statistical and system-atic errors added in quadrature) compared to the MCFM
prediction of 0:123� 0:018. Figure 7 displays the parton-level comparison of asymmetries in data in the two �yregions.
TABLE VII. Measured asymmetries at the data-level for dif-ferent lepton and b-tag selections.
selection At�t Ap �p
inclusive 0:057� 0:028 0:073� 0:028
electrons 0:026� 0:037 0:053� 0:037muons 0:105� 0:043 0:099� 0:043
single b tags 0:058� 0:031 0:095� 0:032double b tags 0:053� 0:059 �0:004� 0:060
y∆
0 0.2 0.4 0.6 0.8 1 1.2 1.4 1.6 1.8 2
Asy
mm
etry
0
0.02
0.04
0.06
0.08
0.1
0.12
0.14
0.16
0.18
0.2
FIG. 6. �y-dependence of At�t according to MCFM.
TABLE VIII. The t�t frame asymmetry At�t at small and largerapidity difference, compared to the SM prediction of MCFM.
sample level j�yj< 1:0 j�yj � 1:0
data data 0:021� 0:031 0:208� 0:062
data parton 0:026� 0:104�0:056
0:611� 0:210�0:147
MCFM parton 0:039� 0:006 0:123� 0:018
T. AALTONEN et al. PHYSICAL REVIEW D 83, 112003 (2011)
112003-12

VII. MASS DEPENDENCE OF THE ASYMMETRYIN THE t �t REST FRAME
We now turn to the dependence of the asymmetry on thet�t invariant massMt�t. The NLO QCD asymmetry also has asignificant Mt�t dependence, as shown in Fig. 8. We gen-erally expect the Mt�t dependence to contain characteristicinformation on the fundamental asymmetry mechanism.
In this analysis, the value ofMt�t is derived from the samereconstruction used to compute the top quark rapidities.The Mt�t distribution in our sample, shown in Fig. 9, isagreement with the standard PYTHIA prediction. Otherrecent studies of the top pair mass spectrum, including
the parton-level differential cross section d=dMt�t, showgood agreement with the standard model [10,19,31].Since the mass dependent behavior is usually described
in the t�t rest frame we focus on the asymmetry in rapiditydifference �y as a function of Mt�t. The laboratory frameasymmetry derived with yh is discussed in Sec. VIII.The underlying 2-dimensional distribution of �y vs
Mt�t is shown on the left in Fig. 10. We expect thesevariables to obey the simple kinematic relationship Mt�t ¼2mT coshð�yÞ, where mT is the transverse mass of the t�tsystem, and we see this in both the data and the prediction.Because coshð�yÞ is symmetric, this kinematic correlationis independent of theMt�t-dependence of any asymmetry in�y. It is clear that the �y dependent measurement at largej�yj � 1:0 (Sec. VI) captures only part of the region atlarge Mt�t. Consequently, the separate measurements of the�y- and Mt�t-dependence of the asymmetry provide com-plementary information.A mass dependent asymmetry At�tðMt�t;iÞ is found by
dividing the �y—Mt�t plane into bins of mass Mt�t;i and
calculating the asymmetry in each:
At�tðMt�t;iÞ ¼ Nð�y > 0;Mt�t;iÞ � Nð�y < 0;Mt�t;iÞNð�y > 0;Mt�t;iÞ þ Nð�y < 0;Mt�t;iÞ : (7)
We use 50 GeV=c2 bins of Mt�t below 600 GeV=c2, and100 GeV=c2 bins above that. TheMt�t-dependent asymme-try in �y is shown on the right in Fig. 10 and Table IX,compared to the prediction of MC@NLO in combinationwith the standard background. The uncertainties in theplot are the statistical errors only; in the table theMC@NLO uncertainty contains both the statistical and theo-
retical component. In the bulk of the data at low mass theasymmetry is consistent with zero, while at high-mass theasymmetry is consistently above the prediction. Figure 11shows that when the data are separated by lepton charge,the asymmetries in the rapidity difference of the leptonicand hadronic top systems, �ylh ¼ yl-yh, behave in
ttA
1.0 y∆
6.0
0.0
2.0
4.0
8.0
QCDNLOtt
-1fb5.3dataCDFlevel-partontt
FIG. 7 (color online). Parton-level asymmetries at small andlarge�y compared to SM prediction of MCFM. The shaded bandsrepresent the total uncertainty in each bin.
(GeV/c )tt
M
300 400 500 600 700 800
Asy
mm
etry
0
0.02
0.04
0.06
0.08
0.1
0.12
0.14
0.16
0.18
0.2
2
FIG. 8. Parton-levelMt�t-dependence of At�t according to MCFM.
)2 (GeV/ctt
M
300 400 500 600 700 800 900
)2E
ven
ts /
(15
GeV
/c
1
10
210
data
+ bkgtt
background
FIG. 9 (color online). Event distribution as a function of thetotal invariant mass Mt�t.
EVIDENCE FOR A MASS DEPENDENT FORWARD- . . . PHYSICAL REVIEW D 83, 112003 (2011)
112003-13

approximately opposite fashion in the two independentsamples.
A. Asymmetries at high and low mass
The large statistical errors in the At�tðMt�t;iÞ distribution ofFig. 10 do not allow any conclusion on the functionaldependence. In order to make a quantitative measurementof At�tðMt�tÞ in a simple, statistically meaningful way, we usea compact representation of At�tðMt�t;iÞ into just two Mt�t
bins, below and above a given mass boundary.The boundary between the low and high-mass regions is
chosen based on a study of the color-octet samples de-scribed in the Appendix. These samples have At�tðMt�t;iÞdistributions that are comparable to the data and reasonablefor modeling the sensitivity in that variable. We find thatthe significance of the asymmetry at high-mass is maxi-mized when the bin division is at Mt�t ¼ 450 GeV=c2, andtherefore adopt this cut.
Figure 12 shows the �y distributions when the data isdivided into two regions, below and above Mt�t ¼450 GeV=c2. At low mass the asymmetry is consistent
with zero. At high-mass, the rapidity difference is broader,as expected from the kinematics, and an asymmetry isapparent. The top two lines of Table X compare the highand low mass asymmetries with the MC@NLO prediction.The uncertainty on the prediction combines the statisticaland the theoretical uncertainties. At high-mass the recon-structed asymmetry At�t ¼ 0:210� 0:049 (stat) is morethan 3 standard deviations above the prediction.The high-mass �ylh distributions for the two separate
lepton charges are shown in Fig. 13, and the asymmetriesin those distributions are summarized in the bottom partof Table X. Under the interchange of lepton charge, or,equivalently, under the interchange of t and �t, the asym-metry at high-mass is approximately reversed. This isconsistent with CP conservation, and also a strong argu-ment against a false asymmetry arising in event selection
ttM
350 400 450 500 550 600 650 700 750 800
(M)
ttA
-0.1
0
0.1
0.2
0.3
0.4
0.5
0.6 datat gkb + NLO t
M (GeV/c )tt2
FIG. 10 (color online). Left: The �y-Mt�t plane. Each dot represents one event, while the intensity of the shading showsapproximately the event probability in the standard PYTHIA based prediction. Right: The t�t frame asymmetry in the data in bins ofinvariant massMt�t, compared to the prediction of MC@NLO t�tþ backgrounds. The last bin includes all events withMt�t � 700 GeV=c2.
TABLE IX. The data-level asymmetry At�t in bins of Mt�t com-pared to the prediction of MC@NLO þ backgrounds.
bin-center At�t
(GeV=c2) N events data MC@NLO
375 532 �0:019� 0:043 0:003� 0:006
425 322 �0:012� 0:056 0:026� 0:008
475 190 0:158� 0:072 0:013� 0:010
525 95 0:305� 0:097 0:019� 0:013
575 58 0:138� 0:130 0:063� 0:020
650 34 0:471� 0:151 0:051� 0:020
750 29 0:103� 0:185 0:091� 0:022
ttM
350 400 450 500 550 600 650 700 750 800
(M)
-0.4
-0.2
0
0.2
0.4
0.6data (+ lepton)data ( - lepton)
M (GeV/c )tt2
A+_ lh
FIG. 11 (color online). The �ylh asymmetries in bins of in-variant mass Mt�t when the data is partitioned by lepton charge.
T. AALTONEN et al. PHYSICAL REVIEW D 83, 112003 (2011)
112003-14

or t�t reconstruction, as neither the event selection norreconstruction make reference to the lepton charge.
The results here suggest that the modest inclusive asym-metry in the t�t rest frame originates with a large asymmetryin a small population at high Mt�t.
B. The mass dependent asymmetry at the Parton-Level
In the measurement of the inclusive asymmetry we useda simple matrix technique to correct the rapidity distribu-tions for acceptance and resolution and derive parton-levelasymmetries that could be compared with theory. We dothis now for the mass dependent asymmetry in the t�t frame.We divide the data into two bins in �y, forward and back-ward, and two bins in mass, above and below 450 GeV=c2
and reapply the well tested 4� 4 unfold machinery of theinclusive analysis. The procedure yields fully corrected,model-independent asymmetries that can be comparedwith theoretical predictions.
We represent the four bins of the parton-leveldistribution of �y and Mt�t by a single vector ~n ¼½nLF; nLB; nHF; nHB� where, for example, nLF is the num-ber of forward events at low mass. As in the inclusive case,we know that the true ~n distribution is modified by matricesrepresenting the acceptance and then by the smearing inthe reconstruction, so that ~nsignal ¼ SA ~nparton. To measure
the parton-level value, we subtract backgrounds to recover
the signal from the data, and then invert the transformationas in Eq. (5).As before, the matrices A and S are derived from Pythia
Monte Carlo samples by comparing truth distributions tothe same distributions after reconstruction. The bin-to-binmigration measured in the smearing matrix now includesthe cross-terms between high and low mass and forwardand backward�y. The most significant migration is causedby misreconstructions that underestimate Mt�t and smearthe shape of the Mt�t spectrum towards lower masses.The accuracy of the procedure is first tested against
simulated control samples using PYTHIA and [email protected] PYTHIA test uses a t�t sample that is independent ofthe one used to create the response matrices. The top partof Table XI shows that the correction procedure is unbiasedwhen operating on the symmetric PYTHIA input. TheMC@NLO sample allows us to study the accuracy of the
correction in measuring the NLO QCD effect. A smallpossible bias of �0:02 between corrected and truth isinsignificant compared to the statistical uncertainty in thepresent data set.Next, we use the color-octet samples to test how well the
correction derived from symmetric PYTHIA can recoverlarge parton-level asymmetries. The bottom half ofTable XI shows that the correction procedure recoversboth the high and low mass asymmetries to within a fewpercent of the true values. The corrections in the Octet
t - YtY = Y∆
-3 -2 -1 0 1 2 3
Ev
en
ts /
0.6
0
100
200
300
400
500
data A = -0.016+/-0.034t gkb + t
A = -0.0087+/-0.034bkg A = 0.00073+/-0.069
t - YtY = Y∆
-3 -2 -1 0 1 2 3
Ev
en
ts /
0. 6
0
20
40
60
80
100
120
140
160data A = 0.21+/-0.049t gkb + t
A = -0.017+/-0.05bkg A = -0.024+/-0.11
FIG. 12 (color online). Top: The distribution of �y at low mass (left) and high-mass (right).
TABLE X. Charged and total asymmetries at the data-level, for all, low, and high Mt�t.
selection all Mt�t Mt�t < 450 GeV=c2 Mt�t � 450 GeV=c2
reco data 0:057� 0:028 �0:016� 0:034 0:210� 0:049MC@NLO 0:017� 0:004 0:012� 0:006 0:030� 0:007
Aþlh 0:067� 0:040 �0:013� 0:050 0:210� 0:066
A�lh �0:048� 0:039 0:020� 0:047 �0:210� 0:071
EVIDENCE FOR A MASS DEPENDENT FORWARD- . . . PHYSICAL REVIEW D 83, 112003 (2011)
112003-15

sample show a possible <0:03 bias that is marginallysignificant compared to the statistical precision of thetest. Because the Octet samples match the data well inthe two key distributions �y and Mt�t (see the Appendix)we expect that this is a representative measure of possiblemodel dependence in the correction, and we assign asystematic uncertainty of 0.035 for this effect.
Additional systematic uncertainties are evaluated in amanner similar to the inclusive case. These uncertaintiesare estimated by repeating the analysis while varying themodel assumptions within their known uncertainties forbackground normalization and shape, the amount of initial-and final-state radiation (ISR/FSR) in PYTHIA, the calo-rimeter jet energy scale (JES), the model of final-statecolor connection, and parton distribution functions(PDF). Table XII shows the expected size of all systematicuncertainties. The physics model dependence dominates.
Table XIII compares the low and high-mass asymmetryto predictions for the data-level, the background subtractedsignal-level, and the fully corrected parton-level. The MCpredictions include the 15% theoretical uncertainty. At low
-3 -2 -1 0 1 2 3
Ev
en
ts /
(0
.5 Y
)
0
10
20
30
40
50
60
70data (negative lepton) A = -0.21+/-0.071
+ bkgtt A = 0.015+/-0.07bkg A = 0.019+/-0.16
- yy = y∆ lh l h
-3 -2 -1 0 1 2 3
Ev
en
ts /
(0
.5 Y
)
0
10
20
30
40
50
60
70
80
90
100 data (positive lepton) A = 0.21+/-0.066
+ bkgtt A = -0.02+/-0.072bkg A = -0.028+/-0.16
- yy = y∆ lh l h
FIG. 13 (color online). The distribution of �ylh at high-mass for events with negative leptons (left) and positive leptons (right).
TABLE XI. Tests of the combined mass and rapidity correction procedure. True, recon-structed, and fully corrected asymmetries as found in the two-mass regions. Uncertainties onpredictions are statistical errors in the MC samples; at truth level these are negligible.
Sample At�t level Mt�t < 450 GeV=c2 Mt�t � 450 GeV=c2
PYTHIA MC truth 0.002 0.001
reconstructed �0:011� 0:006 �0:013� 0:008corrected 0:001� 0:018 0:006� 0:014
MC@NLO MC truth 0.043 0.070
reconstructed 0:015� 0:006 0:043� 0:009corrected 0:066� 0:014 0:086� 0:011
Octet A MC truth 0.081 0.276
reconstructed 0:024� 0:035 0:183� 0:010corrected 0:054� 0:022 0:308� 0:016
Octet B MC truth 0.150 0.466
reconstructed 0:078� 0:036 0:310� 0:009corrected 0:187� 0:024 0:476� 0:015
TABLE XII. Systematic asymmetry uncertainties in the two-mass bin unfold.
Source Mt�t < 450 GeV=c2 Mt�t � 450 GeV=c2
background size 0.017 0.032
background shape 0.003 0.003
JES 0.005 0.012
ISR/FSR 0.012 0.008
color reconnection 0.009 0.004
PDF 0.018 0.004
physics model 0.035 0.035
total 0.047 0.049
T. AALTONEN et al. PHYSICAL REVIEW D 83, 112003 (2011)
112003-16

mass, within uncertainties, the asymmetry at all correctionlevels agrees with predictions consistent with zero. Athigh-mass, combining statistical and systematic uncertain-ties in quadrature, the asymmetries at all levels exceedthe predictions by more than 3 standard deviations. Theparton-level comparison is summarized in Fig. 14. ForMt�t � 450 GeV=c2, the parton-level asymmetry in the t�trest frame is At�t ¼ 0:475� 0:114 (statþ sys), comparedwith the MCFM prediction of At�t ¼ 0:088� 0:013.
VIII. CROSS-CHECKS OF THE MASSDEPENDENTASYMMETRY
The large and unexpected asymmetry at high-mass de-mands a broader study of related effects in the t�t data. Welook for anomalies that could be evidence of a false posi-tive, along with correlations that could reveal more about atrue positive. In order to avoid any assumptions related tothe background subtraction, we make comparisons at thedata-level, appealing when necessary to the full t�tþ bkgsimulation models.
A. Lepton type
All of our simulated models predict asymmetries that areindependent of the lepton type: PYTHIA predicts asymme-tries that are consistent with zero, and the Octet modelspredict asymmetries that are consistent with each other.The data are shown in Table XIV. At high-mass, bothlepton types show positive asymmetries consistent withinerrors.
B. Reconstruction
It is conceivable that a reconstruction error could pro-duce an asymmetry from symmetric inputs. The qualityof the reconstruction is summarized by a �2 that measuresthe consistency of the solution with the t�t hypothesis.The distribution of �2 in our sample, shown in Fig. 15, isin very good agreement with the prediction, including agood match on the long tail. When the sample is restrictedto high quality fits with �2 � 3:0, we find 338 eventsin which At�t ¼ �0:033� 0:065 at low mass andAt�t ¼ 0:180� 0:099 at high-mass. Although the statisticalprecision is diminished in this small sample, it suggeststhat the high-mass asymmetry is present in the bestreconstructed events. Since the �2 requirement rejects asignificant fraction of the background, it also suggests thatthe high-mass asymmetry is not a background relatedeffect.To test for possible reconstruction biases related to b
tagging, we rerun the reconstruction algorithm removingthe constraint that b-tag jets be matched to b partons. Wefind At�t ¼ 0:006� 0:034 at low mass and At�t ¼ 0:190�0:050 at high-mass. When we further separate the events bylepton charge, the �ylh asymmetries are A�
lh ¼ �0:190�0:074 and Aþ
lh ¼ 0:190� 0:069. The large forward-
backward charge asymmetry at high-mass is seen to beindependent of the use of b� jet identification in thereconstruction.
C. b� Jet Identification
All of our simulated models predict asymmetries that areindependent of whether one or two jets are b tagged. In thedata, the asymmetry in the single and double two b-tagsamples are consistent with each other, although at high-mass the statistical precision of the double tagged sample ismarginal.In the background dominated antitags, the inclusive and
low mass samples have small asymmetries that agree withthe prediction. In the high-mass antitag sample we findAt�t ¼ 0:044� 0:035, consistent with either the model pre-diction of zero or a slight excess due to the t�t componentthere. Mixing backgrounds and t�t in the expected ratio andassuming the t�t component has an asymmetry of 0.266 (asin Table XIII), we find a total expected asymmetry in theantitag sample of At�t ¼ 0:079� 0:034 in agreement withthe data.
TABLE XIII. Asymmetry At�t at high and low mass comparedto prediction.
selection Mt�t < 450 GeV=c2 Mt�t � 450 GeV=c2
data �0:016� 0:034 0:210� 0:049t�tþ bkg þ0:012� 0:006 0:030� 0:007(MC@NLO)
data signal �0:022� 0:039� 0:017 0:266� 0:053� 0:032t�t þ0:015� 0:006 0:043� 0:009(MC@NLO)
data parton �0:116� 0:146� 0:047 0:475� 0:101� 0:049MCFM þ0:040� 0:006 0:088� 0:013
QCDNLOtt
ttA
2GeV/c450 ttM
0.0
2.0
4.0
2.0−
-1fb5.3dataCDFlevel-partontt
6.0
FIG. 14 (color online). Parton-level asymmetry in �y at highand low mass compared to MCFM prediction. The shaded regionrepresents the total uncertainty in each bin.
EVIDENCE FOR A MASS DEPENDENT FORWARD- . . . PHYSICAL REVIEW D 83, 112003 (2011)
112003-17

The leptonþ jets sample with no b tagging is the ‘‘pre-tag’’ sample. Our standard PYTHIAþ background modelpredicts pretag asymmetries consistent with zero for allmass categories. The asymmetries in the data are shown inTable XIV. At low mass the asymmetry in the pretags isconsistent with zero. At high-mass, the pretag sample has asignificant asymmetry 0:100� 0:029. If we assume that t�tsignal at high-mass has At�t ¼ 0:266 as in Table XIII andcombine t�t with our standard backgrounds in the expectedpretag ratio, we predict a pretag asymmetry of At�t ¼0:111� 0:028, in good agreement with the data.
As a final check in the pretag sample, we repeat theexercise of running the reconstruction without the con-straint that b-tagged jets are used as b partons. The results
are shown in the bottom row of Table XIV. The asymmetryat high-mass is 0:092� 0:029, a significant effect in asample that makes absolutely no reference to b tagging.
D. Jet multiplicity
In Sec. IVA we discussed the two components of theNLO QCD asymmetry: (1) radiative corrections to quark-antiquark production and (2) interference between differ-ent amplitudes contributing to the t�tj final-state. The twocontributions have opposite signs. At NLO, the first ispositive and dominant for the inclusive measurement,while the second is negative and subdominant. Sinceonly the second term produces t�tj events, we expect thatthe QCD asymmetry will be a function of the jetmultiplicity.We have studied the jet multiplicity dependence of At�t in
MC@NLO. We define 4-jet events as those with four jets
with ET > 20 GeV and j�j< 2:0 and no other such jets.We define 5-jet events as those with at least five jets withET > 20 GeV and j�j< 2:0. The MC@NLO prediction forthe pure t�t signal after reconstruction is shown in Table XV.The 5-jet asymmetries are negative, as expected. Veto ofthe five jet events creates an exclusive 4-jet sample withasymmetries that are roughly double those of the inclusivesample.As we discussed in Sec. IVA, the reliability of the NLO
picture has recently been called into question by NNLOcalculations of the t�tj component [26], which reduce thenegative asymmetry there to close to zero. However, sinceno NNLO calculation exists for the exclusive 4-jet, inclu-sive, or mass dependent asymmetries, the MC@NLO pre-diction in Table XV remains our comparison point.The jet multiplicity dependence of the asymmetries
in the data is shown in Table XVI. Vetoing events withextra jets does not produce a significant increase in the
TABLE XIV. Data-level asymmetries At�t for different event selections. In the case of no-b fit,the t�t reconstruction has been run without the constraint that b-tagged jets be associated with bpartons. In the antitag sample, the asymmetries in the data are compared to the prediction of ourstandard PYTHIAþ background model.
selection N events all Mt�t Mt�t < 450 GeV=c2 Mt�t � 450 GeV=c2
standard 1260 0:057� 0:028 �0:016� 0:034 0:212� 0:049
electrons 735 0:026� 0:037 �0:020� 0:045 0:120� 0:063
muons 525 0:105� 0:043 �0:012� 0:054 0:348� 0:080
data �2 < 3:0 338 0:030� 0:054 �0:033� 0:065 0:180� 0:099
data no-b fit 1260 0:062� 0:028 0:006� 0:034 0:190� 0:050
data single b tag 979 0:058� 0:031 �0:015� 0:038 0:224� 0:056
data double b tag 281 0:053� 0:059 �0:023� 0:076 0:178� 0:095
antitag data 3019 0:033� 0:018 0:029� 0:021 0:044� 0:035
antitag prediction 0:010� 0:007 0:013� 0:008 0:001� 0:014
pretag 4279 0:040� 0:015 0:017� 0:018 0:100� 0:029
pretag no-b fit 4279 0:042� 0:015 0:023� 0:018 0:092� 0:029
2χ
0 10 20 30 40 50 60 70 80 90 100
Eve
nts
0
100
200
300
400
500
600
700
800
900
FIG. 15 (color online). Distribution of t�t reconstruction �2.Black crosses are data. The histogram is sigþ bkg prediction:blue is background, green is PYTHIA stacked on background. Thelast bin on the right contains all events with �2 > 100.
T. AALTONEN et al. PHYSICAL REVIEW D 83, 112003 (2011)
112003-18
asymmetry. In the 5-jet sample, the asymmetries are con-sistent with zero. With a larger sample and better precisionit might be possible to use the jet multiplicity to testwhether the observed asymmetry is an amplified versionof the QCD charge asymmetry or a different effectaltogether.
E. Frame dependence
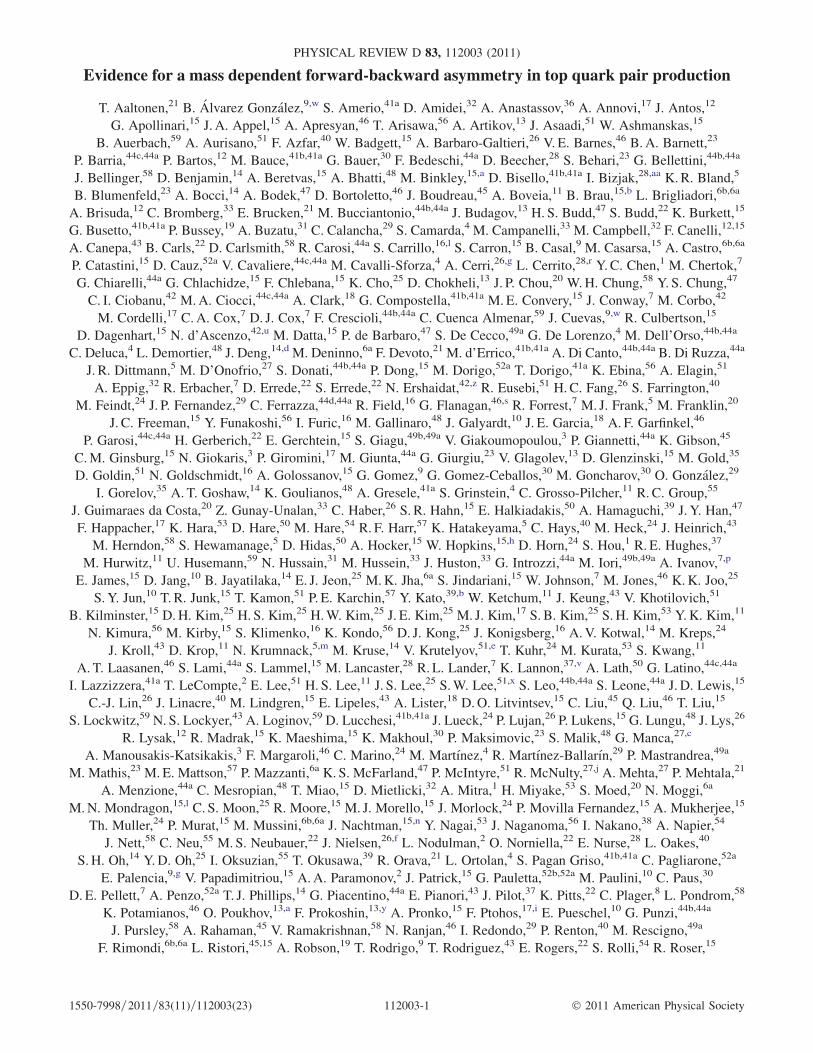
As in the inclusive analysis, it is interesting to compareAt�t to Ap �p. In the NLO QCD effect, the frame dependenceof the asymmetry (see Sec. IVA) persists at high-mass. ForMt�t � 450 GeV=c2 our MC@NLO model predicts the ratioof reconstructed asymmetries in the two frames Ap �p=At�t �0:74. The OctetA model predicts less mass dependence,with a ratio of 0.90.
The lab frame data asymmetries above and belowMt�t ¼450 GeV=c2 are shown in Table XVII. The variation of theasymmetry across the 450 GeV=c2 mass edge is not asdistinct as in the t�t frame, and the deviation from theMC@NLO prediction is not as significant. Within the large
errors, the asymmetries in the two lepton charge samplesare consistent with CP invariance.
Comparing Tables XVII and X, the ratio of Ap �p to At�t athigh-mass is 0:49� 0:21, lower than both the MC@NLO andOctet models. We have used pseudoexperiment techniquesto evaluate the statistical consistency of this ratio with themodels, using a large number of simulated experiments
that differ by Poisson fluctuations in the �y and �qyhdistributions. A Ap �p=At�t ratio of 0.49 or less occurs in 14%of pseudoexperiments with MC@NLO, but in <1% of ex-periments with OctetA.Finally, we look at Ap �p as a function of the b-tag multi-
plicity. We observed in Sec. VII that the inclusive Ap �p iszero in the double b-tagged events. In Table XVII, we seethat this pattern persists at high-mass, although the statis-tical precision is poor. Appealing again to pseudoexperi-ments with Poisson fluctuations, we find that a ratio ofdouble to single tag Ap �p as small as that in the data occursin 6% of all pseudoexperiments with MC@NLO. We con-clude that the low value of Ap �p in the double b-taggedsample is consistent with a statistical fluctuation.
IX. CONCLUSIONS
We have studied the forward-backward asymmetry oftop quark pairs produced in 1.96 TeV p �p collisions at theFermilab Tevatron. In a sample of 1260 events in theleptonþ jet decay topology, we measure the parton-levelinclusive asymmetry in both the laboratory and t�t restframe, and rapidity-dependent, and Mt�t-dependent asym-metries in the t�t rest frame. We compare to NLO predic-tions for the small charge asymmetry of QCD.The laboratory frame measurement uses the rapidity of
the hadronically decaying top system and combines thetwo lepton charge samples under the assumption of CP
TABLE XV. MC@NLO predictions for At�t in reconstructed t�t signal (no backgrounds) as afunction of Mt�t and jet multiplicity. The uncertainties reflect MC statistics only.
selection all Mt�t Mt�t < 450 GeV=c2 Mt�t � 450 GeV=c2
inclusive 0:024� 0:004 0:015� 0:005 0:043� 0:0074-jet 0:048� 0:005 0:033� 0:006 0:078� 0:0095-jet �0:035� 0:007 �0:032� 0:009 �0:040� 0:012
TABLE XVI. Asymmetries At�t in the data as a function of jet multiplicity.
selection N events all Mt�t Mt�t < 450 GeV=c2 Mt�t � 450 GeV=c2
inclusive 1260 0:057� 0:028 �0:016� 0:034 0:212� 0:049
4-jet 939 0:065� 0:033 �0:023� 0:039 0:26� 0:057
5-jet 321 0:034� 0:056 0:0049� 0:07 0:086� 0:093
TABLE XVII. Reconstruction level asymmetries Ap �p in the laboratory frame.
selection all Mt�t Mt�t < 450 GeV=c2 Mt�t � 450 GeV=c2
data reco 0:073� 0:028 0:059� 0:034 0:103� 0:049MC@NLO 0:001� 0:003 �0:008� 0:005 0:022� 0:007
Aþh �0:070� 0:040 �0:028� 0:050 �0:148� 0:066
A�h 0:076� 0:039 0:085� 0:047 0:053� 0:072
single b-tags 0:095� 0:032 0:079� 0:034 0:130� 0:057double b-tags �0:004� 0:060 �0:023� 0:076 0:028� 0:097
EVIDENCE FOR A MASS DEPENDENT FORWARD- . . . PHYSICAL REVIEW D 83, 112003 (2011)
112003-19
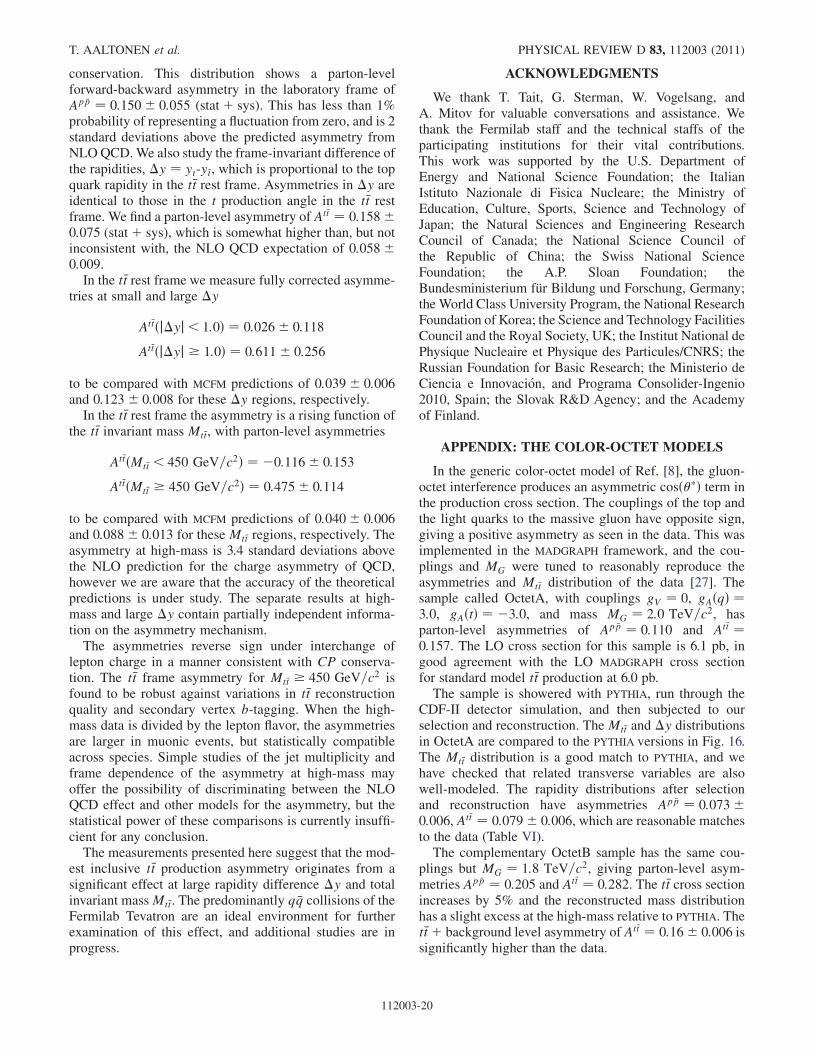
conservation. This distribution shows a parton-levelforward-backward asymmetry in the laboratory frame ofAp �p ¼ 0:150� 0:055 (statþ sys). This has less than 1%probability of representing a fluctuation from zero, and is 2standard deviations above the predicted asymmetry fromNLOQCD.We also study the frame-invariant difference ofthe rapidities, �y ¼ yt-y�t, which is proportional to the topquark rapidity in the t�t rest frame. Asymmetries in �y areidentical to those in the t production angle in the t�t restframe. We find a parton-level asymmetry of At�t ¼ 0:158�0:075 (statþ sys), which is somewhat higher than, but notinconsistent with, the NLO QCD expectation of 0:058�0:009.
In the t�t rest frame we measure fully corrected asymme-tries at small and large �y
At�tðj�yj< 1:0Þ ¼ 0:026� 0:118
At�tðj�yj � 1:0Þ ¼ 0:611� 0:256
to be compared with MCFM predictions of 0:039� 0:006and 0:123� 0:008 for these �y regions, respectively.
In the t�t rest frame the asymmetry is a rising function ofthe t�t invariant mass Mt�t, with parton-level asymmetries
At�tðMt�t < 450 GeV=c2Þ ¼ �0:116� 0:153
At�tðMt�t � 450 GeV=c2Þ ¼ 0:475� 0:114
to be compared with MCFM predictions of 0:040� 0:006and 0:088� 0:013 for these Mt�t regions, respectively. Theasymmetry at high-mass is 3.4 standard deviations abovethe NLO prediction for the charge asymmetry of QCD,however we are aware that the accuracy of the theoreticalpredictions is under study. The separate results at high-mass and large �y contain partially independent informa-tion on the asymmetry mechanism.
The asymmetries reverse sign under interchange oflepton charge in a manner consistent with CP conserva-tion. The t�t frame asymmetry for Mt�t � 450 GeV=c2 isfound to be robust against variations in t�t reconstructionquality and secondary vertex b-tagging. When the high-mass data is divided by the lepton flavor, the asymmetriesare larger in muonic events, but statistically compatibleacross species. Simple studies of the jet multiplicity andframe dependence of the asymmetry at high-mass mayoffer the possibility of discriminating between the NLOQCD effect and other models for the asymmetry, but thestatistical power of these comparisons is currently insuffi-cient for any conclusion.
The measurements presented here suggest that the mod-est inclusive t�t production asymmetry originates from asignificant effect at large rapidity difference �y and totalinvariant massMt�t. The predominantly q �q collisions of theFermilab Tevatron are an ideal environment for furtherexamination of this effect, and additional studies are inprogress.
ACKNOWLEDGMENTS
We thank T. Tait, G. Sterman, W. Vogelsang, andA. Mitov for valuable conversations and assistance. Wethank the Fermilab staff and the technical staffs of theparticipating institutions for their vital contributions.This work was supported by the U.S. Department ofEnergy and National Science Foundation; the ItalianIstituto Nazionale di Fisica Nucleare; the Ministry ofEducation, Culture, Sports, Science and Technology ofJapan; the Natural Sciences and Engineering ResearchCouncil of Canada; the National Science Council ofthe Republic of China; the Swiss National ScienceFoundation; the A.P. Sloan Foundation; theBundesministerium fur Bildung und Forschung, Germany;the World Class University Program, the National ResearchFoundation of Korea; the Science and Technology FacilitiesCouncil and the Royal Society, UK; the Institut National dePhysique Nucleaire et Physique des Particules/CNRS; theRussian Foundation for Basic Research; the Ministerio deCiencia e Innovacion, and Programa Consolider-Ingenio2010, Spain; the Slovak R&D Agency; and the Academyof Finland.
APPENDIX: THE COLOR-OCTET MODELS
In the generic color-octet model of Ref. [8], the gluon-octet interference produces an asymmetric cosð�Þ term inthe production cross section. The couplings of the top andthe light quarks to the massive gluon have opposite sign,giving a positive asymmetry as seen in the data. This wasimplemented in the MADGRAPH framework, and the cou-plings and MG were tuned to reasonably reproduce theasymmetries and Mt�t distribution of the data [27]. Thesample called OctetA, with couplings gV ¼ 0, gAðqÞ ¼3:0, gAðtÞ ¼ �3:0, and mass MG ¼ 2:0 TeV=c2, hasparton-level asymmetries of Ap �p ¼ 0:110 and At�t ¼0:157. The LO cross section for this sample is 6.1 pb, ingood agreement with the LO MADGRAPH cross sectionfor standard model t�t production at 6.0 pb.The sample is showered with PYTHIA, run through the
CDF-II detector simulation, and then subjected to ourselection and reconstruction. The Mt�t and �y distributionsin OctetA are compared to the PYTHIA versions in Fig. 16.The Mt�t distribution is a good match to PYTHIA, and wehave checked that related transverse variables are alsowell-modeled. The rapidity distributions after selectionand reconstruction have asymmetries Ap �p ¼ 0:073�0:006, At�t ¼ 0:079� 0:006, which are reasonable matchesto the data (Table VI).The complementary OctetB sample has the same cou-
plings but MG ¼ 1:8 TeV=c2, giving parton-level asym-metries Ap �p ¼ 0:205 and At�t ¼ 0:282. The t�t cross sectionincreases by 5% and the reconstructed mass distributionhas a slight excess at the high-mass relative to PYTHIA. Thet�tþ background level asymmetry of At�t ¼ 0:16� 0:006 issignificantly higher than the data.
T. AALTONEN et al. PHYSICAL REVIEW D 83, 112003 (2011)
112003-20

)2 (GeV/ctt
M
300 400 500 600 700 800 900
)2E
ven
ts /
(15
GeV
/c
10
210
310
octet A+bkg
t gkb + t
t - YtY = Y∆
-3 -2 -1 0 1 2 3
Eve
nts
/ 0.
6
0
2000
4000
6000
8000
10000
12000
14000
16000Octet A+bkg A = 0.08+/-0.0058
t gkb + t
A = -0.013+/-0.0058
FIG. 16 (color online). The distributions of Mt�t (left) and �y (right) in the OctetA sample compared to the PYTHIAþ backgroundprediction.
350 400 450 500 550 600 650 700 750 800
(M)
ttA
-0.1
0
0.1
0.2
0.3
0.4
0.5
0.6Octet A+bkg
+ bkgtt
)2 (GeV/ctt
M
350 400 450 500 550 600 650 700 750 800
(M)
ttA
-0.1
0
0.1
0.2
0.3
0.4
0.5
0.6Octet B+bkg
+ bkgtt
)2 (GeV/ctt
M
FIG. 17 (color online). The reconstructed Mt�t dependence of At�t in the color-octet models. Left: OctetA. Right: OctetB.
t - YtY = Y∆
-3 -2 -1 0 1 2 3
Eve
nts
/ 0.
6
0
2000
4000
6000
8000
10000
12000Octet A+bkg
A = 0.024+/-0.0072
t gkb + t A = -0.012+/-0.0071
t - YtY = Y∆
-3 -2 -1 0 1 2 3
Eve
nts
/ 0.
6
0
500
1000
1500
2000
2500
3000
3500
4000
4500Octet A+bkg A = 0.18+/-0.0097
t gkb + t A = -0.016+/-0.01
FIG. 18 (color online). Top: The distribution of �y at low mass (left) and high-mass (right). The PYTHIA baseline model is the filledhistogram and the Octet samples are the points.
EVIDENCE FOR A MASS DEPENDENT FORWARD- . . . PHYSICAL REVIEW D 83, 112003 (2011)
112003-21

These models both show the same factor of �2 ratiobetween data-level and parton-level asymmetries that isseen in the data and in MC@NLO.
Since these models have relatively low-lying octetmasses near 2 TeV=c2 we expect a significantMt�t-dependent asymmetry over our experimental range.
The At�tðMt�t;iÞ behavior for the two color-octet samples is
shown in Fig. 17. Both show a smooth and significant riseof the asymmetry with increasing mass.In Sec. VII A we discussed a simple representation of
At�tðMt�tÞ with two regions of low and high Mt�t. The ques-tion for that representation is how to choose the boundarymass between high and low. Table XVIII shows the asym-metry, uncertainty, and significance At�t=At�t at high-massas a function of the mass threshold for both octet models.The uncertainties are calculated assuming the data samplesize of 5:3 fb�1. For both samples, the significance of theasymmetry at high-mass is maximum at reconstructedMt�t ¼ 450 GeV=c2. Looking at Fig. 9, we see that this isreasonable: 450 GeV=c2 cuts off the bulk of the low masspeak while retaining good statistics on the tail.Figure 18 compares the �y distributions in the OctetA
sample and PYTHIA when the events are divided intosamples below and above Mt�t ¼ 450 GeV=c2. TheOctetA �y distribution shows a marked asymmetry inthe high-mass sample.The reconstructed asymmetries at high and low mass in
the color-octet samples are given in Table XIX. The un-certainties here reflect the Monte Carlo statistics. At high-mass the color-octet samples have large asymmetries asseen in Fig. 18. At low mass, the models have small butsignificant asymmetries, especially in OctetB. We havechecked that these asymmetries are charge asymmetries,reversing sign under interchange of lepton charge.
[1] L. G. Almeida, G. F. Sterman, and W. Vogelsang, Phys.
Rev. D 78, 014008 (2008).[2] O. Antunano, J. H. Kuhn, and G.V. Rodrigo, Phys. Rev. D
77, 014003 (2008).[3] M. T. Bowen, S. D. Ellis, and D. Rainwater, Phys. Rev. D
73, 014008 (2006).[4] F. A. Berends, K. J. F. Gaemers, and R. Gastmans, Nucl.
Phys. B63, 381 (1973); T. Himel et al., Phys. Rev. Lett. 41,449 (1978).
[5] T. Aaltonen et al. (CDF Collaboration), Phys. Rev. Lett.
101, 202001 (2008).[6] V.M. Abazov et al. (D0 Collaboration), Phys. Rev. Lett.
100, 142002 (2008).[7] D.W. Jung, P. Ko, J. S. Lee, and S.H. Nam, Phys. Lett. B
691, 238 (2010); E. Alvarez, L. DaRold, and A. Szynkman,
J. High Energy Phys. 11 (2011) 70; D.W. Jung, P. Ko, and
J. S. Lee, arXiv:1011.5976; C.H. Chen, G. Cvetic, and C. S.
Kim, arXiv:1009.5976; Y.K.Wong, B. Xiao, and S.H. Zhu,
Phys. Rev. D 82, 094011 (2010); A. Djouadi, G. Moreau, F.
Richard, and R.K. Singh, Phys. Rev. D 82, 071702(R)(2010); M. Bauer, F. Goertz, U. Haisch, T. Pfoh, and S.
Westhoff, J. High Energy Phys. 11 (2010) 039; R. S.
Chivukula, E.H. Simmons, and C. P. Yuan, Phys. Rev. D
82, 094009 (2010); B. Xiao, Y.K. Wang, and S.H. Zhu,
Phys. Rev. D 82, 034026 (2010); Q.H. Cao, D. McKeen,
J. L. Rosner, G. Shaughnessy, and C. E.M. Wagner, Phys.
Rev. D 81, 114004 (2010); I. Dorsner, S. Fajfer, J. F.
Kamenik, and N. Kosnik, Phys. Rev. D 81, 055009 (2010);S. Jung,H.Murayama,A. Pierce, and J.D.Wells, Phys. Rev.
D 81, 015004 (2010); K. Cheung, W.-Y. Keung, and T.-C.
Yuan, Phys. Lett. B 682, 287 (2009); P.H. Frampton, J. Shu,
and K.Wang, Phys. Lett. B 683, 294 (2010); J. Shu, T.M. P.
Tait, and K. Wang, Phys. Rev. D 81, 034012 (2010); A.
Arhrib,R.Benbrik, andC.H.Chen,Phys.Rev.D82, 034034(2010); D.W. Jung, P. Ko, J. S. Lee, and S.H. Nam, Phys.
Lett. B 691, 238 (2010); J. Cao, Z. Heng, L. Wu, and J.M.
Yang, Phys. Rev. D 81, 014016 (2010); V. Barger, W.Y.
Keung, and C. T. Yu, Phys. Rev. D 81, 113009 (2010); P.
Ferrario and G. Rodrigo, Phys. Rev. D 78, 094018 (2008).[8] P. Ferrario andG. Rodrigo, Phys. Rev. D 80, 051701 (2009).[9] T. Aaltonen et al. (CDF Collaboration), Phys. Rev. Lett.
105, 012001 (2010); D. Acosta et al. (CDF Collaboration),
Phys. Rev. D 71, 052003 (2005).[10] T. Aaltonen et al. (CDF Collaboration), Phys. Rev. Lett.
102, 222003 (2009).[11] D. Acosta et al. (CDF Collaboration), Phys. Rev. D 71,
032001 (2005); CDF-II Collaboration, Detector Technical
Design Report No FERMILAB-PUB/390-E, 1996.
TABLE XVIII. At�t and significance (in units of standard de-viation) in Octet samples for events withMt�t above the bin-edge.
OctetA OctetB
bin-edge At�t significance At�t significance
(GeV=c2)
345 0:082� 0:028 2.90 0:168� 0:028 5.99
400 0:128� 0:036 3.55 0:235� 0:035 6.74
450 0:183� 0:047 3.91 0:310� 0:044 7.08
500 0:215� 0:060 3.60 0:369� 0:054 6.81
550 0:246� 0:076 3.25 0:425� 0:066 6.43
600 0:290� 0:097 2.97 0:460� 0:081 5.70
TABLE XIX. Reconstructed asymmetry At�t below and aboveMt�t ¼ 450 GeV=c2 in Octet models.
sample all Mt�t Mt�t < 450 GeV=c2 Mt�t � 450 GeV=c2
OctetA 0:080� 0:006 0:024� 0:007 0:180� 0:010OctetB 0:160� 0:006 0:078� 0:007 0:310� 0:009
T. AALTONEN et al. PHYSICAL REVIEW D 83, 112003 (2011)
112003-22

[12] The polar angle is and the azimuthal angle is �. Withtotal energy E and momentum p, the transverse energy isdefined as ET ¼ E sin and the transverse momentum ispT ¼ p sin. The missing transverse energy (ET) is definedby ~ET ¼ ��iET
ini where ni is a unit vector perpendicularto the beam axis and pointing to the ith calorimeter tower.The pseudorapidity is � ¼ � lnðtanð=2ÞÞ.
[13] Unless otherwise stated, the inclusion of the charge-conjugate mode is implied.
[14] D. Acosta et al. (CDF Collaboration), Phys. Rev. D 71,052003 (2005).
[15] M. L. Mangano, M. Moretti, F. Piccinini, R. Pittau, and A.Polosa, J. High Energy Phys. 07 (2003) 001.
[16] A. Abulencia et al. (CDF Collaboration), Phys. Rev. D 73,032003 (2006).
[17] T. Sjostrand, S. Mrenna, and P. Skands, J. High EnergyPhys. 05 (2006) 026.
[18] J. Pumplin et al., J. High Energy Phys. 07 (2002) 012.[19] T. Aaltonen et al. (CDF Collaboration), Phys. Lett. B 691,
183 (2010).[20] S. Frixione and B. R. Webber, J. High Energy Phys. 06
(2002) 029.[21] The rapidity resolution is independent of polar angle as a
consequence of dividing the calorimeter into towers ofconstant y-width.
[22] J.M. Campbell and R.K. Ellis, Phys. Rev. D 60, 113006(1999).
[23] J. Alwall, P. Demin, S. de Visscher, R. Frederix,M. Herquet, F. Maltoni, T. Plehn, D. L. Rainwater,and T. Stelzer, J. High Energy Phys. 09 (2007)028.
[24] R.W. Brown, D. Sahdev, and K.O. Mikaelian, Phys.Rev. Lett. 43, 1069 (1979); F. Halzen, P. Hoyer,and C. S. Kim, Phys. Lett. B 195, 74 (1987); P. Nason,S. Dawson, and R.K. Ellis, Nucl. Phys. B303, 607(1988).
[25] G. Sterman (private communication).[26] S. Dittmaier, P. Uwer, and S. Weinzier, Nucl. Phys. B,
Proc. Suppl. 183, 196 (2008).[27] We are indebted to T. Tait for the MADGRAPH implemen-
tation of the color-octet models.[28] T. Schwarz, Ph.D. thesis, University of Michigan, 2006,
Report No. FERMILAB-THESIS-2006-51.[29] D. Hirschbuehl, Ph.D. thesis, Karlsruhe University, 2005,
Report No. FEMILAB-THESIS-2005-80.[30] G. Strycker, Ph.D. thesis, University of Michigan, 2006,
Report No. FERMILAB-THESIS-2010-37.[31] V.M. Abazov et al. (D0 Collaboration), Phys. Lett. B 668,
98 (2008).
EVIDENCE FOR A MASS DEPENDENT FORWARD- . . . PHYSICAL REVIEW D 83, 112003 (2011)
112003-23