physical layer section 2
TRANSCRIPT

Network Analysis: Physical 2-1
Physical Layer Section 2
Dr. G. A. Marin
Network Analysis: Physical 2-2
Theoretical Basis for Data Communication
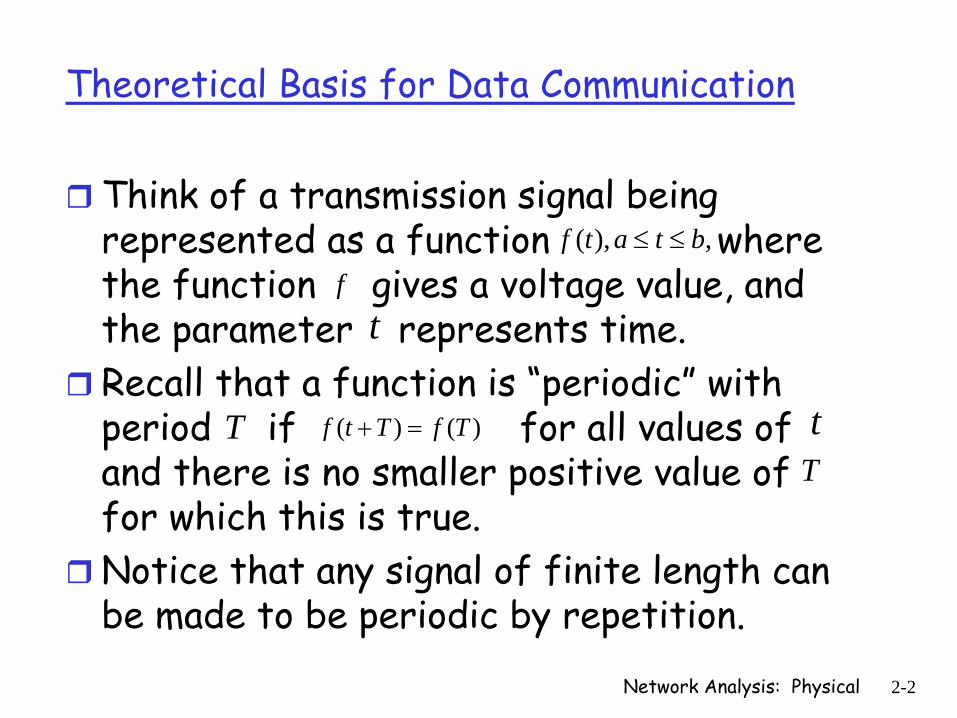
Think of a transmission signal being represented as a function where the function gives a voltage value, and the parameter represents time.Recall that a function is “periodic” with period if for all values of and there is no smaller positive value of for which this is true. Notice that any signal of finite length can be made to be periodic by repetition.
( ), ,f t a t b≤ ≤
ft
T ( ) ( )f t T f T+ = tT

Network Analysis: Physical 2-3
Fourier SeriesEarly in the 19th century the French mathematician, Jean-Baptiste Fourierproved that any "reasonably behaved" periodic function, ( ), can be represented as the sum of sines and cosines such as:
g t
1 1
1 g( ) sin(2 ) cos(2 ),2
1where is the fundamental frequency, and are the "sine and
cosine amplitudes" of the th harmonics (terms), and is a constan
n nn n
n n
t c a nft b nft
f a bT
n c
π π∞ ∞
= =
= + +
=
∑ ∑
0 0
t.The above equation gives the Fourier Series representation of the periodicfunction . We can find the constant and sine and consine amplitudes using:
2 2( )sin(2 ) ( ) cos(2 )T T
n n
g
a g t nf dt b g t nf dT T
π π= =∫ ∫0
2 ( ) .T
t c g t dtT
= ∫
Network Analysis: Physical 2-4
Fourier Example (Tan 2-1)
T 1:= f1T
:=
b n( )2T 0
Ttg t( ) cos 2 π⋅ n⋅ f⋅ t⋅( )⋅
⌠⎮⌡
d⋅12
2 cos π n⋅( )2⋅ 1− 4 π n sin π n⋅( ) cos π n⋅( )⋅⋅⋅⋅+
π2
n2⋅
⋅1
2 π2
n2⋅⋅
−→:=
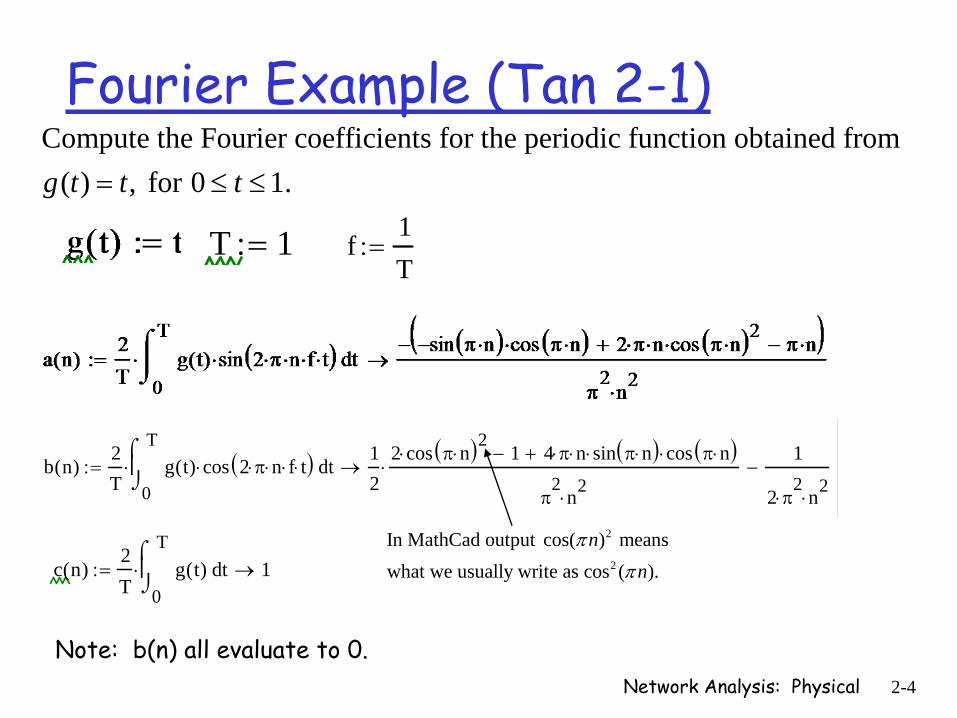
Compute the Fourier coefficients for the periodic function obtained from( ) , for 0 1.g t t t= ≤ ≤
c n( )2T 0
Ttg t( )
⌠⎮⌡
d⋅ 1→:=
Note: b(n) all evaluate to 0.
2
2
In MathCad output cos( ) means what we usually write as cos ( ).
nn
π
π
Network Analysis: Physical 2-5
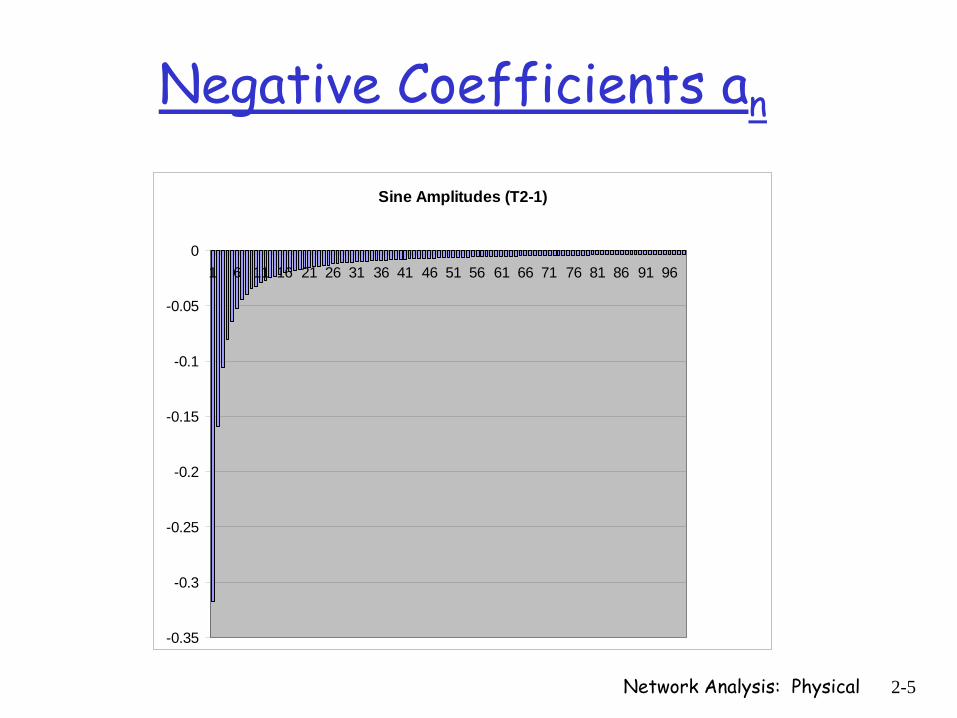
Negative Coefficients an
Sine Amplitudes (T2-1)
-0.35
-0.3
-0.25
-0.2
-0.15
-0.1
-0.05
01 6 11 16 21 26 31 36 41 46 51 56 61 66 71 76 81 86 91 96

Network Analysis: Physical 2-6
rms amplitudes: 2 2n na b+
0
0.05
0.1
0.15
0.2
0.25
0.3
0.35
1 5 9 13 17 21 25 29 33 37 41 45 49 53 57 61 65 69 73 77 81 85 89 93 97
Thus, we may get an acceptable reconstruction of the original g(t)=t, for example, using the first 50 harmonics. If the comm channel only lets the first 4 harmonics through, the received signal may be badly “distorted.”

Network Analysis: Physical 2-7
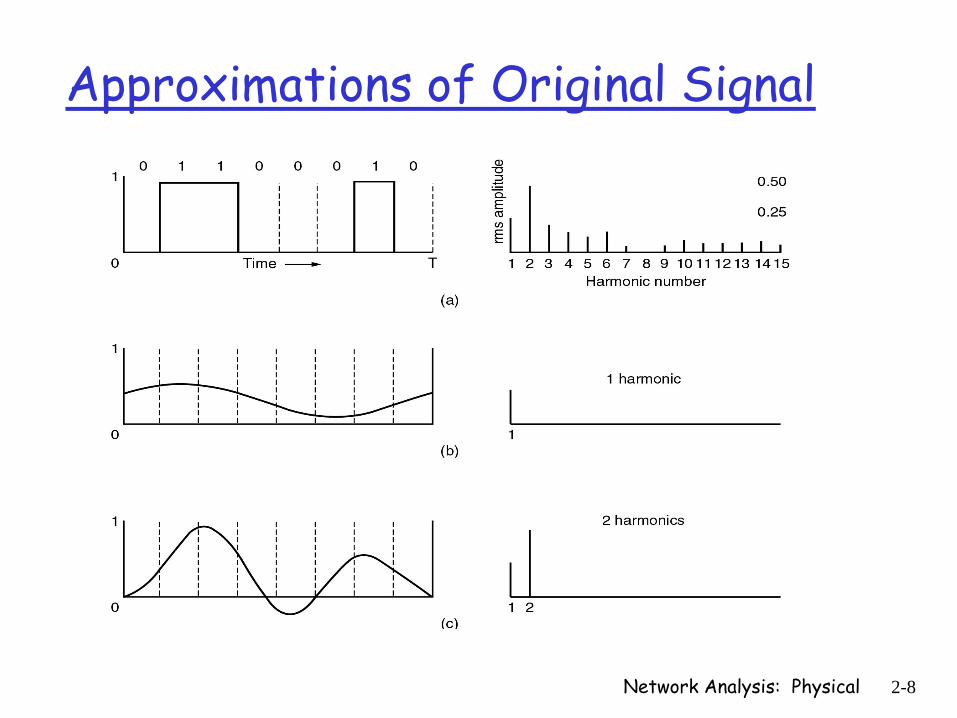
Transmit an ascii “b” or 011000101To find the Fourier coefficients we write 8, and let
0 for 0 11 for 1 21 for 2 30 for 3 4
( )0 for 4 50 for 5 61 for 6 70 for 7 8.
We can then use the definitions t
T fT
tttt
g ttttt
= =
≤ ≤⎧⎪ < ≤⎪⎪ < ≤⎪ < ≤⎪= ⎨ < ≤⎪⎪ < ≤⎪
< ≤⎪⎪ < ≤⎩
o obtain the , , and values.n na b c
Network Analysis: Physical 2-8
Approximations of Original Signal
Network Analysis: Physical 2-9
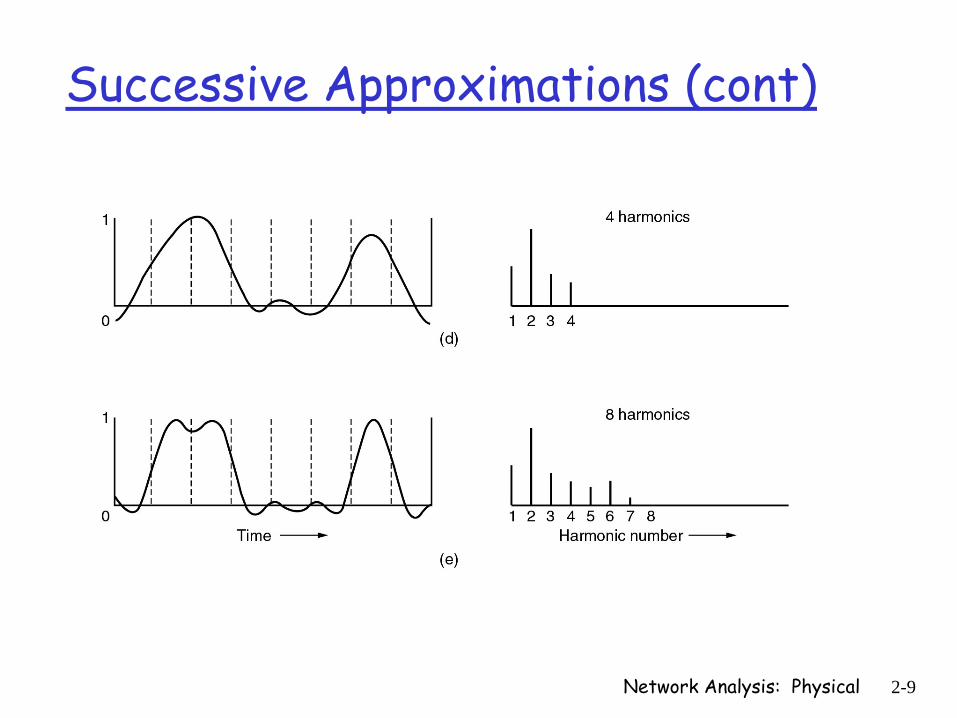
Successive Approximations (cont)

Network Analysis: Physical 2-10
Analog communication channel…
Diminishes different Fourier coefficients by different amounts (distortion).Usually lets frequencies from 0 through a max cutoff frequency, fc.
Frequencies above this value are strongly attentuated.
Transmits a range of frequencies (usually measured from 0 up to the fc where half the transmitted power gets through).
The range of frequencies transmitted without strong attenuation is called the “bandwidth” of the channel.
Network Analysis: Physical 2-11
Maximum Data Rate of Channel
In 1948 Henry Nyquist proved that if a signal has been run through a low-pass filter (channel) of bandwidth H, the filtered signal can be exactly recovered by by capturing (only) 2H samples per second.If the original signal contains V discrete levels, then the maximum data rate is 2Hlog2V bit/sec.
A noiseless 3kHz channel cannot transmit binary signals at a rate faster than 6,000 bps.
Network Analysis: Physical 2-12
Channel NoiseEvery practical transmission channel has some background noise. We measure noise relative to the power of the signal using a signal-to-noise ratio, S/N.
Instead of using the power ratio directly engineers use 10log10S/N, units called decibels.
In 1948 Claude Shannon dealt with the effect of such noise by showing that the max data rate of a noise channel with bandwidth H hz and given S/N ratio is Hlog2(1+S/N) bits/sec.
Notice that S/N is not in decibels in the equation.
Network Analysis: Physical 2-13
Example
10 10
A channel in the telephone system has a bandwidth of about 3000 Hzand a signal-to-noise ratio of 30 dB. What is the max transmission rate inbits/sec?
/ 30 dB implies that 10 log (S/N) 30 or log (S/S N = =
2
N) 3 (the ratio ofthe signal power to noise power); thus, S/N power = 1,000. Because log (1 1000) 9.9672..., the maximum transmission rate is 3,000*9.9672 30,000 bps.
=
+ =≈
Network Analysis: Physical 2-14
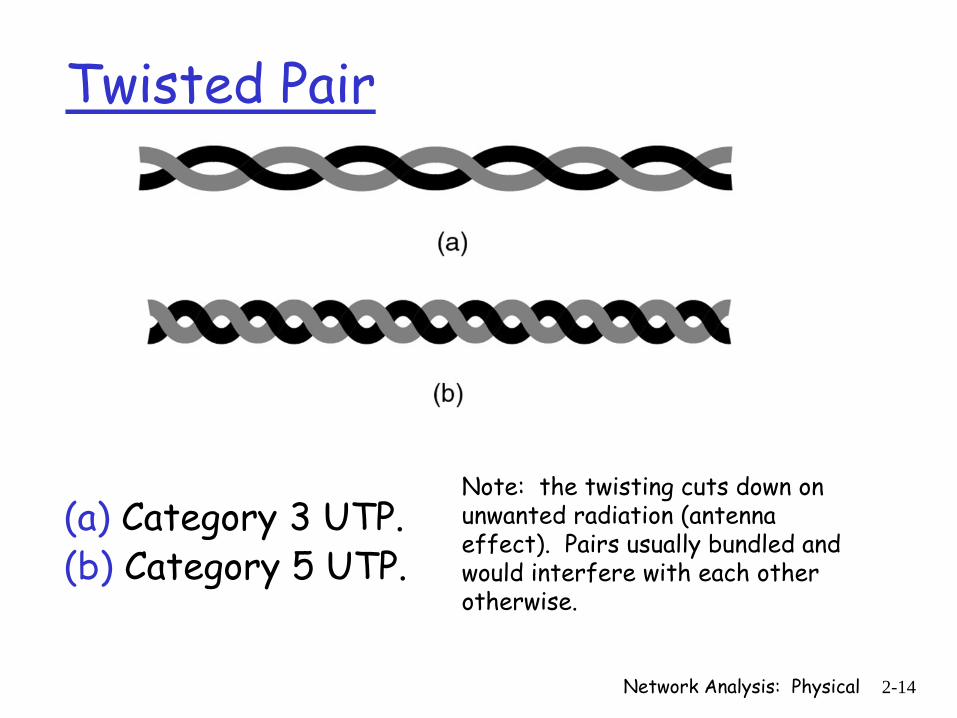
Twisted Pair
(a) Category 3 UTP.(b) Category 5 UTP.
Note: the twisting cuts down on unwanted radiation (antenna effect). Pairs usually bundled and would interfere with each other otherwise.
Network Analysis: Physical 2-15
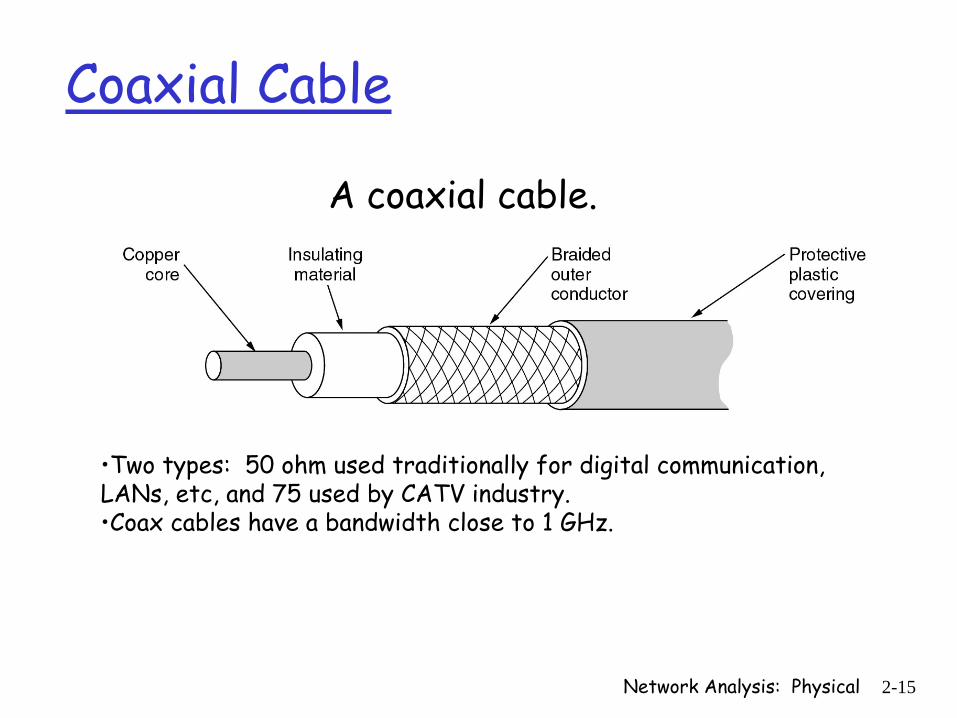
Coaxial Cable
A coaxial cable.
•Two types: 50 ohm used traditionally for digital communication, LANs, etc, and 75 used by CATV industry. •Coax cables have a bandwidth close to 1 GHz.

Network Analysis: Physical 2-16
Fiber Optics
(a) Three examples of a light ray from inside a silica fiber impinging on the air/silica boundary at different angles.
(b) Light trapped by total internal reflection.(c) Theoretical limit today > 50,000 Gbps, but limited to
10Gbps by electro-optical conversion.

Network Analysis: Physical 2-17
Wavelength and FrequencyElectrons propagate in electronic "waves" that were predicted by James Clerk Maxwell in 1865 and and first observed by Heinrich Hertz in 1887. The numberof oscillations per second of a wave is called its frequency, , and is measuredin Hertz (Hz). The distance between two consecutive maxima or minima is called the wavelength, . The relationship between frequency and wavelength is given by:
f
fλ
λ = 8, where represents the speed of light, 3 10 meters/sec.c c ×
Tannenbaum gives a nice rule of thumb: When is in meters and is in MHz,then 300. Thus, 100 MHz waves are about 3 meters long and 1000 MHzwaves are 0.3 meters long.
ff
λλ ≈

Network Analysis: Physical 2-18
Signaling (Encoding)
Assume (first) two signal levels (voltages, frequencies, phase shifts…)Suppose represent 1 as High signal and 0 as Low signal
Bits 0 0 1 0 1 1 1 1 0 1 0 0 0 0 1 0
NRZ
Problems:1. Baseline wander (detect based on delta from avg)2. Clock recovery (need frequent signal transitions)
Network Analysis: Physical 2-19
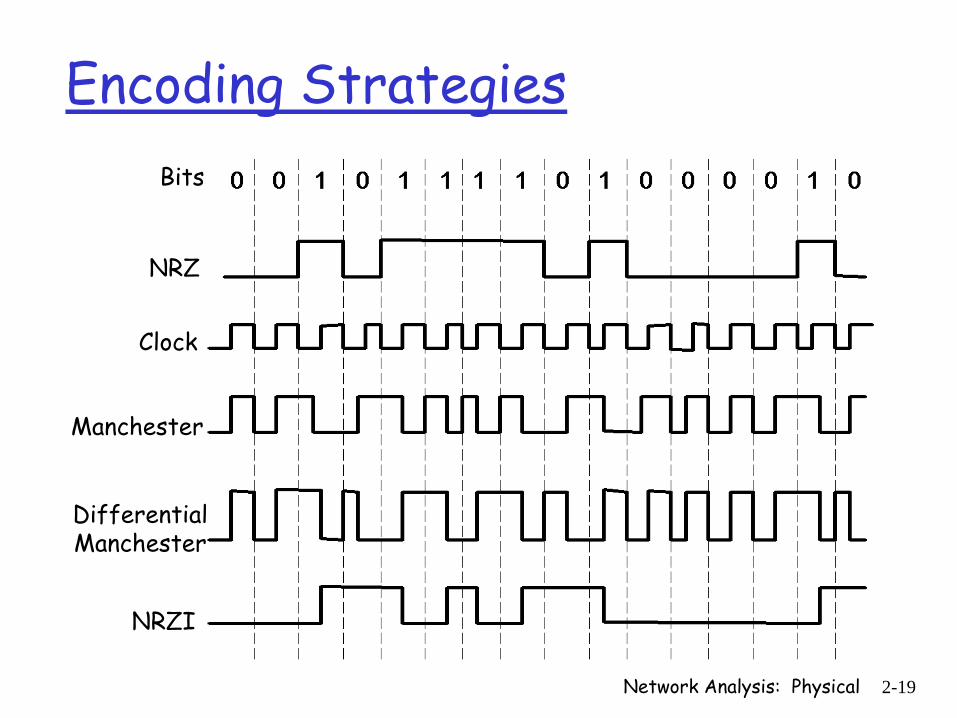
Encoding StrategiesBits
NRZ
Clock
Manchester
DifferentialManchester
NRZI
Network Analysis: Physical 2-20
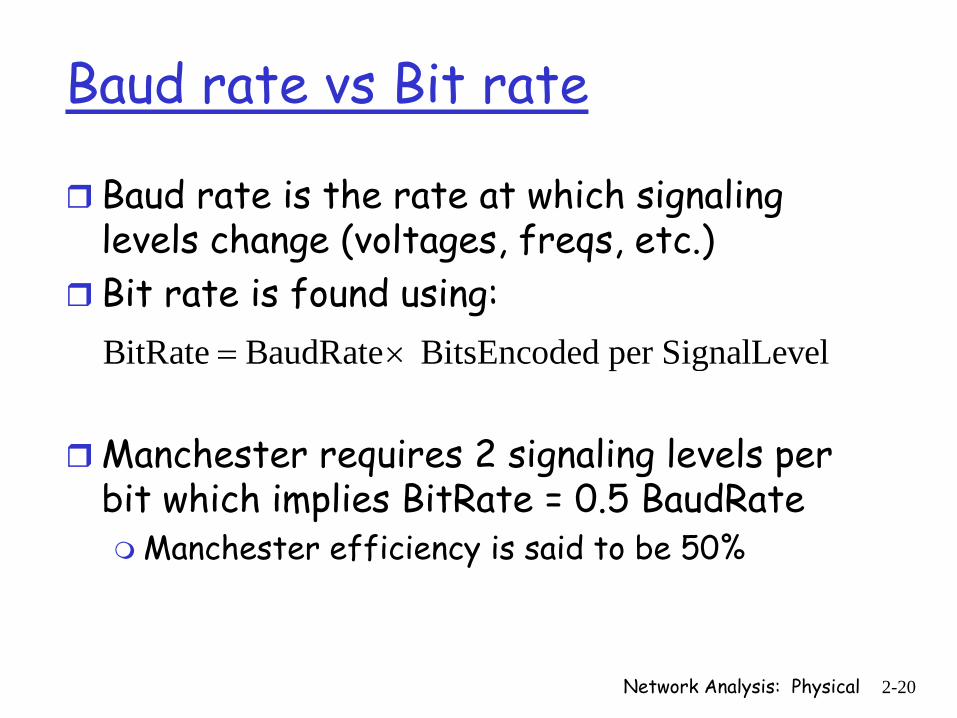
Baud rate vs Bit rate
Baud rate is the rate at which signaling levels change (voltages, freqs, etc.)Bit rate is found using:
Manchester requires 2 signaling levels per bit which implies BitRate = 0.5 BaudRate
Manchester efficiency is said to be 50%
BitRate BaudRate BitsEncoded per SignalLevel= ×
Network Analysis: Physical 2-21
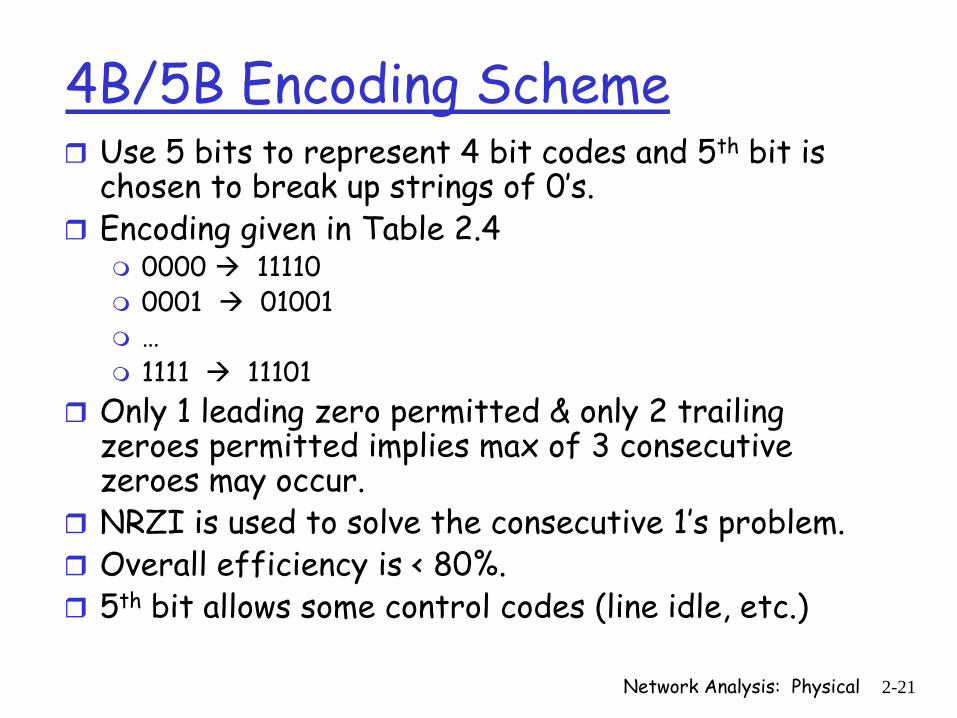
4B/5B Encoding SchemeUse 5 bits to represent 4 bit codes and 5th bit is chosen to break up strings of 0’s.Encoding given in Table 2.4
0000 111100001 01001…1111 11101
Only 1 leading zero permitted & only 2 trailing zeroes permitted implies max of 3 consecutive zeroes may occur.NRZI is used to solve the consecutive 1’s problem.Overall efficiency is < 80%.5th bit allows some control codes (line idle, etc.)

Network Analysis: Physical 2-22
Wireless Transmission
• The Electromagnetic Spectrum• Radio Transmission• Microwave Transmission• Infrared and Millimeter Waves• Lightwave Transmission
Network Analysis: Physical 2-23
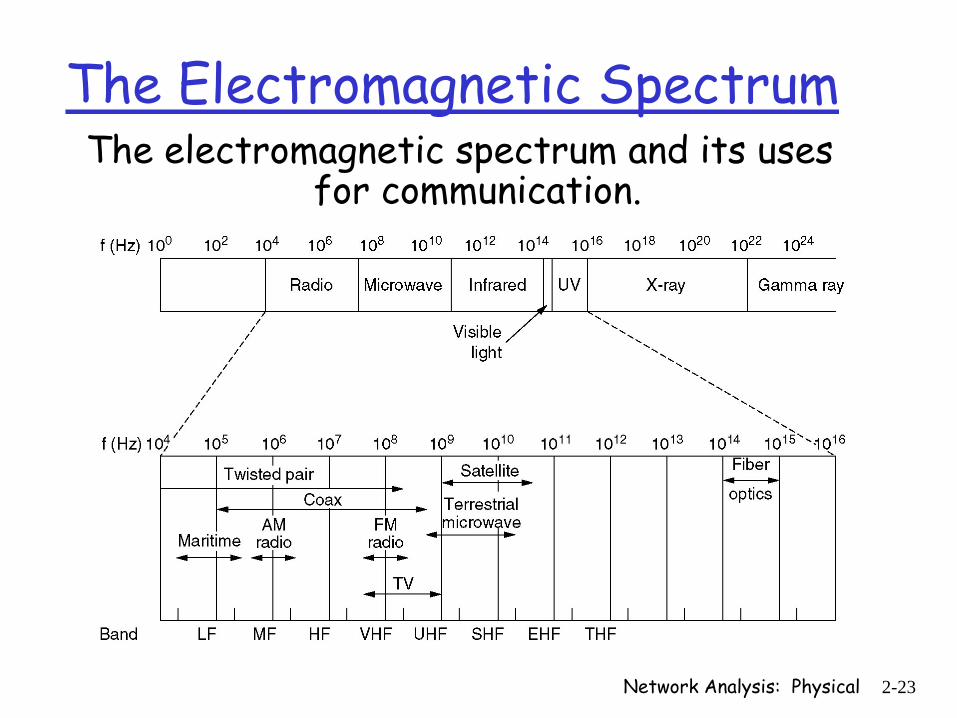
The Electromagnetic SpectrumThe electromagnetic spectrum and its uses
for communication.

Network Analysis: Physical 2-24
Radio Transmission
(a) In the VLF, LF, and MF bands, radio waves follow the curvature of the earth.
(b) In the HF band, they bounce off the ionosphere.
Network Analysis: Physical 2-25
Communication Satellites
• Geostationary Satellites• Medium-Earth Orbit Satellites• Low-Earth Orbit Satellites• Satellites versus Fiber
Network Analysis: Physical 2-26
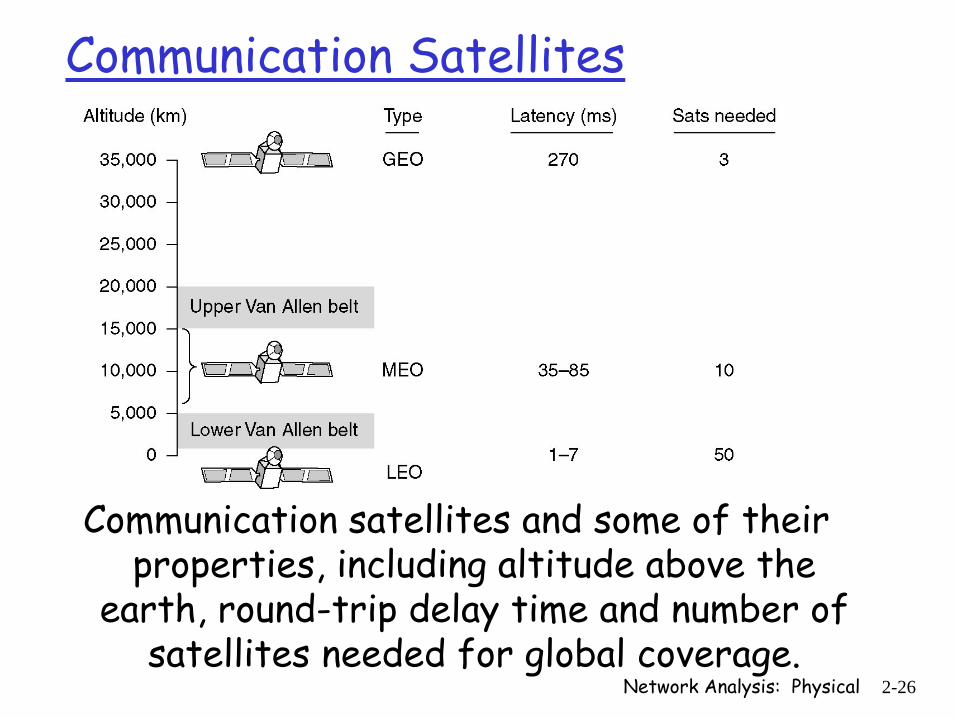
Communication Satellites
Communication satellites and some of their properties, including altitude above the
earth, round-trip delay time and number of satellites needed for global coverage.

Network Analysis: Physical 2-27
Communication Satellites (2)
The principal satellite bands.

Network Analysis: Physical 2-28
Public Switched Telephone System
• Structure of the Telephone System• The Politics of Telephones• The Local Loop: Modems, ADSL and
Wireless• Trunks and Multiplexing• Switching
Network Analysis: Physical 2-29
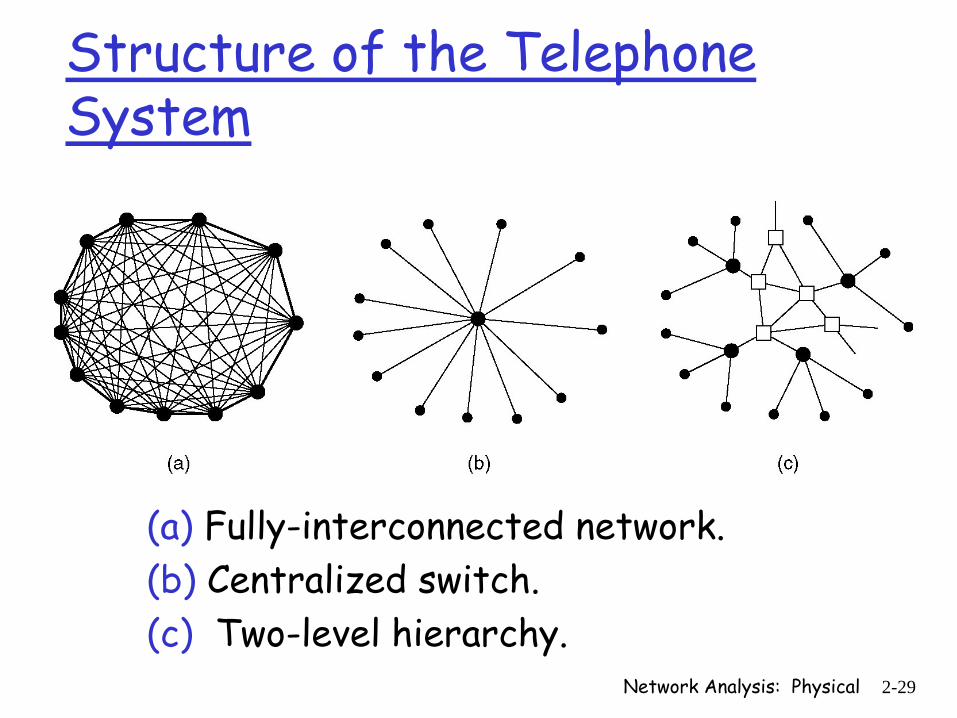
Structure of the Telephone System
(a) Fully-interconnected network.(b) Centralized switch.(c) Two-level hierarchy.

Network Analysis: Physical 2-30
Structure of the Telephone System (2)
A typical circuit route for a medium-distance call.

Network Analysis: Physical 2-31
Major Components of the Telephone System
• Local loopsAnalog twisted pairs going to houses and businesses
• TrunksDigital fiber optics connecting the switching offices
• Switching officesWhere calls are moved from one trunk to another
Network Analysis: Physical 2-32
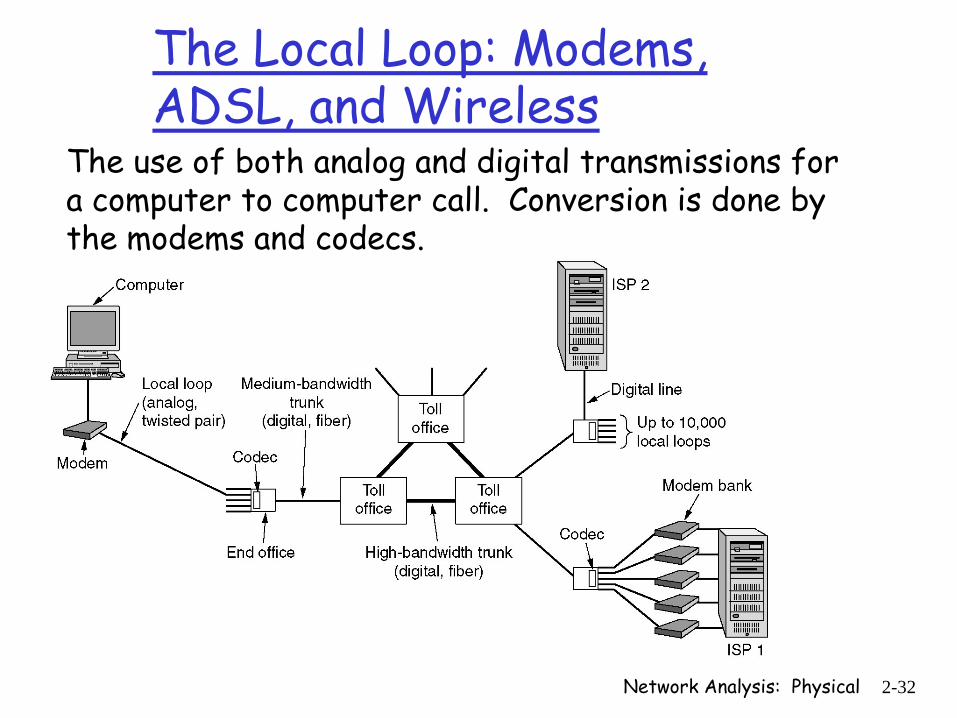
The Local Loop: Modems, ADSL, and Wireless
The use of both analog and digital transmissions for a computer to computer call. Conversion is done by the modems and codecs.
Network Analysis: Physical 2-33
Modems
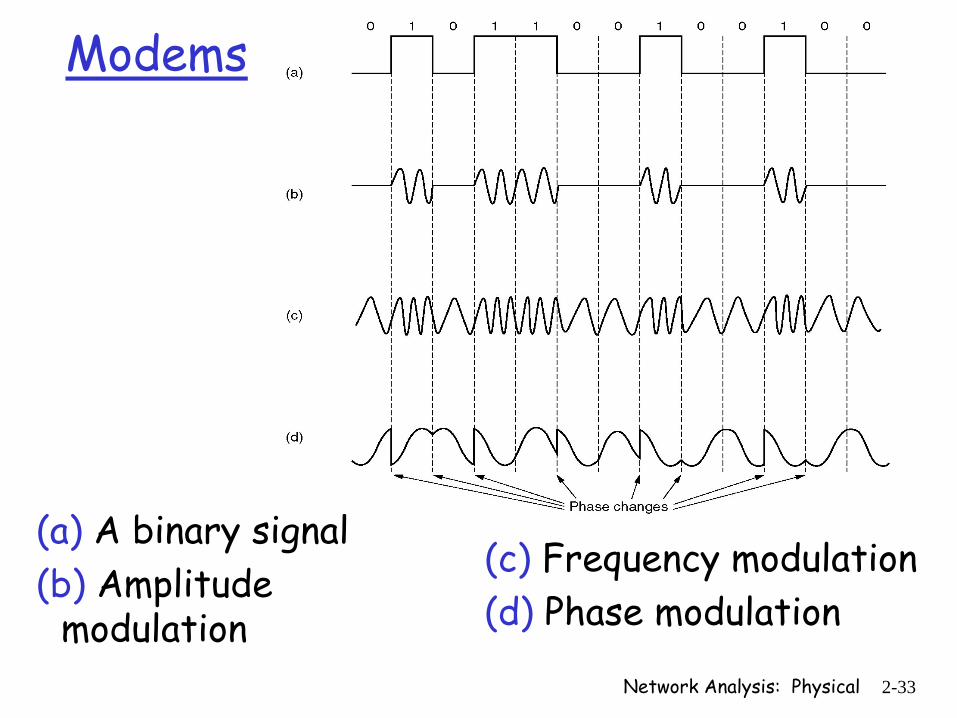
(a) A binary signal(b) Amplitude
modulation
(c) Frequency modulation(d) Phase modulation
Network Analysis: Physical 2-34
Modems (2)
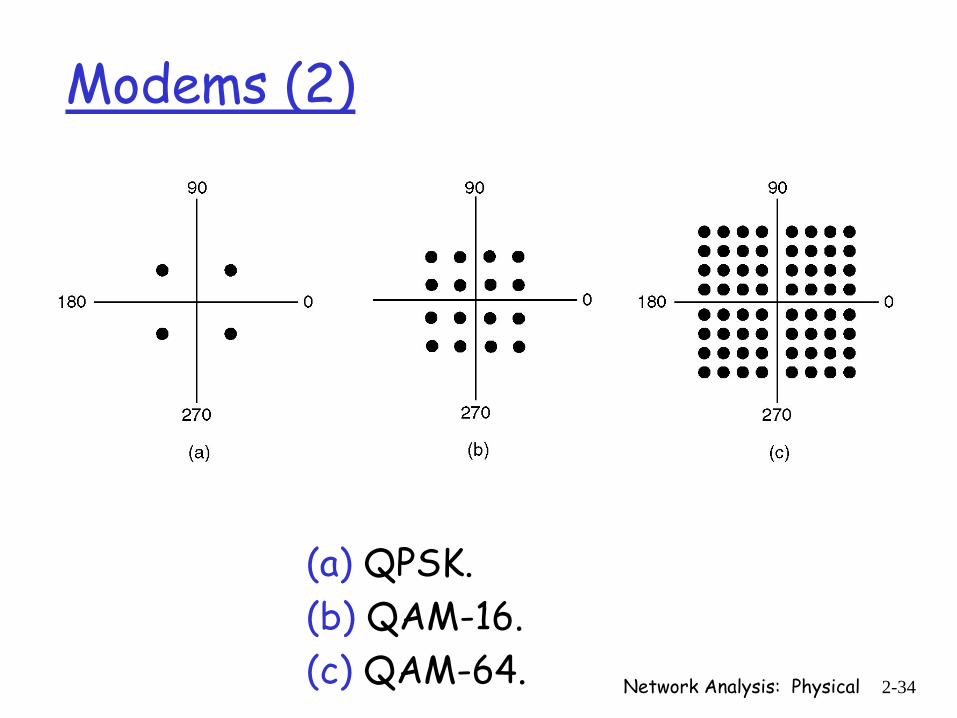
(a) QPSK.(b) QAM-16.(c) QAM-64.

Network Analysis: Physical 2-35
Time Division Multiplexing
The T1 carrier (1.544 Mbps).
Network Analysis: Physical 2-36
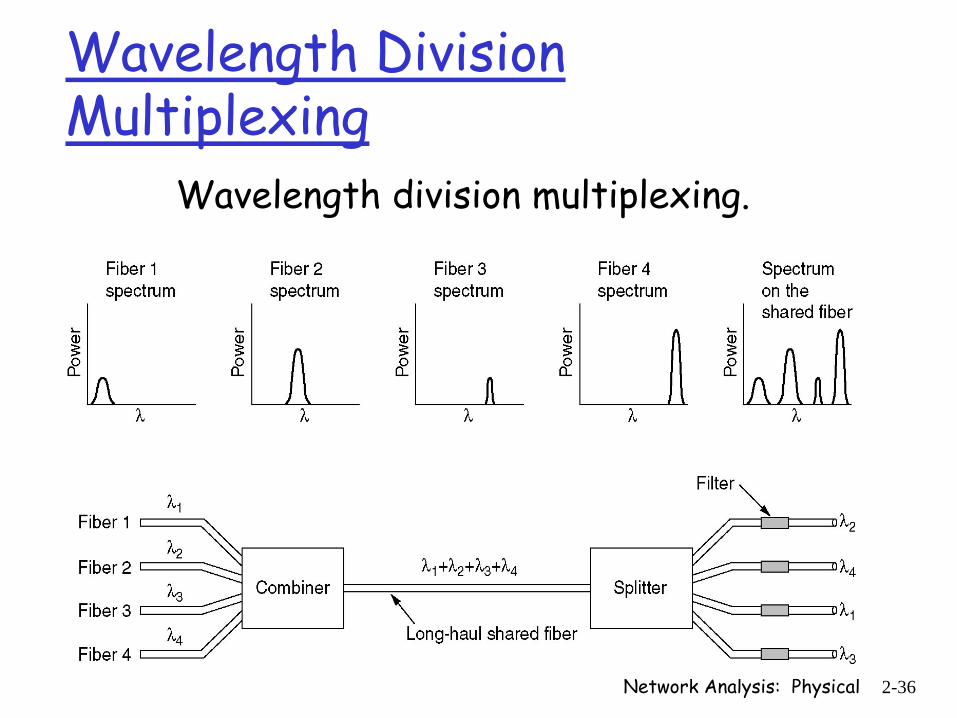
Wavelength Division Multiplexing
Wavelength division multiplexing.

Network Analysis: Physical 2-37
Time Division Multiplexing (5)
SONET and SDH multiplex rates.
Network Analysis: Physical 2-38
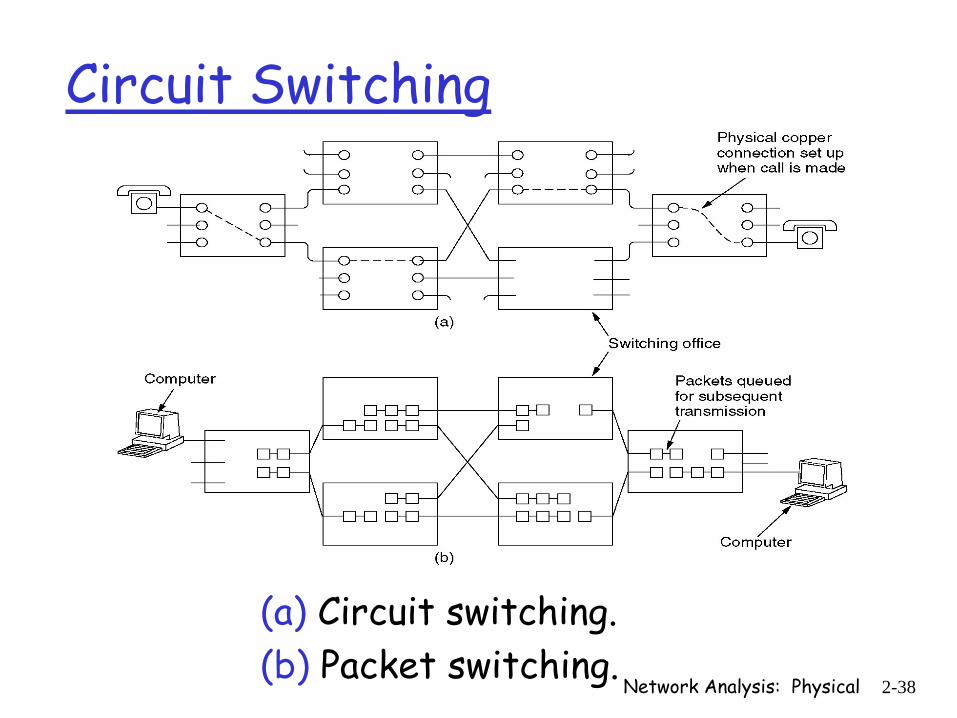
Circuit Switching
(a) Circuit switching.(b) Packet switching.

Network Analysis: Physical 2-39
Packet Switching
A comparison of circuit switched and packet-switched networks.
Network Analysis: Physical 2-40
The Mobile Telephone System• First-Generation Mobile Phones:
Analog Voice
• Second-Generation Mobile Phones: Digital Voice
• Third-Generation Mobile Phones:Digital Voice and Data

Network Analysis: Physical 2-41
Third-Generation Mobile Phones:Digital Voice and Data
Basic services an IMT-2000 network should provide
• High-quality voice transmission• Messaging (replace e-mail, fax, SMS, chat,
etc.)• Multimedia (music, videos, films, TV, etc.)• Internet access (web surfing,
w/multimedia.)
Network Analysis: Physical 2-42
Cable Television
• Community Antenna Television• Internet over Cable• Spectrum Allocation• Cable Modems• ADSL versus Cable
Network Analysis: Physical 2-43
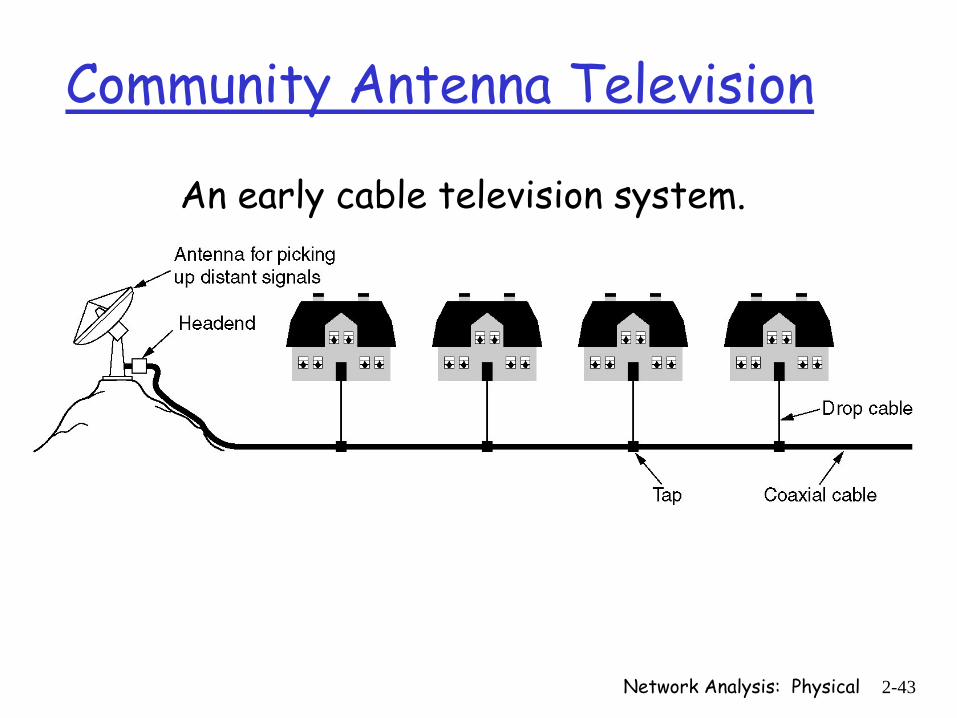
Community Antenna Television
An early cable television system.

Network Analysis: Physical 2-44
Internet over CableCable television