physical and mechanical characteristics for cotton …
TRANSCRIPT

International Journal of Application or Innovation in Engineering & Management (IJAIEM) Web Site: www.ijaiem.org Email: [email protected]
Volume 4, Issue 7, July 2015 ISSN 2319 - 4847
Volume 4, Issue 7, July 2015 Page 156
ABSTRACT This study aimed to study some physical and mechanical properties of the two major components cotton and pigeon pie stalks. These properties are necessary to apply normal design procedures such as pneumatic conveying, fluidization, drying, and combustion. The results obtained from determining the mechanical properties of average tensile and compressive strength for cotton stalks at different moisture content (9.58, 14.22 and 16.00%) was (0.34, 0.35 and 0.23MPa) and (7.24, 5.58 and 5.40 MPa) respectively. The results obtained from determining the mechanical properties of average tensile and compressive strength for pigeon stalks (pie) at different moisture content (10.10, 15.95 and 17.24%) was (0.54, 0.69 and 0.39MPa) and (8.95, 6.61 and 4.21MPa) respectively. Other than tensile and compressive strength the various test such as shear strength, impact test, torsion test and bending moment are performed on the cotton and pigeon stalk. The modulus of elasticity and toughness were evaluated as a function of moisture content. As the moisture content of the stalk regions increased the modulus of elasticity and toughness decreased indicating a reduction in the brittleness of the stalk regions. Useful conclusions may be the analysis of the stalk phenomenon refers to the correlation of the main mechanical properties of these residues. All the tests are performed by taking the average diameter of three portion of stalk i.e. Top, middle and bottom portion of the plant Keywords: Wood Analysis, Cotton stalks, pigeon stalks, physical properties, Average diameter of stalk, Mechanical characteristics and moisture content.
I. INTRODUCTION India is the leading manufacturer of paper and having large area covered by the forest trees from which the wood is supplied to the paper manufacturing industries. The types of wood from which paper is produce includes soft wood like - spruce & pine, hard wood like - short fiber, grasses - several types of long grasses like bamboo, sabai grass, sarkanda etc, the cotton and pigeon plants also used as raw material in paper manufacturing units because it gives more strength in paper or paper board, In India there is no any concept of producing the chips from the wood before supplying to the industry. The concept behind the study is to do the research for designing the human powered operated wood chipper machine that can do the chips of cotton and pigeon stalk and as we know the physical and mechanical properties such as tensile and compressive strength, shear strength, impact test, torsion test and bending moment of these stalk then it is easier to design the various machine components based on the result obtained. India is the agricultural based country where the production of cotton and pigeon takes places in maximum numbers. Near about 70 % of farmers in the Maharashtra region is taking this production every year. After extracting the cotton and red gram from the cotton and pigeon crops the farmer will store only 20% of the total crops for food cooking purpose and leftover is count to be as waste. Leftover dry crops of cotton and pigeon are to be produced in the form of chip by human powered wood chipper machine and can be supply to the paper manufacturing industries. Cutting and conditioning of cotton stalks & pigeon stalks, as only in recent years has cotton stalks, pigeon stalks production for industrial purposes been permitted in India and some Asian countries. The crop residues stalks and fiber have great potential for many products such as wood, paper, fuel resource, animal forage, compost and building materials. These stalks are a tall plant and its stem has a large diameter. A stalk has high percentage of lignin and consists of a woody core and an outer fibrous tissue. These characteristics may make cutting and conditioning cotton and pigeon more energy intensive than any other crops. Important mechanical properties of the agricultural material from the cutting standpoint are strength in tension, shear and bending, density and friction. These properties are influenced by species, variety and age of the plant, moisture content and the cellular structure. The values of these factors are the mechanical properties and observed a wide range
PHYSICAL AND MECHANICAL CHARACTERISTICS FOR COTTON
AND PIGEON PIE AS AGRICULTURE RESIDUES
1Vivek M Sonde, Dr. P. N. Belkhode2, Dr. C. N. Sakhale3
1, Research Scholar and Assistant professor in Priyadarshini College of Engineering, Nagpur
2, Assistant professor in Laxminarayan Institute of Technology, Nagpur
3, Associate professor in Priyadarshini College of Engineering, Nagpur

International Journal of Application or Innovation in Engineering & Management (IJAIEM) Web Site: www.ijaiem.org Email: [email protected]
Volume 4, Issue 7, July 2015 ISSN 2319 - 4847
Volume 4, Issue 7, July 2015 Page 157
of maximum shear strength for cotton stalk is from 6.24 to 24.94 MPA because of its marked dependence on moisture content with a negative linear correlation between shear strength and moisture content. However, show little dependence of shear strength on moisture content, based on dry matter cross-sectional area of the stem. The cross-sectional area and moisture content of the crop had significant influence on cutting energy and maximum cutting force. The shearing energy and maximum shearing force were found to be directly proportional to the cross-sectional area and inversely proportional to the moisture content of the stalk. Maximum shear energy in direct shear tests was observed to decrease with the rate of loading. Average maximum shear strength decreased from 24.94 to 6.24 MPA when the rate of loading was increased from 0.9 to 3.63 KN. Studies of cutting energy requirements have been conducted on soya bean stalks mesquita & Hanna, (1995), cotton stalks El Hag et al., (1971), maize stalks Prasad & Gupta, (1975), and alfalfa stems Prince et al., (1969) and pyrethrum flowers Khazaei et al., (2002). These studies showed that cutting energy is related to the stem mechanical properties (e.g. maximum cutting force and stem shear strength), and physical properties (e.g. stem diameter, dry matter density and moisture content). Types of cutting knife and blade edge also affect the cutting energy requirement. A serrated blade edge gives a higher cutting force and requires more cutting energy than a smooth edge Persson, (1987), also reviewed several studies on the cutting speed and concluded that cutting power is only slightly affected by cutting speed, although an increase in cutting speed will often increase the power losses caused by material acceleration. Information on plant properties and the power or energy requirement of equipment has been very valuable for selecting design and operational parameters of the equipment Persson, (1987). Such information is needed for the design of wood chipper machine, weeding, shredding and lawn mowing and conditioners, assuring appropriate machine functions and an efficient use of energy. The specific objectives were to examine the physical and mechanical properties of cotton and pigeon stalk. Considering the above points, there is a need for information on the variation in the physico-mechanical properties of cotton and pigeon stalks to improve chopping conditions. This study was focused on determining the shear, compression, bending test and the tensile and compressive strength of cotton and pigeon stalks according to various stalk regions at different moisture contents.
II. PHYSICAL CHARACTERISTICS OF COTTON AND PIGEON PIE STALKS The results obtained from measuring several samples (100 samples) of each residue such as cotton & pigeon stalks and showed that the maximum value of stem length cotton & pigeon stalks and were 182 and 250 cm respectively, meanwhile the minimum value of stem length were 98 and 110 cm for the same residues in sequence. The maximum values for cotton and pigeon stem diameter were 32 and 40 mm respectively meanwhile the minimum values of stem diameter were 7.3 and 8.2 mm for the same residues in sequence. The obtained results of average values are tabulated as shown in table 1.
Table 1. Average values of some physical properties of tested farm residues
Residue Property
Cotton stalks Pigeon pie
Range Average Range Average
Stem length, cm 182 - 98 147.69 250 -
110 117.5
Stem diameter,
mm 32 – 6 18 40 – 5.8 24.11
Mass of one stalk,
(g) 200 - 35 106.72 300 -
58.25 179.125
Number of branches 27 - 6 15.95 24-7 15.5
For the experimentation purpose the Sample Number, Length and diameter and average diameter of each sample was taken by using a digital vernier caliper is given to the cotton and pigeon stalk
III. THEORETICAL CONSIDERATIONS 1. Determination of mechanical and physical properties The properties which influence the cutting process are the elastic behavior of the stem in shear, compression and bending Chattopadhyay & Pandey, (1999).

International Journal of Application or Innovation in Engineering & Management (IJAIEM) Web Site: www.ijaiem.org Email: [email protected]
Volume 4, Issue 7, July 2015 ISSN 2319 - 4847
Volume 4, Issue 7, July 2015 Page 158
1.1 Shear The indices which determine the shearing behavior of the plant material are maximum shear strength σs and specific cutting energy ESS. The maximum shear strength is expressed by: σs = Fmax / A Where, σs are the maximum shear strength in (MPa), Fmax is the maximum shear force in (N) and A is the cross-sectional area of stalk at the plane of shear in (mm2). 1.2 Compression The indices which determine the compression behavior of plant material are the modulus of elasticity in compression and the compressive energy. The modulus of elasticity in compression, which is given by: σc = [(Fc / A) / (ΔL / d)] Where, σc is the modulus of elasticity in compression in (N/mm2). Fc is the compressive force in (N), ΔL is the transverse deformation due to compressive force in (mm), and d is the diameter of the stalk at the point of compression in (mm). 1.3 Bending The indices which determine the bending behavior of plant material are beam failure stress, modulus of elasticity in bending and bending energy. The beam failure stress σb in (MPa) can be expressed by the following equation: σb = My / I and M = Fb x L Where, M is the maximum bending moment at which the stem fails in (Nmm), y is the distance of outermost fibre from the neutral axis in (mm), I is the second moment of area of the stem cross-section in (mm4), Fb is the maximum bending force at which the stem fails in (N), and L is the length of lever arm of the bending force in (mm).
IV. MATERIAL AND METHODS 1. Experimental procedure Three common residues with different moisture content were used: cotton stalks (9.58, 14.22 and 16.00%), and pigeon pie (10.10, 15.95 and 17.24%). The electrical drying oven was used to dry the samples of residues to calculate the moisture content. The universal testing machine was used to measure some mechanical properties (tensile strength and compressive strength at vertical plane) for cotton stalk, and pigeon pie. The machine as shown in Fig. (1).
Fig.1 Universal Testing Machine
2. Preparation of Sample For Test a) Mechanical characteristics
• An ascending order is given to the samples along each stalk length, starting from stalk bottom to its top. • This sample number is given to each sample according to the locations along the stalk length. • Samples were taken from three different positions: bottom, middle and top portion of each stalk. • 30 cm sample were cut from each samples to determine Shear strength & tensile strength. • 2.5 cm sample were taken for determine compressive strength. • 43 cm sample were taken for determining bending force.
b) Physical characteristics • The dimensional description of each stalk in all residues implied the measure of samples number, length and
diameter. The average diameter of each sample was determined by using a digital vernier caliper. The various test conducted on cotton stalk and pigeon pie are:
1. Shear strength. 2. Compressive strength. 3. Tensile strength. 4. Bending movement. 5. Impact test 6. Torsion test 7. Moisture content (M.C)

International Journal of Application or Innovation in Engineering & Management (IJAIEM) Web Site: www.ijaiem.org Email: [email protected]
Volume 4, Issue 7, July 2015 ISSN 2319 - 4847
Volume 4, Issue 7, July 2015 Page 159
1. Test for Shear strength. The indices which determine the shearing behavior of the plant material is maximum stress σs are expressed by the equation σs = Fmax / A. Chattopdhyay & Pandy (1999). The fabricated fixture was fixed rigidly on the base plate form of the test machine under the crosshead with the help of two bolts. A chisel measuring heads is placed perpendicular to the length of stalks specimen as shown in Fig below. Fig. 2 shows the stalk under double shear and fig. 3 shows the stalk under single shear. The stalk sample was held on the fixture with the help of two U-type clamps at both ends of the specimen. During the down ward movement of the crosshead, the chisel cut the specimen by shear and passed through the slots provided in the fixture below the specimen. The force required for shearing the stalk was recorded. The maximum shear strength was calculated using equation σs = Fmax / A. The shear test was conducted for the length of the various stalk regions at three positions (bottom, middle and top regions).
Fig. 2 Double & Single Shearing Test
After conducting the shear test as per the procedure mention above on the cotton stalk and pigeon pie for double and single shear, the result obtained as mention in table below.
Table 2. Shear Strength under Double Shear of Cotton Stalk
Position of sample
Average Diameter
(mm)
Area (mm2)
Peak load (KN)
Peak load (N)
Shear strength (N/mm2)
Bottom Portion
31.25 766.602 4.7 4700 28.52 27.22 581.629 4.2 4200 26.18 25.27 501.280 3.7 3700 22.70
Middle Portion
14.99 176.390 2.1 2100 16.98 12.45 121.677 1.9 1900 16.22 11.77 108.748 1.6 1600 11.85
Top Portion
8.40 55.390 1.2 1200 8.87 7.56 44.866 1.1 1100 7.94 6.11 29.306 1.05 1050 5.59
Table 3. Shear Strength under Single Shear of Cotton Stalk
Position of sample
Average Diameter
(mm)
Area (mm2)
Peak load (KN)
Peak load (N)
Shear strength (N/mm2)
Bottom Portion
30.75 742.267 5.1 5100 29.77 27.22 581.629 4.8 4800 28.11 26.82 564.660 4.2 4200 23.85
Middle Portion
14.79 171.714 3.1 3100 17.54 11.52 104.178 2.2 2200 16.98 11.20 98.470 1.3 1300 12.85
Top Portion 8.10 51.504 1.2 1200 9.00 7.56 44.866 1.2 1200 8.74 5.98 28.072 1.1 1100 7.77
Table 4. Shear Strength under Double Shear of Pigeon Pie

International Journal of Application or Innovation in Engineering & Management (IJAIEM) Web Site: www.ijaiem.org Email: [email protected]
Volume 4, Issue 7, July 2015 ISSN 2319 - 4847
Volume 4, Issue 7, July 2015 Page 160
Position of sample
Average Diameter
(mm)
Area (mm2)
Peak load (KN)
Peak load (N)
Shear strength (N/mm2)
Bottom Portion
30.15 713.5827 4.7 4700 29.65 28.22 625.1492 4.4 4400 26.88 25.12 495.3463 3.9 3900 22.71
Middle Portion
15.23 182.083 2.3 2300 17.26 12.1 114.9319 1.9 1900 16.53 11.2 98.4704 1.7 1700 12.63
Top Portion 8.54 57.25131 1.3 1300 7.87 7.22 40.92079 1.1 1100 7.04 6.78 36.08519 1.07 1070 6.59
Table 5. Shear Strength under Single Shear of Pigeon Pie
Position of sample
Average Diameter
(mm)
Area (mm2)
Peak load (KN)
Peak load (N)
Shear strength (N/mm2)
Bottom Portion
27.22 581.6288 3.63 5900 24.94 27.02 573.1131 3.6 5800 23.46 26.92 568.8788 3.59 5800 19.91
Middle Portion
14.23 158.9569 1.9 3100 12.89 13.89 151.4517 1.85 3020 12.22 13.15 135.7442 1.75 2860 11.95
Top Portion
8.54 57.25131 1.14 1860 6.31 7.22 40.92079 0.96 1570 6.28 6.78 36.08519 0.9 1470 6.24
2. Test for Compression strength. The indices which determine the compression behavior of plant material are the modulus of elasticity in compression. The modulus of elasticity in compression was calculated by the following equation σc = [(Fc / A) / (ΔL / d)] Chattopdhyay & Pandy (1999). The specimen was placed on the base plate form perpendicularly. The compressive force on the stalk sample was applied by a flat heads as shown in Fig. 3. During the test, the cross-head was moved down at 25 cm/s speed deforming the sample until failure was achieved. The modulus of elasticity in compression was calculated using above equation. The compression test was conducted for the length of the stalk at three position bottom, middle and top of the stalks.
Fig. 3 Compression test
After conducting the Compression test as per the procedure mention above on the cotton stalk and pigeon pie, the result obtained as mention in table below.
Table 6. Compression Strength of Cotton Stalk
Position of sampl
e
Average
Diameter of sampl
e
Sample
Length
(mm)
Area (mm2)
Compressio
n force
Fc (KN)
Compression force
Fc (N)
Change in length
of sample (mm)
Compressive
strength (N/mm2)
Botto 29.63 25 689.18 2.88 2800 20.12 7.54

International Journal of Application or Innovation in Engineering & Management (IJAIEM) Web Site: www.ijaiem.org Email: [email protected]
Volume 4, Issue 7, July 2015 ISSN 2319 - 4847
Volume 4, Issue 7, July 2015 Page 161
m Portio
n
28.12 25 620.73 2.51 2510 19.23 7.61
26.87 25 566.77 2.12 2120 19.33 6.55
Middle
Portion
15.91 25 198.71 1.5 1500 19.41 7.12 15.61 25 191.28 1.49 1490 18.75 5.55
11.85 25 110.23 1.29 1290 15.65 5.41
Top Portio
n
8.25 25 53.43 0.75 750 14.78 5.23 7.5 25 44.16 0.71 710 14.52 5.31 6.7 25 35.24 0.62 620 13.88 5.27
Table 7. Compression Strength of Pigeon Pie
Position of
sample
Average
Diameter of
sample
Sample Length
(mm)
Area (mm2)
Compression force
Fc (KN)
Compression force
Fc (N)
Change in
length of
sample (mm)
Compressive
strength
(N/mm2
)
Bottom Portion
28.02 25 616.32 3.05 3050 20.15 7.85 27.6 25 597.98 3 3000 20.23 7.69 26.8 25 563.82 2.92 2920 20.95 6.75
Middle Portion
15.6 25 191.04 1.7 1700 19.53 7.24 15.51 25 188.84 1.69 1690 19.22 5.67 12.8 25 128.61 1.39 1390 15 5.58
Top Portion
8.1 25 51.50 0.8 800 14.64 5.20 7.1 25 39.57 0.77 770 14.1 5.37 6.2 25 30.18 0.67 670 13.77 5.40
3. Test for Tensile strength. Tensile strength tests were conducted by placing the samples between two parallel clamps in each sides of sample. The sample axis is placed perpendicular to the clamps axis. There were placed between the clamps and connected by two arms at no loading. Force was applied to the sample by the tensile and force transducer to the moveable cross-head. During the test, the cross-head was moved up at 25 cm/s speed deforming the sample, until failure was achieved. A digital computer unite showed the variations in the force acting on the sample and the force deformation at which sample tissue failed was recorded as shown in Fig. 4. The mechanical properties of these samples (cotton, and pigeon stalks) such as modulus of elasticity, tensile strength and toughness have been determined
Fig. 4 Tensile Test

International Journal of Application or Innovation in Engineering & Management (IJAIEM) Web Site: www.ijaiem.org Email: [email protected]
Volume 4, Issue 7, July 2015 ISSN 2319 - 4847
Volume 4, Issue 7, July 2015 Page 162
After conducting the tensile test as per the procedure mention above on the cotton stalk and pigeon pie, the result obtained as mention in table below.
Table 8. Tensile Strength of Cotton Stalk Position
of sample
Average Diamete
r of sample
Length (mm)
Area (mm2)
Tensile force
Fc (KN)
Tensile force Fc (N)
Change in
length of
sample (mm)
Tensile strength (N/mm2)
Bottom Portion
29.56 300 685.93 2.00 2000 303.1 0.32 28 300 615.44 2.74 2740 304.25 0.32
27.52 300 594.52 2.02 2020 306.22 0.31
Middle Portion
15.98 300 200.46 1.2 1200 307.77 0.24 15.66 300 192.51 1.25 1250 309.20 0.24 12.75 300 127.61 0.74 740 310.84 0.23
Top Portion
8.12 300 51.76 0.71 710 310.89 0.22 7.41 300 43.10 0.60 600 311.12 0.21 6.54 300 33.58 0.54 540 312.29 0.20
Table 9. Tensile Strength of Pigeon Pie
Position of
sample
Average Diamete
r of sample
Length (mm)
Area (mm2)
Tensile force
Fc (KN)
Tensile force Fc (N)
Change in
length of
sample (mm)
Tensile strength (N/mm2)
Bottom Portion
29.11 300 665.20 2.08 2080 304.5 0.35 28.22 300 625.15 3 3000 305.1 0.35 27.57 300 596.68 2.92 2920 305.68 0.34
Middle Portion
15.4 300 186.17 1.7 1700 308.47 0.33 15 300 176.63 1.69 1690 308.9 0.33
12.57 300 124.03 0.9 900 309.98 0.31
Top Portion
7.65 300 45.94 0.8 800 309.99 0.31 7.1 300 39.57 0.77 770 310.1 0.27
6.09 300 29.11 0.67 670 311.29 0.23 4. Test for Bending Moment. The indices which determine the bending behaviors of plant material are beam failure stress. The maximum bending moment was calculated by equation σb = My / I and M = Fb x L Chattopdhyay & Pandy (1999). The bending property of the stalk was determined by simply supported teat as suggested by Persson, (1987). The sample axis is placed perpendicular to the plunger axis. Both end of the stalk specimen was fixed rigidly to the fixture with the help of a screw clamp with two inner semi-circular rims. The vertical force was applied by the chisel heads at the middle of the mounted specimen at a distance of 90 mm from the fixed point as shown in Fig. 5.

International Journal of Application or Innovation in Engineering & Management (IJAIEM) Web Site: www.ijaiem.org Email: [email protected]
Volume 4, Issue 7, July 2015 ISSN 2319 - 4847
Volume 4, Issue 7, July 2015 Page 163
Fig. 5 Bending Test
The test were done till the stalk fails under the application of load, so the performance gives the following test results. Table 10. Bending Test of Cotton Stalk
Position of sample Average
Diameter of sample
Compression force
Fc (N)
Bottom Portion 28.33 2020 27.88 1990 27.11 1940
Middle Portion 15.98 1140 15.1 1080 14.77 1050
Top Portion 12.57 900 7.62 540 7.12 500
Table 11. Bending Test of Pigeon Pie
Position of sample Average
Diameter of sample
Compression force
Fc (N)
Bottom Portion 28.33 2700 27.51 2600 27.19 2590
Middle Portion 15.14 1400 14.78 1400 12.77 1200
Top Portion 8.52 810 8.1 770
7.56 720

International Journal of Application or Innovation in Engineering & Management (IJAIEM) Web Site: www.ijaiem.org Email: [email protected]
Volume 4, Issue 7, July 2015 ISSN 2319 - 4847
Volume 4, Issue 7, July 2015 Page 164
5. Impact Test. The impact teat of sample is done for determining the energy required to shear the sample in transverse as well as along the axis. The impact test can be done in two types. i. Charpy impact test. Sample required for Charpy impact teat is of length 55 mm and it should be placed in horizontal against the load. Load is to be released from 1350 by using “V” notch for shearing as shown in the fig. 6 below.
Fig. 6 Impact Test
ii. Izod impact test Sample required for Izod impact teat is of length 80 mm and it should be placed vertical in the provided slot against the load. Load should be released from 900 by using “U” notch for shearing, the observation for Charpy and Izod Impact test are mention in the table below.
Table 12. Observations of Charpy Impact test
Pigeon Pie Cotton Stalk
Position of sample
Average Diameter of sample
Energy in Joule
Average Diameter of
sample
Energy in Joule
Bottom Portion
25.63 673 25 656.46 24.66 647 24.55 644.11 24.1 633 24.21 635.89
Middle Portion
14.88 390 15.12 396.29 14.1 370 14.22 373.15 14 367 13.67 358.35
Top Portion 7.9 207 7.4 193.90 7.5 197 7.2 189.12 7.1 186 6.54 171.33
Table 13. Observations of Izod Impact test
Pigeon Pie Cotton Stalk
Position of sample
Average Diameter of sample
Energy in Joule
Average Diameter of
sample
Energy in Joule
Bottom Portion
25.61 760 25.22 662.23 24.88 737 24.12 632.83 24.56 728 24.56 645.08
Middle 14.22 441 14.11 369.82

International Journal of Application or Innovation in Engineering & Management (IJAIEM) Web Site: www.ijaiem.org Email: [email protected]
Volume 4, Issue 7, July 2015 ISSN 2319 - 4847
Volume 4, Issue 7, July 2015 Page 165
Portion 14.1 418 14.02 367.90 13.88 411 13.28 348.13
Top Portion 8.51 252 7.1 186.04 8.41 249 7 183.87 7.1 210 6.33 165.83
6. Torsion Test. The torsion teat of sample is done for determining the torque required to shear the sample. Sample required for torsion teat is of length 350 mm and it should be clamp horizontal in the jaws provided as shown below in the fig. 7 and the test performance are tabulated below.
Fig. 7 Torsion Test
Table 14. Observations of Torsion test
Cotton Stalk Pigeon Pie
Position of sample
Average Diameter of sample
Torque in N.m
Average Diameter of
sample
Torque in N.m
Bottom Portion
26.1 108.75 26.87 127.14 25.1 104.5 26.11 123.52
24.58 102.4 25.12 118.86
Middle Portion
15.2 63.3 14.1 66.72 14.23 59.29 13.1 61.98 14.1 58.75 12.16 57.54
Top Portion 7.98 33.25 7.54 35.67 7.55 31.45 7.22 34.16 7.17 29.875 7.11 33.64
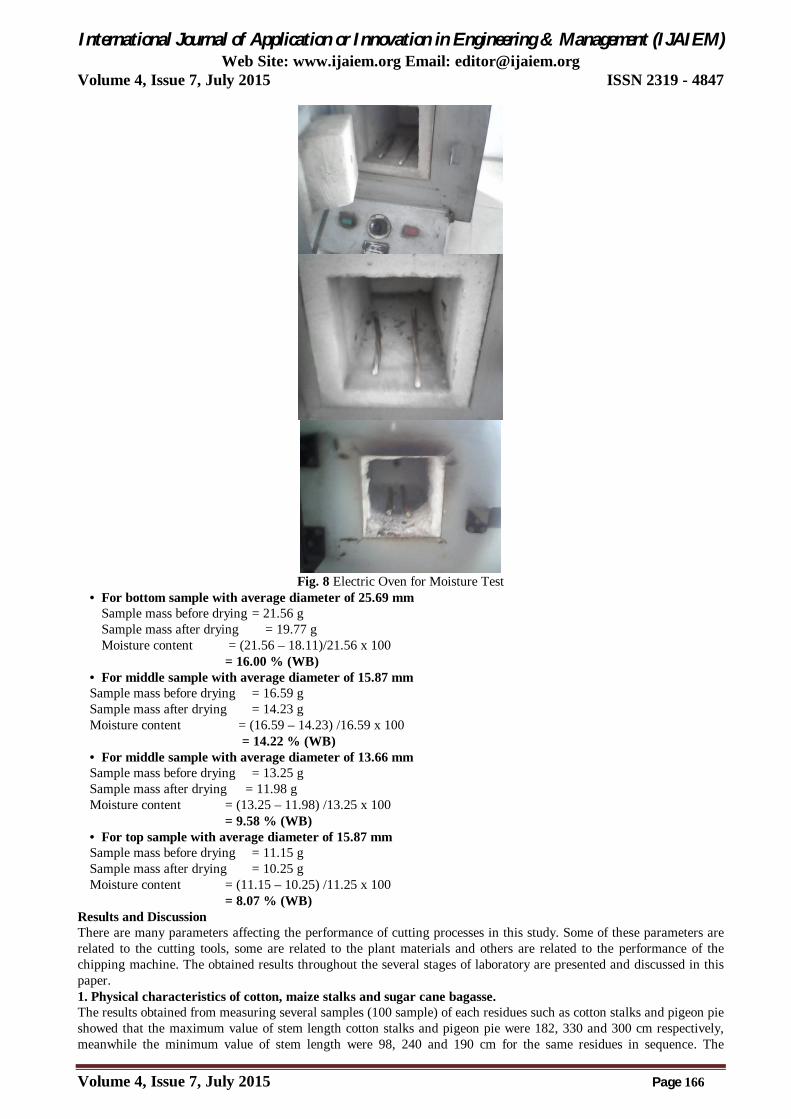
7. Test for Moisture Content Stalk samples were oven dried at 105° C for 24 h by using electrical oven as shown in the below fig 8. The samples were weighted before and after drying and the moisture content was determined by using the following equation: Moisture Content = (SB – SA) / SB x 100 Where: • SB = Sample mass before drying • SA = Sample mass after drying
International Journal of Application or Innovation in Engineering & Management (IJAIEM) Web Site: www.ijaiem.org Email: [email protected]
Volume 4, Issue 7, July 2015 ISSN 2319 - 4847
Volume 4, Issue 7, July 2015 Page 166
Fig. 8 Electric Oven for Moisture Test
• For bottom sample with average diameter of 25.69 mm Sample mass before drying = 21.56 g Sample mass after drying = 19.77 g Moisture content = (21.56 – 18.11)/21.56 x 100 = 16.00 % (WB) • For middle sample with average diameter of 15.87 mm Sample mass before drying = 16.59 g Sample mass after drying = 14.23 g Moisture content = (16.59 – 14.23) /16.59 x 100 = 14.22 % (WB) • For middle sample with average diameter of 13.66 mm Sample mass before drying = 13.25 g Sample mass after drying = 11.98 g Moisture content = (13.25 – 11.98) /13.25 x 100 = 9.58 % (WB) • For top sample with average diameter of 15.87 mm Sample mass before drying = 11.15 g Sample mass after drying = 10.25 g Moisture content = (11.15 – 10.25) /11.25 x 100 = 8.07 % (WB)
Results and Discussion There are many parameters affecting the performance of cutting processes in this study. Some of these parameters are related to the cutting tools, some are related to the plant materials and others are related to the performance of the chipping machine. The obtained results throughout the several stages of laboratory are presented and discussed in this paper. 1. Physical characteristics of cotton, maize stalks and sugar cane bagasse. The results obtained from measuring several samples (100 sample) of each residues such as cotton stalks and pigeon pie showed that the maximum value of stem length cotton stalks and pigeon pie were 182, 330 and 300 cm respectively, meanwhile the minimum value of stem length were 98, 240 and 190 cm for the same residues in sequence. The

International Journal of Application or Innovation in Engineering & Management (IJAIEM) Web Site: www.ijaiem.org Email: [email protected]
Volume 4, Issue 7, July 2015 ISSN 2319 - 4847
Volume 4, Issue 7, July 2015 Page 167
maximum values for cotton stalks and pigeon pie stem diameter were 32 and 40 mm respectively meanwhile the minimum values of stem diameter were 6 and 5.8 mm for the same residues in sequence. The obtained results of average values are tabulated in Table 15
Table 15. Average values of some physical properties of tested farm residues
Residue Property Cotton stalks Pigeon pie
Range
Average Range Avera
ge
Stem length, cm 182 - 98
147.69
250 -110 117.5
Stem diameter, mm
32 – 6 18 40 – 5.8 24.11
Mass of one stalk, (g)
200 - 35
106.72
300 - 58.25
179.125
Number of branches
27 - 6 15.95 24-7 15.5
The mechanical properties of the entire plant, such as stress-strain behavior, resistance to tensile, compressive strength, modulus of elasticity and toughness as guidelines of plant and design experts, mechanical properties of residues (cotton stalks and pigeon pie) may be defined as those properties that determine the behavior of material under applied loads. The entire above mention test done on both plant residue and the result obtain is mention below table 16 & 17
Table 16. Mechanical and Physical characteristic of Cotton Stalk
Shear strength
(Double)
(N/mm2)
Shear strength
(Single)
(N/mm2)
Compressive strength (N/
mm2
)
Tensile
strength (N/mm2)
Compression force Fc (N)
Energy in Joule
Torque in N.m
Moisture
content
Bottom
Portion
28.52 29.77 7.54 0.32 2020 656. 108.75 16.
00%
26.18 28.11 7.61 0.32 1990 644. 104.5
22.7 23.85 6.55 0.31 1940 635. 102.4
Middle
Portion
16.98 17.54 7.12 0.24 1140 396. 63.3 14.
22%
16.22 16.98 5.55 0.24 1080 373. 59.29
11.85 12.85 5.41 0.23 1050 358. 58.75
Top Portion
8.87 9 5.23 0.22 900 193. 33.25
9.58% 7.94 8.74 5.31 0.21 540 189. 31.
45
5.59 7.77 5.27 0.2 500 171. 29.875
Table 17. Mechanical and Physical characteristic of Pigeon pie
Shear
strength
Shear strength
(Singl
Compressive stre
Tensile
strength
Compression forc
Energy in
Joul
Torque in N.m
Moisture

International Journal of Application or Innovation in Engineering & Management (IJAIEM) Web Site: www.ijaiem.org Email: [email protected]
Volume 4, Issue 7, July 2015 ISSN 2319 - 4847
Volume 4, Issue 7, July 2015 Page 168
(Double)
(N/mm2)
e) (N/mm2)
ngth (N/
mm2
)
(N/mm2)
e Fc (N)
e content
Bottom
Portion
29.65 24.94 7.85 0.35 2700 760 127.14 18
.22 %
26.88 23.46 7.69 0.35 2600 737 123.52
22.71 19.91 6.75 0.34 2590 728 118.86
Middle
Portion
17.26 12.89 7.24 0.33 1400 441 66.72 15
.21 %
16.53 12.22 5.67 0.33 1400 418 61.98
12.63 11.95 5.58 0.31 1200 411 57.54
Top Portion
7.87 6.31 5.20 0.31 810 252 35.67 8.59 %
7.04 6.28 5.37 0.27 770 249 34.16 6.59 6.24 5.40 0.23 720 210 33.64
V. CONCLUSIONS The entire test of cotton stalk and pigeon pie is done in view of designing characteristic required for wood chipping machine, the cotton stalk and pigeon pie are the prime production of farmers in Vidarbha region. After taking out the production of cotton and pigeon pie these plants are to be scraped. The scraped material of all these plant residue can be properly utilized for the paper manufacturing units in the forms of chips (small sizes) through chipper machine, but in order to design the wood chipper for cotton stalk and pigeon pie the basic characteristic are required such as the maximum shearing strength, maximum compressive strength, tensile strength, total energy and torque required for shearing various diameter of cotton stalk and pigeon pie. These maximum values can gives the basic design platform for wood chipper machine such as power required, diameter of cutter shaft, maximum rpm of cutter shaft, number of chipping blades required etc. The design procedure of wood chipper based on all above obtained values is under process and that can be presented later. To do the various tests and get the result as various mechanical and physical behavior of cotton stalk and pigeon pie is itself an achievement. The result of various test at various region of stalk is mention below in table no 18.
Observations for
Cotton stalk Observations for
Pigeon pie
Bottom
Portion
Middle
Portion
Top Porti
on
Bottom
Portion
Middle
Portion
Top Portion
Double Shear
strength (N/mm2)
28.52 16.98 8.87 29.65 17.26 7.87
Single Shear
strength (N/mm2)
29.77 17.54 9 24.94 12.89 6.31
Compressive
strength (N/mm2)
7.54 7.12 5.23 7.85 7.24 5.20
Tensile strength (N/mm2)
0.32 0.24 0.22 0.35 0.33 0.31
Compression
force Fc 2020 1140 900 2700 1400 810
International Journal of Application or Innovation in Engineering & Management (IJAIEM) Web Site: www.ijaiem.org Email: [email protected]
Volume 4, Issue 7, July 2015 ISSN 2319 - 4847
Volume 4, Issue 7, July 2015 Page 169
(N) Energy in Joule
656.46
396.29 193.9 760 441 252
Torque in N.m
108.75 63.3 33.25 127.1
4 66.72 35.67
Moisture content
16.00 %
14.22 %
9.58 %
18.22 %
15.21 %
8.59 %
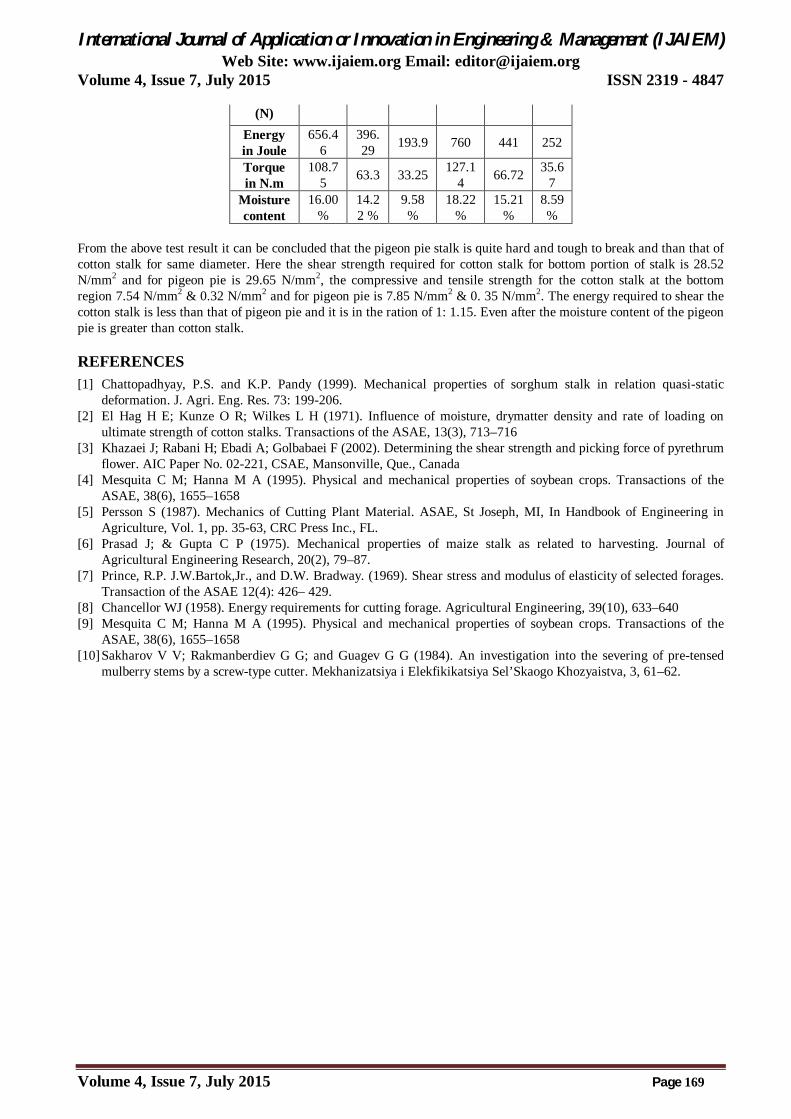
From the above test result it can be concluded that the pigeon pie stalk is quite hard and tough to break and than that of cotton stalk for same diameter. Here the shear strength required for cotton stalk for bottom portion of stalk is 28.52 N/mm2 and for pigeon pie is 29.65 N/mm2, the compressive and tensile strength for the cotton stalk at the bottom region 7.54 N/mm2 & 0.32 N/mm2 and for pigeon pie is 7.85 N/mm2 & 0. 35 N/mm2. The energy required to shear the cotton stalk is less than that of pigeon pie and it is in the ration of 1: 1.15. Even after the moisture content of the pigeon pie is greater than cotton stalk.
REFERENCES [1] Chattopadhyay, P.S. and K.P. Pandy (1999). Mechanical properties of sorghum stalk in relation quasi-static
deformation. J. Agri. Eng. Res. 73: 199-206. [2] El Hag H E; Kunze O R; Wilkes L H (1971). Influence of moisture, drymatter density and rate of loading on
ultimate strength of cotton stalks. Transactions of the ASAE, 13(3), 713–716 [3] Khazaei J; Rabani H; Ebadi A; Golbabaei F (2002). Determining the shear strength and picking force of pyrethrum
flower. AIC Paper No. 02-221, CSAE, Mansonville, Que., Canada [4] Mesquita C M; Hanna M A (1995). Physical and mechanical properties of soybean crops. Transactions of the
ASAE, 38(6), 1655–1658 [5] Persson S (1987). Mechanics of Cutting Plant Material. ASAE, St Joseph, MI, In Handbook of Engineering in
Agriculture, Vol. 1, pp. 35-63, CRC Press Inc., FL. [6] Prasad J; & Gupta C P (1975). Mechanical properties of maize stalk as related to harvesting. Journal of
Agricultural Engineering Research, 20(2), 79–87. [7] Prince, R.P. J.W.Bartok,Jr., and D.W. Bradway. (1969). Shear stress and modulus of elasticity of selected forages.
Transaction of the ASAE 12(4): 426– 429. [8] Chancellor WJ (1958). Energy requirements for cutting forage. Agricultural Engineering, 39(10), 633–640 [9] Mesquita C M; Hanna M A (1995). Physical and mechanical properties of soybean crops. Transactions of the
ASAE, 38(6), 1655–1658 [10] Sakharov V V; Rakmanberdiev G G; and Guagev G G (1984). An investigation into the severing of pre-tensed
mulberry stems by a screw-type cutter. Mekhanizatsiya i Elekfikikatsiya Sel’Skaogo Khozyaistva, 3, 61–62.