physical aging of epoxy polymers and their...
TRANSCRIPT

G.M.OdegardandA.BandyopadhyayJournalofPolymerSciencePartB:PolymerPhysics49(24)1695‐1716(2011) Page1
Physical Aging of Epoxy Polymers and Their Composites
G.M. Odegard and A. Bandyopadhyay Department of Mechanical Engineering - Engineering Mechanics Michigan Technological University 1400 Townsend Drive Houghton, MI 49931, USA ABSTRACT: Exposure to extended periods of sub-Tg temperatures causes physical changes in the molecular structure of epoxy resins and epoxy-based materials to occur. These physical aging mechanisms include the reduction in free volume and changes to the molecular configuration. As a result, mechanical, thermodynamic, and physical properties are affected in ways that can compromise the reliability of epoxy-based engineering components and structures. In this review, the physical changes in the molecular structure of epoxies are described, and the influence of these changes on the bulk-level response is detailed. Specifically, the influence of physical aging on the quasi-static mechanical properties, viscoelasticity, fracture toughness, thermal expansion coefficient, volume relaxation, enthalpy relaxation, endothermic peak temperature, fictive temperature, and moisture/solvent absorption capability are reviewed. Also discussed are relationships between relaxation functions, crosslink density, composite reinforcement, and epoxy/co-polymer blending and the physical aging response of epoxies. Finally, the concepts of thermal and mechanical rejuvenation are discussed. Key words: Ageing; amorphous; relaxation; mechanical properties; glassy polymers; density; differential scanning Calorimetry; epoxy resin; glass transition; free volume
INTRODUCTION Epoxy resins are thermosetting polymers that are widely used in adhesives, paints, coatings, medical implants, and electrical devices. Epoxy is also widely used as a matrix material in fiberous composites for the aerospace and wind turbine industries. Epoxies are ideal for these applications because of their high specific stiffness, high specific strength, electrical insulating properties, corrosion resistance, chemical compatibility with reinforcing fibers, and relative ease-of-manufacture. In many of these applications, epoxies and epoxy composites are often exposed to long-term sustained levels of elevated temperatures, moisture, electric fields, and other harsh environments.1-4 For extended periods of time, this exposure leads to the aging of the epoxy resin, that is, the possible degradation of its overall thermo-mechanical properties. Traditionally, physical aging has been classified as one of the broad categories of glassy material aging mechanisms.4-13 Physical aging is generally characterized as an increase in mass density (volumetric relaxation) and/or a decrease in molecular configurational energy (enthalpy relaxation) of amorphous or semi-crystalline materials when exposed to temperatures below the glass transition temperature for extended periods of time (annealing). Although glassy materials

G.M.OdegardandA.BandyopadhyayJournalofPolymerSciencePartB:PolymerPhysics49(24)1695‐1716(2011) Page2
can be simultaneously subjected to physical aging, chemical aging (chemical degradation of the molecular structure), and/or hydrothermal aging (degradation due to the presence of moisture and elevated temperatures); the characteristic mechanisms of physical aging are focused on physical changes to the molecular structure during annealing. Physical aging is usually associated with decreases in toughness, viscoelastic response, and permeability of polymers and other glassy materials. This is clearly a concern for the industries that use epoxy resins, as physical aging can compromise product durability, reliability, and safety. This paper reviews the current understanding of physical aging in epoxies and decades of experimental, computational, and analytical research that has been performed on epoxy resins and composites. There is a very large body of work that has been reported in the literature for physical aging of polymers in general. However, the focus of this review is on physical aging of epoxies; the physical aging of other polymers will be discussed only in the context of interpreting the observations made for epoxy polymers. The molecular response to physical aging will be discussed first, followed by descriptions of the influence of physical aging on bulk-level mechanical, thermodynamic, and physical properties. A review of the concept of mechanical rejuvenation follows. This review ends with brief discussions of the influence of physical aging in epoxy composites and analytical modeling approaches to physical aging.
MOLECULAR STRUCTURE AND PHYSICAL AGING There are two changes that occur to the molecular structure of an epoxy during the physical aging process: reduction in free volume and volume-independent configuration changes in the molecular network. These concepts are described in this section, along with descriptions of the molecular structure of typical epoxies, the process of thermal rejuvenation, and relaxation mechanisms. It is important to note that the relative levels of contribution of the two physical aging processes are not fully understood.
Molecular Structure Epoxy polymer networks are generally formed from the reaction of polyepoxides (monomer) to polyamines (hardener). For example, Figure 1 shows the typical crosslink structure formed with a 2:1 ratio of monomer to hardener. The resulting crosslinked system forms a rigid network, and thus, a mechanically durable material. Tables I and II list some of the typical monomers and hardeners, respectively, used in epoxy systems.
Table I - Typical monomers used in epoxy systems Chemical name Abbreviation
bisphenol-A epichlorohydrin BPA-ECH diglycidyl ether of bisphenol-A DGEBA diglycidyl ether of butanediol DGEB
diglycidyl orthophthalate DGOP tetraglycidy1-4,4’-diaminodiphenylmethane TGDDM

G.M.OdegardandA.BandyopadhyayJournalofPolymerSciencePartB:PolymerPhysics49(24)1695‐1716(2011) Page3
Figure 1 - Crosslinking process of a diepoxide/diamine system to for an epoxy polymer The overall molecular structure of a cured epoxy is amorphous. The monomer and hardener are usually mixed together in a liquid state, sometimes at elevated temperatures. Because the monomer/hardener solution is in a liquid state (not crystalline state) when the crosslinking process starts, the amorphous crosslinked structure is permanently secured by the presence of the newly-formed rigid crosslinks. Because of the rigidity and complexity of the crosslinked network, the structure exists in a glassy state (resembling a super-cooled liquid) that cannot realistically reconfigure itself into a purely crystalline state.
Table II - Typical hardeners used in epoxy systems Chemical name Abbreviation
1,3-biaminomethylcyclohexane 1,3-BAC aromatic polyamine APA
4,4’-diamino diphenyl sulfone DDS ethylenediamine EDA
methyl-tetrahydrophthalic anhydride MTHPA m-xylylendediamine m-XDA
amine-terminated poly(propylene oxide) PPO trimethylene glycol di-p-aminobenzoate TMAB
Free Volume
As a consequence of the locked-in amorphous molecular structure, there exists significant free volume in the molecular structure, that is, specific volume in excess of that found in the crystalline state at a given temperature (Figure 2). The presence of the free volume is a direct consequence of the non-equilibrated amorphous state, and has a significant impact on the density and the mechanical behavior of the polymer. It is important to note that many authors define the
Diamine
Epoxidegroup
Crosslinked epoxy polymer
CH2CH
O
O
CH2CH
NH2 R NH2
O
CH2 CH
O
CH2 CH
CH2 CH
R NN
OH
CH2 CH
OH
CH2
CH2
CH
CH
OH
OH

G.M.OdegardandA.BandyopadhyayJournalofPolymerSciencePartB:PolymerPhysics49(24)1695‐1716(2011) Page4
free volume as the volume that is not occupied by polymer molecules; however, this concept is complicated by the ambiguous definition of the volume of an atom in an amorphous structure.
Figure 2 - Simple 2D illustration of the free volume in the amorphous state. The free volume is the extra volume that is taken up in the amorphous state relative to the same mass of polymer
molecules in the crystalline state. As an epoxy polymer is cooled from an elevated temperature, the specific volume v will decrease. The relationship between the specific volume of a polymer sample and the temperature is linear at elevated temperatures, as shown by the amorphous equilibrium line in Figure 3. Along this linear portion of the curve, the molecular structure is in an energetic equilibrium for a given temperature. That is, no matter how long it is kept at a fixed elevated temperature, the specific volume will not change. This is known as the rubbery state of the epoxy. As an epoxy sample is cooled from the equilibrium state at elevated temperatures, a small temperature range is reached in which the relationship between specific volume and temperature deviates from its initial linear response (Figure 3). The point at which this occurs is known as the glass transition temperature (Tg). As the epoxy specimen continues to cool through the Tg into the glassy state, the specific volume continues to decrease at a much lower rate than above Tg. The specific volume shrinkage curve below Tg runs parallel to that of the un-obtainable crystalline material, which is a direct result of the thermal contraction (crystal equilibrium line in Figure 3). It is well-accepted that the cause of this change in the shrinkage behavior of the amorphous system at the Tg is due to the reduction of free volume. That is, during the cooling process, the volume of the epoxy approaches a critical point at which the complex combination of covalent crosslinked bonds and van der Waals bonds do not continue to energetically favor a large reduction in free volume for decreasing temperatures, as is observed in the rubbery state. This does not mean that the volume no longer decreases at all, as we will see shortly. This means that it becomes more difficult to reduce the volume at a critical point (Tg) because of the reduced
Crystalline state
Amorphous stateFree volume
CH2 CH
R NN
OH
CH2 CH
OH
CH2
CH2
CH
CH
OH
OH

G.M.OdegardandA.BandyopadhyayJournalofPolymerSciencePartB:PolymerPhysics49(24)1695‐1716(2011) Page5
atomic mobilities in the crosslinked network, especially since the presence of the crosslinks leads to an entangled network and prevents the formation of a low-energy crystalline state.
Figure 3 - Specific volume vs temperature for a typical epoxy polymer. The shaded region indicates the amount of free volume in the polymer.
Also shown in Figure 3 is the dependence of specific volume and Tg on the cooling rate of the polymer through the rubbery regime. Two different cooling rates are illustrated, 1q and the
smaller cooling rate 2q . The lower the cooling rate, the more time the polymer molecules have to
establish a lower-energy configuration as the temperature approaches the Tg region. Naturally the lower-energy configuration will have a smaller volume. Therefore, quicker cooling rates tend to ‘lock-in’ higher amounts of free volume. In Figure 3, this is illustrated with a direct comparison of points A and B , which correspond to cooling rates 1q and 2q , respectively. Also shown in
Figure 3 is the decrease in Tg for the lower cooling rate. This occurs because the associated lower specific volume for lower cooling rates corresponds to molecular configuration equilibrium at lower temperatures along the amorphous equilibrium line. Although the overall network is rigid, there still exist elements of mobility of the polymer structure below Tg so that the amount of free volume can change based on the time/temperature exposure conditions. Consider, for example, point B in Figure 3. If the polymer is exposed to the
Specific volume, v
Temperature
Crystal equilibrium line
Tf Tg (q2) Tg (q1)
Free volumeq1
q2 < q1
A
B
C
D
Ta
Glassy state
Amorphous equilibrium line
Thermal expansionv∞

G.M.OdegardandA.BandyopadhyayJournalofPolymerSciencePartB:PolymerPhysics49(24)1695‐1716(2011) Page6
aging (annealing) temperature Ta for a fixed amount of time ta, the specific volume will decrease to point C. For longer aging times a larger decrease in specific volume will be generally observed. Although the specific volume could ideally continue to decrease until the structure is crystalline and the free volume vanishes, this does not occur in reality with epoxies because of the presence of the strong crosslinks that effectively hold the amorphous structure together. The minimum specific volume that the glassy polymer can realistically achieve is v . It is also shown
in Figure 3 that the fictive temperature Tf is the minimum temperature at which an aged epoxy polymer is in equilibrium. As the polymer continues to age, the fictive temperature will continue to drop. When no physical aging has occurred, f gT T .
Figure 4 - Simple 2D illustration of the change in molecular configuration with a constant level of free volume
Configurational Changes Configurational changes on the molecular level can occur in epoxies that do not result in an overall change in the amount of free volume when an epoxy is subjected to sub-Tg annealing. A schematic example of a constant-volume configurational change is shown in Figure 4. Although it is expected that atomic vibration of atoms continually cause changes in the molecular structure of polymers, the type of configurational changes that are considered as indicative of physical aging are those that cause long-term (orders of magnitude longer than the characteristic times of atomic vibration) changes in the polymer molecular structure. Although the existence of these types of changes is difficult to observe experimentally, the evidence for this physical aging mechanism is discussed below.
Constant free volume
Configurational change
G.M.OdegardandA.BandyopadhyayJournalofPolymerSciencePartB:PolymerPhysics49(24)1695‐1716(2011) Page7
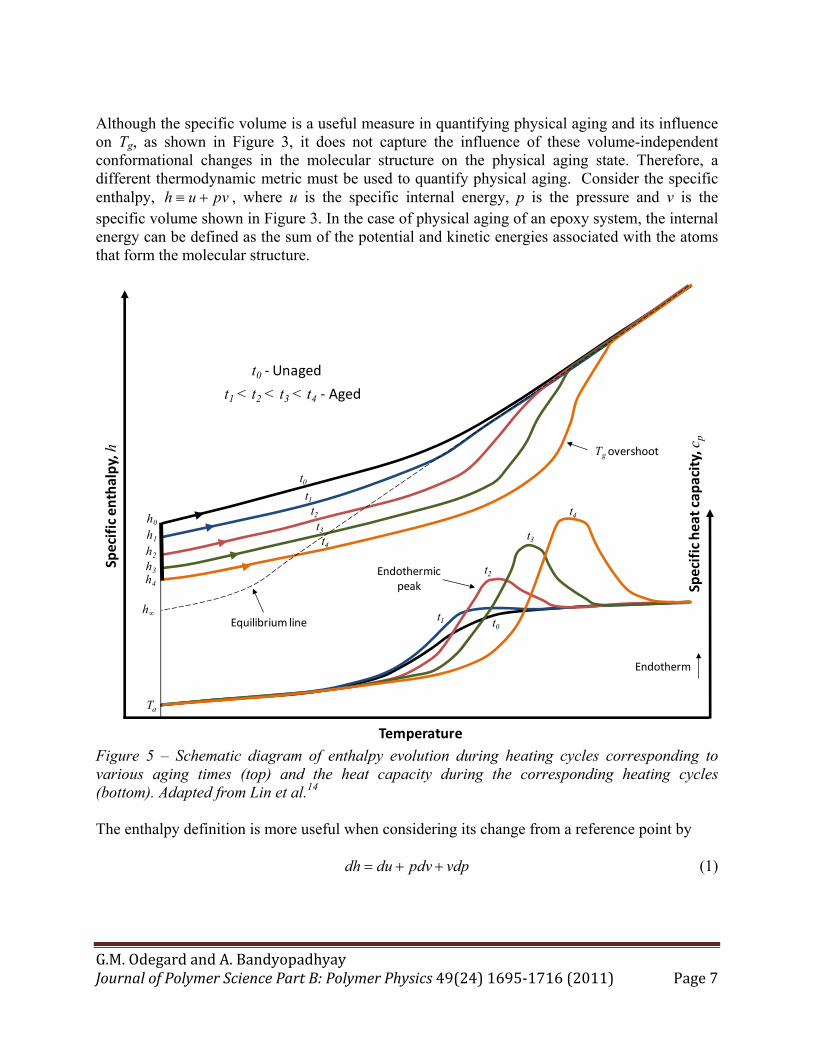
Although the specific volume is a useful measure in quantifying physical aging and its influence on Tg, as shown in Figure 3, it does not capture the influence of these volume-independent conformational changes in the molecular structure on the physical aging state. Therefore, a different thermodynamic metric must be used to quantify physical aging. Consider the specific enthalpy, h u pv , where u is the specific internal energy, p is the pressure and v is the specific volume shown in Figure 3. In the case of physical aging of an epoxy system, the internal energy can be defined as the sum of the potential and kinetic energies associated with the atoms that form the molecular structure.
Figure 5 – Schematic diagram of enthalpy evolution during heating cycles corresponding to various aging times (top) and the heat capacity during the corresponding heating cycles (bottom). Adapted from Lin et al.14 The enthalpy definition is more useful when considering its change from a reference point by dh du pdv vdp (1)
Specific enthalpy, h
Temperature
Specific heat cap
acity, c
p
Equilibrium line
Tgovershoot
Endothermic peak
Endotherm
t0t1
t2
t3
t4
t0t1
t2
t3
t4
Ta
h0
h1
h2
h3h4
h∞
t0 ‐Unaged
t1 < t2 < t3 < t4 ‐ Aged

G.M.OdegardandA.BandyopadhyayJournalofPolymerSciencePartB:PolymerPhysics49(24)1695‐1716(2011) Page8
The process of physical aging is usually observed under conditions of constant pressure in laboratory and practical conditions. If it is assumed that the pressure exerted onto an aging material does not change during the aging process, then Equation (1) becomes dh du pdv (2) The first term on the right-hand-side of Equation (2) represents the change in the internal energy during the physical aging process. That is, it represents the change in the potential and kinetic energies associated with the atoms that form the molecular structure. The change in internal energy can be induced by the type of configurational changes shown in Figures 2 and 4. The second term on the right-hand-side of Equation (2) represents the contribution of enthalpy change from the change in volume (reduction of free volume). Because the specific enthalpy incorporates the influences of volume change and molecular reconfiguration on the thermodynamic state of the material held at a constant pressure, it serves as an excellent metric for physical aging. Figure 5 shows the enthalpic response of epoxies that are held isothermally at Ta. As the aging continues from the unaged time t0 to higher levels of aging (t1 < t2 < t3 < t4), the corresponding enthalpy values (h0, h1, h2, h3, h4, respectively) drop until the enthalpic state eventually reaches the amorphous equilibrium line, where the enthalpy value is h∞ at Ta. This behavior is analogous to that of volume in aged polymers (Figure 3). While Figure 3 shows that the specific volume of the material is dependent on the cooling rate as it cools from the rubbery to glassy regions, Figure 5 shows that the corresponding enthalpic behavior while heating from Ta to the rubbery regime is remarkably different. For progressively longer aging times, the enthalpy lines tend to overshoot the equilibrium line by increasing amounts. The reason for this behavior is best understood by discussing the experimental means by which this trend is discerned, as described below. Figure 5 also shows typical heat capacity curves that are determined via Differential Scanning Calorimetry (DSC). During DSC tests, material samples are gradually heated while the amount of energy required to maintain a gradual temperature increase is measured. When testing unaged epoxies, there is a significant increase in the measured heat capacity near the glass transition region. This increase is due to the increased energy required to initiate the rubbery-phase molecular motions that are characteristic of the glass transition region. For increasing physical aging levels, more energy is required to initiate the same rubbery-phase molecular motions, thus resulting in endothermic peaks of increasing magnitude centered at increasing temperatures, as shown in Figure 5. The tendency of the endothermic peaks to be centered at increasing temperature values above Tg for increasing levels of aging is sometimes referred to as Tg overshoot. It is also possible to have an endothermic peak centered at temperatures below Tg for relatively low aging levels in epoxies.15 It is important to note that the observed decreases in Tg with increasing aging levels that are observed in the specific volume plot of Figure 3 contradict the apparent Tg overshoot that is observed in the heat capacity plots in Figure 5. This contradiction is likely due to the fact that the Tg of specific volume curves is usually obtained during cooling cycles, while the specific heat curves are typically obtained during heating cycles. It is also important to note that any dependency of Tg on heating rate would not, in general,

G.M.OdegardandA.BandyopadhyayJournalofPolymerSciencePartB:PolymerPhysics49(24)1695‐1716(2011) Page9
follow the same dependency found with cooling rates. Therefore, the values of Tg from different analysis techniques such as DSC, dilatometry, and dynamical mechanical analysis (DMA) are generally close but not necessarily the same. The change in the specific enthalpy (henceforth referred to as ∆h) at the aging temperature is calculated based on the heat capacity curves for the aged and unaged state. Specifically,
0
1, ,
T
p aged p refTh c c dT (3)
where cp,aged and cp,ref are the specific heat capacities after and before aging, respectively; and T0 and T1 are reference temperatures above Tg and below the Ta, respectively. The limiting enthalpy relaxation h can be determined based on specific enthalpy values of the unaged and aged states
in which the aging time approaches ∞ 0,a a ah T h T t h T (4)
For most epoxies, Equation (4) cannot be used because of the large aging times required to reach h for aging temperatures significantly below Tg. Therefore, two approximations for h have
emerged. The first approximation involves the application of Equation (3) to the specific heat capacity of the liquid resin cp,l
0
, ,a
T
p l p refTh c c dT (5)
The second approximation is p g ah c T T (6)
where , ,p p l p gc c c and cp,g is the specific heat capacity at Tg. Examples of the use of these
approximations has been reported by various authors.15-18
Thermal Rejuvenation The effects of physical aging can be reversed through thermal rejuvenation (a.k.a. thermal de-aging and erasure). There are multiple reported thermal rejuvenation mechanisms for epoxies that have been discussed in the literature.10,19-27 The most effective mechanism is super-Tg thermal rejuvenation. When an aged epoxy polymer is heated above the Tg for a appreciable time, the physical aging history is lost, and the aging clock is reset to zero. It has been reported that temperatures which are at least 40°C greater than Tg with annealing times of 10-15 minutes are more than adequate for this purpose.28 If the rejuvenated polymer is cooled to an aging temperature below Tg, then it will exhibit the behavior corresponding to the appropriate cooling rate shown in Figure 3 for ta = 0. More details of the thermal rejuvenation process can be found elsewhere.10

G.M.OdegardandA.BandyopadhyayJournalofPolymerSciencePartB:PolymerPhysics49(24)1695‐1716(2011) Page10
The epoxy does not necessarily have to be heated above Tg for rejuvenation to occur. Sub-Tg thermal rejuvenation can occur at specific temperatures below the epoxy Tg. Lee and co-workers20,21 and Gillham and co-workers26,27 reported rejuvenation that occurred at fixed temperatures above Ta and below Tg, referred to as erasure temperatures. The explanation given to this observation is referred to as localization, that is, molecular configurational effects that occur at distinct temperatures. If the epoxy is aged at one of these distinct temperatures, which may correspond to specific transitions in the polymer structure, the effects of prior physical aging are eliminated.
Relaxation Functions
Many characteristic behaviors of physically aged materials are described by relaxation functions. That is, quantities such as volume, enthalpy, and viscoelastic response can be partly described by relaxation as a function of time. Before these behaviors are described in detail in later sections, a brief summary of relaxation functions is necessary. The specific physical explanation of many of the parameters discussed in this sub-section will be described in detail in subsequent sections. Consider a yet unspecified scalar physical quantity (t), where 0 1t , that is expected to
monotonically decrease (relax) as a function of time. The decrease can be expected to occur over several orders of magnitude of time. In some cases the rate of change of (t) can be described by the following differential equation29-33
d t t
dt
(7)
where is the relaxation time. The relaxation time is dependent on the specific material and conditions under consideration. A simple solution to this equation is
expt
t
(8)
In Equation (8) is the time that it takes for the function (t) to relax to 36.8% of its original value. Equation (8) is often referred to as the single-parameter model since is the only adjustable parameter. An improved version of Equation (8) adds the stretching parameter 0 1
exp aa
tt
(9)
Equation (9) is commonly known as the Kohlrausch-Williams-Watts (KWW) function.34,35 As the stretching parameter decreases from = 1, the relaxation function “stretches out” as a function of time, that is, it is said that the width of the distribution of relaxation times decreases.
G.M.OdegardandA.BandyopadhyayJournalofPolymerSciencePartB:PolymerPhysics49(24)1695‐1716(2011) Page11
Instead of treating as a constant or adjustable parameter, it is common to express in terms of an exponential-based equation so that there is a distribution of relaxation times. One such expression has been proposed by Petrie 36
exp expE
A CRT
(10)
where A and C are material parameters, E is the activation energy, which is also a material parameter, and is the departure from equilibrium. The departure from equilibrium is considered to be parameter that describes the structure of the material, that is, how far the molecular structure is from the structure at equilibrium. A more common approach to model the relaxation time is with the KAHR model, developed by Kovacs, Aklonis, Hutchinson, and Ramos,37 which states
exp exp 1r RT T x
(11)
where r is the relaxation time in equilibrium at an arbitrary reference temperature TR in the transition range, which can be taken as Tg; is a function of the activation energy and describes the temperature dependence of the relaxation times in equilibrium; x is the nonlinearity parameter ( 0 1x ) that describes the relative contributions of structure and temperature to the relaxation times; and is a physical quantity that is dependent on the type of relaxation under consideration (e.g. cp for enthalpy relaxation and thermal expansion coefficient for volume relaxation). The parameters and x can be determined using
2
1
g
E
RT
Cx
(12)
Similar to the KAHR equation, the relaxation time can also be expressed in terms of the Tool-Narayanaswamy-Moynihan38-40 (TNM) equation
1
exprf
x ExE
RT RT
(13)
where the parameters are the same as those used in the KAHR model. The KAHR and TNM formalisms are essentially equivalent, but have subtle difference in the interpretation of the parameters. Whereas describes the material structure in the KAHR model, the TNM model

G.M.OdegardandA.BandyopadhyayJournalofPolymerSciencePartB:PolymerPhysics49(24)1695‐1716(2011) Page12
uses Tf. A more thorough discussion of the comparison between the KAHR and TNM approaches and the corresponding parameters can be found elsewhere.41
MECHANICAL BEHAVIOR OF AGED EPOXIES
The physical aging of an epoxy polymer has a significant impact on its mechanical behavior. The mechanical response of an aged epoxy can be described in terms of the testing conditions under which it is observed. This section will describe the influence of physical aging on quasi-static behavior, thermal expansion, viscoelastic behavior in terms of creep/stress relaxation and dynamic viscoelastic behavior, and volume relaxation.
Mechanical Response from Quasi-Static Testing Numerous studies have addressed the measurement of the elastic modulus of aged epoxy polymers.14,25,42-49 These studies have employed standard static tensile-testing,25,44-46,49 compression testing,42,43,47,48 and 3-point bending14 techniques to measure the Young’s modulus of epoxy. Although many of these studies have reported data that showed no conclusive influence of aging on the elastic modulus,14,25,42,43,45,47 other studies have suggested that there is a modest increase of elastic modulus with physical aging in epoxies and epoxy composites.44,46,48,49 From these studies, it is clear that if there is an influence of physical aging on the elastic modulus of epoxy, it is generally small, and shows an increasing modulus with increasing levels of physical aging. Several studies have examined the influence of physical aging on the yield strength of epoxies in compression,42,43,47,48,50 tension,25 and shear.51 In compression, two distinct yield points are often observed in stress-strain curves of epoxy: the upper yield point corresponding to the ultimate load, and the lower yield point corresponding to the minimum post-yield stress. For example, Figure 6 shows the upper and lower yield point values for a DGEB/DDS epoxy system for various physical aging times.43 Also shown in the figure is a typical true stress-true strain curve with the upper and lower yield points labeled. It is clear that in compression, increases in physical aging time result in increases in both upper and lower yield points, with relatively larger increases in the upper yield point. The same general trends are observed in quasi-static shear tests of epoxies.51 However, in quasi-static tension tests, a different behavior is observed. Kong25 demonstrated that the ultimate tensile strength (there are no upper and lower yield points in tension) decreases for increasing aging times. The different failure trends for different loading modes may be due to the different corresponding microscopic failure mechanisms. The embrittlement of the epoxy during the physical aging process results in the growth of microcracks at lower loads. While single microcracks can become critical in pure tension (thus a reduced specimen strength in tension), the biaxial/triaxial load states associated with compression and shear testing are more likely to cause a relatively large array of microcracks to form. Because of the embrittlement due to physical aging, the larger process zone of microcracks may lead to an overall toughening of the specimen. This explanation is further reinforced from the fact that Kong25 demonstrated increasing hardness values for increasing physical aging times. Hardness is a strength measure that reflects compressive-dominated triaxial loading. On a similar note, both Kong25 and Ophir and co-workers52,53 observed decreases in the strain to failure of epoxies for increasing aging times.

G.M.OdegardandA.BandyopadhyayJournalofPolymerSciencePartB:PolymerPhysics49(24)1695‐1716(2011) Page13
Figure 6 - Upper and lower yield points for a DGEB/DDS epoxy system. Inset shows a typical
quasi-static stress-strain curve. Data obtained from Chang and Brittain43 Kawakami and co-workers investigated upper yield points of epoxies subjected to strain-aging conditions, that is, aging under constantly-held strains.54-56 Specifically, they reported very small increases in the upper yield point as a function of aging for very small applied shear strains (1%).54 For larger applied shear strains (up to 4%), the upper yield point appeared to decrease with aging time at first, then began increasing for aging times beyond 103 seconds. They observed similar behaviors in their other studies.55,56 Chang and Brittain57 and Truong and Ennis50 conducted thorough studies on the fracture toughness of aged epoxies. Using tapered double-cantilever beam specimens, Chang and Brittain57 observed that physical aging of a DGEB/DDS epoxy system dramatically decreased the critical energy release rate for initial crack growth Gi (the critical energy release rate corresponding to the maximum load in a load-displacement diagram), but had little influence on the arrest energy release rate Ga (the critical energy release rate corresponding to the point at which the load has dropped and is beginning to build back up again). Figure 7 shows the measured values of Gi and Ga, and the inset shows a typical load-displacment diagram for such a fracture test to illustrate the difference between Gi and Ga. The crack propagation in the aged specimens was primarily of an unstable stick-slip mode. That is, the cracks briefly propagated
50
55
60
65
70
75
80
85
90
0.1 1 10 100
Yield stress (M
Pa)
Aging time (hours)
Upper yield
Lower yield
True stress
True strain

G.M.OdegardandA.BandyopadhyayJournalofPolymerSciencePartB:PolymerPhysics49(24)1695‐1716(2011) Page14
after reaching a critical load which resulted in the release of part of the load, as illustrated in the inset of Figure 7. Once arrested, the load increased again as the cycle repeated, resulting in a saw-tooth shaped load-displacement diagram. For unaged epoxies this crack-growth behavior was not observed. Truong and Ennis50 used double-torsion test specimens to determine the critical energy release rate of aged epoxies. Their observations were very similar to those of Chang and Brittain.57 Their explanation of the decrease in fracture toughness and stick-slip behavior in aged epoxies was that the aging increased the yield point of the material, thus suppressing the crack-blunting mechanisms (toughening) associated with unaged epoxies.
Figure 7 - Critical energy release rate at initial crack growth (Gi) and at crack arrest (Ga) for a DGEB/DDS epoxy system. Inset shows typical load-displacement curves for fracture specimens. Data obtained from Chang and Brittain57
Thermal Expansion Coefficient As epoxies are physically aged, the mass density generally increases. Because the increase in density suppresses molecular motion, it follows that the material’s ability to change its volume in response to a change in temperature also decreases. As a result, the thermal expansion coefficient decreases for increasing aging times. This behavior was observed in a TGDDM/DGOP/DDS epoxy system investigated by Kong25 (Figure 8). By analyzing Thermal Mechanical Analysis (TMA) data, Kong demonstrated that increased physical aging times resulted in decreased thermal expansion coefficients when measured below Tg. However, when tested above Tg,
10
100
1000
0.1 1 10
Critical Energy Release Rate (J/m
2 )
Aging time (hours)
Gi
Ga
Load
Displacement
Steady crack growth (unaged)
Stick‐slip crack growth (aged)
Gi
Ga

G.M.OdegardandA.BandyopadhyayJournalofPolymerSciencePartB:PolymerPhysics49(24)1695‐1716(2011) Page15
increased thermal expansion coefficients were observed for increased aging times. This can be explained by the thermal rejuvenation that occurred when the measurements were taken above Tg. The longer the epoxy specimen was subjected to aging, the higher its tendency was to recover lost volume during the testing, resulting in an increase in the thermal expansion coefficient with aging.
Figure 8 - Coefficient of thermal expansion vs aging time for a TGDDM/DGOP/DDS epoxy system below Tg. Data obtained from Kong.25
Creep and Stress Relaxation The two most fundamental concepts in viscoelasticity are creep and stress relaxation. Numerous researchers have investigated the influence of physical aging on the viscoelastic response of epoxies in terms of creep and stress relaxation.19,22,23,25,46,48,49,58-69 This sub-section will provide a brief background in the characterization of creep and stress relaxation and will present the most significant findings in the viscoelastic response of physically aged epoxies. To examine the stress relaxation response, consider a constant strain 0 applied to a viscoelastic
material specimen. For an elastic material there is a unique stress that is proportional to 0 by the
modulus of the material. For a viscoelastic material, such as an epoxy, molecular mobility will
4.2
4.3
4.4
4.5
4.6
4.7
4.8
4.9
1 10 100 1,000 10,000 100,000
Therm
al expan
sion coefficient (×10‐5°C
‐1)
Aging time (minutes)
G.M.OdegardandA.BandyopadhyayJournalofPolymerSciencePartB:PolymerPhysics49(24)1695‐1716(2011) Page16
allow the structure to evolve in a manner that accommodates the strain and relaxes the stress. This stress relaxation t is proportional to 0
0 0t E t t (14)
where E t is the time-dependent relaxation modulus, t is time, and 0t is the starting time of
the stress relaxation experiment. Figure 9 shows a representative relaxation modulus/time response of a viscoelastic material at a reference temperature RT (blue line in Figure 9). It is clear
that the relaxation modulus decreases nonlinearly over time. From Figure 9 it is also clear that for epoxies (and other crosslinked polymers) the relaxation modulus asymptotically approaches the equilibrium relaxation modulus E∞, known as the rubbery modulus. Similarly, creep can be understood by considering the material subjected to a constant stress 0 . The corresponding
strain response is 0 0t D t t (15)
where D t is the time-dependent creep compliance. The creep response of a polymer at RT is
shown in Figure 10 (blue line). The values of 0E t and 0D t correspond to the initial
instantaneous elastic response. There are a wide range of functional forms for E t and D t .
Specifically, D t is often expressed in the form of the KWW equation
0 expv
v
tD t D
(16)
where 0 0D D t , v is the characteristic relaxation time associated with viscoelasticity, and
v is the stretching exponent associated with viscoelasticity. The KWW equation corresponding
to E t is
0 expv
v
tE t E
(17)
where 0 0E E t . The relaxation modulus and creep compliance are independent of the applied
deformation level for a linear viscoelastic material. This can be easily verified by subjecting the material to a series of creep/relaxation tests with varying levels of loads/deformations and determining if the corresponding compliance/modulus curves are the same for each.

G.M.OdegardandA.BandyopadhyayJournalofPolymerSciencePartB:PolymerPhysics49(24)1695‐1716(2011) Page17
Figure 9 - Relaxation modulus of an epoxy with the corresponding temperature and aging shifts
Another characteristic of a linear viscoelastic material is the superposition property. Specifically, the strain responses to multiple individually-applied stresses can be simply superposed to provide the strain response for the combined loading of all the applied stresses. This is known as the Boltzmann Superposition Principle. For continuously varying applied strains or stresses, this principle can be used to show,70 respectively,
0
0
t
t
dt E t t dt
dt
dt D t t dt
dt
(18)
where it is assumed that the material deformation history starts at 0t . Equations (18) thus represent time-dependent constitutive responses in terms of the material parameters E t and
D t .
TR, tR
log Relaxation modulus
log Time
T1 > TR
E(t0)
E∞
Temperature shift
t1 > tR
Aging shift
log aT
log tRlog t1 log t2
log aE
log tR = log t1 + log aT
log t2 = log tR + log aE

G.M.OdegardandA.BandyopadhyayJournalofPolymerSciencePartB:PolymerPhysics49(24)1695‐1716(2011) Page18
Figure 10 - Creep compliance of an epoxy with the corresponding temperature and aging shifts
Temperature has a strong impact on the viscoelastic response of polymers. As the temperature T increases above the reference temperature TR, the corresponding relaxation modulus and creep compliance will decrease and increase, respectively, for a given time. The effect of elevated temperatures on the response of linear viscoelastic materials is embodied in the Time-Temperature Superposition Principle (TTSP),30,71 which is illustrated in Figures 9 and 10 for stress relaxation and creep, respectively (red lines). These figures demonstrate that E t and
D t at an elevated temperature 1T 1 RT T are related to the corresponding values at RT by a
simple horizontal shift on the log time scale, which can be calculated using the temperature-shift factor Ta . If all curves corresponding to a series of temperatures are shifted horizontally by their
respective values of log Ta , then they will all collapse onto a single master curve corresponding
to RT . Above Tg, the shift factor is often given by the Williams-Landel-Ferry (WLF) equation
1 1
2 1
log RT
R
c T Ta
c T T
(19)
where 1c and 2c are material constants, RT is often chosen to be equal to gT , and 1Ta for
1 RT T . Below gT , an Arrhenius-type equation is often used
log Creep
complian
ce
log Time
D(t0)
Temperature shift
Aging shift
log aT
log tRlog t1 log t2
log aE
log tR = log t1 + log aT
log t2 = log tR + log aE
TR, tRT1 > TR t1 > tR

G.M.OdegardandA.BandyopadhyayJournalofPolymerSciencePartB:PolymerPhysics49(24)1695‐1716(2011) Page19
1 1
exp TTSPT
R
Ea
R T T
(20)
where ETTSP is the activation energy for the TTSP shift and R is the gas constant. The significance of the ability to determine accurate shift factors and create master curves in this manner is the added capability of characterizing the creep compliance and relaxation modulus at a single reference temperature (and at one or more select temperatures to characterize c1, c2, and/or ETTSP) and being able to efficiently predict the corresponding response at any other temperature. The TTSP would not be possible if the curvature of the slopes shown in Figures 9 and 10 were different for various temperatures. The fact that the basic curvature is the same allows for the simple horizontal shifting of the curves according to Equations (19) and (20). The most important application of the TTSP is in accelerated laboratory testing of polymers and polymer composites. Long-term viscoelastic responses can be established in less time with elevated testing temperatures. Therefore, instead of experimental tests that require months or years to complete, fundamental viscoelastic properties can be determined on a much shorter and more practical time scale.
Figure 11 - Relaxation modulus for a DGEBA/PPO epoxy with various levels of physical aging.
Data obtained from Lee and McKenna19
0.2
0.3
0.4
0.5
0.1 1.0 10.0 100.0 1,000.0 10,000.0 100,000.0
Log relaxation modulus (GPa)
Time (seconds)
28 minutes
126 minutes
503 minutes
4026 minutes
Aging times:
Master curve

G.M.OdegardandA.BandyopadhyayJournalofPolymerSciencePartB:PolymerPhysics49(24)1695‐1716(2011) Page20
Similar to the TTSP, it is possible to bring the momentary creep and relaxation curves measured at different aging times into superposition through a horizontal shift. For the Time-Aging Superposition Principle (TASP), the aging shift factor Ea represents the horizontal shift between
compliance/modulus curves at a reference aging time (typically unaged) Rt and aging time 1t , as
shown schematically in Figures 9 and 10 (green lines). It is clear from these figures that as the polymer is aged the viscoelastic response is slowed. The aging shift factor is related to the relaxation times in Equations (16) and (17) by
vE ref
v
a
(21)
where ref
v is the relaxation time for the polymer aged at the reference aging time. Figure 11
shows relaxation modulus curves obtained by Lee and McKenna19 for a DGEBA/PPO epoxy subjected to various physical aging times at 62°C. The figure also shows the corresponding master curve, which is the curve associated with TR onto which the remaining curves are shifted via Equation (21), superposed with a horizontal time shift for clarity. It is clear from Figure 11 that the curves shift very nicely to form a smooth and precise master curve. The same procedure can be used to establish master curves for the creep compliance response. If Ea is plotted as a function of aging time on a log-log plot, it is found to initially map a straight
line with a slope of such that
log
logE
a
d a
d t (22)
Figure 12 shows the log aE - ta trend for a DGEBA/PPO epoxy system at various aging temperatures. The behavior is generally linear and increasing for increasing aging times. Usually the reported values of are on the order of unity for epoxies. Vleeshouwers et al.68 verified that is the same for epoxy in both creep and stress relaxation. McKenna and co-
workers19,23,48,61,62,64,65 have shown that for extended periods of aging, the value of Ea can
abruptly become constant with aging time (Figure 12) for temperatures close to gT . The point at
which this occurs for a given temperature is labeled as t in Figure 12 and marks the point at which further exposure to aT does not result in significant changes in the physical structure of
the epoxy. This could indicate that the specific enthalpy has reached h∞ (Figure 5). Lee and McKenna19,61 observed that t increases with increased crosslink density.

G.M.OdegardandA.BandyopadhyayJournalofPolymerSciencePartB:PolymerPhysics49(24)1695‐1716(2011) Page21
Figure 12 - Aging shift factor for a DGEBA/PPO epoxy at different temperatures. Data obtained
from Lee and McKenna61 Two important issues must be discussed regarding the creep/stress relaxation testing of aged epoxies. First, the duration of creep and stress relaxation testing must be short with respect to the aging time to minimize the amount of aging that occurs during the testing, thus ensuring that the tests occur in an isostructural state. The usual procedure is to conduct the tests for a maximum of one tenth of the total aging time, with appropriate allowance for a sufficient recovery period between each test. Second, some authors perform vertical shifting in addition to horizontal TASP shifting to account for the influence of aging on the initial creep compliance and relaxation modulus (D(t0) and E(t0), respectively). It is expected that there is a very small influence (if any) of aging on these parameters given the discussion above on quasi-static elastic properties. Therefore, any vertical shifting that is performed should be very small relative to the horizontal TASP shifting.
Dynamic Viscoelasticity Epoxies are often subjected to cyclic loadings at relatively high frequencies. Their viscoelastic behavior under these conditions can be characterized using Dynamical Mechanical Analysis (DMA). With DMA, a polymer specimen is subjected to the oscillatory strain
0.0
0.5
1.0
1.5
2.0
10 100 1,000 10,000
log
a E
Aging Time (min)
Tg - Ta = 30.1⁰CTg - Ta = 24.0⁰CTg - Ta = 20.8⁰CTg - Ta = 15.1⁰CTg - Ta = 10.3⁰CTg - Ta = 6.3⁰C
×
t*
t*
= 0.85
+

G.M.OdegardandA.BandyopadhyayJournalofPolymerSciencePartB:PolymerPhysics49(24)1695‐1716(2011) Page22
0 sin t (23)
where 0 is the strain amplitude and is the angular frequency. For a viscoelastic material, the
corresponding stress response has a phase lag such that 0 0 0sin sin cos cos sint t t (24)
where 0 is the stress amplitude. The first term on the right-hand side of Equation (24) is the
portion of the stress response that is in-phase with the strain, and is therefore the elastic response. The second term is the portion that is 2 out-of-phase with the strain, and therefore represents viscous component of the response. The storage modulus is the elastic response and defined by
01
0
cosE
(25)
The loss modulus represents the viscous response and is given by
02
0
sinE
(26)
It is common to define the complex modulus as 1 2E E iE . A relative measure of the viscous
response of a polymer is the loss tangent (loss factor) parameter defined as 2 1tan E E . The
peak of the loss tangent with respect to temperature usually signifies the gT region. The storage
shear modulus G1 and the loss shear modulus G2 have analogous definitions for oscillating shear deformations. DMA testing has been performed with traditional 3-point bend,16,72 compression,43 and tension25 specimens for aged epoxies and epoxy composites.25 The typical procedure is to perform these tests with a forced oscillation over a range of temperatures above and below the gT . An example
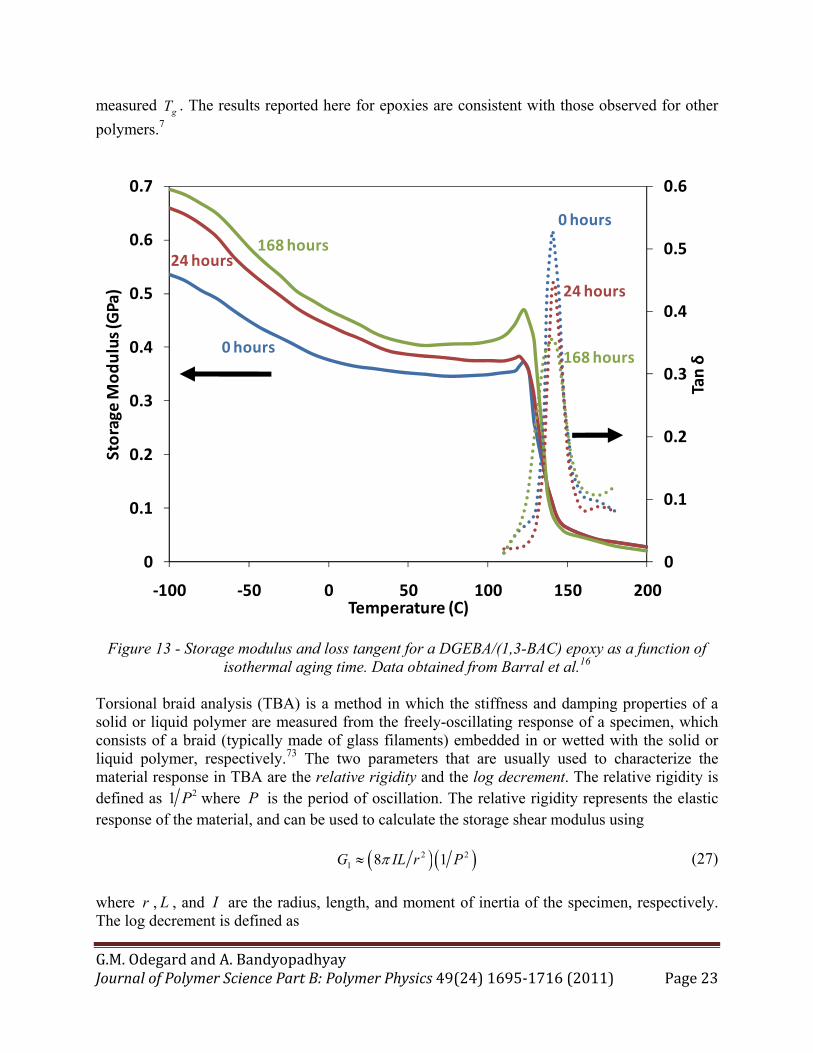
of a typical DMA analysis is shown in Figures 13 for a DGEBA/(1,3-BAC) epoxy system. From this figure several points are clear. First, as the aging time increases, the sub-Tg storage modulus typically increases as well,16,25,72 which is consistent with some of the observations made for quasi-static testing.44,46,48,49 Second, as the temperature proceeds toward the gT , the storage
modulus decreases gradually. When the temperature is within the gT range, the storage modulus
drops dramatically to nearly zero. The loss tangent rises from nearly zero as the temperature approaches Tg and the storage modulus quickly drops. In the Tg range the loss tangent has its maximum peak. As the temperature continues to increase beyond the Tg range, the loss tangent quickly drops to nearly to zero again. It can be observed in Figure 13 that the loss tangent peak magnitude typically decreases as the aging time increases.16,25,43,72 For the limited DMA data available for aged epoxy resins, there does not seem to be an effect of aging time on the
G.M.OdegardandA.BandyopadhyayJournalofPolymerSciencePartB:PolymerPhysics49(24)1695‐1716(2011) Page23
measured gT . The results reported here for epoxies are consistent with those observed for other
polymers.7
Figure 13 - Storage modulus and loss tangent for a DGEBA/(1,3-BAC) epoxy as a function of isothermal aging time. Data obtained from Barral et al.16
Torsional braid analysis (TBA) is a method in which the stiffness and damping properties of a solid or liquid polymer are measured from the freely-oscillating response of a specimen, which consists of a braid (typically made of glass filaments) embedded in or wetted with the solid or liquid polymer, respectively.73 The two parameters that are usually used to characterize the material response in TBA are the relative rigidity and the log decrement. The relative rigidity is defined as 21 P where P is the period of oscillation. The relative rigidity represents the elastic response of the material, and can be used to calculate the storage shear modulus using 2 2
1 8 1G IL r P (27)
where r , L , and I are the radius, length, and moment of inertia of the specimen, respectively. The log decrement is defined as
0
0.1
0.2
0.3
0.4
0.5
0.6
0
0.1
0.2
0.3
0.4
0.5
0.6
0.7
‐100 ‐50 0 50 100 150 200
Tan δ
Storage
Modulus (GPa)
Temperature (C)
0 hours
24 hours168 hours
0 hours
24 hours
168 hours

G.M.OdegardandA.BandyopadhyayJournalofPolymerSciencePartB:PolymerPhysics49(24)1695‐1716(2011) Page24
1
ln i
i
(28)
where i is the amplitude of the thi oscillation of the freely-damped wave. The log decrement
represents the viscous response of the polymer and can be approximated in terms of the shear loss modulus using 2 1G G . A limited number of TBA studies have been reported for aged
epoxies.26,27,74 Figure 14 shows an example of the type of results that are usually observed in TBA experiments for a DGEBA/TMAB epoxy system. From the figure it is clear that aging causes a slight increase in the relative rigidity and a slight decrease of the logarithmic decrement near the aging temperature. These results are consistent with similar TBA studies in other epoxy systems.27,74 The overall form of the relative rigidity curve for a wider range of temperatures than that shown in Figure 14 usually resembles the general form of storage modulus curves observed in DMA tests, such as that shown in Figure 13. The general form of the logarithmic decrement curves for a wider range of temperatures usually resemble the loss tangent curves shown in Figure 13, with the exception of the relatively large increase at temperatures below Tg, which is a glassy-state secondary transition that often has a peak denoted as T .
There are two important facts that need to be discussed at this point. First, the main difference between DMA and TBA testing is that DMA testing usually involves forced oscillations, whereas TBA testing usually is performed with free oscillations. With forced oscillations, particularly near the gT , it becomes difficult for the material to dissipate the mechanical energy.
This can lead to internal heating of the sample which can distort the response. Second, with both DMA and TBA testing, the results can often be difficult to interpret because during the heating scan the sample is exposed to a complex state of aging. The results, therefore, are highly dependent on the heating rate and aging history prior to sample heating.
Volumetric and Free Volume Relaxation
The decrease in volume that is typically observed as epoxies age, as shown in Figure 3, is often referred to as volumetric relaxation, and can be measured using a wide range of experimental techniques, such as traditional dilatometry,58,59,75 torsional dilatometry,23,65,76 density measurements,25,43 measurement of specimen length changes,77 Proton-decoupled Cross Polarization Magic Angle Spinning Nuclear Magnetic Resonance (CP/MAS NMR) techniques,25 positron annihilation lifetime spectroscopy (PALS),78,79 and fluorescence spectroscopy.80 These tests are commonly conducted under isothermal conditions in which the polymer is either cooled or heated from equilibrium to a fixed temperature, known as down- and up-jumps, respectively. It is important to note that PALS enables the observation of the void structure of the resin at a molecular level, thus enabling direct measurement of changes in free volume.

G.M.OdegardandA.BandyopadhyayJournalofPolymerSciencePartB:PolymerPhysics49(24)1695‐1716(2011) Page25
Figure 14 - Relative rigidity and logarithmic decrement for a DGEBA/TMAB epoxy material in
the unaged and aged states (aged at 70°C for 10 hours). Data obtained from Maddox and Gillham26
In volumetric relaxation tests, the change in volume (deviation from equilibrium) during the relaxation process can be expressed as
v
v v
v
(29)
where v is the specific volume of the polymer at a given aging time and v is specified in
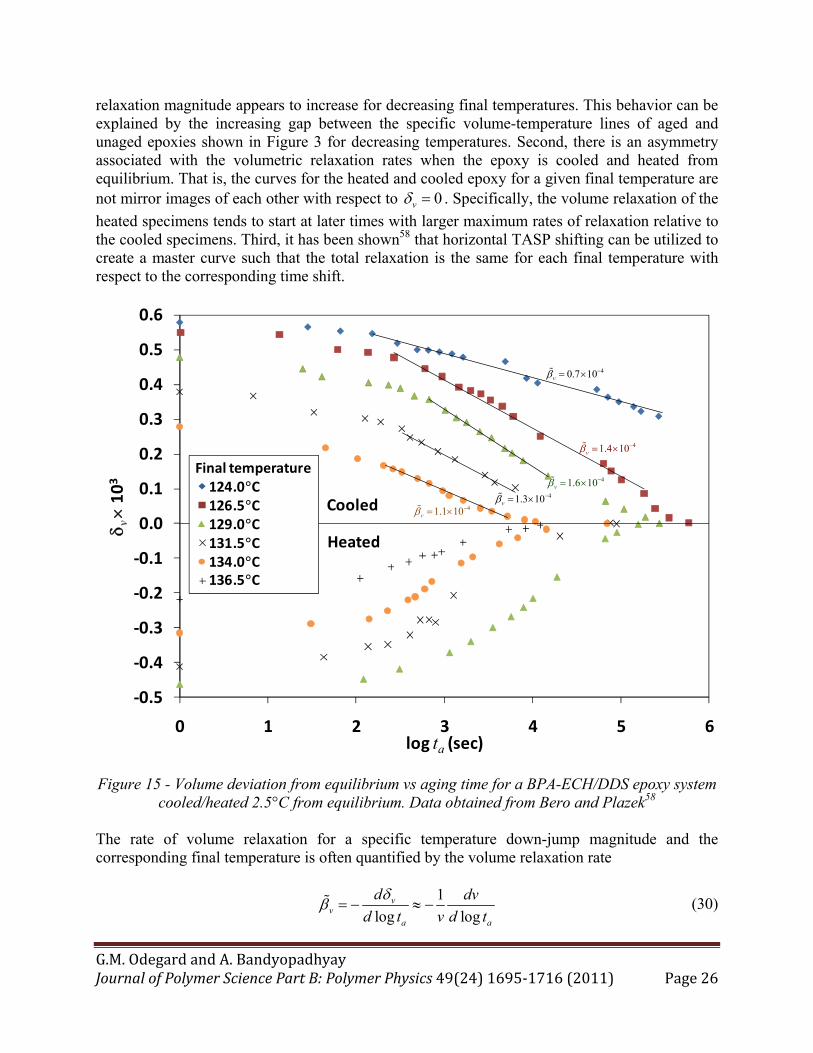
Figure 3. As an example, Figure 15 shows the volumetric relaxation for a BPA-ECH/DDS epoxy system when cooled from equilibrium at various temperatures (136.5°C, 134.0°C, 131.5°C, 129.0°C, 126.5°C) to temperature values of 134.0°C, 131.5°C, 129.0°C, 126.5°C, 124.0°C; respectively. Also shown is the relaxation curves when heating from equilibrium at various temperatures (126.5°C, 129.0°C, 131.5°C, 134.0°C) to temperature values of 129.0°C, 131.5°C, 134.0°C, 136.5°C; respectively.58 In the figure the aging time is corrected for the time it took the specimen to reach a uniform temperature. Clearly the data shows that the volume of the epoxy will approach an equilibrium volume as the aging time proceeds when perturbed from equilibrium. There are three important points to be discussed regarding this data. First, the total
0.02
0.03
0.04
0.05
0.06
0.07
0.08
0.09
0.10
2.10
2.20
2.30
2.40
2.50
2.60
2.70
2.80
2.90
3.00
3.10
0 20 40 60 80 100 120 140
Logarithmic Decrement
Relative
Rigidity (Hz2)
Temperature (C)
Unaged
Aged
Aged
Unaged
G.M.OdegardandA.BandyopadhyayJournalofPolymerSciencePartB:PolymerPhysics49(24)1695‐1716(2011) Page26
relaxation magnitude appears to increase for decreasing final temperatures. This behavior can be explained by the increasing gap between the specific volume-temperature lines of aged and unaged epoxies shown in Figure 3 for decreasing temperatures. Second, there is an asymmetry associated with the volumetric relaxation rates when the epoxy is cooled and heated from equilibrium. That is, the curves for the heated and cooled epoxy for a given final temperature are not mirror images of each other with respect to 0v . Specifically, the volume relaxation of the
heated specimens tends to start at later times with larger maximum rates of relaxation relative to the cooled specimens. Third, it has been shown58 that horizontal TASP shifting can be utilized to create a master curve such that the total relaxation is the same for each final temperature with respect to the corresponding time shift.
Figure 15 - Volume deviation from equilibrium vs aging time for a BPA-ECH/DDS epoxy system
cooled/heated 2.5°C from equilibrium. Data obtained from Bero and Plazek58 The rate of volume relaxation for a specific temperature down-jump magnitude and the corresponding final temperature is often quantified by the volume relaxation rate
1
log logv
va a
d dv
d t v d t
(30)
‐0.5
‐0.4
‐0.3
‐0.2
‐0.1
0.0
0.1
0.2
0.3
0.4
0.5
0.6
0 1 2 3 4 5 6
v103
log ta (sec)
Cooled
Heated
Final temperature124.0°C126.5°C129.0°C131.5°C134.0°C136.5°C
41.1 10v
41.3 10v
41.6 10v
41.4 10v
40.7 10v

G.M.OdegardandA.BandyopadhyayJournalofPolymerSciencePartB:PolymerPhysics49(24)1695‐1716(2011) Page27
The values of v for the BPA-ECH/DDS epoxy system investigated by Bero and Plazek58 are
shown in Figure 15. The values are consistently on the order of 41 10 for the epoxy system, which is much smaller than the values that are usually found for thermoplastics,7 which is due to the limited amount of volume relaxation that can occur when the polymer chains have less mobility due to the presence of the crosslinks. The rate of volume relaxation can also be characterized in terms of relaxation functions. For example, Zheng and McKenna77 used the KAHR model (Equation (11)) to describe the volumetric relaxation of epoxy subjected to jumps in relative humidity. Wang et al.78 and Liu et al.79 utilized Equation (8) and the KWW equation (Equation (9)) to characterize free volume relaxation in epoxy using PALS.
THERMODYNAMIC AND PHYSICAL BEHAVIOR OF AGED EPOXIES
Physical aging can have a dramatic influence on the thermodynamic and physical properties of epoxy polymers. In this section, enthalpic relaxation is described, as is the effect of aging on endothermic peak temperature, fictive temperature, crosslink density, and moisture and solvent absorption.
Enthalpy relaxation A large number of studies have been performed on the enthalpy relaxation of epoxies.14-
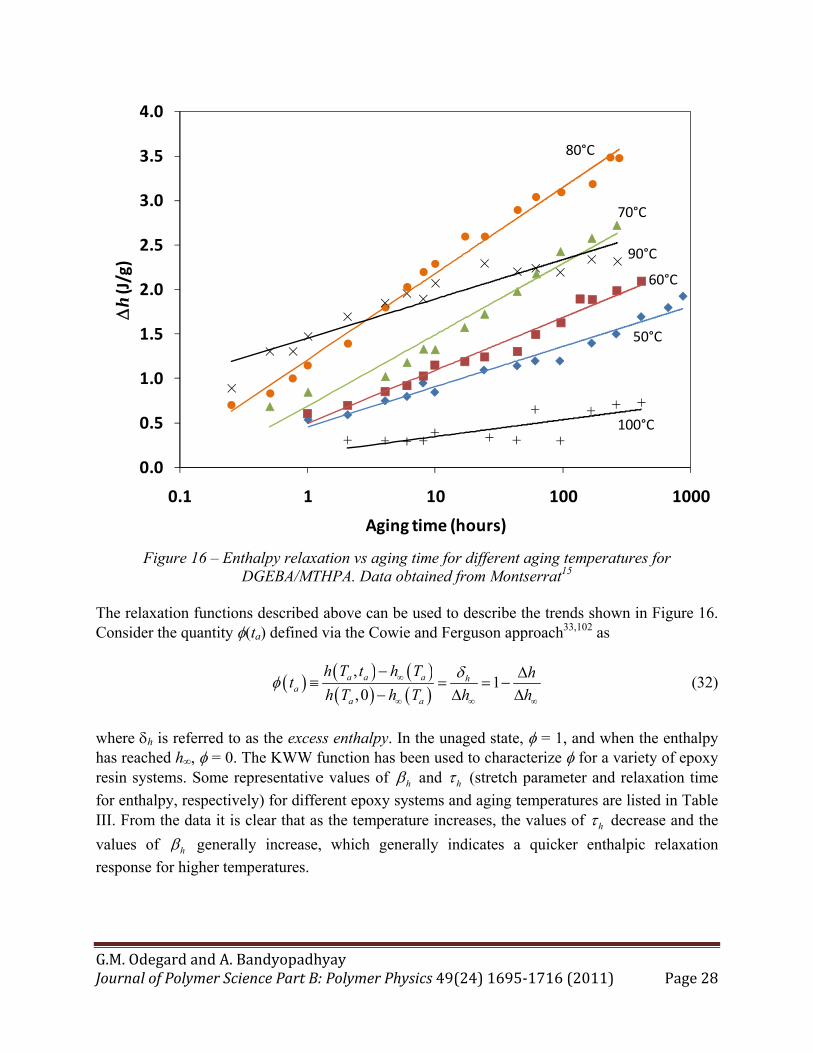
18,25,43,47,52,53,56,72,77-79,81-100 As shown in Figure 5, the enthalpy of a polymer decreases with aging time. The change in enthalpy h with aging time and aging temperature typically follows the trend shown in Figure 16, which is for a DGEBA/MTHPA epoxy system.15 The trend in enthalpy relaxation with aging time is nonlinear, as indicated by the logarithmic trend lines in the figure. Although it can be deduced from Figure 5 that as the aging temperature increases there is generally a decrease in the amount of enthalpy relaxation for a given aging time, this trend is not always consistent.15-18,47,82,91,94 For the epoxy system shown in Figure 16 ( 100 CgT ), the
maximum enthalpy relaxation occurs at Tg - 20°C, and decreases immediately for temperatures above and below this temperature. Similar to Equation (30) for volume relaxation, the slope of the data lines shown in Figure 5 for enthalpy relaxation can be expressed as
logh
a
d h
d t
(31)
This parameter is useful in comparing the enthalpy relaxation of materials for identical aging temperatures with respect to Tg. Montserrat et al.85 reported values of h of 0.56 - 0.72 for
epoxies while Lin et al.14 reported values near 3.0. It has been suggested by Bauwens-Crowet and Bauwens101 that 3h pc , where cp is the specific heat capacity.
G.M.OdegardandA.BandyopadhyayJournalofPolymerSciencePartB:PolymerPhysics49(24)1695‐1716(2011) Page28
Figure 16 – Enthalpy relaxation vs aging time for different aging temperatures for
DGEBA/MTHPA. Data obtained from Montserrat15 The relaxation functions described above can be used to describe the trends shown in Figure 16. Consider the quantity (ta) defined via the Cowie and Ferguson approach33,102 as
,1
,0a a a h
aa a
h T t h T ht
h T h T h h
(32)
where h is referred to as the excess enthalpy. In the unaged state, = 1, and when the enthalpy has reached h∞, = 0. The KWW function has been used to characterize for a variety of epoxy resin systems. Some representative values of h and h (stretch parameter and relaxation time
for enthalpy, respectively) for different epoxy systems and aging temperatures are listed in Table III. From the data it is clear that as the temperature increases, the values of h decrease and the
values of h generally increase, which generally indicates a quicker enthalpic relaxation
response for higher temperatures.
0.0
0.5
1.0
1.5
2.0
2.5
3.0
3.5
4.0
0.1 1 10 100 1000
h(J/g)
Aging time (hours)
50°C
60°C
70°C
80°C
90°C
100°C

G.M.OdegardandA.BandyopadhyayJournalofPolymerSciencePartB:PolymerPhysics49(24)1695‐1716(2011) Page29
Table III - KWW parameters for various epoxy systems
Epoxy system Ta (°C) log τh (hours) βh DGEBA/DDS94 145 5.00 0.37 DGEBA/DDS94 155 3.59 0.40 DGEBA/DDS94 165 1.70 0.42 DGEBA/DDS94 175 0.90 0.51 DGEBA/DDS100 180 1.89 0.26
DGEBA/DDS/PES94 145 4.45 0.21 DGEBA/DDS/PES94 155 1.95 0.28 DGEBA/DDS/PES94 165 1.00 0.41 DGEBA/DDS/PES94 175 0.84 0.73
DGEBA/DDS/PES(20 phr)100 180 1.74 0.36 DGEBA/DDS/PES(30 phr)100 180 1.10 0.52
DGEBA/m-XDA84 60 25.07 ± 0.20 0.10 ± 0.07 DGEBA/m-XDA84 70 15.80 ± 0.10 0.12 ± 0.04 DGEBA/m-XDA84 80 12.98 ± 0.03 0.14 ± 0.02 DGEBA/m-XDA84 90 7.21 ± 0.01 0.16 ± 0.01 DGEBA/MTHPA15 50 19.67 0.18 DGEBA/MTHPA15 60 14.24 0.22 DGEBA/MTHPA15 70 10.09 0.25 DGEBA/MTHPA15 80 5.92 0.28 DGEBA/MTHPA15 90 2.23 0.21
Several studies have addressed fitting the enthalpy relaxation to the Petrie function (Equation (10)).15,18,82,84,91,94 Reported values of the Petrie model parameters for various epoxy systems are listed in Table IV. The data in the table indicates a wide variation on the Petrie model parameters. Montserrat15 used the KAHR model (Equation (11)) to characterize the enthalpy relaxation in a DGEBA/MTHPA epoxy. The corresponding KAHR parameters are θh = 0.89 K-1, xh = 0.20 (nonlinearity parameter for enthalpy relaxation), and r = 41 s. Ramirez et al.,89 Hutchinson et al.,92 Montserrat et al,85,87 and Morancho and Salla97 characterized the enthalpy relaxation with the TNM function (Equation (13)). The corresponding values of the TNM parameters are listed in Table V for various epoxy systems.
Table IV - Petrie parameters for various epoxy systems Epoxy system ln A Eh (kJ/mole) C (g/J)
DGEBA/DDS94 -372 1146 0.2 DGEBA/DDS/PES91 -121 474 0.3 DGEBA/m-XDA84 -242 ± 27 765 ± 83 2.1 ± 0.3
DGEBA/m-XDA/CaCO318 -125 ± 30 380 ± 88 1.2 ± 0.3
DGEBA/m-XDA/PEI82 -48 ± 10 547 ± 102 1.4 ± 0.3 DGEBA/MTHPA15 -333 ± 20 1020 ± 60 2.1 ± 0.1

G.M.OdegardandA.BandyopadhyayJournalofPolymerSciencePartB:PolymerPhysics49(24)1695‐1716(2011) Page30
Table V - TNM parameters for various epoxy systems
Epoxy system Eh/R (kK) xh h DGEBA/1,3-BAC89 152 ± 6 0.47 ± 0.02 0.3
DGEBA/APA97 126 ± 17 0.37 ± 0.04 0.2 < h <0.3 DGEBA/EDA85 124 ± 20 0.25 ± 0.04 0.3
DGEBA/MTHPA (partial cure)92 74 0.41 ± 0.03 0.3 < h < 0.456 DGEBA/MTHPA98 132.3 0.42 ± 0.03 0.5
DGEBA/MTHPA/(reactive diluent)99 100 0.37 ± 0.02 0.3 DGEBA/PPO85 112 ± 10 0.36 ± 0.02 0.3 < h < 0.456 DGEBA/PPO85 97 ± 20 0.47 ± 0.03 0.3 < h < 0.456
The physical interpretation of the TNM parameters is somewhat unclear. Hutchinson et al.92 attempted to provide some physical insight into the parameters by comparing relaxation results of partially cured and fully cured DGEBA/MTHPA epoxies. The resulting TNM parameters are shown in Table V. Because the values of xh are relatively similar for the two systems, it follows that xh is likely related to the chain backbone structure, which is the same in partially and fully cured epoxy systems. On the contrary, the enthalpy activation energy Eh appears to be highly dependent on the degree of cure (crosslink density). Therefore Eh may be a measure of the reduction in molecular mobility of the suprmolecular structure. That is, as the mobility of the molecules decreases (i.e. higher crosslink densities or higher molecular weights in thermoplastics) the activation energy increases. It is important to note that the discrepancies in the enthalpy relaxation parameters shown in Tables III-V can be due to a combination of different laboratory conditions and characterization equipment.98
Endothermic Peak Temperature The endothermic peak temperature is the temperature corresponding to the tip of the endothermic peaks that are observed during DSC scans (Figure 5). The shift in the endothermic peak temperature with aging time has been determined by several authors.15-18,25,72,81,82,85,87-89,92,93 A typical example of this type of data is shown in Figure 17 for a DGEBA/MTHPA epoxy system.15 As the aging time increases, it is clear that the endothermic peak temperature also increases, which is consistent with the trends shown in Figure 5. This trend has been observed in other studies as well.16-18,82,85,87,89,92,93 From Figure 17, it also appears that the endothermic peak temperature generally increases as the isothermal aging temperature increases. Furthermore, it appears that increasing temperature levels result in gradually diminishing increases in the endothermic peak temperature with aging time, as is apparent in the overlap of 70°C, 80°C, 90°C, and 100°C data sets. This is likely because the molecular system is close to its structural equilibrium, as the Tg of this particular epoxy system is around 100°C. A similar trend was observed by Fraga and co-workers17,18,82 and Barral et al.16,72 for other epoxy systems.

G.M.OdegardandA.BandyopadhyayJournalofPolymerSciencePartB:PolymerPhysics49(24)1695‐1716(2011) Page31
Figure 17 – Peak temperature vs aging time for different aging temperatures for
DGEBA/MTHPA. Data obtained from Montserrat15
Fictive Temperature The fictive temperature Tf is the temperature at which the structure of the glass is in equilibrium,12 which, according to Figure 3, is essentially Tg for an unaged glass. As physical aging progresses, Tf decreases. If not measured directly from the specific volume versus temperature curves58 or DSC curves,18,59,75,81,85,87-90,92,93 Tf can be determined from the enthalpy relaxation using15,17,103
f a a gp
hT T ,t T
c
(33)
Montserrat15 used Equation (33) to determine the Tf for a DGEBA/MTHPA epoxy (Tg = 100°C) as a function of Ta and ta (Figure 18). The data in the figure indicates that as the aging time increases, Tf decreases for all six aging temperatures tested. The data also indicates that Tf is sensitive to the aging temperature. In general, Tf decreases as the aging temperature decreases until the aging temperature approaches Tg. The largest decreases in Tf occurred at 80°C. For higher aging temperatures (90°C, 100°C), Tf has an increasing trend. This behavior is likely due
70
75
80
85
90
95
100
105
110
0.1 1 10 100 1000
Endotherm
ic peak temperature (°C)
Aging time (hours)
50°C
60°C
70°C
80°C
90°C
100°C

G.M.OdegardandA.BandyopadhyayJournalofPolymerSciencePartB:PolymerPhysics49(24)1695‐1716(2011) Page32
to inability of the molecular network to relax for temperatures approaching Tg. Similar trends were observed by Plazek and Frund93 and Fraga et al.17
Figure 18 – Fictive temperature vs aging time for different aging temperatures for
DGEBA/MTHPA. Data obtained from Montserrat15
Crosslink Density The primary difference in the molecular structure of thermoplastic and thermosets is the presence of the covalent crosslinks in thermosets. This difference is mostly responsible for the departure typically observed in the bulk aging behavior between these two polymer types. Because the cure cycle of an epoxy can have a dramatic influence on the crosslink density (a.k.a. degree of cure, conversion), it follows that the cure cycle can also have a dramatic influence on behavior of an aging epoxy. As the crosslinking process proceeds, the overall density of the epoxy network increases and the topography of the network becomes irreversibly established. This can ultimately result in significant residual stresses in epoxy-based composite materials and constrained epoxy structures.104-107 Because of the crosslinking, large-scale conformational changes that can occur in the aging of thermoplastics can no longer occur after a significant amount of crosslinking has occurred.
88
90
92
94
96
98
100
1 10 100 1000
Fictive temperature (°C)
Aging time (hours)
50°C
60°C
70°C
80°C
90°C
100°C

G.M.OdegardandA.BandyopadhyayJournalofPolymerSciencePartB:PolymerPhysics49(24)1695‐1716(2011) Page33
Most of the studies cited herein involve a carefully-controlled curing process that maximizes the crosslink density and minimizes the residual stresses. However, some investigators have examined the influence of incomplete cure histories on the thermo-mechanical response of epoxies.108-113 Simon et al.112 demonstrated that a time-conversion superposition principle can be used to successfully predict the development of viscoelastic properties of epoxies during the curing process. Similarly, Adolf and co-workers108-111 developed a method to superpose viscoelastic functions at different extents of cure. Although these studies such as these emphasize the influence of crosslink density on the thermo-mechanical response of epoxies, they did not directly address the influence of aging behavior on crosslink density.
Figure 19 – Relaxation modulus vs time for for DGEBA/PPO systems with two different aging levels (filled markers: 63 minutes, open markers: 2013 minutes) and two different crosslink
densities. Data obtained from Lee and McKenna61 Lee and McKenna61 investigated the applicability of a time-aging time- temperature-conversion superposition principle to describe the influence of crosslink density on the physical aging behavior of epoxy. By comparing the relaxation times of two DGEBA/PPO epoxy systems with different degrees of crosslinking, they showed that for a constant aging time, the relaxation modulus shifted to longer times (shift factor aX) for increasing amounts of crosslinking (Figure
‐0.3
‐0.2
‐0.1
0
0.1
0.2
0.3
0.4
0.1 1 10 100 1000 10000
log
E(t
)(GPa)
Time (s)
ta = 63 minutes
ta = 2013 minutes
aX
aX
aE
aE
Less crosslinkedMore crosslinked

G.M.OdegardandA.BandyopadhyayJournalofPolymerSciencePartB:PolymerPhysics49(24)1695‐1716(2011) Page34
19). Also, it is clear from the data in Figure 19 that as the aging time increases, the shift factor aX also increases. These results demonstrate the large influence of crosslink density on the aging behavior of epoxy.
Figure 20 – Percent weight gain of a TGDDM/DDS epoxy from moisture uptake. Data obtained
from Kong25 The influence of crosslink density on the physical aging of epoxies has also been investigated by several other authors.19,47,56,61,75,92,93,95 In general, the studies demonstrate that as the crosslink density decreases in epoxies, endothermic peak temperatures decrease,47,56,92,95 Tf decreases,59,93 enthalpy relaxation rates increase,92 total relaxation enthalpies increase,47 and the time required to reach structural equilibrium t* decreases.19,61 These observations can be explained by the increased numbers of molecular rearrangements that are available for decreasing levels of crosslinks. Because there are more molecular motions available, the ability of the epoxy to reduce its free volume and conformational enthalpy via relaxation is increased. These trends not only highlight the influence of different levels of crosslinking in epoxies, they also emphasize the difference between the physical aging behavior in thermoplastics and thermosets. In thermoplastics, the molecular structure is can accommodate a relatively large level of molecular conformational changes, whereas in thermosets the topography of the network, which is dictated by the cure cycle, reduces the level of molecular conformational changes that occur during aging. On a related subject, Montserrat et al.15 examined the influence of crosslink length on the
0
1
2
3
4
5
6
1 10 100 1000
Water uptake (w
eight %
)
Absorption time (hours)
0 minutes
10 minutes
100 minutes
1,000 minutes
10,000 minutes
Physical aging time:
G.M.OdegardandA.BandyopadhyayJournalofPolymerSciencePartB:PolymerPhysics49(24)1695‐1716(2011) Page35
physical aging of epoxy using DSC. They observed that as the crosslink lengths decreased, relaxation processes became more cooperative, thus increasing the effects of physical aging.
Moisture and Solvent Absorption The effect of physical aging on the absorptivity characteristics of epoxies have been investigated in a limited number of studies. Liu et al.79 correlated enthalpy relaxation rates to water diffusion coefficients for four different epoxy systems. They generally observed increasing diffusion coefficients for epoxies with increasing enthalpy relaxation rates. The explanation for this trend was that glassy polymers that have more mobility (due to greater free volume) to adjust their segmental conformations to relax at a quicker rate are more accessible for water transportation in the physical aging process. Kong25 measured decreases in moisture content of TGDDM/DDS epoxy systems subjected to increasing levels of physical aging (Figure 20). Similarly, Kong et al.49 reported decreases in solvent (methyl ethyl ketone) absorption for increasing physical aging times. These observations were explained by the reduction in free volume during the physical aging process, which reduced the total amount of volume in the network in which water transportation could occur. From these studies it is clear that the presence of relatively high amounts of free volume results in greater diffusion of fluid species. As the free volume decreases during the physical aging process, the epoxy can hold decreasing amounts of fluid. Initially an epoxy can have a relatively high amount of free volume, which results in a high enthalpy relaxation rate and absorption rate. As the free volume (and thus specific enthalpy) decreases, the enthalpy relaxation rate decreases and the epoxy can hold less fluid in its molecular suprastructure.
INFLUENCE OF MECHANICAL DEFORMATIONS ON PHYSICAL AGING It is clear that the application of stresses on an aging epoxy can have a significant impact on the material response. The influences of applied stresses that are lower and higher than the yield stress on the physical aging state of an epoxy are discussed in this section.
Large sub-yield loads near Tg For applied loads that are relatively large yet less than the yield strength, a considerable amount of debate has surrounded the concept of mechanical rejuvenation,22,24 that is, the erasure of aging due to an applied load. Struik10 initially proposed the concept of mechanical rejuvenation in response to the observed reduction in relaxation times of amorphous glasses subjected to large stresses. This effect was subsequently verified for epoxy.62 Figure 21 shows the response of the aging shift factor for DGEBA/PPO epoxy creep specimens subjected to a range of periodically applied tensile loads. It is clear from the figure that as the applied load increases, the aging shift rate decreases. For results such as this, it was hypothesized by Struik that the large mechanical deformations induced large-scale segmental motion, which, in turn, created more free volume irrespective of the nature of the deformation (tensile, compression, shear, etc.), thus partially erasing the physical aging history of the material. Because Struik defined physical aging strictly in terms of free volume,24 he concluded that the large mechanical deformations caused rejuvenation of the glass.

G.M.OdegardandA.BandyopadhyayJournalofPolymerSciencePartB:PolymerPhysics49(24)1695‐1716(2011) Page36
McKenna and co-workers used a series of careful experiments to demonstrate that large deformations do not necessarily erase prior aging.19,22,23,62,65,114 Lee and McKenna62 demonstrated with tensile creep tests that an epoxy subjected to different levels of stress between 1 and 15 MPa not only has a decreasing value of for increasing values of applied stresses, but
also exhibits a constant value of t (Figure 21). The fact that t does not change with stress level indicates that despite the level of applied stress, the structure reaches equilibrium at a consistent aging time. Therefore, the structural state of the epoxy is not necessarily influenced directly by the applied stress magnitude, and thus Lee and McKenna62 argued that rejuvenation does not occur when large sub-yield stresses are applied.
Figure 21 - Shift factor vs aging time for DGEBA/PPO epoxy with different levels of applied stresses. Data obtained from Lee and McKenna62 McKenna and co-workers also conducted a series of experiments using torsional dilatometry.23 This test configuration allowed for the simultaneous measurement of applied load and volume for different levels of periodically applied shear strain. Figure 22 shows the volumetric relaxation of a DGEBA/PPO epoxy subjected to two different magnitudes of periodic shear strains. Two types of volume recovery are shown in the figure: the recovery associated with physical aging after a quench from above Tg with a nearly zero-valued level of applied shear stress, and the recovery associated with the large applied periodic shear deformations. The data in the figure
0
0.2
0.4
0.6
0.8
1
1.2
1.4
10 100 1000 10000
log
a E
Aging time (min)
t*
1 MPa
5 MPa
10 MPa
15 MPa

G.M.OdegardandA.BandyopadhyayJournalofPolymerSciencePartB:PolymerPhysics49(24)1695‐1716(2011) Page37
indicate that the periodic deformation caused instantaneous increases in volume which always relaxed back to the response observed in the specimen with little applied deformation. Therefore, the magnitude of applied shear deformation had no influence on the underlying volume recovery of epoxy, thus no influence on the state of the physical aging. It was speculated by Lee and McKenna62 that the observed change in is due to changes in structure accompanying volume recovery that affect the nonlinear viscoelastic response for different stress levels. Waldron et al.114 used a nonlinear viscoelastic constitutive law to show that most of the behavior attributed to mechanical rejuvenation of epoxies subjected to sub-yield stresses is most likely due to memory effects in nonlinear viscoelastic materials rather than to a strong interaction between large loads and the thermodynamic state of the epoxy. Changes in that are similar to those observed by Lee and McKenna62 have been observed in molecular simulations of simple glass systems at sub-yield stress loadings.115 The corresponding authors commented that the decrease in μ is due to mechanical rejuvenation, contrary to the above-described interpretation by Lee and McKenna.62
Figure 22 - Volume recovery for DGEBA/PPO epoxy with two different levels of applied shear
strain. Data obtained from Santore et al.23 A broad definition of physical aging and rejuvenation can be used to interpret the type of results presented here. Whereas Struik defined physical aging and rejuvenation strictly in terms of free
‐6E‐4
‐4E‐4
‐2E‐4
‐1E‐18
2E‐4
4E‐4
1E+3 1E+4 1E+5 1E+6
V/V
0
Time (s)
Applied shear strain = 0.25%
Applied shear strain = 3%
G.M.OdegardandA.BandyopadhyayJournalofPolymerSciencePartB:PolymerPhysics49(24)1695‐1716(2011) Page38
volume,24 McKenna put forth a broader definition of rejuvenation by stating that rejuvenation “pushes the glass towards the more freshly quenched state or erases the prior aging”.22 Oyanguren et al.42 defined rejuvenation as “an increase in the specific enthalpy and a corresponding increase in the specific volume of the glass”. The latter two definitions do not limit the structural changes associated with physical aging and rejuvenation to be associated with free-volume only. This definition opens up the possibility of other physical mechanisms to contribute to these observed behaviors. Specifically, constant-volume conformational changes (discussed above) can relax the specific enthalpy of a glass and yet have no bearing on the observed specific volume. Therefore, the structural state of a glass can still be driven towards equilibrium (or at least kept at a constant-enthalpy state) even if temporary or long-term changes to the specific volume (induced by large sub-yield deformations) are applied. This explanation could partly justify the observed behavior of glasses when subjected to large sub-yield loads. Oyanguren et al.42 showed that large sub-yield compressive loads did not eliminate the characteristic enthothermic enthalpy peak in DSC measurements of epoxy, thus indicating that the underlying molecular structure was not significantly influenced by the loads. It is important to note that some authors116-118 have reported the appearance of overaging of glasses, that is, the accelerated physical aging of a glass at very small applied mechanical loads. Similarly, the concept of implosion has been observed by Colucci et al.119 for polycarbonates in which the aging is accelerated by large sub-yield deformations. Because there are no reported observations of these behaviors for epoxy systems, they will not be discussed further in this review.
Post-yield loads
While there is some debate over mechanical rejuvenation at sub-yield loads in epoxies, there is also debate over apparent mechanical rejuvenation with post-yield loads. Several studies have shown evidence of mechanical rejuvenation in the post-yield regime. Oyanguren et al.42 aged two different epoxy resins and demonstrated that the characteristic endothermic enthalpy relaxation peak was erased after subjecting the epoxies to compressive loads at the yield point. The apparent rejuvenation was accompanied by an increase in specific volume, indicating a possible increase in the amount of free volume in the epoxies when loaded mechanically. The authors argued that these observations indicated a clear case of mechanical rejuvenation in the thermodynamic sense. Kawakami et al.54 reported decreases in the time for stress relaxation when large shear strains (4%) were applied to torsional test specimens, indicating a reversal of the typical aging response. Using molecular models of a simplified binary glass, Utz et al.120 simulated the reversal of aging under the application of post-yield loads. Although these studies demonstrate an apparent mechanical rejuvenation at post-yield applied loads, McKenna22 speculated that even though it is possible that mechanical rejuvenation is occurring under these conditions, it is more likely that the observed material response is actually due to a phase transformation induced by yield. This conclusion was supported by Kawakami et al.,55 who speculated that post-yield stresses induced a structural change in an epoxy material subjected to different levels of shear. Furthermore, this conclusion was reinforced by molecular simulations of simple glass systems by Lacks and co-workers.121,122 They observed that the states produced by mechanical deformations resemble the states of less-aged systems, however, they

G.M.OdegardandA.BandyopadhyayJournalofPolymerSciencePartB:PolymerPhysics49(24)1695‐1716(2011) Page39
are not identical with those states. Therefore, they concluded that mechanical deformations do not induce a direct rejuvenation of the material for post-yield loads.
EPOXY-BASED COMPOSITES
The majority of the studies cited in this review cover neat epoxy resins. There have been numerous studies on the physical aging of epoxy composites, epoxy copolymers, and rubber-modified epoxies. The results of these studies are summarized in this section.
Epoxy Composites
The primary structural application of epoxies is in fiber-reinforced composites. The long fiber geometry provides for an exceptional amount of load transfer from the relatively brittle epoxy matrix to the stiff and strong reinforcement. Because it is imperative that this load transfer be maintained during the service life of a composite component, there is considerable interest in physical aging of these materials. Several studies have been conducted on the physical aging of fiberous epoxy composites.25,44,45,49,86,123,124 In general, these studies indicate that the composite material response to physical aging is very similar to the corresponding response of neat epoxy resin. The presence of glass or carbon fibers has little influence on the physical aging characteristics. It is also clear that physical aging has little influence on the strength of the fiber/epoxy interface,124 which indicates that physical aging does not alter the load-transfer characteristics of fiber-reinforced composites. Particle-reinforced composites are a cost-effective alternative to fiber-reinforced composites. They are usually easier to manufacture, however, they usually do not have the same magnitude of stiffness and strength enhancement that fiber composites have. A very limited number of studies have examined the influence of particle reinforcement on physical aging characteristics in epoxy composites. Lu and Nutt90 use DSC analysis to demonstrate that relative to neat resin epoxies, organically modified layered silicate epoxy nanocomposites exhibit slower overall enthalpy relaxation rates and broader distributions of relaxation times. The interaction of the polymer molecules with the silicate layers was given as an explanation to the slowed relaxation. Fraga et al.18 compared the DSC response of epoxy systems with and without CaCO3 filler. They observed very subtle differences between the filled and non-filled systems.
Epoxy Copolymers and Rubber Toughening
Epoxies are often modified through the addition of small, soft second-phase particles or molecular groups. This blending of epoxies can lead to a range of more desirable properties, such as the improvement of fracture toughness with the addition of small rubber/thermoplastic particles and the improvement of composite processability with the addition of reactive diluents. Numerous studies have focused on the physical aging of epoxy blends, specifically epoxies blended with carboxyl-terminated butadiene acrylonitrile copolymers (CTBN),49,50,53,63,95,97 acrylonitrile butadiene styrene copolymer (ABS),88 poly(ether sulfone) (PES),83,91,94,100 amine-terminated polypropylene oxide (PPO),49 diaminotetrafunctional (PSX),49 polyetherimide (PEI),82 and aliphatic diglycidyl ether.99

G.M.OdegardandA.BandyopadhyayJournalofPolymerSciencePartB:PolymerPhysics49(24)1695‐1716(2011) Page40
The results of these studies differ dramatically for different copolymers. For example, whereas Morancho and Salla,97 Ramirez et al.,88 and Cortes et al.99 demonstrated that epoxy resins blended with various modifiers exhibited decreased activation energies h with respect to the pure epoxy; Fraga et al.82 reported increases in Eh with the addition of PEI to epoxy. Fraga et al.82 reported a decrease in the endothermic peak temperature with PEI addition, Ophir53 reported no change with CTBN addition, and Morancho and Salla95 reported an increase with CTBN addition. These differences in observed behaviors demonstrate the high sensitivity of the physical aging response of blended epoxies to the specific molecular interactions that occur for each type of copolymer and the conditions under which they are combined. In fact, several studies49,53,83,91,94 have concluded that when phase separation occurs in an epoxy blend the enthalpy will recover in a very similar manner to the pure epoxy resin. When there is little phase separation the enthalpy recovers in a different manner relative to the pure epoxy resin. Although it seem intuitive that the presence of the purely elastic rubber would not influence the viscoelastic response of the epoxy, Lee and McKenna63 found that rubber-toughened epoxies do not exhibit the time-aging time superposition for stress relaxation, even though they do exhibit the superposition for creep. Although the authors could not provide a definite physical explanation for this behavior, they did provide numerous possible explanations.
MULTISCALE MODELING OF PHYSICALLY-AGED EPOXIES Despite the large body of research conducted on the experimental characterization of physical aging in epoxy materials and composites, there have been relatively few studies conducted on the modeling of physical aging. Several studies have been performed on the molecular-level modeling of simplified glassy molecular structures.115-118,120,122,125,126 Although these molecular simulations did not directly simulate the specific molecular structure of epoxy, they have provided insight into the molecular-level behavior of glassy materials in general when subjected to physical aging. Also of interest are two continuum-level models that have been applied specifically to epoxy-based materials. Leveque et al.45 constructed a multiscale modeling technique to predict the time-dependent mechanical response of polymer composites. The model was characterized using data obtained from experiments on carbon fiber/epoxy composites. On the lowest length scale (micro-level), the local stresses are determined using transformation field analysis,127 which incorporates local geometry and global-level stresses. As a result, the behavior of the constituent materials (nonlinear viscoelastic matrix and elastic fiber reinforcement), which are local-stress dependent, can be directly determined. Once the properties of the constituent materials are known, then the response of a composite ply are determined via standard micromechanical techniques.128 The mechanical properties of the ply were then used to determine the overall behavior of the composite panel via laminated plate theory.128 The model was subsequently used to predict the strains in creep deformations for 4
45s
laminates. The predictions were compared to
experimental results, and excellent agreement was observed. Drozdov129 developed a continuum-based modeling technique to establish constitutive relations for the linear viscoelastic response and physical aging of polymers. The model is based on the

G.M.OdegardandA.BandyopadhyayJournalofPolymerSciencePartB:PolymerPhysics49(24)1695‐1716(2011) Page41
theory of cooperative relaxation in which spatial regions in the polymer are allowed to rearrange individually.130 As a result, the model is capable of predicting the stress-strain response of the polymer and the changes in Tf. The approach was applied to model the uniaxial deformation of epoxy, and fair agreement was demonstrated with experimental data.
CHEMICAL AND HYDROTHERMAL AGING In addition to the physical aging studies performed on epoxies that are described herein, there have been numerous studies on the chemical and hydrothermal aging of epoxies.1,2,45,46,60,66,69,77,86,131-133 An review of chemical and hydrothermal aging of thermosets in general has been given by Gates.134 Although this review is focused on the physical aging of epoxies, as a comprehensive review of chemical and hydrothermal aging in epoxies would require another full-length review, it is important to briefly discuss the basic molecular mechanisms that occur with these types of aging to emphasise their importance in the development and design of epoxies for engineerign applications. Exposure of epoxies to elevated temperatures well above Tg and in oxygen-rich environments often results in thermo-oxidative degradation of the epoxy. That is, the chemical structure of the crosslinked epoxy structure is broken down during exposure partly due to the reaction of O2 molecules with the carbon-based polymer structure. The thermo-oxidative degradation results in four primary observables: First, the initial weight loss of polymers during exposure is mostly due to loss of moisture and residual volatiles. However, after many hours of exposure, the sample weight stabilizes and any additional weight loss is indicative of the production of gaseous by-products. Second, observable changes in color, surface texture, and crack density can be indicators of thermo-oxidative degradation. Third, increases in Tg are frequently observed during thermo-oxidative aging and are due in part to further network crosslinking. Finally, increases in fracture toughness are often observed for prolonged thermo-oxidative exposures due to the chain degradation, which effectively plasticizes the resin, that is, evenly distributes the flaw sites within the material so that a greater volume of material can absorb energy. Similar observations are usually made for thermosets exposed to elevated temperatures in the absence of oxygen, however, the magnitude of the changes is reduced for a given exposure time. Hydrothermal aging in polymers is due to the diffusion of water into the resin leading to possible plasticization of the network. There are three observables associated with this type of aging. First, a significant weight gain due to moisture uptake is observed that is proportional to the relative humidity. Second, increases in microcrack density may be observed with increasing cyclic exposures. Third, changes in fracture toughness and increases in internal stresses are often observed with prolonged hydrothermal aging.
SUMMARY This review has discussed the background and fundamental concepts associated with the physical aging of epoxy resins and epoxy composites. From the numerous studies that have been reviewed herein, it is clear that physical aging involves the simultaneous reduction of free volume and conformational changes of the crosslinked molecular structure when exposed to sub-Tg temperatures for extended periods of time. The changes in the molecular structure result in
G.M.OdegardandA.BandyopadhyayJournalofPolymerSciencePartB:PolymerPhysics49(24)1695‐1716(2011) Page42
bulk-level responses of epoxies. Specifically; mechanical, thermodynamic, and physical properties of epoxies are influenced in a manner that significantly alters the overall response of these materials.
ACKNOWLEDGEMENTS The authors gratefully acknowledge NASA under the Aircraft Aging and Durability Project (Grant NNX07AU58A) and the Air Force Office of Scientific Research under the Low Density Materials Program (Grant FA9550-09-1-0375). The authors would also like to thank Greg McKenna for his helpful insight and Tom Gates for inspiring our interest in the subject. References 1. Tian, W. D.; Hodgkin, J. Journal of Applied Polymer Science 2010, 115, 2981-2985. 2. Dao, B.; Hodgkin, J.; Krstina, J.; Mardel, J.; Tian, W. Journal of Applied Polymer Science
2010, 115, 901-910. 3. Kumosa, M. Key Engineering Materials 2006, 324, 663-666. 4. Martin, R., Ed. Ageing of Composites; Woodhead Publishing Limited: Cambridge, UK, 2008. 5. Bauwens, J. C. In Failure of Plastics; Brostow, W.; Corneliussen, R. D., Eds.; Hanser
Publishers: New York, 1986. 6. Henkel, M.; Pleimling, M.; Sanctuary, R., Eds. Ageing and the Glass Transition; Springer:
New York, 2007. 7. Hutchinson, J. M. Progress in Polymer Science 1995, 20, 703-760. 8. Hutchinson, J. M. In Physics of Glassy Polymers; Haward, R. N.; Young, R. J., Eds.;
Chapman & Hall: New York, 1997. 9. McKenna, G. B. Computational Materials Science 1995, 4, 349-360. 10. Struik, L. C. E. Physical Aging in Amorphous Polymers and Other Materials; Elsevier: New
York, 1978. 11. Struik, L. C. E. In Failure of Plastics; Brostow, W.; Corneliussen, R. D., Eds.; Hanser
Publishers: New York, 1986. 12. Tool, A. Q. Journal of the American Chemical Society 1946, 29, 240-253. 13. Brinson, L. C.; Gates, T. S. International Journal of Solids and Structures 1995, 32, 827-846. 14. Lin, Y. G.; Sautereau, H.; Pascault, J. P. Journal of Applied Polymer Science 1986, 32, 4595-
4605. 15. Montserrat, S. Journal of Polymer Science Part B-Polymer Physics 1994, 32, 509-522. 16. Barral, L.; Cano, J.; Lopez, J.; Lopez-Bueno, I.; Nogueira, P.; Abad, M. J.; Ramirez, C.
European Polymer Journal 1999, 35, 403-411. 17. Fraga, F.; Castro-Diaz, C.; Rodriguez-Nunez, E.; Martinez-Ageitos, J. M. Polymer 2003, 44,
5779-5784. 18. Fraga, F.; Lopez, M.; Tellini, V. H. S.; Rodriguez-Nunez, E.; Martinez-Ageitos, J. M.;
Miragaya, J. Journal of Applied Polymer Science 2009, 113, 2456-2461. 19. Lee, A.; McKenna, G. B. Polymer Engineering and Science 1990, 30, 431-435. 20. Lee, J. K.; Hwang, J. Y. Polymer Journal 2003, 35, 191-196. 21. Lee, J. K.; Hwang, J. Y.; Gillham, J. K. Journal of Applied Polymer Science 2001, 81, 396-
404. 22. McKenna, G. B. Journal of Physics-Condensed Matter 2003, 15, S737-S763.

G.M.OdegardandA.BandyopadhyayJournalofPolymerSciencePartB:PolymerPhysics49(24)1695‐1716(2011) Page43
23. Santore, M. M.; Duran, R. S.; McKenna, G. B. Polymer 1991, 32, 2377-2381. 24. Struik, L. C. E. Polymer 1997, 38, 4053-4057. 25. Kong, E. S. W. Advances in Polymer Science 1986, 80, 125-171. 26. Maddox, S. L.; Gillham, J. K. Journal of Applied Polymer Science 1997, 64, 55-67. 27. Wisanrakkit, G.; Gillham, J. K. Journal of Applied Polymer Science 1991, 42, 2465-2481. 28. Cowie, J. M. G.; Ferguson, R. Polymer Communications 1986, 27, 258-260. 29. McKenna, G. B. In Comprehensive Polymer Science 2; Booth, C.; Price, C., Eds.; Pergamon:
Oxford, UK, 1989. 30. Kovacs, A. J. Advances in polymer science 1963, 3, 394-507. 31. Ramos, A. R.; Hutchinson, J. M.; Kovacs, A. J. Journal of Polymer Science Part B-Polymer
Physics 1984, 22, 1655-1696. 32. Kovacs, A. J.; Hutchinson, J. M. Journal of Polymer Science Part B-Polymer Physics 1979,
17, 2031-2058. 33. Cowie, J. M. G.; Ferguson, R. Macromolecules 1989, 22, 2312-2317. 34. Kohlrausch, R. Poggendorf's Ann. Phys 1954, 91, 179-214. 35. Williams, G.; Watts, D. C. Transactions of the Faraday Society 1970, 66, 80-85. 36. Petrie, S. E. B. Journal of Polymer Science Part A-2: Polymer Physics 1972, 10, 1255-1272. 37. Kovacs, A. J.; Aklonis, J. J.; Hutchinson, J. M.; Ramos, A. R. Journal of Polymer Science
Part B-Polymer Physics 1979, 17, 1097-1162. 38. Moynihan, C. T.; Easteal, A. J.; Debolt, M. A.; Tucker, J. Journal of the American Ceramic
Society 1976, 59, 12-16. 39. Tool, A. Q. Journal of the American Ceramic Society 1946, 29, 240-253. 40. Narayanaswamy, O. S. Journal of the American Ceramic Society 1971, 54, 491-498. 41. McKenna, G. B.; Simon, S. L. In Handbook of Thermal Analysis and Calorimetry; Cheng, S.
Z. D., Ed.; Elsevier Science: Amsterdam, 2002. 42. Oyanguren, P. A.; Vallo, C. I.; Frontini, P. M.; Williams, R. J. J. Polymer 1994, 35, 5279-
5282. 43. Chang, T. D.; Brittain, J. O. Polymer Engineering and Science 1982, 22, 1221-1227. 44. Hu, H. W. Journal of Mechanics 2007, 23, 245-252. 45. Leveque, D.; Schieffer, A.; Mavel, A.; Maire, J. F. Composites Science and Technology
2005, 65, 395-401. 46. Shi, X. D.; Fernando, B. M. D.; Croll, S. G. Journal of Coatings Technology and Research
2008, 5, 299-309. 47. Cook, W. D.; Mehrabi, M.; Edward, G. H. Polymer 1999, 40, 1209-1218. 48. G'Sell, C.; McKenna, G. B. Polymer 1992, 33, 2103-2113. 49. Kong, E. S. W.; Wilkes, G. L.; McGrath, J. E.; Banthia, A. K.; Mohajer, Y.; Tant, M. R.
Polymer Engineering and Science 1981, 21, 943-950. 50. Truong, V. T.; Ennis, B. C. Polymer Engineering and Science 1991, 31, 548-557. 51. Aboulfaraj, M.; Gsell, C.; Mangelinck, D.; McKenna, G. B. Journal of Non-Crystalline
Solids 1994, 172, 615-621. 52. Ophir, Z.; Emerson, J. A.; Wilkes, G. L. Bulletin of the American Physical Society 1978, 23,
371-371. 53. Ophir, Z. H.; Emerson, J. A.; Wilkes, G. L. Journal of Applied Physics 1978, 49, 5032-5038. 54. Kawakami, H.; Otsuki, R.; Nanzai, Y. Polymer Engineering and Science 2005, 45, 20-24. 55. Kawakami, H.; Souda, K.; Nanzai, Y. Polymer Engineering and Science 2006, 46, 630-634. 56. Kawakami, H.; Watanabe, M. Journal of Applied Polymer Science 2008, 107, 2095-2100.

G.M.OdegardandA.BandyopadhyayJournalofPolymerSciencePartB:PolymerPhysics49(24)1695‐1716(2011) Page44
57. Chang, T. D.; Brittain, J. O. Polymer Engineering and Science 1982, 22, 1228-1236. 58. Bero, C. A.; Plazek, D. J. Journal of Polymer Science Part B-Polymer Physics 1991, 29, 39-
47. 59. Choy, I. C.; Plazek, D. J. Journal of Polymer Science Part B-Polymer Physics 1986, 24,
1303-1320. 60. Croll, S. G.; Shi, X.; Femando, B. M. D. Progress in Organic Coatings 2008, 61, 136-144. 61. Lee, A.; McKenna, G. B. Polymer 1988, 29, 1812-1817. 62. Lee, A.; McKenna, G. B. Polymer 1990, 31, 423-430. 63. Lee, A.; McKenna, G. B. Journal of Polymer Science Part B-Polymer Physics 1997, 35,
1167-1174. 64. McKenna, G. B.; Leterrier, Y.; Schultheisz, C. R. Polymer Engineering and Science 1995,
35, 403-410. 65. McKenna, G. B.; Santore, M. M.; Lee, A.; Duran, R. S. Journal of Non-Crystalline Solids
1991, 131, 497-504. 66. Alcoutlabi, M.; Briatico-Vangosa, F.; McKenna, G. B. Journal of Polymer Science Part B-
Polymer Physics 2002, 40, 2050-2064. 67. Miyano, Y.; Nakada, M.; Kasamori, M.; Muki, R. Mechanics of Time-Dependent Materials
2000, 4, 9-20. 68. Vleeshouwers, S.; Jamieson, A. M.; Simha, R. Polymer Engineering and Science 1989, 29,
662-670. 69. Zheng, Y.; Priestley, R. D.; McKenna, G. B. Journal of Polymer Science Part B-Polymer
Physics 2004, 42, 2107-2121. 70. Malvern, L. E. Introduction to the Mechanics of a Continuous Medium; Prentice-Hall, Inc.:
Upper Saddle River, NJ, 1969. 71. Ferry, J. D. Viscoelastic Properties of Polymers; John Wiley & Sons, Inc: New York, 1980. 72. Barral, L.; Cano, J.; Lopez, J.; Lopez-Bueno, I.; Nogueira, P.; Abad, M. J.; Ramirez, C.
Journal of Thermal Analysis and Calorimetry 2000, 60, 391-399. 73. Enns, J. B.; Gillham, J. K. In Polymer Characterization: Spectroscopic, Chromatographic,
and Physical Instrumental Methods; Craver, C. D., Ed.; American Chemical Society: Washington, D.C., 1983, p 27-63.
74. Pang, K. P.; Gillham, J. K. Journal of Applied Polymer Science 1989, 38, 2115-2130. 75. Plazek, D. J.; Choy, I. C. Journal of Polymer Science Part B-Polymer Physics 1989, 27, 307-
324. 76. Duran, R. S.; McKenna, G. B. Journal of Rheology 1990, 34, 813-839. 77. Zheng, Y.; McKenna, G. B. Macromolecules 2003, 36, 2387-2396. 78. Wang, B.; Gong, W.; Liu, W. H.; Wang, Z. F.; Qi, N.; Li, X. W.; Liu, M. J.; Li, S. J. Polymer
2003, 44, 4047-4052. 79. Liu, M. J.; Ding, Y. F.; Wang, M. H.; Li, S. J.; Liu, W. H.; Wang, B. Journal of Polymer
Science Part B-Polymer Physics 2003, 41, 1135-1142. 80. Shmorhun, M.; Jamieson, A. M.; Simha, R. Polymer 1990, 31, 812-817. 81. Fraga, F.; Castro-Diaz, C.; Rodriguez-Nunez, E.; Martinez-Ageitos, J. M. Journal of Applied
Polymer Science 2005, 98, 2003-2008. 82. Fraga, F.; Payo, P.; Rodriguez-Nunez, E.; Martinez-Ageitos, J. M.; Castro-Diaz, C. Journal
of Applied Polymer Science 2007, 103, 3931-3935. 83. Yu, T. L.; Chen, Y. S. Journal of Polymer Research-Taiwan 2000, 7, 257-266.

G.M.OdegardandA.BandyopadhyayJournalofPolymerSciencePartB:PolymerPhysics49(24)1695‐1716(2011) Page45
84. Fraga, F.; Castro-Diaz, C.; Rodriguez-Nunez, E.; Martinez-Ageitos, J. M. Journal of Applied Polymer Science 2005, 96, 1591-1595.
85. Montserrat, S.; Cortes, P.; Calventus, Y.; Hutchinson, J. M. Journal of Polymer Science Part B-Polymer Physics 2000, 38, 456-468.
86. Stocchi, A.; Pellicano, A.; Rossi, J. P.; Bernal, C.; Montemartini, P. Composite Interfaces 2006, 13, 685-697.
87. Montserrat, S.; Calventus, Y.; Hutchinson, J. M. Progress in Organic Coatings 2006, 55, 35-42.
88. Ramirez, C.; Abad, M. J.; Barral, L.; Cano, J.; Diez, F. J.; Lopez, J. Journal of Thermal Analysis and Calorimetry 2002, 70, 85-92.
89. Ramirez, C.; Abad, M. J.; Cano, J.; Lopez, J.; Nogueira, P.; Barral, L. Colloid and Polymer Science 2001, 279, 184-189.
90. Lu, H. B.; Nutt, S. Macromolecules 2003, 36, 4010-4016. 91. Jong, S. R.; Yu, T. L. Macromolecular Chemistry and Physics 1999, 200, 87-94. 92. Hutchinson, J. M.; McCarthy, D.; Montserrat, S.; Cortes, P. Journal of Polymer Science Part
B-Polymer Physics 1996, 34, 229-239. 93. Plazek, D. J.; Frund, Z. N. Journal of Polymer Science Part B: Polymer Physics 1990, 28,
431-448. 94. Jong, S. R.; Yu, T. L. Journal of Polymer Science Part B-Polymer Physics 1997, 35, 69-83. 95. Morancho, J. M.; Salla, J. M. Polymer 1999, 40, 2821-2828. 96. Tarifa, S.; Bouazizi, A. Journal of Thermal Analysis 1997, 48, 297-307. 97. Morancho, J. M.; Salla, J. M. Journal of Non-Crystalline Solids 1998, 235, 596-599. 98. Montserrat, S.; Cortes, P.; Pappin, A. J.; Quah, K. H.; Hutchinson, J. M. Journal of Non-
Crystalline Solids 1994, 172, 1017-1022. 99. Cortes, P.; Montserrat, S.; Hutchinson, J. M. Journal of Applied Polymer Science 1997, 63,
17-25. 100. Breach, C. D.; Folkes, M. J.; Barton, J. M. Polymer 1992, 33, 3080-3082. 101. Bauwenscrowet, C.; Bauwens, J. C. Polymer 1982, 23, 1599-1604. 102. Cowie, J. M. G.; Ferguson, R. Macromolecules 1989, 22, 2307-2312. 103. Perez, J.; Cavaille, J. Y.; Calleja, R. D.; Ribelles, J. L. G.; Pradas, M. M.; Greus, A. R.
Makromolekulare Chemie-Macromolecular Chemistry and Physics 1991, 192, 2141-2161.
104. Alcoutlabi, M.; McKenna, G. B. Journal of Physics-Condensed Matter 2005, 17, R461-R524.
105. Merzlyakov, M.; McKenna, G. B.; Simon, S. L. Composites Part a-Applied Science and Manufacturing 2006, 37, 585-591.
106. Prasatya, P.; McKenna, G. B.; Simon, S. L. Journal of Composite Materials 2001, 35, 826-848.
107. Alcoutlabi, M.; McKenna, G. B.; Simon, S. L. Journal of Applied Polymer Science 2003, 88, 227-244.
108. Adolf, D.; Chambers, R. Polymer 1997, 38, 5481-5490. 109. Adolf, D.; Martin, J. E. Macromolecules 1990, 23, 3700-3704. 110. Adolf, D. B.; Martin, J. E.; Chambers, R. S.; Burchett, S. N.; Guess, T. R. Journal of
Materials Research 1998, 13, 530-550. 111. Martin, J. E.; Adolf, D.; Wilcoxon, J. P. Physical Review Letters 1988, 61, 2620-2623.

G.M.OdegardandA.BandyopadhyayJournalofPolymerSciencePartB:PolymerPhysics49(24)1695‐1716(2011) Page46
112. Simon, S. L.; McKenna, G. B.; Sindt, O. Journal of Applied Polymer Science 2000, 76, 495-508.
113. Enns, J. B.; Gillham, J. K. Journal of Applied Polymer Science 1983, 28, 2831-2846. 114. Waldron, W. K.; McKenna, G. B.; Santore, M. M. Journal of Rheology 1995, 39, 471-497. 115. Warren, M.; Rottler, J. Physical Review E 2007, 76, 031802. 116. Rottler, J.; Robbins, M. O. Physical Review Letters 2005, 95, 255504. 117. Rottler, J.; Warren, M. European Physical Journal-Special Topics 2008, 161, 55-63. 118. Warren, M.; Rottler, J. Physical Review E 2008, 78, 041502. 119. Colucci, D. M.; OConnell, P. A.; McKenna, G. B. Polymer Engineering and Science 1997,
37, 1469-1474. 120. Utz, M.; Debenedetti, P. G.; Stillinger, F. H. Physical Review Letters 2000, 84, 1471-1474. 121. Isner, B. A.; Lacks, D. J. Physical Review Letters 2006, 96, 025506. 122. Lacks, D. J.; Osborne, M. J. Physical Review Letters 2004, 93, 255501. 123. Issoupov, V.; Demont, P.; Lacabanne, C.; Startsev, O. V.; Viel, V.; Dinguirard, M. Journal
of Applied Polymer Science 2002, 85, 342-350. 124. Mendels, D. A.; Leterrier, Y.; Manson, J. A. E.; Nairn, J. A. Journal of Composite Materials
2002, 36, 1655-1676. 125. Warren, M.; Rottler, J. Epl 2009, 88, 5. 126. Chen, K.; Schweizer, K. S. Physical Review Letters 2007, 98, 4. 127. Dvorak, G. Proceedings of the Royal Society of London Series a-Mathematical Physical
and Engineering Sciences 1992, 437, 311-327. 128. Herakovich, C. T. Mechanics of Fibrous Composites; John Wiley & Sons, Inc.: New York,
1998. 129. Drozdov, A. D. Modelling and Simulation in Materials Science and Engineering 1999, 7,
1045-1060. 130. Adam, G.; Gibbs, J. H. Journal of Chemical Physics 1965, 43, 139-146. 131. Dao, B.; Hodgkin, J.; Krstina, J.; Mardel, J.; Tian, W. Journal of Applied Polymer Science
2006, 102, 4291-4303. 132. Dao, B.; Hodgkin, J.; Krstina, J.; Mardel, J.; Tian, W. Journal of Applied Polymer Science
2006, 102, 3221-3232. 133. Dao, B.; Hodgkin, J. H.; Krstina, J.; Mardel, J.; Tian, W. Journal of Applied Polymer
Science 2007, 106, 4264-4276. 134. Gates, T. S. In Ageing of Composites; Martin, R., Ed.; Woodhead Publishing Limited:
Cambridge, England, 2008.