phylogeography of the human mitochondrial haplogroup l3e ... · (including cabo verde). we propose...
TRANSCRIPT

Ann. Hum. Genet. (2001), 65, 549–563 ' University College London
DOI: 10.1017}S0003480001008892 Printed in the United Kingdom
549
Phylogeography of the human mitochondrial haplogroup L3e: a snapshot of
African prehistory and Atlantic slave trade
H.-J. BANDELT", J. ALVES-SILVA#, P. E. M. GUIMARAN ES#, M. S. SANTOS#, A. BREHM$,
L. PEREIRA%,&, A. COPPA', J. M. LARRUGA(, C. RENGO),*, R. SCOZZARI),
A. TORRONI),"!, M. J. PRATA%,&, A. AMORIM%,&, V. F. PRADO# S. D. J. PENA#
"Fachbereich Mathematik, UniversitaX t Hamburg, 20146 Hamburg, Germany#Departamento de BioquıUmica e Imunologia, Universidade Federal de Minas Gerais, Belo Horizonte-
MG, Brazil 30161-970$Centro de CieW ncias BioloU gicas e GeoloU gicas, Universidade da Madeira, 9000 Funchal, Portugal
% IPATIMUP (Instituto de Patologia e Imunologia Molecular da Universidade do Porto), 4200 Porto,
Portugal&Faculdade de CieW ncias da Universidade do Porto, 4099-002 Porto, Portugal
'Dipartimento di Biologia Animale e dell’Uomo, Universita[ ‘La Sapienza’, 00185 Roma, Italy(Departamento de GeneU tica, Universidad de La Laguna, 38271 La Laguna, Tenerife, Spain
)Dipartimento di Genetica e Biologia Molecolare, Universita[ ‘La Sapienza’, 00185 Roma, Italy* Istituto di Medicina Legale, Universita[ Cattolica del Sacro Cuore, 00168 Roma, Italy"!Dipartimento di Genetica e Microbiologia, Universita[ di Pavia, 27100 Pavia, Italy
(Received 11.5.01. Accepted 31.8.01)
The mtDNA haplogroup L3e, which is identified by the restriction site 2349 MboI within the
Afro-Eurasian superhaplogroup L3 (®3592 HpaI), is omnipresent in Africa but virtually absent in
Eurasia (except for neighbouring areas with limited genetic exchange). L3e was hitherto poorly
characterised in terms of HVS-I motifs, as the ancestral HVS-I type of L3e cannot be distinguished
from the putative HVS-I ancestor of the entire L3 (differing from the CRS by a transition at np
16223). An MboI screening at np 2349 of a large number of Brazilian and Caribbean mtDNAs
(encompassing numerous mtDNAs of African ancestry), now reveals that L3e is subdivided into four
principal clades, each characterised by a single mutation in HVS-I, with additional support coming
from HVS-II and partial RFLP analysis. The apparently oldest of these clades (transition at np
16327) occurs mainly in central Africa and was probably carried to southern Africa with the Bantu
expansion(s). The most frequent clade (transition at np 16320) testifies to a pronounced expansion
event in the mid-Holocene and seems to be prominent in many Bantu groups from all of Africa. In
contrast, one clade (transition at np 16264) is essentially restricted to Atlantic western Africa
(including Cabo Verde). We propose a tentative L3e phylogeny that is based on 197 HVS-I
sequences. We conclude that haplogroup L3e originated in central or eastern Africa about 46,000
(³14,000) years ago, and was a hitchhiker of much later dispersal and local expansion events, with
the rise of food production and iron smelting. Enforced migration of African slaves to the Americas
translocated L3e mitochondria, the descendants of which in Brazil and the Caribbean still reflect
their different regional African ancestries.
Correspondence: Prof. Dr. Hans-Ju$ rgen Bandelt, Fachbereich Mathematik der Universita$ t, Bundesstr.55, 20146Hamburg, Germany. Fax: 49-40-42838-5190.
E-mail : bandelt!math.uni-hamburg.de, bandelt!yahoo.com

550 H.-J. B
African mtDNAs seem to fall into a restricted
number of basal haplogroups having different
ages and geographic specificity (Scozzari et al.
1988; Chen et al. 1995; Watson et al. 1997). In
regard to the enormous complexity and time
depth of the prehistory of the African continent
(Phillipson, 1993; Shillington, 1995), the phylo-
geographic information (Avise, 2000) hitherto
derived from mtDNA variation is rather un-
satisfactory. The major cause of this dilemma
may be seen in the apparent shift of scientific
paradigms towards global population com-
parisons, mimicking studies of nuclear DNA
polymorphisms (Simoni et al. 2000), that seek to
establish a correlation between genetic variation
and cultural markers, such as subsistence pattern
and language (Watson et al. 1996; Barbujani,
1997; Poloni et al. 1997). Another reason is the
unbalanced sampling of mtDNA across Africa,
where Atlantic western Africa (Senegal in par-
ticular) is clearly over-represented. A third
shortcoming is that different studies focussed on
different parts of the molecule, with little or no
attention paid to combining these data, despite
the fact that the same population samples have
been employed repeatedly (e.g. from the Biaka,
Mbuti, and Mandenka): Scozzari et al. (1988)
studied six enzyme RFLPs; and Cann et al.
(1987) used 12-enzyme restriction mapping;
Vigilant (1990) and Vigilant et al. (1991)
sequenced the segments HVS-I & II of the
control region (which subsequently became a
popular enterprise, especially the compilation of
HVS-I sequences) ; Nachman et al. (1996) pro-
vided ND3 information; and Watson et al. (1997)
studied HVS-I sequences jointly with two key
restriction sites which distinguish the mtDNA
superhaplogroups L1, L2, and L3. Notably,
Soodyall (1993) obtained both six enzyme
RFLPs and HVS-I & II sequences for southern
African mtDNAs, but without striving to link
the systems phylogenetically. The work of
Graven et al. (1995) established a connection
between HVS-I & II and six enzyme RFLPs for
Senegalese mtDNAs, but this information was
not linked with the parallel study of Chen et al.
(1995) on 14-enzyme RFLPs. Later, Chen et al.
(2000) reported 14-enzyme RFLPs combined
with HVS-I & II from South Africa, which,
however, are partly in conflict with each other as
well as with earlier results. Finally, Ingman et al.
(2000) presented a worldwide set of 53 complete
mtDNA sequences but ignored the previously
published information about the mtDNA phy-
logeny. The a posteriori linking of the information
and the resolution of conflicts in the data is not
yet completed, but some progress was made by
Rando et al. (1998) and Quintana-Murci et al.
(1999). However, one of the African-specific
haplogroups, L3e, that emerged from these
attempts is still poorly understood in its geo-
graphic distribution and HVS-I variation across
Africa. As a clade within L3 it is characterised
only by the presence of the MboI site at np 2349,
which is not identified by the six enzyme system.
A recent screening of 69 Brazilian mtDNAs of
African ancestry for the combination of ®3592
HpaI and 2349 MboI indicated that L3e is the
dominant African haplogroup (compared to L1a,
L1b, L1c, L2, L3b, L3d, and U6) in the Brazilian
sample (Alves-Silva et al. 2000). The advantage
of using Brazilian data for phylogenetic mtDNA
studies is the geographically diverse origin of the
corresponding ancestral lineages, viz., from west-
ern Africa (coast of Guinea), central Africa
(Angola), and possibly even eastern Africa
(Mozambique). In addition to 37 confirmed and 5
inferred L3e mtDNAs from the literature, a
further 29 mtDNAs mainly from new samples of
Santo Domingo (Dominican Republic) and Cabo
Verde (Cape Verde) were found to harbour the
characteristic RFLP markers for L3e. The cor-
responding HVS-I sequences then turned out to
fall into four principal clades, each of which can
be identified by one mutation in HVS-I. The thus
discovered HVS-I motifs allowed the screening
of the database for potential members of L3e:
altogether 126 additional sequences can be allied
with one of the four clades. The phylogenetic
analysis of the total collection of 197 HVS-I
sequences, leaving of course some ambiguities, is
rather straightforward because the whole set
Phylogeography of mtDNA haplogroup L3e 551
connects up quite well with 1- or 2-mutational
steps. Available HVS-II information on 56 of
these sequences and the screening of a few
restriction sites assisted in establishing a nested
hierarchy of haplotypes. Some of the more
peripheral clades in L3e show a geographically
localized provenance on the one hand and long-
distance links on the other hand, which reflect
the imprint of major dispersal or diffusion events
that took place in the Holocene. L3e as a whole
has a considerable age of 46,000 (³14,000) years
and, in regard to age and continental ubiquity, it
could be seen as an African counterpart of the
European haplogroup U5.
1. mtDNA classification
We employ the classification of European and
African mtDNA established in Rando et al.
(1998), Richards et al. (1998), and Macaulay et al.
(1999), which combine HVS-I and RFLP in-
formation. Following the nomenclature of those
papers, human mtDNAs are divided into the
(paraphyletic) cluster L1 and the clades L2 and
L3. Whereas L1 and L2 are essentially African-
specific, L3 (characterised by the loss of the HpaI
site at np 3592) is ubiquitous. L3 can be further
subdivided into basal clades: haplogroup M (with
C at np 10400), haplogroup N (with T at np
10873), L3b (with gain of the 10084 TaqI site),
L3d (with loss of the 8616 MboI site), L3e (with
gain of the 2349 MboI site), and further
central}eastern African clades that await charac-
terisation. Haplogroups M and N together en-
compass virtually all Eurasian mtDNAs
(Quintana-Murci et al. 1999), in particular the
familiar European and Asian}American haplo-
groups, whereas haplogroups L3b, L3d, and L3e
are African-specific (Chen et al. 1995, 2000;
Watson et al. 1997; Rando et al. 1998, 1999).
2. Population samples
We employed a sample of 247 Brazilian
mtDNAs analysed for HVS-I and in part for
HVS-II (those with code BR-SE) and a number
of restriction sites, so that L3e membership could
reliably be assessed (Alves-Silva et al. 2000). This
provided 21 L3e mtDNAs, all of which have also
been analysed for HVS-II. MtDNAs of 127
subjects from Santo Domingo (Dominican Re-
public) were analysed by high resolution RFLP
analysis according to Torroni et al. (1999), and
17 were found to harbour the L3e RFLP motif.
HVS-I sequence variation of these 17 mtDNAs
was also determined. Two L3e HVS-I sequences
were also found in a sample of 109 Palestinians,
one in a sample of 71 French, and one in a sample
of 86 Yemenites. These four mtDNAs as well as
the L3e mtDNAs from the study of Rando et al.
(1998) were further typed by partial RFLP
analysis. A data set from Cabo Verde of size 292
yielded an additional 42 L3e mtDNAs, for which
HVS-I and some diagnostic restriction sites were
analysed. From a new Portuguese sample of 298
HVS-I sequences we further extracted five L3e
sequences.
3. Control region sequencing and RFLP
screening
HVS-I sequences were determined according
to Torroni et al. (1999) and Alves-Silva et al.
(2000). HVS-II sequence between positions 72
and 337 was determined for all Brazilian L3e
samples (with codes BR-N and BR-NE) not
previously analysed for HVS-II. The pair of
primers L29 5«-GGTCTATCACCCTATTAACC-
AC-3« and H580 5«-TTGAGGAGGTAAGCTAC-
ATA-3« was used to amplify a 570 bp fragment in
a 45 µl volume PCR reaction. Each tube con-
tained 0±8 µM of each primer, 200 µM dNTP and
0±5 U of Taq DNA polymerase (Promega Cor-
poration, USA). Thirty cycles of denaturation at
94 °C for 1 min, annealing at 55 °C for 30 sec and
extension at 72 °C for 1 min were carried out.
PCR products were visualized in 1% agarose gel
electrophoresis with ethidium bromide. Ampli-
fied segments were purified using Magic4 PCR
Preps (Promega Corporation, USA) and dideoxy
sequencing was carried out with Thermo
Sequenase Sequencing Kit (Amersham LIFE
SCIENCE, Inc., USA) using fluorescently

552 H.-J. B
labelled primers L48 5«-CTCACGGGAGCTCTCC-
ATGC-3« or H408 5«-CTGTTAAAAGTGCATAC-
CGCCA-3«. Employing the information from
Chen et al. (1995, 2000) and that obtained from
the high resolution 14-enzyme RFLP analysis
of the 17 L3e samples from Santo Domingo
(A. Torroni, unpub. data), we identified a number
of polymorphic restriction sites which potentially
could be used to subdivide L3e into subclades.
Screening of these sites (5260 AvaII, 5584 AluI,
9253 HaeIII, 9553 HaeIII, 13100 MspI, 13803
AluI, 14869 MboI, and 15812 RsaI) in selected
samples was performed by PCR using pairs of
primers and conditions described by Torroni et
al. (1992), Chen et al. (1995), and Macaulay et al.
(1999). Digestions were carried out following the
conditions specified by the manufacturer
(GibcoBRL Life Technologies, USA). Resulting
fragments were resolved by electrophoresis in
8% acrylamide gels after silver staining. For the
Northwest African and Senegalese samples
shorter fragments were amplified.
4. Database search
We searched the mtDNA database (including
all published HVS-I sequences, up to the year
2000) for additional sequences that match a
sequence with confirmed (or inferred) L3e status
or that bear a mutation (relative to CRS) at np
16223 and one of the four positions 16327, 16320,
16265 (transversion) and 16264. Only those
sequences were retained as potential members of
L3e which do not bear motifs of other known
haplogroups or other clusters of yet unknown
status. It was taken into consideration whether
the competing haplogroup}cluster occurs in the
area where the sequence in question was sampled.
We then searched for 1-step neighbours of the
candidate sequences that might have undergone
a back mutation at the corresponding motif
position but share other mutations with the
potential members of L3e.
Some of the sequences from the database were
adjusted as follows. We assumed that one HVS-
I sequence from the Kikuyu (Watson et al. 1997)
should bear the transition at np 16185 rather
than at np 16186 as published (base shift error).
Note that Table A1 of that publication lists only
mutations within the scoring frame (thus not
displaying e.g. a transition at np 16067), and in
one case (p. 700) erroneously recorded the A to T
transversion at np 16265 as a transition. The
position scored as 196 in HVS-II by Vigilant
(1990) was reconstructed as 195. We took care of
the multiple enumeration shifts (relative to CRS)
in HVS-I & II as listed by Soodyall (1993), but
otherwise retained the raw sequences (in which
evidently some variant nucleotides were not
recorded).
5. Phylogenetic analysis
We have chosen the MJ network method with
parameter ε¯ 0 (Bandelt et al. 1999) as the
initial stage of the analysis since the collection of
HVS-I sequences under study is almost 2-step
connected (with large 1-step components), except
for one potential outlier. In order to enhance the
search for plausible trees within the MJ network
we propose the following heuristic ‘thinning’
procedure (tailored to networks with large 1-step
components and only a few cycles). To this end,
we appreciate potential differences in the
positional mutation rates, by adopting the
mutational scores inferred by Hasegawa et al.
(1993) as rough estimates for the relative
positional rates. The mutational score m(i), being
a number between 0 and 15 in their test data, of
each position i from the HVS-I reading frame
16042–16400 is translated into a weight wiby the
following (ad hoc) scaling:
wi¯ 1}[3m(i)]
We then screen all 4-cycles with 1-step links in
the MJ network. Assume that C is such a cycle,
in which the two pairs of opposite links are
labelled by positions i and j in HVS-I, re-
spectively. For each node x of C we determine the
total number F(x) of individuals from the sample
located at node x or at 1-step neighbours of x
outside C. The sum of the F-values for the four

Phylogeography of mtDNA haplogroup L3e 553
Table 1. Population codes
Code Population Reference
AFB African Brazilian Bortolini et al. (1997)BAL Berbers from Algeria Co# rte-Real et al. (1996)BAM Bambara Rando et al. (1998)BMO Berbers from Morocco Rando et al. (1998)BRA Brazilian ‘Amerindian’ Horai et al. (1993)BR- Brazilian from North (N), Northeast (NE),
Southeast (SE), South (S)Alves-Silva et al. (1999),Alves-Silva et al (2000)
BUB Bubi Mateu et al. (1997)CAV Cabo Verde This studyDAM Dama Soodyall (1993)DIO Diola Rando et al. (1998)EGY Egyptian Krings et al. (1999)FRA Northern French Richards et al. (2000)FUL Fulbe Watson et al. (1997)HAU Hausa Watson et al. (1997)HER Herero Vigilant (1990), Vigilant et al. (1991),
Soodyall (1993)KAN Kanuri Watson et al. (1997)KIK Kikuyu Watson et al. (1997)!KU (Sekele, Vasikela) !Kung Soodyall (1993), Chen et al. (2000)KWE Barakwena}Khwe Soodyall (1993), Chen et al. (2000)MAN Mandenka Graven et al. (1995)MEX Mexican Green et al. (2000)PAL Palestinian Richards et al. (2000)POR Portuguese Pereira et al. (2000), this studySAN O Sa4 o Tome! an Mateu et al. (1997)SDO Santo Domingan This studySER Serer Rando et al. (1998)SOT Sotho Soodyall (1993)SUD Southern Sudanese Krings et al. (1999)SYR Syrian Richards et al. (2000)TUA Tuareg Watson et al. (1997)WOL Wolof Rando et al. (1998)YEM Yemenite Richards et al. (2000)YOR Yoruba Vigilant (1990), Vigilant et al. (1991),
Watson et al. (1997)ZUL Zulu Soodyall (1993)
nodes of C is denoted by F(C). We then delete the
link xy between two neighbouring nodes x and y
of C, which is labelled by position j, provided
that the following three requirements are met:
(1) wj& 2[w
i;
(2) F(x)F(y)!F(C)}2; ;
(3) the link xy belongs to no other cycle than C.
Criterion (1) in combination with the proposed
scaling requires that the mutational score of
position j is considerably smaller than that of
position i (thus allowing for some stochastic error
and systematic bias in the scoring by Hasegawa
et al. 1993): e.g. (1) is met when m(i)& 9 and
m( j)% 3. Criterion (2) breaks ties by favouring
the more frequent side of the rectangle C and its
1-step neighbourhood for the inferred evolution-
ary pathway. Finally, criterion (3) blocks any
potential decision to delete a link that would
create a larger cycle in the network.
Most parsimonious reconstruction of HVS-II
evolution on a tree inferred from HVS-I
sequences (in conjunction with partial RFLP
information) is hampered by the following cir-
cumstances : (i) HVS-II sequences are available
only for a small subset of the data; (ii) several
positions in HVS-II are subject to particularly
high mutation rates (Aris-Brosou & Excoffier,
1996; Bandelt et al. 2000); (iii) the quality of the
HVS-II sequences collected from the (early)
literature is suboptimal, reflecting obvious errors

554 H.-J. B
(such as notorious misscoring of np 263). To
shield against highly unreliable reconstructions,
we adopt a hierarchical consensus approach for
finding HVS-II motifs, which operates on a
collapsed tree focussing only on the deepest
branches of the phylogeny. This tree, referred to
as a skeleton of the phylogeny, defines the
principal clades and pronounced subclades. Then
our approach simply amounts to most par-
simonious reconstruction (Maddison, 1989) along
the highly polytomous tree in which the tips
represent the different HVS-I & II haplotypes
and the interior part is determined by the
skeleton.
6. Age estimation
The coalescence time of a group of individual
HVS-I sequences is estimated via the averaged
mutational distance, ρ, to the reconstructed
most recent common ancestor. The calibration
for converting ρ into time scores only transitions
in the segment np 16090–16365 such that ρ¯ 1
corresponds to 20,180 years (Forster et al. 1996).
A lower bound for the standard deviation of
ρ is obtained as o(ρ}n) where n is the sample size
(by assuming a perfect star genealogy). A direct
estimation for the standard deviation σ uses a
reconstructed phylogeny as a hypothetical gen-
ealogy (which is thus not fully resolved, being
locally a star at each branching node). Then, if
there are altogether m nested clades, each of
which is defined by a branch with di
scored
mutations and carries ni
individuals (i¯1, … , m), we obtain the following formulae
(assuming independent Poisson processes along
the branches with parameters d", … , d
m) :
ρ¯ (n"d"n
#d#In
mdm)}n,
σ#¯ (n#"d"n#
#d#In#
mdm)}n#
(Saillard et al. 2000). Age estimates are presented
in the form ρ³σ converted to time.
7. Regional profiles
The African samples are allocated to five
major regions (Senegambia, non-Atlantic west-
ern, eastern, central, and southern Africa) and
two islands (Cabo Verde and Sa4 o Tome! ). These
are compared to the samples from Santo
Domingo, Brazil, and Portugal. Thus only five
(with population codes BAL, BMO, FRA, and
MEX) out of 197 mtDNAs are left unassigned.
Haplogroup L3e is subdivided into six clusters
(five principal subclades and one paraphyletic
cluster). For each region we record the absolute
sample frequencies of these clusters ; the resulting
vectors (in 6-dimensional Euclidean space) are
then referred to as the regional L3e profiles.
Angles θ between profile vectors measure dis-
similarity and could be transformed into the
familiar chord length measure by taking the
square root of 2(1®cos θ).
With two exceptions, all of the 66 HVS-I
sequences recognised as L3e members by the
MboI site at position 2349 bear exactly one of the
following four mutations: a transition at np
16327, or 16320, or 16264, or an A!T trans-
version at np 16265. The four principal clades
within L3e defined by these mutations are named
L3e1, L3e2, L3e4, and L3e3, respectively. Five
additional sequences from the Mandenka belong
to the 6-enzyme RFLP haplogroup 52-2 (Graven
et al. 1995), which coincides with the superclade
L3e3«4 (see below). The database search offers an
additional 126 sequences as L3e candidates. The
minimum spanning network (which is the super-
position of all minimum spanning trees ; see
Excoffier & Smouse, 1994; Bandelt et al. 1999)
for this collection of 197 sequences is nearly 2-
step connected, with only one outlier requiring 3
steps to link up. Large parts of the principal
clades are even 1-step connected. The MJ
network (not shown) has 10 cycles, six of which
are within L3e1, one in L3e2, one in L3e3, and
two in L3e4. Position 16311 is involved in six of
these cycles, which testifies to its extreme
variability in this haplogroup. The thinning
procedure (see Materials and Methods) resolves
five cycles and thus yields the network shown in
Fig. 1, where a plausible phylogeny (employed
for time estimates) is highlighted. In this phy-

Phylogeography of mtDNA haplogroup L3e 555
Fig. 1. Inferred HVS-I network of 197 potential L3e lineages, which is derived from the MJ network byapplying the thinning procedure. A plausible phylogeny is indicated by solid lines (assuming one additionalback mutation indicated by a double-line). The central node (black square) constitutes the root of L3e,distinguished from CRS (Andrews et al. 1999) by a transition at np 16223. Numbers preceding the populationcodes (see Table 1) are numbers of sequences of the same type sampled from the population in question;suffix indicates whether the RFLP status at 2349 MboI has been confirmed (or inferred in the case of theMandenka lineages). Numbers along links refer to nucleotide positions in HVS-I minus 16000, suffixesindicate a transversion or a deletion; underlining highlights recurrent mutations. Length polymorphisms inthe A–C run are ignored.

556 H.-J. B
Table 2. Restriction sites tested for subclassification of confirmed L3e sequences (including published
!Kung}Khwe data)
Clade}Populationcode HVS-I
5260AvaII
5584AluI
9253HaeIII
9553HaeIII
13100MspI
13803AluI
14869MboI
15812RsaI
L3e1:SDO 16223 16327 ® ® ® ® BR-NE 16223 16327 ® WOL 16223 16323del
16327®
BR-NE 16176 16223 16327 ® ®
L3e1a:BR-NE 16185 16223 16327 ® BR-SE 16185 16223 16311 ® BR-SE 16145 16185 16223
16327
6 KWE, SDO 16185 16209 1622316327
® ® ®
BR-SE 16185 16209 1622316256 16327
L3e2a:DIO, CAV 16223 16320 ®CAV 16086 16223 16320 ®SDO 16192 16223 16320 ® ® ® ® ® BR-SE 16223 16254G 16320 ®BR-NE 16223 16294 16320 ® ® ® SDO 16223 16311 16320 ® ® ® ® ® BR-N 16223 16311 16320 ®SDO 16223 16320 16399 ® ® ® ® ® BMO 16223 16278 16286 ® ®
16320
L3e2b:WOL 16172 16189 16223
16320®
2!KU, 3 KWE,5 SDO
16172 16189 1622316320
® ® ® ®
BR-SE 16172 16189 1622316320
® ®
BR-SE 16172 16189 1622316320
® ®
SDO 16172 16189 1622316290 16320
® ® ® ®
BR-SE 16172 16189 1622316311 16320
4 SDO 16172 16189 1620916223 16311 16320
® ® ® ®
L3e3:YEM 16223 16265T ® ® PAL 16223 16265T ® ® ®SDO 16223 16265T ® ® ®BR-SE 16093 16223 16265T ® ® ®FRA 16093 16223 16265T
16278 ® ® ®
BR-N 16093 16223 16265T16316
® ® ®
SER 16093 16148 16223 16265T 16311
PAL 16189 16223 16265T ® ® ®
L3e4:BAM 16223 16264 ® SDO 16051 16223 16264 ® ® ® ® WOL 16051 16223 16264 ®
Phylogeography of mtDNA haplogroup L3e 557
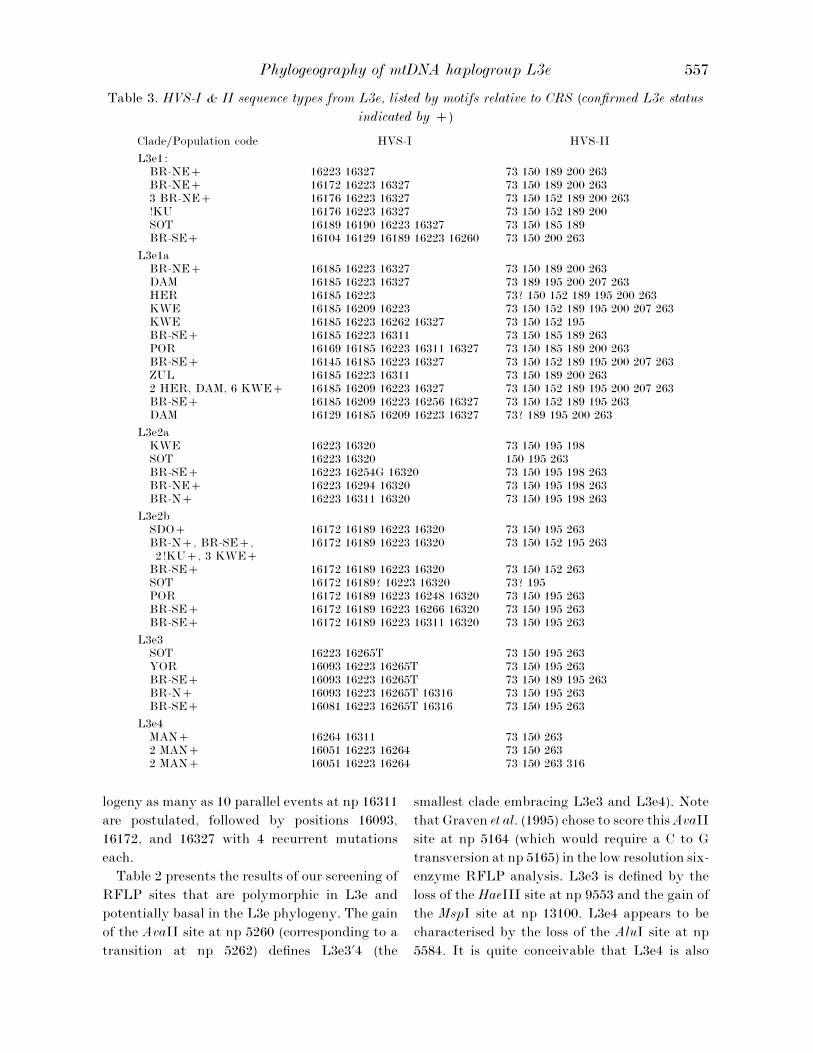
Table 3. HVS-I & II sequence types from L3e, listed by motifs relative to CRS (confirmed L3e status
indicated by )
Clade}Population code HVS-I HVS-II
L3e1:BR-NE 16223 16327 73 150 189 200 263BR-NE 16172 16223 16327 73 150 189 200 2633 BR-NE 16176 16223 16327 73 150 152 189 200 263!KU 16176 16223 16327 73 150 152 189 200SOT 16189 16190 16223 16327 73 150 185 189BR-SE 16104 16129 16189 16223 16260 73 150 200 263
L3e1aBR-NE 16185 16223 16327 73 150 189 200 263DAM 16185 16223 16327 73 189 195 200 207 263HER 16185 16223 73? 150 152 189 195 200 263KWE 16185 16209 16223 73 150 152 189 195 200 207 263KWE 16185 16223 16262 16327 73 150 152 195BR-SE 16185 16223 16311 73 150 185 189 263POR 16169 16185 16223 16311 16327 73 150 185 189 200 263BR-SE 16145 16185 16223 16327 73 150 152 189 195 200 207 263ZUL 16185 16223 16311 73 150 189 200 2632 HER, DAM, 6 KWE 16185 16209 16223 16327 73 150 152 189 195 200 207 263BR-SE 16185 16209 16223 16256 16327 73 150 152 189 195 263DAM 16129 16185 16209 16223 16327 73? 189 195 200 263
L3e2aKWE 16223 16320 73 150 195 198SOT 16223 16320 150 195 263BR-SE 16223 16254G 16320 73 150 195 198 263BR-NE 16223 16294 16320 73 150 195 198 263BR-N 16223 16311 16320 73 150 195 198 263
L3e2bSDO 16172 16189 16223 16320 73 150 195 263BR-N, BR-SE,2 !KU, 3 KWE
16172 16189 16223 16320 73 150 152 195 263
BR-SE 16172 16189 16223 16320 73 150 152 263SOT 16172 16189? 16223 16320 73? 195POR 16172 16189 16223 16248 16320 73 150 195 263BR-SE 16172 16189 16223 16266 16320 73 150 195 263BR-SE 16172 16189 16223 16311 16320 73 150 195 263
L3e3SOT 16223 16265T 73 150 195 263YOR 16093 16223 16265T 73 150 195 263BR-SE 16093 16223 16265T 73 150 189 195 263BR-N 16093 16223 16265T 16316 73 150 195 263BR-SE 16081 16223 16265T 16316 73 150 195 263
L3e4MAN 16264 16311 73 150 2632 MAN 16051 16223 16264 73 150 2632 MAN 16051 16223 16264 73 150 263 316
logeny as many as 10 parallel events at np 16311
are postulated, followed by positions 16093,
16172, and 16327 with 4 recurrent mutations
each.
Table 2 presents the results of our screening of
RFLP sites that are polymorphic in L3e and
potentially basal in the L3e phylogeny. The gain
of the AvaII site at np 5260 (corresponding to a
transition at np 5262) defines L3e3«4 (the
smallest clade embracing L3e3 and L3e4). Note
that Graven et al. (1995) chose to score this AvaII
site at np 5164 (which would require a C to G
transversion at np 5165) in the low resolution six-
enzyme RFLP analysis. L3e3 is defined by the
loss of the HaeIII site at np 9553 and the gain of
the MspI site at np 13100. L3e4 appears to be
characterised by the loss of the AluI site at np
5584. It is quite conceivable that L3e4 is also

558 H.-J. B
Fig. 2. The skeleton of major branching nodes in the L3e phylogeny, based on HVS-I & II sequences andrestriction sites in the coding region (Tables 2 and 3). The potential root type of L3e (with motif 16223, 73,150, 263 relative to CRS) and the inferred ancestral types of L3e1, L3e2, and L3e3«4 are indicated byrectangles, whereas the ancestral types of the peripheral clades are indicated by triangles. The order ofmutations along single links is undetermined.
characterised by the loss of the RsaI site at np
16049 (caused by a transition at np 16051) since
the two exceptional L3e4 sequences (Fig. 1) may
well have back-mutated at this site. The MboI
site at np 14869 seems to partition L3e2 into two
subclades: the loss characterises L3e2a, while the
complementary clade, L3e2b, appears to be
defined by transitions at nps 16172 and 16189.
The site 9253 HaeIII is polymorphic within L3e1
but the site may be present in all those sequences
which bear the transition at np 16209. Within
L3e3 the sites 13803 AluI and 15812 RsaI are
polymorphic but may constitute private
mutations in single individuals. Since the data
set from Santo Domingo has been checked for 14-
enzyme RFLPs, we can conclude that no further
RFLP sites exist that would characterise the
distinguished subclades of L3e.
HVS-II information is available for 56 sampled
mtDNAs (Table 3). The skeleton of the L3e
phylogeny, for which we reconstruct ancestral
HVS-II types (see Material and Methods), com-
prises the ancestral nodes of L3e, L3e1, L3e1a,
L3e2, L3e2a, L3e2b, L3e3«4, L3e3, and L3e4.
Figure 2 displays the reconstructed HVS-II
evolution along the skeleton, where the ancestral
HVS-II type of L3e is distinguished from CRS by
transitions at nps 73, 150, and 263, but the
ancestral state at the highly variable position
195 cannot be determined unambiguously. HVS-
II information may help to decide whether a
mtDNA with an ambiguous HVS-I motif likely
belongs to L3e or not. For instance, a Yoruban
mtDNA with transitions at nps 16124, 16223,
and 16327 in HVS-I bears transitions only at nps
73, 146, 152, and 263 in HVS-II (Vigilant, 1990)
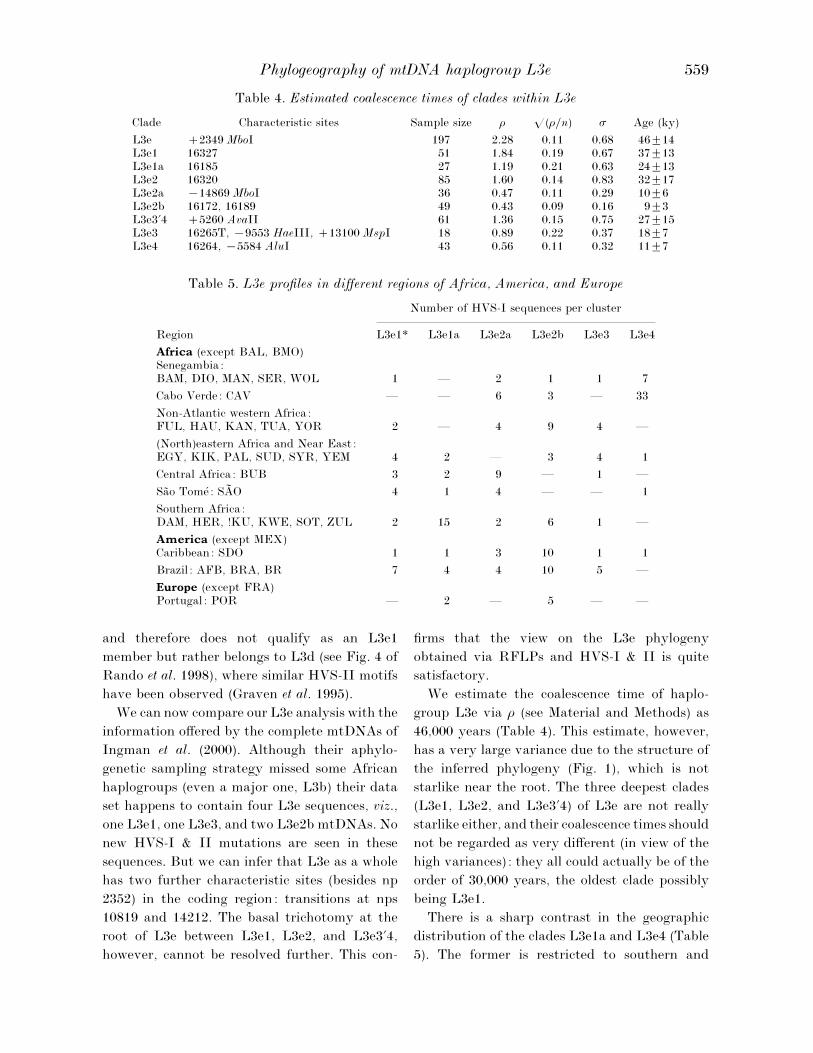
Phylogeography of mtDNA haplogroup L3e 559
Table 4. Estimated coalescence times of clades within L3e
Clade Characteristic sites Sample size ρ o(ρ}n) σ Age (ky)
L3e 2349 MboI 197 2±28 0±11 0±68 46³14L3e1 16327 51 1±84 0±19 0±67 37³13L3e1a 16185 27 1±19 0±21 0±63 24³13L3e2 16320 85 1±60 0±14 0±83 32³17L3e2a ®14869 MboI 36 0±47 0±11 0±29 10³6L3e2b 16172, 16189 49 0±43 0±09 0±16 9³3L3e3«4 5260 AvaII 61 1±36 0±15 0±75 27³15L3e3 16265T, ®9553 HaeIII, 13100 MspI 18 0±89 0±22 0±37 18³7L3e4 16264, ®5584 AluI 43 0±56 0±11 0±32 11³7
Table 5. L3e profiles in different regions of Africa, America, and Europe
Region
Number of HVS-I sequences per cluster
L3e1* L3e1a L3e2a L3e2b L3e3 L3e4
Africa (except BAL, BMO)Senegambia:BAM, DIO, MAN, SER, WOL 1 — 2 1 1 7
Cabo Verde: CAV — — 6 3 — 33
Non-Atlantic western Africa:FUL, HAU, KAN, TUA, YOR 2 — 4 9 4 —
(North)eastern Africa and Near East :EGY, KIK, PAL, SUD, SYR, YEM 4 2 — 3 4 1
Central Africa: BUB 3 2 9 — 1 —
Sa4 o Tome! : SAN O 4 1 4 — — 1
Southern Africa:DAM, HER, !KU, KWE, SOT, ZUL 2 15 2 6 1 —
America (except MEX)Caribbean: SDO 1 1 3 10 1 1
Brazil : AFB, BRA, BR 7 4 4 10 5 —
Europe (except FRA)Portugal : POR — 2 — 5 — —
and therefore does not qualify as an L3e1
member but rather belongs to L3d (see Fig. 4 of
Rando et al. 1998), where similar HVS-II motifs
have been observed (Graven et al. 1995).
We can now compare our L3e analysis with the
information offered by the complete mtDNAs of
Ingman et al. (2000). Although their aphylo-
genetic sampling strategy missed some African
haplogroups (even a major one, L3b) their data
set happens to contain four L3e sequences, viz.,
one L3e1, one L3e3, and two L3e2b mtDNAs. No
new HVS-I & II mutations are seen in these
sequences. But we can infer that L3e as a whole
has two further characteristic sites (besides np
2352) in the coding region: transitions at nps
10819 and 14212. The basal trichotomy at the
root of L3e between L3e1, L3e2, and L3e3«4,
however, cannot be resolved further. This con-
firms that the view on the L3e phylogeny
obtained via RFLPs and HVS-I & II is quite
satisfactory.
We estimate the coalescence time of haplo-
group L3e via ρ (see Material and Methods) as
46,000 years (Table 4). This estimate, however,
has a very large variance due to the structure of
the inferred phylogeny (Fig. 1), which is not
starlike near the root. The three deepest clades
(L3e1, L3e2, and L3e3«4) of L3e are not really
starlike either, and their coalescence times should
not be regarded as very different (in view of the
high variances) : they all could actually be of the
order of 30,000 years, the oldest clade possibly
being L3e1.
There is a sharp contrast in the geographic
distribution of the clades L3e1a and L3e4 (Table
5). The former is restricted to southern and

560 H.-J. B
Table 6. Affinities between regional L3e profiles expressed by the cosine of the angle between profile
vectors
BAM, DIO, MAN, SER, WOL
±98 CAV±28 ±14 FUL, HAU, KAN, TUA, YOR±35 ±18 ±70 EGY, KIK, PAL, SUD, SYR, YEM±30 ±16 ±44 ±30 BUB
±44 ±29 ±38 ±48 ±88 SAN O±11 ±05 ±39 ±54 ±34 ±32 DAM, HER, !KU, KWE, SOT, ZUL
±31 ±23 ±94 ±57 ±32 ±29 ±48 SDO
±28 ±11 ±90 ±88 ±50 ±57 ±62 ±84 AFB, BRA, BR
±12 ±08 ±77 ±52 ±08 ±06 ±68 ±91 ±75 POR
eastern Africa whereas the latter seems to be
confined to Atlantic western Africa (with only
sporadic incursions in Sudan). The clades L3e2a,
L3e2b, and the cluster L3e1* (that is, L3e1
without L3e1a) in contrast are almost omni-
present but apparently at relatively different
frequencies per region.
Comparing the L3e profiles of the four regions
(Cabo Verde, Santo Domingo, Sa4 o Tome! , and
Brazil), which were settled by slave trade, with
the potential source areas in Africa, it is apparent
that Cabo Verde represents a faithful image of
Senegambia, Santo Domingo is very similar to
non-Atlantic western Africa, Sa4 o Tome! is re-
markably akin to Bioko of Central Africa
(although one should bear in mind that no
haplotypes are shared between these two popu-
lations other than two L3e types), whereas Brazil
resembles all areas to some extent except
Senegambia. Southern Africa comes closest to
Portugal and Brazil. These affinities are nu-
merically expressed by the angles θ between the
corresponding profile vectors (see Table 6 for the
values cos θ, where the highest values corre-
sponding to angles ! 30° are highlighted). The
sharpest contrast is between Cabo Verde and
southern Africa, for which the profile vectors are
almost perpendicular. This nicely parallels the
contrasts found in the βS haplotype distribution
for the beta globin gene (Bortolini & Salzano,
1999).
The present analysis of L3e assists in directing
the search for correct haplogroup assignment by
HVS-I motifs. It demonstrates that a first sorting
of HVS-I sequences from L3 as performed in
Watson et al. (1997) led to an unsatisfactory
coarse grouping that failed to identify L3e (and
other clades). Standard phylogenetic analyses of
HVS-I sequences alone, which do not anticipate
the correlation with putative RFLP status, have
no chance to identify a set of diverse L3e
sequences as a clade in an MP or NJ or any other
tree. The two NJ trees (Bioko vs Sa4 o Tome! )displayed in Fig. 3 of Mateu et al. (1997)
constitute an illustrative case in question; also
the NJ tree for the entire data set does not
support L3e as a clade since sequences from other
haplogroups are interspersed among the L3e
sequences. Even with the information provided
in the present study, there is an obvious risk in
inferring L3e status just from HVS-I motif
comparison. The positions 16264, 16320, and
16327 have evidently undergone multiple hits in
Africa. The transition at np 16264 in conjunction
with 2349 MboI is also part of the recognition
HVS-I & RFLP motif for haplogroup L1b, but
inasmuch as L1b can be distinguished from L3
by several mutations in HVS-I, HVS-II, as well
as 14-enzyme RFLPs, there is no danger of
confusion. The presence of the MboI site at np
2349 has also been observed in a sequence type
from U6 (Torroni et al. 1999). To date we have no
positive evidence for any further independent
mutational events at np 2352 that create the
MboI site at np 2349 (except possibly another
event in haplogroup M scored by Ballinger et al.
1992).
The precise location and time of origin of
Phylogeography of mtDNA haplogroup L3e 561
haplogroup L3e cannot yet reliably be recon-
structed. A central African (or southern Sudanic)
origin is certainly plausible considering the
geographic distribution, especially of its pre-
sumably oldest and most diverse clade L3e1.
Even the seemingly southern African subclade
L3e1a harbours sequences from the Bantu-
speaking Kikuyu of Kenya (which otherwise
possess a typical east African mtDNA profile,
akin to the Turkana mtDNA pool; Watson et al.
1997). If this subclade had really come from the
south, one would expect to find sequences in
central}eastern Africa from the ancient
‘Khoisan’ haplogroups (Chen et al. 2000). It
rather seems likely that the southern African
mtDNA pool received a package of L2}L3
mtDNAs (of limited diversity) through Bantu
migrations. In particular, L3e1 must have been
prominent in this ‘southern Bantu package’,
although also L3e2 and L3e3 participated to
some extent. The relatively high frequency of
L3e in the Brazilian mtDNA pool may then be
explained by the fact that the majority of the
slaves that arrived in Brazil came from Bantu
groups, mainly from Angola. The sporadic
occurrences of L3e (and other sub-Saharan
haplogroups; Pereira et al. 2000) in Portugal is
then not surprising in view of early slave trade
and back migration from the colonies.
The most frequent and widespread type of L3e
is the ancestral type of the subclade L3e2b.
Interestingly, this type (also found in our
Brazilian sample) was previously reported as a
Brazilian Amerindian sequence by Horai et al.
(1993), but Forster (1997) emphasised that this
sequence should rather be regarded as an African
Brazilian sequence. The two dominant L3e2
types could have been successful hitchhikers of
population movements in the Sahara during the
Great Wet Phase (of the early Holocene) and the
subsequent Neolithic Wet Phase (Muzzolini,
1993). Members of L3e2 are not only found in
northern Africa but even in the Near East
sporadically. In Egypt and Sudan there are also
incursions of western African L1b and north-
west African U6a sequences, which seem to be
out of place. This may testify to long-distance
contacts in the Sahel zone and beyond, especially
with pastoralists movements (such as the recent
‘Fulbe diaspora’ ; Newman, 1995).
It is evident that our investigation of a single,
though widespread, haplogroup can offer no more
than a snapshot of African prehistory from the
genetic perspective. In the future, detailed
phylogeographic analyses of the other African
mtDNA haplogroups as well as the African-
specific Y-chromosome haplotypes and types of
autosomal genes will provide a rich mosaic,
which will eventually allow a more faithful
picture of the genetic landscape to be sketched
than was hitherto possible with classical genetic
markers (Cavalli-Sforza et al. 1994).
We thank Martin Richards for providing some samplesfor RFLP testing. This research was supported by grantsfrom CNPq, FAPEMIG, PRPq-UFMG (Brazil), a travelgrant from DAAD and CAPES to H.-J.B. and S.D.J.P.,and grants from Fondazione Telethon (E.0890) to A.T.,Fondo d’Ateneo per la Ricerca dell’Universita' di Paviato A.T., Istituto Pasteur Fondazione Cenci Bolognetti,Universita' di Roma ‘‘La Sapienza’’ to R.S., ProgettiRicerca Interesse Nazionale 1999 and 2001 to R.S., A.T.,A.C., and Facolta' 60% to A.C. ; J.M.L. was supportedby grant PB96-1034 from DGICT (Spain) ; A.B. wassupported by a grant from ICCTI (Portugal) andacknowledges the support of the Cape Verde Army Chiefof Staff; L.P. was supported by a Ph.D. grant fromFundac: a4 o para a Cie# ncia e a Tecnologia (PRAXISXXI}BD}13632}97).
Alves-Silva, J., Santos, M. S., Guimara4 es, P. E. M.,Ferreira, A. C. S., Bandelt, H.-J., Pena, S. D. J., et al.(2000). The ancestry of Brazilian mitochondrial DNAlineages. Am. J. Hum. Genet. 67, 444–461.
Alves-Silva, J., Santos, M. S., Pena, S. D. & Prado, V. F.(1999). Multiple geographic sources of region V 9-bpdeletion haplotypes in Brazilians. Hum. Biol. 71,245–259.
Andrews, R. M., Kubacka, I., Chinnery, P. F.,Lightowlers, R. N., Turnbull, D. M. & Howell, N.(1999). Reanalysis and revision of the Cambridgereference sequence for human mitochondrial DNA. Nat.Genet. 23, 147.
Aris-Brosou, S. & Excoffier, L. (1996). The impact ofpopulation expansion and mutation rate heterogeneityon DNA sequence polymorphism. Mol. Biol. Evol. 13,494–504.
Avise, J. C. (2000). Phylogeography: the history andformation of species. Cambridge, MA: Harvard Uni-versity Press.
Ballinger, S. W., Schurr, T. G., Torroni, A., Gan, Y. Y.,Hodge, J. A., Hassan, K., et al. (1992). SoutheastAsian mitochondrial DNA analysis reveals genetic
562 H.-J. B
continuity of ancient mongoloid migrations. Genetics130, 139–152.
Bandelt, H.-J., Forster, P. & Ro$ hl, A. (1999). Median-joining networks for inferring intraspecific phylogenies.Mol. Biol. Evol. 16, 37–48.
Bandelt, H.-J., Macaulay, V. & Richards, M. (2000).Median networks: speedy construction and greedyreduction, one simulation, and two case studies fromhuman mtDNA. Mol. Phylogenet. Evol. 16, 8–28.
Barbujani, G. (1997). DNA variation and languageaffinities. Am. J. Hum. Genet. 61, 1011–1014.
Bortolini, M. C., Zago, M. A., Salzano, F. M., Silva-Junior, W. A., Bonatto, S. L., Da Silva, M. C., et al.(1997). Evolutionary and anthropological implicationsof mitochondrial DNA variation in African Brazilianpopulations. Hum. Biol. 69, 141–159.
Bortolini, M. C. & Salzano, F. M. (1999). β S haplotypediversity in Afro-Americans, Africans, and Euro-Asiatics – an attempt at a synthesis. CieW ncia e Cultura51, 175–180.
Cann, R. L., Stoneking, M. & Wilson, A. C. (1987).Mitochondrial DNA and human evolution. Nature 325,31–36.
Cavalli-Sforza, L. L., Menozzi, P. & Piazza, A. (1994).History and geography of human genes. Princeton, NY:Princeton University Press.
Chen, Y. S., Torroni, A., Excoffier, L., Santachiara-Benerecetti, A. S. & Wallace, D. C. (1995). Analysis ofmtDNA variation in African populations reveals themost ancient of all human continent-specific haplo-groups. Am. J. Hum. Genet. 57, 133–149.
Chen, Y. S., Olckers, A., Schurr, T. G., Kogelnik, A. M.,Huoponen, K. & Wallace, D. C. (2000). mtDNAvariation in the South African Kung and Khwe – andtheir genetic relationships to other African popu-lations. Am. J. Hum. Genet. 66, 1362–1383.
Co# rte-Real, H. B., Macaulay, V. A., Richards, M. B.,Hariti, G., Issad, M. S., Cambon-Thomsen, A., et al.(1996). Genetic diversity in the Iberian Peninsuladetermined from mitochondrial sequence analysis.Ann. Hum. Genet. 60, 331–350.
Excoffier, L. & Smouse, P. E. (1994). Using allelefrequencies and geographic subdivision to reconstructgene trees within a species : molecular variance par-simony. Genetics 136, 43–59.
Forster, P., Harding, R., Torroni, A. & Bandelt, H.-J.(1996). Origin and evolution of Native AmericanmtDNA variation: a reappraisal. Am. J. Hum. Genet.59, 935–945.
Forster, P. (1997). Wandertrieb im Blut. Interview in‘Der Spiegel ’ (3}1997), pp. 152–153.
Graven, L., Passarino, G., Semino, O., Boursot, P.,Santachiara-Benerecetti, S., Langaney, A., et al.(1995). Evolutionary correlation between control re-gion sequence and restriction polymorphisms in themitochondrial genome of a large Senegalese Mandenkasample. Mol. Biol. Evol. 12, 334–345.
Green, L. D., Derr, J. N. & Knight, A. (2000). mtDNAaffinities of the peoples of north-central Mexico. Am. J.Hum. Genet. 66, 989–998.
Hasegawa, M., Di Rienzo, A., Kocher, T. D. & Wilson,A. C. (1993). Toward a more accurate time scale for thehuman mitochondrial DNA tree. J. Mol. Evol. 37,347–354.
Horai, S., Kondo, R., Nakagawa-Hattori, Y., Hayashi,
S., Sonoda, S. & Tajima, K. (1993). Peopling of theAmericas, founded by four major lineages of mito-chondrial DNA. Mol. Biol. Evol. 10, 23–47.
Ingman, M., Kaessmann, H., Pa$ a$ bo, S. & Gyllensten, U.(2000). Mitochondrial genome variation and the originof modern humans. Nature 408, 708–713.
Krings, M., Salem, A. E., Bauer, K., Geisert, H., Malek,A. K., Chaix, L. et al. (1999). mtDNA analysis of NileRiver Valley populations: A genetic corridor or abarrier tomigration?Am.J.Hum.Genet.64, 1166–1176.
Macaulay, V., Richards, M., Hickey, E., Vega, E.,Cruciani, F., Guida, V., et al. (1999). The emerging treeof West Eurasian mtDNAs: a synthesis of control-region sequences and RFLPs. Am. J. Hum. Genet. 64,232–249.
Maddison, W. P. (1989). Reconstructing character evol-ution on polytomous cladograms. Cladistics 5, 365–377.
Mateu, E., Comas, D., Calafell, F., Perez-Lezaun, A.,Abade, A. & Bertranpetit, J. (1997). A tale of twoislands: population history and mitochondrial DNAsequence variation of Bioko and Sa4 o Tome! , Gulf ofGuinea. Ann. Hum. Genet. 61, 507–518.
Muzzolini, A. (1993). The emergence of a food-producingeconomy in the Sahara. In The archaeology of Africa:food, metals and towns (eds. T. Shaw et al.), pp. 227–239.London: Routledge.
Nachman, M. W., Brown, W. M., Stoneking, M. &Aquadro, C. F. (1996). Nonneutral mitochondrial DNAvariation in humans and chimpanzees. Genetics 142,953–963.
Newman, J. L. (1995). The peopling of Africa. NewHaven: Yale University Press.
Pereira, L., Prata, M. J. & Amorim, A. (2000). Diversityof mtDNA lineages in Portugal : not a genetic edge ofEuropean variation. Ann. Hum. Genet. 64, 491–506.
Phillipson, D. W. (1993). African archaeology (2nd ed.).Cambridge: Cambridge University Press.
Poloni, E. S., Semino, O., Passarino, G., Santachiara-Benerecetti, A. S., Dupanloup, I., Langaney, A., et al.(1997). Human genetic affinities for Y-chromosomeP49a,f}TaqI haplotypes show strong correspondencewith linguistics. Am. J. Hum. Genet. 61, 1015–1035.
Quintana-Murci, L., Semino, O., Bandelt, H-.J.,Passarino, G., McElreavey, K. & Santachiara-Benerecetti, A. S. (1999). Genetic evidence of an earlyexit of Homo sapiens sapiens from Africa througheastern Africa. Nat. Genet. 23, 437–441.
Rando, J. C., Cabrera, V. M., Larruga, J. M., Herna! ndez,M., Gonza! lez, A. M., Pinto, F., et al. (1999). Phylo-geographic patterns of mtDNA reflecting the col-onisation of the Canary Islands. Ann. Hum. Genet. 63,413–428.
Rando, J. C., Pinto, F., Gonza! lez, A. M., Herna! ndez, M.,Larruga, J. M., Cabrera, V. M., et al. (1998). Mito-chondrial DNA analysis of northwest African popu-lations reveals genetic exchanges with European, near-eastern, and sub-Saharan populations. Ann. Hum.Genet. 62, 531–550.
Richards, M. B., Macaulay, V. A., Bandelt, H.-J. &Sykes, B. C. (1998). Phylogeography of mitochondrialDNA in western Europe.Ann.Hum. Genet. 62, 241–260.
Richards, M., Macaulay, V. A., Hickey, E., Vega, E.,Sykes, B., Guida, V., et al. (2000). Tracing Europeanfounder lineages in the Near Eastern mtDNA pool. Am.J. Hum. Genet. 67, 1251–1276.

Phylogeography of mtDNA haplogroup L3e 563
Saillard, J., Forster, P., Lynnerup, N., Bandelt, H.-J. &Nørby, S. (2000). mtDNA variation among GreenlandEskimos: the edge of the Beringian expansion. Am. J.Hum. Genet. 67, 718–726.
Scozzari, R., Torroni, A., Semino, O., Sirugo, G., Brega,A. & Santachiara-Benerecetti, A. S. (1988). Geneticstudies on the Senegal population. I. MitochondrialDNA polymorphisms. Am. J. Hum. Genet. 43, 534–544.
Shillington, K. (1995). History of Africa (2nd ed.).London: Macmillan.
Simoni, L., Calafell, F., Pettener, D., Bertranpetit, J. &Barbujani, G. (2000). Reconstruction of prehistory onthe basis of genetic data. Am. J. Hum. Genet. 66,1177–1179.
Soodyall, H. (1993). Mitochondrial DNA polymorphismsin southern African populations. PhD thesis, Uni-versity of Witwatersrand, Johannesburg.
Torroni, A., Cruciani, F., Rengo, C., Sellitto, D., Lopez-Bigas, N., Rabionet, R., et al. (1999). The A1555Gmutation in the 12S rRNA gene of human mtDNA:recurrent origins and founder events in families
affected by sensorineural deafness. Am. J. Hum. Genet.65, 1349–1358.
Torroni, A., Schurr, T. G., Yang, C.-C., Szathmary,E. J. E., Williams, R. C., Schanfield, M. S., et al.(1992). Native American mitochondrial DNA analysisindicates that the Amerind and the Nadene popu-lations were founded by two independent migrations.Genetics 130, 153–162.
Vigilant, L. (1990). Control region sequences from Africanpopulation and the evolution of human mitochondrialDNA. PhD thesis, University of California, Berkeley.
Vigilant, L., Stoneking, M., Harpending, H., Hawkes, K.& Wilson, A. C. (1991). African populations and theevolution of human mitochondrial DNA. Science 253,1503–1507.
Watson, E., Bauer, K., Aman, R., Weiss, G., vonHaeseler, A. & Pa$ a$ bo, S. (1996). mtDNA sequencediversity in Africa. Am. J. Hum. Genet. 59, 437–444.
Watson, E., Forster, P., Richards, M. & Bandelt, H.-J.(1997). Mitochondrial footprints of human expansionsin Africa. Am. J. Hum. Genet. 61, 691–704.