phylogenetic footprinting for motif identificationcs.ucf.edu/~xiaoman/fall/lecture 18...
TRANSCRIPT

Phylogenetic footprinting for motif identification
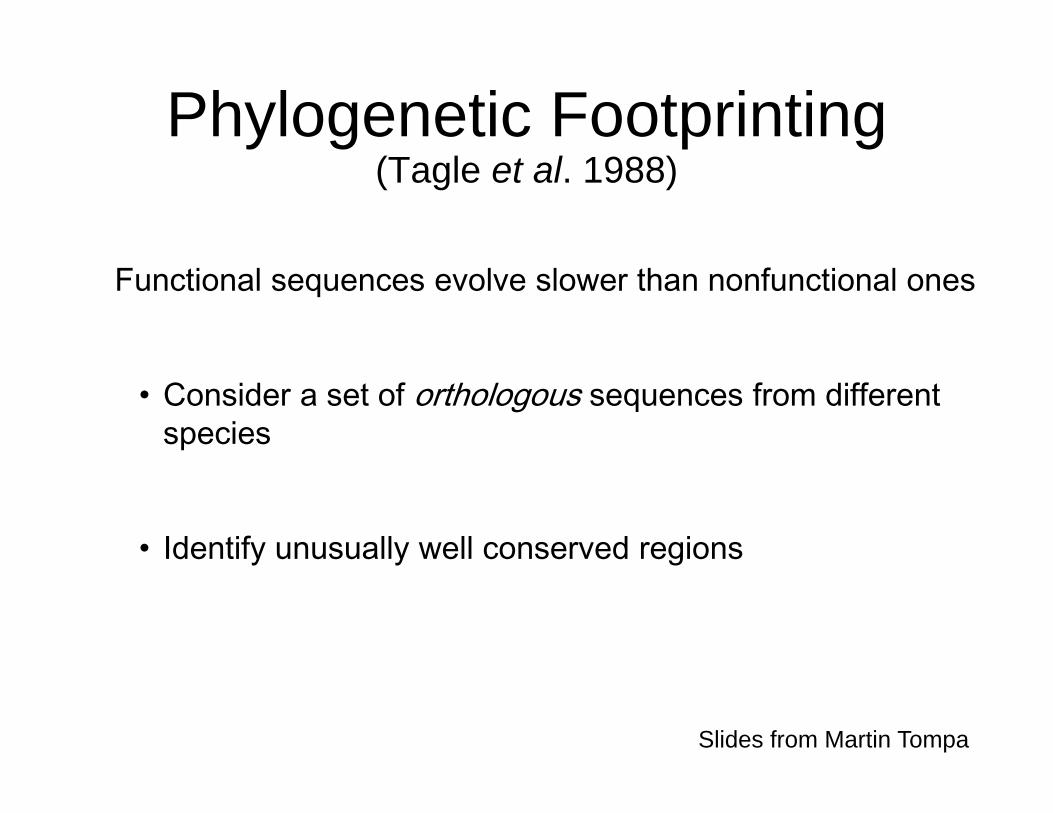
Phylogenetic Footprinting(Tagle et al. 1988)
Functional sequences evolve slower than nonfunctional ones
• Consider a set of orthologous sequences from different species
• Identify unusually well conserved regions
Slides from Martin Tompa

Evolutionary Conservation
CACGTGAACCACGTGACC CACGTGAAC

One of the earliest work
Discovery of regulatory elements by a computational method for phylogenetic footprinting. Blanchette M, Tompa M.Genome Res. 2002 May;12(5):739-48.
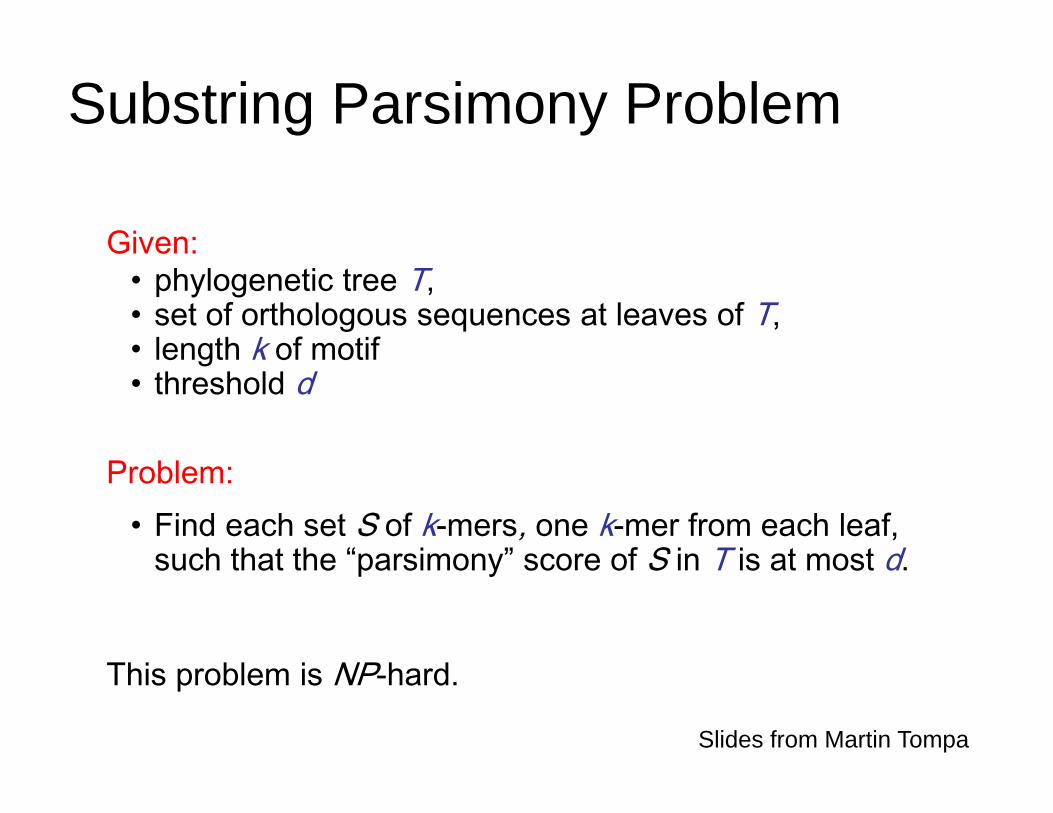
Substring Parsimony Problem
Given:• phylogenetic tree T,• set of orthologous sequences at leaves of T,• length k of motif• threshold d
Problem:• Find each set S of k-mers, one k-mer from each leaf,
such that the “parsimony” score of S in T is at most d.
This problem is NP-hard.
Slides from Martin Tompa
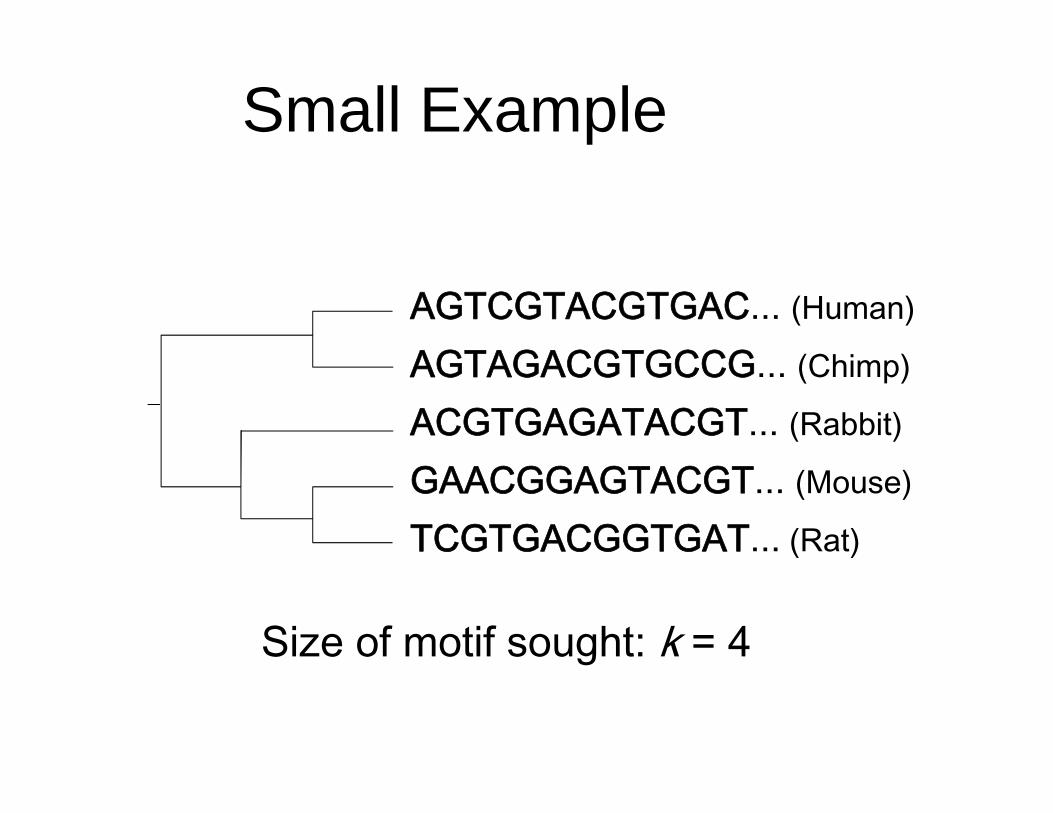
Small Example
AGTCGTACGTGAC... (Human)
AGTAGACGTGCCG... (Chimp)
ACGTGAGATACGT... (Rabbit)
GAACGGAGTACGT... (Mouse)
TCGTGACGGTGAT... (Rat)
Size of motif sought: k = 4

Solution
Parsimony score: 1 mutation
AGTCGTACGTGAC...AGTAGACGTGCCG...ACGTGAGATACGT...GAACGGAGTACGT...TCGTGACGGTGAT...ACGG
ACGT
ACGT
ACGT

CLUSTALW multiple sequence alignment (rbcS gene)
Cotton ACGGTT-TCCATTGGATGA---AATGAGATAAGAT---CACTGTGC---TTCTTCCACGTG--GCAGGTTGCCAAAGATA-------AGGCTTTACCATTPea GTTTTT-TCAGTTAGCTTA---GTGGGCATCTTA----CACGTGGC---ATTATTATCCTA--TT-GGTGGCTAATGATA-------AGG--TTAGCACATobacco TAGGAT-GAGATAAGATTA---CTGAGGTGCTTTA---CACGTGGC---ACCTCCATTGTG--GT-GACTTAAATGAAGA-------ATGGCTTAGCACCIce-plant TCCCAT-ACATTGACATAT---ATGGCCCGCCTGCGGCAACAAAAA---AACTAAAGGATA--GCTAGTTGCTACTACAATTC--CCATAACTCACCACCTurnip ATTCAT-ATAAATAGAAGG---TCCGCGAACATTG--AAATGTAGATCATGCGTCAGAATT--GTCCTCTCTTAATAGGA-------A-------GGAGCWheat TATGAT-AAAATGAAATAT---TTTGCCCAGCCA-----ACTCAGTCGCATCCTCGGACAA--TTTGTTATCAAGGAACTCAC--CCAAAAACAAGCAAADuckweed TCGGAT-GGGGGGGCATGAACACTTGCAATCATT-----TCATGACTCATTTCTGAACATGT-GCCCTTGGCAACGTGTAGACTGCCAACATTAATTAAALarch TAACAT-ATGATATAACAC---CGGGCACACATTCCTAAACAAAGAGTGATTTCAAATATATCGTTAATTACGACTAACAAAA--TGAAAGTACAAGACC
Cotton CAAGAAAAGTTTCCACCCTC------TTTGTGGTCATAATG-GTT-GTAATGTC-ATCTGATTT----AGGATCCAACGTCACCCTTTCTCCCA-----APea C---AAAACTTTTCAATCT-------TGTGTGGTTAATATG-ACT-GCAAAGTTTATCATTTTC----ACAATCCAACAA-ACTGGTTCT---------ATobacco AAAAATAATTTTCCAACCTTT---CATGTGTGGATATTAAG-ATTTGTATAATGTATCAAGAACC-ACATAATCCAATGGTTAGCTTTATTCCAAGATGAIce-plant ATCACACATTCTTCCATTTCATCCCCTTTTTCTTGGATGAG-ATAAGATATGGGTTCCTGCCAC----GTGGCACCATACCATGGTTTGTTA-ACGATAATurnip CAAAAGCATTGGCTCAAGTTG-----AGACGAGTAACCATACACATTCATACGTTTTCTTACAAG-ATAAGATAAGATAATGTTATTTCT---------AWheat GCTAGAAAAAGGTTGTGTGGCAGCCACCTAATGACATGAAGGACT-GAAATTTCCAGCACACACA-A-TGTATCCGACGGCAATGCTTCTTC--------Duckweed ATATAATATTAGAAAAAAATC-----TCCCATAGTATTTAGTATTTACCAAAAGTCACACGACCA-CTAGACTCCAATTTACCCAAATCACTAACCAATTLarch TTCTCGTATAAGGCCACCA-------TTGGTAGACACGTAGTATGCTAAATATGCACCACACACA-CTATCAGATATGGTAGTGGGATCTG--ACGGTCA
Cotton ACCAATCTCT---AAATGTT----GTGAGCT---TAG-GCCAAATTT-TATGACTATA--TAT----AGGGGATTGCACC----AAGGCAGTG-ACACTAPea GGCAGTGGCC---AACTAC--------------------CACAATTT-TAAGACCATAA-TAT----TGGAAATAGAA------AAATCAAT--ACATTATobacco GGGGGTTGTT---GATTTTT----GTCCGTTAGATAT-GCGAAATATGTAAAACCTTAT-CAT----TATATATAGAG------TGGTGGGCA-ACGATGIce-plant GGCTCTTAATCAAAAGTTTTAGGTGTGAATTTAGTTT-GATGAGTTTTAAGGTCCTTAT-TATA---TATAGGAAGGGGG----TGCTATGGA-GCAAGGTurnip CACCTTTCTTTAATCCTGTGGCAGTTAACGACGATATCATGAAATCTTGATCCTTCGAT-CATTAGGGCTTCATACCTCT----TGCGCTTCTCACTATAWheat CACTGATCCGGAGAAGATAAGGAAACGAGGCAACCAGCGAACGTGAGCCATCCCAACCA-CATCTGTACCAAAGAAACGG----GGCTATATATACCGTGDuckweed TTAGGTTGAATGGAAAATAG---AACGCAATAATGTCCGACATATTTCCTATATTTCCG-TTTTTCGAGAGAAGGCCTGTGTACCGATAAGGATGTAATCLarch CGCTTCTCCTCTGGAGTTATCCGATTGTAATCCTTGCAGTCCAATTTCTCTGGTCTGGC-CCA----ACCTTAGAGATTG----GGGCTTATA-TCTATA
Cotton T-TAAGGGATCAGTGAGAC-TCTTTTGTATAACTGTAGCAT--ATAGTACPea TATAAAGCAAGTTTTAGTA-CAAGCTTTGCAATTCAACCAC--A-AGAACTobacco CATAGACCATCTTGGAAGT-TTAAAGGGAAAAAAGGAAAAG--GGAGAAAIce-plant TCCTCATCAAAAGGGAAGTGTTTTTTCTCTAACTATATTACTAAGAGTACLarch TCTTCTTCACAC---AATCCATTTGTGTAGAGCCGCTGGAAGGTAAATCATurnip TATAGATAACCA---AAGCAATAGACAGACAAGTAAGTTAAG-AGAAAAGWheat GTGACCCGGCAATGGGGTCCTCAACTGTAGCCGGCATCCTCCTCTCCTCCDuckweed CATGGGGCGACG---CAGTGTGTGGAGGAGCAGGCTCAGTCTCCTTCTCG
Slides from Martin Tompa
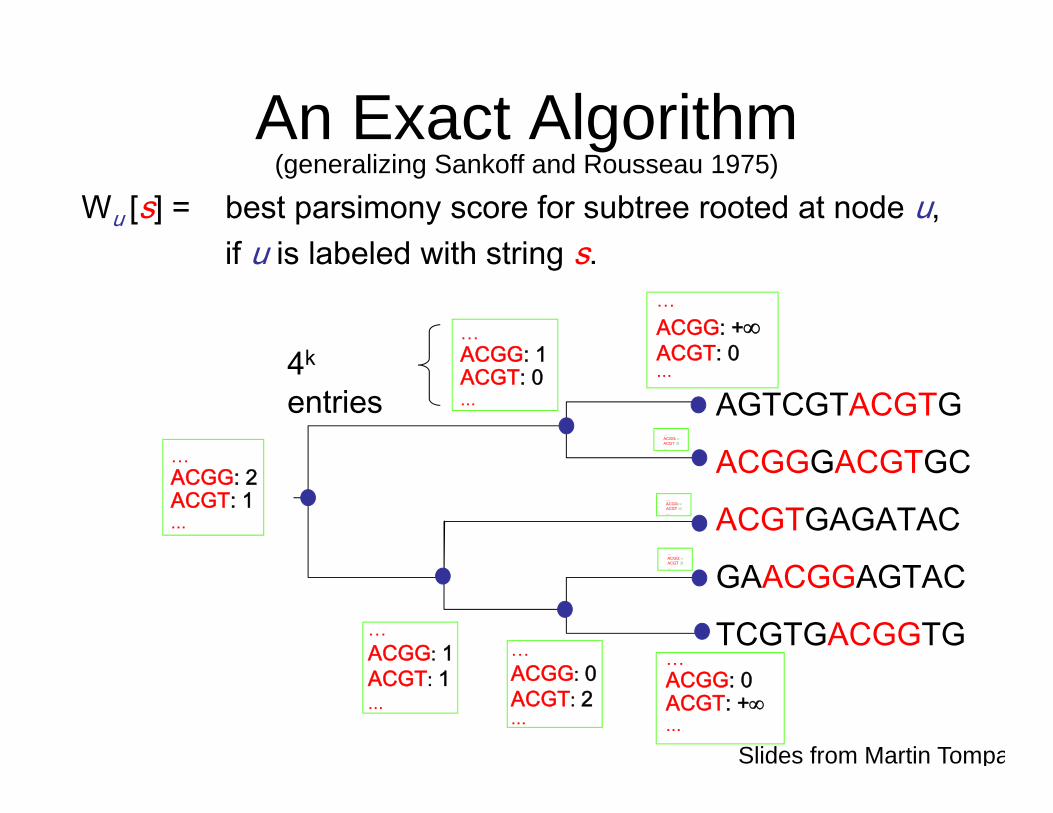
An Exact Algorithm(generalizing Sankoff and Rousseau 1975)
Wu [s] = best parsimony score for subtree rooted at node u,if u is labeled with string s.
AGTCGTACGTG
ACGGGACGTGC
ACGTGAGATAC
GAACGGAGTAC
TCGTGACGGTG
… ACGG: 2ACGT: 1...
… ACGG: 0ACGT: 2...
… ACGG: 1ACGT: 1...
… ACGG: +ACGT: 0...
… ACGG: 1 ACGT: 0 ...
4k
entries
… ACGG: 0 ACGT: +...
… ACGG:ACGT :0 ...
… ACGG:ACGT :0 ...
… ACGG:ACGT :0 ...
Slides from Martin Tompa
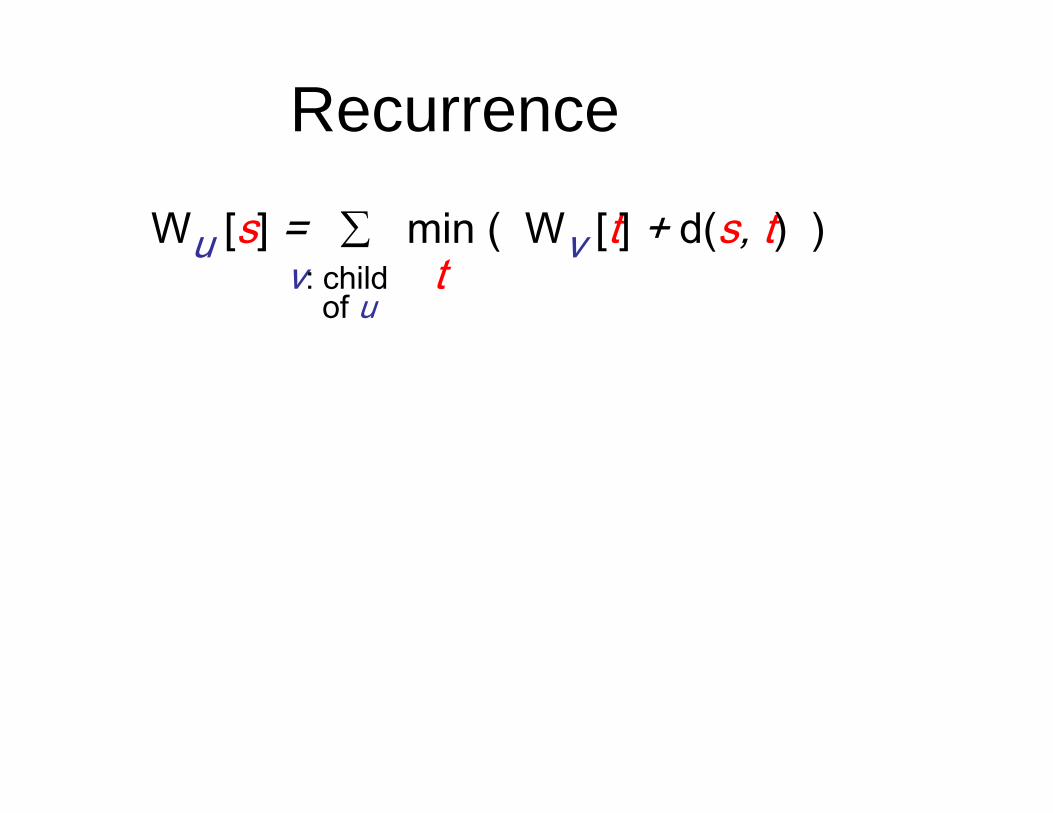
Wu [s] = min ( Wv [t] + d(s, t) ) v: child t
of u
Recurrence

O(k 42k )time per
node
Wu [s] = min ( Wv [t] + d(s, t) ) v: child t
of u
Running Time
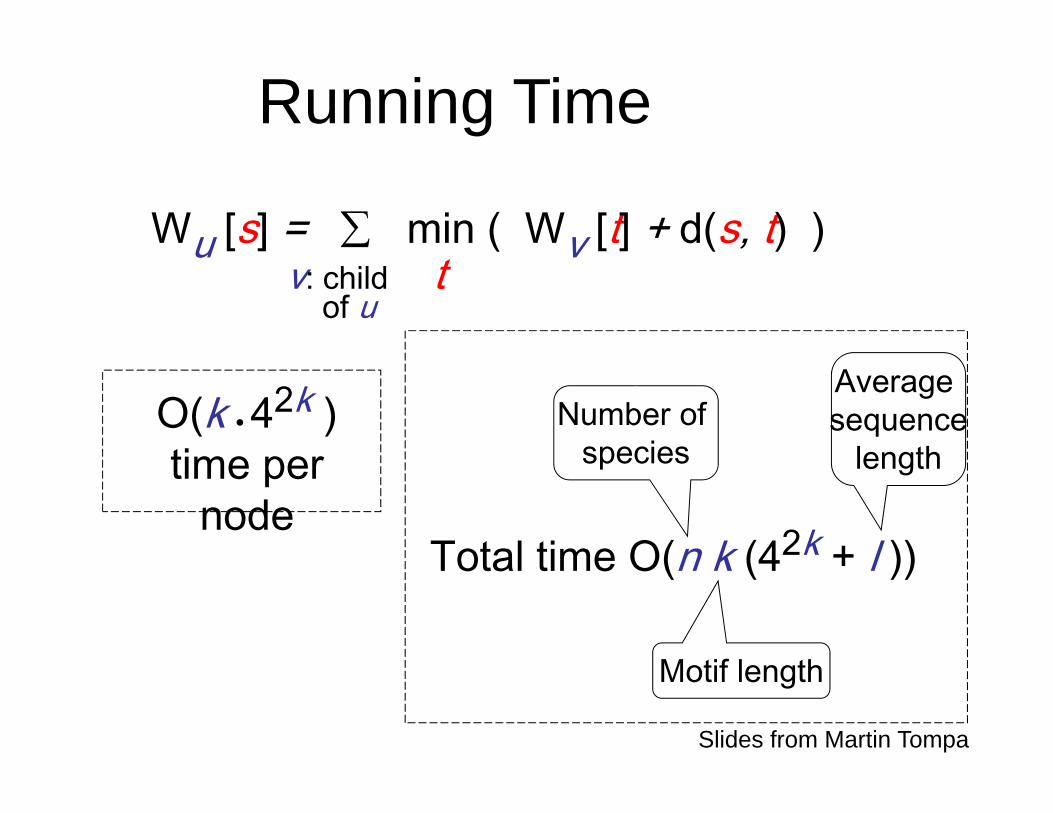
O(k 42k )time per
node
Number of species
Average sequence
length
Motif length
Total time O(n k (42k + l ))
Wu [s] = min ( Wv [t] + d(s, t) ) v: child t
of u
Running Time
Slides from Martin Tompa
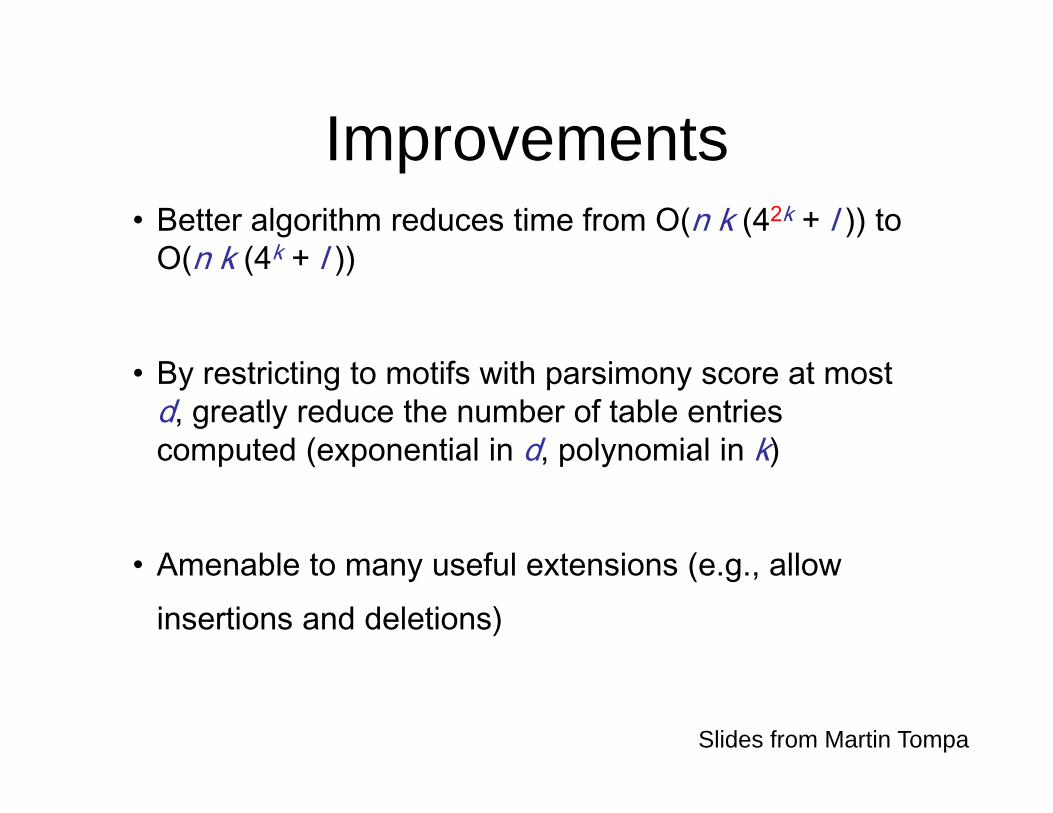
Improvements• Better algorithm reduces time from O(n k (42k + l )) to
O(n k (4k + l ))
• By restricting to motifs with parsimony score at most d, greatly reduce the number of table entries computed (exponential in d, polynomial in k)
• Amenable to many useful extensions (e.g., allow insertions and deletions)
Slides from Martin Tompa
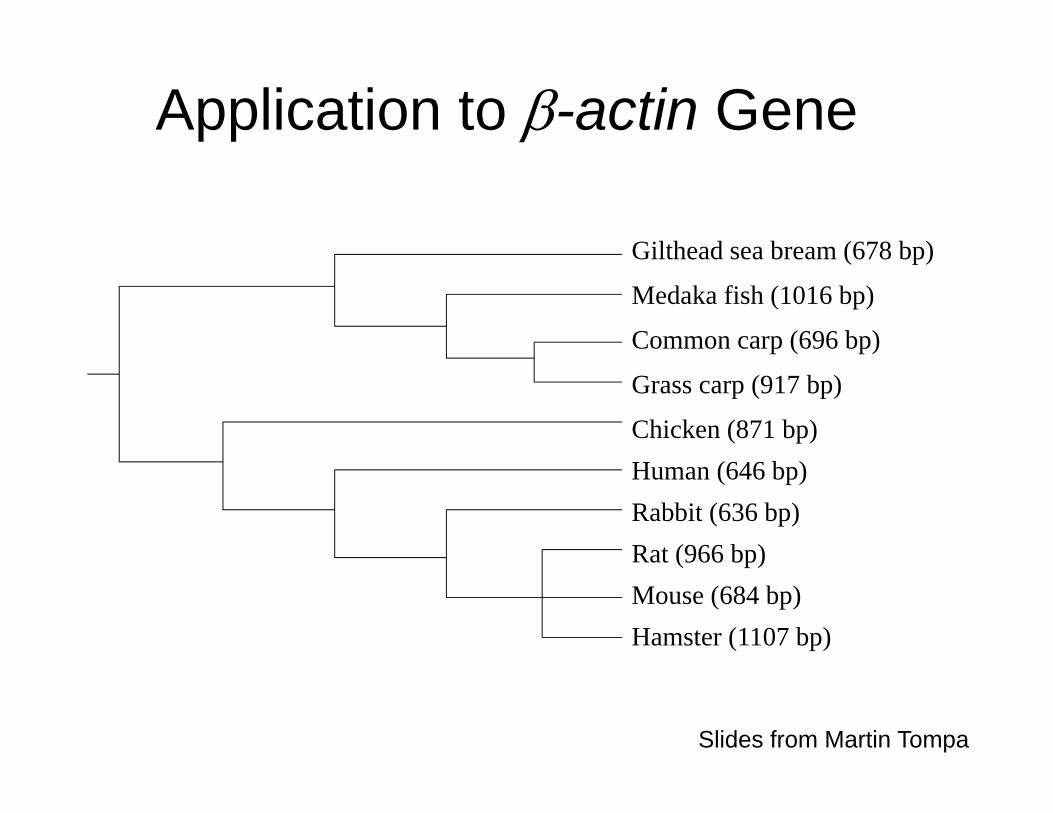
Application to -actin Gene
Gilthead sea bream (678 bp)
Medaka fish (1016 bp)
Common carp (696 bp)
Grass carp (917 bp)
Chicken (871 bp)Human (646 bp)Rabbit (636 bp)Rat (966 bp)Mouse (684 bp)Hamster (1107 bp)
Slides from Martin Tompa

Common carpACGGACTGTTACCACTTCACGCCGACTCAACTGCGCAGAGAAAAACTTCAAACGACAACATTGGCATGGCTTTTGTTATTTTTGGCGCTTGACTCAGGATCTAAAAACTGGAACGGCGAAGGTGACGGCAATGTTTTGGCAAATAAGCATCCCCGAAGTTCTACAATGCATCTGAGGACTCAATGTTTTTTTTTTTTTTTTTTCTTTAGTCATTCCAAATGTTTGTTAAATGCATTGTTCCGAAACTTATTTGCCTCTATGAAGGCTGCCCAGTAATTGGGAGCATACTTAACATTGTAGTATTGTATGTAAATTATGTAACAAAACAATGACTGGGTTTTTGTACTTTCAGCCTTAATCTTGGGTTTTTTTTTTTTTTTGGTTCCAAAAAACTAAGCTTTACCATTCAAGATGTAAA
GGTTTCATTCCCCCTGGCATATTGAAAAAGCTGTGTGGAACGTGGCGGTGCAGACATTTGGTGGGGCCAACCTGTACACTGACTAATTCAAATAAAAGTGCACATGTAAGACATCCTACTCTGTGTGATTTTTCTGTTTGTGCTGAGTGAACTTGCTATGAAGTCTTTTAGTGCACTCTTTAATAAAAGTAGTCTTCCCTTAAAGTGTCCCTTCCCTTATGGCCTTCACATTTCTCAACTAGCGCTTCAACTAGAAAGCACTTTAGGGACTGGGATGC
ChickenACCGGACTGTTACCAACACCCACACCCCTGTGATGAAACAAAACCCATAAATGCGCATAAAACAAGACGAGATTGGCATGGCTTTATTTGTTTTTTCTTTTGGC
GCTTGACTCAGGATTAAAAAACTGGAATGGTGAAGGTGTCAGCAGCAGTCTTAAAATGAAACATGTTGGAGCGAACGCCCCCAAAGTTCTACAATGCATCTGAGGACTTTGATTGTACATTTGTTTCTTTTTTAATAGTCATTCCAAATATTGTTATAATGCATTGTTACAGGAAGTTACTCGCCTCTGTGAAGGCAACAGCCCAGCTGGGAGGAGCCGGTACCAATTACTGGTGTTAGATGATAATTGCTTGTCTGTAAATTATGTAACCCAACAAGTGTCTTTTTGTATCTTCCGCCTTAAAAACAAAACACACTTGATCCTTTTTGGTTTGTCAAGCAAGCGGGCTGTGTTCCCCAGTGATAGATGTGAATGAAGGCTTTACAGTCCCCCACAGTCTAGGAGTAAAGTGCCAGTATGTGGG
GGAGGGAGGGGCTACCTGTACACTGACTTAAGACCAGTTCAAATAAAAGTGCACACAATAGAGGCTTGACTGGTGTTGGTTTTTATTTCTGTGCTGCGCTGCTTGGCCGTTGGTAGCTGTTCTCATCTAGCCTTGCCAGCCTGTGTGGGTCAGCTATCTGCATGGGCTGCGTGCTGGTGCTGTCTGGTGCAGAGGTTGGATAAACCGTGATGATATTTCAGCAAGTGGGAGTTGGCTCTGATTCCATCCTGAGCTGCCATCAGTGTGTTCTGAAGGAAGCTGTTGGATGAGGGTGGGCTGAGTGCTGGGGGACAGCTGGGCTCAGTGGGACTGCAGCTGTGCT
HumanGCGGACTATGACTTAGTTGCGTTACACCCTTTCTTGACAAAACCTAACTTGCGCAGAAAACAAGATGAGATTGGCATGGCTTTATTTGTTTTTTTTGTTTTGTT
TTGGTTTTTTTTTTTTTTTTGGCTTGACTCAGGATTTAAAAACTGGAACGGTGAAGGTGACAGCAGTCGGTTGGAGCGAGCATCCCCCAAAGTTCACAATGTGGCCGAGGACTTTGATTGCATTGTTGTTTTTTTAATAGTCATTCCAAATATGAGATGCATTGTTACAGGAAGTCCCTTGCCATCCTAAAAGCCACCCCACTTCTCTCTAAGGAGAATGGCCCAGTCCTCTCCCAAGTCCACACAGGGGAGGTGATAGCATTGCTTTCGTGTAAATTATGTAATGCAAAATTTTTTTAATCTTCGCCTTAATACTTTTTTATTTTGTTTTATTTTGAATGATGAGCCTTCGTGCCCCCCCTTCCCCCTTTTTGTCCCCCAACTTGAGATGTATGAAGGCTTTTGGTCTCCCTGGGAGTGGGTGG
AGGCAGCCAGGGCTTACCTGTACACTGACTTGAGACCAGTTGAATAAAAGTGCACACCTTAAAAATGAGGCCAAGTGTGACTTTGTGGTGTGGCTGGGTTGGGGGCAGCAGAGGGTG
Parsimony score over 10 vertebrates: 0 1 2Slides from Martin Tompa

Current methods
One species Multiple species
•MEME (Bailey et al. 1994)
•AlignACE (Roth et al. 1998)
•BioProspector (Liu et al. 2001)
•MDscan (Liu et al. 2002)
•MITRA (Eskin et al. 2002)
•FootPrinter (Blanchette et al. 2003)
•PhyloCon (Wang et al. 2003)
•CompareProspector (Liu et al. 2004)
•OrthoMEME (Prakash et al. 2004)
•EMnEM (Moses et al. 2004 )
•PhyloGibbs (Siddharthan et al. 2004)
•PhyME (Sinha et al. 2004)

Limitations of current methods
Often find motifs in the pre-aligned sequences.
•FootPrinter (Blanchette et al. 2003)
•PhyloCon (Wang et al. 2003)
•CompareProspector (Liu et al. 2004)•OrthoMEME (Prakash et al. 2004)
•EMnEM (Moses et al. 2004)
•PhyloGibbs (Siddharthan et al. 2004)
•PhyME (Sinha et al. 2004)

Motif instances are not aligned
BCL2, GLi target, the transfac motif instance is GACCACCAA.
Alignment block 1 of 1 in window, 59138739 - 59138761, 23 bps Human gacttggtg-----gtcgctggggtccgMouse ggctggacgtgcctatagccagggcc--
Rat ggatgggtgcgcttattgccagggtcagRabbit ============================Dog NNNNNNNNNNNNNNNNNNNNNNNNNNNN
Elephant gggccgcgg-----gcgggcgagcggagOpossum ggctaggcg-------ggctaggttcgg
Chicken ============================tropicalis ============================
Tetraodon ============================

Limitations of current methodsPhylogenetic information is used ineffectively.
•FootPrinter (Blanchette et al. 2004)
•CompareProspector (Liu et al. 2004)
•PhyloCon (Wang et al. 2004)
•OrthoMEME (Prakash et al. 2004)•EMnEM (Moses et al. 2004)
•PhyloGibbs (Siddharthan et al. 2004)•PhyME (Sinha et al. 2004)

•How to find motif without alignment?
•How to explore phylogenetic tree properly?
Can we do better?
TGS: Tree Gibbs Sampler!!!

Outline
• Background• Current motif finding methods• Tree Gibbs Sampler (TGS)
– Overview– Results
• Motif verification– Overview– Results

How to find the ancestral motif
instances?
How did the motifs evolve?
Overview of TGS
Colored lines: regulatory regions of genesColored boxes: motif instances

How to find the ancestral motif instances?
CACGTGAACCACGTGACC CACGTGAAC
1 2 3 4 5 6 7 8 9A .036 .892 .036 .036 .036 .036 .892 .036 .036C .892 .036 .892 .036 .036 .036 .036 .75 .75 G .036 .036 .036 .892 .036 .892 .036 .036 .036T .036 .036 .036 .036 .892 .036 .036 .178 .178
Ancestral motif weight matrix:

A C G TA 0.8515 0.0278 0.0775 0.0432C 0.0464 0.8026 0.0344 0.1167G 0.1167 0.0350 0.8023 0.0460T 0.0429 0.0785 0.0264 0.8522
Background substitution matrix
A C G TA 0.9802 0.0066 0.0066 0.0066C 0.0120 0.9640 0.0120 0.0120G 0.0120 0.0120 0.9640 0.0120T 0.0066 0.0066 0.0066 0.9802
Motif substitution matrix
How did the motifs evolve?
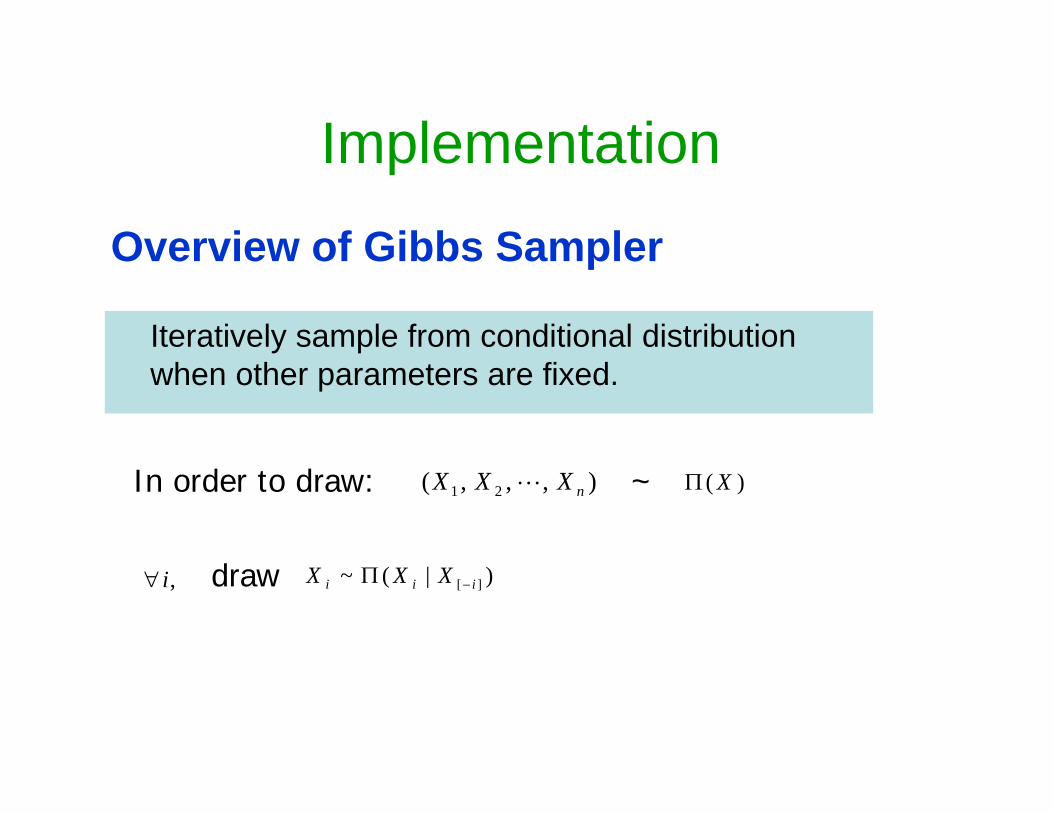
Overview of Gibbs Sampler
Iteratively sample from conditional distribution when other parameters are fixed.
,i draw )|(~ ][ iii XXX
),,,( 21 nXXX )( X~In order to draw:
Implementation

ImplementationParameters
0
ip
Ancestral motif weight matrix at the root
Background distribution (multinomial)
Probability that a gene in the i-th species will contain the motif
w Motif width
iM 0 Background substitution matrix for the i-th branch
iM1 Motif substitution matrix for the i-th branch

ImplementationPrior distribution
0
ip
w
iM 0
iM1
Beta(1,1)
Poisson distribution

ImplementationInitialization
Parameters are sampled by using prior distributions;
Motif instances in current species are sampled from sequences directly for each current species;
Motif instances in ancestral species are randomly assigned with one of its immediate child motif instances.
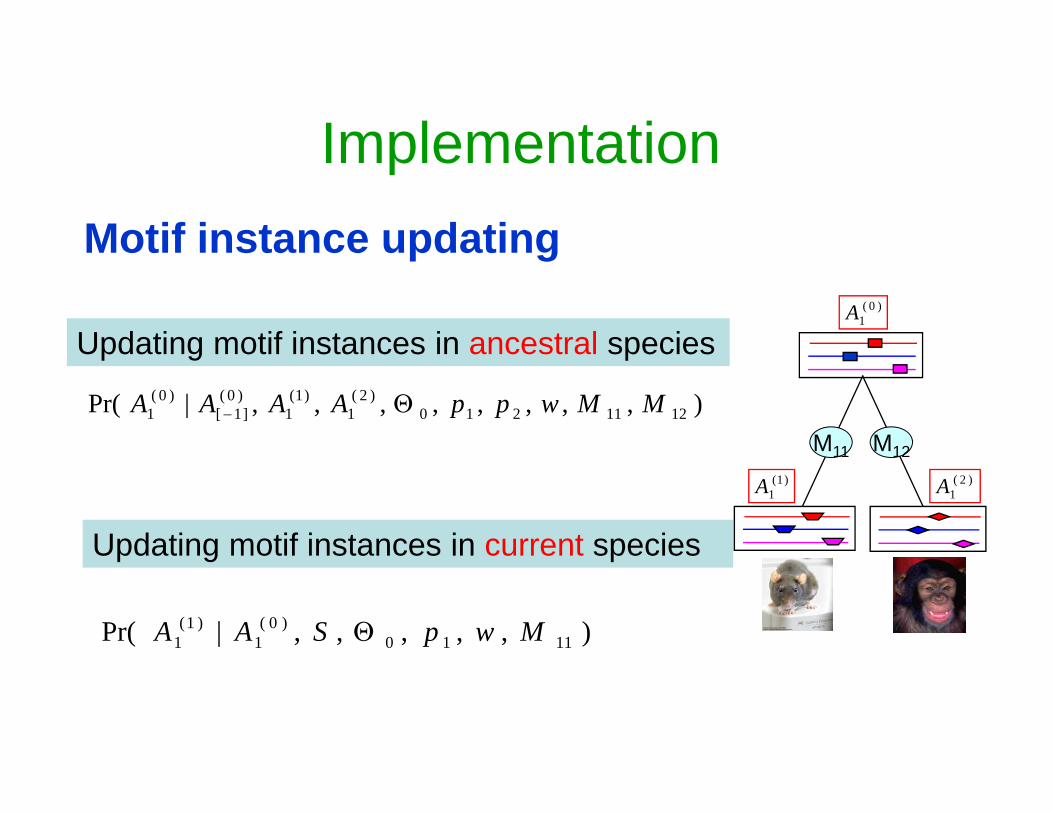
ImplementationMotif instance updating
),,,,,,,,|Pr( 1211210)2(
1)1(
1)0(]1[
)0(1 MMwppAAAA
Updating motif instances in ancestral species
),,,,,|Pr( 1110)0(
1)1(
1 MwpSAA
Updating motif instances in current species
M11 M12
)0(1A
)1(1A )2(
1A
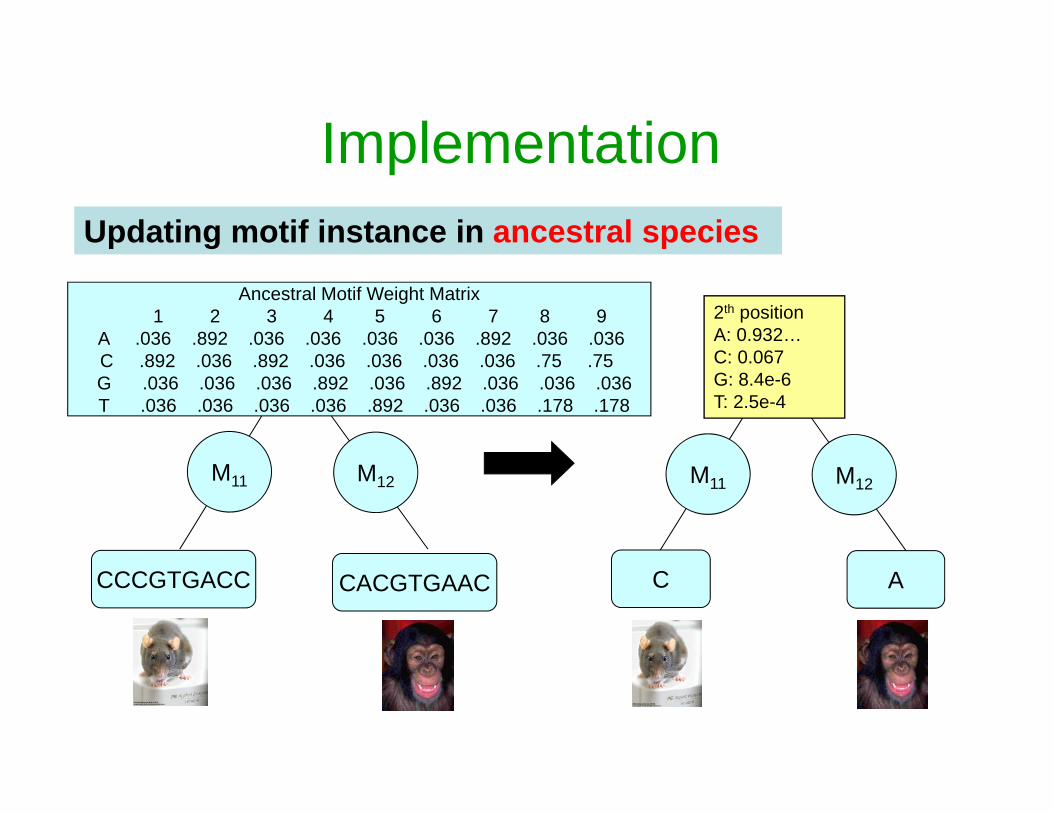
ImplementationUpdating motif instance in ancestral species
M11 M12
CCCGTGACC CACGTGAAC
Ancestral Motif Weight Matrix1 2 3 4 5 6 7 8 9
A .036 .892 .036 .036 .036 .036 .892 .036 .036C .892 .036 .892 .036 .036 .036 .036 .75 .75 G .036 .036 .036 .892 .036 .892 .036 .036 .036 T .036 .036 .036 .036 .892 .036 .036 .178 .178
M11 M12
C A
2th positionA: 0.932…C: 0.067G: 8.4e-6T: 2.5e-4
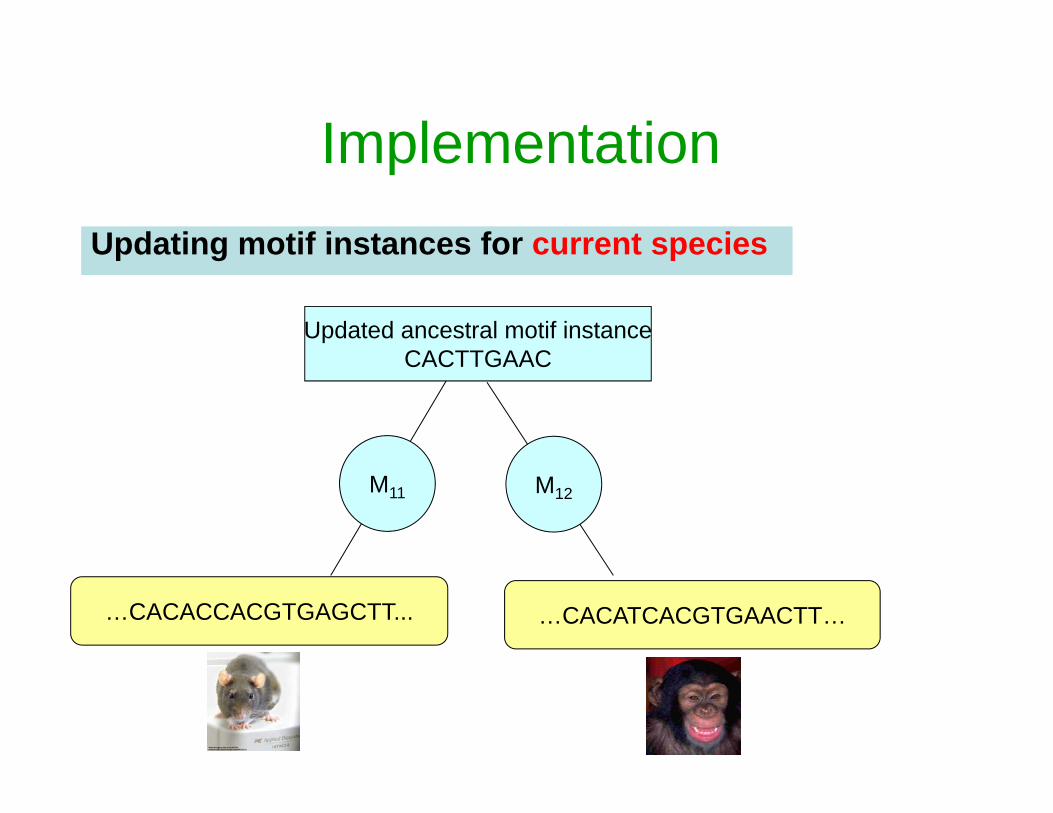
M11 M12
…CACACCACGTGAGCTT... …CACATCACGTGAACTT…
Updated ancestral motif instanceCACTTGAAC
Updating motif instances for current species
Implementation

Multiple Species??
CACGTGAAC CACGTGAAC CAGGTGATC
CACGTGAAC
CACGTGATC
CAGGTGATC
4
10
4
1
14
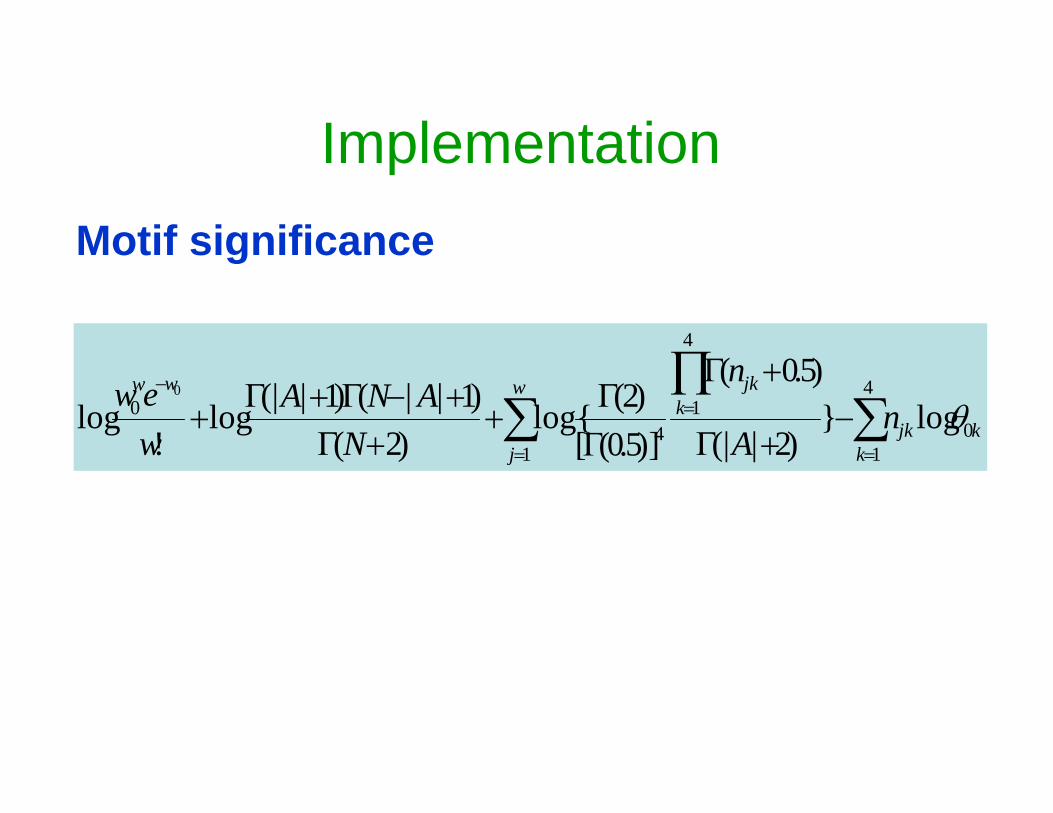
0 log})2|(|
)5.0(
)]5.0([)2(log{
)2()1||()1|(|log
!log
0
kkjk
kjkw
j
ww
nA
n
NANA
wew
Motif significance
Implementation
Outline
• Background• Current motif finding methods• Tree Gibbs Sampler (TGS)
– Overview– Results
• Motif verification– Overview– Results
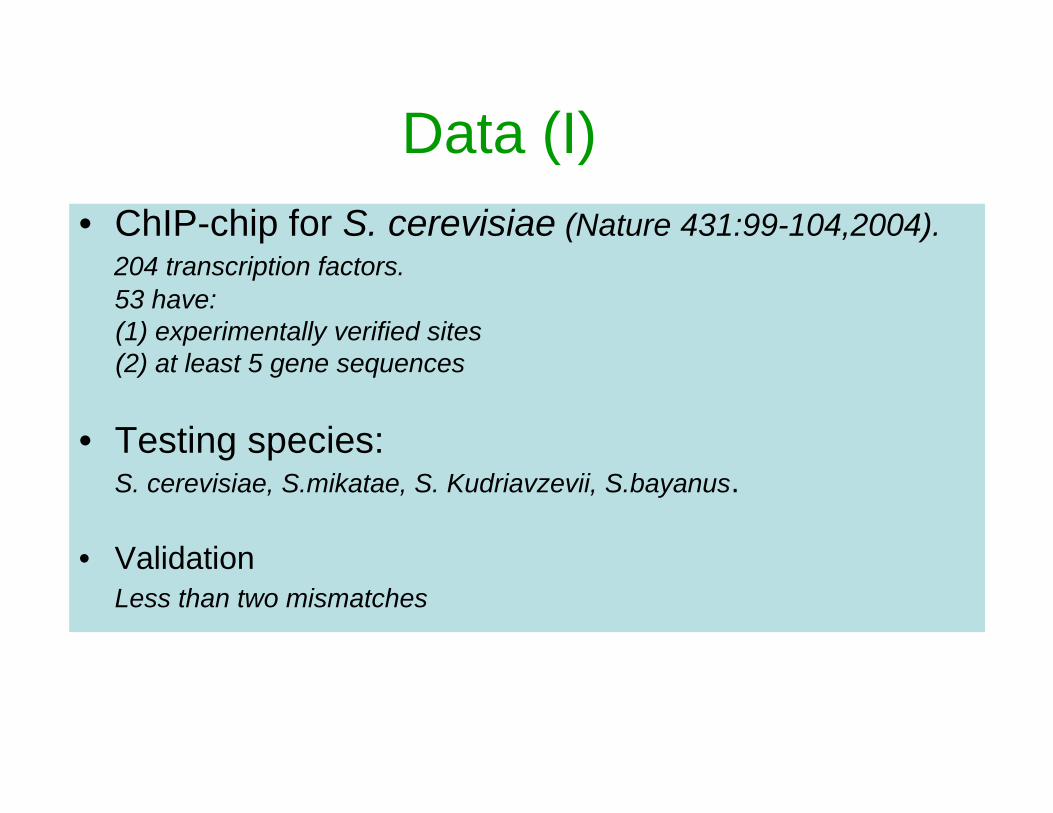
Data (I)• ChIP-chip for S. cerevisiae (Nature 431:99-104,2004).
204 transcription factors. 53 have:(1) experimentally verified sites (2) at least 5 gene sequences
• Testing species:S. cerevisiae, S.mikatae, S. Kudriavzevii, S.bayanus.
• Validation Less than two mismatches

Result (1): True Positive
CompareProspector 30/53
(4130)/53=
20.75%
5.66% improvement over MEME
PhyloCon 27/53
Tree Gibbs Sampler 41/53!

Result (1): False Positive
CompareProspector 18/48=37.5%
PhyloCon 6/32=18.75%
Tree Gibbs Sampler 8/49=16.33%
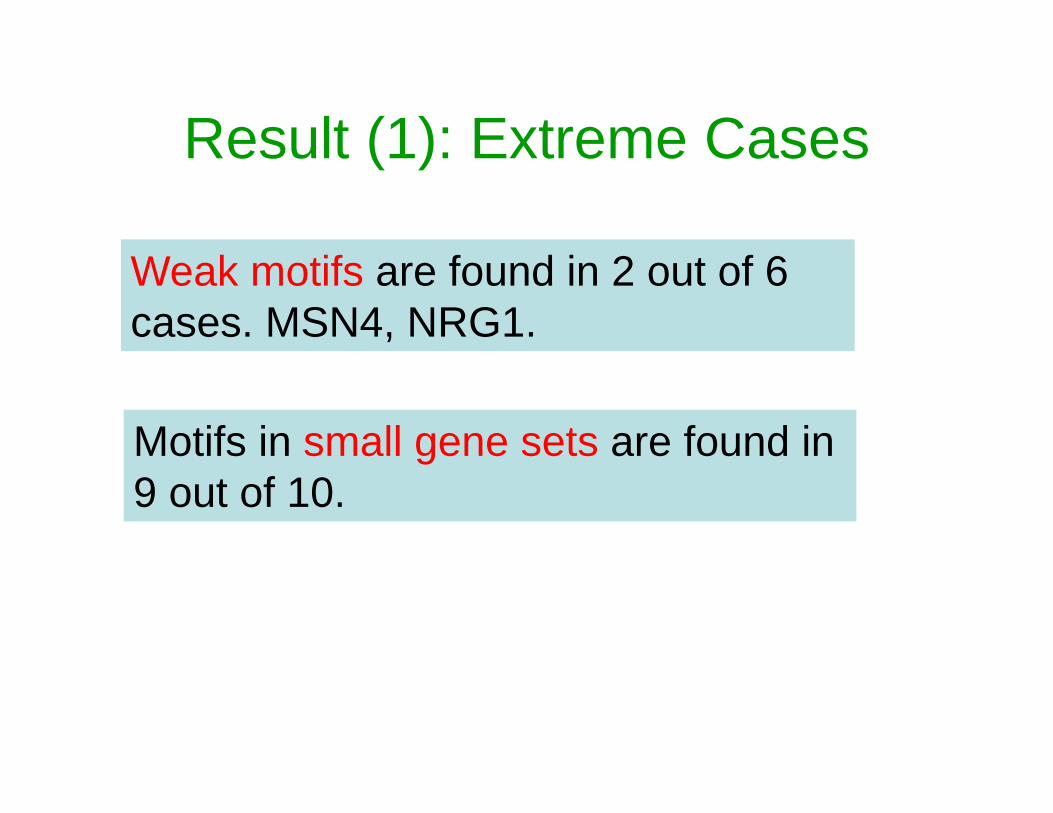
Result (1): Extreme Cases
Weak motifs are found in 2 out of 6 cases. MSN4, NRG1.
Motifs in small gene sets are found in 9 out of 10.

Data (II)
•63 Ribosomal protein genes for D. melanogaster.
•Test Species:
D. melanogaster, Anopheles gambiae.
•Literature.
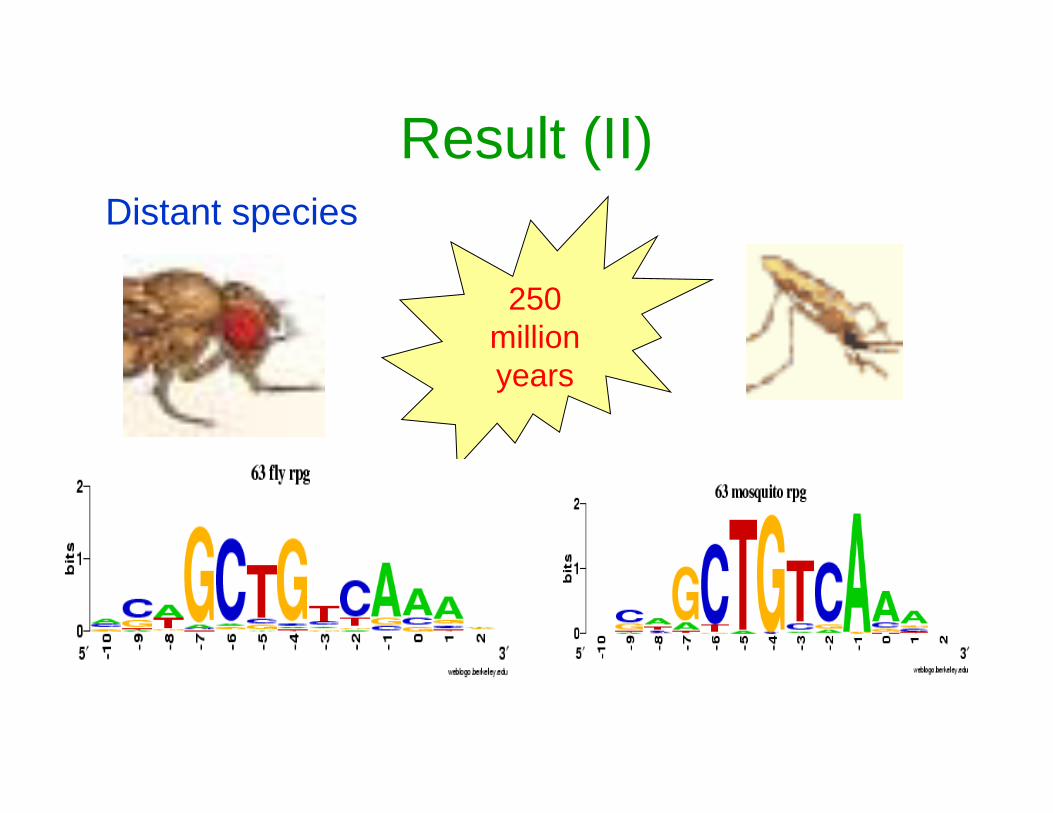
Result (II)Distant species
250 million years
Summary
•Unaligned sequences •Weak motifs•Small gene sets•Distant species•Different motifs from the same origin

Li, X., Wong, WH. (2005)Sampling motifs on phylogenetic trees Proc Natl Acad Sci U S A. 102(27): 9481-6.
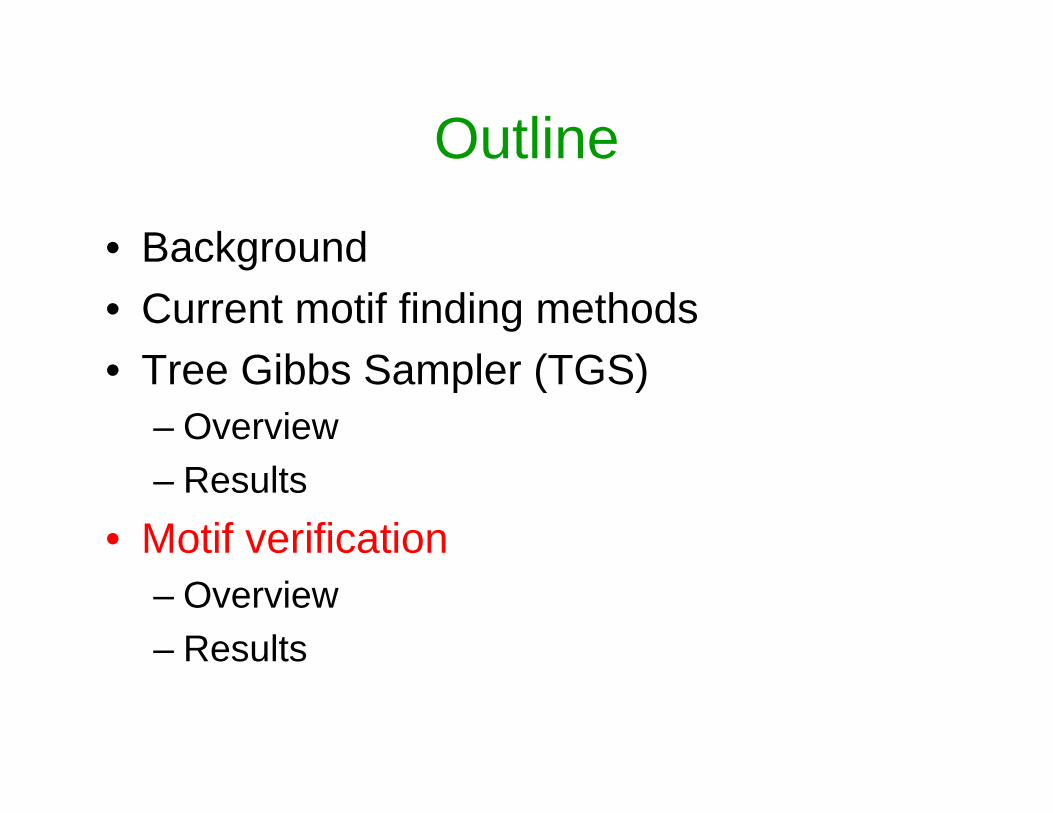
Outline
• Background• Current motif finding methods• Tree Gibbs Sampler (TGS)
– Overview– Results
• Motif verification– Overview– Results

Motif Verification
Which are the real ones in the output of any software?
Independent evidence
MEME on each species, then hypothesis testing by conservation information
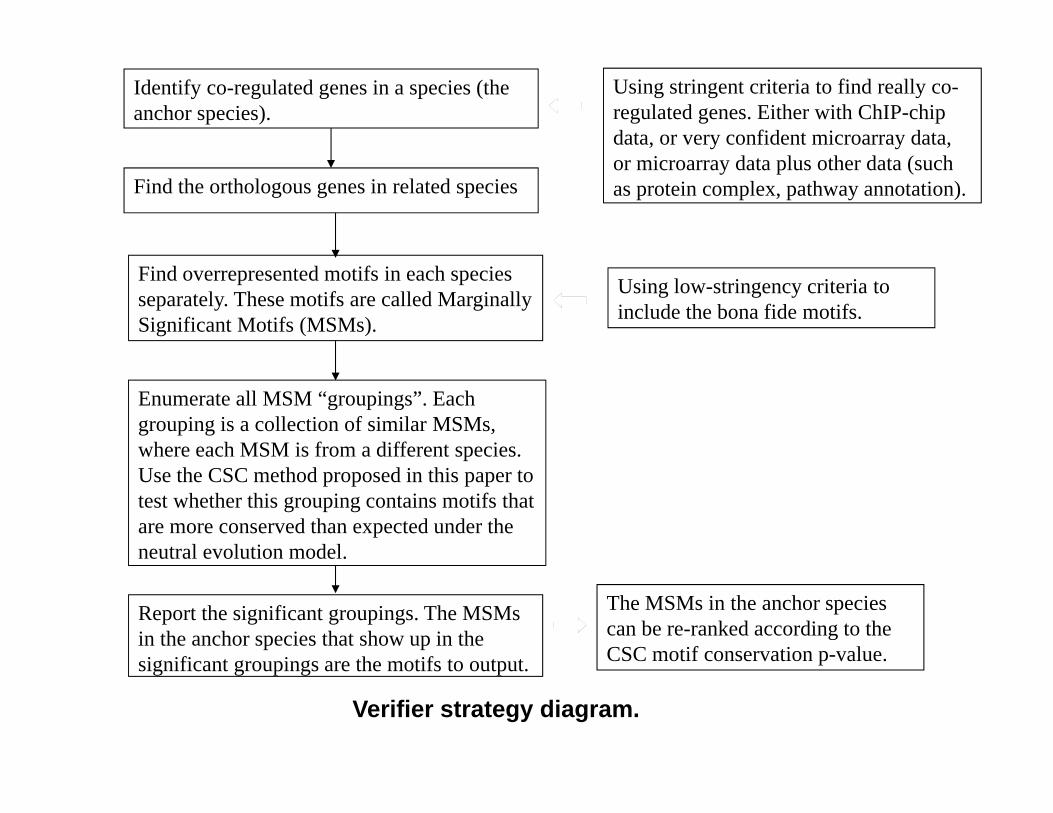
Find overrepresented motifs in each species separately. These motifs are called Marginally Significant Motifs (MSMs).
Using stringent criteria to find really co-regulated genes. Either with ChIP-chip data, or very confident microarray data, or microarray data plus other data (such as protein complex, pathway annotation).Find the orthologous genes in related species
Using low-stringency criteria to include the bona fide motifs.
The MSMs in the anchor species can be re-ranked according to the CSC motif conservation p-value.
Identify co-regulated genes in a species (the anchor species).
Report the significant groupings. The MSMs in the anchor species that show up in the significant groupings are the motifs to output.
Enumerate all MSM “groupings”. Each grouping is a collection of similar MSMs, where each MSM is from a different species. Use the CSC method proposed in this paper to test whether this grouping contains motifs that are more conserved than expected under the neutral evolution model.
Verifier strategy diagram.

Figure 2. The construction of the test statistic for testing whether a group of MSMs evolved from the same ancestral motif.
For every orthologous group of genes, g, do the following
Set x=0
Construct the ancestral motif weight matrix from all the ancestral instances on all the genes, except g.
Scan the orthologous sequences for gene g
x = x +1 if there are two or more genes, including the anchor gene, containing real motif instances of the ancestral motif.
Finished for all orthologous gene groups?No
Yes
Output x
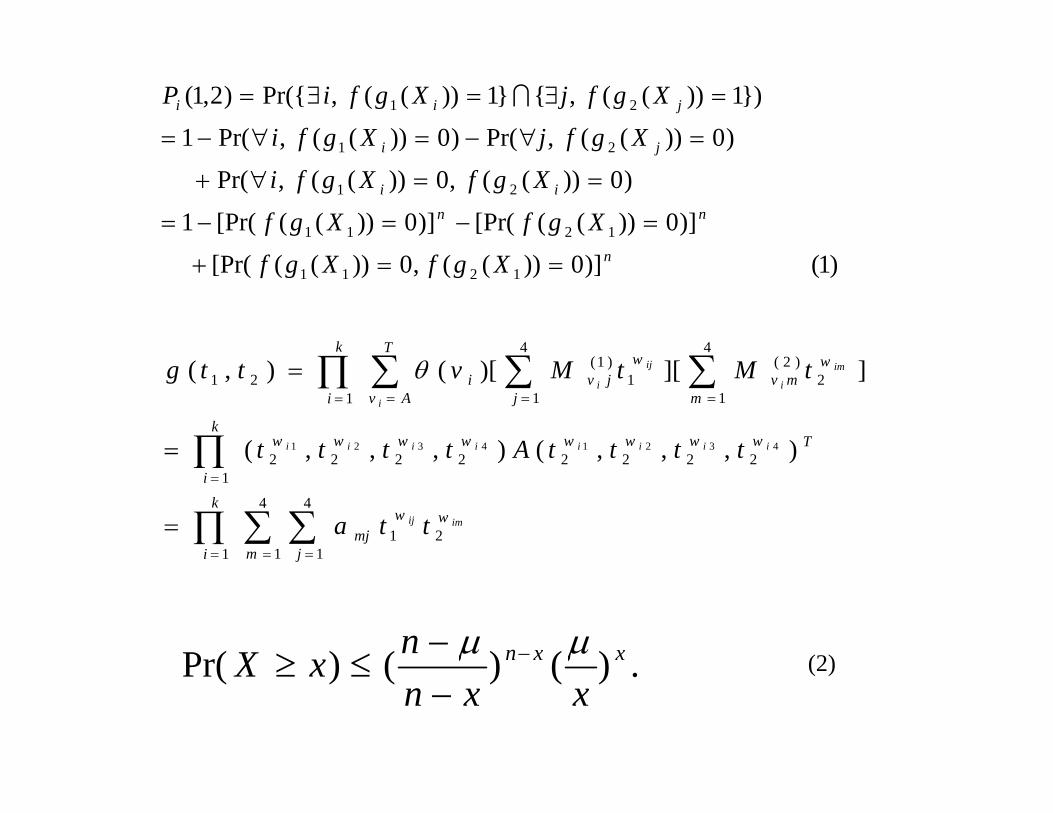
)1()]0))((,0))(([Pr(
)]0))(([Pr()]0))(([Pr(1
)0))((,0))((,Pr(
)0))((,Pr()0))((,Pr(1
})1))((,{}1))((,Pr({)2,1(
1211
1211
21
21
21
n
nnii
ji
jii
XgfXgf
XgfXgf
XgfXgfi
XgfjXgfi
XgfjXgfiP
k
i m j
wwmj
k
i
Twwwwwwww
k
i
T
Av m
wmv
j
wjvi
imij
iiiiiiii
i
im
i
ij
i
tta
ttttAtttt
tMtMvttg
1
4
1
4
121
122222222
1
4
12
)2(4
11
)1(21
),,,(),,,(
]][)[(),(
43214321
(2).)()()Pr( xxn
xxnnxX
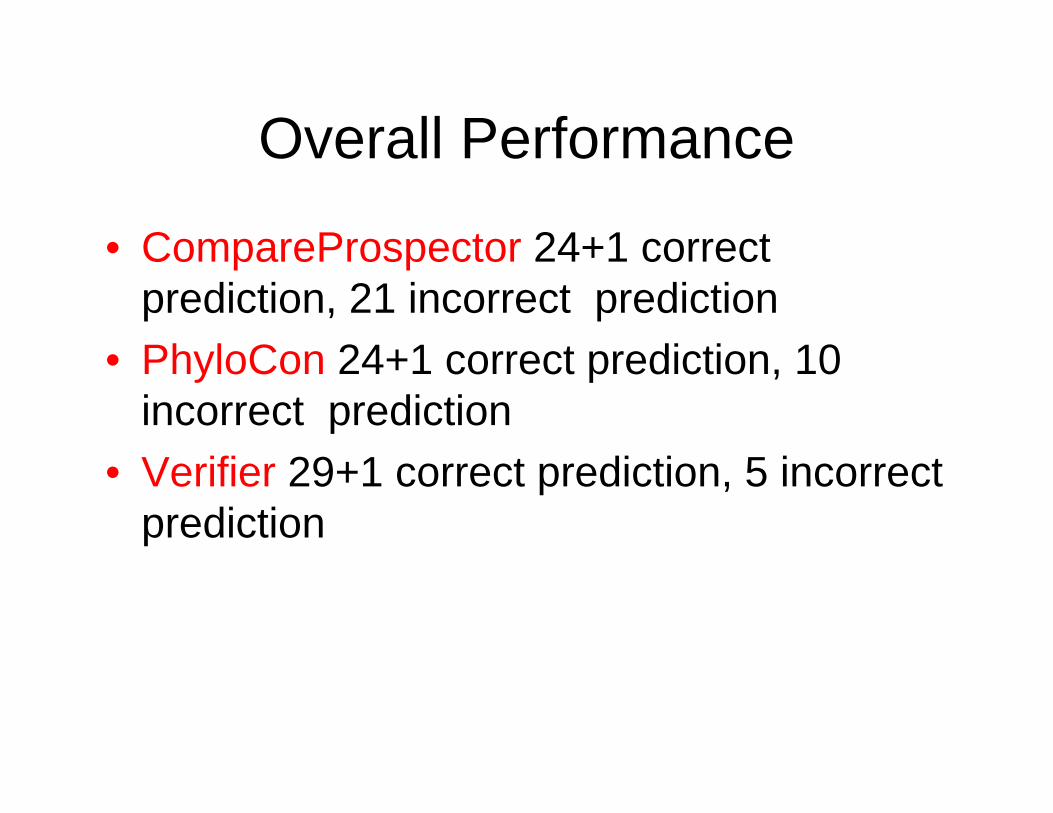
Overall Performance
• CompareProspector 24+1 correct prediction, 21 incorrect prediction
• PhyloCon 24+1 correct prediction, 10 incorrect prediction
• Verifier 29+1 correct prediction, 5 incorrect prediction


Reliable prediction of transcription factor binding sites by phylogenetic verification
Li, Zhong & WongPNAS vol 102, 16945-16950
Summary and outlook
• Blanchette et al’s method is an early work based on one group of orthologous sequences.
• We have developed two efficient methods for identifying transcription factor binding sites in the promoter regions.
• Future motif identification should target at motif modules. Hu J, Hu H, Li X. Nucleic Acids Res. 2008 Aug;36(13):4488-97. Epub 2008 Jul 7. and the entire non-coding regions.