photosynthesis monitoring to optimize growth of … · photosynthesis monitoring to optimize growth...
TRANSCRIPT

AQUATIC BIOLOGYAquat Biol
Vol. 22: 123–140, 2014doi: 10.3354/ab00597
Published November 20
INTRODUCTION
Microalgal culture
Microalgae—i.e. microscopic prokaryotic cyano-bacteria and eukaryotic algae—represent importantprimary producers in nature and form the basis of thefood chain in aquatic environments. Their substantialbenefits over plants are based on their short life
cycles and metabolic plasticity that offers the possi-bility of modifying their biochemical pathways andcellular composition by varying culture conditions.In microalgal biotechnology, suitable species can begrown as productive strains in aquacultures facilitat-ing the efficient manipulation of the cultivation pro-cess. The ‘mass culture of microalgae’, dense (>0.5 gdry weight, DW, l−1) and well-mixed, with sufficientnutrition and gas exchange, represents an artificial
© The authors 2014. Open Access under Creative Commons byAttribution Licence. Use, distribution and reproduction are un -restricted. Authors and original publication must be credited.
Publisher: Inter-Research · www.int-res.com
*Corresponding author: [email protected]
Photosynthesis monitoring to optimize growth ofmicroalgal mass cultures: application of
chlorophyll fluorescence techniques
José R. F. Malapascua1,2, Celia G. Jerez3, Magda Sergejevová1, Félix L. Figueroa3,
Jirí Masojídek1,2,*
1Laboratory of Algal Biotechnology, Institute of Microbiology, Academy of Science, Opatovický mlýn, 37981 Trebon, Czech Republic
2Faculty of Science, University of South Bohemia, Branišovská, 37005 Ceské Budejovice, Czech Republic3Department of Ecology, Faculty of Sciences, University of Málaga, Campus Universitario de Teatinos s/n, 29071 Málaga, Spain
ABSTRACT: Since the mid-1990s, chlorophyll a (chl a) fluorescence measurement has becomewidespread to monitor photosynthetic performance of microalgal mass cultures. This paper aimsto provide practical instructions for microalgal physiologists and biotechnologists on how fluores-cence monitoring can be used to explain changes in photosynthetic activity of microalgal masscultures. Emphasis is placed on the 2 most common fluorescence techniques—pulse-amplitude-modulation and fluorescence induction kinetics—and the interpretation of important variablesthat reflect changes of photosynthesis and physiological status of microalgal cultures. In particu-lar, consideration is given to problems associated with the estimation of the photochemical yieldof photosystem II and its relationship to linear electron transport rate and overall photosynthesis.Emphasis is also given to the applications and limitations of these techniques through several casestudies. In model experiments with microalgal cultures, typical records and their interpretationunder various culture conditions are illustrated. Changes of photosynthetic activity and selectedvariables monitored by chl a fluorescence techniques can thus be related to changes of cultivationconditions, physiological status and growth of microalgal cultures for a given microalgal strainand cultivation system. In this way, chl a fluorescence may be used as a rapid screening techniqueto monitor photosynthetic activity and subsequently to estimate growth rate in both indoor andoutdoor studies. This text and results formed the basis of a key lecture at the 9th International GAPworkshop held at the University of Málaga in September 2012.
KEY WORDS: Biomass · Chlorophyll fluorescence · Growth · Light-response curve · Microalga ·OJIP curves · Productivity · Photosynthesis · Pulse-amplitude modulation (PAM)
Contribution to the Theme Section ‘Environmental forcing of aquatic primary productivity’ OPENPEN ACCESSCCESS

Aquat Biol 22: 123–140, 2014
system that is completely different from natural, opti-cally-thin phytoplankton populations, with biomassdensities several orders of magnitude lower. Massmicroalgal cultures should have their physiologicalstatus monitored operatively in order to optimizephotosynthetic activity and growth.
Various cultivation systems and technologies havebeen developed to grow microalgal mass cultures.The choice of a suitable cultivation system and theadjustment of the cultivation regime must be deter-mined for each individual microalgal strain and prod-uct. Two basic approaches to mass production areused: one applies to cultivation in open reservoirs(with direct contact between the microalgal cultureand the environment), while the other involves closedor semi-closed vessels called photobioreactors (for arecent review, see Grobbelaar 2009, Zittelli et al.2013). Open cultivation systems are natural or artifi-cial ponds, raceways (shallow race tracks mixed bypaddle wheels) and circulation cascades (i.e. inclined-surface systems). Similarly, for the closed/semi-closedsystems a variety of photobioreactors (with eithernatural or artificial illumination) exists, consisting ofglass or transparent plastic tubes, columns or panels,positioned horizontally or vertically, arranged as ser-pentine loops, flexible coils, a series of panels or col-umn gardens, in which the microalgal suspension iscirculated.
Principles of microalgal mass culturing
In every cultivation system, several basic cultiva-tion requirements that affect growth must be consid-ered: light, a suitable temperature and pH, and a sufficient supply of carbon and nutrients. However,since mass cultures grow in dense suspensions, effi-cient mixing is necessary to expose cells to lightevenly and to allow for an efficient gas exchange(CO2 supply/O2 removal) and make nutrition avail-able (e.g. Grobbelaar 2007, Richmond 2013).
Light is the most important factor for microalgalgrowth. The amount of photon energy received byeach cell is a combination of several factors: photonfluence rate, cell density, length of optical path(thickness of culture layer), rate of mixing and accli-mation state of microalgae. The ambient maxima(about 2 mmol photons m−2 s−1) of photosyntheticallyactive radiation (PAR) available for photosyntheticantennae are roughly 5 to 10 times higher than thoserequired to saturate growth. At high irradiance, therate of photosynthetic electron transport significantlyexceeds the rate of the dark enzymatic reactions (the
Calvin-Benson cycle) (Masojídek et al. 2013, Rich-mond 2013). In other words, the culture density mustbe adjusted for an optimal light regime and growth;otherwise as much as 90% of the photons capturedby the photosynthetic antennae may be dissipatedas heat.
In mass cultures, due to the self-shading of cells,light through the culture is attenuated exponentiallywith depth according to the Beer-Lambert law—from full sunlight at the surface to darkness at thebottom (Ritchie & Larkum 2012, Zarmi et al. 2013).Several areas can be conceived in a microalgal cul-ture exposed to solar irradiance (Tredici 2010): (1) thesurface layers in which irradiance is supra-saturatingand photoinhibition is taking place; (2) the deeperarea, in which irradiance is saturating and a highphotosynthetic rate is achieved; (3) a light-limitedarea, in which irradiance is used with maximum effi-ciency; and (4) an area below a certain irradianceintensity (the compensation point), at which photo-synthetic rates are too low to compensate for respira-tion. The first 3 areas, in which light is sufficient fornet photosynthesis, make up the photic volume. Inthe most efficient systems—shallow ponds, thin-layercascades or narrow flat panels—the microalgal cellconcentration is so high that all 4 layers can occurover a short distance, and some form of efficient stir-ring is crucial to maintain optimal production.
If the rate of photosynthesis of a microalgal culture(oxygen production or uptake) is plotted as a functionof irradiance (E), the so-called light-response curveof photosynthesis, or photosynthesis−irradiance (P/E)curve, is obtained (e.g. Torzillo & Vonshak 2013). TheP/E curve can be divided into 4 distinct areas: respira -tory, light-limited, light-saturated and light-inhibited(Fig. 1). This division fits the layout of the differentareas in a dense microalgal culture exposed to sun-light mentioned above (Tredici 2010). The so-calledinitial slope (α) of the P/E curve is a measure of themaximum photosynthetic efficiency of light conver-sion. The intercept of α and the maximum photosyn-thetic activity (Pmax) represents the saturation irradi-ance (Ek). Beyond this point, photosynthetic rate isslowed down and counteracted by energy dissipa-tion. The system reaches Pmax for that microalgalstrain under the given conditions. At a certain area,the irradiance intensity becomes inhibiting and so-called down-regulation occurs, which might be con-sidered as a complex mechanism to defend againstover-saturation and potential damage to the photo-synthetic apparatus.
After irradiance, temperature is the most importantvariable to control microalgal culture growth. Some
124

Malapascua et al.: Fluorescence monitoring in microalgal mass cultures
strains tolerate a broad temperature range of be -tween 15 and 40°C (e.g. Chlorella vulgaris or C.sorokiniana). By contrast, the freshwater Eustig -matophyceae strains (Trachydiscus) usually require amuch narrower range (20 to 28°C). However, for themajority of freshwater microalgae the optimum tem-perature ranges between 25 and 30°C.
CO2 serves as the main carbon source and is usu-ally added on demand (for example, by using a pH-stat). Nutrient status can be followed by monitoringthe concentration of nitrogen or phosphorus, using itas a measure for adding proportional amounts of theother nutrients.
Photosynthesis monitoring
Oxygen production, CO2 uptake and chlorophyll a(chl a) fluorescence have been used as reliable andsensitive techniques to monitor the photosynthetic activity of various photosynthetic organisms (Bradbury& Baker 1984, Krause & Weis 1984, 1991, Walker1987, Flameling & Kromkamp 1998, Gilbert et al.2000, Figueroa et al. 2003, Wilhelm et al. 2004). Allthese methods reflect the performance of processes inthe photosynthetic apparatus, and consequently phys-iological status and growth of a culture. They provideanalogous information, but compared with measure-ments of O2 production and/or CO2 uptake, fluores-
cence methods are considerably faster,more sensitive and can give in formationon energy use between the photo chemicaland non-photochemical (heat dissipation)processes (Schreiber et al. 1986, 1995,Baker & Oxborough 2004, Suggett et al.2011). While pulse-amplitude modulated(PAM) fluorescence can be used as a goodproxy for photosynthetic performance under certain conditions, it must alwaysbe compared with some other standardmethod: for example, an oxygen electrodemeasurement, which is an appropriateand well-established technique as it canmeasure both photosynthetic and respira-tory rates (Walker 1987).
One direct approach is to measure photosynthesis on-line/in situ during thediel cycle to monitor the actual situa -tion in a culture. Another possi bility isto measure off-line, using dark-adaptedmicroalgal samples taken from a culti -vation unit at selected times (Masojídeket al. 2011b).
Presently, 2 basic chl a fluorescence techniques areused for monitoring photosynthetic efficiency inmicroalgal mass cultures: rapid fluorescence induc-tion or relaxation kinetics, and the PAM method (forrecent reviews, see Maxwell & Johnson 2000, Strasseret al. 2004, Schreiber 2004, Baker 2008, Masojídek etal. 2011b). While the rapid fluorescence inductionprovides us with information on the reduction ofthe photosynthetic electron transport chain, the PAMtechnique gives information on the balance betweenphotosynthetic electron transport and the Calvin-Benson cycle. The latter method was a considerableleap forward as it made photosynthetic activity veryeasy to estimate in situ under ambient irradiance.Soon after, fluorometry became one of the most common techniques to estimate photosynthetic per-formance both in terrestrial plants (e.g. Juneau et al.2005) and microalgal mass cultures (e.g. Baker 2008,Masojídek et al. 2011b).
Care must be taken when measuring fluorescenceand evaluating data in cyanobacteria. This is be -cause the fluorescence emission of phycobilisomes,as well as state transition effects, contributes signifi-cantly to the total signal, and this affects the correctdetermination of certain variables (Ting & Owens1992, Büchel & Wilhelm 1993, Schreiber et al. 1995).
The aim of this paper is to provide a simple, practi-cal guide to the use of selected fluorescence tech-niques—PAM and fluorescence induction kinetics—
125
Increasing irradiance
Rat
e of
pho
tosy
nthe
sis
Pmax
α
Ek
0
Excess energy dissipation
Photosynthesis (O2 production)
Photon capture
Light-limitedDown-regulated
or light-inhibited?? Light-saturated
Respiration
Fig. 1. Schematic representation of the photosynthetic light-response curve(solid line), i.e. the dependency of photosynthesis on irradiance. The initialslope of the curve (α, thick dashed line) shows maximum quantum efficiencyof photosynthetic electron transport. The intersection between the maxi-mum rate of photosynthesis (Pmax) and α is the light saturation (optimum) ir-radiance, Ek. When photosynthesis reaches maximum, surplus energy abovethis value is dissipated. At supra-optimum irradiance, photosynthesis de-clines (dotted part of the light-response curve), which is commonly called
down-regulation or photoinhibition

Aquat Biol 22: 123–140, 2014
for biotechnologists who wish to monitor changes ofphotosynthetic activity and optimize the growth ofmicroalgal mass cultures. In exemplary experimentswith microalgal model strains Chlorella (Chloro-phyceae) and Trachydiscus (Eustigmatophyceae) wehave demonstrated typical records and their inter-pretation under various culture conditions as relatedto physiological status and growth.
MATERIALS AND METHODS
Organisms and culture conditions
For the present series of model experiments, cul-tures were grown in the laboratory or outdoors ininorganic media using various types of cultivationunits (Fig. 2). For comparative purposes, green micro -algae (commonly-used benchmark species for photo-synthetic studies in our laboratories) have beenincluded as experimental examples in this study. Theexperiments were carried out with the microalgaeChlorella fusca (Chlorophyta; UTEX 580 from Pro -vasoli-Guillard Center CCMP), C. vulgaris (Chloro-phyta) and Trachydiscus minutus (Eustigmatophyta)(both from the culture collection of the Laboratory ofAlgal Biotechnology at the Institute of Microbiology,Trebon, Czech Republic). All microalgal cultureswere grown phototrophically in a mineral mediumusing a semi-continuous regime, with part of the culture harvested at regular intervals. The growthoptima are ~35°C for both strains of Chlorella, butthey are able to grow up to 40°C, while Trachydiscusgrows at 27°C up to 33°C. Laboratory experimentswere carried out under continuous illumination.
At the start of the experiment, the cultures werediluted with fresh medium to the required biomassdensity. Microalgal mass cultures (>0.5 g dry biomassl−1) were well-mixed and homogenous and thereforecan be represented as an averaged cell population.
Cultivation equipment
Laboratory cultivation was carried out in glasscylinders (i.d. 35 mm, volume 0.4 l) placed in a tem-perature-controlled water bath with adjustable back-side illumination from LED panels. Mixing of themicroalgal suspension was maintained by bubblingthrough a mixture of air + 1% CO2. One open unit (anoutdoor thin-layer cascade) and 3 closed systems(photobioreactors; vertical flat-panel and annularcolumn) were used for cultivation experiments (Fig. 2).
In the outdoor thin-layer cascade (24 m2, volume230 l, located at the Institute of Microbiology, Trebon,Czech Republic) the illuminated surface to total vol-ume (S/V) ratio was about 105. Most of the outdoorexperiments in a thin-layer cascade were carried outbetween 07:00 and 19:00 h (GMT) on clear, sunnydays with stable irradiance between May and July(for more information, see Doucha & Lívanský 1995,Masojídek et al. 2011a). In the outdoor cascade, themicroalgal suspension was circulated during the dayin a thin layer (about 6 mm) over a series of slopingplanes exposed to solar irradiance using a centrifugalpump, and kept overnight in the retention tank,mixed by air bubbling. Nutrients were supplied onceor twice a day according to culture demand (fed-batch regime). The pH was maintained at the optimalvalue of 7.6 ± 0.2 by automatic injection of pure CO2,
126
Fig. 2. Examples of experimental, open-outdoor systems or semi-closed photobioreactors for cultivation of microalgae, whichcan be scaled up to large production facilities. A thin-layer cascade of sloping planes (24 m2, 220 l) at the Institute ofMicrobiology in Trebon, Czech Republic (left); a vertical flat-plate photobio reactor (dimensions 1 × 1.4 m; 70 mm light path) atthe Institute of Microbiology in Trebon, Czech Republic (center); and a laboratory annular column photobioreactor (10 l) whichis a double-jacket glass vessel with internal illumination by 4 internal LED sources (Institute of Microbiology in Trebon, Czech
Republic) (right)
Malapascua et al.: Fluorescence monitoring in microalgal mass cultures
or controlled manually in the range 7.4 to 7.9. In themorning (08:00 h), the irradiance intensity was about400 µmol photons m−2 s−1, reaching up to 2 mmolphotons m−2 s−1 at midday (13:00 h). An outdoorthin-layer cascade (5 m2, located at the University ofMálaga, Spain) was also used in some experiments.
For comparison, 3 closed systems (photobioreac-tors), were also used (Fig. 2). The first, a laboratoryannular column photobioreactor (10 l) was a double-jacket glass vessel with 4 internal light sources con-sisting of LED strips attached to an aluminum squareprofile protected by a glass cylinder. The maximumoutput irradiance was about 2 mmol photons m−2 s−1
.
The light sources illuminated microalgal culturesequally, as these were mixed by bubbling with themixture of air + 1% CO2 with a light path of about35 mm. The S/V ratio was about 1.5.
The second photobioreactor was a vertical thickflat-plate photobioreactor consisting of glass platesmounted in a stainless steel frame (dimensions 1 ×1.4 m; about 100 l), placed outdoors. Microalgal cul-tures were mixed by bubbling with the mixture of air+ 1% CO2 with a light path of about 70 mm. The S/Vratio was about 15.
The third photobioreactor was a laboratory annularcolumn photobioreactor (10 l) which consisted of adoublejacket glass vessel with internal illuminationby 4 internal LED sources (Institute of Microbiologyin Trebon, Czech Republic) (Fig. 2, right panel).
Chlorophyll a fluorescence and dissolved oxygenconcentration measurements
For off-line fluorescence measurements, all sam-ples were diluted (final biomass concentration 0.2 to0.3 g DW l−1, corresponding to 5 to 6 mg chl l−1) andtransferred to a measuring chamber (light path of10 mm). In this way, we measured under standardconditions and avoided re-absorption problems witha dense culture by providing sufficient illuminationin the dark-acclimated samples (with an oxidizedplastoquinone, PQ, pool). Measurements were car-ried out under well-defined laboratory conditionswithin 5 to 10 min of a short dark adaptation, to avoidmodifying the photoacclimation state of the cells. Itshould be noted that this procedure might generateslightly different results compared to those measuredon-line/in situ, as the dark-adapted samples willhave a part of their non-photochemical quenchingcoefficient (NPQ) relaxed, whereas this might beoperational when measuring in situ. Hence, careshould be taken that the handling/dark acclimation
period should be tested with every microalgal cultureinvestigated.
A pH/Oxi340i meter and electrodes (WTW) wereused to control temperature, pH and dissolved oxygen concentration.
Rapid fluorescence induction kinetics (OJIP test)
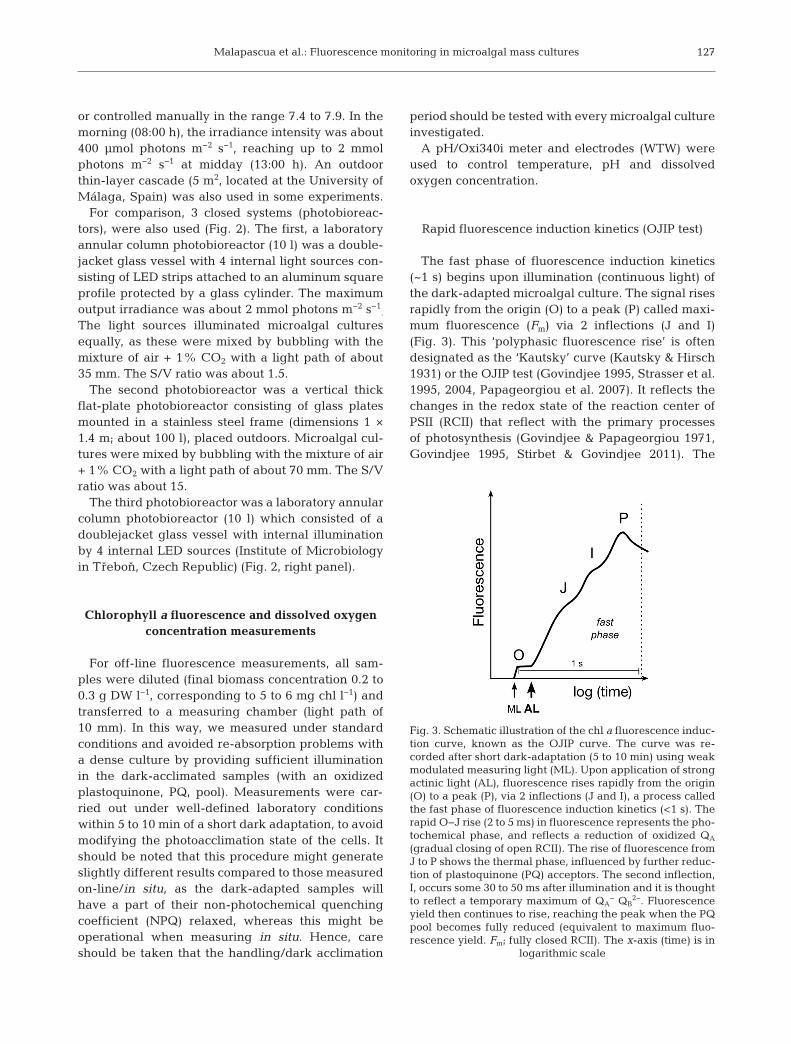
The fast phase of fluorescence induction kinetics(~1 s) begins upon illumination (continuous light) ofthe dark-adapted microalgal culture. The signal risesrapidly from the origin (O) to a peak (P) called maxi-mum fluorescence (Fm) via 2 inflections (J and I)(Fig. 3). This ‘polyphasic fluorescence rise’ is oftendesignated as the ‘Kautsky’ curve (Kautsky & Hirsch1931) or the OJIP test (Govindjee 1995, Strasser et al.1995, 2004, Papageorgiou et al. 2007). It reflects thechanges in the redox state of the reaction center ofPSII (RCII) that reflect with the primary processesof photosynthesis (Govindjee & Papageorgiou 1971,Govindjee 1995, Stirbet & Govindjee 2011). The
127
Fig. 3. Schematic illustration of the chl a fluorescence induc-tion curve, known as the OJIP curve. The curve was re -corded after short dark-adaptation (5 to 10 min) using weakmodulated measuring light (ML). Upon application of strongactinic light (AL), fluorescence rises rapidly from the origin(O) to a peak (P), via 2 inflections (J and I), a process calledthe fast phase of fluorescence induction kinetics (<1 s). Therapid O−J rise (2 to 5 ms) in fluorescence represents the pho-tochemical phase, and reflects a reduction of oxidized QA
(gradual closing of open RCII). The rise of fluorescence fromJ to P shows the thermal phase, influenced by further reduc-tion of plastoquinone (PQ) acceptors. The second inflection,I, occurs some 30 to 50 ms after illumination and it is thoughtto reflect a temporary maximum of QA
− QB2−. Fluorescence
yield then continues to rise, reaching the peak when the PQpool becomes fully reduced (equivalent to maximum fluo-rescence yield. Fm; fully closed RCII). The x-axis (time) is in
logarithmic scale

Aquat Biol 22: 123–140, 2014
origin of the fluorescence induction curve is a basevalue, designated as the minimum fluorescence yield(F0; measured after 10 to 50 µs). It is the signal emit-ted from excited chl a molecules in the light-harvesting complex (LHCII) before excitons havemigrated to the RCII where PQ acceptors are fullyoxidized. The F0 or the Fm values are the most com-mon empirical parameters. The difference betweenFm and F0, called variable fluorescence (FV), and theratio FV/Fm are used extensively; the parameterFV/Fm has been related to the maximum quantumyield of PSII photochemistry (Genty et al. 1989, Papa-georgiou & Govindjee 2004, Masojídek et al. 2013).
After light exposure, the rapid O−J rise (2 to 5 ms)in fluorescence represents the photochemical phase,and reflects the accumulation of the reduced ‘pri-mary’ acceptor of PSII, QA
− (gradual closing of theopen RCII). The second inflection (I) occurs some 30to 50 ms after illumination and it is thought to reflectdifferent redox states, e.g. QA QB
2− or QA− QB
2−
(Govindjee 2004). The dip after the J inflection re -flects the movement of electrons from one quencherto the next (e.g. QA → QB). An important variable thatis frequently used in graphical presentations of fluorescence induction data is the relative variable fluorescence at time t: Vt = (Ft − F0) / (Fm − F0); it is a double normalization of the fluorescence inductioncurve that allows a comparison of transients meas-ured under different conditions and/or on differentsamples (reviewed in Stirbet & Govindjee 2011). Therise of fluorescence from J to P (200 to 500 ms) showsthe thermal phase influenced by the 2-step reductionof QB (QB → QB
− → QB2−) and heterogeneity in the
reduction of the PQ pool. Fluorescence yield thencontinues to rise, reaching P when the PQ poolbecomes fully reduced (equivalent to Fm; fully closedRCII). Fast fluorescence induction curves can be nor-malized on both F0 and Fm to better illustrate thereduction status of the J (Vj) and I (Vi) transients(Masojídek et al. 2011b, Fig. 4). Due to the complexnature of the numerous interactions influencing thechl a fluorescence induction curve, there has beensome discussion over data interpretation; however, itis generally agreed which particular phase reflectsthe individual photosynthetic processes (Govindjee1995, Strasser et al. 2004, Stirbet & Govindjee 2011).
As an example, we show a comparison of exem-plary fluorescence induction kinetics of variousmicroalgal strains which reflect their physiologicalfeatures and photosynthetic activity (Fig. 4). The flu-orescence induction curve from the cyanobacteriumSpirulina (Arthrospira) platensis shows the distinctJ inflection of the photochemical phase (curve with
filled circles in Fig. 4). This inflection probably re -flects the reduction of the PQ acceptor QA, sincecyanobacteria generally reduce PQ acceptors in thedark due to respiratory electron transport (Dominy &Willims 1987). The OJIP kinetics among eukaryoticmicroalgae, e.g. the eustigmatophyt T. minutus (curvewith closed triangles) compared to the chlorophyt C.vulgaris (curve with shaded circles) may also showentirely different kinetics. The slow growth of T. min-utus is reflected by a high I inflection, suggesting ahigh level of QA and QB reduction and electron trans-port being slowed down beyond the P maximum.Green microalgae like Chlorella grow quickly, sincephotosynthetic electron transport is not delayed compared to that of Trachydiscus. The J variableof Chlorella was low as it can quickly reoxidize thePQ pool (after 5 to 10 min of dark adaptation).
PAM-fluorometry—the saturation pulse method
The PAM technique was first described in the1980s (Bradbury & Baker 1984, Schreiber et al. 1986)and further elaborated in the 1990s (Schreiber et al.
128
I
Time (ms)0.1 1.0 10.0 100.0 1000.0
Fluo
resc
ence
(r.u
.)
0.0
0.2
0.4
0.6
0.8
1.0P
J
I
T. minutusC. sorokiniana
S. platensis O
Fig. 4. Rapid chlorophyll fluorescence induction curves ofvarious microalgae—Chlorella sorokiniana (Chlorophyceae),Trachydiscus minutus (Eustigmatophyceae) and Spirulina(Arthrospira) platensis (Cyanobacteria)—grown in an inor-ganic medium. The induction curves of outdoor cultureswere measured at midday. Before measurement, the dilutedcultures (DW = 0.2 to 03 g l−1) were dark adapted (5 to10 min). Fast fluorescence induction kinetics was recordedin a 3 ml cuvette (light path of 10 mm) within a time range of50 µs to 2 s from the onset of the saturation light using adual-modulation induction fluorometer (Aquapen AP-100;Photon Systems Instruments). The recorded curves (n = 3 to5) were averaged and double-normalized to F0 and Fm in or-der to distinguish changes in the intermediate steps (J and I)that represent various reduction states of the PSII electron
carriers. r.u. = relative units

Malapascua et al.: Fluorescence monitoring in microalgal mass cultures
1995, Schreiber 2004). The most important contribu-tion of PAM-fluorometry has been the developmentof quenching analysis (Schreiber et al. 1998), whichprovides the principal information on the distributionof the absorbed energy: its use in photochemistry(and growth) and/or its dissipation in non-photo-chemical processes.
PAM fluorometers usually employ 3 different lightsources to examine the photosynthetic apparatus(Fig. 5). Firstly, there is a weak measuring light (ML;<0.5 µmol photons m−2 s−1) that induces fluorescenceemission without starting photosynthesis, and thedetector is exclusively tuned to this emitter. The basicfluorescence signal (fluorescence yield) emitted asa response to ML in dark-adapted microalgae is F0.The second light source used to assess maximumphotosynthetic activity is a strong saturating pulse(SP; >10 000 µmol photons m−2 s−1, 0.4 to 0.8 s in dura-tion) which is sufficient to close all RCIIs (i.e. reduceall QA). The third is actinic light (AL), which can beprovided by the sun or an artificial source, and whichis used to induce photosynthesis.
Some variables (described below) are analogous tothe fast induction kinetics introduced earlier. F0 willoccur when all RCIIs are open (QA in RCIIs is oxi-dized) and quantum energy reaching the reactioncenter has the maximum chance of being used forphotochemistry (with only a small part being dissi-pated as heat and fluorescence). This state is gener-ally considered to be achieved after dark adaptationand the release of the transthylakoid pH gradient. Ifa SP is applied to a dark-adapted sample, fluores-cence yield will reach its true maxi-mum Fm—hence photochemistry willbe fully saturated and non-photochemical quenching negligible.The maximum quantum yield of PSII,FV/Fm can be estimated by normaliz-ing FV to Fm (Table 1). The maximumvalues of the FV/Fm ratio usually rangebetween 0.7 and 0.8 in normal, non-stressed microalgae (Masojídek et al.2013). This variable is often used asan indicator of photoinhibition: usu allycaused by a synergism between highirradiance and other forms of environ-mental stress (e.g. temperatureextremes, high dissolved oxygen con-centration, or nutrient limitation).
However, if the sample is exposed toany level of AL, non-photochemicalquenching will inevitably lower thefluorescence yield (F ’ and Fm’, where ’
129
Fig. 5. Schematic representation of fluorescence quenchinganalysis using the saturation pulse method (pulse-amplitudemodulation technique, PAM). The minimum and maximumfluorescence levels (F0 and Fm) were measured after shortdark-adaptation (5 to 10 min) using weak modulated meas-uring light (ML) and a saturating light pulse (SP) to calculatethe maximum photochemical yield (FV/Fm). Next, the samplewas illuminated with actinic light (AL) and a series of satu -rating pulses in order to reach the steady state F ’ and Fm’
Parameter Symbol Formula
Maximum photochemical FV/Fm FV/Fm = (Fm − F0) / Fm
yield of PSII (r.u.)
Actual or effective PSII YII or ΔF/Fm’ YII = (Fm’ − F ’) / Fm’photochemical yield (r.u.)
Relative electron transport rETR rETR = YII × EPAR
rate through PS II (rate of photochemistry)—correlated with primary productivity (r.u.)
Electron transport rate through ETR ETR = YII × EPAR × a* × 0.5PS II (µmol electrons m−2 s−1)
Stern−Volmer coefficient of NPQ NPQ = (Fm − Fm’) / Fm’non-photochemical quenching (r.u.)
Non-photochemical quenching (r.u.) qN qN = (Fm − Fm’) / (Fm’ − F0’)
Table 1. Selected parameters calculated from chl a fluorescence measure-ments (see Fig. 5). F0, FV, Fm = minimum, variable and maximum fluorescencein the dark-adapted state; F ’, Fm’ = steady-state and maximum fluorescencein the light-adapted state; a* = optical cross-section of PSII; RCII = reaction
center of PSII; E = irradiance; r.u. = relative units

Aquat Biol 22: 123–140, 2014
denotes that the sample is measured under AL).Quenching analysis using the saturating pulsemethod compares the fluorescence yield during SPunder AL, Fm’ and F ’, with the dark-adapted values,Fm and F0 (Fig. 5). The difference between Fm and Fm’can be used as a measure of non-photochemicalquenching (NPQ). The actual photochemical yield ofPSII, YII, which estimates the efficiency at which acertain light intensity is used for photochemistry, iscalculated as YII or ΦPSII = (Fm’ − F ’)/Fm’ (Genty et al.1989). Propor tionally, the non-photochemical quen -ch ing coefficient, NPQ = (Fm − Fm’)/Fm’ can also bequantified (Bilger & Björkman 1990). The NPQ vari-able (Stern-Volmer coefficient of non-photochemicalquen ching) is considered more robust and frequentlyused in preference to qN (for calculation differencesee Table 1), as the F0’ variable is not used in the cal-culation (Table 1; Ralph & Gademann 2005). NPQ isused to infer the activity of the xanthophyll cycle inmicroalgal cultures (Ma sojídek et al. 2004), althoughNPQ can also be caused by state transitions or photo-damage (chronic photo in hi bi tion). The primary sitefor the development of non-photochemical quench-ing is thought to be the light harvesting antennae(Ting & Owens 1992, Oxborough & Baker 1997). Thedown-regulation of the PSII photochemistry acts as aphotoprotective mechanism. This prevents the devel-opment of triplet state of chl in RCII and the forma-tion of reactive oxygen species. The evidence indi-cates that photoinhibition is moderated by thedevelopment of non-photochemical quenching(Krause & Weis 1991). A widely used variable in pho-tosynthetic studies is the relative electron transportrate through PSII (rETR) (e.g. Hofstraat et al. 1994,Ralph & Gademann 2005, White et al. 2011). In thisstudy, rETR (dimensionless) was calculated by multi-plying the actual (or effective) photochemical effi-ciency by the photosynthetically active radiation:rETR = YII × EPAR.
The fluorescence nomenclature in this paper fol-lows Schreiber et al. (1986) and as later elaborated byvan Kooten & Snel (1990) and Kromkamp & Forster(2003). Although the terminology of chl a fluores-cence variables is complex, reflecting the complexityof the fluorescence signal and the various ways ofmeasuring it, the degree of standardization in nomen -clature in recent years has made it easier to avoidmisinterpretations. The comparison of results fromthe same instrument type, either induction or PAMfluorometers, should be made with some cautionsince the system arrangement and geometry (e.g. theposition of a detector to the sample cuvette, dilution,stirring) can affect data (see e.g. Figueroa et al. 2013).
Rapid light-response curves (RLC) of photosyntheticelectron transport
In comparison to the classic steady-state light-response curve (SLRC) (P/E curve; photosynthesis−oxygen production/CO2 uptake vs. irradiance; Fig. 1),the so-called rapid light-response curve (RLC) lookssimilar, but shows the dependency of rETR on E (seeFig. 6B) (see also Kromkamp et al. 1998, White &Critchley 1999, Ralph & Gademann 2005). RLCs pro-vide detailed information on the saturation character-istics of electron transport, as well as the actual per-formance of a microalgal culture. This technique canbe used for analysis of changes in maximum photo-synthetic rates (ETRmax), photosynthetic efficiency (α)and Ek (for a recent review see Enriquez & Borow-itzka 2011). Using a RLC analysis we can calculatethe following key variables similar to a classic SLRC:
• α (electrons/photon): the initial slope of RLCwhich reflects the quantum efficiency ofphotosynthetic electron transport.
• rETRmax ~ Pmax (relative units): maximumelectron transport rate through the PSIIcomplex.
• Ek (µmol photons m−2 s−1): irradiance that issaturating photosynthesis.
The Ek value is determined from the interceptionpoint of the α slope with the maximum level of rETR-
max; it defines the onset of light saturation (Fig. 1).RLCs also provide the threshold irradiance, showingthe level at which down-regulation or photo-damagewill occur and which manifests itself as a decrease inphotosynthetic activity (Fig. 1).
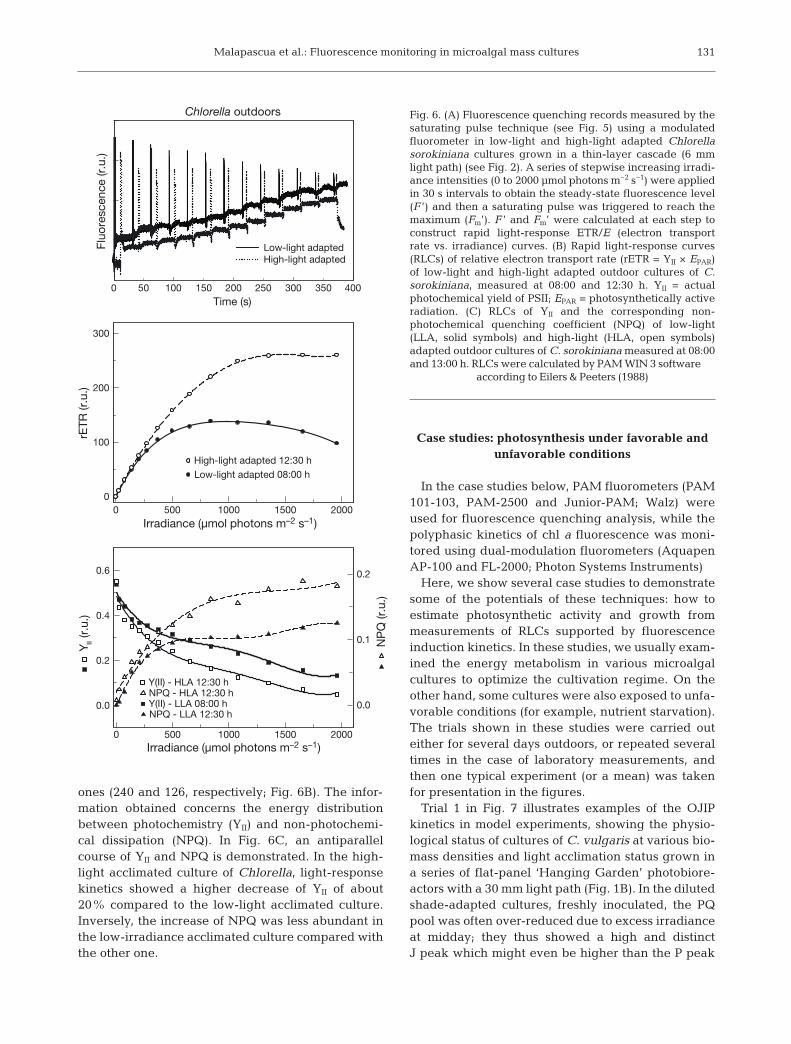
RLCs measured by PAM fluorometers generatevariables which describe the physiological state ofvariously-adapted microalgal cultures. Compared tothe steady-state or ‘slow’ SLRC, the RLC is measuredusing increasing irradiances over very short timeperiods. Each AL intensity can last for 10 to 30 s toobtain the balanced fluorescence level F’, and then aSP is triggered to reach the maximum Fm’. As anexample, we show records of fluorescence quench-ing analysis to construct light-response curves of thelow-light and high-light adapted Chlorella culturesgrown outdoors (Fig. 6A). RLCs of the electron trans-port rate vs. irradiance curve (ETR/E curve, seebelow) can be completed within a few minutes com-pared to the several hours required for SLRC (White& Critchley 1999, Ralph & Gademann 2005, Ritchie &Larkum 2012). In this experiment, the high-lightadapted cultures of Chlorella show values of rETRmax
that are twice as high as those of low-light adapted
130
Malapascua et al.: Fluorescence monitoring in microalgal mass cultures
ones (240 and 126, respectively; Fig. 6B). The infor-mation obtained concerns the energy distributionbetween photochemistry (YII) and non-photochemi-cal dissipation (NPQ). In Fig. 6C, an antiparallelcourse of YII and NPQ is demonstrated. In the high-light acclimated culture of Chlorella, light-responsekinetics showed a higher decrease of YII of about20% compared to the low-light acclimated culture.Inversely, the increase of NPQ was less abundant inthe low-irradiance acclimated culture compared withthe other one.
Case studies: photosynthesis under favorable andunfavorable conditions
In the case studies below, PAM fluorometers (PAM101-103, PAM-2500 and Junior-PAM; Walz) wereused for fluorescence quenching analysis, while thepolyphasic kinetics of chl a fluorescence was moni-tored using dual-modulation fluorometers (AquapenAP-100 and FL-2000; Photon Systems Instruments)
Here, we show several case studies to demonstratesome of the potentials of these techniques: how toestimate photosynthetic activity and growth frommeasurements of RLCs supported by fluorescenceinduction kinetics. In these studies, we usually exam-ined the energy metabolism in various microalgalcultures to optimize the cultivation regime. On theother hand, some cultures were also exposed to unfa-vorable conditions (for example, nutrient starvation).The trials shown in these studies were carried outeither for several days outdoors, or repeated severaltimes in the case of laboratory measurements, andthen one typical experiment (or a mean) was takenfor presentation in the figures.
Trial 1 in Fig. 7 illustrates examples of the OJIPkinetics in model experiments, showing the physio-logical status of cultures of C. vulgaris at various bio-mass densities and light acclimation status grown ina series of flat-panel ‘Hanging Garden’ photobiore-actors with a 30 mm light path (Fig. 1B). In the dilutedshade-adapted cultures, freshly inoculated, the PQpool was often over-reduced due to excess irradianceat midday; they thus showed a high and distinctJ peak which might even be higher than the P peak
131
Time (s)0 50 100 150 200 250 300 350 400
Fluo
resc
ence
(r.u
.)
Low-light adapted High-light adapted
Chlorella outdoors
Irradiance (µmol photons m–2 s–1)
Irradiance (µmol photons m–2 s–1)
0 500 1000 1500 2000
rETR
(r.u
.)
0
100
200
300
High-light adapted 12:30 hLow-light adapted 08:00 h
0 500 1000 1500 2000
Y II (r
.u.)
0.0
0.2
0.4
0.6
0.0
0.1
0.2
NP
Q (r
.u.)
NPQ - HLA 12:30 h
NPQ - LLA 12:30 h
Y(II) - HLA 12:30 h
Y(II) - LLA 08:00 h
Fig. 6. (A) Fluorescence quenching records measured by thesaturating pulse technique (see Fig. 5) using a modulatedfluoro meter in low-light and high-light adapted Chlorellasorokiniana cultures grown in a thin-layer cascade (6 mmlight path) (see Fig. 2). A series of stepwise increasing irradi-ance intensities (0 to 2000 µmol photons m−2 s−1) were appliedin 30 s intervals to obtain the steady-state fluorescence level(F ’) and then a satu rating pulse was triggered to reach themaximum (Fm’). F ’ and Fm’ were calculated at each step toconstruct rapid light-response ETR/E (electron transportrate vs. irradiance) curves. (B) Rapid light-response curves(RLCs) of relative electron transport rate (rETR = YII × EPAR)of low-light and high-light adapted outdoor cultures of C.sorokiniana, measured at 08:00 and 12:30 h. YII = actualphoto chemical yield of PSII; EPAR = photosynthetically activeradiation. (C) RLCs of YII and the corresponding non-photochemical quenching coefficient (NPQ) of low-light(LLA, solid symbols) and high-light (HLA, open symbols)adapted outdoor cultures of C. sorokiniana measured at 08:00and 13:00 h. RLCs were calculated by PAM WIN 3 software
according to Eilers & Peeters (1988)

Aquat Biol 22: 123–140, 2014
(Fig. 7A, curves 1 and 2). The J inflection reflects theover-reduction of the PSII acceptors QA and QB anddecrease of electron flow due to excessive irradianceas reducing power cannot be utilized in further reac-tions. As the cultures recovered overnight (Fig. 7A,curve 3), they seemed to be fully photosyntheticallycompetent and able to grow well.
A different situation was observed when Chlorellacultures, which were even denser, were exposed tonitrate starvation. In the morning when light inten-
sity was low, only a slight increase in the J and I in -flections was found compared to the nutrient repleteculture (compare Fig. 7B, curve 4 with Fig. 7A, curve3). If the nitrate-starved culture was exposed to highirradiance at midday, the J and I inflections wereclearly visible, suggesting over-reduction of the QA
and QB electron acceptors of PSII due to the meta-bolic insufficiency of the culture (Fig. 7B, curve 5).However, in the culture limited by CO2 supply, onlythe J peak was distinct and the shape of the OJIPkinetics was different. This suggests that the inhibi-tion of QA to QB electron transport due to the Calvin-Benson cycle was slowed down, and unable to utilizereduction equivalents (Fig. 7B, curve 6). These exam-ples show some typical OJIP kinetics which can beused for diagnostics of the photosynthetic apparatusand physiological status of microalgal culture undervarious growth conditions.
Trial 2, as presented in Fig. 8, is an example of2 microalgal strains, C. fusca (Chlorophyta) and T.minutus (Eustigmatophyta), grown in an outdoorexperimental cascade (24 m2, shown in Fig. 1). Thisnear-horizontal system is based on microalgal growthin a thin-layer (6 mm) that supports very high arealand volumetric productivity (Masojídek et al. 2011a).Both cultures had high photosynthetic activity andgrew well in comparison to other cultivation systems(vertical flat-panel or annular cylinder, shown inFig. 1). Nevertheless, Chlorella reached a biomassden sity that was 2-fold higher than that of Trachy -discus; after 10 d the biomass density of the formerwas 21.5 g l−1, while the latter was 9.5 g l−1 (Fig. 8A).This higher growth rate corresponded with the dielcourses of rETRmax, which were 2 to 3 times higher inChlorella (about 795) than those of Trachydiscus(about 250) when both cultures began growing expo-nentially at a biomass density of about 4 g l−1 (repre-senting the optimum starting biomass density for thiscascade system) (Fig. 8B). It matched the specificgrowth rate of 0.43 and 0.28 d−1 and daily produc -tivity 2 g l−1 d−1 and 1.3 g l−1 d−1 for Chlorella and Trachydiscus, respectively. To analyze the photobio-chemical changes in more detail, we also comparedthe diel courses of their OJIP kinetics simultaneously.The kinetics of both strains showed rather typical dif-ferences, as the J and I inflections were much higherin Trachydiscus than in Chlorella—especially at mid-day (Fig. 8C). This suggests that the PQ electronacceptors of PSII were reduced in the Trachydiscusculture, showing an inability to utilize the highenergy input for growth in this outdoor culture incontrast to the Chlorella culture. The difference inenergy utilization to biomass production can be ex -
132
0.0
0.2
0.4
0.6
0.8
1.0P
O
J
I
1
2
Time (ms)0.1 1.0 10.0 100.0 1000.0
Fluo
resc
ence
(r.u
.)
0.0
0.2
0.4
0.6
0.8
1.0
P
J
I
45
6
3
B
A
1- very thin, light adapted,12:00 h2 - thin, light adapted,12:00 h3 - thin, shade adapted - 08:30 h
O6 - dense - 11:30 h, low CO2
4 - dense - 08:30 h, N-starvation5 - dense -11:30 h, N-starvation
Fig. 7. Rapid fluorescence induction kinetics (OJIP-test) ofChlorella sorokiniana cultures measured in the morning(08:30 h) and at mid-day (11:30 to 12:00 h). (A) Diluted (0.1 to0.33 g DW l−1) and (B) dense (5 g DW l−1) cultures were usedto characterize typical fluorescence induction kinetics anddemonstrate differences regarding the inflection points Jand I (redox states of QA and QB). The measurement condi-tions and instrumentation are identical to that given in Fig. 4.The biomass density of cultures varied between 0.1−0.33and 5 g DW l−1.The cultures were grown in (A) a flat-panelseries ‘Hanging Gardens’© photobioreactor with a lightpath of 30 mm (Ecoduna), and (B) in a thin-layer cascade(curve 6) at the Institute of Microbiology in Trebon, CzechRepublic. Off-line fluorescence measurements were carriedout under well-defined laboratory conditions within 5 to10 min after short dark adaptation. Between 3 and 5 records
were averaged to construct each OJIP curve

Malapascua et al.: Fluorescence monitoring in microalgal mass cultures
plained by the fact that Trachydiscus produces about30% of oils in the biomass (Řezanka et al. 2010), thesynthesis of which is rather energy demanding. Thevalues of rETRmax and OJIP kinetics of Chlorella andTrachydiscus cultures measured during the cultiva-tion period showed that using these characteristicrecords of growth rate and productivity of microalgalstrains can be predicted even after a few experi -mental days.
Trial 3 represents a model laboratory experimentwhere we examined changes in RLCs in cultures ofT. minutus and C. fusca grown under nutrient starva-tion and high irradiance (about 1.2 mmol photonsm−2 s−1) over a 24 h period. The photosynthetic activ-ity of control cultures of Trachydiscus and Chlorelladeveloped differently: in the Chlorella culture it wasrelatively high right from the start, reaching high val-
ues after just 4 h, while the activity of Trachydiscuswas about 40% lower. However, after 24 h the rETR-
max values were similar in both cultures, but Chlorellawas tolerating the high irradiance level better, whilethe Trachydiscus culture became down-regulated atcultivation light intensities (Fig. 9A,C). In the nitrate-starved cultures, the photosynthetic activities of Chlo -rella and Trachydiscus were rather similar after 4 h ofcultivation (Fig. 9B,D); but a dramatic difference wasfound after 24 h of the nitrate-starvation trial: theactivity of Trachydiscus was over 60% higher thanthat of Chlorella as the latter’s faster growth at thebeginning had exhausted the medium’s nutrient con-tent. The photosynthetic activity of microalgal cul-tures is down-regulated when they experience nitro-gen starvation and the products of the light-reactionscannot be used in the dark ‘synthetic’ processes.
133
Period of cultivation (d)0 2 4 6 8 10
0
5
10
15
20
25
Trachydiscus minutusChlorella fusca
A C
D
B
Time (h)8 10 12 14 16 18
0
200
400
600
800
Trachydiscus minutus
Chlorella fusca
Fluo
resc
ence
(r.
u.)
0.0
0.2
0.4
0.6
0.8
1.0Chlorella fusca
Time (s)10 –4 10 –3 10 –2 10 –1 10 0
0.0
0.2
0.4
0.6
0.8
1.0
07:00 h 09:30 h 13:00 h17:00 h
07:00 h 09:30 h 13:00 h17:00 h
Trachydiscus minutus
rETR
ma
x (r.
u.)
DW
(g
l–1 )
Fig. 8. (A) Growth curves of Chlorella fusca and Trachydiscus minutus cultivated in an outdoor thin-layer cascade during a 10 dexperimental trial in June and July 2013. (B) Diel courses of maximum relative electron transport rate (rETRmax) of C. fusca andT. minutus on Days 3 and 7, respectively, when both cultures started to grow exponentially at a biomass density of about 4 g l−1
(i.e. the optimum starting biomass density for the cascade system). Measurements were taken in culture samples off-line usingthe stirred cuvette holder of a pulse-amplitude-modulation fluorometer (PAM-2500, Walz). (C) Fast fluorescence induction kinetics of C. and T. minutus grown outdoors in a thin-layer cascade during June and July 2013, measured at selected times of
the day (07:00, 09:30, 13:00 and 17:00 h), using an induction fluorometer (Aquapen AP-100; Photon Systems Instruments)

Aquat Biol 22: 123–140, 2014
The RLC of rETRmax measured in the laboratorycultures of Chlorella and Trachydiscus during the24 h experiment showed that we can obtain typicalrecords which indicate behavior of the nutrient-replete and nitrate-starved cultures. This can be usedto manipulate growth of these cultures under nutri-ent-starvation, which induces production of somevalu able metabolites, e.g. carotenoids, polysaccharidesor fatty acids.
In Trial 4, the photosynthetic activity of well-grow-ing C. fusca cultures (3 to 4 g biomass l−1) was exam-ined when grown in various types of cultivation units(see examples in Fig. 1). These included an outdooropen thin-layer cascade (S/V about 105) and an out-door vertical flat-plate photobioreactor (S/V about15), both under a diurnal regime in July under amoderate climate (T ebo , Czech Republic), in com-parison to a 10 l laboratory annular column photo-bioreactor with internal LED-illumination (S/V about
1.5). In the outdoor units, photosynthetic activity wasmeasured at the maximum daily irradiance at mid-day (13:30 h), whereas the laboratory column photo-bioreactor was sampled at random times since theculture was grown under continuous illumination.The RLCs showed the varying photosynthetic per-formance of the cultures grown in various cultivationunits (Fig. 10). The highest rETR activity (>300) wasfound in the thin-layer cascade culture, since thatwas acclimated to high irradiance as the S/V ratiowas the highest (about 105) which pre-determinesthe culture for fast growth. The saturation of photo-synthesis was noted with the cultures grown in theflat-panel and cylindrical photobioreactor, but therETRmax values of the cascade culture were signifi-cantly higher (>300), in contrast to the latter ones(233 and 107, respectively; Fig. 6B). The culture inthe column photobioreactor with internal illumina-tion was evidently acclimated to low irradiance due
134
rETR
(r.
u.)
0
100
200
300
0 500 1000 1500 2000 0 500 1000 1500 2000
0
100
200
300
Irradiance (µmol photons m–2 s–1)
T. minutus T. minutus
C. fusca C. fusca
A B
C D
Control 0 h Control 4 h Control 24 h
-NO3–, 4 h
-NO3–, 24 h
Fig. 9. Changes in the rapid light-response curves (RLCs) of the laboratory cultures of (A,B) Trachydiscus minutus and (C,D)Chlorella fusca induced by 4 and 24 h exposure to nitrogen starvation (25% of nitrogen level of full medium) under high irra-diance (1200 µmol photons m−2 s−1). (A,C) Closed symbols represent control cultures and (B,D) open symbols are the nitrate-limited treatments. Mixing of the microalgal suspension was maintained by bubbling through a mixture of air + 1% CO2. Lines
represent the fitted curves according to the model of Eilers & Peeters (1988). rETR: relative electron transport rate

Malapascua et al.: Fluorescence monitoring in microalgal mass cultures
to the low S/V ratio: photosynthesis saturation wasnoted at a much lower irradiance level than in theother 2 cultures, and rETRmax was about 35% of thatin the cascade. From the RLCs of rETR in this trial,we can estimate photosynthetic activity of variousmicroalgal cultures in different cultivation units andadjust the optimum biomass density and cultivationregime. The RLCs show the varying photosyntheticperformance of the cultures as a consequence of lightavailability in various cultivation units.
In Trial 5, we examined photosynthetic changes ofC. fusca cultures grown in outdoor thin-layer cascades(4 m2; for a more detailed description see Jerez et al.2014, this Theme Section) with an additional supply ofinorganic carbon. The aim was to find out whetherthe carbon supply (CO2 bubbling into the retentiontank) was sufficient for the culture. We followed thediel changes of the light-response curves in culturesgrown in inorganic medium with and without the ad-dition of sodium bicarbonate (NaHCO3). In the morn-ing at low irradiance, both cultures (no addition ofNaHCO3) showed a similar time course as well as sim-ilar rETRmax values of about 90 to 100 (curves withopen circles in Fig. 11). By the afternoon (15:00 h), theaddition of 20 mM NaHCO3 in the mid-morning toone of the cultures increased electron transport activ-ity by about 15% (compare the curves with solid trian-
gles in Fig. 11). By the evening (20:00 h), the rETRmax
of both cultures was similar again, at about 125 (com-pare curves with grey diamonds in Fig. 11). These re-sults suggest that the photosynthetic activity of theculture where carbon was supplied by bubbling CO2
to the retention tank was down-regulated, probablydue to a lack of inorganic carbon.
The insufficient supply of carbon dioxide can rep-resent a typical problem in outdoor open cultivationunits exposed to full solar irradiance, as we oftenwish to supply only a necessary amount to keep pro-duction cost low. The lack of carbon for growth canbe signaled by changes of the RLCs of rETR meas-ured off-line in samples comparing the carbon-suffi-cient and carbon-limited cultures. In such a case, fluorescence measurement in situ as demonstratedbelow is more operative as we can monitor changesof photosynthesis on-line and correct the problem.
135
rETR
(r.
u.)
0
100
200
300 Chlorella fusca
Thin-layer cascade Flat-panelAnnular cylinder
0 500 1000 1500 2000
Irradiance (µmol photons m–2 s–1)
Fig. 10. Rapid light-response curves (RLCs) of Chlorellafusca cultures measured at midday to monitor photosyntheticperformance of the cultures: relative electron transport rate(rETR) vs. irradiance. The cultures were grown in varioustypes of cultivation units (see Fig. 2): outdoor thin-layer cascade (6 mm light path, cultivation surface of 24 m2, totalvolume 220 l) and vertical flat-plate photobioreactor (dimen-sions 1 × 1.4 m; 70 mm light path, total volume 100 l) as wellas in a 10 l laboratory annular column glass photobioreactorwith continuous illumination by 4 cylindrical LED lightsources (Institute of Microbiology, Trebon, Czech Republic)
0 1000 2000 30000
30
60
90
120
150 B+ NaHCO3
0
30
60
90
120
150 A Chlorella fusca
09:00 h 12:00 h 15:00 h 20:00 h
Irradiance (µmol photons m–2 s–1)
rETR
(r.
u.)
Fig. 11. Cultures of Chlorella fusca grown outdoors in thin-layer cascades (4 m2; detail description by Jerez et al. 2014)in September at the University of Malaga, Spain. Compar-isons were made between cultures grown in (A) an inor-ganic medium bubbled with CO2, and (B) with an additionalsupply of 20 mM NaHCO3. Rapid light-response curves(rETR vs. irradiance) of C. fusca were measured at 09:00 h(circle), 12:00 h (square) and 15:00 h (triangle) and at 20:00 h (diamond) to characterize the physiological state of the cul-tures. The measurements were carried out off-line in dark-adapted samples using the stirred cuvette holder of a pulse-
amplitude-modulation fluorometer (PAM-2500, Walz)
Aquat Biol 22: 123–140, 2014
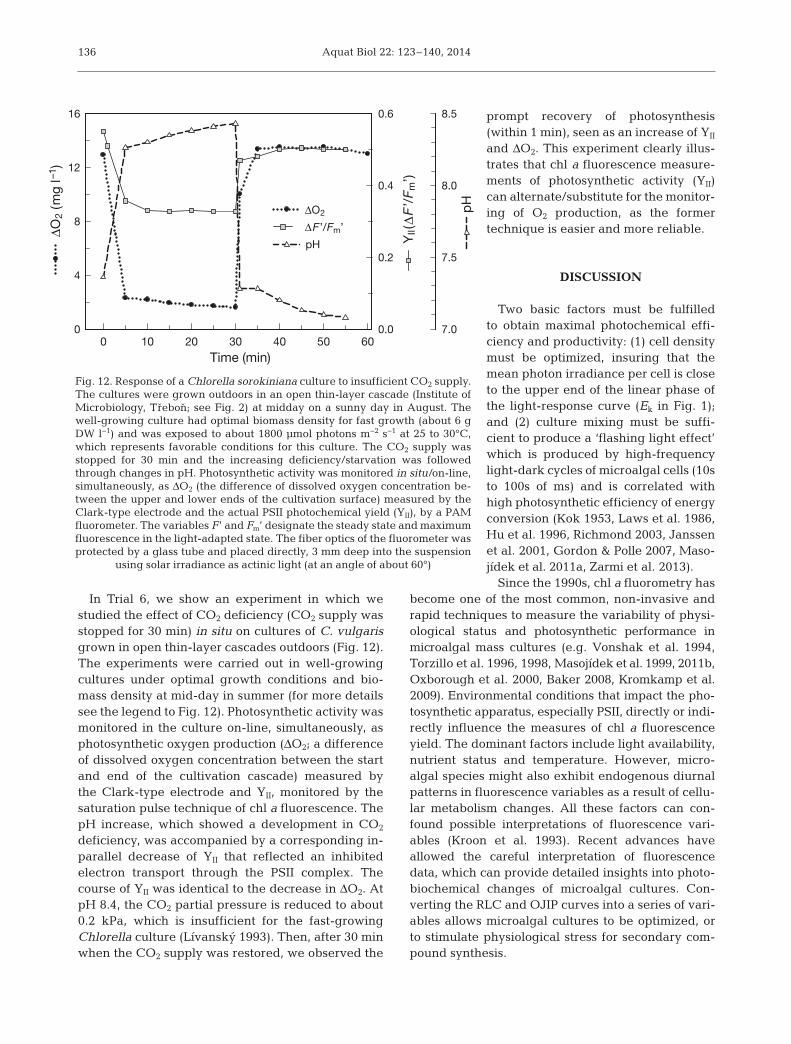
In Trial 6, we show an experiment in which westudied the effect of CO2 deficiency (CO2 supply wasstopped for 30 min) in situ on cultures of C. vulgarisgrown in open thin-layer cascades outdoors (Fig. 12).The experiments were carried out in well-growingcultures under optimal growth conditions and bio-mass density at mid-day in summer (for more detailssee the legend to Fig. 12). Photosynthetic activity wasmonitored in the culture on-line, simultaneously, asphotosynthetic oxygen production (ΔO2; a differenceof dissolved oxygen concentration between the startand end of the cultivation cascade) measured bythe Clark-type electrode and YII, monitored by thesaturation pulse technique of chl a fluorescence. ThepH increase, which showed a development in CO2
deficiency, was accompanied by a corresponding in-parallel decrease of YII that reflected an inhibitedelectron transport through the PSII complex. Thecourse of YII was identical to the decrease in ΔO2. AtpH 8.4, the CO2 partial pressure is reduced to about0.2 kPa, which is insufficient for the fast-growingChlorella culture (Lívanský 1993). Then, after 30 minwhen the CO2 supply was restored, we observed the
prompt recovery of photosynthesis(within 1 min), seen as an increase of YII
and ΔO2. This experiment clearly illus-trates that chl a fluorescence measure-ments of photosynthetic activity (YII)can alternate/ substitute for the monitor-ing of O2 production, as the formertechnique is easier and more reliable.
DISCUSSION
Two basic factors must be fulfilledto obtain maximal photochemical effi-ciency and productivity: (1) cell densitymust be optimized, insuring that themean photon irradiance per cell is closeto the upper end of the linear phase ofthe light-response curve (Ek in Fig. 1);and (2) culture mixing must be suffi-cient to produce a ‘flashing light effect’which is produced by high-frequencylight-dark cycles of microalgal cells (10sto 100s of ms) and is correlated withhigh photosynthetic efficiency of energyconversion (Kok 1953, Laws et al. 1986,Hu et al. 1996, Richmond 2003, Janssenet al. 2001, Gordon & Polle 2007, Maso-jídek et al. 2011a, Zarmi et al. 2013).
Since the 1990s, chl a fluorometry hasbecome one of the most common, non-invasive andrapid techniques to measure the variability of physi-ological status and photosynthetic performance inmicro algal mass cultures (e.g. Vonshak et al. 1994,Torzillo et al. 1996, 1998, Masojídek et al. 1999, 2011b,Oxborough et al. 2000, Baker 2008, Kromkamp et al.2009). Environmental conditions that impact the pho-tosynthetic apparatus, especially PSII, directly or indi-rectly influence the measures of chl a fluorescenceyield. The dominant factors include light availability,nutrient status and temperature. However, micro-algal species might also exhibit endogenous diurnalpatterns in fluorescence variables as a result of cellu-lar metabolism changes. All these factors can con-found possible interpretations of fluorescence vari-ables (Kroon et al. 1993). Recent advances haveal lowed the careful in ter pretation of fluorescencedata, which can provide detailed insights into photo-biochemical changes of microalgal cultures. Con-verting the RLC and OJIP curves into a series of vari-ables allows microalgal cultures to be optimized, orto stimulate physiological stress for secondary com-pound synthesis.
136
Time (min)0 10 20 30 40 50 60
ΔO2
(mg
l–1 )
YII(Δ
F’/
F m’)
pH
ΔO2
ΔF’/Fm’
pH
0
4
8
12
16
7.0
7.5
8.0
8.5
0.0
0.2
0.4
0.6
Fig. 12. Response of a Chlorella sorokiniana culture to insufficient CO2 supply.The cultures were grown outdoors in an open thin-layer cascade (Institute ofMicrobiology, Trebon; see Fig. 2) at midday on a sunny day in August. Thewell-growing culture had optimal biomass density for fast growth (about 6 gDW l−1) and was exposed to about 1800 µmol photons m−2 s−1 at 25 to 30°C,which represents favorable conditions for this culture. The CO2 supply wasstopped for 30 min and the increasing deficiency/starvation was followedthrough changes in pH. Photosynthetic activity was monitored in situ/on-line,simultaneously, as ΔO2 (the difference of dissolved oxygen concentration be-tween the upper and lower ends of the cultivation surface) measured by theClark-type electrode and the actual PSII photochemical yield (YII), by a PAMfluorometer. The variables F’ and Fm’ designate the steady state and maximumfluorescence in the light-adapted state. The fiber optics of the fluorometer wasprotected by a glass tube and placed directly, 3 mm deep into the suspension
using solar irradiance as actinic light (at an angle of about 60°)

Malapascua et al.: Fluorescence monitoring in microalgal mass cultures
Photosynthetic efficiency measured by fluorescencewas found to be related to quantum yields of otherphotosynthetic processes, such as O2 evolution andCO2 uptake (Genty et al. 1989, Flameling & Krom -kamp 1998). The relationship between ETR and grossphotosynthesis (as oxygen evolution) has been stud-ied in microalgae (see reviews of Flameling & Krom -kamp 1998, Gilbert et al. 2000, Kromkamp et al.2009, Suggett et al. 2009).
Using fluorescence measurements, (relative) elec-tron transport rate can be correlated with overallphotosynthetic performance (Juneau et al. 2005,Baker 2008), and subsequently growth rate, givingrapid estimates of productivity (e.g. Torzillo et al.1996). From a practical point in microalgal biotech-nology, we can use used the simplified formula forthe relative electron transport rate, rETR = YII × EPAR
(dimensionless), as we work with dense mass cul-tures (in contrast to relatively thin phytoplanktonpopulations) where all light is absorbed in the micro-algal layer. For a given irradiance intensity, rETR isan approximation of the rate of electron flow throughthe photosynthetic chain, and it has often been considered to be closely related to photosynthetic activity when measured by oxygen evolution or CO2
uptake (Beer et al. 1998, Ralph & Gademann 2005).In this approximation (rETR = YII × EPAR), the absorp-tance (A) or ETR-factor is omitted, and equal electrontransfer rates through PSII and PSI are ex pected(PPS2/PPPS or σPSII/σPSU = 0.5). In this way, the incorrectassumptions of A, a* (optical cross-section of PSII)and/or the absorption cross section σPSII/σPSU can beavoided.
The calculation of absolute ETR rate is a complexpoint. Using Fast Repetition Rate fluorometry (FRRf),the so-called PSII electron flux per unit volume [RCII]can be estimated, which generally correlates wellwith photosynthetic O2 evolution. A major limitationof using FRRf arises from the need to employ an in -dependent method to determine the concentration offunctional PSII reaction centers; a requirement thathas prevented FRR fluorometers from being used asstand-alone instruments for the estimation of elec-tron transport. Recently, a new algorithm for estimat-ing the PSII electron flux per unit volume has beenpublished (Oxborough et al. 2012), which does notrequire determination of [RCII]. This approach mightalso be possible with PAM, although it requires stan-dardization of the ML and output gain settings, andinvolves an initial FRRf calibration as well. Once thisis done, it is possible to calculate absolute ETR rateswithout knowledge of the optical cross section andthe PSII/PSI ratio.
The correspondence of rETR and productivity ofSpiru lina platensis cultures was shown at low andhigh biomass densities grown at optimum and sub-optimum temperatures (Torzillo et al. 1996). Recently,PAM fluorometry has also been applied to the moni-toring of physiological stress caused by nutrient limitation; this induced the subsequent synthesis ofcellular neutral lipids in laboratory cultures of afreshwater Chlorella strain (White et al. 2011). Physi-ological stress became evident when the photosyn-thesis RLC variables were decreased significantly inrETR, FV/Fm and Ek to 75%, 36% and 60%, respec-tively, and increased in NPQ to 83%, marking theonset of neutral lipid synthesis. Complete nutrientstress induced the highest yield of cellular neutrallipids (~49%), compared to an absence of selectednutrients (~30%).
Photosynthetic carbon production (µmol C m−2 d−1)of Chlorella fusca cultures in thin-layer cascade(TLC) cultivators has been converted into biomassproductivity expressed as g DW m−2 d−1 (estimatedproductivity) using the total internal carbon contentand the theoretical relationship between photonsabsorbed and oxygen production and the relation-ship between carbon assimilated per oxygen pro-duced (Figueroa et al. 2013). In 2 cm layer cascades,the estimated biomass productivity was about 8%lower than the measured productivity, whereas ina 1 cm layer cascade no relationship was found(Figueroa et al. 2013).
Large-scale cultivation of microalgae will benefitfrom on-line/in situ monitoring of both physicochem-ical and biological variables to help achieve processcontrol and improved productivity (Havlik et al.2013). Such monitored variables could include irradi-ance intensity, temperature, pH, dissolved oxygenconcentration, biomass density, chl a fluorescence,etc. Novel monitoring techniques available nowshould be reliable and non-invasive for most micro-algal strains. All of the methods for on-line monitor-ing of biological variables require more sophisticatedevaluation methods, implemented in software, inorder to deliver meaningful results. Scientific ex -perience and process understanding is an inevitableprerequisite.
Acknowledgements. The authors thank Ms. Sona Pekarová,Mr. Petr Novotný and Mr. Pavel Souvek for technical as -sistance, Mr. Steve Ridgill for language corrections, and Professors John Beardall, Giuseppe Torzillo and JaccoKromkamp for comments. We are grateful to 3 anonymousreferees who provided criticism to improve the manuscript.The work was supported by the Ministry of Education,Youth and Sports of the Czech Republic, project AlgaTech
137

Aquat Biol 22: 123–140, 2014
CZ.1.05/2.1.00/03.0110, AlgaIn CZ.1.07/2.3.00/30.0059 andby the Action CTM2011-15659-E within the 9th Interna-tional GAP workshop at the University of Málaga.
LITERATURE CITED
Baker NR (2008) Chlorophyll fluorescence: a probe of photo-synthesis in vivo. Annu Rev Plant Biol 59: 89−113
Baker NR, Oxborough K (2004) Chlorophyll fluorescence asa probe of photosynthetic productivity. In: PapageorgiouGC, Govindjee (eds) Chlorophyll a fluorescence: a signa-ture of photosynthesis. Springer, Dordrecht, p 65−82
Beer SB, Vilenkin A, Weil M, Veste L, Eshel S (1998) Meas-uring photosynthetic rates in seagrasses by pulse ampli-tude modulated (PAM) fluorometry. Mar Ecol Prog Ser174: 293−300
Bilger W, Björkman O (1990) Role of the xanthophyll cycle inphotoprotection elucidated by measurements of light-induced absorbance changes, fluorescence and photo-synthesis in leaves of Hedera canariensis. PhotosynthRes 25: 173−185
Bradbury M, Baker NR (1984) A quantitative determina-tion of photochemical and non-photochemical quenchingduring the slow phase of the chlorophyll fluorescenceinduction curve of bean leaves. Biochim Biophys Acta765: 275−281
Büchel C, Wilhelm C (1993) In vivo analysis of slow chloro-phyll fluorescence induction kinetics in algae: progress,problems and perspectives. Photochem Photobiol 58: 137−148
Dominy PJ, Willims WP (1987) The role of respiratory elec-tron flow in the control of excitation energy distributionin blue-green algae. Biochim Biophys Acta 892: 264−274
Doucha J, Lívanský K (1995) Novel outdoor thin-layer highdensity microalgal culture system: productivity and oper-ation parameters. Algol Stud 76: 129−147
Eilers PHC, Peeters JCH (1988) A model for the relationshipbetween light intensity and the rate of photosynthesisin phytoplankton. Ecol Modell 42: 199−215
Enriquez S, Borowitzka MA (2011) The use of the fluores-cence signal in studies of seagrasses and macroalgae. In: Suggett DJ, Prášil O, Borowitzka MA (eds) Chlorophyll afluorescence in aquatic sciences: methods and applica-tions. Springer, Dordrecht, p 187−208
Figueroa FL, Conde-Álvarez R, Gómez I (2003) Relationsbetween electron transport rates determined by pulseamplitude modulated chlorophyll fluorescence and oxy-gen evolution in macroalgae under different light condi-tions. Photosynth Res 75: 259−275
Figueroa FL, Jerez CG, Korbee N (2013) Use of in vivochlorophyll fluorescence to estimate photosyntheticactivity and biomass productivity in microalgae grownin different culture systems. Lat Am J Aquat Res 41: 801−819
Flameling IA, Kromkamp J (1998) Light dependence ofquantum yields for PSII charge separation and oxygenevolution in eukaryotic algae. Limnol Oceanogr 43: 284−297
Genty B, Briantais JM, Baker NR (1989) The relationshipbetween the quantum yield of photosynthesis electrontransport and quenching of chlorophyll fluorescence.Biochim Biophys Acta 990: 87−92
Gilbert M, Wilhelm C, Richter M (2000) Bio-optical model-ling of oxygen evolution using in vivo fluorescence:
comparison of measured and calculated photosynthesis/irradiance (P-I) curves in four representative phyto-plankton species. J Plant Physiol 157: 307−314
Gordon JM, Polle JEW (2007) Ultrahigh bioproductivityfrom algae. Appl Microbiol Biotechnol 76: 969−975
Govindjee (1995) Sixty-three years since Kautsky: chloro-phyll a fluorescence. Austr J Plant Physiol 22: 131−160
Govindjee (2004) Chlorophyll a fluorescence: a bit of basicsand history. In: Papageorgiou G, Govindjee (eds) Chloro-phyll a fluorescence: a signature of photosynthesis.Springer, Dordrecht, p 1−42
Grobbelaar JU (2007) Photosynthetic characteristics of Spir-ulina platensis grown in commercial-scale open outdoorraceway ponds: What do the organisms tell us? J ApplPhycol 19: 591−598
Grobbelaar JU (2009) Factors governing algal growth inphotobioreactors: the ‘open’ versus ‘closed’ debate.J Appl Phycol 21: 489−492
Havlik I, Lindner P, Scheper T, Reardon KF (2013) On-linemonitoring of large cultivations of microalgae and cyano-bacteria. Trends Biotechnol 31: 406−414
Hofstraat JW, Peeters JCH, Snel JFH, Geel C (1994) Simpledetermination of photosynthetic efficiency and photo -inhibition of Dunaliella tertiolecta by saturating pulsefluorescence measurements. Mar Ecol Prog Ser 103: 187−196
Hu Q, Guterman H, Richmond A (1996) A flat inclined mod-ular photobioreactor (FIMP) for outdoor mass cultivationof photoautotrophs. Biotechnol Bioeng 51:51–60
Janssen M, Slenders P, Tramper J, Muur LR, Wijffels R(2001) Photosynthetic efficiency of Dunaliella tertiolectaunder short light/dark cycles. Enzyme Microb Technol29: 298−305
Jerez CG, Navarro E, Malpartida I, Rico RM, Masojídek J,Abdala R, Figueroa FL (2014) Hydrodynamics and photosynthesis performance of Chlorella fusca (Chloro-phyta) grown in a thin-layer cascade (TLC) system.Aquat Biol 22: 111−122
Juneau P, Green BR, Harrison PJ (2005) Simulation of Pulse-Amplitude-Modulated (PAM) fluorescence: limitations ofsome PAM-parameters in studying environmental stresseffects. Photosynthetica 43: 75−83
Kautsky H, Hirsch A (1931) Neue Versuche zur Kohlensäure -assimilation. Naturwissenschaften 19: 964
Kok B (1953) Experiments on photosynthesis by Chlorella inflashing light. In: Burlew JS (ed) Algal culture from labo-ratory to pilot plant. Carnegie Inst Wash 600: 63−158
Krause GH, Weis E (1984) Chlorophyll fluorescence as a toolin plant physiology. 2. Interpretation of fluorescence signals. Photosynth Res 5: 139−157
Krause GH, Weis E (1991) Chlorophyll fluorescence andphotosynthesis: the basics. Annu Rev Plant Physiol 42: 313−349
Kromkamp JC, Forster RM (2003) The use of variable fluo-rescence measurements in aquatic ecosystems: differ-ences between multiple and single turnover measuringprotocols and suggested terminology. Eur J Phycol 38: 103−111
Kromkamp JC, Barranguet C, Peene J (1998) Determinationof microphytobenthos PSII quantum efficiency and photosynthetic activity by means of variable chlorophyllfluorescence. Mar Ecol Prog Ser 162: 45−55
Kromkamp JC, Beardall J, Sukenik A, Kopecký J and others(2009) Short term variation in photosynthetic parametersof Nannochloropsis grown in two different types of out-
138

Malapascua et al.: Fluorescence monitoring in microalgal mass cultures
door mass cultivation systems. Aquat Microb Ecol 56: 309−322
Kroon B, Prezelin BB, Schofield O (1993) Chromatic regula-tion of quantum yields for photosystem II charge separa-tion, oxygen evolution, and carbon fixation in Hetero-capsa pygmaea (Pyrrophyta). J Phycol 29:453–462
Laws EA, Taguchi S, Hirata J, Pang L (1986) High algal pro-duction rates achieved in a shallow outdoor flume.Biotechnol Bioeng 28: 191−197
Lívanský K (1993) Dependence of the apparent CO2 masstransfer coefficient KLa on the nutrient solution pH in out-door algal culture units. Algol Stud 71: 111−119
Masojídek J, Torzillo G, Koblížek M, Kopecký J, BernardiniP, Sacchi A, Komenda J (1999) Photoadaptation of twomembers of the Chlorophyta (Scenedesmus and Chlo -rella) in laboratory and outdoor cultures: changes inchlorophyll fluorescence quenching and the xanthophyllcycle. Planta 209: 126−135
Masojídek J, Kopecký J, Koblížek M, Torzillo G (2004) Thexanthophyll cycle in green algae (Chlorophyta): its rolein the photosynthetic apparatus. Plant Biol 6: 342−349
Masojídek J, Kopecký J, Giannelli L, Torzillo G (2011a) Pro-ductivity correlated to photobiochemical performance ofChlorella mass cultures grown outdoors in thin-layer cascades. J Ind Microbiol Biot 38: 307−317
Masojídek J, Vonshak A, Torzillo G (2011b) Chlorophyll flu-orescence applications in microalgal mass cultures. In: Suggett DJ, Prášil O, Borowitzka MA (eds) Chlorophyll afluorescence in aquatic sciences: methods and applica-tions. Springer, Dordrecht, p 277−292
Masojídek J, Koblížek M, Torzillo G (2013) Photosynthesisin microalgae. In: Richmond A, Hu Q (eds) Handbook ofmicroalgal culture: applied phycology and biotechno -logy. Wiley Blackwell, Oxford, p 20−39
Maxwell K, Johnson GN (2000) Chlorophyll fluorescence—a practical guide. J Exp Bot 51: 659−668
Oxborough K, Baker NR (1997) An instrument capable ofimaging chlorophyll a fluorescence from intact leaves atvery low irradiance and at cellular and subcellular levelsof organization. Plant Cell Environ 20: 1473−1483
Oxborough K, Hanlon ARM, Underwood GJC, Baker NC(2000) In vivo estimation of the photosystem II photo-chemical efficiency of individual microphytobenthoscells using high resolution imaging of chlorophyll a fluo-rescence. Limnol Oceanogr 43: 1207−1221
Oxborough K, Moore CM, Suggett DJ, Lawson T, Chan HG,Geider RJ (2012) Direct estimation of functional PSIIreaction center concentration and PSII electron flux on avolume basis: a new approach to the analysis of Fast Repetition Rate fluorometry (FRRf) data. Limnol OceanogrMethods 10: 142−154
Papageorgiou GC, Govindjee (eds) (2004) Chlorophyll a fluorescence: a signature of photosynthesis. Advancesin photosynthesis and respiration, Vol 19. Springer, Dordrecht,
Papageorgiou GC, Tsimilli-Michael M, Stamatakis K (2007)The fast and slow kinetics of chlorophyll a fluorescenceinduction in plants, algae and cyanobacteria: a view-point. Photosynth Res 94: 275−290
Ralph PJ, Gademann R (2005) Rapid light curves: a power-ful tool to assess photosynthetic activity. Aquat Bot 82: 222−237
Rezanka T, Petránková M, Cepák V, Pribyl P, Sigler K,Cajthaml T (2010) Trachydiscus minutus, a new biotech-nological source of eicosapentaenoic acid. Folia Micro-
biol (Praha) 55: 265−269Richmond A (2003) Growth characteristics of ultrahigh-
density microalgal cultures. Biotechnol Bioprocess Eng8: 349−353
Richmond A (2013) Biological principles of mass cultivation ofphotoautotrophic microalgae. In: Richmond A, Hu Q (eds)Handbook of microalgal culture: applied phyco logy andbiotechnology. Wiley Blackwell, Oxford, p 171−204
Ritchie RJ, Larkum AWD (2012) Modelling photosynthesisin shallow algal production ponds. Photosynthetica 50: 481−500
Schreiber U (2004) Pulse-amplitude-modulation (PAM) fluo-rometry and saturation pulse method: an overview. In: Papageorgiou GC, Govindjee (eds) Chlorophyll a fluo-rescence: a signature of photosynthesis. Advances inphotosynthesis and respiration, Vol 19. Springer, Dor-drecht, p 279−319
Schreiber U, Schliwa U, Bilger W (1986) Continuous record-ing of photochemical and nonphotochemical fluores-cence quenching with a new type of modulation fluoro -meter. Photosynth Res 10: 51−62
Schreiber U, Endo T, Mi H, Asada K (1995) Quenchinganalysis of chlorophyll fluorescence by the saturationpulse method: particular aspects relating to the study ofeukaryotic algae and cyanobacteria. Plant Cell Physiol36: 873−882
Schreiber U, Bilger W, Hormann H, Neubauer C (1998)Chlorophyll fluorescence as a diagnostic tool: basics andsome aspects of practical relevance. In: RaghavendraAS (ed) Photosynthesis: a comprehensive treatise. Cam-bridge University Press, Cambridge, p 320−334
Stirbet A, Govindjee (2011) On the relation between theKautsky effect (chlorophyll a fluorescence induction)and photosystem II: basics and applications of the OJIP fluorescence transient. J Photochem Photobiol B 104: 236−257
Strasser RJ, Srivastava A, Govindjee (1995) Polyphasicchlorophyll a fluorescence transient in plants and cyano-bacteria. Photochem Photobiol 61: 33−42
Strasser RJ, Tsimili-Michael M, Srivastava A (2004) Analysisof the chlorophyll a fluorescence transient. In: Papageor-giou GC, Govindjee (eds) Chlorophyll a fluorescence: asignature of photosynthesis. Advances in photosynthesisand respiration, Vol 19. Springer, Dordrecht, p 321−362
Suggett DJ, MacIntyre HL, Kana TM, Geider RJ (2009)Comparing electron transport with gas exchange: para-meterising exchange rates between alternative photo-synthetic currencies for eukaryotic phytoplankton. AquatMicrob Ecol 56: 147−162
Suggett DJ, Moore CM, Geider RJ (2011) Estimating aquaticproductivity from active fluorescence measurements. In: Suggett DJ, Prášil O, Borowitzka MA (eds) Chlorophyll afluorescence in aquatic sciences: methods and applica-tions. Springer, Dordrecht, p 103−128
Ting CS, Owens TG (1992) Limitation of the pulse-modulatedtechnique for measuring the fluorescence characteristicsof algae. Plant Physiol 100: 367−373
Torzillo G, Vonshak A (2013) Environmental stress physio -logy with reference to mass cultures. In: Richmond A,Hu Q (eds) Handbook of microalgal cultures: appliedphycology and biotechnology. Wiley Blackwell, Oxford,p 90−113
Torzillo G, Accolla P, Pinzani E, Masojídek J (1996) In situmonitoring of chlorophyll fluorescence to assess the syn-ergistic effect of low temperature and high irradiance
139

Aquat Biol 22: 123–140, 2014140
stresses in Spirulina cultures grown outdoors in photo-bioreactors. J Appl Phycol 8: 283−291
Torzillo G, Bernardini P, Masojídek J (1998) On-line moni-toring of chlorophyll fluorescence to assess the extent ofphotoinhibition of photosynthesis induced by high oxy-gen concentration and low temperature and its effect onthe productivity of outdoor cultures of Spirulina platensis(Cyanobacteria). J Phycol 34: 504−510
Tredici M (2010) Photobiology of microalgae mass cultures: understanding the tools for the next green revolution.Biofuels 1: 143−162
van Kooten O, Snel JFH (1990) The use of chlorophyll fluo-rescence nomenclature in plant stress physiology. Photo-synth Res 25: 147−150
Vonshak A, Torzillo G, Tomaselli L (1994) Use of chlorophyllfluorescence to estimate the effect of photoinhibition inoutdoor cultures of Spirulina platensis. J Appl Phycol 6: 31−34
Walker DA (1987) The use of the oxygen electrode and fluorescence probes in simple measurements of photo-
synthesis. Oxygraphics, SheffieldWhite AJ, Critchley C (1999) Rapid light curves: a new fluo-
rescence method to assess the state of the photosyntheticapparatus. Photosynth Res 59: 63−72
White S, Anandraj A, Bux F (2011) PAM fluorometry as atool to assess microalgal nutrient stress and monitor cel-lular neutral lipids. Bioresour Technol 102: 1675−1682
Wilhelm C, Becker A, Vieler A, Rautenberger R (2004) Pho-tophysiology and primary production of phytoplanktonin freshwater. Physiol Plant 120: 347−357
Zarmi Y, Bel G, Aflalo C (2013) Theoretical analysis of cul-ture growth in flat-plate bioreactors: the essential roleof timescales. In: Richmond A, Hu Q (eds) Handbook ofmicroalgal culture: applied phycology and biotechno -logy. Wiley Blackwell, Oxford, p 205−224
Zittelli GC, Biondi N, Rodolfi L, Tredici MR (2013) Photo-bioreactors for mass production of microalgae. In: Rich-mond A, Hu Q (eds) Handbook of microalgal culture: applied phycology and biotechnology. Wiley Blackwell,p 225−266
Submitted: December 2, 2013; Accepted: August 12, 2014 Proofs received from author(s): November 7, 2014