photoelectrocatalytic study of gold-modified bivo for · pdf filephotoelectrocatalytic study...
TRANSCRIPT

Photoelectrocatalytic Study of Gold-Modified
BiVO4 for the Degradation of 4-Chlorophenol
A WPI Major Qualifying Project
By Andrew Black
Sponsored by
School of Environmental Science and Engineering

Project Number HSZ-CH01
Photoelectrocatalytic Study of Gold-Modified BiVO4 for the Degradation of 4-Chlorophenol
A Major Qualifying Project Report
submitted to the faculty of
Worcester Polytechnic Institute
in partial fulfillment of the requirements for the
Degree of Bachelor of Science
By
_________________________
Andrew Black
On
April 27, 2011
_________________________
Dr. Hong Susan Zhou, Assistant Professor
Worcester Polytechnic Institute
Department of Chemical Engineering
Shanghai Major Qualifying Project Center
In Cooperation With
Dr. Mingce Long, Assistant Professor
Shanghai Jiao Tong University
School of Environmental Science and Engineering

WPI SJTU MQP i
Abstract
This project, prepared in collaboration with Shanghai Jiao Tong University, details a study
on the modification of monoclinic BiVO4 photocatalyst with gold nanoparticles for the degradation
of 4-chlorophenol. It adapts methodologies in the literature for the synthesis of thin film
semiconductor photocatalyst electrodes and photoelectrochemical characterization techniques,
including linear sweep and cyclic voltammetry and chopped irradiation chronoamperometry, to
compare BiVO4 modified with 0.5, 0.75, 1, 2, and 4 wt% gold to its unmodified form. Additional
parameters explored were the material of the counter electrode, the electrical potential bias, the
spectra of illumination, and the addition of hydrogen peroxide. Analysis of data suggested that 2
wt% Au/BiVO4 was the most suitable thin film electrode for the degradation of 4-chlorophenol in a
H2O2-Na2SO4 electrolyte. Several recommendations for improving the quality of the research are
then discussed.

WPI SJTU MQP ii
Acknowledgments
I would like to thank the School of Environmental Science and Engineering at Shanghai Jiao
Tong University for providing me with the fortuity to participate in this project and great cultural
exchange. Specifically, my thanks extend to Professor Mingce Long, my lab advisor, whose support
and aid were invaluable to the completion of this project. The generosity to graciously provide the
workspace, materials, and equipment required for this project is greatly appreciated. I would like to
thank Professor Jiahui Shao at SJTU and Professors David DiBiasio and Susan Zhou at WPI for
organizing this experience. Additional thanks go to Professor Zhou for supervising the writing of
this report.
Special thanks go to the members of the lab and other Chinese students befriended while
abroad for introducing me to weird yet delicious food, for helping me acclimate to the culture of
China, and for enabling me to truly reap the benefits of an experience abroad. Their persistent
willingness to help and hospitality deserves this acknowledgement. Many thanks go to my dorm-
mates and WPI classmates for enjoying with me the amazing opportunities that China offers and
ensuring that I did not go crazy.

WPI SJTU MQP iii
Table of Contents
Abstract .................................................................................................................................................. i
Acknowledgments................................................................................................................................. ii
Table of Contents ................................................................................................................................. iii
List of Figures ...................................................................................................................................... iv
List of Tables ....................................................................................................................................... iv
Chapter 1: Introduction ......................................................................................................................... 1
Chapter 2: Background ......................................................................................................................... 3
2.1 Motivation for Semiconductor Photocatalysis ....................................................................... 3
2.2 Basics of Semiconductor Photocatalysis ............................................................................... 4
2.3 Photocatalysts with Metal Nanoparticle Modification .......................................................... 7
Chapter 3: Methodology ..................................................................................................................... 10
3.1 Synthesis of Catalyst Paste .................................................................................................. 11
3.2 Preparation of FTO Glass Electrode .................................................................................... 12
3.3 Assembly of Electrochemical Cell ....................................................................................... 13
3.4 Characterization ................................................................................................................... 15
3.4.1 Linear Sweep Voltammetry .......................................................................................... 15
3.4.2 Chronoamperometry ..................................................................................................... 15
3.4.3 Degradation of 4-Chlorophenol .................................................................................... 16
3.4.4 SEM .............................................................................................................................. 17
Chapter 4: Results and Discussion ...................................................................................................... 18
4.1 Linear Sweep Voltammetry ................................................................................................. 18
4.2 Chronoamperometry ............................................................................................................ 21
4.3 Degradation of 4-Chlorophenol ........................................................................................... 24
4.4 SEM Images ......................................................................................................................... 27
4.5 Errors and Lab Practices ...................................................................................................... 28
4.6 Recommendations for Future Work..................................................................................... 30
Chapter 5: Conclusions ....................................................................................................................... 34
References ........................................................................................................................................... 35
Appendix ............................................................................................................................................. 38
Furnace Program for Electrode Calcination .............................................................................. 38
SEM Images ............................................................................................................................... 38

WPI SJTU MQP iv
List of Figures
Figure 1: Basic schematic of a photoelectrochemical cell with an n-type semiconductor ................... 5
Figure 2: Schematic of major processes following e- h
+ photogeneration ............................................ 6
Figure 3: Charge separation in a TiO2 or BiVO4 electrode .................................................................. 9
Figure 4: Schematic of the overall methodology ................................................................................ 11
Figure 5: Temperature-time profile of the electrode calcination program ......................................... 13
Figure 6: Bismuth vanadate in a vial and doctor bladed on three FTO glass electrodes and the same
electrodes after calcination ................................................................................................................. 13
Figure 7: Pictures of the electrochemical cell ..................................................................................... 14
Figure 8: The experimental setup for 4-chlorophenol degradation. ................................................... 16
Figure 9: The working electrodes after calcination coated with a thin film of Au/BiVO4. ................ 18
Figure 10: Linear sweep voltammetry ................................................................................................ 20
Figure 11: CVs performed with BiVO4 electrode before photocurrent measurements ...................... 21
Figure 12: Chronoamperometric photocurrent measurements at constant potentials ......................... 23
Figure 13: Chronoamperometric photocurrent measurements with different filters .......................... 24
Figure 14: Absorbance of samples from 4-chlorophenol degradation with 2 wt% Au/BiVO4 .......... 25
Figure 15: Absorbance of samples from 4-chlorophenol degradation with 2 wt% Au/BiVO4 and 5
mM H2O2 added .................................................................................................................................. 26
Figure 16: Absorbance of samples from 4-chlorophenol degradation with 2 wt% Au/BiVO4 and 10
mM H2O2 ............................................................................................................................................ 27
Figure 17: SEM images BiVO4, 1 wt% BiVO4, and 2 wt% Au/BiVO4 ............................................. 28
List of Tables
Table 1: Processes and characteristic times in TiO2 photomineralization of organics ......................... 7
Table 2: Magnifications of SEM images for 0, 0.5, 1, and 2 wt% Au/BiVO4.................................... 17

WPI SJTU MQP 1
Chapter 1: Introduction
Contamination of water by organic pollutants significantly impacts developed and rapidly
developing regions in the world. Without proper treatment, they seep into groundwater aquifers,
rivers, and reservoirs used as water sources. The slow pace of hazardous waste remediation means
that the presence of toxic chemical substances from waste effluents and previously contaminated
sites is a major concern.1
Mineralization (oxidation of organic compounds to carbon dioxide, water, and other
inorganic components) by photoelectrochemical methods has been identified as an effective waste
degradation technique with applications in environmental control technology by semiconductor
photocatalysis with TiO2 and BiVO4.1 A supreme challenge for photocatalysis century is the
development of new catalysts that more efficiently utilize sunlight, a vastly abundant and green
energy source, to drive chemical reactions of interest to society. This research has led to great new
understandings of heterogeneous photocatalysis by metal oxide systems in environments with
multiple phases.2, 3
Heterogeneous titanium dioxide photocatalysts are well-studied in the removal of organic
pollutants from environments and are known to be highly oxidative, inexpensive, non-toxic, and
chemically stable; however, these advantageous properties are offset by the fact that TiO2 is active
only under UV light irradiation. Because ambient light is typically provided by the sun or
conventional fluorescent lamps, it is desirable to develop visible-light driven photocatalysts that
demonstrate degradation activity on the order of titanium dioxide.4-7 Bismuth vanadate is one such
candidate that has shown promising photooxidation capabilities under visible light irradiation. Its
activity is typically improved by the loading of transition metals such as silver or gold.6, 8-10 In
particular, gold nanoparticles are known to strongly absorb visible light due to a surface plasmon
resonance effect.2
Nanocrystalline semiconductor thin films exhibit a highly microporous structure with similar
properties to semiconductor particle suspensions. The use of an immobilized thin film eliminates the
need to add semiconductor particles to a reaction mixture and then perform a separation step.
Developments in designing porous nanocrystalline thin films make it possible to achieve charge
separation in a semiconductor system with an electrochemical bias.4, 6, 11-13

WPI SJTU MQP 2
4-Chlorophenol was chosen as a model organic compound. Chlorophenol compounds are
used in disinfectant agents and pesticides and are intermediates in the polychlorination of phenol.
Exposure is most common after water is disinfected with chlorine, wood is bleached, and pesticides
released to the environment go into water. High levels of chlorophenols cause liver and immune
system effects and may lower birth weight but not cause birth defects.14, 15 Mechanisms of 4-
chlorophenol photooxidation have been explored previously.1
In this report, nanocrystalline bismuth vanadate loaded with varying weight percentages of
gold nanoparticles were explored in terms of their photocurrents at various potentials and with and
without visible-light irradiation. A limited number of 4-chlorophenol degradation experiments were
run, and recommendations for future experiments were made. Ultimately, this study will improve
the understanding of the photoelectrocatalytic degradation of 4-chlorophenol on a metal oxide
support enhanced by gold nanoparticles.

WPI SJTU MQP 3
Chapter 2: Background
Much of the early semiconductor photocatalysis research focused upon the use of titanium
dioxide (TiO2), which has been investigated quite thoroughly in photocatalytic and mechanistic
studies1, 2, 5-12, 16-18
since its discovery in applications of water electrolysis with TiO2 by Fujishima
and Honda.19
In recent years, alternative photocatalysts have come of interest and many papers on
the synthesis and characterization of bismuth vanadate (BiVO4) can be found.4, 5, 13, 20-32
Of these,
many have studied the effects of loading transition metals such as gold, platinum, iridium, cobalt,
and silver onto TiO2 and BiVO4, with indications that the photocatalytic activity is greatly
enhanced.2, 3, 6, 8, 9, 20, 22, 23
2.1 Motivation for Semiconductor Photocatalysis
Semiconductor photocatalysis has been applied to water splitting,13, 25
electricity production,3
self-cleaning films, oxidation of gaseous and dissolved organic pollutants, biomass conversion to H2
and CO2,17
and selective oxidation reactions of interest to the bulk commodity industry2 as well as
the photodestruction of cells, bacteria, and viruses.17
Among the many reactions for which
semiconductor photocatalysis has been applied, those related to pollution abatement and organic
waste degradation have garnered a large amount of interest in the research community. General
types of hazardous wastes include solvents, halogenated hydrocarbons, pesticides, volatile organics,
phenols, and dyes.1, 4, 17
4-chlorophenol, the probe compound in this project, is a skin and eye
irritant that is toxic if ingested.14
It is created in the production of pesticides, chlorination of
drinking water, and synthesis of dyes and drugs.18
Groundwater contamination is the primary source
of human contact, and numerous studies have explored 4-chlorophenol as a model compound.11, 12, 18
Many of these organic contaminants can penetrate environmental barriers and enter
groundwater wells or surface wells after being released in wastewater effluents from industries or
households. Military as well as commercial installations have disposed chemical wastes in
underground storage tanks and dump sites that eventually contaminate the surrounding soil and
groundwater aquifers. This slows the conversion of these facilities to civilian or other uses and cost
billions of dollars and take years to cleanup.1, 17
Semiconductor photocatalytic degradation reactions can serve as alternative or
complementary processes to more traditional approaches to chemical waste elimination, such as

WPI SJTU MQP 4
incineration, anaerobic digestion, activated sludge digestion, and conventional physicochemical
treatments.1 Common water treatment technologies adsorb organic pollutants on activated carbon or
utilize air stripping, which do not destroy the contaminants, and incineration is negatively perceived,
limiting its use.16
Therefore, complete mineralization of organic pollutants to CO2 and inorganic
acids is desirable; with wide bandgap semiconductors that have high oxidation potentials under
photoexcitation, this is achievable.
2.2 Basics of Semiconductor Photocatalysis
Photocatalysis refers to two distinct mechanisms of catalysis. In one conceptualization of it,
it is the acceleration of a photoreaction in the presence of a catalyst whereby the adsorbed substrate
absorbs light. In the context of this report, it is photogenerated catalysis, whereby the catalyst itself
absorbs light and its photocatalytic activity depends on its ability to create electron-hole (e- h
+) pairs.
Creation of electron-hole pairs leads to generation of free radicals (such as hydroxyl radicals) that
are able to undergo secondary reactions.17
In photocatalysis, light acts as an electron pump; atomic or molecular absorption of a photon
pumps an electron from an almost full valence band to a nearly empty conduction band. To cause
such a transition, the wavelength of light must be with energy equal to or greater than the bandgap,
the difference in energies of the two orbitals or bands. This excitation results in an electron (e- h
+)
pair. This pair can separate such that the e- transfers to an acceptor species, A, and the h
+ is filled
with an electron from a donor species, D:
If the electron is pumped through a wire and the above redox reactions are separated, useful
electrical current can be extracted.11, 12
The excited state of charge separation is typically very short-
lived and the charge pairs frequently recombine quickly, emitting heat.1, 2, 17
Promotion of this
separation occurs by introduction of an electric field (when an electrical potential bias is created) or
a difference in chemical potential (which occurs when A and D are present). Semiconductor
immersion in a solution results in charge transfer at the interface due to the difference in electron
affinities between the two phases. An electrical field to a depth on the order of one to several
hundred nanometers is created by this difference. In an n-type semiconductor, some electrons are in
WPI SJTU MQP 5
the conduction band, so the field is directed from the bulk of the semiconductor to the interface.28
Photogeneration of an e- h
+ pair in this region results in their separation because the electron would
move towards the bulk of the semiconductor while the hole would move towards the surface.
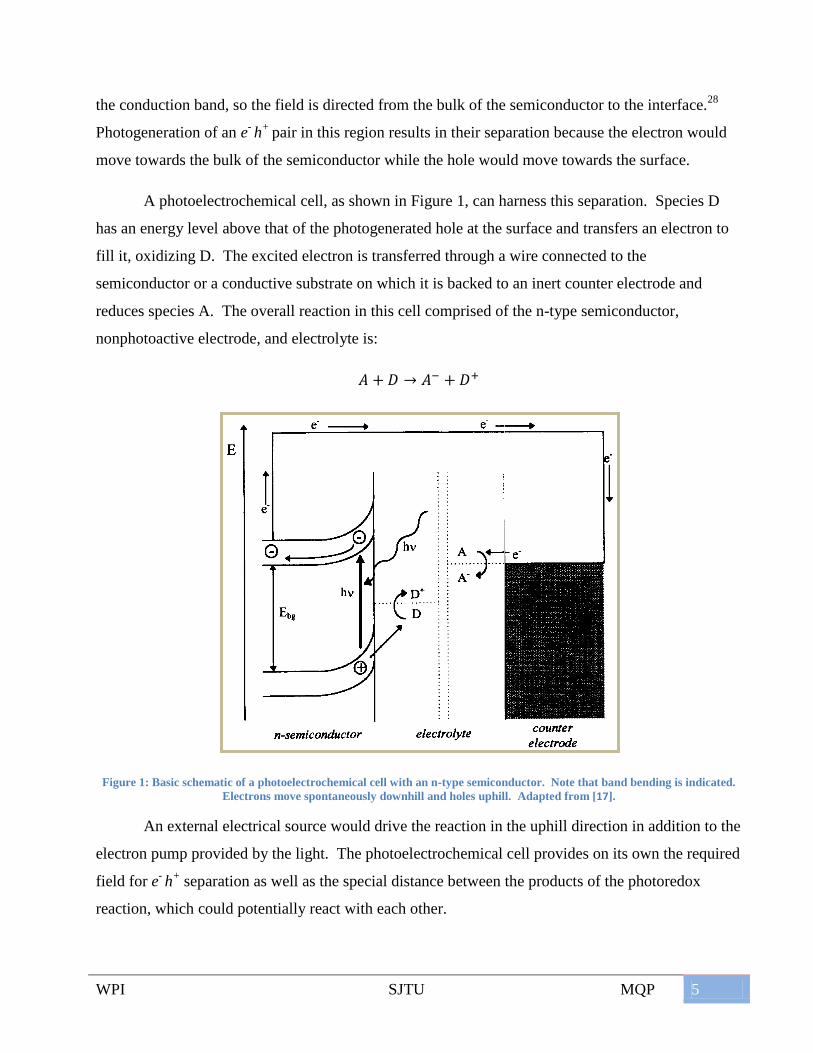
A photoelectrochemical cell, as shown in Figure 1, can harness this separation. Species D
has an energy level above that of the photogenerated hole at the surface and transfers an electron to
fill it, oxidizing D. The excited electron is transferred through a wire connected to the
semiconductor or a conductive substrate on which it is backed to an inert counter electrode and
reduces species A. The overall reaction in this cell comprised of the n-type semiconductor,
nonphotoactive electrode, and electrolyte is:
Figure 1: Basic schematic of a photoelectrochemical cell with an n-type semiconductor. Note that band bending is indicated.
Electrons move spontaneously downhill and holes uphill. Adapted from [17].
An external electrical source would drive the reaction in the uphill direction in addition to the
electron pump provided by the light. The photoelectrochemical cell provides on its own the required
field for e- h
+ separation as well as the special distance between the products of the photoredox
reaction, which could potentially react with each other.

WPI SJTU MQP 6
Figure 2 summarizes the processes involving e- h
+ pairs upon photoexcitation of a
semiconductor particle by light greater than the bandgap of the semiconductor. Upon generation and
subsequently separation of the charge pairs, competing processes can occur. Deactivation and
degradation of light energy into heat occurs with recombination of the charges at the surface (path
A) or in the bulk (path B). After diffusing to the surface, interfacial electron transfer occurs.
Photogenerated electrons reduce the electron acceptor (path C), and photogenerated holes oxidize
the electron donor (path D). In a photoelectrochemical cell, the electrons would be drawn through
the wire and react at the surface of the counter electrode. The combination of the reactions given by
path C and path D is the overall redox reaction that can occur in the cell.
Figure 2: Schematic of major processes following e- h+ photogeneration. Adapted from [17].
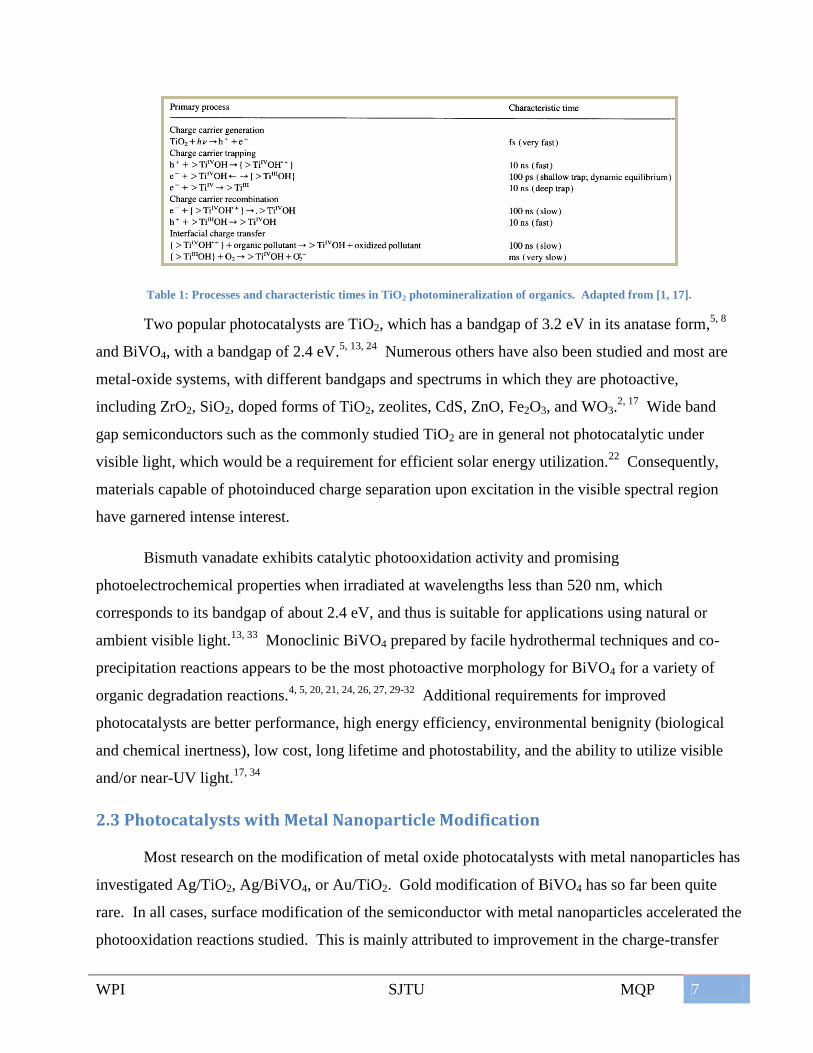
From laser flash photolysis experiments, primary processes associated with the
mineralization of organic compounds via heterogeneous photocatalysis over TiO2 were identified,
along with their characteristic time domains, shown in Table 1. >TiOH is the primary hydrated
surface functionality of TiO2. The organic compound acts as an electron donor while oxygen is an
electron acceptor. Typically, the organic does not undergo direct hole transfer but rather is oxidized
by a surface-bound hydroxyl radical. A full kinetic model for these sets of reactions is difficult to
establish and may vary depending upon the substrate used.
WPI SJTU MQP 7
Table 1: Processes and characteristic times in TiO2 photomineralization of organics. Adapted from [1, 17].
Two popular photocatalysts are TiO2, which has a bandgap of 3.2 eV in its anatase form,5, 8
and BiVO4, with a bandgap of 2.4 eV.5, 13, 24
Numerous others have also been studied and most are
metal-oxide systems, with different bandgaps and spectrums in which they are photoactive,
including ZrO2, SiO2, doped forms of TiO2, zeolites, CdS, ZnO, Fe2O3, and WO3.2, 17
Wide band
gap semiconductors such as the commonly studied TiO2 are in general not photocatalytic under
visible light, which would be a requirement for efficient solar energy utilization.22
Consequently,
materials capable of photoinduced charge separation upon excitation in the visible spectral region
have garnered intense interest.
Bismuth vanadate exhibits catalytic photooxidation activity and promising
photoelectrochemical properties when irradiated at wavelengths less than 520 nm, which
corresponds to its bandgap of about 2.4 eV, and thus is suitable for applications using natural or
ambient visible light.13, 33
Monoclinic BiVO4 prepared by facile hydrothermal techniques and co-
precipitation reactions appears to be the most photoactive morphology for BiVO4 for a variety of
organic degradation reactions.4, 5, 20, 21, 24, 26, 27, 29-32
Additional requirements for improved
photocatalysts are better performance, high energy efficiency, environmental benignity (biological
and chemical inertness), low cost, long lifetime and photostability, and the ability to utilize visible
and/or near-UV light.17, 34
2.3 Photocatalysts with Metal Nanoparticle Modification
Most research on the modification of metal oxide photocatalysts with metal nanoparticles has
investigated Ag/TiO2, Ag/BiVO4, or Au/TiO2. Gold modification of BiVO4 has so far been quite
rare. In all cases, surface modification of the semiconductor with metal nanoparticles accelerated the
photooxidation reactions studied. This is mainly attributed to improvement in the charge-transfer

WPI SJTU MQP 8
process at the interface of the metal/semiconductor and surface plasmon resonance (SPR). The SPR
effect is due to the collective oscillations of the conduction-band electrons in the nanoparticles upon
resonance with the electric field of an electromagnetic wave (i.e., the incident light shone upon
them).2, 6, 9, 10
Zhu, et. al.2 determined that visible light absorption by Au nanoparticles attributed to
SPR originates from intraband excitation of 6sp orbital electrons while UV light absorption
originates from interband excitation of electrons from 5d to 6sp.
Wodka, et al.9 report that a common Ag/TiO2 composite system was able to absorb light in
the whole visible region, with the appearance of optical effects in absorbance spectra attributed to
the SPR effect. The potential for oxidation of silver is relatively similar to that of the conduction
band edge of TiO2; this allows electrons to flow in both directions and enables capture of a hole by a
silver nanoparticle. This potential for gold is much less than the conduction band edge of TiO2, so
the electrons can flow in one direction only; gold nanoparticles deposited at the TiO2 surface can
become traps for electrons, enhancing the charge separation step of the irradiation response.
According to Kohtani, et al.,20
oxidation of water by valence-band holes on Ag/BiVO4 surfaces
generates OH radicals, which greatly contributes to organic degradation.
Chandrasekharran, et al.8 determined that Au particles adsorbed on TiO2 films were larger in
diameter (50 – 70 nm) than particles in solution (5 nm) but still retained similar surface plasmon
characteristics. They found a 3-fold enhancement in photocurrent generation due to the Au
nanoparticles and explained this increased efficiency by the promotion of charge separation within
the nanostructured TiO2 network and of the interfacial charge-transfer process. A schematic
illustrating the mechanism of these improved charge transfer kinetics is shown in Figure 3. Tian et
al.10
explain that Au nanoparticles are photoexcited due to SPR, and charge separation occurs by the
transfer of photoexcited electrons from the Au particle to the TiO2 conduction band and
simultaneously by the transfer of electrons from a donor in the solution to the gold particle. The
electrons injected into the TiO2 conduction band can then be drawn through a wire and transferred to
O2 or another electron acceptor elsewhere in the photoelectrochemical cell.

WPI SJTU MQP 9
Figure 3: Charge separation in a TiO2 or BiVO4 electrode on optically transparent electrode modified with gold nanoparticles
upon irradiation and presence of a redox couple. Adapted from [6, 8].
Charge separation at a plasmon-excited metal nanoparticle is accompanied by corrosion or
degradation of the particle.10
Subramanian, et al.6 caution that photocurrent measurements and
photocatalytic degradation experiments employ different experimental conditions, related to the
length of illumination time. Photocurrents are measured using short-term illumination, while
degradation involves long-term illumination; deterioration of the metal/semiconductor interface
during long-term operation of a photoelectrode likely limits the benefits of metal nanoparticle
deposition. In composite films, the oxidation of the metal nanoparticles in the presence of oxidizing
radicals and valence-band holes disrupts the metal/semiconductor interface but also creates new
electron-hole recombination centers, such as Au+. Some of these metal ions diffuse into the
photocatalyst matrix but many recombine with photogenerated electrons, reducing the efficiency in a
net loss of electrons. Contributions by these recombination centers are negligible for short-term
irradiation, but continued irradiation could become detrimental to photocurrent generation.

WPI SJTU MQP 10
Chapter 3: Methodology
The overall procedure was as follows. The catalyst powder was mixed into a slurry of ethyl
cellulose, ethanol, and terpineol. This paste was doctor bladed onto the conductive side of FTO
glass pieces to form the electrode; these electrodes were then heated in a furnance. The calcined
electrodes were assembled into an electrochemical cell, with the catalyst side contacting the
electrolyte solution and the other side exposed to irradiation from a xenon lamp. Various
experiments could be performed with or without irradiation and/or filters while potential and current
through the electrochemical setup and time could be recorded and plotted. The electrolyte was
sodium sulfate with 4-chlorophenol and, in a few runs, hydrogen peroxide added. The 4-
chlorophenol samples were analyzed in a UV-vis spectrometer. All potentials were measured versus
the potential of the Ag/AgCl reference electrode saturated with KCl (+0.197 V vs. NHE, normal
hydrogen electrode). All water used for preparation of solutions and cleaning of glassware was
purified by a Hitech-Kflow reverse osmosis deionization (RO DI) water purification unit that
provided water with a resistivity up to 15 MΩ-cm. Gloves, safety glasses, and a lab coat were worn
throughout the duration of all experiments and handling of chemicals. Data from the
photoelectrochemical experiments was collected by the potentiostat software and then converted to a
text format. These text files were imported into OriginLab 7.5 and Microsoft Office Excel 2007 for
graphing and analysis.

WPI SJTU MQP 11
Figure 4: Schematic of the overall methodology
3.1 Synthesis of Catalyst Paste
Monoclinic BiVO4 powders were synthesized according to the description of Kohtani, et al.4,
5 Aqueous equimolar Bi(NO3)3 and NH4VO3 solutions (0.4 M) containing HNO3 (1.84 M) were
prepared separately. After 100 mL each of these two solutions were mixed, 7.5 g of urea was added.
The mixed solution was then stirred at 90°C for eight hours. The BiVO4 precipitation formed by the
hydrolysis was washed by water, filtered, and dried at 45°C.
The bismuth vanadate was modified with gold nanoparticles using a gold precursor of
chloroauric acid (HAuCl4). The preparation was performed by deposition-precipitation with urea.
Usually, BiVO4 powder (1 g) was dispersed into 0.42 M urea solution with a desirable amount of
HAuCl4 aqueous solution (4 g/100 mL water) was added to achieve the desired gold content (0.5

WPI SJTU MQP 12
wt%, 0.75 wt%, 1 wt%, 2 wt%, or 4 wt%). This suspension was sonicated for 30 minutes and then
stirred in a water bath at 90°C for four hours in a sealed flask. The resulting precipitate was
collected, washed with water, and dried. Finally, Au/BiVO4 was obtained by calcinations at 300°C
for two hours.
To prepare a paste of the appropriate powder, ethyl cellulose (0.2 g) was mixed into ethanol
(2 mL) over five minutes. The catalyst powder (1 g) was added along with terpineol (1 mL) and the
resulting mixture was mixed for another five minutes using a glass stirring rod.
3.2 Preparation of FTO Glass Electrode
Fluorine-doped tin oxide coated glass (FTO glass), a transparent and conductive substrate,
was used as the catalyst support and electrode. The conductive side was identified by a finite
reading by a multimeter on a resistance setting. Electrodes were measured into the appropriate
dimensions with a ruler and then scored once on the nonconductive side at the correct intervals with
a diamond-edge cutter. They were separated by placing the small end between two stiff, flat
surfaces and snapping off the larger end. The electrodes were handled with plastic tweezers and
placed into separate covered weighing dishes and cleaned. They were sonicated in water and soap
for ten minutes, then again in ethanol, and once more in acetone, with triple rinses with water in
between each sonication step. The electrodes were then dried under an infrared lamp.
The thin film electrode was prepared by doctor blading the catalyst paste onto the conductive
substrate of the electrode with a glass stirring rod. A thin strip at the top of the electrode was left
bare so that a copper wire could be attached to create the working electrode in the electrochemical
setup. It was necessary to calcine the electrodes in order to remove the volatile organics and
promote the adsorption of the catalyst film on the FTO glass. The electrodes were calcined in
alternating periods of temperature ramps and of constant temperature. The rate of temperature
change was 5°C/min, and the calcinations program lasted 305 min, or about 5 hours. The
temperature-time profile is shown in Figure 5. Figure 6 shows BiVO4 electrodes before and after
calcination.

WPI SJTU MQP 13
Figure 5: Temperature-time profile of the electrode calcination program
Figure 6: Left: Bismuth vanadate in a vial and doctor bladed on three FTO glass electrodes; right: the same electrodes after
calcination.
3.3 Assembly of Electrochemical Cell
The electrochemical cell was made of plastic with a removable top and a circular opening
towards the bottom of the front. The cell was covered in construction paper to limit the exposure of
light to the contents. The top had ports for the counter electrode, reference electrode, and gas
bubbler. The working electrode (FTO glass) was sandwiched between an O-ring in the groove
around the front opening and a plastic plate that could be secured and tightened by screws or
wingnuts. The electrode and openings in the cell and the plate were aligned so that the catalyst layer
in contact with the electrolyte solution would be exposed to light irradiated from a xenon lamp with
an infrared filter to avoid overheating.
0
50
100
150
200
250
300
350
400
450
500
0 50 100 150 200 250 300
Tem
pe
ratu
re (
°C)
Time (min)

WPI SJTU MQP 14
Once the electrode was secured in place, the electrochemical cell was filled with the
appropriate electrolyte solution; care was taken not to create bubbles in the channel in front of the
working electrode. The cell was covered with its top, and the reference electrode, Ag/AgCl
saturated with KCl, and the counter electrode, Pt wire, were inserted into the cell. If necessary, a
syringe needle connected to a gas line was inserted into the cell in order to sparge nitrogen into the
electrolyte solution. The cell was placed onto a stand with an adjustable height in front of a 500-W
xenon lamp at a distance of 10 ± 0.1 cm, measured from the front filter of the lamp to the center of
the working electrode. The electrodes were connected to the potentiostat by wires with alligator
clips.
Two different electrochemical cells were used. When the electrodes were being
characterized in 0.5 M Na2SO4, a larger cell with a front hole of area 0.785 cm2, was used.
However, when 4-chlorophenol degradation experiments were carried out in 0.5 M Na2SO4 and 10
mg/L 4-chlorophenol, a smaller reactor with a larger opening in the front, of area 1.77 cm2, was
found necessary. The xenon lamp was always operated at 20.0 A, and a cooling fan was directed at
the cell in order to prevent significant heating.
Upon completion of experiments with the electrochemical cell, it was disassembled and all
parts and electrodes were triple rinsed with water. It was found that a white precipitate would form
if the electrolyte solution was left in the cell.
Figure 7: Pictures of the electrochemical cell. From left to right: The large electrochemical cell with no electrodes; the same
cell fully assembled; the small cell with a bismuth vanadate electrode in place after the electrolyte was left to sit in the cell
overnight.

WPI SJTU MQP 15
3.4 Characterization
The filters used were 420 nm, 490 nm, 535 nm, 600 nm. The 535 nm and 600 nm are above
the wavelengths of light absorbed by bismuth vanadate, so any activity observed should be due to
the gold nanoparticles. When the platinum-wire counter electrode was replaced by a graphite
electrode or when the FTO glass was pre-treated with TiCl4 (to reduce background noise), there were
no significant changes in the photocurrent measurements. When a potential is applied, there is
usually a built-in delay before the current is recorded in order to allow the system to equilibrate.
3.4.1 Linear Sweep Voltammetry
In linear sweep voltammetry (LSV), an initial potential is applied and then increased linearly
at a constant rate until a final potential is reached. The current is recorded, and current versus
potential graphs are generated. All linear sweep voltammograms were generated in 0.5 M Na2SO4
by sweeping from -0.5 V to 1.2 V (vs. Ag/AgCl) with a scan rate of 0.05 V/s after an initial two
second delay and with data recorded every 0.001 V at a sensitivity of 0.001 A/V. For a given sample
and filter, an LSV was produced with no illumination (“dark” LSV) and then with irradiation. The
dark LSV indicates the level of background current present in that experimental setup; the
illuminated LSV should be compared to the dark LSV to determine the level of photocurrent induced
by the illumination. For one sample, BiVO4, a cyclic voltammetry (CV) was performed; it scanned
between -0.5 V and 0.5 V (vs. Ag/AgCl) with the other settings identical to those for the LSVs. The
CV swept forward and backward for 10 cycles.
3.4.2 Chronoamperometry
In chronoamperometry (CA), a constant potential is applied and the transient photocurrent is
measured over time. This was performed in 0.5 M Na2SO4 under chopped irradiation of unfiltered
visible light from the xenon lamp in order to elucidate information on the rates of the electron-hole
transfer processes. By removing an aluminum shield in front of the lamp, the cell was irradiated for
5 seconds. After irradiation, the lamp was again shielded. The potentials that were probed were 0.2
V, 0.5 V, -0.2 V, and -0.4 V (in that order), with a sensitivity of 0.001 A/V and sample interval of
0.001 s after an initial delay of five seconds.

WPI SJTU MQP 16
3.4.3 Degradation of 4-Chlorophenol
Degradation of 4-chlorophenol was carried out in a solution of sodium sulfate and 4-
chlorophenol. Solutions were prepared from a stock solution of 1 g/L 4-CP and 1 M Na2SO4. In the
case where 5 mM or 10 mM H2O2 was also present in the solution, a 0.1 M H2O2 stock solution was
used. The small electrochemical cell was thus filled with 40 mL of 0.5 M Na2SO4, 20 mg/L 4-CP,
and 0, 5, or 10 mM H2O2. A constant potential of 1.0 V (vs. Ag/AgCl) was applied through a one-
hour long chronoamperometry program under constant irradiation. For one sample of BiVO4,
another program was tested: applied -0.2 V for 300 s and then 1.0 V for 900 s and repeated this
cycle 3 times per hour. At the hour, the lamp was shielded, and an approximately 1.5 mL sample
was drawn off from the solution using a syringe that was thoroughly washed between uses. These
samples were stored in labeled vials in a dark refrigerator to be tested later. Then this process was
repeated for a total of four hours of degradation. The experimental setup is displayed in Figure 8.
Figure 8: The experimental setup for 4-chlorophenol degradation.
Immediately following the completion of the experiment, the absorbance of each sample was
taken in a quartz cuvette against a blank of 3 mL of 0.5 M Na2SO4. The absorbances over the
wavelength range of 200 nm to 700 nm were determined, with the region 210 nm to 310 nm being
the most important to features exhibited by 4-chlorophenol. The strongest peaks can be seen at 230
nm and 280 nm.

WPI SJTU MQP 17
3.4.4 SEM
Surface morphology was imaged by scanning electron microscopy. Due to limited time,
SEM images were taken only for one of each of the following: 0 wt%, 0.5 wt%, 1 wt%, and 2 wt%
Au/BiVO4. These were recorded at various magnifications 200-200000x, as shown in Table 2, with
an accelerating voltage of 5.00 kV on a FEI Sirion 200 Field Emission SEM.
Table 2: Magnifications of SEM images for 0, 0.5, 1, and 2 wt% Au/BiVO4.
Sample BiVO4 0.5 wt% Au/BiVO4 1 wt% Au/BiVO4 2 wt% Au/BiVO4
Available
Magnifications
200 200 500 200
500 1000 1000 1000
10000 10000 2500 50000
40000 100000 5000 100000
50011 9000 200000
10000
20000
40000
WPI SJTU MQP 18
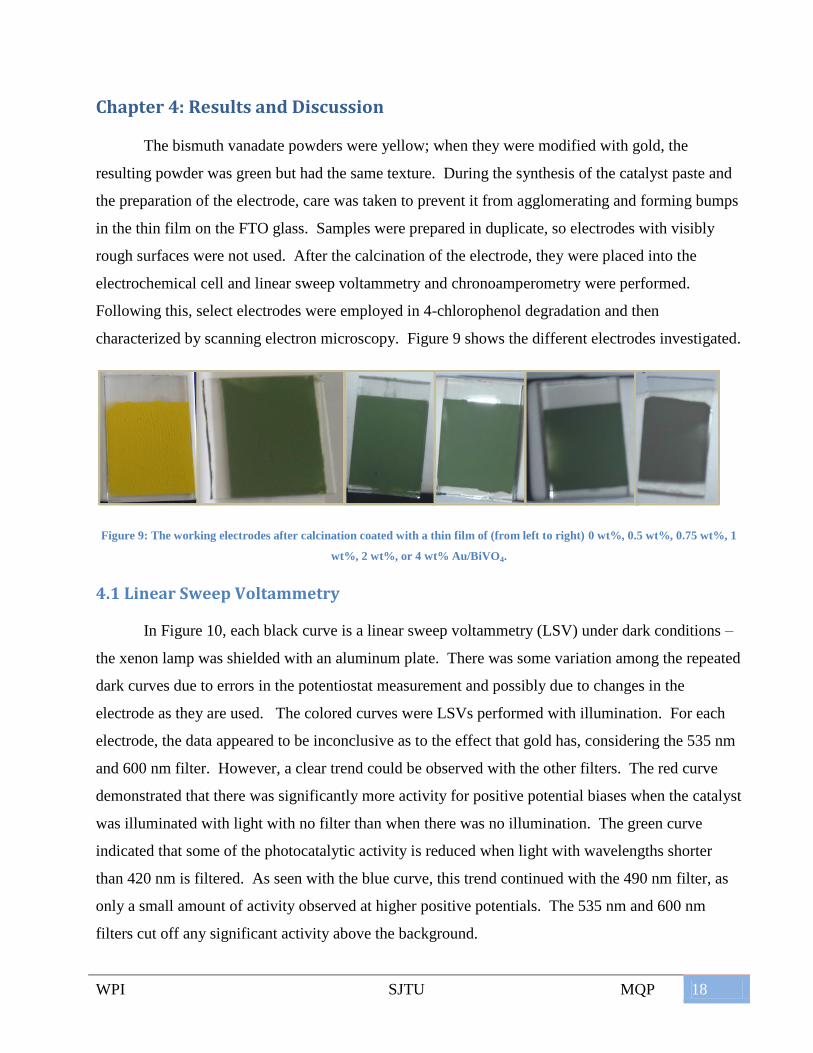
Chapter 4: Results and Discussion
The bismuth vanadate powders were yellow; when they were modified with gold, the
resulting powder was green but had the same texture. During the synthesis of the catalyst paste and
the preparation of the electrode, care was taken to prevent it from agglomerating and forming bumps
in the thin film on the FTO glass. Samples were prepared in duplicate, so electrodes with visibly
rough surfaces were not used. After the calcination of the electrode, they were placed into the
electrochemical cell and linear sweep voltammetry and chronoamperometry were performed.
Following this, select electrodes were employed in 4-chlorophenol degradation and then
characterized by scanning electron microscopy. Figure 9 shows the different electrodes investigated.
Figure 9: The working electrodes after calcination coated with a thin film of (from left to right) 0 wt%, 0.5 wt%, 0.75 wt%, 1
wt%, 2 wt%, or 4 wt% Au/BiVO4.
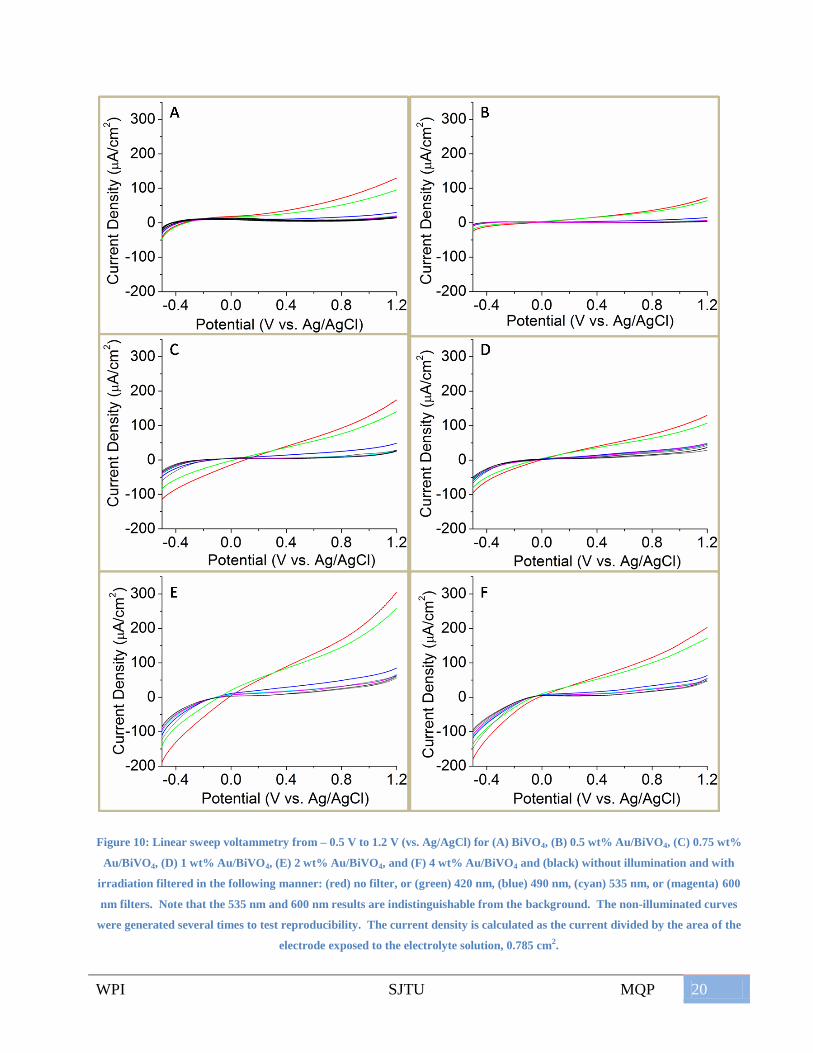
4.1 Linear Sweep Voltammetry
In Figure 10, each black curve is a linear sweep voltammetry (LSV) under dark conditions –
the xenon lamp was shielded with an aluminum plate. There was some variation among the repeated
dark curves due to errors in the potentiostat measurement and possibly due to changes in the
electrode as they are used. The colored curves were LSVs performed with illumination. For each
electrode, the data appeared to be inconclusive as to the effect that gold has, considering the 535 nm
and 600 nm filter. However, a clear trend could be observed with the other filters. The red curve
demonstrated that there was significantly more activity for positive potential biases when the catalyst
was illuminated with light with no filter than when there was no illumination. The green curve
indicated that some of the photocatalytic activity is reduced when light with wavelengths shorter
than 420 nm is filtered. As seen with the blue curve, this trend continued with the 490 nm filter, as
only a small amount of activity observed at higher positive potentials. The 535 nm and 600 nm
filters cut off any significant activity above the background.

WPI SJTU MQP 19
In the case of (Figure 10A), this was to be expected as the bandgap of BiVO4 corresponds to
a wavelength of about 520 nm. Filtering light below this wavelength would inhibit the generation of
electron-hole pairs necessary for BiVO4 to be photoactive and conduct current. The other charts in
Figure 10 show the results of linear sweep voltammetry with the gold-modified BiVO4 electrodes. A
major difference between these LSVs and those with BiVO4 was that a cathodic current was more
readily achieved. With no filter and with a 420 nm filter and below ~0 V vs. Ag/AgCl, the current
was less than the dark currents. However the trend of the magnitude of the photocurrents at a given
potential at the extreme potentials was still the same: no filter > 420 nm filter > 490 nm filter > 535
nm filter > 600 nm filter. The 535 nm and 600 nm curves were always very similar to the dark
curves, calling into question whether the ability of gold to provide activity above these wavelengths
can be determined by these methods. The magnitudes of the current densities achieved should only
be qualitatively compared because the densities were determined from geometric area, not the true
catalytic surface area, which was not determined due to limited time.
WPI SJTU MQP 20
Figure 10: Linear sweep voltammetry from – 0.5 V to 1.2 V (vs. Ag/AgCl) for (A) BiVO4, (B) 0.5 wt% Au/BiVO4, (C) 0.75 wt%
Au/BiVO4, (D) 1 wt% Au/BiVO4, (E) 2 wt% Au/BiVO4, and (F) 4 wt% Au/BiVO4 and (black) without illumination and with
irradiation filtered in the following manner: (red) no filter, or (green) 420 nm, (blue) 490 nm, (cyan) 535 nm, or (magenta) 600
nm filters. Note that the 535 nm and 600 nm results are indistinguishable from the background. The non-illuminated curves
were generated several times to test reproducibility. The current density is calculated as the current divided by the area of the
electrode exposed to the electrolyte solution, 0.785 cm2.

WPI SJTU MQP 21
Out of interest to test the stability of the BiVO4, a cycle voltammogram (CV) from -0.5 V to
0.5 V vs. Ag/AgCl was obtained before the chronoamperometric photocurrent measurements, shown
in Figure 11. The red curve demonstrates that the photocurrent is relatively stable under dark
conditions. However, the blue curve indicates that the photocurrent changes with time under
illuminated conditions; this is because the illumination is effectively inducing the separation of
charges and holes, and electrons are being depleted. The CVs in both cases demonstrate hysteresis
as the forward scan is not the same as the backward scan.
Figure 11: CVs performed with BiVO4 electrode before photocurrent measurements. The red curve (and black curve that it
overlaps) were obtained in dark conditions. The blue curve (and green curve that it overlaps) were obtained in illuminated
conditions.
4.2 Chronoamperometry
Figure 12 plots the results of chopped irradiation chronoamperometric photocurrent
measurements, whereby a given potential was applied, the lamp was unshielded and then shielded,
and the current measured as it varies with time. The start of the region of interest is when the
catalyst is illuminated and the end of it is when the lamp is shielded. The response can be indicative
of the mechanism of electron-hole pair generation. Differences between these responses among the
different catalysts being studied would indicate a change in preferred routes. The magnitude of the
current density in this region is indicative of the amount of catalytic activity. Because the data was
generated over periods of time that were not exactly identical and the general shape of the curve is
independent of absolute time, the time scale is not explicitly shown; the timescale for each run was

WPI SJTU MQP 22
adjusted so that the time when the lamp was unshielded (a spike in current is observed) were
approximately uniform. The chronoamperometric photocurrent measurements obtained when a filter
was occasionally applied followed the same trend as for the LSVs when a filter was applied; that is,
the same generic shape was retained but the magnitude of the response was diminished.
For 0, 1, and 4 wt% Au/BiVO4, the curves at each potential were very similar in magnitude
and in shape. Potentials of 0.5 V and 0.2 V resulted in anodic (positive) currents, with that at 0.5 V
higher than at 0.2 V. At -0.2 V and -0.4 V, the current was cathodic (negative), with that at -0.2 V
only marginally more positive than that at -0.4 V. The 2 wt% Au/BiVO4 exhibits much greater
magnitudes of photocurrent densities, especially at 0.5 V and -0.4 V. This demonstrates that a 2
wt% loading of gold onto bismuth vanadate greatly enhances its photoactivity and may be the most
interesting catalyst to employ in the working electrode for the 4-chlorophenol degradation
experiments.
As seen in Figure 12B and Figure 12C, the features for the curves representing 0.5 wt% and
0.75 wt% Au/BiVO4 were similar to those for BiVO4 at 0.5 V, -0.2 V, and -0.4 V. However, the
response at 0.2 V was cathodic (the current density is negative) instead of anodic (positive). This
indicates that a cathodic current was produced more readily or easily on the gold-modified BiVO4
than with the unmodified form. The gold nanoparticles scavenged the electrons generated during
electron-hole pair separation on the photocatalyst and facilitated the conduction of the electrons to
the electrolyte. Since the solution was bubbled with nitrogen, the reduced species was likely water.
This conclusion did not always hold for the other electrodes. The chronoamperometric photocurrent
at 0.2 V was cathodic when it was anodic for the other gold-modified samples; this was attributed to
an effect by gold. However, this may have been due to oxygen diffusing into the solution. For the 1
wt% Au/BiVO4 sample, a similarly cathodic current was observed at first, but the run was repeated.
When the nitrogen purge was increased in flow and the CA was repeated, the current became anodic.
The current at 0.2 V was generally small in magnitude, so it would have been sensitive to
fluctuations in the concentration of oxygen; trace amounts of oxygen would have driven the current
to become more negative (more cathodic). Lack of oxygen, trace gases, and other contaminants may
have contributed to the different results. As experiments were performed, the lab technique of the
investigator improved and so later data is probably more consistent with the methodology laid out in
Chapter 3. Unfortunately, the measurements for 0.5 wt% and 0.75 wt% could not be repeated due to
time constraints.

WPI SJTU MQP 23
Figure 12: Chronoamperometric photocurrent measurements at constant potentials of (red) 0.5 V, (black) 0.2 V, (green) -0.2
V, and (blue) -0.4 V (vs. Ag/AgCl) for (A) BiVO4, (B) 0.5 wt% Au/BiVO4, (C) 0.75 wt% Au/BiVO4, (D) 1 wt% Au/BiVO4, (E) 2
wt% Au/BiVO4, and (F) 4 wt% Au/BiVO4 with illumination and no filters. The current density is calculated as the current
divided by the area of the electrode exposed to the electrolyte solution, 0.785 cm2.
Figure 13 compares the photocurrent measurements of BiVO4 and 2 wt% Au/BiVO4 at 0.5 V
with different filters. In each chart, the black curve was obtained with no filter, the red curve was
with the 420 nm filter, the green curve with the 490 nm filter, the blue curve with the 535 nm filter,
and the cyan curve with the 600 nm filter. It can be seen that for each potential, the photocurrent for
BiVO4 is much smaller than that for 2 wt% Au/BiVO4. The currents for the 535 nm and 600 nm

WPI SJTU MQP 24
filters appear identical to each other for both electrodes. A small amount of activity is observable for
BiVO4, but the activity for 2 wt% Au/BiVO4 is much more significant. No photocurrent density
would be expected for the 535 nm or 600 nm filters with BiVO4 because it is not supposed to absorb
above 520 nm. However, there was a small yet noticeable photocurrent with these filters. This may
be due to a background capacitance in the solution created because the electrodes in the three-
electrode setup were not immediately adjacent to each other in the cell. For 2 wt% Au/BiVO4, there
was an increased photocurrent density measured with the 535 nm or 600 nm filters applied. One
could attribute this to the presence of the gold in the sample. However, this may be caused by the
capacitance within the solution being different due to a slightly different experimental setup.
Therefore, the effect of gold at wavelengths above 520 nm cannot be conclusively determined.
Figure 13: Chronoamperometric photocurrent measurements for (left) BiVO4 and (right) 2 wt% Au/BiVO4 at 0.5 V with
different filters: (black) no filter, (red) 420 nm, (green) 490 nm, (blue) 535 nm, and (cyan) 600 nm.
4.3 Degradation of 4-Chlorophenol
From the photocurrent measurements, it was decided that 2 wt% Au/BiVO4 showed the most
activity; photodegradation experiments were also done with BiVO4. The two different degradation
programs used with BiVO4 were: 1.0 V constant applied potential; apply -0.2 V for 300 s and then
1.0 V for 900 s and repeat this cycle 3 times per hour. The logic behind the second program is that
applying a cathodic potential of -0.2 V should restore the electrons in the photocatalyst and should
decompose any peroxide generated on the surface of the electrode at the high anodic bias of 1.0 V.
However, the absorbance readings did not improve appreciably, so the first program was utilized in
subsequent runs. With the constant applied 1.0 V, there was a minor change in absorbance, but with
the alternating pulses, there was no change in absorbance. It was expected that the absorbances were

WPI SJTU MQP 25
proportional to the concentration of 4-chlorophenol at the main peaks exhibited by it, at 230 nm and
at 280 nm. Most runs using only Na2SO4 and 4-chlorophenol in the electrolyte solution were
inconclusive, with no major changes in absorbance and no observable trend in the hourly readings.
Sometimes samples in a run taken at later times had higher absorbances than the earlier samples,
which is indicative of error if a degradation reaction is occurring. Figure 14 is representative of this;
it shows the absorbance measurements made for a run with 2 wt% Au/BiVO4. The samples taken at
hour 3 and hour 4 displayed higher absorbances than the others. The remaining curves do not
indicate significant degradation, signifying that 2 wt% Au/BiVO4 demonstrated low activity with
only Na2SO4 and 4-chlorophenol.
Figure 14: Absorbance of samples from 4-chlorophenol degradation with 2 wt% Au/BiVO4, taken once every hour. The
curves were created by subtracting the blank reading from the absolute readings of the samples.
More success occurred with the addition of H2O2, an electron scavenger, whereby observable
changes in absorbance occurred. It was thought that the addition of H2O2 would promote the
formation of hydroxyl radicals in the solution. As shown in Figure 15, there was a clear decrease in
the absorbance readings for each hour, except that the absorbances for hour 2 and hour 3 overlapped.
This may be because the vials containing these samples were accidentally mixed in the cuvette.
Figure 16 also indicates that the addition of hydrogen peroxide improved the degradation efficiency.
Both figures indicate that the peak at 230 nm is the one that changes the most throughout the
degradation experiment; readings should be based around this peak as opposed to the one at 280 nm.
The former was generated when 5 mM H2O2 was used, while the latter was produced with 10 mM

WPI SJTU MQP 26
H2O2. The initial absorbance readings for each are not the same, indicating that the experimental
setup must have been slightly different or that the readings were taken under different conditions
(perhaps more time had elapsed between storage of the initial samples and measuring the
absorbances in the second case). However, the addition of 5 mM H2O2 led to a degradation
efficiency of 51% after the first hour and 92% after the fourth hour, based on the ratio of the change
in the absorbance at 230 nm to the initial reading. The addition of 10 mM H2O2 resulted in a
degradation efficiency of 23% after the first hour and 70.% after the second hour, which may mean
that 10 mM H2O2 led to less effective degradation or that the samples were degraded by H2O2 while
in storage.
These experiments should be repeated to ensure that the results are reproducible. The current
results indicate that additives such as H2O2 should be used to study the best gold-modified bismuth
vanadate photocatalysts. Unfortunately, time did not permit reproduction or further optimization of
the experiments.
Figure 15: Absorbance of samples from 4-chlorophenol degradation with 2 wt% Au/BiVO4 and 5 mM H2O2 added, taken once
every hour. The curves were created by subtracting the blank reading from the absolute readings of the samples.

WPI SJTU MQP 27
Figure 16: Absorbance of samples from 4-chlorophenol degradation with 2 wt% Au/BiVO4 and 10 mM H2O2 added, taken
once every hour. The curves were created by subtracting the blank reading from the absolute readings of the samples.
4.4 SEM Images
Due to limited time, scanning electron microscopy images were obtained only for the 0, 0.5,
1 and 2 wt% Au/BiVO4 samples. The most interesting and representative images are shown in
Figure 17 while the rest are in the Appendix. It can be clearly seen that BiVO4 displays a
monoclinic structure, indicating that the synthesis procedure was successful. This same structure is
prominent in the gold-modified samples as well. The gold nanoparticles do not necessarily appear
uniform in size but appear to be relatively “smooth” in appearance, with no spikes or right angles in
their shapes. They exhibit increased dispersion at higher concentrations of gold. In the 2 wt%
sample, the larger particles are on the order of 40 – 100 nm in the longest dimension. However,
some small specks of particles appear to be present. It may be possible that some small clusters of
gold atoms nucleated and then grew and agglomerated into the larger clusters.

WPI SJTU MQP 28
Figure 17: SEM images of (Top) BiVO4 at 104X magnification; (Bottom left) 1 wt% BiVO4 at 104X magnification; (Bottom
right) 2 wt% Au/BiVO4 at 105X magnification
4.5 Errors and Lab Practices
Throughout the project experience, numerous sources of error were noted and are discussed
in this section. These errors derive from limitations in the technology available as well as the
practices employed by others in the lab.
The only available container of 4-chlorophenol was dark brown to prevent photodegradation
from ambient light; however, it was broken early on in the experiment but most of the solid 4-CP
was recovered and dissolved in water in a 250 mL Erlenmeyer flask. Although it was stored in a
dark refrigerator, there is a possibility that this stock solution was exposed to ambient light when
being used to prepare 4-CP solutions. After washing the FTO glass pieces, it was possible that they
were not completely dry, dust from the air deposited on them, or that they were scratched from
handling with tweezers. In the assembly of the electrochemical cell, the working electrode with the

WPI SJTU MQP 29
catalyst thin film needed to be carefully placed on top of the O ring used to create a seal between it
and the cell. If the electrode did slip slightly, the catalyst film could have been partially scratched
off or some of the catalyst placed into the reactor cell, reducing the effective geometric area of the
electrode and possibly contaminating the electrolyte solution.
Due to noise in the initial collection of data for the photocurrent experiments (without 4-
chlorophenol), it was decided that the electrolyte solutions should be N2-purged. It was necessary to
redesign the reactor cell used in the degradation experiments and to change the size of the electrodes
in order to create a better seal and to completely cover the O-ring. The room in which the
electrochemical cell was used was relatively dark without the room lights on. To be consistent in the
exposure to external light, the lights were left on in the lab. The light through the windows, which
changes during the cycle of the day, was not a major source. However, the room’s lights were
connected to those of an adjacent lab, so others would occasionally turn off the lights when they did
not realize the room was in use. The reactor cells were covered in dark paper in attempt to limit the
amount light admitted by sources other than the xenon lamp. However, it was impractical to cover
the removable top piece of the cell as well as the front plate of the cell and the area that it covered.
Working electrodes with visible bumps on the surface due to uneven dispersion of the paste
and/or ethyl cellulose were discarded and re-made until a smooth surface was created. This does not
mean that all electrodes used were relatively smooth at the microscopic level. With a smoother
surface, the geometric area would more closely approximate the true catalytic surface area. The
furnaces used for calcination were filled with the ambient air, so it cannot be known for certain
whether undesired reactions occurred on the working electrodes at the high temperatures in the
furnace or whether impurities may have been introduced.
When the degradation experiments were carried out, the absorbance data may have had
serious errors in it. Although the samples were stored in a dark refrigerator and covered when
transported, they may still have been exposed to light, leading to degradation not caused by the
photoelectrochemical degradation. The sample port in the cell was not located immediately next to
the working electrode, and the stirrer bar in the main part of the cell may not have induced mixing in
the channel leading to the working electrode. This may mean that the samples taken were not truly
representative of the bulk surrounding the photocatalyst. It would be recommended to thin the front
side of the reactor cell, which would reduce the size of the channel between the working electrode
WPI SJTU MQP 30
and the main compartment of the cell. This would also reduce the likelihood that bubbles would
form and be trapped in the channel when filling the cell with solution. It is doubtful that the cuvettes
used for the absorbance measurements were clean despite thorough washing from the investigator;
occasionally the background curves generated with the blanks would show absorbance peaks!
In general, lab practices of colleagues were seen as poor. Oftentimes, powder residue was
observed on the glassware shared with me. There was no central HVAC system in the lab building,
so vapors were diluted by opening the windows in the lab or removed inefficiently by turning on a
single fume hood with the sash opened above the recommended level. The floors and counters were
filthy with unknown residues, and many metal cabinets (including ones for storage of chemicals)
were rusted. To wash glassware, tap water, known to be biologically and chemically impure, was
oftentimes used to wash the glassware, which was usually washed once before being dried in an
oven where wet powder samples were dried. Many times, colored solutions were left uncovered,
and labeling of containers was infrequent. In addition, there was very little urgency in the proper
disposal of waste and its treatment. Powder samples and broken glassware were thrown in the
regular trash, even if they contained heavy metals. There was only one waste container used for
disposal of liquids and liquid-phase solutions in the labs utilized by the group. It was blue in color,
with foam at the top, and reeked of the smell of heavy metals. It seemed to be leaking somewhat
because when it was picked up, the cabinet floor was blue in color, with plastic from the container
adhered to the floor. There seemed to be no apparent separation of wastes between acids, bases,
heavy metals, and organics. Given these generally poor practices, it is unknown what effect they
may have had on the experimental results presented in this report. It is recommended that future
projects evaluate these issues and establish lab hygiene and safety protocols, with a member of the
group or at least the building dedicated to ensuring it is followed.
4.6 Recommendations for Future Work
This work has been useful for a preliminary exploration of gold-modified bismuth vanadate
as a photocatalyst for 4-chlorophenol degradation. However, numerous items can be improved and
ideas covered in this work can be extended. experimental design
Some papers suggest that the chronoamperometric photocurrent will decay over very long
periods of irradiation. Runs should be performed where the light is not chopped and where the
chopped irradiation is carried over long periods of time, on order of thousands of seconds.13, 23

WPI SJTU MQP 31
The catalytic surface area should be determined.9 It would be useful to know the actual
surface area of the catalyst so that all currents can be normalized with respect to area and compared
quantitatively with other samples, as opposed to only being qualitatively comparable. The geometric
area, as determined by the size of the O-ring in the electrochemical cell, is not necessarily an
accurate indicator of the actual area of catalyst exposed by the semiconductor thin film. Ideally,
BET or another adsorption isotherm would be done after the catalyst film is calcined on the
substrate, but it could also be done on the catalyst powder prior to the paste being prepared to get the
surface area per mass of the catalyst. Assuming the same mass of catalyst was used in all cases and
the preparation method was consistent, comparisons between different electrode samples would be
achievable.
The investigator feels that the overall experimental design was relatively poor and would
recommend that the order of experiments be changed. Due to the short amount of time, the advice of
the lab advisor was followed even when it may have been better to do otherwise. It would be
suggested that future experiments first perform degradation experiments and systematically tune the
parameters, including the weight percentage of gold. Then the LSV and CA data and SEM images
should be collected in order to characterize the electrodes. Due to limited time, it was unsatisfying
to be unable to compare the photodegradation efficiencies between the different electrodes, as is
done in the literature.
The 2 wt% Au/BiVO4 sample exhibited the best photoactivity and was predicted to have the
most promising photodegradation efficiency, but due to a lack of time, the degradation conditions
were not optimized. Future experiments should monitor the degradation concentrations over time
and determine the degradation efficiency for a certain amount of time. The best results from the
degradations performed in this project indicate that the first one or two hours was when the most
degradation occurred. Photodegradation should be carried out with applied potential but no
illumination and with illumination but no applied potential as control experiments. It would be
useful to know which of the electrochemical, photochemical, or photoelectrochemical aspects have
the most significant influences on the degradation efficiency. The channel in the front of the
electrochemical cell should be thinned so that there is less distance between the working electrode
and the main compartment of the cell. Adequate mixing may not have occurred, so the solution in
the channel may have become stagnant. Due to the location of the sampling port, the sampling may
not have been representative of the processes taking place at the catalyst surface. In addition, the

WPI SJTU MQP 32
working electrode was located in the solution some distance apart from the other two electrodes.
Although the reference electrode and counter electrode were relatively adjacent to each other in the
solution, the working electrode was at a distance of at least the thickness of the front wall of the
electrochemical cell (about 1-2 cm). This separation within the solution can lead to an undesirable
solution resistance and a background current. Reducing this distance would then reduce the
background capacitance that was observed in the chronoamperometric photocurrents.
There are many parameters that can be manipulated to optimize the degradation conditions,
including the addition of electron scavengers, changing the pH, bubbling in O2, and changing the
power and spectra of illumination. As shown in this work, the addition of H2O2 greatly enhanced the
photodegradation, as observed by the change in absorbance of the degradation samples. This work
suggests that too much hydrogen peroxide may diminish the efficiency, so the initial concentration
of it should be tuned. The surface plasmon resonance effect enables gold to absorb light in the UV
range. To test this, the samples should be exposed to UV light separately from visible light; then the
samples can be tested with both visible- and UV-light exposure. In addition, the power of the lamp
and the current at which it is operating influences the intensity of light shone on the photocatalyst,
which in turn affects the electron-hole generation and separation processes. This would then change
rate of reaction. Most of the characterization experiments were carried out in an N2-purged Na2SO4
electrolyte. Others have reported that the activity would be higher in an O2 environment or with
alternative electrolytes, such as NaOH. Oxygen should be bubbled into the solution because the
degradation requires oxygen as an electron acceptor; the oxygen in the electrolyte would eventually
be depleted because diffusion of air into the solution would be too slow.1, 11, 12 When bubbling gases
into the solution, placing the experimental setup in a ventilation hood may prevent undesired trace
gases from diffusing into the electrolyte. It has been reported that alkaline electrolytes lead to higher
stability of and higher photocurrents for BiVO4 film electrodes. This effect was attributed to lower
accumulation of peroxide species in the solution when a photooxidation reaction was carried out.13.
In order to explore possible mechanisms and the kinetically significant steps relevant to conditions
under which environmental remediation would be performed, the products of the degradation would
need to be analyzed more completely. As the parameters are modified, the mechanism may change
or become more complicated. If the applied potential is too high, water photooxidation would
become involved when one may want the activity to only stem from organic mineralization.

WPI SJTU MQP 33
Work in the Flytzani-Stephanopolous group on gold modification of various metal oxide
supports has revealed that the actual weight percentage of gold present in the sample is not a
significant factor.35, 36 The nanoparticle clusters do not contribute significantly to the activity in the
studied reactions. By leaching the clusters off and leaving only the most strongly adsorbed Au
species (Au-O-Metal) in place on the surface, it was discovered that sites with only a single or few
gold atoms were responsible for the activity of the gold catalysts supported on metal oxides. Thus,
the shape of the catalyst is critical. More work should be carried out to study the structure effects.
Although these metal-oxide supported gold catalysts were studied in steam reforming and water-gas
shift reactions, it is possible that other oxidation reactions would experience such structure
sensitivity.
Thus, the photocurrent activity displayed by the Au/BiVO4 photocatalysts when different
filters are applied may be explained by the fact that only gold should be responsible for the activity
above the 535 nm filter wavelength (BiVO4 no longer contributes). This activity remains the same
for the different filters because only the gold is contributing. This photocurrent activity is similar for
different weight percentages of gold because what truly matters is the formation of the few-atom
clusters, not the major agglomerations of nanoparticles. This idea would suggest that the calcination
process should be optimized to avoid sintering – migration of particles and agglomeration upon
contact with each other due to the energy provided by the thermal excitation. The thermal treatment
is important because it removes the volatile fraction and burns off the organics in the slurry paste.

WPI SJTU MQP 34
Chapter 5: Conclusions
In this research, bismuth vanadate was identified as an n-type semiconductor photocatalyst
that has the enticing property of being visible-light driven; it would be an alternative to the more
popular ultraviolet-active titanium dioxide. Recent research indicates that transition metal
modification of a photocatalyst enhances its activity, and gold is well known to catalyze many
reactions. By modifying BiVO4 with gold nanoparticles, the photocurrent generated under visible-
light irradiation was much higher than that of BiVO4 itself when the gold concentration was 1 wt%
or more. The most promising gold-modified bismuth vanadate sample studied was identified as 2
wt% Au/BiVO4, balancing low loading with reasonable activity. It exhibited the largest
photocurrents in illuminated linear sweep voltammetry as well as chopped irradiation
chronoamperometry. The gold promotes the separation of the electron-hole pairs once they are
generated and the transfer of the holes to the electrolyte before the charges can recombine. SEM
images revealed that gold-modified bismuth vanadate retains the same support structures as BiVO4,
indicating that the dispersion of gold on the surface does not appear to promote rearrangement at the
surface. The addition of 5 mM and 10 mM H2O2 to the Na2SO4 electrolyte greatly enhanced the
decrease in the absorbance curves of 4-chlorophenol, specifically at 230 nm. This was attributed to
the role of hydrogen peroxide as an electron scavenger; because surface peroxides can be detrimental
to photocatalytic performance, the lower concentration of H2O2 led to higher photodegradation
efficiency. Modification of the electrolyte may be necessary to improve the degradation efficiency.
The 2 wt% Au/BiVO4 sample appeared to have the most promising photodegradation
efficiency, but due to a lack of time, the degradation conditions were not optimized. In future
investigations, the degradation parameters should be optimized to demonstrate the best performance.
The effects of electron scavengers, pH, O2, and power of illumination should be explored. Once
these are appropriately tuned, the gold loading on the bismuth vanadate should be surveyed as a
variable once again. The activity may be enhanced, enabling better distinction among the current
curves for the 535 and 600 nm filters. In addition, the absorbance curves would be more widely
spaced so that the concentrations over time would follow a consistent trend. Other techniques may
be more appropriate for analyzing the products, and in more completely investigating the solution
after degradation, a complete mechanism could be explored. If one wishes to use this thin film
semiconductor photocatalyst in the commercial treatment of wastewater, one must keep in mind the
parameters that could be realistically achieved in the actual process.

WPI SJTU MQP 35
References
(1) Hoffmann, M. R.; Martin, S. T.; Choi, W.; Bahnemann, D. W. Environmental applications of
semiconductor photocatalysis. Chem. Rev. 1995, 95, 69-96.
(2) Zhu, H.; Chen, X.; Zheng, Z.; Ke, X.; Jaatinen, E.; Zhao, J.; Guo, C.; Xie, T.; Wang, D.
Mechanism of supported gold nanoparticles as photocatalysts under ultraviolet and visible light
irradiation. Chemical Communications 2009, 2009, 7524-7526.
(3) Bard, A. J. Photoelectrochemistry. Science 1980, 207, 139-144.
(4) Kohtani, S.; Koshiko, M.; Kudo, A.; Tokumura, K.; Ishigaki, Y.; Toriba, A.; Hayakawa, K.;
Nakagaki, R. Photodegradation of 4-alkylphenols using BiVO4 photocatalyst under irradiation
with visible light from a solar simulator. Applied Catalysis B: Environmental 2003, 46, 573-
586.
(5) Kohtani, S.; Makino, S.; Kudo, A.; Tokumura, K.; Ishigaki, Y.; Matsunaga, T.; Nikaido, O.;
Hayakawa, K.; Nakagaki, R. Photocatalytic Degradation of 4-n-Nonylphenol under Irradiation
from Solar Simulator: Comparison between BiVO4 and TiO2 Photocatalysts. Chem. Lett. 2002,
31, 660-661.
(6) Subramanian, V.; Wolf, E.; Kamat, P. V. Semiconductor− Metal Composite Nanostructures. To
What Extent Do Metal Nanoparticles Improve the Photocatalytic Activity of TiO2 Films? J
Phys Chem B 2001, 105, 11439-11446.
(7) Long, M.; Cai, W.; Wang, Z.; Liu, G. Correlation of electronic structures and crystal structures
with photocatalytic properties of undoped, N-doped and I-doped TiO2. Chemical Physics
Letters 2006, 420, 71-76.
(8) Chandrasekharan, N.; Kamat, P. V. Improving the Photoelectrochemical Performance of
Nanostructured TiO2 Films by Adsorption of Gold Nanoparticles. J Phys Chem B 2000, 104,
10851-10857.
( ) Wodka, .; iela ska, E.; Socha, . P.; El bieciak-Wodka, M.; Gurgul, J.; Nowak, P.;
Warszy ski, P.; Kumakiri, . Photocatalytic ctivity of Titanium ioxide Modified by Silver
Nanoparticles. ACS Applied Materials & Interfaces 2010, 33-177.
(10) Tian, Y.; Tatsuma, T. Mechanisms and applications of plasmon-induced charge separation at
TiO2 films loaded with gold nanoparticles. J. Am. Chem. Soc. 2005, 127, 7632-7637.
(11) Vinodgopal, K.; Hotchandani, S.; Kamat, P. V. Electrochemically assisted photocatalysis:
titania particulate film electrodes for photocatalytic degradation of 4-chlorophenol. J. Phys.
Chem. 1993, 97, 9040-9044.

WPI SJTU MQP 36
(12) Vinodgopal, K.; Stafford, U.; Gray, K. A.; Kamat, P. V. Electrochemically assisted
photocatalysis. 2. The role of oxygen and reaction intermediates in the degradation of 4-
chlorophenol on immobilized TiO2 particulate films. J. Phys. Chem. 1994, 98, 6797-6803.
(13) Long, M.; Cai, W. Photoelectrochemical Properties of BiVO4 Film Electrode in Alkaline
Solution. Chinese Journal of Catalysis 2008, 29, 881-883.
(14) Murray, H. E.; Wong, D. Toxicological Profile for Chlorophenols. 1999.
(15) Fiege, H.; Voges, H. -.; Hamamoto, T.; Umemura, S.; Iwata, T.; Miki, H.; Fujita, Y.; Buysch,
H. -.; Garbe, D.; Paulus, W. In Phenol Derivatives; Ullmann's Encyclopedia of Industrial
Chemistry; Weinheim: Wiley-VCH: 2010; .
(16) Hofstadler, K.; Bauer, R.; Novalic, S.; Heisler, G. New Reactor Design for Photocatalytic
Wastewater Treatment with TiO2 Immobilized on Fused-Silica Glass Fibers:
Photomineralization of 4-Chlorophenol. Environ. Sci. Technol. 1994, 28, 670-674.
(17) Mills, A.; Hunte, S. L. An overview of semiconductor photocatalysis. Journal of
Photochemistry and Photobiology-Chemistry Section 1997, 108, 1-36.
(18) Theurich, J.; Lindner, M.; Bahnemann, D. W. Photocatalytic Degradation of 4-Chlorophenol in
Aerated Aqueous Titanium Dioxide Suspensions: A Kinetic and Mechanistic Study. Langmuir
1996, 12, 6368-6376.
(19) Fujishima, A.; Honda, K. Electrochemical Photolysis of Water at a Semiconductor Electrode.
Nature 1972, 238, 37-38.
(20) Kohtani, S.; Tomohiro, M.; Tokumura, K.; Nakagaki, R. Photooxidation reactions of polycyclic
aromatic hydrocarbons over pure and Ag-loaded BiVO4 photocatalysts. Applied Catalysis B:
Environmental 2005, 58, 265-272.
(21) Kudo, A.; Omori, K.; Kato, H. A Novel Aqueous Process for Preparation of Crystal Form-
Controlled and Highly Crystalline BiVO4 Powder from Layered Vanadates at Room
Temperature and Its Photocatalytic and Photophysical Properties. J. Am. Chem. Soc. 1999, 121,
11459-11467.
(22) Long, M.; Cai, W.; Cai, J.; Zhou, B.; Chai, X.; Wu, Y. Efficient photocatalytic degradation of
phenol over Co3O4/BiVO4 composite under visible light irradiation. J Phys Chem B 2006, 110,
20211-20216.
(23) Long, M.; Cai, W.; Kisch, H. Visible light induced photoelectrochemical properties of n-BiVO4
and n-BiVO4/p-Co3O4. 2007.
(24) Martínez-de la Cruz, A.; Pérez, U. M. G. Photocatalytic properties of BiVO4 prepared by the
co-precipitation method: Degradation of rhodamine B and possible reaction mechanisms under
visible irradiation. Mater. Res. Bull. 2010, 45, 135-141.

WPI SJTU MQP 37
(25) Sayama, K.; Nomura, A.; Arai, T.; Sugita, T.; Abe, R.; Yanagida, M.; Oi, T.; Iwasaki, Y.; Abe,
Y.; Sugihara, H. Photoelectrochemical Decomposition of Water into H2 and O2 on Porous
BiVO4 Thin-Film Electrodes under Visible Light and Significant Effect of Ag Ion Treatment.
The Journal of Physical Chemistry B 2006, 110, 11352-11360.
(26) Sun, Y.; Wu, C.; Long, R.; Cui, Y.; Zhang, S.; Xie, Y. Synthetic loosely packed monoclinic
BiVO4 nanoellipsoids with novel multiresponses to visible light, trace gas and temperature.
Chem. Commun. 2009, 4542-4544.
(27) Tokunaga, S.; Kato, H.; Kudo, A. Selective Preparation of Monoclinic and Tetragonal BiVO4
with Scheelite Structure and Their Photocatalytic Properties. Chemistry of Materials 2001, 13,
4624-4628.
(28) Walsh, A.; Yan, Y.; Huda, M. N.; Al-Jassim, M.; Wei, S. Band Edge Electronic Structure of
BiVO4: Elucidating the Role of the Bi s and V d Orbitals. Chemistry of Materials 2009, 21, 547-
551.
(29) Wood, P.; Glasser, F. P. Preparation and properties of pigmentary grade BiVO4 precipitated
from aqueous solution. Ceram. Int. 2004, 30, 875-882.
(30) Yang, T.; Xia, D. Self-assembly of highly crystalline spherical BiVO4 in aqueous solutions. J.
Cryst. Growth 2009, 311, 4505-4509.
(31) Yang, T.; Xia, D.; Chen, G.; Chen, Y. Influence of the surfactant and temperature on the
morphology and physico-chemical properties of hydrothermally synthesized composite oxide
BiVO4. Mater. Chem. Phys. 2009, 114, 69-72.
(32) Yu, J.; Zhang, Y.; Kudo, A. Synthesis and photocatalytic performances of BiVO4 by ammonia
co-precipitation process. Journal of Solid State Chemistry 2009, 182, 223-228.
(33) Castillo, N. C.; Ding, L.; Heel, A.; Graule, T.; Pulgarin, C. On the photocatalytic degradation of
phenol and dichloroacetate by BiVO4: The need of a sacrificial electron acceptor. J. Photochem.
Photobiol. A. 2010, 216, 221-227.
(34) Herrmann, J. Photocatalysis fundamentals revisited to avoid several misconceptions. Applied
Catalysis B: Environmental 2010, 99, 461-468.
(35) Fu, Q.; Saltsburg, H.; Flytzani-Stephanopoulos, M. Active Nonmetallic Au and Pt Species on
Ceria-Based Water-Gas Shift Catalysts. Science 2003, 301, 935-938.
(36) Boucher, M. B.; Goergen, S.; Yi, N.; Flytzani-Stephanopoulos, M. 'Shape effects' in metal oxide
supported nanoscale gold catalysts. Phys. Chem. Chem. Phys. 2011, 13, 2517-2527.

WPI SJTU MQP 38
Appendix
Furnace Program for Electrode Calcination
Region Temperature (°C) Time Interval (min) Cumulative Time (min)
1 20 20 0
2 120 10 20
3 120 40 30
4 325 10 70
5 325 10 80
6 375 5 90
7 375 15 95
8 450 5 110
9 450 10 115
10 500 180 125
11 500 END 305
SEM Images
BiVO4

WPI SJTU MQP 39
0.5 wt% Au/BiVO4

WPI SJTU MQP 40
1 wt% Au/BiVO4

WPI SJTU MQP 41
2 wt% Au/BiVO4