photoacoustic image reconstruction from few-detector and limited-angle data
TRANSCRIPT
Photoacoustic image reconstruction from few-detector and limited-angle data
Lei Yao and Huabei Jiang* Department of Biomedical Engineering, University of Florida, Gainesville, FL 32611, USA
Abstract: Photoacoustic tomography (PAT) is an emerging non-invasive imaging technique with great potential for a wide range of biomedical imaging applications. However, the conventional PAT reconstruction algorithms often provide distorted images with strong artifacts in cases when the signals are collected from few measurements or over an aperture that does not enclose the object. In this work, we present a total-variation-minimization (TVM) enhanced iterative reconstruction algorithm that can provide excellent photoacoustic image reconstruction from few-detector and limited-angle data. The enhancement is confirmed and evaluated using several phantom experiments. © 2011 Optical Society of America OCIS codes: (100.2980) Image enhancement; (170.3010) Image reconstruction techniques; (170.5120) Photoacoustic imaging; (170.6960) Tomography
References and links 1. G. Paltauf, J. A. Viator, S. A. Prahl, and S. L. Jacques, “Iterative reconstruction algorithm for optoacoustic
imaging,” J. Acoust. Soc. Am. 112(4), 1536–1544 (2002). 2. S. J. Norton and T. Vo-Dinh, “Optoacoustic diffraction tomography: analysis of algorithms,” J. Opt. Soc. Am. A
20(10), 1859–1866 (2003). 3. A. A. Oraevsky, A. A. Karabutov, S. V. Solomatin, E. V. Savateeva, V. A. Andreev, Z. Gatalica, H. Singh, and
R. D. Fleming, “Laser optoacoustic imaging of breast cancer in vivo,” Proc. SPIE 4256, 6–15 (2001). 4. L. A. Kunyansky, “Explicit inversion formulae for the spherical mean radon transform,” Inverse Probl. 23(1),
373–383 (2007). 5. D. Finch, S. Patch, and Rakesh, “Determining a Function from Its Mean Values Over a Family of Spheres,”
SIAM J. Math. Anal. 35(5), 1213–1240 (2004). 6. M. Xu and L. V. Wang, “Universal back-projection algorithm for photoacoustic computed tomography,” Phys.
Rev. E Stat. Nonlin. Soft Matter Phys. 71(1), 016706 (2005). 7. Z. Yuan and H. Jiang, “Quantitative photoacoustic tomography: Recovery of optical absorption coefficient maps
of heterogenous media,” Appl. Phys. Lett. 88(23), 231101 (2006). 8. L. Yin, Q. Wang, Q. Zhang, and H. Jiang, “Tomographic imaging of absolute optical absorption coefficient in
turbid media using combined photoacoustic and diffusing light measurements,” Opt. Lett. 32(17), 2556–2558 (2007).
9. K. D. Paulsen and H. Jiang, “Spatially varying optical property reconstruction using a finite element diffusion equation approximation,” Med. Phys. 22(6), 691–701 (1995).
10. S. R. Arridge, “Forward and inverse problems in time-resolved infrared imaging,” in Medical Optical Tomography: Functional Imaging and Monitoring, G. J. Mueller, B. Chance, R. R. Alfano, S. B. Arridge, J. Beuthen, E. Gratton, M. Kaschke, B. R. Masters, S. Svanberg, and P. van der Zee, eds. (SPIE Press, 1993), pp. 35–64.
11. S. J. LaRoque, E. Y. Sidky, and X. Pan, “Accurate image reconstruction from few-views and limited-angle data in diffraction tomography,” J. Opt. Soc. Am. A 25(7), 1772–1782 (2008).
12. J. Bian, J. H. Siewerdsen, X. Han, E. Y. Sidky, J. L. Prince, C. A. Pelizzari, and X. Pan, “Evaluation of sparse-view reconstruction from flat-panel-detector cone-beam CT,” Phys. Med. Biol. 55(22), 6575–6599 (2010).
13. H. Ammari, E. Bretin, V. Jugnon, and A. Wahab, “Photo-acoustic imaging for attenuating acoustic media,” in Mathematical Modeling in Biomedical Imaging II, H. Ammari, ed., Vol. 2035 of Lecture Notes in Mathematics (Springer, 2011), pp. 53–80.
14. H. Ammari, E. Bossy, V. Jugnon, and H. Kang, “Mathematical models in photoacoustic imaging of small absorbers,” SIAM Rev. 52(4), 677–695 (2010).
15. H. Ammari, E. Bossy, V. Jugnon, and H. Kang, “Reconstruction of the optical absorption coefficient of a small absorber from the absorbed energy density,” SIAM J. Appl. Math. 71, 676–693 (2011).
#151589 - $15.00 USD Received 22 Jul 2011; revised 19 Aug 2011; accepted 19 Aug 2011; published 19 Aug 2011(C) 2011 OSA 1 September 2011 / Vol. 2, No. 9 / BIOMEDICAL OPTICS EXPRESS 2649
16. K. Wang, E. Y. Sidky, M. A. Anastasio, A. A. Oraevsky, and X. Pan, “Limited data image reconstruction in optoacoustic tomography by constrained total variation minimization,” Proc. SPIE 7899, 78993U, 78993U-6 (2011).
17. L. Yao and H. Jiang, “Finite-element-based photoacoustic tomography in time-domain,” J. Opt. A, Pure Appl. Opt. 11(8), 085301 (2009).
18. K. D. Paulsen and H. Jiang, “Enhanced frequency-domain optical image reconstruction in tissues through total-variation minimization,” Appl. Opt. 35(19), 3447–3458 (1996).
19. H. Jiang, Z. Yuan, and X. Gu, “Spatially varying optical and acoustic property reconstruction using finite-element-based photoacoustic tomography,” J. Opt. Soc. Am. A 23(4), 878–888 (2006).
20. Z. Wang and A. C. Bovik, “A universal image quality index,” IEEE Signal Process. Lett. 9(3), 81–84 (2002).
1. Introduction
Photoacoustic tomography (PAT) is an emerging non-invasive imaging technique that combines the merits of high optical contrast and high ultrasound resolution in a single modality [1–3]. In PAT, the Helmholtz-like photoacoustic wave equation has been commonly used as an accurate model for describing laser-induced acoustic wave propagation in tissue. While a variety of analytic PAT reconstruction algorithms have been developed [4–6], the finite element method (FEM) based approach appears to be particularly powerful in this regard, because it can provide quantitative imaging capability by recovering optical absorption coefficient [7,8], eliminate the assumption of homogeneous acoustic medium needed in analytical methods, accommodate object boundary irregularity and allow appropriate boundary conditions implementations.
A practical need exists for reconstruction of photoacoustic images from few measurements, as this can greatly reduce the required scanning time and the number of ultrasound sensors placed near or on the boundary of an object to receive the laser-induced acoustic signals. In addition, in many practical implementations of PAT the photoacoustic signals are recorded over an aperture that does not enclose the object, which results in a limited-angle tomographic reconstruction problem. In such cases, the existing reconstruction algorithms, which are based on the least-squares criteria (i.e., the regularized Newton method) [9,10], often generate distorted images with severe artifacts. Total-variation-minimization (TVM), on the other hand, has proved to be a powerful tool for limited-data image reconstruction in diffraction tomography and computed tomography (CT) [11,12]. TVM based PAT algorithms have also been implemented and tested using numerically simulated limited-view data [13–16]. Here we describe an unconstrained TVM FEM-based iterative reconstruction algorithm, and for the first time present experimental evidence that the TVM-based algorithm offers excellent photoacoustic image reconstruction from few-detector and limited-angle data.
This paper is organized as follows. In Section 2, the FEM based PAT reconstruction algorithm and the unconstrained TVM scheme are reviewed briefly. The experimental validation of our TVM FEM-based algorithm is presented in Section 3. The conclusions are made in Section 4.
2. Method
We first briefly describe the existing FEM-based photoacoustic reconstruction algorithm detailed elsewhere [17]. The time-domain photoacoustic wave equation in tissue can be described as follows:
( ) ( ) ( ) ( )22
2 20
,1, ,p
p t J tp t
C tv tβ∂ Φ ∂
∇ − = −∂∂
r rr (1)
where p is the pressure wave; 0v is the speed of acoustic wave in the medium; β is the thermal expansion coefficient; pC is the specific heat; Φ is the absorbed energy density;
( ) ( )0J t t tδ= − is assumed in our study.
#151589 - $15.00 USD Received 22 Jul 2011; revised 19 Aug 2011; accepted 19 Aug 2011; published 19 Aug 2011(C) 2011 OSA 1 September 2011 / Vol. 2, No. 9 / BIOMEDICAL OPTICS EXPRESS 2650
To form an image from a presumably uniform initial guess of the absorbed energy density distribution, we need a method of updating Φ, the desired quantity from its starting value. This update is accomplished through the least-squares minimization of the following functional:
( ) ( )20
1, ,
Mc
j jj
F p p p=
Φ = −∑ (2)
where ojp and c
jp are the measured and computed acoustic field data for 1, 2,i M= boundary locations. Using the regularized Newton method, we obtained the following matrix equation for updating Φ:
( ) ( ) ,T T o cp pλ χℑ ℑ+ ∆ = ℑ −I (3)
where ( )0 0 0 01 2, ,
T
Mp p p p= and ( )1 2, ,Tc c c c
Mp p p p= ; χ∆ is the update vector for the
absorbed optical energy density; ℑ is the Jacobian matrix formed by p∂ ∂Φ at the boundary measurement sites; λ is the regularization parameter determined by combined Marquardt and Tikhonov regularization schemes; and I is the identity matrix.
We now incorporate the total variation of Φ as a penalty term by defining a new functional [18]:
( ) ( ) ( ), , .F p F p LΦ = Φ + Φ (4)
Here ( ) 22 2L dxdyω δΦΦ = ∇Φ +∫ is the penalty term, and ωΦ and δ are typically positive parameters that need to be determined numerically. The minimization of Eq. (4) can be realized by the differentiation of F with respect to each nodal parameter that constitutes the Φ distribution and by setting each of the resulting expression to zero, leading to the following system of equations:
( ) ( )1
0 1,2 ,cMjo c
j j iji i
pF p p V i N=
∂∂= − − + = =
∂Φ ∂Φ∑
(5)
where i iV L= ∂ ∂Φ . Again, through the regularized Newton method, the following matrix equation for TVM-based inversion is obtained [18]:
( ) ( )0 ,T T cR I p p Vλ χℑ ℑ+ + ∆ = ℑ − − (6)
where V is formed by L∂ ∂Φ and R is formed by V∂ ∂Φ . At this point, our solution procedure for solving Eq. (6) and the regularization parameter selection are identical to those described previously. Hence, it becomes clear that the only additions to our new algorithm result from the assembly of matrix R and the construction of column vector V.
3. Results
In this section our TVM enhanced reconstruction algorithm is tested and evaluated using phantom experimental data. For comparative purposes, reconstruction results without the TVM enhancement are also presented.
The experimental setup used for collecting the phantom data was a pulsed ND: YAG laser based single transducer (1MHz) scanning system, which was described in detail elsewhere [8]. Three phantom experiments were conducted. In the first two experiments, we embedded one or two objects with a size ranging from 3 to 0.5 mm in a 50 mm-diameter solid cylindrical phantom. The absorption coefficient of the background phantom was 0.01 mm−1, while the
#151589 - $15.00 USD Received 22 Jul 2011; revised 19 Aug 2011; accepted 19 Aug 2011; published 19 Aug 2011(C) 2011 OSA 1 September 2011 / Vol. 2, No. 9 / BIOMEDICAL OPTICS EXPRESS 2651

absorption coefficient of the target(s) was 0.03 mm−1. In the last experiment, we used a single-target-containing phantom, aiming to test the capability of detecting target having low optical contrasts relative to the background phantom. In this case, the target had an absorption coefficient of 0.015 mm−1. The reduced scattering coefficients of the background phantom and targets were 1.0 and 3.0 mm−1 for the first two experiments, and 1.0 and 2.0 mm−1 for the last experiment. In the reconstructions, we used a dual-meshing scheme [19] where the fine mesh used for the forward calculation consisted of 5977 nodes and 11712 elements, while the coarse mesh used for the inverse calculation had 1525 nodes and 2928 elements. All the images obtained from the method without the TVM are the results of three iterations, while those obtained from the TVM-enhanced method are the results of twenty or more iterations. Parallel code was used to speed up these calculations on Beowulf clusters with 8 CPUs. The computational speed can be further increased if clusters with more than 8 CPUs are used. As mentioned above, the parameters ωΦ and δ were determined through numerical experimentation. From our experience, a constant value of δ = 0.001 was sufficient for the current experimental studies, while the value of ωΦ is related to the signal-to-noise ratio of the measurements. For our experimental cases, 1.0ωΦ = and δ = 0.001 for the first case, and
0.5ωΦ = and δ = 0.001 for the second and third cases were used. The reconstruction results based on few-detector data from the three experimental cases
are shown in Figs. 1, 2 and 3, respectively. In each figure, the images in the top and bottom rows, respectively, present the recovered absorbed energy density images using the algorithm without and with the TVM where 120, 60, 30, and 15 detectors were equally distributed along the surface of the circular background region. As expected, the conventional algorithm without the TVM provides high quality images only when the number of detectors was relatively sufficient (Figs. 1a,b, Figs. 2a,b, and Figs. 3a,b). The images reconstructed from few-detector data by the conventional algorithm without the TVM contained severe artifacts and distortions (Figs. 1c,d, Figs. 2c,d, and Figs. 3c,d). Considerably enhanced images are achieved using the method with the TVM, especially when the number of the detectors is reduced to 30 or 15 (Figs. 1g,h, Figs. 2g,h, and Figs. 3g,h). We also note that the computational efficiency of our TVM based algorithm for recovering a small absorber (Fig. 2) and a larger absorber (Fig. 3) is similar when the number of the detectors is insufficient.
Images reconstructed from the limited-angle data for the first case using the two methods are displayed in Fig. 4 where the top and bottom rows, respectively, show the recovered absorbed energy density images using the algorithm without and with the TVM when 120 detectors over 360°, 60 detectors over 180°, and 30 detectors over 90°, were equally
Fig. 1. Reconstructed photoacoustic images based on few-detector data for case 1. (a), 120 detectors, without TVM. (b), 60 detectors, without TVM. (c), 30 detectors, without TVM. (d), 15 detectors, without TVM. (e), 120 detectors, with TVM. (f), 60 detectors, with TVM. (g), 30 detectors, with TVM. (h), 15 detectors, with TVM.
#151589 - $15.00 USD Received 22 Jul 2011; revised 19 Aug 2011; accepted 19 Aug 2011; published 19 Aug 2011(C) 2011 OSA 1 September 2011 / Vol. 2, No. 9 / BIOMEDICAL OPTICS EXPRESS 2652

Fig. 2. Reconstructed photoacoustic images based on few-detector data for case 2. (a), 120 detectors, without TVM. (b), 60 detectors, without TVM. (c), 30 detectors, without TVM. (d), 15 detectors, without TVM. (e), 120 detectors, with TVM. (f), 60 detectors, with TVM. (g), 30 detectors, with TVM. (h), 15 detectors, with TVM.
Fig. 3. Reconstructed photoacoustic images based on few-detector data for case 3. (a), 120 detectors, without TVM. (b), 60 detectors, without TVM. (c), 30 detectors, without TVM. (d), 15 detectors, without TVM. (e), 120 detectors, with TVM. (f), 60 detectors, with TVM. (g), 30 detectors, with TVM. (h), 15 detectors, with TVM.
Fig. 4. Reconstructed photoacoustic images based on limited-angle data for case 1. (a), 120 detectors over 360°, without TVM. (b), 60 detectors over 180°, without TVM. (c), 30 detectors over 90°, without TVM. (d), 120 detectors over 360°, with TVM. (e), 60 detectors over 180°, with TVM. (f), 30 detectors over 90°, with TVM.
distributed along the surface of the circular background region. Again, strong artifacts and distortions exist in the images recovered with the method without the TVM when the data collected is angle-limited (Figs. 4b,c), while considerably improved images are reconstructed using the TVM enhanced algorithm (Figs. 4e,f).
#151589 - $15.00 USD Received 22 Jul 2011; revised 19 Aug 2011; accepted 19 Aug 2011; published 19 Aug 2011(C) 2011 OSA 1 September 2011 / Vol. 2, No. 9 / BIOMEDICAL OPTICS EXPRESS 2653
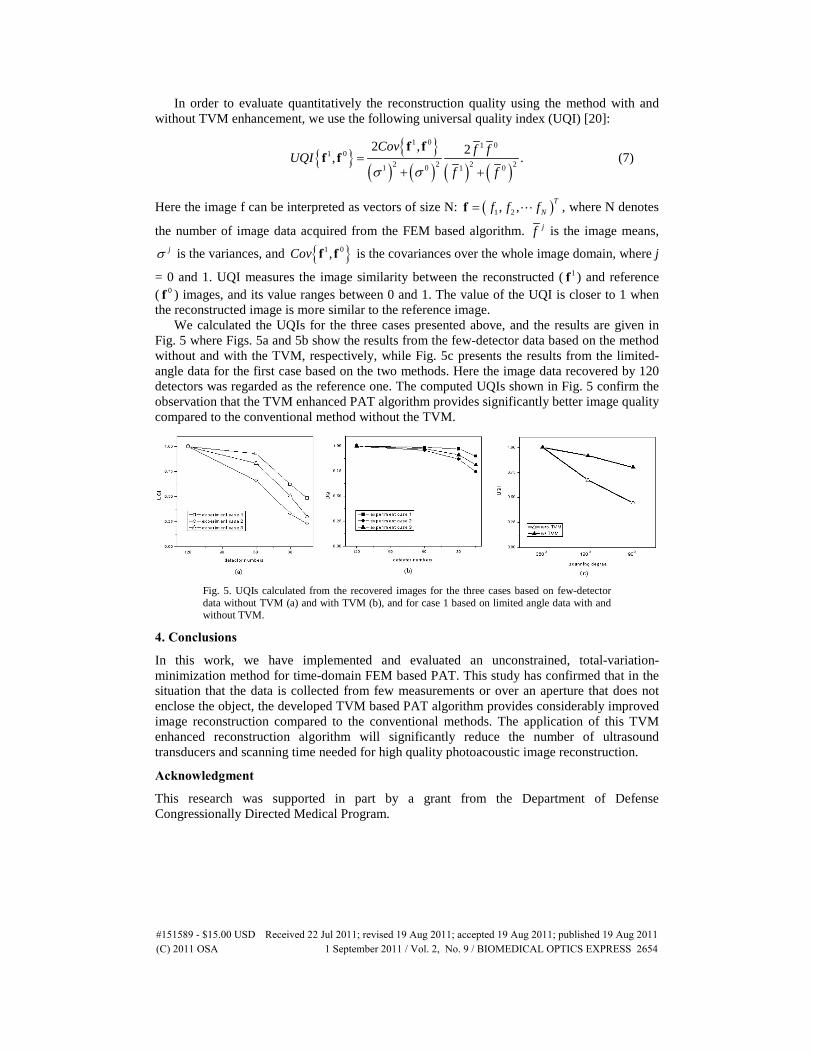
In order to evaluate quantitatively the reconstruction quality using the method with and without TVM enhancement, we use the following universal quality index (UQI) [20]:
{ } { }( ) ( ) ( ) ( )
1 0 1 01 0
2 2 2 21 0 1 0
2 , 2, .Cov f fUQI
f fσ σ=
+ +
f ff f (7)
Here the image f can be interpreted as vectors of size N: ( )1 2, , TNf f f=f , where N denotes
the number of image data acquired from the FEM based algorithm. jf is the image means, jσ is the variances, and { }1 0,Cov f f is the covariances over the whole image domain, where j
= 0 and 1. UQI measures the image similarity between the reconstructed ( 1f ) and reference ( 0f ) images, and its value ranges between 0 and 1. The value of the UQI is closer to 1 when the reconstructed image is more similar to the reference image.
We calculated the UQIs for the three cases presented above, and the results are given in Fig. 5 where Figs. 5a and 5b show the results from the few-detector data based on the method without and with the TVM, respectively, while Fig. 5c presents the results from the limited-angle data for the first case based on the two methods. Here the image data recovered by 120 detectors was regarded as the reference one. The computed UQIs shown in Fig. 5 confirm the observation that the TVM enhanced PAT algorithm provides significantly better image quality compared to the conventional method without the TVM.
Fig. 5. UQIs calculated from the recovered images for the three cases based on few-detector data without TVM (a) and with TVM (b), and for case 1 based on limited angle data with and without TVM.
4. Conclusions
In this work, we have implemented and evaluated an unconstrained, total-variation-minimization method for time-domain FEM based PAT. This study has confirmed that in the situation that the data is collected from few measurements or over an aperture that does not enclose the object, the developed TVM based PAT algorithm provides considerably improved image reconstruction compared to the conventional methods. The application of this TVM enhanced reconstruction algorithm will significantly reduce the number of ultrasound transducers and scanning time needed for high quality photoacoustic image reconstruction.
Acknowledgment
This research was supported in part by a grant from the Department of Defense Congressionally Directed Medical Program.
#151589 - $15.00 USD Received 22 Jul 2011; revised 19 Aug 2011; accepted 19 Aug 2011; published 19 Aug 2011(C) 2011 OSA 1 September 2011 / Vol. 2, No. 9 / BIOMEDICAL OPTICS EXPRESS 2654