phoenix unit trust managers manager’s interim report/media/files/p/phoenix-utm/documents/... ·...
TRANSCRIPT

PHOENIX UNIT TRUST MANAGERS
MANAGER’S INTERIM REPORTFor the half year: 1 August 2016 to 31 January 2017
PUTM OPPORTUNITY UNIT TRUST


1
Contents
Investment review 2-3
Portfolio of investments 4-10
Top ten purchases and sales 11
Statistical information 12-14
Statement of total return & change in unitholders’ funds 15
Balance sheet 16
Distribution table 17
Corporate information 18-19

PUTM Opportunity Unit Trust 23.4 -3.2 12.8 11.0 12.8
Sector Average 28.7 -4.0 13.2 10.3 13.2
Jan 16-17 Jan 15-16 Jan 14-15 Jan 13-14 Jan 12-13% growth % growth % growth % growth % growth
2
Dear Investor
Welcome to the PUTM Opportunities Unit Trust interimreport for the six months to 31 January 2017.
Performance Review
Over the review period, the PUTM Opportunity Unit Trustreturned 10.4%, compared to its sector average whichreturned 9.7%. (Source: Lipper, bid to bid, net incomereinvested for the six months to 31/01/17).
In the table below, you can see how the Fund performedagainst its sector average over the last five discrete oneyear periods.
Investment review
Source: Lipper, bid to bid, net income reinvested to end January for each year.
Past performance is not a guide to future performance.
The value of units and the income from them can go down as well as up and is not guaranteed. You may not get backthe full amount invested.
Please note that all past performance figures are calculated without taking the initial charge into account.
Standardised Past Performance

3
Portfolio and Market Review
We continued to build our position in China’s Ctrip.com.The company has established itself in a toughcompetitive environment as the dominant online travelagent. Its latest results at the end of November showedrevenues were up 75% year-on-year and operatingmargins climbed 600 basis points, beating consensusestimates. Given the scale of margin improvement still tocome from the easing competitive environment, wecontinue to see significant upside to the share price.Other additions included Pandora and JP Morgan. Bycontrast, we reduced the holding in German chemicalsfirm Covestro. The supply/demand dynamics on anumber of its products have improved, boosting margins,while cost-cutting measures have also borne fruit. As aresult, the stock has performed exceptionally well,meaning our investment case is playing out. Meanwhile,we exited Japan’s Mitsubishi UFJ Financial Group. Ourconviction in the stock rested on improved capitalefficiency through the reduction of cross shareholdings onthe company’s balance sheet, driven by a broad-basedinitiative to promote corporate governance in Japan.However, the issue has been clouded due to falling profitsin a negative interest rate world.
Both Citigroup and First Republic Bank performed well onthe back of rapidly rising bond yields and the prospect oflooser financial regulation in the wake of Trump’s electionwin. Staying in the US, shares in autoparts firm Visteonclimbed after Samsung bought one of its rivals,highlighting the important role Visteon has to play in thegrowing car infotainment segment. The Fund’s largeexposure to commodity-related companies proved positivefor performance, with Anglo American and Glencorenotably strong. The mining sector had been weak, asinvestors were concerned about the outlook for emergingmarkets. However, we maintained our view that thesecompanies are integral to future global growth.
However, Capita disappointed following a surprise profitwarning. Management cited a slowdown in its cyclicalbusinesses and several contract issues. Novo Nordiskhad a difficult results day as it became more cautious onthe outlook for pricing in the US pharmaceuticals sector.That said, we believe that the company’s productportfolio remains ‘best in class’ and the stock shouldrebound as pricing expectations are reset.
Market Outlook and Fund Strategy
While the recent rally could continue into 2017, weremain cautious on the medium-term outlook for globalequity markets, with the potential for further volatilitydriven by politics and the outlook for the global economy.In particular, Europe has a full election schedule nextyear, while the UK is set to invoke Article 50 in March.Monetary policy will continue to diverge, with the USFederal Reserve likely to hike interest rates further, whileexpect the other major central banks will maintain ratesat more or less current levels. Against this backdrop, webelieve our fundamental bottom-up investment approachremains the best way to generate robust long-termreturns.
Investment review

Portfolio of investments
4
Investments held at 31 January 2017 Market Percentage of value total net assets Holding Investment £ %
United Kingdom (31/07/16 – 32.84%) 33.42 Oil & Gas Producers 526,040 BP 2,510,526 1.62 158,336 Royal Dutch Shell ‘B’ 3,602,144 2.33
Mining 103,661 Anglo American 1,413,936 0.92 55,142 Rio Tinto 1,953,405 1.26
Construction & Materials 24,452 Kier Group 338,416 0.22 114,089 Polypipe Group 384,594 0.25
Aerospace & Defence 154,859 Senior 305,537 0.20
General Industrials 58,271 Smith (DS) 260,297 0.17
Support Services 16,297 Atkins (WS) 239,403 0.15 142,799 Babcock International 1,278,765 0.83 32,022 Capita Group 160,590 0.10 47,177 Essentra 193,473 0.13 50,633 Howden Joinery Group 189,114 0.12 78,978 PageGroup 340,395 0.22
Automobiles & Parts 280,894 GKN 982,286 0.64
Beverages 46,962 Britvic 289,990 0.19 28,070 Diageo 624,277 0.40
Personal Goods 11,484 Unilever 373,460 0.24
Household Goods 46,418 Bellway 1,153,023 0.74 43,284 Bovis Homes Group 358,175 0.23 116,815 Countryside Properties 272,413 0.18 58,049 Crest Nicholson Holdings 293,438 0.19 7,264 Reckitt Benckiser 495,332 0.32
Leisure Goods 69,636 Pets at Home Group 139,063 0.09
Tobacco 23,621 British American Tobacco 1,153,768 0.75 30,952 Imperial Brands Group 1,153,581 0.75
Healthcare Equipment & Services 40,547 NMC Health 664,565 0.43 33,448 Smith & Nephew 397,028 0.26
5
Portfolio of investments
Investments held at 31 January 2017 Market Percentage of value total net assets Holding Investment £ %
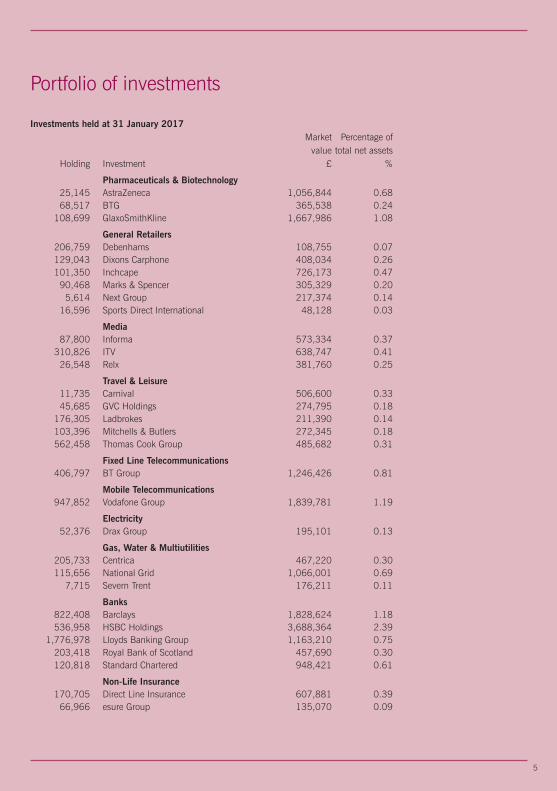
Pharmaceuticals & Biotechnology 25,145 AstraZeneca 1,056,844 0.68 68,517 BTG 365,538 0.24 108,699 GlaxoSmithKline 1,667,986 1.08
General Retailers 206,759 Debenhams 108,755 0.07 129,043 Dixons Carphone 408,034 0.26 101,350 Inchcape 726,173 0.47 90,468 Marks & Spencer 305,329 0.20 5,614 Next Group 217,374 0.14 16,596 Sports Direct International 48,128 0.03
Media 87,800 Informa 573,334 0.37 310,826 ITV 638,747 0.41 26,548 Relx 381,760 0.25
Travel & Leisure 11,735 Carnival 506,600 0.33 45,685 GVC Holdings 274,795 0.18 176,305 Ladbrokes 211,390 0.14 103,396 Mitchells & Butlers 272,345 0.18 562,458 Thomas Cook Group 485,682 0.31
Fixed Line Telecommunications 406,797 BT Group 1,246,426 0.81
Mobile Telecommunications 947,852 Vodafone Group 1,839,781 1.19
Electricity 52,376 Drax Group 195,101 0.13
Gas, Water & Multiutilities 205,733 Centrica 467,220 0.30 115,656 National Grid 1,066,001 0.69 7,715 Severn Trent 176,211 0.11
Banks 822,408 Barclays 1,828,624 1.18 536,958 HSBC Holdings 3,688,364 2.39 1,776,978 Lloyds Banking Group 1,163,210 0.75 203,418 Royal Bank of Scotland 457,690 0.30 120,818 Standard Chartered 948,421 0.61
Non-Life Insurance 170,705 Direct Line Insurance 607,881 0.39 66,966 esure Group 135,070 0.09

Portfolio of investments
Investments held at 31 January 2017 Market Percentage of value total net assets Holding Investment £ %
Life Insurance 275,105 Aviva 1,319,679 0.85 283,600 Legal & General 671,848 0.43 144,882 Prudential 2,250,017 1.46
Real Estate Investment Services 57,854 Savills 443,451 0.29
Financial Services 62,564 Close Brothers 910,306 0.59 49,142 Paragon Group of Companies 198,190 0.13 76,383 Virgin Money Holdings 237,322 0.15 67,907 Worldpay 194,554 0.13
Software & Computer Services 185,649 Sage 1,149,167 0.74 250,050 Sophos Group 680,636 0.44
Europe (31/07/16 – 17.66%) 14.39 Banks 162,538 Bankinter 1,055,542 0.68 204,766 BlackRock 481,885 0.31 57,405 Danske Bank 1,532,094 0.99
Technology Hardware & Equipment 12,757 ASML Holding 1,244,113 0.81 53,024 Infineon Technologies 783,557 0.51 120,467 Nokia 435,850 0.28
Healthcare Equipment & Services 7,262 Orpea 474,172 0.31
Pharmaceuticals & Biotechnology 22,772 Novo Nordisk B 657,423 0.43 7,104 Roche Holding 1,331,502 0.86
Industrial Transportation 689 A.P. Moller – Maersk 936,625 0.61 111,544 Ryanair Holdings 1,386,600 0.90
Travel & Leisure 294,583 International Consolidated Airlines Group 1,431,968 0.93 60,671 TUI 713,491 0.46
Mobile Telecommunications 138,350 Deutsche Telekom 1,945,394 1.26
Warrants 53 Kenmare Resources Warrants 16/11/2019^ – 0.00
Electronic & Electrical Equipment 25,070 Allegion 1,324,111 0.86
6

Portfolio of investments
Investments held at 31 January 2017 Market Percentage of value total net assets Holding Investment £ %
Food Producers 68,152 Glanbia 915,982 0.59
Oil & Gas Producers 85,459 Galp Energia 1,015,524 0.66 53,707 Lundin Petroleum 932,182 0.60
Support Services 20,271 Grafton Group 118,383 0.08 104,606 Securitas ‘B’ 1,336,171 0.86
Personal Goods 14,363 Pandora 1,506,027 0.97
Software & Computer Services 23,379 Scout24 AG 669,483 0.43
North America (31/07/16 – 34.44%) Oil & Gas Producers 36.23 128,418 Africa Oil 199,912 0.13 9,949 Concho Resources 1,107,866 0.72 29,115 Devon Energy 1,052,971 0.68 22,579 Hess 977,119 0.63
Oil Equipment & Services 25,930 Halliburton 1,174,986 0.76
Construction & Materials 6,995 Acuity Brands 1,149,499 0.74 31,883 Fortune Brands Home & Security 1,423,248 0.92 6,781 Martin Marietta Materials 1,280,239 0.83
Automobiles & Parts 21,942 Visteon 1,552,420 1.00
Food Producers 29,551 Kraft Heinz Company 2,111,633 1.37
Household Goods 46,175 Newell Brands 1,714,426 1.11
Leisure Goods 41,648 Activision 1,323,432 0.85 14,651 Electronic Arts 985,433 0.64
Media 238,976 Entertainment One 552,513 0.36
Personal Goods 55,451 Hanesbrands 1,037,648 0.67
Healthcare Equipment & Services 93,367 Boston Scientific 1,786,125 1.16 7,614 C.R. Bard 1,446,978 0.94 15,695 UnitedHealth Group 2,040,652 1.32
7
Portfolio of investments
Investments held at 31 January 2017 Market Percentage of value total net assets Holding Investment £ %
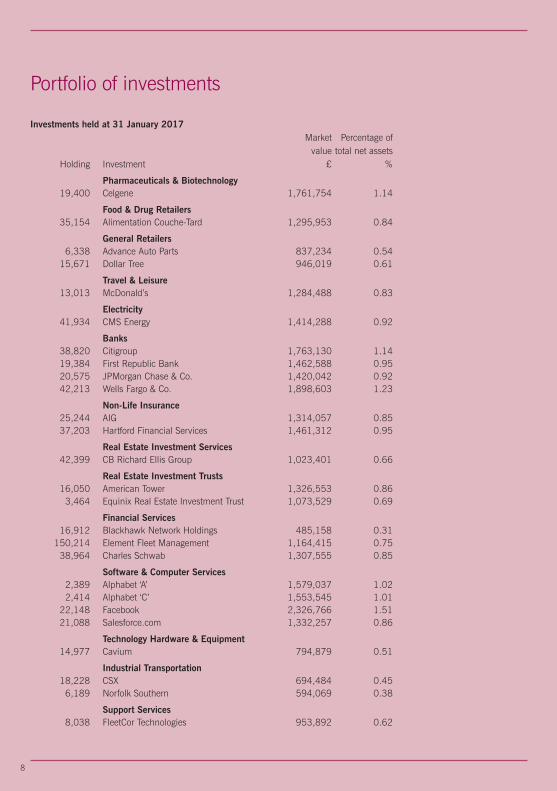
Pharmaceuticals & Biotechnology 19,400 Celgene 1,761,754 1.14
Food & Drug Retailers 35,154 Alimentation Couche-Tard 1,295,953 0.84
General Retailers 6,338 Advance Auto Parts 837,234 0.54 15,671 Dollar Tree 946,019 0.61
Travel & Leisure 13,013 McDonald’s 1,284,488 0.83
Electricity 41,934 CMS Energy 1,414,288 0.92
Banks 38,820 Citigroup 1,763,130 1.14 19,384 First Republic Bank 1,462,588 0.95 20,575 JPMorgan Chase & Co. 1,420,042 0.92 42,213 Wells Fargo & Co. 1,898,603 1.23
Non-Life Insurance 25,244 AIG 1,314,057 0.85 37,203 Hartford Financial Services 1,461,312 0.95
Real Estate Investment Services 42,399 CB Richard Ellis Group 1,023,401 0.66
Real Estate Investment Trusts 16,050 American Tower 1,326,553 0.86 3,464 Equinix Real Estate Investment Trust 1,073,529 0.69
Financial Services 16,912 Blackhawk Network Holdings 485,158 0.31 150,214 Element Fleet Management 1,164,415 0.75 38,964 Charles Schwab 1,307,555 0.85
Software & Computer Services 2,389 Alphabet ‘A’ 1,579,037 1.02 2,414 Alphabet ‘C’ 1,553,545 1.01 22,148 Facebook 2,326,766 1.51 21,088 Salesforce.com 1,332,257 0.86
Technology Hardware & Equipment 14,977 Cavium 794,879 0.51
Industrial Transportation 18,228 CSX 694,484 0.45 6,189 Norfolk Southern 594,069 0.38
Support Services 8,038 FleetCor Technologies 953,892 0.62
8

Portfolio of investments
Investments held at 31 January 2017 Market Percentage of value total net assets Holding Investment £ %
Australia (31/07/16 – 0.00%) 0.79 Life Insurance 181,677 Challenger 1,213,629 0.79
Brazil (31/07/16 – 0.00%) 0.71 Banks 132,895 Banco Bradesco 1,102,897 0.71
Cayman Islands (31/07/16 – 1.28%) 2.46 Personal Goods 527,196 Anta Sports Products 1,352,376 0.88 36,518 Ctrip ADR~ 1,271,478 0.82
Travel & Leisure 10,632 China Lodging Group ADR~ 459,764 0.30
Software & Computer Services 5,102 Baidu ADR~ 715,066 0.46
Channel Islands (31/07/16 – 2.52%) 3.23 Oil Equipment & Services 15,891 Petrofac 147,310 0.09
Mining 717,516 Glencore Xstrata 2,344,842 1.52
Support Services 10,114 Wolseley 503,070 0.33
Pharmaceuticals & Biotechnology 27,045 Shire 1,182,678 0.76
Media 28,068 WPP 525,714 0.34
Travel & Leisure 16,122 Wizz Air Holdings 291,325 0.19
Hong Kong (31/07/16 – 0.58%) 0.37 Chemicals 6,236,000 Tianhe Chemicals Group+ – 0.00
Food Producers 378,708 China Mengniu Dairy 571,131 0.37
Japan (31/07/16 – 4.92%) 3.42 Leisure Goods 57,285 Yamaha 1,392,901 0.90
Pharmaceuticals & Biotechnology 24,232 Shionogi 929,030 0.60
General Retailers 29,270 Seven and I Holdings 932,669 0.60
9

Portfolio of investments
Investments held at 31 January 2017 Market Percentage of value total net assets Holding Investment £ %
Travel & Leisure 53,909 Resort Trust 792,965 0.52
Real Estate Investment Services 66,944 Mitsui Fudosan 1,237,856 0.80
Singapore (31/07/16 – 1.39%) 1.16 Technology Hardware & Equipment 11,022 Broadcom 1,796,758 1.16
South Korea (31/07/16 – 1.76%) 1.76 Fixed Line Telecommunications 36,914 KT 748,124 0.48
Technology Hardware & Equipment 1,449 Samsung Electronics 1,974,103 1.28
Papua New Guinea (31/07/16 – 0.74%) 0.00
Bermuda (31/07/16 – 0.46%) 0.00 Portfolio of investments 151,344,851 97.94 Net other assets 3,179,693 2.06
Net assets 154,524,544 100.00
All investments are listed on recognised stock exchanges and are “approved securities” within the meaning of the FCA rules unless otherwise stated.
~ADR – American Depositary Receipt +This stock is currently suspended from trading and has been valued by the Manager based on information available as at 31 January 2017. ^The Kenmare Resources warrants are not listed and have an exercise price of 29.09p.
10

11
Purchases Cost £UnitedHealth Group 1,628,556AIG 1,583,654Yamaha 1,468,532Veolia Environnement 1,416,059Ctrip ADR 1,391,797Pandora 1,358,269Salesforce.com 1,273,989Devon Energy 1,231,279McDonald’s 1,198,229JPMorgan Chase & Co. 1,168,133
Sales Proceeds £CVS Health 1,925,634Covestro 1,710,594Pfizer 1,612,499Amgen 1,603,079Mitsubishi UFJ Financial Group 1,505,279First Republic Bank 1,488,397Hewlett-Packard 1,274,094NMC Health 1,189,054Kumagi Gumi 1,164,726Misumi 1,127,299
Total purchases 35,688,907 Total sales 43,951,156
Top ten purchases and salesFor the half year ended 31 January 2017

12
Statistical information
Comparative tables Accumulation 31/01/17 31/07/16 31/07/15 31/07/14 pence pence pence penceChange in net assets per unitOpening net asset value per unit 183.77 171.45 156.42 145.18
Return before operating charges* 20.34 12.68 15.31 11.44Operating charges (0.22) (0.36) (0.28) (0.20)
Return after operating charges* 20.12 12.32 15.03 11.24
Distributions on accumulation units (1.53) (3.62) (3.56) (4.16)Retained distributions on accumulation units 1.53 3.62 3.56 4.16
Closing net asset value per unit 203.89 183.77 171.45 156.42
*after direct transaction costs of 0.15 0.16 0.32 0.08
PerformanceReturn after charges 10.95% 7.19% 9.61% 7.74%
Other informationClosing net asset value (£000) 154,525 147,266 151,890 152,257Closing number of units 75,789,933 80,137,698 88,591,719 97,337,702Operating charges 0.23% 0.22% 0.19% 0.19%Direct transaction costs 0.08% 0.10% 0.21% 0.08%
PricesHighest unit price (pence) 220.09 193.85 189.65 166.26Lowest unit price (pence) 180.60 147.33 144.27 135.80

13
Investment objective
The objective of the Fund is to provide a superior return over the longer term using theIA Flexible Investment benchmark. The Fund is a higher risk managed fund designedto provide speculative investors with exposure to worldwide securities markets in amanner designed to produce higher long term returns which can lead to short termvolatility. The Manager will take an aggressive approach to asset selection which will,for periods, lead to extremely heavy or nil allocation to some markets or assets classes.
Investment policy
The Fund will primarily invest in a range of worldwide equities. The Fund may holdcash and near cash assets where reasonably necessary to fund redemptions of units,for the efficient management of the Fund, or for purposes ancillary to the objectives ofthe Fund. It may borrow, providing such borrowing is on a temporary basis, and doesnot exceed the limits applicable to the Fund.
Revenue distribution and pricing
Units of the Fund are available as Accumulation units (where revenue is reinvested toenhance the unit price). There will be two potential distributions in each accountingyear: an interim distribution as at 31 January and a final distribution as at 31 July. Ateach distribution the net revenue after deduction of expenses, arising in the precedingsix months, from the investments of the Fund is apportioned amongst the unitholders.Unitholders receive a tax voucher giving details of the distribution and the Manager’sReport no later than two months after these dates.
Statistical information

14
Risk and reward profileThe Risk and Reward Indicator table demonstrates where the Fund ranks in terms of itspotential risk and reward. The higher the rank the greater the potential reward but thegreater the risk of losing money. It is based on past data, may change over time andmay not be a reliable indication of the future risk profile of the Fund. The shaded area inthe table below shows the Fund’s ranking on the Risk and Reward Indicator.
Typically lower rewards, Typically higher rewards, lower risk higher risk fi
1 2 3 4 5 6 7
This Fund is ranked at 5 because funds of this type have experienced medium to highrises and falls in value in the past. Although this is a high risk ranking it is not thehighest. The above figure relates to the following unit class:
• Accumulation
Please note that even the lowest risk class can lose you money and that extreme marketcircumstances can mean you suffer severe losses in all cases. Please note the Fund’srisk category may change in the future. The indicator does not take into account thefollowing risks of investing in this Fund:
• Investing overseas can bring additional returns and spread risk to different markets.There are risks, however, that changes in currency rates will reduce the value of yourinvestment.
• The Fund may use derivatives to reduce risk or cost or to generate additional capitalor income at low risk, or to meet its investment objective.
For more information on the Risk and Reward profiles of our Funds, please refer to themost up to date relevant fund and Unit Class Key Investor Information Documents(KIIDs). These are available online at www.phoenixunittrust.co.uk.
Directors’ statementThis report has been prepared in accordance with the requirements of the CollectiveInvestment Schemes Sourcebook as issued and amended by the Financial ConductAuthority.
17 March 2017 Craig Baker, Director Shamira Mohammed, Director
Statistical information
fi

15
Interim financial statements (unaudited)For the half year ended 31 January 2017
Statement of total return 31/01/17 31/01/16 £ £ £ £
Income
Net capital gains/(losses) 14,471,237 (11,001,804) Revenue 1,421,344 1,284,488
Expenses (160,086) (136,898)
Interest payable and similar charges (654) (88)
Net revenue before taxation 1,260,604 1,147,502
Taxation (61,193) (116,925)
Net revenue after taxation 1,199,411 1,030,577
Total return/(deficit) before distributions 15,670,648 (9,971,227)
Distributions (1,199,436) (1,133,966)
Change in unitholders’ funds from investment activities 14,471,212 (11,105,193)
Statement of change in unitholders’ funds 31/01/17 31/01/16* £ £ £ £
Opening net assets 147,265,896 151,889,975
Amounts receivable on issue of units – 3,698Amounts payable on cancellation of units (8,369,346) (7,416,213)
(8,369,346) (7,412,515)Change in unitholders’ funds from investment activities 14,471,212 (11,105,193)
Retained distributions on accumulation units 1,156,782 1,093,197
Closing net assets 154,524,544 134,465,464
*Please note that the comparative figures are for the comparative interim period. The brought forward net
assets for the current period do not, therefore equal the carried forward figure in the comparative.

16
Balance sheet 31/01/17 31/07/16 £ £ £ £
Assets:Fixed assets:Investments 151,344,851 145,188,277
Current assets:Debtors 235,846 897,874Cash and bank balances 3,170,120 1,937,690
Total current assets 3,405,966 2,835,564
Total assets 154,750,817 148,023,841
Liabilities:Creditors:Other creditors (226,273) (757,945)
Total liabilities (226,273) (757,945)
Net assets 154,524,544 147,265,896
Unitholders’ funds 154,524,544 147,265,896
Interim financial statements (unaudited)As at 31 January 2017
Notes to the interim financial statements
Accounting policies
The interim financial statements have been prepared under the historical cost basis, asmodified by the revaluation of investments and in compliance with FRS102 and inaccordance with the Statement of Recommended Practice (2014 SORP) for financialstatements of Authorised Funds issued by The Investment Association in May 2014.Unless otherwise stated all accounting policies applied are consistent with those of theAnnual Report for the year ended 31 July 2016 and are described in those financialstatements.

17
Interim distribution in pence per unitGroup 1: units purchased prior to 1 August 2016Group 2: units purchased 1 August 2016 to 31 January 2017
2017 2016 pence pence per unit per unit Net payable paid income Equalisation 31 Mar 31 Mar
Accumulation
Group 1 1.5263 — 1.5263 1.2999 Group 2 1.5263 0.0000 1.5263 1.2999
Equalisation
This applies only to units purchased during the distribution period (Group 2 units). It isthe average amount of revenue included in the purchase price of all Group 2 units andis refunded to the holders of these units as a return of capital. Being capital it is notliable to income tax but must be deducted from the cost of the units for capital gainstax purposes.
Distribution tableFor the half year ended 31 January 2017

18
Corporate information
The information in this report is designed to enable unitholders to make an informed judgement on the activities ofthe Fund during the period it covers and the results of those activities at the end of the period.
Phoenix Unit Trust Managers Limited is part of the Phoenix Group.
Ignis Investment Services Limited is part of the Standard Life Investments group (Standard Life Investments(Holdings) Limited) and its subsidiaries.
Unit prices appear daily on our website www.phoenixunittrust.co.uk
Remuneration
The Manager has adopted a remuneration policy, up-to-date details of which can be found onwww.phoenixunittrust.co.uk. These details describe how remuneration and benefits are calculated and identify thecommittee which oversees and controls the policy. A paper copy of these details can be requested free of chargefrom the Manager. Following the implementation of UCITS V in the UK on 18 March 2016, all authorised UCITSManagers are required to comply with the UCITS V Remuneration Code from the start of their next accounting year.Under the UCITS V Directive, the Manager is required to disclose information relating to the remuneration paid to itsstaff for the financial year, split into fixed and variable remuneration. The Manager’s Financial Year end is 31December, it is therefore anticipated that the Manager’s Remuneration Policy and associated financial disclosureswill be made within the Annual Reports starting from 31 December 2017, following its first full performance period.Prior to this date, and in line with the FCA’s guidance on the UCITS V remuneration disclosures, the Manager wouldbe part way through its first performance period and the information available would not be relevant or provide aproper basis for comparison.
Risk
The price of units and the income from them can go down as well as up and investors may not get back theamount they invested, particularly in the case of early withdrawal. Tax levels and reliefs are those currentlyapplicable and may change. The value of any tax relief depends on personal circumstances.
Depending on the fund, the value of your investment may change with currency movements.

19
Corporate information
ManagerPhoenix Unit Trust Managers Limited (PUTM)1 Wythall Green Way, Wythall, Birmingham, B47 6WGTel: 0330 1233 703Registered in England – No.03588031Authorised and regulated by the Financial ConductAuthority
DirectorsAndrew Moss PUTM Director, Chief Executive
Phoenix Life;Shamira Mohammed PUTM Director, Finance Director
Phoenix Life;Craig Baker PUTM Director, Head of Investment
Management Phoenix Life;Mike Urmston Non Executive Director of PUTM
Registrar and correspondence addressPhoenix Unit Trust Managers LimitedPO Box 12997ChelmsfordCM99 2ENAuthorised and regulated by the Financial ConductAuthority
Investment AdviserIgnis Investment Services Limited1 George StreetEdinburgh, EH2 2LLRegistered in Scotland – No.SC101825Authorised and regulated by the FinancialConduct Authority
Trustee National Westminster BankYounger Building, 1st Floor3 Redheughs Avenue Edinburgh EH12 9RHAuthorised by the Prudential Regulation Authority andregulated by the Financial Conduct Authority and thePrudential Regulation Authority
Independent Auditor to the FundErnst & Young LLPTen George StreetEdinburgh EH2 2DZ
Authorised statusThis Fund is an Authorised Unit Trust scheme undersection 243 of the Financial Services & Markets Act2000 and is categorised under the CollectiveInvestment Schemes Sourcebook as a UCITS fund.

20
Notes


B609.01.17
Telephone calls may be monitored and/or recorded for the purposes of security, internal training, accurate accountoperation, internal customer monitoring and to improve the quality of service.
Please note the Key Investor Information Document (KIID), the supplementary Information Document (SID) and thefull prospectus are available free of charge. These are available by contacting Client Services on 0330 1233 703.
Phoenix Unit Trust Managers Limited does not accept liability for any claims or losses of any nature arising directlyor indirectly from use of the data or material in this report. The information supplied is not intended to constituteinvestment, tax, legal or other advice.
Phoenix Unit Trust Managers Limited* is a Phoenix Group Company. Registered in England No 3588031.Registered office: 1 Wythall Green Way, Wythall, Birmingham B47 6WG.*Authorised and regulated by the Financial Conduct Authority.
Phoenix Unit Trust Managers Limited and its subsidiaries are part of the Phoenix Group (Phoenix Group plc and itssubsidiaries).
Contact: Client ServicesCall: 0330 1233 703Correspondence Address: PO Box 12997 Chelmsford CM99 2ENVisit: phoenixunittrust.co.uk