phoenix unit trust managers manager’s interim report/media/files/p/... · welcome to the putm...
TRANSCRIPT

PHOENIX UNIT TRUST MANAGERS
MANAGER’S INTERIM REPORTFor the half year: 1 September 2016 to 28 February 2017
PUTM BOTHWELL EMD UNCONSTRAINED FUND

1
Contents
Investment review 2-3
Portfolio of investments 4-10
Top ten purchases and sales 11
Statistical information 12-15
Statements of total return & change in unitholders’ funds 16
Balance sheet 17
Distribution tables 18
Corporate information 19-20

2
Dear Investor
Welcome to the PUTM Bothwell Emerging Market DebtUnconstrained Fund interim report for the six months to28 February 2017.
Performance Review
Over the review period the PUTM Bothwell EmergingMarket Debt Unconstrained Fund returned 1.1%.(Source: HSBC, Gross of AMC, GBP, based upon themovement in the Cancellation Price for six months to28/02/17). This was compared to its benchmark indexwhich returned -0.5%. (Source: Datastream, 50% JPMEMBI Global Diversified, 50% JPM GBI-EM GlobalDiversified, Total Return, for six months to 28/02/17).
In the table below you can see how the Fund performedagainst its benchmark index. As the Fund was launchedon 1 July 2015, it has a limited performance history.
Investment review
Source: Fund performance is HSBC, Gross of AMC, GBP, based upon the movement in the Cancellation Price to endFebruary for each year. Benchmark Index performance is Datastream, JPM EMBI Global Diversified, 50% JPM GBI-EMGlobal Diversified, Total Return, to end February for each year.
Past performance is not a guide to future performance.
The value of units and the income from them can go down as well as up and is not guaranteed. You may not get backthe full amount invested.
Please note that all past performance figures are calculated without taking the initial charge into account.
Standardised Past Performance
PUTM Bothwell Emerging Market DebtUnconstrained Fund 13.8 – – – –
Benchmark Index 12.1 – – – –
Feb 16-17 Feb 15-16 Feb 14-15 Feb 13-14 Feb 12-13% growth % growth % growth % growth % growth

3
Portfolio and Market Review
Emerging market (EM) bond markets were generallydominated by events in the US. These included thepresidential election, both its anticipation and its result,generally improving economic data and the rate hike bythe Federal Reserve in December.
The prevailing market environment helped portfolioperformance relative to the benchmark. A largeunderweight exposure to Turkey contributed to excessreturns. Turkey has a large funding requirement, so isadversely affected by tighter monetary conditions in theUS. The manager remains cautious on Turkey due to largeexternal imbalances, rapid credit growth and the uncertainpolitical environment. The Fund is overweight inIndonesia, where the political environment is increasinglyfavourable, and in Serbia, where fiscal and current accountdeficits are being well received by investors. Despiteadding some exposure to long duration currency bonds,the portfolio retains an underweight position in SouthAfrica, given caution on the political outlook.
Market Outlook and Fund Strategy
Broadly speaking, we remain positive on EM bond andcurrency markets. Our conviction in this has increased inthe past month as hard data has shown a very rapidimprovement in global trade so far this year that is coupledwith generally still moderate outlook for domesticallygenerated growth across most emerging markets. Thismix, with growing trade supporting currencies anddomestic demand still modest, reducing the need forimmediate rate hikes even with the recovery and thereforesupporting bond valuations relative to core markets, is agood one for EM fixed income.
Investment review

4
Portfolio of investments
Investments held at 28 February 2017 Market Percentage of value total net assets Holding Investment £000 %
Argentina (31/08/16 – 0.82%) 1.69 Corporate Bonds (31/08/16 – 0.82%) USD 2,105,000 Cablevision SA/Argentina 6.5% 15/06/2021 1,778 0.39
Government Bonds (31/08/16 – 0.00%) USD 7,300,000 Argentina (Government of) 5.625% 26/01/2022 5,925 1.30
Bermuda (31/08/16 – 0.00%) 0.35 USD 2,074,000 Bermuda (Government of) 3.717% 25/01/2027 1,601 0.35
Brazil (31/08/16 – 3.56%) 5.60 Government Bonds (31/08/16 – 3.56%) BRL 16,825 Brazil Notas do Tesouro Nacional 10% 01/01/2025 4,304 0.95 BRL 30,520 Nota Do Tesouro Nacional 10% 01/01/2021 7,872 1.73
Government Index-Linked (31/08/16 – 0.00%) BRL 15,550 Brazil (Republic of) 6% 15/05/2045 13,260 2.92
Channel Islands (31/08/16 – 0.55%) 0.25 Government Bonds (31/08/16 – 0.55%) USD 1,478,000 Ivory Coast (Government of) 5.375% 23/07/2024 1,151 0.25
Chile (31/08/16 – 0.00%) 3.62 Government Bonds (31/08/16 – 0.00%) CLP 13,155,000,000 Chile (Republic of) 4.5% 28/02/2021 16,426 3.62
Colombia (31/08/16 – 8.62%) 4.18 Corporate Bonds (31/08/16 – 0.36%) USD 2,311,000 Colombia Telecomunicaciones S.A E.S.P 8.5% VRN 29/12/2049 1,708 0.38
Government Bonds (31/08/16 – 8.26%) COP 13,071,100,000 Colombia (Republic of) 10% 24/07/2024 4,260 0.94
Government Index-Linked (31/08/16 – 0.00%) COP 186,919,000 Colombian (Republic of) 3.5% 10/03/2021 12,991 2.86
Croatia (31/08/16 – 1.70%) 1.61 Government Bonds (31/08/16 – 1.70%) USD 8,252,000 Croatia (Government of) 6% 26/01/2024 7,321 1.61
Dominican Republic (31/08/16 – 4.69%) 4.16 Corporate Bonds (31/08/16 – 0.00%) USD 1,100,000 Aeropuertos Dominicanos 6.75% 30/03/2029 923 0.20
Government Bonds (31/08/16 – 4.69%) DOP 583,400,000 Dominican (Republic of) 15.95% 04/06/2021 11,835 2.61 USD 7,400,000 Dominican (Republic of) 5.95% 25/01/2027 6,125 1.35
Egypt (31/08/16 – 2.25%) 2.92 Government Bonds (31/08/16 – 2.25%) USD 6,292,000 Arab (Republic of) Egypt 5.875% 11/06/2025 4,965 1.09 USD 3,700,000 Egypt (Republic of) 6.125% 31/01/2022 3,088 0.68 USD 6,000,000 Egypt (Republic of) 8.50% 31/01/2047 5,231 1.15

5
Portfolio of investments
Investments held at 28 February 2017 Market Percentage of value total net assets Holding Investment £000 %
India (31/08/16 – 1.29%) 2.03 Corporate Bonds (31/08/16 – 1.25%) USD 11,601,000 Export - Import Bank of India 3.375% 05/08/2026 9,012 1.98
Government Bonds (31/08/16 – 0.04%) INR 18,000,000 India (Republic of) 7.28% 03/06/2019 220 0.05
Indonesia (31/08/16 – 11.15%) 11.69 Government Bonds (31/08/16 – 11.15%) IDR 232,907,000,000 Indonesia (Government of) 7.875% 15/04/2019 14,286 3.15 IDR 130,250,000,000 Indonesia (Government of) 8.375% 15/03/2024 8,241 1.81 IDR 206,220,000,000 Indonesia (Government of) 8.375% 15/09/2026 13,200 2.91 IDR 47,166,000,000 Indonesia (Government of) 9% 15/03/2029 3,067 0.68 IDR 18,717,000,000 Indonesia (Government of) 6.625% 15/05/2033 980 0.22 USD 3,388,000 Indonesia (Government of) 5.25% 17/01/2042 2,891 0.64 USD 1,365,000 Indonesia (Government of) 5.125% 15/01/2045 1,148 0.25 USD 11,075,000 Perusahaan Penerbit SBSN 4.55% 29/03/2026 9,222 2.03
Ivory Coast (31/08/16 – 2.42%) 1.06 Government Bonds (31/08/16 – 2.42%) USD 6,484,000 Ivory Coast 5.75% 31/12/2032 4,800 1.06
Jamaica (31/08/16 – 3.31%) 2.44 Government Bonds (31/08/16 – 3.31%) USD 8,648,000 Jamaica (Government of) 8% 15/03/2039 8,027 1.77 USD 3,313,000 Jamaica (Government of) 7.875% 28/07/2045 3,049 0.67
Jordan (31/08/16 – 2.67%) 2.58 Government Bonds (31/08/16 – 2.67%) USD 14,251,000 Jordan (Kingdom of) 6.125% 29/01/2026 11,725 2.58
Lebanon (31/08/16 – 2.35%) 1.46 Government Bonds (31/08/16 – 2.35%) USD 8,239,000 Lebanese (Republic of) 6% 27/01/2023 6,622 1.46
Luxembourg (31/08/16 – 0.00%) 1.07 Corporate Bonds (31/08/16 – 0.00%) USD 5,894,000 Sberbank (SB Capital SA) 5.25% 23/05/2023 4,841 1.07
Malaysia (31/08/16 – 6.70%) Government Bonds (31/08/16 - 6.70%) 4.90 MYR 31,029,000 Malaysia (Government of) 3.314% 31/10/2017 5,623 1.24 MYR 31,690,000 Malaysia (Government of) 3.795% 30/09/2022 5,710 1.26 MYR 51,170,000 Malaysia (Government of) 4.254% 31/05/2035 8,846 1.95 MYR 11,332,000 Malaysia (Government of) 4.736% 15/03/2046 2,066 0.45
Mexico (31/08/16 – 8.10%) 6.18 Corporate Bonds (31/08/16 – 4.75%) USD 5,089,000 Petroleos Mexicanos 6.875% 04/08/2026 4,477 0.99
Government Bonds (31/08/16 – 0.00%) MXN 5,614,000 Mexico (State of) 8% 07/12/2023 23,570 5.19

6
Portfolio of investments
Investments held at 28 February 2017 Market Percentage of value total net assets Holding Investment £000 %
Government Index-Linked (31/08/16 – 3.35%)
Morocco (31/08/16 – 0.00%) 1.49 Government Bonds (31/08/16 – 0.00%) USD 8,127,000 Morocco (Government of) 4.25% 11/12/2022 6,783 1.49
Netherlands (31/08/16 – 1.90%) 2.62 Corporate Bonds (31/08/16 – 1.90%) USD 5,380,000 Equate Petrochemical BV 3% 03/03/2022 4,196 0.92 USD 4,979,000 Petrobras Global Finance 6.25% 17/03/2024 4,065 0.90 USD 3,979,000 Petrobras Global Finance 8.75% 23/05/2026 3,629 0.80
Nigeria (31/08/16 – 1.67%) 1.54 Government Bonds (31/08/16 – 1.67%) USD 8,235,000 Nigeria (Republic of) 7.875% 16/02/2032 6,972 1.54
Other African (31/08/16 – 0.00%) Government Bonds (31/08/16 – 0.00%) 1.02 USD 5,690,000 Senegal (Republic of) 6.25% 30/07/2024 4,620 1.02
Other Caribbean (31/08/16 – 2.39%) 2.83 Government Bonds (31/08/16 – 2.39%) USD 11,594,000 Honduras (Government of) 7.5% 15/03/2024 10,257 2.26 USD 3,200,000 Honduras (Government of) 6.25% 19/01/2027 2,601 0.57
Panama (31/08/16 – 0.00%) 1.97 Government Bonds (31/08/16 – 0.00%) USD 3,926,000 Panama (Republic of) 8.875% 30/09/2027 4,441 0.98 USD 3,819,000 Panama (Republic of) 9.375% 01/04/2029 4,491 0.99
Paraguay (31/08/16 – 2.80%) 2.60 Government Bonds (31/08/16 – 2.80%) USD 5,028,000 Paraguay (Republic of) 4.625% 25/01/2023 4,162 0.92 USD 9,166,000 Paraguay (Republic of) 6.1% 11/08/2044 7,624 1.68
Peru (31/08/16 – 4.92%) 1.13 Government Bonds (31/08/16 – 4.92%) PEN 3,297,000 Peru (Republic of) 8.2% 12/08/2026 936 0.21 PEN 16,907,000 Peru (Republic of) 6.35% 12/08/2028 4,195 0.92
Poland (31/08/16 – 5.07%) 4.93 Government Bonds (31/08/16 – 5.07%) PLN 110,832,000 Poland (Government of) 3.25% 25/07/2019 22,409 4.93
Russia (31/08/16 – 0.00%) 3.25 Government Bonds (31/08/16 – 0.00%) RUB 1,111,000,000 Russia (Government of) 6.7% 15/05/2019 14,765 3.25
Serbia (31/08/16 – 3.22%) 1.61 Government Bonds (31/08/16 – 3.22%) USD 8,000,000 Serbia (Government of) 7.25% 28/09/2021 7,295 1.61
South Africa (31/08/16 – 0.00%) 3.27 Government Bonds (31/08/16 – 0.00%) ZAR 293,000,000 South Africa (Government of) 7% 28/02/2031 14,845 3.27

7
Portfolio of investments
Investments held at 28 February 2017 Market Percentage of value total net assets Holding Investment £000 %
Sweden (31/08/16 – 1.12%) 1.06 Corporate Bonds (31/08/16 – 1.12%) USD 5,665,000 PKO Finance AB 4.63% 26/09/2022 4,814 1.06
Thailand (31/08/16 – 1.81%) 2.99 Government Index-Linked (31/08/16 – 1.81%) THB 613,839,000 Thailand (Government of) 1.2% 12/03/2028 13,577 2.99
Ukraine (31/08/2016 – 3.17%) 1.89 Government Bonds (31/08/16 – 3.17%) USD 7,474,000 Ukraine (Government of) 7.75% 01/09/2019 6,026 1.33 USD 1,682,000 Ukraine (Government of) 7.75% 01/09/2023 1,291 0.28 USD 1,733,000 Ukraine (Government of) 7.75% 01/09/2026 1,291 0.28
Vietnam (31/08/16 – 0.00%) 1.94 Government Bonds (31/08/16 – 0.00%) USD 4,925,000 Vietnam (Socialist Republic of) 6.75% 29/01/2020 4,331 0.95 USD 5,500,000 Vietnam (Socialist Republic of) 4.8% 19/11/2024 4,505 0.99
Forward Foreign Exchange Contracts (31/08/16 – (9.37%)) (0.31) GBP 130,000,000 GBP Forward Currency Contract 02/03/2017 130,000 28.62 (USD 162,376,071) USD Forward Currency Contract 02/03/2017 (130,478) (28.73) GBP 130,398,054 GBP Forward Currency Contract 02/03/2017 130,398 28.71 (USD 162,855,004) USD Forward Currency Contract 02/03/2017 (130,863) (28.81) GBP 135,000,000 GBP Forward Currency Contract 02/03/2017 135,000 29.72 (USD 168,691,478) USD Forward Currency Contract 02/03/2017 (135,553) (29.85) USD 6,851,268 USD Forward Currency Contract 02/03/2017 5,505 1.21 (GBP 5,502,076) GBP Forward Currency Contract 02/03/2017 (5,502) (1.21) GBP 4,706,066 GBP Forward Currency Contract 02/03/2017 4,706 1.04 (USD 5,986,009) USD Forward Currency Contract 02/03/2017 (4,810) (1.06) GBP 25,000,000 GBP Forward Currency Contract 02/03/2017 25,000 5.50 (USD 31,033,525) USD Forward Currency Contract 02/03/2017 (24,937) (5.49) USD 5,787,749 USD Forward Currency Contract 02/03/2017 4,651 1.02 (GBP 4,681,221) GBP Forward Currency Contract 02/03/2017 (4,681) (1.03) USD 887,552 USD Forward Currency Contract 02/03/2017 713 0.16 (GBP 724,000) GBP Forward Currency Contract 02/03/2017 (724) (0.16) GBP 4,682,964 GBP Forward Currency Contract 02/03/2017 4,683 1.03 (USD 5,767,709) USD Forward Currency Contract 02/03/2017 (4,635) (1.02) USD 4,095,600 USD Forward Currency Contract 02/03/2017 3,291 0.72 (GBP 3,350,560) GBP Forward Currency Contract 02/03/2017 (3,350) (0.74) USD 4,230,971 USD Forward Currency Contract 02/03/2017 3,400 0.75 (GBP 3,469,867) GBP Forward Currency Contract 02/03/2017 (3,470) (0.76) THB 554,631,125 THB Forward Currency Contract 26/04/2017 12,743 2.81 (USD 15,704,367) USD Forward Currency Contract 26/04/2017 (12,602) (2.77) TRY 4,942,048 TRY Forward Currency Contract 26/04/2017 1,076 0.24 (USD 1,273,949) USD Forward Currency Contract 26/04/2017 (1,022) (0.23) USD 22,758,068 USD Forward Currency Contract 26/04/2017 18,262 4.02 (TRY 88,285,715) TRY Forward Currency Contract 26/04/2017 (19,214) (4.23) INR 2,327,784,000 INR Forward Currency Contract 26/04/2017 27,764 6.11 (USD 33,821,780) USD Forward Currency Contract 26/04/2017 (27,141) (5.98)

8
Portfolio of investments
Investments held at 28 February 2017 Market Percentage of value total net assets Holding Investment £000 %
Forward Foreign Exchange Contracts (continued) USD 4,786,438 USD Forward Currency Contract 26/04/2017 3,841 0.85 (MYR 21,462,390) MYR Forward Currency Contract 26/04/2017 (3,867) (0.85) USD 15,292,870 USD Forward Currency Contract 26/04/2017 12,272 2.70 (PHP 768,772,550) PHP Forward Currency Contract 26/04/2017 (12,256) (2.70) AUD 8,366,474 AUD Forward Currency Contract 26/04/2017 5,155 1.14 (USD 6,301,628) USD Forward Currency Contract 26/04/2017 (5,057) (1.11) PLN 56,550,000 PLN Forward Currency Contract 26/04/2017 11,166 2.46 (EUR 12,872,008) EUR Forward Currency Contract 26/04/2017 (11,005) (2.42) HUF 5,900,000,000 HUF Forward Currency Contract 26/04/2017 16,341 3.60 (USD 20,502,143) USD Forward Currency Contract 26/04/2017 (16,452) (3.62) USD 2,886,202 USD Forward Currency Contract 26/04/2017 2,316 0.51 (HUF 830,576,300) HUF Forward Currency Contract 26/04/2017 (2,301) (0.51) JPY 672,209,600 JPY Forward Currency Contract 26/04/2017 4,833 1.06 (USD 5,960,659) USD Forward Currency Contract 26/04/2017 (4,783) (1.05) SGD 8,944,640 SGD Forward Currency Contract 26/04/2017 5,134 1.13 (USD 6,295,323) USD Forward Currency Contract 26/04/2017 (5,052) (1.11) USD 15,854,301 USD Forward Currency Contract 26/04/2017 12,723 2.80 (CLP 10,516,158,000) CLP Forward Currency Contract 26/04/2017 (12,946) (2.85) BRL 54,958,290 BRL Forward Currency Contract 26/04/2017 13,990 3.08 (USD 16,654,027) USD Forward Currency Contract 26/04/2017 (13,364) (2.94) USD 31,360,096 USD Forward Currency Contract 26/04/2017 25,165 5.54 (CNY 217,889,950) CNY Forward Currency Contract 26/04/2017 (25,340) (5.58) PEN 53,731,500 PEN Forward Currency Contract 26/04/2017 13,126 2.89 (USD 15,880,449) USD Forward Currency Contract 26/04/2017 (12,743) (2.81) USD 31,168,282 USD Forward Currency Contract 26/04/2017 25,011 5.51 (CNY 216,479,300) CNY Forward Currency Contract 26/04/2017 (25,176) (5.54) EUR 23,654,050 EUR Forward Currency Contract 26/04/2017 20,224 4.45 (USD 25,323,979) USD Forward Currency Contract 26/04/2017 (20,321) (4.47) ILS 51,917,093 ILS Forward Currency Contract 26/04/2017 11,463 2.52 (USD 13,650,000) USD Forward Currency Contract 26/04/2017 (10,954) (2.41) USD 13,650,000 USD Forward Currency Contract 26/04/2017 10,954 2.41 (MXN 303,844,905) MXN Forward Currency Contract 26/04/2017 (12,092) (2.66) USD 19,741,581 USD Forward Currency Contract 26/04/2017 15,842 3.49 (CLP 13,155,000,000) CLP Forward Currency Contract 26/04/2017 (16,195) (3.57) KZT 2,760,849,000 KZT Forward Currency Contract 26/04/2017 6,950 1.53 (USD 8,190,000) USD Forward Currency Contract 26/04/2017 (6,572) (1.45) KZT 1,806,940,000 KZT Forward Currency Contract 26/04/2017 4,549 1.00 (USD 5,379,399) USD Forward Currency Contract 26/04/2017 (4,317) (0.95) ILS 52,402,413 ILS Forward Currency Contract 26/04/2017 11,570 2.55 (USD 13,880,000) USD Forward Currency Contract 26/04/2017 (11,138) (2.45) GBP 7,285,476 GBP Forward Currency Contract 02/03/2017 7,285 1.60 (USD 9,169,121) USD Forward Currency Contract 02/03/2017 (7,368) (1.62) GBP 11,146,120 GBP Forward Currency Contract 02/03/2017 11,146 2.45 (USD 14,072,144) USD Forward Currency Contract 02/03/2017 (11,308) (2.49) KZT 1,850,925,000 KZT Forward Currency Contract 26/04/2017 4,659 1.03 (USD 5,550,000) USD Forward Currency Contract 26/04/2017 (4,454) (0.98) USD 6,940,000 USD Forward Currency Contract 26/04/2017 5,569 1.23 (RUB 427,851,000) RUB Forward Currency Contract 26/04/2017 (5,791) (1.28)

9
Portfolio of investments
Investments held at 28 February 2017 Market Percentage of value total net assets Holding Investment £000 %
Forward Foreign Exchange Contracts (continued) MXN 298,293,757 MXN Forward Currency Contract 26/04/2017 11,872 2.61 (USD 14,347,737) USD Forward Currency Contract 26/04/2017 (11,513) (2.53) RUB 417,718,600 RUB Forward Currency Contract 26/04/2017 5,653 1.24 (USD 6,940,000) USD Forward Currency Contract 26/04/2017 (5,569) (1.23) IDR 186,241,840,000 IDR Forward Currency Contract 26/04/2017 11,132 2.45 (USD 13,880,000) USD Forward Currency Contract 26/04/2017 (11,138) (2.45) GBP 5,690,973 GBP Forward Currency Contract 02/03/2017 5,691 1.25 (USD 7,108,470) USD Forward Currency Contract 02/03/2017 (5,712) (1.26) USD 27,405,623 USD Forward Currency Contract 26/04/2017 21,992 4.84 (ILS 102,679,277) ILS Forward Currency Contract 26/04/2017 (22,671) (4.99) USD 17,255,892 USD Forward Currency Contract 26/04/2017 13,847 3.05 (BRL 54,958,290) BRL Forward Currency Contract 26/04/2017 (13,990) (3.08) EUR 13,050,402 EUR Forward Currency Contract 26/04/2017 11,158 2.46 (PLN 56,550,000) PLN Forward Currency Contract 26/04/2017 (11,166) (2.46) GBP 10,000,000 GBP Forward Currency Contract 02/03/2017 10,000 2.20 (USD 12,497,306) USD Forward Currency Contract 02/03/2017 (10,042) (2.21) TRY 31,778,117 TRY Forward Currency Contract 26/04/2017 6,916 1.52 (USD 8,330,000) USD Forward Currency Contract 26/04/2017 (6,684) (1.47) ILS 105,281,563 ILS Forward Currency Contract 26/04/2017 23,245 5.12 (USD 28,150,000) USD Forward Currency Contract 26/04/2017 (22,589) (4.97) BRL 88,179,875 BRL Forward Currency Contract 26/04/2017 22,447 4.94 (USD 28,150,000) USD Forward Currency Contract 26/04/2017 (22,589) (4.97) PEN 46,027,520 PEN Forward Currency Contract 26/04/2017 11,244 2.48 (USD 14,080,000) USD Forward Currency Contract 26/04/2017 (11,299) (2.49) EGP 59,699,200 EGP Forward Currency Contract 26/04/2017 2,833 0.62 (USD 3,520,000) USD Forward Currency Contract 26/04/2017 (2,825) (0.62) THB 492,729,600 THB Forward Currency Contract 26/04/2017 11,321 2.49 (USD 14,080,000) USD Forward Currency Contract 26/04/2017 (11,299) (2.49) USD 555,630,356 USD Forward Currency Contract 02/03/2017 446,480 98.31 (GBP 446,181,929) GBP Forward Currency Contract 02/03/2017 (446,182) (98.24) GBP 446,181,929 GBP Forward Currency Contract 02/06/2017 446,182 98.24 (USD 556,895,282) USD Forward Currency Contract 02/06/2017 (446,398) (98.29) TRY 50,990,011 TRY Forward Currency Contract 26/04/2017 11,097 2.44 (USD 14,037,554) USD Forward Currency Contract 26/04/2017 (11,265) (2.48) USD 6,328,152 USD Forward Currency Contract 26/04/2017 5,078 1.12 (SGD 8,944,640) SGD Forward Currency Contract 26/04/2017 (5,134) (1.13) USD 5,953,716 USD Forward Currency Contract 26/04/2017 4,778 1.05 (JPY 672,209,600) JPY Forward Currency Contract 26/04/2017 (4,833) (1.06) USD 6,426,712 USD Forward Currency Contract 26/04/2017 5,157 1.14 (AUD 8,366,474) AUD Forward Currency Contract 26/04/2017 (5,155) (1.14) USD 25,014,742 USD Forward Currency Contract 26/04/2017 20,074 4.42 (EUR 23,654,050) EUR Forward Currency Contract 26/04/2017 (20,224) (4.45) CNY 434,369,250 CNY Forward Currency Contract 26/04/2017 50,517 11.12 (USD 62,849,593) USD Forward Currency Contract 26/04/2017 (50,434) (11.10) PEN 45,818,348 PEN Forward Currency Contract 26/04/2017 11,193 2.46 (USD 13,971,564) USD Forward Currency Contract 26/04/2017 (11,212) (2.47) USD 13,942,704 USD Forward Currency Contract 26/04/2017 11,188 2.46 (CLP 9,093,013,000) CLP Forward Currency Contract 26/04/2017 (11,194) (2.46)

10
Portfolio of investments
Investments held at 28 February 2017 Market Percentage of value total net assets Holding Investment £000 %
Credit Default Swaps (31/08/16 – (0.07%)) 0.19 USD 34,370,000 Barclays 1% 20/12/2021 27,620 6.08 (USD 34,370,000) Barclays 1% 20/12/2021 (27,818) (6.12) USD 30,075,000 Barclays 1% 20/12/2021 24,249 5.34 (USD 30,075,000) Barclays 1% 20/12/2021 (24,168) (5.32) USD 14,473,684 Goldman Sachs 1% 20/12/2021 11,631 2.56 (USD 14,473,684) Goldman Sachs 1% 20/12/2021 (10,930) (2.41) USD 30,075,000 HSBC 1% 20/12/2021 24,168 5.32 (USD 30,075,000) HSBC 1% 20/12/2021 (24,469) (5.39) USD 13,026,316 HSBC 1% 20/12/2021 10,468 2.30 (USD 13,026,316) HSBC 1% 20/12/2021 (9,837) (2.17)
Guatemala (31/08/16 – 1.26%)
Kazakhstan (31/08/16 – 1.50%)
Kenya (31/08/16 – 1.62%)
Philippines (31/08/16 – 1.76%)
Venezuela (31/08/16 – 1.25%) Portfolio of investments^ 426,042 93.81 Net other assets 28,135 6.19
Net assets 454,177 100.00
All investments with the exception of Forward Foreign Exchange Contracts andCredit Default Swaps are listed on recognised stock exchanges and are ‘approvedsecurities’ within the meaning of the FCA rules unless otherwise stated.The counterparties for the Forward Foreign Exchange Contracts areCitibank, Deutsche Bank, Goldman Sachs, HSBC, Barclays and Morgan Stanley.^ Includes investment liabilities.
Credit Ratings £000 %Investment grade 164,664 38.61Non-investment grade 175,004 41.03Unrated 86,840 20.36
Total investment in bonds 426,508 100.00

11
Purchases Cost £000MMexico (State of) 8% 07/12/2023 28,464Poland (Government of) 3.25% 25/07/2019 24,152Chile (Republic of) 4.5% 28/02/2021 16,615South Africa (Government of) 7%28/02/2031 15,350Russia (Government of) 6.7% 15/05/2019 14,984Colombian (Republic of) 3.5% 10/03/2021 14,574Brazil (Republic of) 6% 15/05/2045 13,511Malaysia (Government of) 4.254%31/05/2035 10,730Export - Import Bank of India 3.375%05/08/2026 8,691Indonesia (Government of) 8.375%15/03/2024 8,547
Sales Proceeds £000Poland (Government of) 3.25% 25/07/2025 27,942Colombia (Republic of) 10% 24/07/2024 25,868Mexican Udibonos 2% 09/06/2022 19,749Brazil Notas do Tesouro Nacional 10%01/01/2025 18,759Malaysia Sukuk Global Berhad 3.179%27/04/2026 17,963Titulos de Tesoreria 7.75% 18/09/2030 14,638Peru (Republic of) 8.2% 12/08/2026 14,581Peru (Republic of) 6.95% 12/08/2031 13,378Petroleos Mexicanos 6.375% 04/02/2021 12,380Serbia (Government of) 7.25% 28/09/2021 11,888
Total purchases 290,082 Total sales 408,450
Top ten purchases and salesFor the half year ended 28 February 2017
12
Statistical information
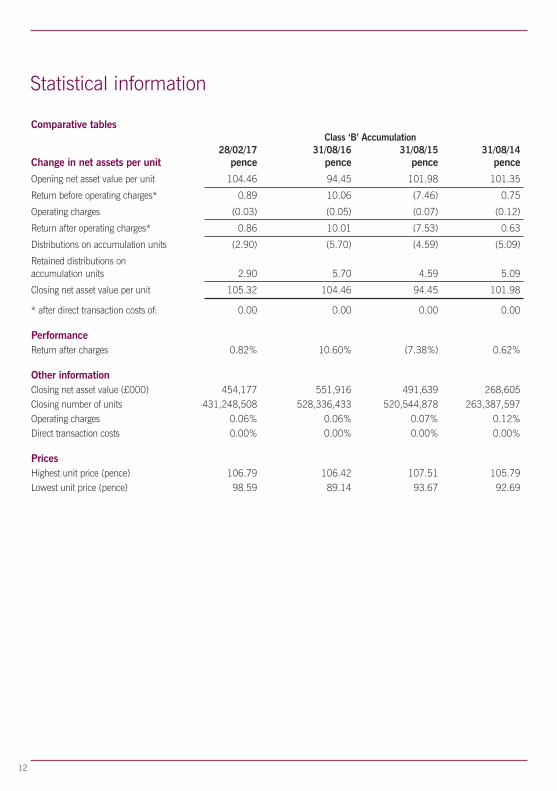
Comparative tables Class ‘B’ Accumulation 28/02/17 31/08/16 31/08/15 31/08/14Change in net assets per unit pence pence pence pence
Opening net asset value per unit 104.46 94.45 101.98 101.35
Return before operating charges* 0.89 10.06 (7.46) 0.75
Operating charges (0.03) (0.05) (0.07) (0.12)
Return after operating charges* 0.86 10.01 (7.53) 0.63
Distributions on accumulation units (2.90) (5.70) (4.59) (5.09)
Retained distributions onaccumulation units 2.90 5.70 4.59 5.09
Closing net asset value per unit 105.32 104.46 94.45 101.98
* after direct transaction costs of: 0.00 0.00 0.00 0.00
PerformanceReturn after charges 0.82% 10.60% (7.38%) 0.62%
Other informationClosing net asset value (£000) 454,177 551,916 491,639 268,605Closing number of units 431,248,508 528,336,433 520,544,878 263,387,597Operating charges 0.06% 0.06% 0.07% 0.12%Direct transaction costs 0.00% 0.00% 0.00% 0.00%
PricesHighest unit price (pence) 106.79 106.42 107.51 105.79Lowest unit price (pence) 98.59 89.14 93.67 92.69

13
Investment objective
The investment objective of the Fund is to provide returns from capital appreciation,emerging foreign currency movements and income by investing in emerging marketbonds or taking long or short net exposure to foreign currency exchange and financialderivative instruments.
Investment policy
The investment policy of the Fund is to invest in, or take exposure to, a portfolio ofbonds that are issued by governments, quasi-government entities or corporations inemerging markets countries and emerging market currencies or which, in the opinionof the Manager, carry out a substantial part of their operations in emerging marketcountries. The Fund will hold a varying proportion of the portfolio directly but will alsohave the ability to gain exposure to the markets by indirect means, which will beachieved by the use of appropriate derivative instruments.
Additionally, the Fund will seek to generate positive returns by taking views of the ratesor spread of a particular issuer, the shape of an issuer’s yield curve or a country’s ratescurve, the level of a country’s exchange rate, or the spread between such levels,amongst other opportunities.
It is often the case that movements in commodity prices, the bonds issued by G10countries, currencies and stock indices drive emerging market debt movements, andtrading these developed market instruments or their derivatives can represent cheapand liquid hedges to emerging market debt portfolio positions. The Fund may transactin these areas and also in any other markets and countries that they considerappropriate to gain the necessary exposure to meet the Fund's objectives. As a result,trading may occur in an instrument traded on a particular eligible market in order togain underlying exposure to an emerging market.
The Fund will not be constrained by any index weightings and will not concentrate onany particular country or sector or have regard to market capitalisation.
Active exposures to Emerging Market issuers, rates and foreign exchange will beachieved through exposure to physical instruments or over-the-counter derivativessuch as credit default swaps, credit linked notes, global depositary notes, interest rateswaps, deliverable or non-deliverable forward foreign exchange contracts, futures andoptions. Long exposure may be held through a combination of direct investment insecurities and/or derivatives. Short exposure will be taken through derivative positions.
The Fund may use one or more counterparties for gaining exposure to over-the-counterfinancial derivatives. In all circumstances, however, the Fund will comply with theinvestment restrictions and limits set out in the Prospectus.
Substantial cash holdings of up to 100% of the portfolio may arise as a balance to thedesired exposures being achieved through derivatives. In order to pursue itsinvestment policy, the Fund may also invest the Fund's assets in near cash, deposits,warrants and/or money market instruments and collective investment schemes (anduse may be made of stocklending (including repos) and borrowing). In addition, theFund will use derivative and forward transactions for the purpose of efficient portfoliomanagement as well as for the purpose of actively achieving market exposure in
Statistical information

furtherance of the Fund's performance objectives. The Fund will seek to minimise theimpact of exchange rate fluctuations between the operating currency of the portfolio, USDollars, and the base currency, Sterling, through currency hedging. This includesinvestments in other currencies that are made with regards to the operating currency.Currency hedging is a process that aims to lower the risk from exchange rate movementson the Fund.
Revenue distribution and pricing
Units of the Fund are available as Class ‘B’ Accumulation units (where revenue isreinvested to enhance the unit price). There will be two potential distributions in eachaccounting year: an interim distribution as at the last day of February and a finaldistribution as at 31 August. At each distribution the net revenue after deduction ofexpenses, arising in the preceding six months from the investments of the Fund isapportioned amongst the unitholders. Unitholders receive a tax voucher giving details ofthe distribution and the Manager’s Report no later than two months after these dates.
Risk and reward profile
The Risk and Reward Indicator table demonstrates where the Fund ranks in terms of itspotential risk and reward. The higher the rank the greater the potential reward but thegreater the risk of losing money. It is based on past data, may change over time andmay not be a reliable indication of the future risk profile of the Fund. The shaded area inthe table below shows the Fund's ranking on the Risk and Reward Indicator.
Typically lower rewards, Typically higher rewards,
lower risk higher risk fi
1 2 3 4 5 6 7
This Fund is ranked at 4 because funds of this type have experienced average rises andfalls in value in the past. The above figure applies to the following unit class:
• Class ‘B’ Accumulation
Please note that even the lowest risk class can lose you money and that extreme marketcircumstances can mean you suffer severe losses in all cases. Please note the Fund’srisk category may change in the future. The indicator does not take into account thefollowing risks of investing in this Fund:
• Investing overseas can bring additional returns and spread risk to differentmarkets.There are risks, however, that changes in currency rates will reduce the valueof your investment. The Investment Manager does, however, use transactions to offsetand reduce this risk.
• Emerging markets tend to be less stable than more established stock markets so yourmoney is at greater risk.
• Bonds are affected by changes in interest rates, inflation and any decline increditworthiness of the bond issuer. Bonds that produce a higher level of incomeusually also carry greater risk as such bond issuers may have difficulty in paying theirdebts.
14
fi
Statistical information

15
• This Fund can use derivatives in order to meet its investment objectives. This maylead to greater and more frequent rises and falls in the Fund’s unit price.
• Investing in derivatives carries the risk of substantial loss and/or increased volatilityin adverse market conditions.
• There may be cases where the organisation from which we buy an asset (usuallyfinancial institution such as a bank) fails to carry out its obligations which couldcause losses to the Fund.
• It may be more difficult to sell or value certain bonds within the Fund. There arefewer investors in these bonds and it may be harder to buy and sell them at the besttime.
For more information on the Risk and Reward profiles of our funds, please refer to themost up to date relevant fund and Unit Class Key Investor Information Documents(KIIDs). These are available online at www.phoenixunittrust.co.uk.
Directors’ statement
This report has been prepared in accordance with the requirements of the CollectiveInvestment Schemes Sourcebook as issued and amended by the Financial ConductAuthority.
28 April 2017 Craig Baker, DirectorShamira Mohammed, Director
Statistical information

16
Interim financial statements (unaudited)For the half year ended 28 February 2017
Statement of total return 28/02/17 29/02/16 £000 £000 £000 £000
Income
Net capital losses (9,465) (22,166) Revenue 13,402 13,671
Expenses (114) (119)
Interest payable and similar charges (67) (41)
Net revenue before taxation 13,221 13,511
Taxation (121) (104)
Net revenue after taxation 13,100 13,407
Total return/(deficit) before distributions 3,635 (8,759)
Distributions (13,145) (13,465)
Change in unitholders’ fundsfrom investment activities (9,510) (22,224)
Statement of change in unitholders’ funds
28/02/17 29/02/16* £000 £000 £000 £000
Opening net assets 551,916 491,639
Amounts receivable on issue of units 33,713 4,381Amounts payable onin-specie transfer** (77,927) –Amounts payable oncancellation of units (56,509) (17,350)
(100,723) (12,969)
Change in unitholders’ fundsfrom investment activities (9,510) (22,224)
Retained distributions on accumulation units 12,494 13,304
Closing net assets 454,177 469,750
*Please note that the comparative figures are for the comparative interim period. The brought forward netassets for the current period do not, therefore equal the carried forward figure in the comparative.**Represents the value of units cancelled by in-specie transfer of assets during the period.

17
Balance sheet 28/02/17 31/08/16 £000 £000 £000 £000
Assets:Fixed assets:Investments 433,785 529,968
Current assets:Debtors 14,798 13,364Cash and bank balances 23,004 62,948
Total current assets 37,802 76,312
Total assets 471,587 606,280
Liabilities: Investment liabilities (7,743) (54,208)
Creditors: Other creditors (9,667) (156)
Total creditors (9,667) (156)
Total liabilities (17,410) (54,364)
Net assets 454,177 551,916
Unitholders’ funds 454,177 551,916
Interim financial statements (unaudited)As at 28 February 2017
Notes to the interim financial statements
Accounting policiesThe interim financial statements have been prepared under the historical cost basis, asmodified by the valuation of investments and in compliance with FRS102 and inaccordance with the Statement of Recommended Practice (2014 SORP) for financialstatements of Authorised Funds issued by The Investment Association in May 2014.
Unless otherwise stated all accounting policies applied are consistent with those of theAnnual Report for the year ended 31 August 2016 and are described in thosefinancial statements.

18
Interest distributions
Interim distribution in pence per unitGroup 1: units purchased prior to 1 September 2016Group 2: units purchased 1 September 2016 to 28 February 2017 2017 2016 pence pence per unit per unit Gross payable paid income Equalisation 30 Apr 30 Apr
Class ‘B’ Accumulation
Group 1 2.8971 — 2.8971 2.6269Group 2 1.3198 1.5773 2.8971 2.6269
EqualisationThis applies only to units purchased during the distribution period (Group 2 units). Itis the average amount of revenue included in the purchase price of all Group 2 unitsand is refunded to the holders of these units as a return of capital. Being capital it isnot liable to income tax but must be deducted from the cost of the units for capitalgains tax purposes.
Distribution tableFor the half year ended 28 February 2017

19
Corporate information
The information in this report is designed to enable unitholders to make an informed judgement on the activitiesof the Fund during the period it covers and the results of those activities at the end of the period.
Phoenix Unit Trust Managers Limited is part of the Phoenix Group.
Ignis Investment Services Limited is part of the Standard Life Investments group (Standard Life Investments(Holdings) Limited) and its subsidiaries.
Unit prices appear daily on our website www.phoenixunittrust.co.uk
Dealing: 0370 707 0073 Administration: 0330 12330 703
RemunerationThe Manager has adopted a remuneration policy, up-to-date details of which can be found onwww.phoenixunittrust.co.uk. These details describe how remuneration and benefits are calculated and identifythe committee which oversees and controls the policy. A paper copy of these details can be requested free ofcharge from the Manager. Following the implementation of UCITS V in the UK on 18 March 2016, allauthorised UCITS Managers are required to comply with the UCITS V Remuneration Code from the start of theirnext accounting year. Under the UCITS V Directive, the Manager is required to disclose information relating tothe remuneration paid to its staff for the financial year, split into fixed and variable remuneration. The Manager’sFinancial Year end is 31 December, it is therefore anticipated that the Manager's Remuneration Policy andassociated financial disclosures will be made within the Annual Reports starting from 31 December 2017,following its first full performance period. Prior to this date, and in line with the FCA’s guidance on the UCITS Vremuneration disclosures, the Manager would be part way through its first performance period and theinformation available would not be relevant or provide a proper basis for comparison.
RiskThe price of units and the revenue from them can go down as well as up and investors may not get back theamount they invested, particularly in the case of early withdrawal. Tax levels and reliefs are those currentlyapplicable and may change. The value of any tax relief depends on personal circumstances.
Management charges on some funds are charged to capital and therefore a reduction in capital may occur.
Depending on the Fund, the value of your investment may change with currency movements.

20
Corporate information
ManagerPhoenix Unit Trust Managers Limited (PUTM)1 Wythall Green Way, Wythall, Birmingham, B47 6WGTel: 0330 1233 703Registered in England – No.03588031Authorised and regulated by the Financial ConductAuthority
DirectorsAndrew Moss PUTM Director, Chief Executive
Phoenix Life;Shamira Mohammed PUTM Director, Finance Director
Phoenix Life;Craig Baker PUTM Director, Head of Investment
Management Phoenix Life;Mike Urmston Non Executive Director of PUTM
Registrar and correspondence addressPhoenix Unit Trust Managers LimitedPO Box 12997ChelmsfordCM99 2ENAuthorised and regulated by the Financial ConductAuthority
Investment AdviserIgnis Investment Services Limited1 George StreetEdinburgh, EH2 2LLRegistered in Scotland – No.SC101825Authorised and regulated by the FinancialConduct Authority
Trustee Citibank Europe plcRegistered Office:Citigroup Centre,Canada Square,Canary Wharf, London E14 5LBAuthorised by the Prudential Regulation Authority andregulated by the Financial Conduct Authority and thePrudential Regulation Authority
Independent Auditor to the FundErnst & Young LLPTen George StreetEdinburgh EH2 2DZ
Authorised statusThis Fund is an Authorised Unit Trust scheme undersection 243 of the Financial Services & Markets Act2000 and is categorised under the CollectiveInvestment Schemes Sourcebook as a UCITS fund.

B1001.03.17
Telephone calls may be monitored and/or recorded for the purposes of security, internal training, accurate accountoperation, internal customer monitoring and to improve the quality of service.
Please note the Key Investor Information Document (KIID), the supplementary Information Document (SID) and thefull prospectus are available free of charge. These are available by contacting Client Services on 0330 1233 703.
Phoenix Unit Trust Managers Limited does not accept liability for any claims or losses of any nature arising directlyor indirectly from use of the data or material in this report. The information supplied is not intended to constituteinvestment, tax, legal or other advice.
Phoenix Unit Trust Managers Limited* is a Phoenix Group Company. Registered in England No 3588031.Registered office: 1 Wythall Green Way, Wythall, Birmingham B47 6WG.Authorised and regulated by the Financial Conduct Authority.
Contact: Client ServicesCall: 0330 1233 703Correspondence Address: PO Box 12997 Chelmsford CM99 2ENVisit: phoenixunittrust.co.uk