philosophy and idea of the person-oriented analysis · • just when you are interested in...
TRANSCRIPT

The philosophy and the idea of the person-oriented analysis
Jari-Erik NurmiDepartment of Psychology
University of Jyväskylä

Background: a variable-orientedresearch
• Since early 20th century (1905 or so), quantitavebehavioral sciences (psychology, sociology, etc.) have used ”variable-oriented methods” in analyzing data:– Measurement of phenomena by operationalizing
them as (usually) continuous variables– Examining research questions as statistical
associations between variables (correlations, betacoefficients, exploratory factor analyses, etc.)
– More recently using more sophisticated analysis likeSEM and LGM
– Analysis have focused on inter-individual variance and covariance between variables

Background: a variable-orientedresearch
• More recently the analysis of inter-individualvariance have been complemented by– Research on intra-individual variance– And research on nested environments

But something has been missing: the person-oriented approach

A holistic theory of personality byDavid Magnusson
• Magnusson started by using a variable-orientedpsychometrics
• At certain point he begin to rethink the researchon personality and human development
• ”a holistic theory of personality”– Personality does not consist of (orthogonal) traits but
rather a unique constellation/ combination of traits– In order to study such unique constellations one
needs a new methodological framework a person-oriented approach

Lars Bergman, David Magnusson and Bassam El’Khouri: A person-oriented
analysis• The aim is to identify unique combinations of
individual characteristics• This can be done by using many statistical
methods: creating categorical variables, clusteranalysis, mixture modeling, etc.
• You can do this either by using– Cross-sectional data or– Longitudinal data or– Even diary data

Lars Bergman, David Magnusson and El’Khouri: A person-oriented analysis
• Key idea: – Identify groups of individuals who are similar in the
constellation of variable values– But who differ from other groups of individuals in
these constellations• Benefits of using the approach:
– Identify typical groups with different pattern of chracteristics
– Identify the percentage of people showing thesepatterns
– Identify developmental trajectories of changingpatterns over time
Many ways to use the person-orientedapproach and many statistical
methods available

1. Cross-sectional research that can beinteresting
• Just when you are interested in different patterns/ constellations at certain time-point
X1X2X3X4X5
Cluster 1
Cluster 2
Cluster 3

2a. Clustering in longitudinal data using different clustering criteria over
time• How do patterns of some individual characteristics
change over time• How do people change from one pattern to another
Cluster 1
Cluster 2
Cluster 3
Cluster 1
Cluster 2
Cluster 3Cluster 4
time1 time2
Odd ratios

2b. Clustering longitudinal data usingidentical criteria in different time
points: ISOA procedure• The benefit that clusters are formed on the
basis of identical criteria– The concept of stability (of cluster membership)
becomes clear– The concept of change becomes clear– The role of other predictors become clear
• Should be preceded by 2a type of analysis

The trick is simple but clevert1 t2
S1 y11 y21…S2 y11 y21…S3 y11 y21…S4 y11 y21…S5 y11 y21…
S1 y12 y22…S2 y12 y22…S3 y12 y22…S4 y12 y22…S5 y12 y22…
S1 y1 y2…S2 y1 y2…S3 y1 y2…S4 y1 y2…S5 y1 y2…
Conduct clusteringand save cluster membership
Rearrangedata
S1 y11 y21CL2…S2 y11 y21CL1…S3 y11 y21CL2…S4 y11 y21CL3…S5 y11 y21CL2…
S1 y12 y22CL2…S2 y12 y22CL1…S3 y12 y22CL3…S4 y12 y22CL3…S5 y12 y22CL2…
RearrangeData again includingcluster membership
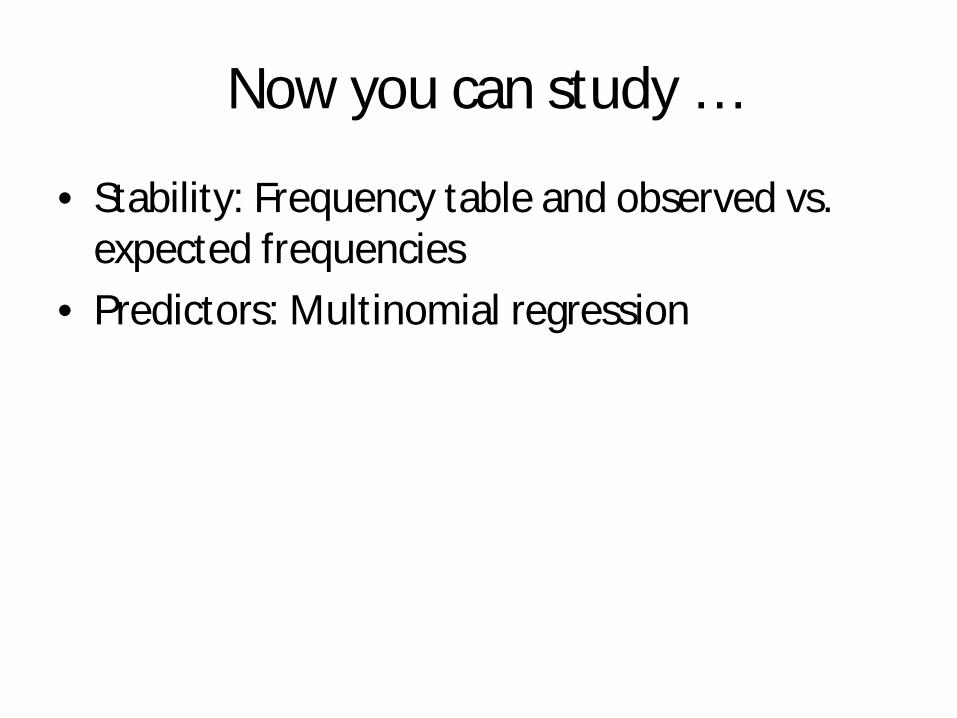
Now you can study …
• Stability: Frequency table and observed vs. expected frequencies
• Predictors: Multinomial regression
Study example
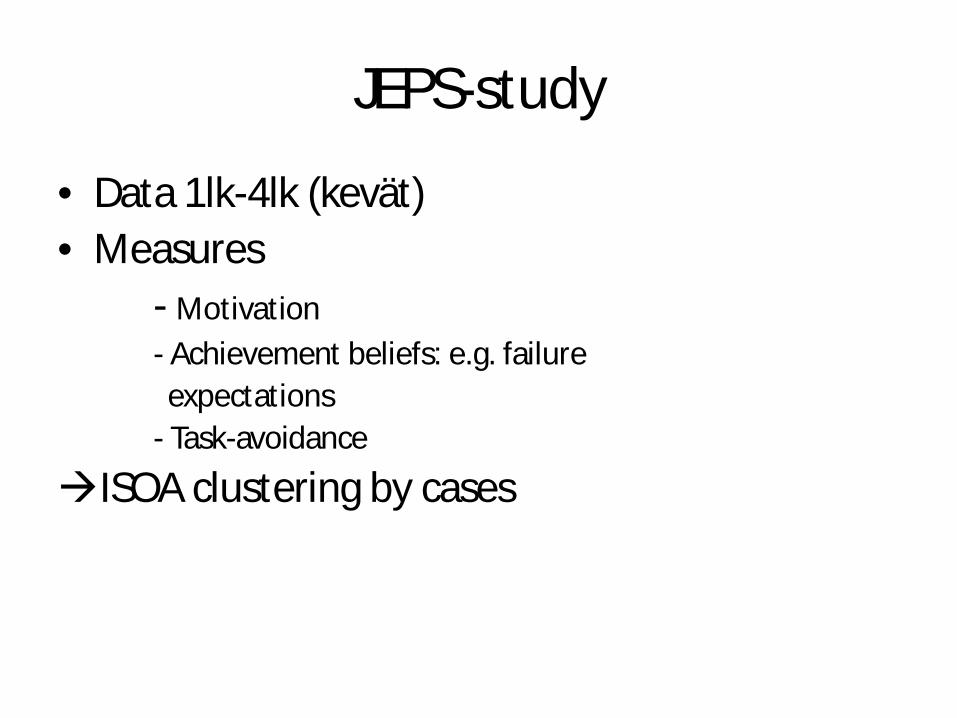
JEPS-study
• Data 1lk-4lk (kevät)• Measures
- Motivation- Achievement beliefs: e.g. failure expectations
- Task-avoidance
ISOA clustering by cases

-2,5
-2,0
-1,5
-1,0
-0,5
0,0
0,5
1,0
1,5
2,0
2,5
failure-expectation low-motivation autonomic adaptive-social
task_avoidanceefficacymotivationfailure_expectationsocial_supportreading_motivationmath_motivation

n = 31(17.4 %)n = 26
(13.3 %)n = 22
(11.2 %)
n = 35(19.7 %)
n = 24(12.2 %)n = 19
(9.7 %)
n = 64(36.0 %)
n = 66(33.7 %)
n = 32(16.3 %)
n = 48(27.0 %)
n = 80(40.8 %)
n = 123(62.8 %)
0,0 %
20,0 %
40,0 %
60,0 %
80,0 %
100,0 %
1st 2nd 4th
failure-expectation low-motivation autonomic adaptive-social
65***
17*
8***
7**
4 ***
3 *
9 **
10 **
30***
13***
15***
0 **
8 *
5 *
0**

2c. Person-oriented analysis on developmental changes over time
• Clustering is conducted by using variablesmeasured over several time-points
• The benefit of the approach is that the changepatterns over time becomes very clear

Development of Reading Skills among Preschool and Primary
School Pupils
Ulla Leppänen, Pekka Niemi,
Kaisa Aunola & Jari-Erik Nurmi
Reading Research Quarterly.

Mean LUKUT5Mean lukut4: lukutai
Mean lukut3: lukutaiMean lukut2: lukutai
Mean lukut1: lukutai
70
60
50
40
30
20
10
0
197.00
198.00
199.00
200.00
201.00
202.00
203.00
204.00
205.00
206.00
207.00
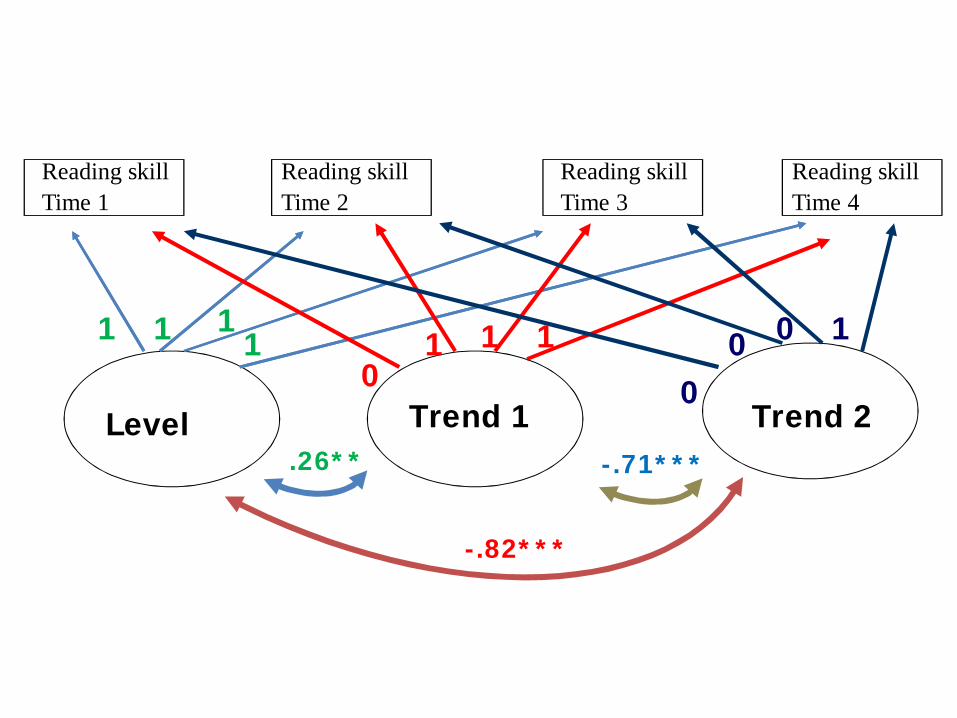
Level Trend 1 Trend 2
1 1 11
01 1 1
00 0 1
Reading skillTime 1
Reading skillTime 2
Reading skillTime 3
Reading skillTime 4
.26** -.71***
-.82***
.17 .09 .09 .43

Time 4Time 3Time 2Time 1
Rea
ding
Ski
ll S
core
s
40
30
20
10
0
Cluster Groups
1 N=71
2 N=113
3 N=11

But … whatever procedure you usethere is always many statistical tools to
conduct the clustering:– Clustering by cases (e.g., SPSS)– Mixture modelling (M-plus, AMOS)