philippines: energy sector assessment, strategy, and road map · ngcp national grid corporation of...
TRANSCRIPT

ASIAN DEVELOPMENT BANK
PhilippinesEnergy Sector Assessment, Strategy, and Road Map
This energy sector assessment, strategy, and road map documents the status and strategic priorities of the Government of the Philippines in the energy sector. It highlights sector performance, development constraints, government plans and strategies, past support of the Asian Development Bank (ADB) and other development partners, and the strategy for future ADB support in the energy sector. It also provides sector background information for investment and technical assistance operations. The assessment is based on a systematic review of the Philippines’ energy sector and consultations with the government and other development partners.
About the Asian Development Bank
ADB is committed to achieving a prosperous, inclusive, resilient, and sustainable Asia and the Pacific, while sustaining its efforts to eradicate extreme poverty. Established in 1966, it is owned by 67 members— 48 from the region. Its main instruments for helping its developing member countries are policy dialogue, loans, equity investments, guarantees, grants, and technical assistance.
AsiAn Development BAnk6 ADB Avenue, Mandaluyong City1550 Metro Manila, Philippineswww.adb.org
PHILIPPINESENERGY SECTOR ASSESSMENT, STRATEGY, AND ROAD MAPOCTOBER 2018
PHILIPPINES

ASIAN DEVELOPMENT BANK
PHILIPPINESENERGY SECTOR ASSESSMENT, STRATEGY, AND ROAD MAPOCTOBER 2018

Creative Commons Attribution 3.0 IGO license (CC BY 3.0 IGO)
© 2018 Asian Development Bank6 ADB Avenue, Mandaluyong City, 1550 Metro Manila, PhilippinesTel +63 2 632 4444; Fax +63 2 636 2444www.adb.org
Some rights reserved. Published in 2018.
ISBN 978-92-9261-362-4 (print), 978-92-9261-363-1 (electronic)Publication Stock No. TCS189616DOI: http://dx.doi.org/10.22617/TCS189616
The views expressed in this publication are those of the authors and do not necessarily reflect the views and policies of the Asian Development Bank (ADB) or its Board of Governors or the governments they represent.
ADB does not guarantee the accuracy of the data included in this publication and accepts no responsibility for any consequence of their use. The mention of specific companies or products of manufacturers does not imply that they are endorsed or recommended by ADB in preference to others of a similar nature that are not mentioned.
By making any designation of or reference to a particular territory or geographic area, or by using the term “country” in this document, ADB does not intend to make any judgments as to the legal or other status of any territory or area.
This work is available under the Creative Commons Attribution 3.0 IGO license (CC BY 3.0 IGO) https://creativecommons.org/licenses/by/3.0/igo/. By using the content of this publication, you agree to be bound by the terms of this license. For attribution, translations, adaptations, and permissions, please read the provisions and terms of use at https://www.adb.org/terms-use#openaccess.
This CC license does not apply to non-ADB copyright materials in this publication. If the material is attributed to another source, please contact the copyright owner or publisher of that source for permission to reproduce it. ADB cannot be held liable for any claims that arise as a result of your use of the material.
Please contact [email protected] if you have questions or comments with respect to content, or if you wish to obtain copyright permission for your intended use that does not fall within these terms, or for permission to use the ADB logo.
Notes: In this publication, “$” refers to United States dollars.ADB recognizes “China” as the People’s Republic of China and “Korea” as the Republic of Korea.Corrigenda to ADB publications may be found at http://www.adb.org/publications/corrigenda.
On the cover: Solar panels from a hybrid energy system on Cobrador Island, Philippines (photo by ADB).

iii
Contents
Tables and Figures ivAcknowledgments vAbbreviations viCurrency Equivalents viiWeights and Measures viiI. Introduction 1
II. Overall Sector Context 2A. Energy Resources 3B. Energy Balance 4C. Forecasts for Energy Supply and Demand 5D. Climate Change 7
III. Institutional Context 8A. Government Institutions in the Power Sector 8B. State-Owned Enterprises 10C. Private Sector 11
IV. Core Sector Issues 13A. Electric Power Subsector 13B. Energy Efficiency 20C. Energy Resource Subsectors 21D. Subsector Constraints 30
V. Sector Strategy 37A. Power Sector Priorities 37B. ADB’s Sector Support Program and Experience 39C. Other Development Partner Support 40D. ADB Experience and Self-Evaluation 42E. ADB’s Sector Forward Strategy and Policy Issues Moving Forward 42
VI. Energy Sector Road Map and Results Framework 47Appendix: Energy Sector Problem Tree 48

iv
Tables and Figures
Tables 1 Energy Supply Projections for 2040 6 2 Current Transmission Interconnection Capacity in the Philippines 19 3 Approved Feed-In Tariff Rates as of 31 December 2016 28 4 National Energy Targets Set Out by the Philippine Development Plan 2017–2022 38 5 Energy-Focused Legislative Agenda from the Philippine Development Plan 2017–2022 39 6 Major Donor Activities in the Philippine Power Sector, 2010 Onward 41
Figures 1 Regional Real Gross Domestic Product Growth, 2003–2016 2 2 Electricity Demand Growth vs. Real Gross Domestic Product Growth 5 3 Structure of the Power Industry in the Philippines 8 4 Power Generation by Source in the Philippines, 1991–2016 13 5 Supply and Reserve Margins in Luzon, 1987–2016 14 6 Generation in the Main Philippine Grids, 2016 15 7 System Losses in the Philippines 18 8 Installed Renewable Energy Capacity under the Feed-In Tariff Program 29 9 Retail Tariffs for Residential Customers as of September 2017 30 10 Comparison of Generation Charge by Meralco vs. Wholesale Electricity 31
Spot Market Prices 11 Strategic Linkages 43

v
Acknowledgments
This report was prepared by a team led by Shannon Cowlin, senior energy specialist, Energy Division (SEEN) of the Southeast Asia Department (SERD), with team members: Rehan Kausar, director, Portfolio Management Division of the Procurement, Portfolio, and Financial Management Department; Manfred Kiefer, senior economist, Private Sector Transaction Support Division of the Private Sector Operations Department; Michael Thomas, consultant, and Christopher Starling, consultant. Guidance and support was provided by Ramesh Subramaniam, director general, SERD; Andrew Jeffries, director, SEEN; and Kelly Bird, director, Philippines Country Office (PHCO).
The team wishes to thank Yongping Zhai, chief, Energy Sector Group, Sustainable Development and Climate Change Department; Aekapol Chongvilaivan, country economist, PHCO; and Anthony Jude, consultant, for their helpful reviews and comments during the preparation of the report. The team wishes to thank the Department of Communications and SERD staff: April-Marie Gallega, associate communications coordinator; Mary Grace Huelgas, associate operations officer; and Jeffrey Almera, senior operations assistant, for their support in preparing and editing the report.
The team wishes to thank agencies and colleagues in the Government of the Philippines for discussions held during the preparation of the report.
vi
Abbreviations
ADB Asian Development BankARMM Autonomous Region in Muslim MindanaoASR assessment, strategy, and road mapBAU business-as-usualCES Clean Energy ScenarioDENR Department of Environment and Natural ResourcesDOE Department of EnergyEPIRA Electric Power Industry Reform ActERC Energy Regulatory CommissionFiT feed-in tariffFiT-All FiT-AllowanceGDP gross domestic productGHG greenhouse gasIMEM Interim Mindanao Electricity MarketLNG liquefied natural gasNEA National Electrification AdministrationNGCP National Grid Corporation of the PhilippinesNPC National Power CorporationNREB National Renewable Energy BoardNREP National Renewable Energy ProgramPDP Philippine Development PlanPEMC Philippine Electricity Market CorporationPEP Philippine Energy PlanPNOC Philippine National Oil CompanyPPA power purchase agreementRoR run-of-riverRPS Renewable Portfolio StandardTPES total primary energy supplyTransCo National Transmission CompanyUCME Universal Charge for Missionary ElectrificationWESM Wholesale Electricity Spot Market

vii
Currency Equivalents(as of 6 September 2018)
Currency unit – peso (PHP) ₱1.00 = $0.019 $1.00 = ₱53.59
Weights and Measures
GW gigawattkV kilovoltkW kilowattkWh kilowatt-hourMt million metric tonsMTOE million tons of oil equivalentMW megawatt


1
I Introduction
1. This sector assessment, strategy, and road map (ASR) reviews the state of the energy sector of the Philippines. Consistent with the plans and strategy of the Government of the Philippines, the ASR proposes support actions for the energy sector to be taken by the Asian Development Bank (ADB) during the period 2018–2023. It also provides sector background information, which will be updated as needed for investment and technical assistance operations. The ASR is a working paper based on a systematic review of the country’s energy sector and consultations with the government and other development partners.
2. The ASR is linked to and informs ADB’s country partnership strategy for the Philippines. The country partnership strategy sets out principles for assistance and partnership between ADB and the Philippines. It is aligned with the government’s policies and priorities, and draws upon ADB’s Strategy 2030, which outlines a framework for ADB’s overall operations.1
1 ADB. 2018. Strategy 2030: Achieving a Prosperous, Inclusive, Resilient, and Sustainable Asia and the Pacific. Manila.

2
II Overall Sector Context
3. The Philippines is a vast archipelago comprising 7,641 islands in Southeast Asia situated to the north of Indonesia and the east of Borneo. As of 2015, the population was 100.98 million having grown by 8.64 million since 2010.2 On the main northern island of Luzon, the administrative regions of Calabarzon (Region IV-A), the National Capital Region, and Central Luzon (Region III) accounted for 38.51 million inhabitants or 38.1% of the Philippine population.
4. With a gross domestic product (GDP) of $305 billion in 2016, the Philippine economy is the third largest in Southeast Asia ranking only behind Indonesia and Thailand. Compared with other countries in the region, the economy of the Philippines is weighted more toward the services sector which accounted for 57.3% of overall GDP in 2016. The Philippine economy has continued to grow robustly over the past few years; during 2016, GDP growth was 6.92% (6.15% in 2015 and 6.07% in 2014) driven by growth in the services (7.4%) and industry (8.4%) sectors.3 The National Capital Region accounted for the largest share of GDP at 36.6%, though rates of growth are faster in other regions notably in the Visayas (Figure 1).
5. The economic performance of the Philippines has improved since 2010. The World Economic Forum’s Global Competitiveness Report 2016–2017 ranked the Philippines as 57th of
2 Government of the Philippines, Philippine Statistics Authority. 2017. Philippine Population Surpassed the 100 Million Mark (Results from the 2015 Census of Population). https://www.psa.gov.ph/content/philippine-population-surpassed-100-million-mark-results-2015-census-population.
3 Bangko Sentral ng Pilipinas. Statistics. http://www.bsp.gov.ph/statistics/efs_fiscalnia.asp (accessed 9 July 2017).
Figure 1: Regional Real Gross Domestic Product Growth, 2003–2016
Source: Government of the Philippines, Philippine Statistics Authority.
Luzon
2004
2005
2006
2007
2008
2009
2010
2011
2012
2013
2014
2015
2016
Visayas Mindanao National
2003
14
12
10
8
6
4
2
0
–2
%

Overall Sector Context 3
138 economies worldwide.4 The ranking reflects many of the country’s strengths including the size of the domestic market and underlying GDP growth. At the same time, the report points to some barriers to the country’s ability to compete globally including a high cost of doing business. The country’s score for “policy instability” also worsened relative to the previous year’s study. In the subcategory “quality of electricity supply” the Philippines ranked 94th, a fall of five places in the rankings. In the 2017 World Bank’s Doing Business report which evaluates the business regulation for domestic firms across 190 economies, the Philippines ranked 99th—behind Thailand (46th), Viet Nam (82nd), and Indonesia (91st).5
6. Economic growth has become more inclusive with unemployment reaching historically low levels (5.5% in 2016) and poverty incidence decreasing to 21.6% in 2015 from 25.2% in 2012 based on a poverty threshold of ₱21,753 minimum annual income per capita.6 The poverty incidence for families also declined to 16.5% in 2015 from 19.7% in 2012.7
7. In 2018, the Philippines had investment-grade credit ratings of BBB (Fitch) and Baa2 (Moody’s) with a stable to positive outlook, having been bolstered over the previous years by economic reforms designed to improve accountability and transparency, fiscal management, debt reduction, and efforts to boost growth.8 The Philippines received its first-ever investment-grade credit rating from Fitch in 2012.
8. Consensus forecasts project the economy to grow strongly (from 6.4% to 6.9% in 2016– 2018) supported by expansionary fiscal policy, particularly with respect to public infrastructure projects.9 Inflation was at 1.8% in 2016, having been driven higher during the second half of the year due to a weaker peso (vis-à-vis the US dollar), but still lower than the average of 2.7% per year between 2012 and 2016.10
A. Energy Resources
9. Natural gas and coal remain the predominant indigenous fossil fuel resources in the Philippines; proven gas reserves are 98.54 billion cubic meters11 and economically recoverable coal is estimated
4 World Economic Forum. 2016. The Global Competitiveness Report 2016-2017. Geneva. http://www3.weforum.org/docs/GCR2016-2017/05FullReport/TheGlobalCompetitivenessReport2016-2017_FINAL.pdf.
5 World Bank. 2017. Doing Business 2017. http://www.doingbusiness.org/~/media/WBG/DoingBusiness/Documents/Annual-Reports/English/DB17-Report.pdf.
6 Government of the Philippines, Philippine Statistics Authority. 2016. 2016 Annual Labor and Employment Status; Government of the Philippines, Philippine Statistics Authority. 2016. 2015 Full Year Official Poverty Statistics of the Philippines. https://www.psa.gov.ph/content/2016-annual-labor-and-employment-status.
7 Government of the Philippines, Philippine Statistics Authority. 2016. 2015 Full Year Official Poverty Statistics of the Philippines. https://psa.gov.ph/sites/default/files/2015%20Full%20Year%20Official%20Poverty%20Statistics%20of%20the%20Philippines%20Publication_0.pdf.
8 Fitch Ratings. 2018. Fitch Affirms Philippines at ‘BBB’; Outlook Stable. https://www.fitchratings.com/site/pr/10038330; Moody’s. Research and Ratings. https://www.moodys.com/researchandratings/market-segment/sovereign-supranational/-/005005/005005%7C04208A/-/0/0/-/0/-/-/-/-1/-/-/-/en/global/pdf/-/rra.
9 Consensus forecasts for economic growth include those from ADB and the World Bank. ADB. 2017. Asian Development Outlook 2017: Transcending the Middle-Income Challenge. Manila. https://www.adb.org/publications/asian-development-outlook-2017-middle-income-challenge; World Bank. 2017. Philippines Economic Update April 2017. http://www.worldbank.org/en/news/feature/2017/05/04/philippines-economic-update-april-2017
10 Government of the Philippines, Philippine Statistics Authority. Price Indices. https://psa.gov.ph/business/price-indices (accessed 9 July 2017).
11 Central Intelligence Agency. The World Factbook. https://www.cia.gov/library/publications/the-world-factbook/geos/rp.html (accessed 9 July 2017).

4 Philippines: Energy Sector Assessment, Strategy, and Road Map
at 316 million tons.12 Proven oil reserves are around 100 million barrels (footnote 11). The resource potential of hydropower is estimated at 13,097 megawatts (MW).13 Wind energy potential is estimated at 76,600 MW with wind power densities ranging between 300 watts per square meter (W/m2) and 1,250 W/m2 based on 2014 National Renewable Energy Laboratory geographic information system data.14 Estimates for potential solar capacity are also promising with the country enjoying average global horizontal irradiance levels of 5.1 kilowatt-hours/m2/day (footnote 13). Biomass resources from agricultural residues are likewise available for industrial and household use.
B. Energy Balance
10. Total primary energy supply (TPES) stood at 52.15 million tons of oil equivalent (Mtoe) in 2015 according to the International Energy Agency.15 The primary energy mix is dominated by fossil fuels (61.0% in 2015), with oil accounting for 32.2%, coal for 23.1%, and natural gas for 5.7%.16 However, renewable energy accounts for a meaningful share of TPES (36.5% in 2015), owing to a long-standing use of geothermal and hydro resources for electricity generation and the use of biomass by the industrial and residential sector (footnote 15).
11. In 2015, the Philippines consumed 29.8 Mtoe of final energy (footnote 16). The biggest share of final energy is consumed by the transport sector (36%) followed by the industry sector (29%). ADB estimates that by 2035 the final energy consumption of the Philippines will nearly double to 49.0 Mtoe.17 ADB’s 2013 Energy Outlook for Asia and the Pacific presented an alternative path that could ensure future energy security by (i) improving thermal efficiency in power generation, (ii) increasing contributions from renewable energy, and (iii) shifting toward more energy-efficient vehicles; in aggregate, these measures would reduce the projected final energy consumption in 2035 to 42.8 Mtoe (footnote 17).
12. A key item on the government’s agenda as set out in the Philippine Development Plan 2017–2022 and the Energy Sector Accomplishment Report for 2016 of the Department of Energy (DOE) remains the issue of addressing energy security by utilizing indigenous energy resources. Energy self-sufficiency increased from 57.9% in 2008 to 59.6% in 2011 but has since fallen to 53.5% in 2015 due to greater demand for oil by the transport sector and the increased use of imported coal in electricity generation, largely sourced from Australia and Indonesia.18
13. Energy security is also emphasized in the DOE’s Philippine Energy Plan (PEP) 2017–2040 which outlines anticipated changes and sets goals for the energy sector by 2040. Energy self-sufficiency is becoming ever more challenging as the country’s main domestic natural gas field, the Malampaya field, depletes. Gas from Malampaya is primarily used in domestic power generation, and
12 J. Kessels. 2013. Coal in the Philippines. World Coal. 26 March. https://www.worldcoal.com/coal/26032013/coal_in_the_philippines_iea_clean_coal_centre/.
13 International Renewable Energy Agency. 2012. Renewables Readiness Assessment: The Philippines. Abu Dhabi. http://www.irena.org/publications/2017/Mar/Renewables-Readiness-Assessment-The-Philippines.
14 This estimate is based on the following specifications for wind technology: turbine size is 550 kilowatts; hub height is 40 meters; rotor diameter is 38 meters; turbine spacing is 10 rotor diameters in one direction and 5 rotor diameters in another; capacity per square kilometer is 6.9 MW (Footnote 12).
15 International Energy Agency. 2017. World Energy Balances (2017 edition). Paris.16 Government of the Philippines, National Economic and Development Authority. 2017. Philippine Development Plan
2017–2022. Manila.17 ADB. 2013. ADB Energy Outlook for Asia and the Pacific. Manila.18 Government of the Philippines, Department of Energy. 2018. Philippine Energy Plan, 2017–2040. Manila (draft); and
footnote 15.

Overall Sector Context 5
the Philippines is at a pivotal moment for determining its future energy mix beyond its availability. To attain self-sufficiency and provide for growing energy demand, the DOE has sought to expand fossil fuel production through exploration and development, and to grow the renewable energy sector. In addition, strategies to enhance energy efficiency and conservation by end users is aimed at reducing the resource availability and energy consumption gap.
14. Fuelwood for cooking is being used by more than half of the population (54%) while 35% use charcoal and 20% utilize biomass residues.19 Burning of traditional biomass results in indoor air pollution, which has negative effects on health such as respiratory, pulmonary, and cardiovascular diseases. The practice also contributes to ambient air pollution and climate change through the emission of carbon dioxide (CO2) and non-CO2 pollutants formed by the incomplete combustion of biomass. There are no policies that promote the use of clean cooking technologies in the Philippines.
C. Forecasts for Energy Supply and Demand
15. Historically, energy demand growth and economic growth in the Philippines have shared similar underlying drivers, though the precise relationship may be slowly decoupling particularly in Luzon (Figure 2). Nevertheless, energy demand increases are expected from growth in the industrial, commercial, and domestic sectors of each island. In addition, electrification continues; households in areas that are currently not fully grid-connected, such as parts of Mindanao and Mindoro, are likely to gain better access to electricity supply in the coming years with a target to reach 100% electrification across the Philippines by 2022.
19 Government of the Philippines, Philippine Statistics Authority, and Department of Energy. 2013. 2011 Household Energy Consumption Survey.
Figure 2: Electricity Demand Growth vs. Real Gross Domestic Product Growth
GDP = gross domestic product.Sources: Department of Energy. 2017. Annual System Peak Demand per Grid as of 2016. https://www.doe.gov.ph/sites /default/files/pdf/energy_statistics/annual_system_peak_demand_per_grid_2016.pdf; and Bangko Sentral ng Pilipinas. Statistics. http://www.bsp.gov.ph/statistics/efs_fiscalnia.asp (accessed 9 July 2017).
1 1.2 1.4 1.6 1.8 2 2.21
1.2
1.4
1.6
1.8
2
2.2
2.4
2.6
2001
Luzon
Visayas
Peak
Dem
and
(200
1 = 1.
000)
Regional GDP (2001 = 1.000)
20022003
2004 2005 2006 20072009
2010 20112012
20132014
2015
2016
20082001 2002
2003 2004 20052006
2007
2009
20102011
2012 20132014
2015
2016
2008

6 Philippines: Energy Sector Assessment, Strategy, and Road Map
16. Under the assumption of “business as usual” (BAU) in the PEP, DOE anticipates a 4.4% annual growth in TPES to reach 148.1 Mtoe by 2040.20 As power generation and industrial processing demands increase and natural gas reserves decrease, coal, oil, and geothermal energy are expected to comprise a large portion of the energy mix. Under an alternative clean energy scenario (CES), TPES would grow to 137.8 Mtoe—a 7% decrease relative to the forecasted BAU TPES—due to decreases in fossil fuel use, mainly of oil and coal.
17. Whereas the BAU scenario accounts for demand growth driven by an oil-reliant transport scenario, the CES is based on the prediction that alternative sources of energy for transport such as electricity, compressed natural gas, and biofuels will reduce the demand for oil, slowing the annual rate of oil supply growth—as presented in Table 1 (footnote 20). Both scenarios predict an increase in coal’s contribution to the energy mix, but in the CES this growth is mitigated somewhat by institutional reforms to reduce carbon emissions. The BAU scenario assumes 6.7% growth in the natural gas supply over the 2017–2040 planning horizon which will necessarily come from liquefied natural gas (LNG) imports if no new domestic gas fields are developed. In contrast, the CES assumes faster growth in the gas supply due to increased government efforts to promote the use of LNG; though production from domestic fields will be targeted, some of the gas supply may need to be imported which would come at the expense of energy self-sufficiency (footnote 20).
18. Under the BAU scenario, modest growth in the supply of renewable energy is expected to result in TPES from renewable energy of 28.2 Mtoe in 2040. Under the CES, renewable energy supply grows at a slightly faster annual rate resulting in 29.1 Mtoe from renewable energy in 2040. Geothermal energy is the primary source of renewable energy in both the BAU and CES scenarios. Under both scenarios, geothermal will contribute the largest share of renewable energy TPES, 43.3% in BAU and 44.3% in the CES (footnote 20). In both scenarios, biomass will be the second largest share of the renewable energy mix due to the residential sector’s demand for cooking followed by hydropower. Wind and solar are expected to grow in both scenarios with the CES resulting in more
20 Government of the Philippines, Department of Energy. 2018. Philippine Energy Plan, 2017–2040. Manila (draft).
Table 1: Energy Supply Projections for 2040
Business-as-Usual Scenario Clean Energy ScenarioSupply
(million tons of oil equivalent)
Average Growth from 2016–2040
(%)
Supply(million tons of oil
equivalent)
Average Growth from 2016–2040
(%)Fossil Fuels
Oil 53.1 4.5 48.8 4.1
Coal 51.3 6.4 40.7 5.3
Natural gas 15.7 6.7 17.1 7.1RenewablesGeothermal 10.5 0.4 11.7 0.9Hydropower 3.1 1.9 2.9 1.5Solar and wind 0.2 0.2 0.4 3.5Biomass 12.5 2.2 12.3 2.1
Source: Government of the Philippines, Department of Energy.

Overall Sector Context 7
than 5 gigawatts (GW) of additional capacity from these sources by 2040. However, in either case, wind and solar will supply only a small portion of the renewable energy mix.
D. Climate Change
19. The Philippines is highly vulnerable to the effects of climate change owing to its archipelagic geography, growing population, and risk from flooding. Agriculture represents a meaningful share of the economy and crop yields could be materially reduced because of climate change.
20. The government is seeking to address the country’s contributions to climate change through a variety of targets that focus on reducing the energy intensity of the economy and increasing installed renewable energy capacity. The DOE is actively promoting compressed natural gas, liquefied petroleum gas, and e-vehicles through the Alternative Fuels for Transportation Program and will undertake efforts to expand the public mass transport system.
21. On 1 March 2017, the Philippines ratified the climate treaty known as the Paris Agreement and its associated Nationally Determined Contribution asserts the intention to reduce greenhouse gas (GHG) emissions (CO2 equivalent) by 70% relative to the country’s BAU scenario for 2000–2030.21 The energy, transport, waste, forestry, and industry sectors were all listed as sectors that will contribute to emission reductions; the commitment itself was contingent on financial resources including capacity building and technology development and transfer being made available to the country.
22. Notwithstanding ratification, there remains considerable uncertainty around how these commitments will be achieved particularly given that continued economic development is contingent on significant increases in power generation capacity. The DOE has officially signaled its “conditional concurrence” to the country’s commitments under the Paris Agreement. However, under current targets for the future energy mix of 70% “baseload” capacity, 20% “mid-merit” capacity, and 10% “peaking” capacity (70–20–10), coal generation as the current least-cost form of baseload generation may remain a priority which could impede progress toward targeted emission reductions.
23. The DOE estimates that under the PEP BAU scenario, GHG emissions from fossil fuels used in energy production will increase by approximately 5.5% annually through 2040. This will result in annual emissions of 396.9 million metric tons of CO2 in 2040. Coal will be responsible for 52.4% of the anticipated emissions, oil-based fuels for 42.4%, and natural gas for 5.2%. Over half of the GHG emissions will come from power generation. Transport will contribute 28.7% emissions and industry will produce 13.2% of total emissions (footnote 20).
24. By comparison, the DOE’s CES projects emissions grow at a lower average rate of 4.9% through 2040 resulting in annual GHG emissions of approximately 345.5 million metric tons of CO2 (footnote 20).
21 Government of the Philippines. 2015. Intended Nationally Determined Contributions. http://www4.unfccc.int/submissions/INDC/Published%20Documents/Philippines/1/Philippines%20-%20Final%20INDC%20submission.pdf.

8
III Institutional Context
A. Government Institutions in the Power Sector
25. Figure 3 illustrates the current structure of the power industry in the Philippines. The apex body for governing and developing policy within the country’s power sector is the Department of Energy (DOE). The DOE is responsible for energy policy and planning including the formulation of the PEP 2017–2040 and the Power Development Plan. It reports directly to the Offi ce of the President and is also responsible for supervising the reform process of the sector following the Electric Power Industry Reform Act (EPIRA).
F igure 3: Structure of the Power Industry in the Philippines
DOE = Department of Energy; ERC = Energy Regulatory Commission; IPP = independent power producer; NEA = National Electrifi cation Administration; NGCP = National Grid Corporation of the Philippines; PEMC = Philippines Electricity Market Corporation; PIOU = private investor-owned utility; PSALM = Public Sector Assets and Liabilities Management Corporation. Source: Asian Development Bank.
Policy and Regulatory Institutions
Generation
Market
Transmission
Distribution
Supply
Dire
ctly
Conn
ecte
d
End Users
Regulation Supervision Policy making Flow of electricity
DOE
IPPs
PEMC
NGCP
Meralco andOther PIOUs
Electric Cooperatives
Retail Electricity Suppliers
ContestableCustomerCaptive Customers
NEA
Institutional Context 9
26. The Energy Regulatory Commission (ERC) is an independent body responsible for regulating the power industry and, among other duties, is responsible for approving bilateral power supply agreements, Ancillary Service Procurement Agreements, and setting the distribution wheeling rates of distribution utilities and electric cooperatives.
27. Other government bodies include the Philippine Competition Commission established under the Philippine Competition Act of 2015. The Philippine Competition Commission is mandated to promote free and fair competition across all sectors including energy, can penalize monopolistic and anticompetitive behavior, and has the authority to approve asset transactions in the power sector. Both the Philippine Competition Commission and the ERC can exercise their jurisdiction over anticompetitive behavior “in a concurrent capacity.” However, the ERC’s view is that the agency where a complaint is fi rst fi led will assert their authority though it is not clear how this will work in practice as no complaints have been lodged thus far.22
28. The EPIRA passed in 2001 is the main foundation of regulation in the energy sector. The legislation sought to liberalize and unbundle the power sector and promote competition, which resulted in a signifi cant transformation of the country’s power sector. Privatization was a key part of the EPIRA-driven reform process which established that power generation should no longer be considered a public utility operation. The Power Sector Assets and Liabilities Management Corporation is charged with selling both government-owned power sector assets and the rights to control capacity contracted to the government by the private sector under long-term power purchase agreements (PPAs). By the end of 2013, the power sector in the Philippines had become one of the most extensively privatized power sectors in the region. The EPIRA also required distribution utilities to procure power in the “least-cost manner” for sale to their franchised captive customers and required the establishment of a sophisticated Wholesale Electricity Spot Market (WESM).
29. In the years since the passage of the EPIRA, the power sector restructuring in the Philippines has achieved the following signifi cant milestones:
(i) establishment of the WESM in Luzon and the Visayas;
(ii) establishment of the ERC as an autonomous sector regulator;
(iii) absorption of debt: following the mandate of the EPIRA, the government absorbed ₱200 billion of the debt liabilities of the National Power Corporation (NPC);
(iv) structural unbundling of electricity provision into generation, transmission, and distribution plus retail supply;
(v) privatization to the point where the private sector now provides most of the generation, all transmission, and most of the distribution or retail supply;
(vi) introduction of performance-based regulation for electricity transmission and distribution businesses;
(vii) removal of most subsidies and cross-subsidies;
(viii) reduction of transmission and distribution losses; and
(ix) improvements in electrification coverage, which stands at 89.7% nationally as of December 2016.23
22 Government of the Philippines, Energy Regulatory Commission. 2017. ERC Asserts Jurisdiction Over Competition Cases in Energy. http://www.erc.gov.ph/ContentPage/30636.
23 Government of the Philippines, National Electrifi cation Administration. Electric Cooperatives Statistics—Status of Energization. http://www.nea.gov.ph/status-of-energization/category/119-2016-monthly-reports (accessed 18 March 2018).

10 Philippines: Energy Sector Assessment, Strategy, and Road Map
30. Prior to the passage of the EPIRA, three cross-subsidies existed in the electricity supply sector: industrial and commercial end users subsidizing the residential and public sector, cross-subsidies between wholesale customers of the NPC in Luzon, and cross-subsidies between the three major grids. The EPIRA required that these cross-subsidies be phased out following the introduction of the Universal Charge which was introduced between September 2003 and October 2005. Today the only subsidies paid by consumers are lifeline rate subsidies, senior citizen subsidies (both cross-subsidized by other users of the distribution utility), the Universal Charge, and the Feed-in Tariff Allowance (FiT-All) (the latter two are cross-subsidized by all other grid-connected end users).24
31. Despite the intentions of the EPIRA, challenges remain in ensuring the affordability of electric power supply. For a variety of reasons, the Philippines has one of Asia’s highest electricity tariff rates which are explored further in para. 106. Challenges in ensuring adequacy of power supply have persisted predominantly in Mindanao and, given projected economic growth and associated demand growth, it could be a challenge to grow generation capacity at the pace of demand growth.
B. State-Owned Enterprises
32. The National Electrification Administration (NEA) is a government-owned and controlled corporation responsible for promoting full electrification in the Philippines with a focus on the numerous electric cooperatives that tend to serve less developed areas. The NEA provides loans or subsidies to the electric cooperatives to establish infrastructure, operations, and facilities necessary to supply electricity in rural areas. The NEA’s main responsibilities include (i) preparing the electric cooperatives to operate and compete under a deregulated electricity market; (ii) acting as guarantor for purchases of electricity in the WESM by electric cooperatives; (iii) strengthening the technical capability and financial viability of electric cooperatives; and (iv) acting as an administrator of government grants for extensions of distribution lines in the non-electrified barangays. The NEA assists in the preparation and integration of the electric cooperatives’ distribution development plans, each of which contains all major capital investment projects including rehabilitation, upgrading, and expansion of the distribution system, as well as acquisition of new assets such as subtransmission lines. The consolidated electric cooperatives’ distribution development plan is submitted to the DOE for the preparation of a nationwide distribution development plan.
33. The Philippine National Oil Company (PNOC) was formed in 1973 in response to the global oil crisis and embargo that began in the same year. PNOC was tasked with developing the country’s indigenous oil resources and securing energy independence; its mandate has subsequently been expanded to include a spectrum of energy resources including oil, gas, coal, geothermal, and other renewables. One of the most notable discoveries since PNOC was founded is the discovery of the Malampaya offshore gas field in 1992. It was later commercialized via the Malampaya Deepwater Gas-to-Power project in conjunction with Chevron and Royal Dutch Shell, which operates the field. PNOC has two fully owned subsidiaries: the PNOC Exploration Company which undertakes exploration, development, and production of the country’s oil, gas, and coal resources, and the PNOC Renewables Corporation which promotes and develops renewable energy projects. The Energy Development Corporation was originally a fully owned subsidiary of PNOC that was privatized in 2007 and now operates 2.7 GW of renewable power generators in the Philippines.
24 The Universal Charge is levied on grid-connected end users and (i) covers the cost of stranded NPC contracts that were entered into with independent power producers during the 1990s, (ii) subsidizes missionary electrification activities outside of the main grid, and (iii) sets aside money for watershed rehabilitation and management. The FiT-All is designed to fund the proportion of the feed-in tariff payments to eligible renewable energy generators that has not been recovered from the WESM.

Institutional Context 11
34. The NPC is a government-owned and controlled corporation that owned and operated all generation and transmission assets within the Philippines until 1987 when the government began permitting participation of independent power producers who would bilaterally contract with NPC via PPAs backed by the government.25 Following the EPIRA in 2001, which mandated the privatization of generation and transmission assets, the NPC’s responsibilities have been reduced to:
(i) assisting with missionary electrification through its Small Power Utilities Group, the dominant generation service provider on smaller islands and isolated grids that cannot be serviced by distribution utilities or other qualified third parties;
(ii) management of 11 watersheds and 22 dams, and certain reforestation and agro-forestry initiatives;
(iii) preserving and maintaining the never-commissioned Bataan nuclear power plant; and
(iv) management of generation capacity that has not yet been privatized.
35. The National Transmission Corporation was formed under the EPIRA and operated and managed the transmission network prior to the National Grid Corporation of the Philippines (NGCP) being awarded the concession in 2008. The National Transmission Corporation remains the legal owner of the underlying assets. In recent years, one of its principal roles has been to act as the FiT-All fund administrator responsible for the disbursement of funds to renewable energy developers with eligible projects.
C. Private Sector
36. Since the EPIRA, there has been substantial privatization across the power industry value chain. The Power Sector Assets and Liabilities Management Corporation began operations in July 2001 with the remit that included the privatization of the NPC’s generation and transmission assets and management of the NPC’s debt obligations and future income from independent power producers.
37. Several independent power producers currently exist in the Philippines with some major players having material market shares, both domestic and foreign. Competition laws [EPIRA sec. 45(a)] mandate the ERC to enforce market share limits of generators to 30% of installed capacity in any of the three regional grids and 25% of national installed capacity. In the case of the Visayan grid, both Global Business Power Corporation and Energy Development Corporation have essentially already reached this limit.
38. In 2008, the 25-year concession of the transmission network franchise was awarded to the NGCP in which the State Grid Corporation of China has a 40% stake. The NGCP is regulated by the ERC and under the EPIRA is mandated to “improve and expand its transmission facilities” to “adequately serve generation companies, distribution utilities, and suppliers requiring transmission service.” The NGCP’s role also includes the procurement of ancillary services necessary to maintain the stability and security of the grid.
39. Private investor-owned utilities are licensed to sell electricity within their distribution franchise areas and are similarly regulated by the ERC. In more rural and generally less developed areas, member-owned and not-for-profit electric cooperatives provide electricity to customers.
25 Executive Order 215 (EO 215) is supported by the Build–Operate–Transfer Laws of 1989 and 1994, and Republic Act no. 6957.

12 Philippines: Energy Sector Assessment, Strategy, and Road Map
40. The Philippine Electricity Market Corporation (PEMC) is a nonprofit entity that reports administratively to the DOE and has the mandate to manage the WESM. The PEMC produces the hourly generation schedules (based on generator market offers) which the system operator (NGCP) then uses to instruct the dispatch of the generation plants. The PEMC can set penalties for breaches of market rules and is governed by a 15-person board made up of representatives of the electricity industry and independent members. Intended to operate autonomously until a formal independent market operator could be appointed, operations of the WESM are being transferred to the Independent Electricity Market Operator of the Philippines which was established in June 2018.26
26 K. Manalo. 2018. Cusi Hands Over PEMC Control. Daily Tribune. 27 June. http://www.wesm.ph/inner.php/downloads/rfp_for_imo_operating_agreement.

13
A. Elec tric Power Subsector
1. Generation
41. In 2016, the Philippines generated 90.8 terawatt-hou rs of electricity27 (Figure 4). By December 2016, the total installed in the Philippines’ generating capacity had reached 21,423 megawatts (MW)—a year-on-year increase of 2,665 MW (16.2%).28
42. In the 1970s and 1980s, the country’s power sector experienced deteriorating service, perceived mismanagement, and high debt levels. An extended period of negligible capacity development compounded by the shelving of the 620 MW Bataan nuclear power project led to power shortages from 1989 which, at their height saw multiple 10-hour to 12-hour outages in Mindanao during 1990–1991 and frequent rotating brownouts lasting 8–10 hours in Luzon in 1992.29
27 Government of the Philippines, Department of Energy. List of Existing Power Plants. https://www.doe.gov.ph/list-existing-power-plants (accessed 26 June 2017).
28 Government of the Philippines, Department of Energy. 2017. Summary 2016 Power Statistics. https://www.doe.gov.ph/sites/default/fi les/pdf/energy_statistics/summary_2016_power_statistics_fi nal_march_27_2017.pdf.
29 G. Delgado. 2015. The Power Crisis in the 90s. Blog. Gaad Thinks.
IV Core Sector Issues
Figu re 4: Power Generation by Source in the Philippines, 1991–2016
TWh = terawatt-hour.Source: Government of the Philippines, Department of Energy.
TWh
Geothermal
Coal
Solar
Hydro
Oil
Biomass
Natural Gas
Wind
100
90
80
70
60
50
40
30
20
10
0
19901991
19921993
19941995
19961997
19981999
20002001
20022003
20042005
20062007
20082009
20102011
20122013
20142015
2016

14 Philippines: Energy Sector Assessment, Strategy, and Road Map
43. The Electric Power Crisis Act was passed in an effort to alleviate the crisis and was followed by an expansion of the private sector-oriented Build–Operate–Transfer Law that saw a surge in the construction of power stations by the private sector in the mid-to-late 1990s. The NPC signed around 22 government-backed PPAs with private sector independent power producers from 1991 to 1993, amounting to 2.65 GW of capacity. By 1997, the number of PPAs signed with private sector investors had reached 37. A significant block of generation capacity was developed around 2001 to utilize natural gas from the newly developed offshore Malampaya field.
44. These major capacity developments and corresponding PPAs coincided with a period of optimistic electricity demand forecasts. When the forecast demand did not materialize, parts of the Philippines—mainly in Luzon—were left with significant excess capacity and corresponding PPA-related costs. Coupled with the 1997 Asian Financial Crisis, this led to considerable debt accumulated in the sector. As demand grew and reserve margins decreased, excess coal-fired capacity decreased and reserve margins are now roughly tracking demand growth (Figure 5).30
45. Today, the overall energy mix of the Philippines for electricity generation is relatively diverse with significant indigenous fuel supply, mainly natural gas, some coal, and varied renewable energy resources.
46. Historical resource development policies have led to each main island region (Luzon, Visayas, and Mindanao) being characterized by a different fuel mix for power generation and exposed to different risks (Figure 6). Natural gas sourced from the large Malampaya fields is a
30 Government of the Philippines, Department of Energy. Philippine Power Statistics. Manila. (30 years: 1987–2016).
Figure 5: Supply and Reserve Margins in Luzon, 1987–2016
GW = gigawatt.Source: Government of the Philippines, Department of Energy.
GW16
14
12
10
8
6
4
2
0
1997
1996
1995
1994
1993
1992
1991
1990
1989
1988
1987
1998
1999
2000
2001
2002
2003
2004
2005
2006
2007
2008
2009
2010
2011
2012
2013
2014
2015
2016
Dependable Capacity Peak Demand Demand + Required Reserve

Core Sectors Issues 15
dominant feature of the Luzon region. Geothermal energy concentrated in Leyte and Negros is a distinctive feature of the Visayas region and accounts for around half of the power generation in that region. Highly seasonal hydro-based generation is the defi ning feature of the Mindanao power system. These signature resources are supplemented by coal-fi red capacity that accounts for 40%–50% in each of the three regions. Oil-fi red capacity remains a signifi cant feature of the Mindanao generation mix but its peaking role in Luzon and the Visayas has diminished in recent years due to much-improved capacity margins and the rise of solar and wind energy.
Figure 6: Generation in the Main Philippine Grids, 2016
TWh = terawatt-hour, WESM = Wholesale Electricity Spot Market.Source: Government of the Philippines, Department of Energy. 2017. 2016 Power Statistics—Gross Power Generation by Plant Type. https://www.doe.gov.ph/sites/default/fi les/pdf/energy_statistics/bgross_power_generation_by_plant_2016.pdf.
Geothermal
Coal
Solar
Hydro
Oil
Biomass
Natural Gas
Wind
90 TWh
Total Luzon Visayas
WESM
Mindanao
67 TWh 13 TWh 11 TWh
6%
48%
22%
9%
12%
4%
50%
30%
8%6%
5%
41%
46%
43%
27%
8%
22%
47. Luzon which accounts for around 73% of total generation in the Philippines has three large combined cycle gas-fi red power plants in Batangas (Sta. Rita, San Lorenzo, and Ilijan) of 2,880 MW aggregate installed capacity. These plants operate largely in a baseload regime due to the high take-or-pay gas quantities specifi ed in the Malampaya gas supply. This results in distortion of the merit order and displacement of coal. As a result, coal units have had to play the principal “swing” role in responding to load growth, seasonal demand patterns, diurnal demand cycles, variations in hydropower output, and temperature-dependent loads. The cost of electricity generated from the Malampaya natural gas is signifi cantly higher than the cost of an equivalent amount of electricity from existing or new coal-based capacity, resulting in an upward pressure on Philippine electricity prices. A more economic dispatch of the gas power stations would suggest the natural gas-based generation being concentrated in higher demand periods and during periods of planned or unplanned capacity outages.
16 Philippines: Energy Sector Assessment, Strategy, and Road Map
48. The government has sought to maximize the use of indigenous renewable resources since the enactment of the Renewable Energy Law in 2008. The DOE subsequently launched the National Renewable Energy Program (NREP) in 2011 which established targets and a road map by which to achieve them. The Philippines introduced a feed-in tariff (FiT) in 2015 which spurred the development and commercialization of 0.68 GW of solar capacity, 0.43 GW of wind, and 0.20 GW of biomass, adding to the existing 1.69 GW installed capacity for geothermal and 3.18 GW for hydropower.31 Despite these achievements, significant renewable energy potential remains untapped.
2. Demand
49. Total electricity consumption reached 888 kilowatt-hour per capita in 2016.32 Compared to other developing countries in Asia, economic development in the Philippines has been less energy-intensive (measured in electricity consumption per gross domestic product per capita) because of higher contributions to growth by the services sector. Nevertheless, development is coupled with electricity consumption and the demand continues to increase along with economic growth.
50. The DOE predicts peak demand for electricity in Luzon to grow by 4.78% annually from 2016 to 2040—from 9,726 MW in 2016 to 14,501 MW in 2025, reaching 29,852 MW by 2040.33 On face value, projects under development by the private sector are more than sufficient to meet the expected demand growth: the DOE reported a pipeline of 19,934 MW of capacity under development.34 This is comprised of 4,264 MW of “committed” projects due to go online from 2017 to 2022 and 15,670 MW of “indicative” projects from 2017 to 2025.35
51. The rate of peak demand growth for electricity in the Visayas is expected to be higher than in Luzon. The DOE projects peak demand in the Visayas to grow by 6.85% annually from 2016 to 2040—from 1,878 MW in 2016 to 3,427 MW in 2025, and 9,210 MW by 2040 (footnote 35). The DOE reported a pipeline of 4,095 MW of capacity under development by the private sector comprising 468 MW of “committed” projects and a further 3,627 MW of “indicative” projects (footnote 36). During 2016, the Visayas region rapidly transitioned into a state of oversupply following the addition of 323.9 MW of solar power plants in Negros and Leyte and two coal-fired plants totaling 285 MW in Panay.
52. Expectations for robust demand growth in Luzon and Visayas are mirrored in Mindanao. Historically undersupplied and subject to demand curtailment (power outages), recent additions of coal-fired capacity have eased curtailments and otherwise unmet demand leading to significantly increased electricity usage. Peak demand in Mindanao reached 1,653 MW in 2016.36 This is expected to grow by 7.54% every year from 2016 to 2040 to reach 3,456 MW by 2025 and 10,225 MW by 2040 (footnote 35). Despite the improved supply and demand situation, Mindanao’s hydropower supplies
31 Government of the Philippines, Department of Energy. 2017. FIT Monitoring Board Summary as of 31 December 2016. https://www.doe.gov.ph/national-renewable-energy-program?q=renewable-energy/fit-monitoring-board-summary.
32 Government of the Philippines, Department of Energy. 2017. 2016 Power Statistics - Electricity Consumption. https://www.doe.gov.ph/sites/default/files/pdf/energy_statistics/electricity_sales_and_consumption_2016.pdf; and footnote 3.
33 Government of the Philippines, Department of Energy. 2017. Power Development Plan 2016–2040. Manila.34 Government of the Philippines, Department of Energy. Private Sector Initiated Power Projects. https://www.doe.gov.ph/
private-sector-initiated-power-projects (accessed 27 June 2017).35 The DOE lists “indicative” projects as generally being those that are at the feasibility study, permitting, or pre-construction
stage in their project development. “Committed” projects have a higher degree of certainty that they will come online, have typically entered the construction phase of project development, and have a relatively fixed commercial operations date.
36 Government of the Philippines, Department of Energy. 2017. Annual System Peak Demand per Grid as of 2016. https://www.doe.gov.ph/sites/default/files/pdf/energy_statistics/annual_system_peak_demand_per_grid_2016.pdf.

Core Sectors Issues 17
are subject to variation due to water availability, particularly in El Niño years. Hydropower accounted for 52% of generation capacity in 2013, but even the current share of 27% is high enough to pose a risk of seasonal power shortages in future El Niño years. On the other hand, 1,289 MW of new capacity could come online by 2019 if all currently “committed” projects materialize and the DOE is tracking a further pipeline of 3,627 MW of capacity as being “indicative” (footnote 36).
53. Outside of the three main grid-based regions of Luzon, Visayas, and Mindanao, total off-grid demand amounted to 209.86 MW in 2015 (around 1.6% of total) (footnote 35). On smaller islands and isolated grids, power provision by new power providers, independent power producers, and qualified third parties is increasingly being encouraged but the NPC-Small Power Utilities Group still acts as the main provider in these regions. However, many of the areas served by the NPC-Small Power Utilities Group still do not get reliable and 24-hour electricity services. As of July 2017, of the 123 NPC-Small Power Utilities Group existing power plants nationwide, 76 are operating less than 24 hours per day, indicating unmet demand. Some small island electric cooperatives also operate diesel generator sets that may only provide 4 hours to 6 hours of electricity per day.37 Much of the off-grid demand lies on the islands of Masbate, Palawan, and Mindoro, and there are tentative plans by the NGCP to interconnect the latter to the main Luzon grid as discussed further in the succeeding section.
3. Transmission
54. Grid infrastructure across the Philippines will face increasing pressure for expansion and reinforcement to support demand growth. Grid development is invariably complicated by the difficulties of securing rights of way. Regional misalignments of supply and demand have become a prominent feature over the last 2 years, most notably in the Western Visayan regions of Panay and Negros where the addition of significant renewable energy capacity (mainly solar) has created grid congestion that limits the potential benefit of renewable energy resources in these locations.
55. The quality and strength of the grid within the Philippines is also subject to significant regional variation. Luzon, representing around 73% of total load requirements within the Philippines, has inherently been at the focus of grid infrastructure improvements. In 2016, transmission and distribution losses in Luzon were 7.87%, compared to 11.81% in Visayas and 13.68% in Mindanao (Figure 7).38
56. As the concessionaire responsible for managing, operating, and investing in the transmission grid, a heavy burden of responsibility rests on the NGCP to fulfill its mandate with the Energy Regulatory Commission (ERC) also playing a pivotal role in having to approve major capex projects. Projects in the NGCP’s most recent Transmission Development Plan (2014–2015) published in December 2016 underscore the differing stages of development of each of the three main regional grids.
57. The NGCP’s focus in Luzon is on strengthening the transmission system and improving reliability and resilience through extensions of the existing 500-kilovolt (kV) transmission backbone from around the main load center of Metro Manila and into the generation heartlands of Western Luzon and Batangas. The NGCP is also due to undertake a looping of the Northern Luzon 230 kV
37 National Power Corporation Small Power Utilities Group. 2017. Grid Statistics. http://www.spug.ph/index.php/2015-05-27-06-23-45 (accessed 1 December 2017).
38 Government of the Philippines, Department of Energy. 2017. 2016 Power Statistics—Electricity Consumption. https://www.doe.gov.ph/sites/default/files/pdf/energy_statistics/electricity_sales_and_consumption_2016.pdf; Government of the Philippines, Department of Energy. 2017. 2016 Power Statistics—Gross Power Generation by Plant Type. https://www.doe.gov.ph/sites/default/files/pdf/energy_statistics/bgross_power_generation_by_plant_2016.pdf.

18 Philippines: Energy Sector Assessment, Strategy, and Road Map
backbone which evacuates power generated by hydro assets in the region and the Burgos wind projects on the northern tip of the island. The arrival of the country’s first supercritical plant planned for operation in 2018, the Pagbilao Expansion (420 MW), requires an extra high voltage substation. It is likely that the NGCP will need to undertake sustained grid investment (approved by the ERC) to facilitate the entry of several other large coal-fired projects over the coming years.
58. In the Visayas, the NGCP is focused on alleviating grid constraints due to excess capacity from the raft of coal-fired and solar generation projects that came online during 2016 and to allow for further projects to enter the system. Under the FiT program, Negros saw the addition of 279 MW of solar capacity during March and April 2016 which amounts to 57% of the total solar capacity under the program on an island where peak demand reached 316 MW in 2016. The must-dispatch status solar is afforded and the variability of generation has posed grid management challenges.
59. The situation in the Visayas has led to the NGCP having two main priorities within the region. First, they intend to procure additional ancillary services, particularly regulating reserves (frequency response) to manage the effects of fluctuations in supply due to solar generation variability. Second, they intend to advance the Cebu–Negros–Panay 230-kilovolt backbone project which is comprised of three phases:
(i) Phase 1. This involves an expansion of the Negros–Panay submarine interconnection from 180 MW (138 kV) to 330 MW (230 kV).
(ii) Phase 2. This entails upgrading of the Negros overground transmission network to 230 kV to improve grid stability and support capacity additions.
(iv) Phase 3. This is an expansion of the Negros–Cebu submarine interconnection from 180 MW (138 kV) to 580 MW (230 kV).
60. In Mindanao, which has experienced sustained supply deficits in the past, the focus of the NGCP has largely been on transmission projects that facilitate the entry and full utilization of new generation capacity particularly new coal-fired plants such as Therma South, FDC Misamis, SMC Malita, and GNPower Kauswagan. Transmission projects to support these projects include the Mindanao 230 kV transmission project, the Malita–Matanao 230 kV transmission line project, and Baloi–Kauswagan–Aurora 230 kV transmission line project.
Figure 7: System Losses in the Philippines
Source: Government of the Philippines, Department of Energy..
17.5%
15.0
12.5
10.0
7.5
5.0
Luzon Visayas Mindanao
20032004
20052006
20072009
20102011
20122013
20142015
20162008

Core Sectors Issues 19
62. The NGCP’s Transmission Development Plan includes strategic interconnection transmission projects to further strengthen inter-grid power management:
(i) the Visayas–Mindanao Interconnection Project, expected to be completed by December 2020, which received the ERC’s approval in September 2017 as discussed further in paras. 111–118; and
(ii) the Batangas-Mindoro Interconnection Project expected to be completed by March 2021 but remains subject to the ERC’s approval.
63. In addition to the projects proposed in the NGCP’s Transmission Development Plan, discussions are ongoing regarding a Palawan–Sabah transmission interconnection that has been proposed by the Brunei Darussalam–Indonesia–Malaysia–The Philippines East Association of Southeast Asian Nations Growth Area. The timing and scale of the prospective link is unclear.
Table 2: Current Transmission Interconnection Capacity in the PhilippinesInterconnection MW / Type Commenced OperationsSouth Luzon–Leyte 440 MW
Monopolar, 350 kV HVDCAugust 1998
Leyte–Bohol 90 MWRated at 100 MW, 138 kV
August 2004
Leyte–Cebu 185 MWRated at 200 MW, 230 kV
1997
+ 185 MWRated at 200 MW, 230 kV
October 2005
Cebu–Negros 90 MWRated at 100 MW, 138 kV
1993
+ 90 MWRated at 100 MW, 138 kV
2007
Negros–Panay 85/90 MWRated at 100 MW, 138 kV
1990
+ 90 MWDesigned at 230 kV but initially energized at 138 kV
January 2017 (Commissioned from October 2016)
HVDC = high-voltage direct current, kV = kilovolt, MW = megawatt.Source: National Grid Corporation of the Philippines Transmission Development Plan.
61. Another priority of the NGCP is increased interconnectivity among the major grids. The Luzon grid has been physically interconnected with Leyte in the Visayas grid since 1998 via a 440 MW capacity link that facilitated the landmark Leyte–Luzon Geothermal Project. The wider subgrids comprising the Visayas are each linked via smaller interconnections that, except for Leyte–Cebu (370 MW capacity), range from 90 MW to 180 MW capacity and are energized at lower voltages (Table 2).

20 Philippines: Energy Sector Assessment, Strategy, and Road Map
4. Distribution and Retail
64. The distribution sector in the Philippines is served by regulated distribution utilities which encompass private investor-owned utilities, electric cooperatives, and Ecozone utility enterprises. Distribution utilities directly connect and bill consumers and purchase wholesale electricity through bilateral contracts or from the spot market. Since the introduction of retail competition and open access in December 2012, these distribution utilities have been complemented by unregulated retailers classified as retail electricity suppliers and local retail electricity suppliers.
65. Private investor-owned utilities typically operate in the largest cities while electric cooperatives are member-owned, not-for-profit, and smaller entities that tend to operate in more rural locations serving residential loads.39 Across the 120 electric cooperatives that operate in the Philippines, the quality in their operations, financial health, and organizational capability are highly variable. The National Electrification Administration (NEA) oversees and supports electric cooperatives at an operational, technical, and sometimes financial aid with the aim of implementing the Rural Electrification Program.
66. Distribution grid reliability in the Philippines has improved in recent years though areas served by privately-owned distribution utilities experienced markedly higher service quality compared to those of electric cooperatives. For customers of Meralco, the incumbent distribution utility in Luzon that supplies approximately 60% of the region’s electricity, an average of 0.91 hours was unmet and 2.18 outages occurred per customer in 2016.40 Both measures have been on an improving trend with the underlying performance-based regulation providing the necessary incentive.
67. By comparison, the NEA reported that during 2015 a total of 96 electric cooperatives (79% of total) fell within the NEA standard of 25 interruptions per year for grid-connected customers and 30 interruptions per year for off-grid customers, 21 electric cooperatives were above the standard, and 4 electric cooperatives did not submit data (footnote 43). With respect to duration of service interruptions during 2015, 106 electric cooperatives fell within the NEA’s standard of 45 hours of unmet demand per year for on-grid end users and 62.25 hours per year for off-grid end users, while 11 electric cooperatives failed to meet these levels and 4 electric cooperatives did not submit data (footnote 43).
B. Energy Efficiency
68. The government has several active programs aimed at promoting energy savings and energy efficiency as described in the near-term National Energy Efficiency and Conservation Action Plan (2016–2020), prepared in conjunction with the European Union and a longer-term Philippine Energy Efficiency Roadmap (2014–2030). While the action plan and road map are aspirational rather than binding, the government’s objective is to achieve a cumulative reduction in final energy demand of 10% by the end of the 2011–2030 period.
69. The action plan sets out a number of initiatives across all-energy-using sectors which include establishing guidelines for a stronger institutional framework, improving the availability of energy
39 Private investor-owned utilities mainly operate in the largest cities, such as Meralco in Metro Manila and nearby provinces, VECO in Metro Cebu and the surrounding municipalities, and the Davao Light and Power Company in Davao, Mindanao.
40 Government of the Philippines, National Electrification Administration. 2015. http://www.nea.gov.ph/2015-ecs-compliance-reports?download=1485%3A4th-quarter-compliance-report-of-2015; Compliance Report on the Performance of Electric Cooperatives for the Fourth Quarter of 2015; Meralco. 2016. 2016 Annual Report. https://meralcomain.s3-ap-southeast-1.amazonaws.com/documents/pdf_listing/2017-11/1496105620.ffbcea0a2f3d9d679cae7ada384bd720.pdf?null.

Core Sectors Issues 21
efficiency financing and establishing performance monitoring frameworks to improve compliance.41 Meanwhile, the road map identifies high-level measures for industry, transport, commercial buildings, and residential consumers, with a target of a 40% reduction in energy intensity by 2030 compared to the 2010 baseline. Proposed measures in the road map include enforcing vehicle standards and road taxes and developing performance standards for motors used in the industry sector and specific energy efficiency programs for low-income households, supported through stronger coordination across all levels of government.42
70. The enactment of a Law on Energy Efficiency and Conservation has been marked as one of the short-term strategic objectives in the road map and the action plan. On 14 August 2017, the House Committee on Energy approved a draft substitute bill that consolidated eight other bills and seeks to institutionalize energy efficiency and conservation, enhance the efficient use of energy, and grant incentives to energy efficiency and conservation projects.43
71. Within the broader Association of Southeast Asian Nations region, the Philippines is also relatively active in the field of energy efficiency supporting the Asia-Pacific Economic Cooperation targets that include the reduction of aggregate energy intensity by 45% by 2035 using 2005 as a base year. Energy efficiency in the construction sector as well as “climate proofing” is promoted (for instance, in the national Climate Change Action Plan); however, operational targets are not yet established except for the 10% general energy saving target.
C. Energy Resource Subsectors
1. Oil
72. The Philippines has depended heavily on oil imports: in 2016, 87% of the country’s supply of crude oil was imported from the Middle East (36.1% from Saudi Arabia, 33.6% from Kuwait, and 13.3% from the United Arab Emirates).44 Foreign dependence on oil has left the Philippines vulnerable to price volatility, an issue that was especially pronounced during the oil crisis of the 1970s.45 The Philippine National Oil Corporation (PNOC) was established in response to the oil crisis and its efforts have included the exploration of domestic oil production opportunities along with broader measures to expand the domestic energy industry.46 The Petroleum Board was created in 1972 to oversee oil exploration and development with PNOC serving as chairman. These responsibilities were later transferred to the DOE.
73. Although the country’s oil industry has remained small, there have been a few minor production opportunities in the area. The first large oil fields were discovered in July 1977 and January 1978 in the Palawan Basin (Nido-A and Nido-B) and were brought into production soon
41 Government of the Philippines, Department of Energy. 2015. National Energy Efficiency and Conservation Action Plan 2016–2020. Manila.
42 Government of the Philippines, Department of Energy. 2013. Philippine Energy Efficiency Roadmap 2014–2030. Manila.43 Government of the Philippines, House of Representatives. 2017. EEC Substitute Bill Gets Green Light from House.
14 August. http://www.congress.gov.ph/press/details.php?pressid=10174.44 Government of the Philippines, Department of Energy. 2016. Oil Supply/Demand Report. https://www.doe.gov.ph/
downstream-oil.45 I. Gorre, E. Magulgad, and C. A. Ramos. 2012. Philippines: Seizing Opportunities, Increasing Transparency and Accountability in
the Extractive Industries. Jakarta: Revenue Watch Institute.46 Philippine National Oil Company. About PNOC. http://www.pnoc.com.ph/aboutpnoc.php?sectionid=ac587724-1514-
11df-a7de-92d1637a39b1.

22 Philippines: Energy Sector Assessment, Strategy, and Road Map
after. At the peak of their production in 1979, Nido-A produced 13,000 barrels per day while Nido-B produced 29,000 barrels per day.47 A third oil field, Mantiloc, also in the Palawan basin, was discovered in January of 1978 and began production in July 1983. These fields continue to produce oil periodically in line with changes in the price of oil.
74. A few other oil fields were subsequently discovered including the Galoc field and the West Linapacan Fields, both discovered in 1981. The Malampaya oil and gas field, the country’s largest source of domestic gas, was discovered in 1992. In 1997, the DOE sought to further develop the oil industry by launching the “Window of Opportunity,” a 3-year period for petroleum exploration near the Malampaya field that spanned from June 2000 to June 2003.48
75. In June of 2011, the DOE accepted bids for the 15 contract areas collectively spanning 10 million hectares within the East Palawan and Mindoro–Cuyo basins along with other promising locations for exploration in Cagayan, Central Luzon, the Visayas, and Agusan–Davao.49 Another contracting round opened in June 2014 offering 11 areas primarily in Luzon. In both contracting rounds, the DOE offered 7-year contracts for exploration and 25-year contracts for production.50
76. There are currently 26 petroleum service contracts in the Philippines.51 In recent years, the Galoc field on the northeast coast of Palawan has been the most productive whereas output from Nido, Mantinloc, and North Mantinloc has been minimal.52 The Galoc oil field had produced 1.87 million barrels with 1.54 million barrels of proved reserves as of December 2016.53
77. Investment on promising blocks in the waters west of the Philippines may augment the domestic supply of oil in the country. Promising blocks including the Red Bank may hold some of the richest deposits in the region estimated to be between 764 million and 2.2 billion barrels of oil equivalent, in addition to natural gas reserves.54 Without development of these fields, the Philippines faces a dwindling supply of domestic oil.
2. Gas
78. To date, the Malampaya field remains the only meaningful source of indigenous gas within the Philippines, supporting 2,880 MW of gas-fired generation capacity in Luzon. In addition to the older Sta. Rita, San Lorenzo, and Ilijan plants which have take-or-pay contracts and thus operate as baseload, newer gas plants also use gas from Malampaya including the San Gabriel mid-merit and Avion peaking plant. Production levels from the Malampaya gas field are expected to decline from 2024 onward, eliminating a significant source of domestic gas and impacting significant generating
47 Nido Petroleum Limited. SC 14A & 14B—Nido and Mantiloc Oil Fields. http://www.nido.com.au/irm/content/sc-14a-14b -nido-mantiloc-oil-fields.aspx?RID=237.
48 Government of the Philippines, Department of Energy. 2000. Department Circular No. 2000-05-009. https://www.doe.gov.ph/department-circular-no-2000-05-009.
49 Government of the Philippines, Department of Energy. 2017. Energy Resource Exploration. https://www.doe.gov.ph/energy-resource-exploration (accessed 1 August 2017).
50 Government of the Philippines, Department of Energy. 2014. DOE to Launch PECR5 on Coal and Petroleum Exploration. https://www.doe.gov.ph/doe-launch-pecr5-coal-and-petroleum-exploration.
51 C. J. L. Petilla. 2013. Investment Opportunities in the Philippine Energy Sector. Presentation at the Investment Symposium for Energy Sector in the Philippines at the Institute of Energy Economics. 4 October.
52 Oxford Business Group. 2014. Onshore Oil Potential in the Philippines. 20 August. http://www.oxfordbusinessgroup.com/news/onshore-oil-potential-philippines.
53 Nido Petroleum Limited. 2016. Annual Report. http://www.nido.com.au/irm/PDF/2621_0/AnnualReporttoShareholders.54 E. Cruz. 2014. Reuters. 9 May.

Core Sectors Issues 23
capacity. San Gabriel and Avion were built with the intent to switch to regasified imported liquefied natural gas (LNG) upon depletion of Malampaya.
79. Continued exploration under existing petroleum service contracts has not yielded commercial quantities of natural gas. In the absence of the discovery and commercialization of further indigenous gas, the decline of Malampaya will see the Philippines necessarily source LNG to fuel existing and new gas-fired generation. One prerequisite to importing LNG to the Philippines will be the development of gas infrastructure such as an LNG terminal, floating storage and regasification units, and pipelines, which the Philippines currently does not have and would require significant capital investment. Given its current reliance on Malampaya gas as well as its overall grid size, Luzon is the most likely region for development of such a project. Batangas, Limay, Atimonan, and Sual have received attention over the years as potential sites to develop an LNG import terminal in Luzon. However, the only terminal under construction to date is that of Energy World Corporation Limited (near Pagbilao), though it remains challenged by funding and transmission requirements.
80. Uncertainty around how LNG-fueled gas generation will fit economically and commercially into the current electricity generation system given its relatively higher marginal cost and positioning behind renewables, take-or-pay gas generation, and coal in the merit order, has complicated and slowed private investment in gas infrastructure. The increasing contribution of solar generation during peak daytime demand hours, for instance, has reduced the need for generation from oil-fired peaking plants in the country (and thus reduced the potential opportunity for gas-fired generation to achieve a similar result). Given projected cost declines, increasing solar generation could conceivably directly erode the share of mid-merit or peaking gas generation required. PNOC is exploring an LNG hub in Batangas with a regasification unit, storage facility, power plant, and associated infrastructure. In January 2018, PNOC and the Asian Development Bank (ADB) signed an agreement under which ADB will advise on the project including the award and execution of related contracts.
3. Coal
81. The energy sector in the Philippines is highly reliant on coal. Total consumption of coal reached 20.3 million metric tons (Mt) in 2016, reflecting a 10-year compound annual growth rate of 10.8%.55 The first coal-fired plant in Pagbilao was commissioned in 1996 and output from coal-fired generation has since grown to account for 48% of total power generation in the country as of 201656 and power generation was responsible for 79.8% of coal consumption in 2015.57 Owing to its affordability, coal power predominates baseload generation capacity.58
82. Despite its rapidly increasing coal consumption, the Philippines has relatively modest indigenous reserves; total domestic coal reserves are estimated at 316 Mt59 and domestic coal production reached 12.1 Mt in 2016 (footnote 60). Domestic coal production is concentrated on Semirara Island with mines owned and managed by the Semirara Mining and Power Corporation accounting for around 96% of total coal production in the country. A large portion of domestically-produced coal is designated for use by just two generating units owned by the SEM-Calaca Power Corporation, a subsidiary of the Semirara Mining Corporation. Both are 300 MW units, generally operating at 50%–60% utilization. A potential new 700 MW project in Batangas to be developed
55 Government of the Philippines, Department of Energy. Overall Coal Statistics as of 2016.56 The distribution is 50% in Luzon, 41% in Visayas, and 43% in Mindanao.57 Government of the Philippines, Department of Energy. 2015 Coal Statistics. 58 Government of the Philippines, Department of Energy. 2016 Philippine Power Situation Report.59 Broken down, 170 Mt is subbituminous coal, 105 Mt is lignite, and 41 Mt is bituminous coal and anthracite.

24 Philippines: Energy Sector Assessment, Strategy, and Road Map
under a joint venture agreement between the Semirara Mining and Power Corporation and Meralco and subject to ERC approval would likely also source Semirara coal.60
83. The rapid development of the electricity sector combined with limited indigenous reserves means that the Philippines has had to import a large proportion of the coal it consumes. In 2016, coal sourced internationally amounted to 20.0 Mt with Indonesia accounting for 89.8% of all imports.61
84. Coal consumption in the Philippines is expected to increase fivefold by 2040.62 Acknowledging the importance of the fuel to the power sector and the reliance on imports from overseas, the government has made a concerted effort in recent years to expand coal production through additional operating contract offerings. In December 2011, the DOE offered 30 new operating contracts that would expand mining exploration and operations in Mindanao and the Visayas.63 The DOE’s 2012–2030 energy plan targets doubling of domestic coal production by 2030. Since the publication of this plan, the DOE has granted contracts to five companies to operate in seven new areas in Mindanao. As of July 2016, the DOE had issued 30 coal operating contracts for development and production and 48 contracts for coal exploration with 83 small-scale coal mining operators participating.64
85. While the DOE has pursued a drastic expansion of domestic coal production, there are environmental concerns with this trajectory. In late 2016 and early 2017, there was a crackdown on violations of environmental standards for mining that had previously been poorly enforced. Within 9 months the closure of 26 mines had been ordered and 75 mining licenses had been suspended,65 and debates ignited over whether coal or renewable energy will better serve the country going forward. The Philippines continues to grapple with this question of whether to commit to building new coal-fired power plants, a long-term investment, given that solar and other renewable energy technologies are expected to become increasingly cost-competitive in the coming decades.
4. Geothermal
86. The Philippines has a long history of utilizing indigenous geothermal resources in electricity generation and currently ranks as the third largest producer of geothermal energy globally, behind the United States and Indonesia. In 1978, Presidential Decree No. 1442 provided the platform for the exploration and development of geothermal resources within the Philippines following a successful pilot project at Palinpinon on Negros in 1977. Under this Presidential Decree, 13 contracts were awarded by the DOE to five domestic firms through public bidding and negotiation which allowed for up to 7 years of exploration and up to 43 years of production.66
60 J. Kessels and P. Baruya. 2013. Prospects for Coal and Clean Coal Technologies in the Philippines. London: IEA Clean Coal Centre.
61 Government of the Philippines, Department of Energy. Coal Importation by Country as of 2016. https://www.doe.gov.ph/coal-importation-by-country (accessed 11 August 2018).
62 Institute of Energy Economics, Japan. Asia/World Energy Outlook 2016. http://eneken.ieej.or.jp/data/7199.pdf.63 Government of the Philippines, Department of Energy. Coal. https://www.doe.gov.ph/coal-overview.64 Asia Pacific Energy Research Center. 2013. APEC Energy Demand and Supply Outlook Fifth Edition. Tokyo.65 K. Schneider. 2017. Gina Lopez, Philippine Environmental Secretary, Pursues Watershed Protection. Circle of Blue. 10 April.
http://www.circleofblue.org/2017/water-policy-politics/gina-lopez-philippine-environment-secretary-pursues-watershed-protection/.
66 Under Presidential Decree No. 1442, geothermal service contracts allowed for 5 years of exploration, which could be extended by a further 2 years, and geothermal operating contracts allowed for 25 years of production, which could be extended by a further 18 years.

Core Sectors Issues 25
87. Since the development of the country’s first commercial geothermal power plant at Makban on Luzon in 1979, geothermal resources have grown to provide a large source of baseload electricity generation. As of 2016, installed capacity of geothermal power plants had reached 1,916 MW providing 12.2% of the country’s total electricity requirements (footnote 28). The majority of the country’s geothermal generating capacity is situated on the islands of Leyte and Negros and accounted for 46% of the generation in the Visayas region (footnote 28).
88. Despite the DOE estimating geothermal resources having the potential to support over 4,000 MW of geothermal capacity, more than twice the current installed capacity, only two projects are currently under development though there are several projects at a pre-development or exploration stage. The Energy Development Corporation’s 40 MW BacMan Expansion is expected to commence operations by the fourth quarter of 2018, while the time frames for Biliran Geothermal Inc.’s 49 MW project in Leyte are less certain due to issues encountered with the acidity of geothermal brine.
5 Hydropower
89. Hydropower plays an important role in the country’s generation mix, providing almost a fifth of the country’s total indigenous electricity supply (around 18% as of June 2016). The total installed capacity across the Philippines was 3,618 MW as of June 2016, with 2,537 MW in Luzon, 1,061 MW in Mindanao, and a more modest 20 MW in the Visayas (footnote 28).
90. Grid-based hydropower generation takes several forms, namely storage hydropower, pumped storage, and run-of-river (RoR). The Philippines boasts some of the largest storage hydropower plants in Southeast Asia including the San Roque Dam built in 2003 with a capacity of 435 MW. RoR hydropower is an important source of power generation in the Philippines but plant sizes typically range between 5 MW and 70 MW, which is significantly smaller than storage hydropower.67 To promote the development of new RoR capacity, the DOE is offering a FiT to qualifying projects. However, the development has been slow relative to other renewable energy technologies covered under the FiT with only 10.6% (26.6 MW) of the 250 MW quota for the technology reached 5 years after the start of the program. However, there are 190.2 MW of projects that have received a certificate confirming commerciality and will likely go online by the end of 2019.
91. Storage hydropower provides an important source of reserve capacity and other forms of ancillary services to the grid, owing to it being among the most responsive forms of generation capacity.68 The flexibility and responsiveness of storage hydropower generation also means that it is well-positioned to dispatch opportunistically and capture price volatility in the Wholesale Electricity Spot Market (WESM). As such, hydropower assets typically tend to lack bilateral power purchase contracts. However, an important challenge associated with hydropower generation in the Philippines stems from the seasonal fluctuations in generation that result from intra- and inter-year variations in precipitation and temperatures. In most years, plants have a significantly higher capacity factor in December through March following the end of the rainy season when storage hydro reservoirs are full. In 2011–2016, the average capacity factor for January through March (first quarter) was around 51% compared to 15%–20% for the remaining quarters of the year. This variation in availability also typically corresponds to seasonality in electricity demand. In the drier and hotter periods during the second and third quarters of the year, WESM prices would more likely be higher than in the first and fourth quarters. The climatic cycles of El Niño and La Niña have a similar impact on hydro availability and WESM prices.
67 Except for the 255 MW Pulangi 4 RoR hydropower plant in Mindanao, the largest RoR plant in the Philippines is the 70 MW Bakun facility in Luzon.
68 Ramp rates of 20 MW per minute are not untypical for storage hydropower plants.

26 Philippines: Energy Sector Assessment, Strategy, and Road Map
92. Hydropower plants also pose challenges at a social and environmental level and there are concerns that construction of newer and larger dams may exacerbate water shortages, impact local ecosystems, and displace indigenous populations. The recently announced 500 MW Wawa pumped storage project targets completion of construction by 2022 and will likely impact six communities and alter the downstream watershed.69
93. The majority of hydropower capacity in the Philippines is owned and operated by independent power producers; however, among the remaining assets for the Power Sector Assets and Liabilities Management Corporation to privatize are two large hydropower complexes in Mindanao, Agus and Pulangi, with a combined installed capacity of 982.1 MW. The NPC continues to operate these generating assets which are subject to political challenges due to the power facilities (or their ultimate water sources) being in the Bangsamoro area of Mindanao, with some rights to the output being given locally as part of the peace process. Historically, the optimal mode of operating these hydropower assets has been unclear considering the historical supply shortages and curtailments. With the new coal-fired capacity that has come online during 2015–2016, it is likely that the operating regime for these hydropower assets will be more flexible and peaking-oriented. If so, it may be beneficial to study the system to identify optimal future water management and hydro-generation practices.
6. Biomass and Biofuels
94. The Philippines was the first country in Southeast Asia to enact biofuels legislation, offering tax exemptions for biofuel production and use under the Biofuels Act of 2006. The Biofuels Act set bioethanol blending targets for the transport sector at 10% and 5% for biodiesel with sugarcane and coconut oil being the preferred feedstock. This was followed in 2011 by a DOE-issued mandate for a minimum 10% blend of bioethanol in all gasoline distributed and sold in-country to be increased to a 20% blend by 2020.70 It is estimated that 27 bioethanol plants would be required to meet the targeted 20% blend; as of December 2016, the country had only 10 registered bioethanol projects with the capacity to produce 282.1 million liters per year and 11 registered biodiesel projects with the capacity to produce 614.9 million liters per year (footnote 20). There are five additional biofuels projects that are in the process of accreditation.
95. Biomass and biofuels make a small but meaningful contribution to the power sector. As of December 2016, there were 16 existing biomass-fueled power plants in the Philippines, of which 9 were in Luzon, 6 in the Visayas, and 1 in Mindanao. Four more had been approved but were not yet operational. Of these plants, nine run on bagasse (residue from sugarcane processing), four on rice-husks, and three use a landfill gas recovery system.71 They collectively provide 233 MW of installed capacity, or alternatively 157 MW of dependable capacity which is 0.8% of the country’s dependable capacity.
96. As part of its commitment to expanding the renewable energy sector and reducing carbon emissions, the DOE has sought to grow biomass for use in power generation. The National Renewable Energy Program (NREP) targeted 276.7 MW of installed biomass power generating capacity which was exceeded by the end of 2016 when the installed capacity had reached 352.8 MW (footnote 20).
69 Olympia Violago Power. 2015. 500MW Wawa Pumped-Storage Hydropower Project-Environmental Impact Assessment. http://119.92.161.2/embgovph/Portals/21/News%20and%20Events/Public%20Hearing/olympia%20violaga/(1)%20EXECUTIVE%20SUMMARY.pdf.
70 Government of the Philippines, Department of Energy. 2011. DC2011-02-0001: Mandatory Use of Biofuel Blend. https://www.doe.gov.ph/sites/default/files/pdf/issuances/DC2011-02-0001.pdf.
71 Government of the Philippines, Department of Energy. List of Existing Power Plants. https://www.doe.gov.ph/list-existing-power-plants (accessed 26 June 2017).

Core Sectors Issues 27
Under the Renewable Energy Law of 2008, FiT rates were made available for biomass-generated power up to a quota of 250 MW. According to the Summary of Renewable Energy Projects as of 31 December 2017 posted in the official website of the Department of Energy, total installed biomass generating capacity had reached 407.2 MW.
97. While biomass makes a relatively small contribution to power production, it fuels a variety of other industrial and household needs including cooking and heating, crop-drying, and mechanical and electrical applications. Most households still rely on traditional biomass fuels for cooking. While there was a slight decrease in the use of fuelwood by households from 2004 to 2011, the use of charcoal increased by 5% and biomass residues by 4% in 2011. Based on the 2011 Household Energy Consumption Survey by the Philippine Statistics Authority and the DOE, 54% of the households were still using fuelwood, 35% were still using charcoal, and 20% were still using biomass residues (footnote 19).
7. New Forms of Renewable Energy
98. The Renewable Energy Act of 2008 aims to accelerate the exploration, commercialization, and development of renewable energy resources with the aim of achieving energy self-sufficiency, reducing dependence on fossil fuels, and contributing to slower growth in greenhouse gas (GHG) emissions. The Renewable Energy Act created the National Renewable Energy Board (NREB) to supervise the implementation of that law and as a recommending body on renewable energy policies and action plans for implementation. It is headed by a chairman and one representative each from the DOE, Department of Trade and Industry, Department of Finance, Department of Environment and Natural Resources, NPC, National Transmission Corporation or National Grid Corporation of the Philippines (NGCP), PNOC, Philippine Electricity Market Corporation, renewable energy developers, government, financial institutions, private distribution utilities, electric cooperatives, and nongovernment organizations. Applications for renewable energy service contracts are reviewed by a board composed of members of the DOE’s Renewable Energy Management Bureau.72
99. Under the NREP of 2011, the policy framework for implementing the Renewable Energy Act, the DOE is aiming to almost triple the renewable energy capacity from 5,438 MW in 2010 to about 15,304 MW by 2030.73 This highly ambitious plan comprises technology-specific targets by region which notably includes an additional 1,495 MW (75%) of geothermal capacity by 2030, 5,394 MW (160%) of hydropower, and 2,345 MW of wind power. Of the 9,866 MW of renewable energy capacity additions targeted by 2030, 72.4% are intended for Luzon. Many goals of the NREP have yet to be achieved. While the program was fashioned around policy road maps for each of the identified technologies, the targets remain contingent on a combination of policy mechanisms, technological advancements, cost reductions, and resource development (among others) all being successful.
100. The FiT and Renewable Portfolio Standard (RPS) were intended to be two of the principal policy mechanisms to realize the NREP targets. An RPS through which distribution utilities would be mandated to source a specific portion of their electricity supply from eligible renewable energy generation (incremental targets up to 35% by 2030) has yet to come into effect some 6 years after the publication of the NREP and despite it being mandated by the Renewable Energy Act of 2008. The introduction of the RPS would likely be complemented by a renewable energy certificates Market to provide a venue for the trading of renewable energy certificates that correspond to renewable electricity generated. The DOE continues to work to address industry concerns and combat the perception that
72 Government of the Philippines, Department of Energy. 2009. Departmental Circular No. 2009-07-0011. https://www.doe.gov.ph/department-circular-no-2009-07-0011.
73 Government of the Philippines, Department of Energy. 2011. Renewable Energy Plans and Programs (2011–2030). Manila.

28 Philippines: Energy Sector Assessment, Strategy, and Road Map
such a large increase in renewable energy under the RPS will increase end-user costs, which is not consistent with a WESM study concluding that there is likely to be a net benefit to consumers.74
101. In 2012, the Energy Regulatory Commission (ERC) approved 20-year FiT rates for eligible renewable energy generators with quotas for several newer renewable energy technologies (Table 3). FiT rates are recommended by the NREB and approved by the ERC and are designed to cover the cost of capital investment, connection to transmission or distribution network, and a market-based return of capital.
102. Solar photovoltaic and wind have been the main beneficiaries of the FiT program: at 526 MW, the solar quota is oversubscribed (105.2%), and subscribed wind capacity of 394 MW nearly exhausts the quota (98.5%). Growth in biomass has been steadily increasing, and a further 13 MW of FiT-approved projects were under construction at the end of 2016. Additionally, 190.2 MW of RoR hydropower could feasibly go online by 2019 given the projects progressing in Panay and Mindanao. Figure 8 highlights the development of FiT-eligible renewable energy capacity since the inception of the program. Once quotas are met as has been the case with a small number of solar projects, plants must wait for an increase in the quota or sell electricity without the FiT subsidy either via bilateral contracts or through the WESM.
103. A host of other countries including Argentina, Canada, Mexico, Germany, and the People’s Republic of China conducted auctions in 2016 to bring new renewable energy capacity to the market. Unlike the design of the country’s FiT program where the NREB sets a predefined FiT rate, renewable
74 Philippine Electricity Market Corporation. 2016. Forecast, the Philippine Electricity Market Corporation Journal. Manila. http://www.wesm.ph/download.php?download=RExEQkZvcmVjYXN0XzIwMTYucGRm.
Table 3: Approved Feed-In Tariff Rates as of 31 December 2016
TechnologyBase FiT Rate
(P/kWh)Adjusted FiT*
for 2017Quota (MW)
Approved for FIT (MW)
Degression Rate (from effectivity
of FiT)Biomass 6.63 7.25 250 105.1
(42.0%)0.5%
(from Y+2)Hydro (RoR) 5.90 6.64 250 26.6
(10.6%)0.5%
(from Y+2)Solar PV (FiT1) 9.68 n/a 50 526.0
(105.2%)6.0%
(from Y+1)Solar PV (FiT2) 8.69 n/a 450 6.0%
(from Y+1)Wind (FiT1) 8.53 n/a 250 393.9
(98.5%)0.5%
(from Y+2)Wind (FiT2) 7.40 7.61 150 0.5%
(from Y+2)FiT = feed-in tariff, kWh = kilowatt-hour, MW = megawatt, PV = photovoltaic, RoR = run-of-river.Note: FiT rates for installed capacity are subject to annual adjustments for local inflation and foreign exchange. Approved FiT capacity is that which has received a certificate of endorsement. Two years (1 year for solar) after the effectiveness of the prevailing FiT rate, a new rate (reduced by the degression rate) becomes applicable.Source: Government of the Philippines, Department of Energy. 2012–2015. Energy Regulatory Commission (case no. 2011-006M, 27 July 2012; case no. 2014-004RM, 27 March 2015, resolution N° 14, 6 October 2015). Manila.

Core Sectors Issues 29
energy auctions can allow for greater price discovery and are considered both cost-effi cient and transparent.75 Given the current funding issues facing the FiT program in the Philippines, as explored in paras. 119–123, renewable energy auctions could instead provide a mechanism that improves aff ordability and transparency if they were to be adopted by the DOE in place of an expansion of the FiT.
104. Other incentives actively promoting the utilization of renewable energy resources in the Philippines include the following:
(i) A net metering program, which commenced in 2014, allows end users producing their own energy at facilities of less than 100-kilowatt (kW) capacity (e.g., via rooftop solar panels) to export their excess energy to the grid. Exported energy is paid at rates corresponding to the blended generation charge of the distribution utilities. Like the FiT, electricity generated under net metering agreements has priority of dispatch ahead of other forms of generation.
(ii) The exemption from value-added tax from the cost of energy consumed from renewable energy technologies creates a relative cost advantage of currently 12%.
(iii) There are tax incentives, exemptions for import duty for renewable technology imports, and cash incentives for renewable missionary electrification.
105. The government has also announced a fuel mix target of 30% for both renewables and gas. However, these targets are not supported by binding policy rules or incentive schemes and their appropriateness at national and regional levels have not been fully evaluated.
75 International Renewable Energy Agency. 2017. Renewable Energy Auctions: Analysing 2016. Abu Dhabi.
Fi gure 8: Installed Renewable Energy Capacity under the Feed-In Tariff Program
FiT = feed-in tariff , MW = megawatt.Source: Government of the Philippines, Department of Energy.
200
400
600
800
1,000
1,200
MW
Inst
alle
d
0
October 2014
November 2014
December 2014
January 2015
February 2015
March 2015
April 2015
May 2015
June 2015
July 2015
August 2015
September 2015
October 2015
November 2015
December 2015
January 2016
February 2016
March 2016
Wind FiT2 Solar FiT2Wind FiT1Solar FiT1Hydro FiT1Biomass FiT1

30 Philippines: Energy Sector Assessment, Strategy, and Road Map
Figure 9: Retail Tariffs for Residential Customers as of September 2017
kWh = kilowatt-hour, $ = United States dollar.Note: Tariffs are based on 200 kWh monthly consumption. Where more than one supplier operates in a particular locale, tariffs for the largest supplier (by number of customers) are shown.Source: The Lantau Group.
0.6
0.5
0.4
0.3
0.2
0.1
0.0
$/kWh
Kuala Lumpur
Taipei,China
BeijingHanoi
ShanghaiSeoul
Bangkok
Jakarta
Hong Kong, China
SingaporeDavao
Manila
Zuric
h
Rotterdam
Cebu
Amsterdam
Vienna
Stockholm
Auckland
London
Brussels
Los Angeles
Madrid
Melbourne
Sydney
New YorkPerth
RomeDublin
Munich
Frankfurt
Copenhagen
AdelaideTokyo
AsiaInternational
Cross-subsidy and direct subsidyCross-subsidy only
Philippines
D. Subsector Constraints
1. Affordability of Electricity to End Users
106. Despite the intentions of the Electric Power Industry Reform Act (EPIRA), tariffs in the Philippines remain high for a variety of reasons and are higher than a number of other cities across Southeast Asia, the People’s Republic of China, and the Republic of Korea (Figure 9).76
107. Of the Asian cities with residential tariffs below those estimated for the Philippines, a main reason for observed differences concerns the presence of an underlying subsidy—either an absolute subsidy or a cross-subsidy arising from a different approach to allocating costs to customer classes. A detailed attribution of causes of observed tariff differences is not available, but the observed differences have diminished materially in recent years. Even so, there remains room for improvement. Pursuant to the EPIRA, retail tariffs in the Philippines are unbundled into generation, transmission, distribution, system loss charges, and a variety of other recovery charges and taxes. While the EPIRA mandated distribution utilities to procure electricity in a least cost manner, there has been no binding measure nor real incentive for them to do so. Individual power supply agreements are regulated on a cost-plus approach and not a market-based approach, losing some of the potential benefits of competitive market pricing. Regulation of individual contracts as opposed to generation costs also removes the incentive on distribution utilities and electric cooperatives to contract at least cost. Power supply agreements associated with new capacity are also inherently long-term and can span 20–25 years, resulting in falls in WESM prices not being passed through to consumers. Figure 10 compares the generation charge being levied by Meralco against the spot market prices
76 The Lantau Group. 2018. Residential Electricity Tariff Benchmarks (September 2017). Hong Kong, China.

Core Sectors Issues 31
Figure 10: Comparison of Generation Charge by Meralco vs. Wholesale Electricity Spot Market Prices
₱ = Philippine peso, kWh = kilowatt-hour, LWAP = load-weighted average price, WESM = Wholesale Electricity Spot Market.Source: Meralco.
2
–2
4
6
8
10
12�/
kWh
0
October 2007
May 2007
December 2006
July 2006
March 2008
August 2008
January 2009
June 2009
November 2009
April 2010
September 2010
February 2011
July 2011
December 2011
May 2012
October 2012
March 2013
August 2013
January 2014
June 2014
April 2015
November 2014
September 2015
February 2016
July 2016
December 2016
Meralco Monthly Generation Charge Average Monthly Luzon WESM LWAP (ex ante)
since the inception of the WESM in 2006; over this time frame, spot market prices have been around 16% lower.77
108. Following the inception of retail competition and open access in December 2012, there is increased potential for market forces to take hold and significantly improve competitiveness in the supply market. However, only a handful of large users sit above the contestable voluntary threshold of 750 kW (average peak demand). Mandatory contestability is currently subject to a temporary restraining order by the Supreme Court having been petitioned by the Federation of Philippine Industries and the Philippine Chamber of Commerce and Industry, among others. No updates have been issued despite the initially envisaged time frame of June 2018 for lowering the mandatory contestability threshold to 501 kW and to allow voluntary contestability for end users below 500 kW.
2. Uncertainty Surrounding the Energy Regulatory Commission
109. As the independent regulator of the Philippines’ electricity sector, the ERC’s activities have a far-reaching impact on nearly all stakeholders in the sector. Among other activities, the ERC is charged with approving all supply contracts for the captive market and ancillary services contracts procured by NGCP. The ERC is also responsible for regulating the wheeling rates levied by the NGCP and numerous distribution utilities as well as their maximum allowed revenues and major projects to be undertaken. Under the prevailing performance-based regulatory regime, these entities are subject to a regulatory reset that takes place every 4 years. This regulatory reset for several regulated entities was due in 2015–2016 but has not yet occurred and is affecting not only the NGCP but also large
77 Meralco. 2017. Rates Archive. http://www.meralco.com.ph/consumer-information/rates-archive (accessed 2 July 2017); Philippine Energy Market Corporation. 2017. Market Prices & Schedules. http://www.wesm.ph/inner.php/downloads/market_prices_&_schedules (accessed 2 July 2017).

32 Philippines: Energy Sector Assessment, Strategy, and Road Map
incumbents such as Meralco. The precise reason for delays at the ERC is unknown, but the climate of uncertainty constrains investment in the transmission and distribution grids which is necessary to support growth in the sector and the efficient functioning of the network.
110. In June 2017, legal challenges were filed questioning the extension of the competitive selection process deadline for awarding new generation contracts. The inevitable delay that will result from the legal charges calls into question the timing and certainty of a significant tranche of the new capacity that was expected to go online by 2021–2023.
3. Mindanao: Issues of Integration, Market Development (Wholesale Electricity Spot Market), and Electrification
111. Mindanao, along with numerous islands with self-contained mini-grids, currently sits outside of the WESM and lacks any physical integration with the Luzon–Visayas grid. Having been characterized by chronic supply shortages and unserved demand until relatively recently, the region now faces new challenges to forge a competitive, transparent market that facilitates further growth in the power sector. These include
(i) successful introduction of the WESM;
(ii) physical integration with the Luzon-Visayas grid; and
(iii) improved electrification, particularly in areas of the Bangsamoro Autonomous Region.
112. In the absence of a WESM, Mindanao’s supply and demand arrangements are based solely around bilateral contracts between generators and distribution utilities. It has been a long-standing ambition of the DOE and the PEMC to have a WESM operational in the region with the introduction of the Interim Mindanao Electricity Market (IMEM) in November 2013 marking an attempt to ultimately transition toward a WESM. The IMEM was a day-ahead market specifically designed to address Mindanao’s acute supply shortages by focusing on spare, underutilized capacity, differing from the WESM’s energy-only design. However, the IMEM was short-lived and was suspended in early 2014 having been plagued by many issues including a lack of liquidity, payment issues, and grid interruptions.
113. Despite the challenges of the IMEM, the introduction of the WESM into Mindanao is currently targeted for early 2018. Currently, and perhaps understandably given the lessons of the IMEM, the focus is on market readiness and capacity building of prospective participants. In June 2017, the PEMC released guidelines to participants for trial operations of the WESM in Mindanao pertaining to registration, bid submission, pricing and scheduling, and settlement.
114. Though some stakeholders may be initially reluctant to the arrival of the WESM, the market will provide more sourcing flexibility for distribution utilities and bulk users, stimulate further investment in new capacity in the region, and increase price transparency to end users. Price volatility, a long-standing feature of the WESM in Luzon and the Visayas, is also likely to feature in the prospective WESM in Mindanao given the substantial contributions of hydro to the generation mix in the region (27% in 2016) and its seasonal nature.
115. The physical integration of Mindanao to the broader Luzon–Visayas grid has been an enduring objective of the DOE and the NGCP with the aim of furthering the efficient utilization of generating assets and the security and stability of the transmission system. The NGCP had originally envisaged that Mindanao would be interconnected with Leyte in the Visayas with the ERC approving the link in 2011 subject to a successful feasibility study. In 2016, the proposed route was deemed

Core Sectors Issues 33
infeasible due to unexploded wartime ordnance, shipwrecks, and a large ocean trench with the potential for volcanic activity. Integration is now envisioned through the Mindanao 230 kV backbone project which features a new interconnection route between Mindanao (Zamboanga) and Cebu for a 450 MW-rated high-voltage direct current link similar in scale and nature to the existing Luzon–Leyte interconnection. The ERC has approved the Mindanao–Cebu link but the precise timing for project development is unclear.
116. Mindanao’s electrification rate at 74.8% remains significantly behind progress in Luzon (93.4%) and the Visayas (93.8%) (footnote 24). As of December 2016, only 10 of the 36,061 barangays (subdistricts) in the Philippines were without access to electricity and 8 of these are situated in the Autonomous Region in Muslim Mindanao (ARMM). The autonomous region of Bangsamoro in the west of the island features an electrification rate of just 37.8% and chronically high distribution losses of electric cooperatives of up to 26%.
117. The lack of electrification and development of energy infrastructure within ARMM and Bangsamoro is also symptomatic of the poverty faced by its population. Compared to 21.6% rate of poverty incidence seen nationally, the rate in ARMM stands at 53.7% and has been on an increasing trend in recent years (footnote 7).
118. The power challenges in Bangsamoro are being targeted through ongoing international assistance programs. In March 2017, the Japan International Cooperation Agency signed a grant agreement with the government to provide ₱349 million in aid for the provision of power distribution equipment to improve supply coverage and reliability in the region.78 The World Bank is also implementing a “last mile” electrification program to provide solar home systems to an initial 40,500 households nationally (including Bangsamoro), which is funded by the Global Partnership on Output-Based Aid and the European Union with additional assistance provided by the DOE. The first competitive tender for this program was launched in the second quarter of 2017.
4. Challenges Posed by Renewable Energy
119. Despite the sharp increase in newer forms of renewable energy capacity that has occurred via the FiT program, the integration of variable renewable energy and management of the FiT program itself has not been without issue. Unresolved challenges and issues include curtailment risk and grid congestion, requirements for ancillary services and their procurement, and delayed decisions and underfunding of the FiT-Allowance (FiT-All) fund.
a. Curtailment Risk and Price Dislocations
120. The Western Visayas region has experienced grid instability issues since the substantial additions of solar capacity in March and April 2016. This is putting pressure on the NGCP to push ahead with grid strengthening and grid expansion projects (paras. 54–63) but is also posing material merchant risks to generators in the region that have WESM exposure.
121. The shift to overcapacity during 2016 combined with the priority of dispatch given to solar and other newer forms of renewable energy (under the Renewable Energy Act) has led to the curtailment of coal and geothermal generating capacity by the NGCP to mitigate grid congestion. Despite its preferred status, solar generation has also experienced curtailments in Negros—evidence
78 Japan International Cooperation Agency. 2017. Signing of Grant Agreement with the Philippines: Contributing to a Stable Supply of Power in the Bangsamoro Area by Providing Power Distribution Equipment. 30 March. https://www.jica.go.jp/english/news/press/2016/170330_04.html.

34 Philippines: Energy Sector Assessment, Strategy, and Road Map
of the seriousness of the issue. The localized congestion conditions have been compounded by the insufficient interconnection capacity between Negros and the major load center of Cebu which if increased could provide additional balancing opportunities between the two grids.
122. Curtailment risk is likely to diminish as demand growth erodes the supply surplus, but it will still likely continue to characterize the region until the implementation of Cebu–Negros–Panay Phase 3. This project is targeted for 2020 but the time line is uncertain given the capital expenditure required and the still outstanding approval by the ERC.
123. The regional misalignments of supply and demand that arose over the past year within the WESM also have the potential to add additional cost to end users. Due to the lack of interconnection capacity between certain regions, notably Panay–Negros and Negros–Cebu, there has been a decoupling of regional WESM prices. Line rentals which represent the cost of transmission between the respective generator and load nodes have therefore increased in some instances and, as a result, have recently featured in power supply agreements submitted for approval.
b. Integration of Variable Renewable Energy and Requirements for Ancillary Services
124. The variable nature of renewable energy technologies presents additional challenges in managing the stability of the Philippine grid and assuring a reliable supply of energy, particularly when amplified through geographic concentration such as in Negros. Requirements for ancillary services, particularly responsive regulating reserves, increase as the need to counteract real-time fluctuations in renewable energy generation grows. Regulating reserves are provided by generating plants that are already synchronized and generating (spinning); in the case of the Philippines, storage hydro is currently the only generation technology providing regulating reserves.79 No providers of regulating reserves are based in the Visayas, so the NGCP has had to keep “slack” in the high-voltage direct current link between Luzon and Leyte to import regulating reserves into the Visayas when required. The NGCP has noted in recent filings to the ERC that the “current level of regulating reserve has not yet reached the desired levels necessary for system reliability.”80
125. Against the backdrop of continued growth in variable renewable energy, and indeed growth in system demand, the NGCP is therefore faced with a growing need to procure further ancillary services. The WESM was originally intended to serve as a market for both energy and reserves. However, ancillary service procurement currently takes place through long-term bilateral contracts with eligible providers and which require ERC approval. Given the expected growth in variable renewable energy, a reserve market could provide a more efficient and competitive means of procuring regulating reserves while attracting new providers of ancillary services that are much needed.
c. Issues Surrounding Underfunding of the Feed-In Tariff Allowance Fund
126. Under the FiT, generators with eligible renewable energy capacity are paid a FiT rate that is guaranteed for 20 years from the date of effectivity. Funding of the FiT rate that renewable energy generators are paid comprises two interacting components: a cost recovery rate based on the prevailing WESM price as well as a universal subsidy known as the FiT-All paid by end users and set annually.81 The National Transmission Corporation (TransCo) is the body responsible for administering the FiT-All fund through which eligible generators are paid.
79 National Grid Corporation of the Philippines. 2017. List of Existing Ancillary Services Providers. http://www.ngcp.ph/beta/cms/Attachment-Uploads/June%202017%20-%20List%20of%20AS%20Providers-2017-06-20-08-33-20.pdf.
80 For example, Energy Regulatory Commission. 2017. ERC Case No. 2017-024 RC; ERC Case No. 2017-025. Manila.81 In Mindanao, the lack of a WESM means that the cost recovery rate is tied to distribution utilities’ average generation cost
over the previous 12 months.

Core Sectors Issues 35
127. According to the NREB Guidelines on the Collection of the Feed-In Tariff, the FiT-All for the following year must be determined and approved by the ERC each year no later than 31 October—with TransCo required to file their FiT-All application no later than 31 July.82 In practice, the determination of the FiT-All rate has suffered from delays. In 2016, TransCo requested a 3-month extension for submission of its FiT-All application for 2017 followed by a further 30-day extension after the ERC found the application to be insufficient.83 TransCo’s FiT-All application84 was ultimately submitted on 25 November 2016, nearly 4 months behind schedule, and final determination and approval by the ERC came only on 9 May 2017. TransCo submitted their 2018 FiT-All rate application to the ERC85 on 30 August 2017, a month behind schedule, though a decision had still not been issued as of August 2018. The procedural delays and delayed decision making undermine the financial position of renewable energy investors and erode confidence in the FiT program.
128. In addition to delayed FiT-All decision-making, the rates ultimately afforded are posing challenges for renewable energy investors. The WESM market prices have underperformed relative to TransCo’s expectations since mid-2015, resulting in an accumulating deficit for the FiT-All fund. In 2016, TransCo under-recovered by ₱4.43 billion which has resulted in renewable energy generators not being paid the full “guaranteed” FiT-rate for the electricity generated. In addition, ₱230 million of interest on the unpaid FiT revenues had accrued as of the second quarter of 2017. To address the deficit, TransCo’s proposed 2017 FiT-All rate was ₱0.2291 to be collected from January 2017. In May 2017, the ERC instead approved a FiT-All rate of ₱0.1830 per kilowatt-hour (kWh) to be collected from June 2017 onward. TransCo’s application for 2018’s FiT-All rate was ₱0.2932/kWh, which is a significant increase sought to address the financial shortfall of the FiT-All fund and associated interest payments. WESM market prices are expected to remain subdued in the near-term due to sizable new capacity coming online. Without sufficient funding of the FiT-All fund to bridge this gap, sustained failures to meet payment obligations to renewable energy generators risk permanently undermining the investment climate for renewable energy in the Philippines.
d. Constraints on Renewable Energy Permitting Process and Granting of Incentives in Missionary Areas
129. Compared to fossil-based power generation, the permitting process for renewable energy development is more complex. For electricity generation, the government has set up a permitting process that gives one developer the exclusive right to explore, develop, or utilize a renewable energy contract area. The issuance of a renewable energy service contract allows the utilization of renewable energy resources for power generation and includes requirements for competitive selection. Incentives for renewable energy (duty-free importation, income tax reduction, etc.) can be accessed only after the project has been issued the contract. The same regulations and permitting processes are applied to all renewable energy projects whether large (megawatt range) or small (kilowatt range) scale, including renewable energy deployment in mini-grids to enhance energy access in areas that are not yet energized or that receive limited power supply. The transaction cost and time for undergoing such lengthy regulatory processes can make smaller renewable energy projects unattractive to investors.
130. Moreover, access to the Universal Charge for Missionary Electrification (UCME) has been limited to areas that are either under the NPC-Small Power Utilities Group or that have been waived
82 Government of the Philippines, Energy Regulatory Commission. 2013. A Resolution Adopting the Guidelines on the Collection of the Feed-In Tariff Allowance (FIT-All) and the Disbursement of the FIT-ALL Fund. http://www.erc.gov.ph/Files/Render/issuance/485.
83 Government of the Philippines, Energy Regulatory Commission. 2016. ERC Grants TRANSCO’s Plea for Extension of 2017 FiT-All Filing. http://www.erc.gov.ph/ContentPage/30374.
84 ERC Case No. 2016-192 RC.85 ERC Case No. 2017-079 RC.

36 Philippines: Energy Sector Assessment, Strategy, and Road Map
by electric cooperatives to qualified third parties. According to current rules, electric cooperatives that generate their own power in small and isolated islands are not eligible to access the UCME. This has resulted in the inequitable distribution of the UCME, with the bigger Small Power Utilities Group-operated off-grid islands receiving most of the UCME funds while smaller and more isolated islands are unable to access those funds. The streamlining of the permitting processes and rules on UCME eligibility is necessary to further increase renewable energy deployment. The DOE is undertaking a comprehensive review of these existing rules, regulations, and permitting processes and is expected to come up with specific set of rules and permitting processes for projects in off-grid and missionary areas.

37
V Sector Strategy
A. Power Sector Priorities
131. The Philippine Development Plan (PDP) 2017–2022 is the government’s medium-term plan that proposes policies, supported by strategic frameworks for their implementation, and targets, across all areas of the Philippine economy and society to deliver: (i) more inclusive growth that lowers poverty in rural areas, (ii) a high-trust and resilient society through improved accountability and transparency in governance, and (iii) a globally competitive knowledge economy (footnote 16).
132. Among other challenges, the PDP 2017–2022 highlights the high cost of electricity within the country and the importance of achieving a more affordable and adequate supply of electricity to improve the competitiveness of the country’s economy. A lack of competition, system losses, and the absence of state subsidy are cited as drivers of the high cost of electricity, but also mentioned are potential manipulation of market prices and disruptions to power supply due to outages.
133. The government’s desire for more affordable electricity is tempered by the desire to achieve an optimal supply mix that uses different generation technologies, provides reliable supply, and mitigates greenhouse gas (GHG) emissions. The issue of climate change features throughout the PDP 2017–2022, which includes measures to assist local communities in assessing their vulnerability to climate change risks and promote adaptation.
134. With respect to the power sector, the aims of the PDP 2017–2022 are similarly reflected in the Power Sector Roadmap set forth within the Power Development Plan 2016–2040. The issues that both plans set out to address include
(i) improving competition and lowering costs within the power sector by increasing the number of suppliers in the retail electricity market, accelerating the privatization of capacity owned by the Power Sector Assets and Liabilities Management Corporation, rationalizing charges and taxes relating to electricity consumption, strengthening the competitive selection process, and removing value-added tax on system loss charges;
(ii) mitigating supply disruption by removing red tape and fast-tracking of infrastructure projects, including declaring projects as having “national significance” to expedite their completion and ensure supply adequacy;
(iii) addressing grid stability by upgrading and expansion of the transmission network, procurement of sufficient reserve capacities, and addressing congestion through increased transmission interconnections between islands;
(iv) achieving an optimal generation mix that utilizes baseload, mid-merit, and peaking capacity at least cost;
(v) rolling out the Renewable Portfolio Standard (RPS) to further promote the development of renewable energy resources and the initiation a renewable energy market;

38 Philippines: Energy Sector Assessment, Strategy, and Road Map
(vi) establishing the WESM in Mindanao and the rollout of retail competition and open access in the region; and
(vii) achieving full household electrification by 2022 and encouraging renewable energy development in missionary areas to reduce reliance on expensive diesel generator sets (footnote 16, 35).
135. The PDP 2017–2022 and Power Development Plan 2016–2040 cite concerns around the ability of the transmission grid to expand with expected demand growth due to the challenges the NGCP faces in acquiring necessary right-of-way for the associated projects and the limited interconnection capacity between subgrids. The government also considers the impending depletion of Malampaya gas and the expiry of the gas supply purchase agreements to threaten energy security. The PDP 2017–2022 also proposes the implementation of the country’s 2016–2020 Energy Efficiency and Conservation Action Plan and Alternative Fuels Roadmap to improve energy efficiency and sustainability. In addition, it includes provisions to enact an energy efficiency and conservation law that promotes demand-side management, encourage energy efficiency projects, and impose minimum energy performance standards for energy-intensive industries.
Table 4: National Energy Targets Set Out by the Philippine Development Plan 2017–2022
IndicatorBaseline Value
(2016)End-of-Plan
Target (2022)Power requirements met, maintained above 100% = available capacity / (total peak demand + required reserve)
107.20 113.00
- Luzon 107.60 120.00 - Visayas 109.30 96.00 - Mindanao 102.00 121.0Available capacity supply increased (MW) 16,791.00 24,248.00
- Luzon 12,394.00 17,272.00
- Visayas 2,383.00 3,105.00
- Mindanao 2,014.00 3,871.00
Households with electricity increased (%) 89.61a 100.00
Energy intensity (primary energy) reduced, in tons of oil equivalent per ₱ million
6.32 5.36
Amount of displaced gasoline increased, in million liters (for bioethanol)
524 713
Amount of displaced diesel increased, in million liters (for biodiesel) 182.00 572.00
Conserved annual amount of electricity and fuel increased (kilotons of oil equivalent)
302.64 372.36
₱ = Philippine peso, MW = megawatt .a Note that the household electrification level quoted by the Philippine Development Plan 2017–2022 is based on a
July 2016 figure, thus differing slightly from other sources in this report due to the source used and date accessed.Source: Government of the Philippines, National Economic and Development Authority. 2017. Philippine Development Plan 2017–2022. Manila.
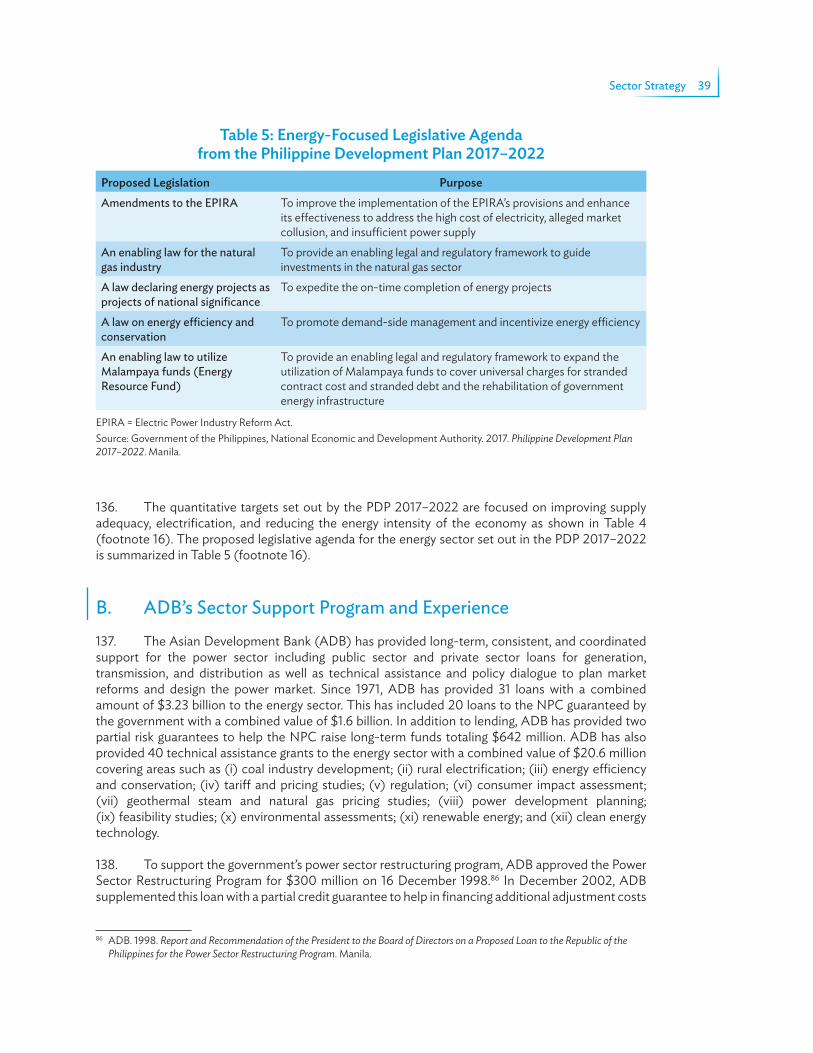
Sector Strategy 39
136. The quantitative targets set out by the PDP 2017–2022 are focused on improving supply adequacy, electrification, and reducing the energy intensity of the economy as shown in Table 4 (footnote 16). The proposed legislative agenda for the energy sector set out in the PDP 2017–2022 is summarized in Table 5 (footnote 16).
B. ADB’s Sector Support Program and Experience
137. The Asian Development Bank (ADB) has provided long-term, consistent, and coordinated support for the power sector including public sector and private sector loans for generation, transmission, and distribution as well as technical assistance and policy dialogue to plan market reforms and design the power market. Since 1971, ADB has provided 31 loans with a combined amount of $3.23 billion to the energy sector. This has included 20 loans to the NPC guaranteed by the government with a combined value of $1.6 billion. In addition to lending, ADB has provided two partial risk guarantees to help the NPC raise long-term funds totaling $642 million. ADB has also provided 40 technical assistance grants to the energy sector with a combined value of $20.6 million covering areas such as (i) coal industry development; (ii) rural electrification; (iii) energy efficiency and conservation; (iv) tariff and pricing studies; (v) regulation; (vi) consumer impact assessment; (vii) geothermal steam and natural gas pricing studies; (viii) power development planning; (ix) feasibility studies; (x) environmental assessments; (xi) renewable energy; and (xii) clean energy technology.
138. To support the government’s power sector restructuring program, ADB approved the Power Sector Restructuring Program for $300 million on 16 December 1998.86 In December 2002, ADB supplemented this loan with a partial credit guarantee to help in financing additional adjustment costs
86 ADB. 1998. Report and Recommendation of the President to the Board of Directors on a Proposed Loan to the Republic of the Philippines for the Power Sector Restructuring Program. Manila.
Table 5: Energy-Focused Legislative Agenda from the Philippine Development Plan 2017–2022
Proposed Legislation PurposeAmendments to the EPIRA To improve the implementation of the EPIRA’s provisions and enhance
its effectiveness to address the high cost of electricity, alleged market collusion, and insufficient power supply
An enabling law for the natural gas industry
To provide an enabling legal and regulatory framework to guide investments in the natural gas sector
A law declaring energy projects as projects of national significance
To expedite the on-time completion of energy projects
A law on energy efficiency and conservation
To promote demand-side management and incentivize energy efficiency
An enabling law to utilize Malampaya funds (Energy Resource Fund)
To provide an enabling legal and regulatory framework to expand the utilization of Malampaya funds to cover universal charges for stranded contract cost and stranded debt and the rehabilitation of government energy infrastructure
EPIRA = Electric Power Industry Reform Act.Source: Government of the Philippines, National Economic and Development Authority. 2017. Philippine Development Plan 2017–2022. Manila.

40 Philippines: Energy Sector Assessment, Strategy, and Road Map
associated with the restructuring.87 A further Power Sector Development Program was approved in December 2006.88
139. In the field of energy efficiency, the Philippine Energy Efficiency Project was approved in 2009 for $31.1 million. The project retrofitted 150 government office buildings and almost 4,000 public parks and streetlights and 260 traffic intersections with energy efficient lighting systems, distributed 8.6 million compact fluorescent lamps nationwide, installed solar home systems in roughly 220 households in off-grid areas, assisted in establishing a green rating system for buildings, established a lamp waste management facility, properly disposed of 4.4 million incandescent bulbs, and enhanced the energy efficiency testing facilities of the DOE. The Philippine Energy Efficiency Project resulted in energy savings of about 360 gigawatt-hours per year and deferral of an investment in 230 megawatts of coal-fired generation. Low-income customers benefited particularly as lighting is a significant component of their electricity consumption.
140. ADB is also providing technical assistance in partnership with the private sector and local government units in harnessing renewable energy sources such as solar, wind, geothermal, and waste at the community level. ADB has supported the development of business models for community-based renewable energy systems and piloted one such model in Mindanao with micro-hydro systems serving two villages.89 ADB is also supporting small island electrification using solar energy hybrid systems in Romblon and Antique. These projects are demonstrating the viability of the technology in these island contexts and exploring approaches for scaling up this technology approach to other small islands, such as innovative business models that bring in the private sector.
141. ADB, through its Private Sector Operations Department, has also provided substantial support to the expansion of the power sector in the Philippines through the establishment of funds and direct investment in the project. It supported the government in the privatization of the power assets and the construction of a power plant in Visayas to address the power shortage in that region (Philippine Investment Alliance for Infrastructure). More recently, the Private Sector Operations Department has provided support for renewable energy projects in the Philippines including an investment of $85 million for a wind farm project in the northern part of the country.
C. Other Development Partner Support
142. ADB is a key development partner in the energy sector and has worked in coordination with other development partners with similar initiatives. Traditionally, ADB had the lead in providing policy advice to the government on power sector restructuring while the World Bank assumed a more prominent role in rural electrification programs. Other multilateral and bilateral agencies involved in the sector include the Japan International Cooperation Agency, the European Union, the United States Agency for International Development, the Republic of Korea (Korea Energy Agency90), and Germany (Deutsche Gesellschaft fur Internationale Zusammenarbeit [GIZ]). For example, one Japanese technical assistance project supports increased use of renewable energy particularly micro-hydro in rural areas in Mindanao. The project will install renewable energy demonstration projects in
87 ADB. 2002. Report and Recommendation of the President to the Board of Directors on a Proposed Partial Credit Guarantee for Fixed Rate Bond Issues by the Power Sector Assets and Liabilities Management Corporation for the Power Sector Restructuring Program in the Republic of the Philippines. Manila.
88 ADB. 2006. Report and Recommendation of the President to the Board of Directors on a Proposed Power Sector Development Program in the Republic of the Philippines. Manila.
89 ADB. 2013. Maximizing Access to Energy for the Poor in Developing Asia. Manila.90 The Korea Energy Management Corporation, which initiated the activities noted here, was renamed to Korea Energy
Agency on 29 July 2015. http://www.ieadsm.org/wp/files/Korea_ChangeName_Contracting_Party.pdf.

Sector Strategy 41
several barangays in Mindanao and will pilot a revolving fund to finance mobilization of local financial institutions to extend credit to entrepreneurs for investments in livelihood enhancement using renewable energy. The Japan International Cooperation Agency also completed a study on a gas pipeline project that stretches from Batangas to Manila. The United States Agency for International Development is engaged in promoting renewable energy systems and working with the DOE on barangay electrification mainly in Mindanao. The Korea Energy Agency is piloting the development of hybrid renewable energy schemes. GIZ is promoting renewable energy regulation. The European Union has approved a large technical assistance and investment program on access to sustainable energy, a portion of which is being administered by the World Bank. A summary of major donor activities in the Philippines power sector since 2010 is outlined in Table 6.
Table 6: Major Donor Activities in the Philippine Power Sector, 2010 Onward
Project Year ApprovedCommitted ($ million)
Asian Development BankTiwi and MakBan Geothermal Power Green Bonds Project 2015 151.20150-Megawatt Burgos Wind Farm Project 2015 20.00Municipal Solid Waste Management 2014 0.25Proctor and Gamble Waste-to-Worth Project 2012 0.40Consumer Protection in a Competitive Electricity Market with Open Access 2012 0.50Single Well Engineered Electrical Turbine System Geothermal Power Project 2011 0.43Market Transformation through Introduction of Energy-Efficient Electric Vehicles Project
2012 405.00
Rural Community-Based Renewable Energy Development in Mindanao 2011 2.00Mitigation of Climate Change through Increased Energy Efficiency and the Use of Clean Energy
2010 0.93
Three Wind Farm Projects in Luzon 2010 0.63World BankPhilippines Renewable Development Project 2016 44.00Second Philippines Extractive Industries Transparency Initiative Support Project 2016 1.50Access to Sustainable Energy Project (EU funds administered by World Bank) 2016 23.24Philippines Extractive Industries Transparency Initiative Support Project 2014 0.20Chiller Energy Efficiency Project 2010 2.60Other DonorsJICA: Project for Improvement of Equipment for Power Distribution in Bangsamoro Area
2017 348.90
EU: Access to Sustainable Energy Program 2016 Up to 34.91 for TA and investment
USAID: Energy Policy and Development Program 2014 5.00USAID: Low Emissions Asian Development Program 2011 Not reported
ADB = Asian Development Bank, EU = European Union, JICA = Japan International Cooperation Agency, USAID = United States Agency for International Development.
Source: Asian Development Bank.

42 Philippines: Energy Sector Assessment, Strategy, and Road Map
D. ADB Experience and Self-Evaluation
143. As detailed in the 2008 Philippines Country Assistance Program Evaluation, ADB’s contribution to the energy sector restructuring and efforts toward financial reform of the power sector has helped to increase private sector participation and financing. Other successful outcomes resulting from ADB’s assistance include accelerated progress toward power subsector privatization and the implementation of an operational WESM.91 These reforms have encouraged private investment, reducing the need for government subsidies and improving the financial viability of the sector. While the 2008 evaluation identifies some shortcomings of energy market reform—the failure to lower electricity prices and attract greater competition—ADB’s energy sector support has been deemed both “substantial” and “sustainable” (footnote 97).
144. Through its renewable energy generation and energy-efficiency programs completed from 2010 to 2015, ADB has contributed to a reduction in GHG emissions of 173,789 tons of CO2 equivalent per year in the country.92 As issues of the environment and sustainability become increasingly important factors in the development of energy projects, renewable energy generation and energy savings programs have become more common; eight of the nine ADB Philippine energy projects approved since 2010 have been related to renewable energy generation and energy savings. ADB’s loans to renewable developers have provided invaluable support for projects that are environmentally and socially valuable but considered too risky to attract private investment. Renewable technologies have also been an important tool in expanding grid access. Such programs are all in line with ADB’s environmental objectives, and the bank continues to strengthen linkages between energy, the environment, and economic development.
145. Support for energy-related programs has also been crucial to ADB’s social mission. A socioeconomic survey conducted within rural areas of Luzon, the Visayas, and Mindanao found that electricity access was associated with an improved quality of living across multiple dimensions. While it is difficult to disaggregate grid access from other possible causes of the rise in quality of life and even more difficult to measure the contributions of individual programs, the survey’s findings are in line with ADB’s belief that electricity access is crucial to inclusive economic development. ADB’s partnership with the National Electrification Administration (NEA) to expand on-grid and off-grid electricity access in Mindanao, Romblon, and Antique was deemed successful, having supplied renewable electricity to more than 1,500 homes and effectively involving community-based organizations in the development process, where appropriate. These programs have also paved the way for future renewable energy development and expanded energy access to underserved populations.93
E. ADB’s Sector Forward Strategy and Policy Issues Moving Forward
146. ADB’s proposed forward strategy is based on its assessment of the current issues facing the Philippine power sector market, the government’s PDP 2017–2022, and the goals and strategies set forth in ADB’s Strategy 2030 and ADB’s Energy Policy 2009—as shown in Appendix 1. The proposed forward strategy encompasses the following three key areas, which are expanded on in the subsequent sections:
91 ADB. 2008. Philippines Country Assistance Program Evaluation: Increasing Strategic Focus for Better Results. Manila.92 ADB. 2017. Results of ADB-Supported Operations: Philippines. Manila. https://www.adb.org/countries/philippines/results/
data.93 ADB. 2016. Completion Report: Philippines: Rural Community-Based Renewable Energy Development in Mindanao. Manila.

Sector Strategy 43
(i) supporting energy efficiency and sustainable development, including renewable energy resources;
(ii) enabling access to energy for all both for clean cooking and electricity, including through strengthening electric cooperatives in remote and challenging areas, such as Bangsamoro and island communities; and
(iii) supporting further energy sector reform and improved governance (Figure 11).
1. Energy Effi ciency and Sustainable Development
147. Refi ne the 70–20–10 target. In late 2016, the DOE announced a 70–20–10 energy mix target referring to the split for baseload, mid-merit, and peaking capacity. This marked a signifi cant change from the previous administration’s push for a 30 (coal)–30 (gas)–30 (renewables)–10 (other generation sources) mix. The DOE’s new approach for the future energy mix appears to be more economically driven; it is technology neutral and allows fuels to operate in diff erent capacities, and the 70–20–10 mix also aligns with the current load profi le of the country quite well. Yet, defi ning such specifi c percentages does not acknowledge the changing nature of the system load which will likely be dynamic given the fast pace of economic development in the country. There are potential measures that can be taken to improve the 70–20–10 approach. For example, appropriate targets could be established at each regional grid level considering the available resources, demand, and their variability throughout on diurnal and seasonal time frames. A least-cost planning framework that allows the 70–20–10 split to be periodically reviewed would allow it to refl ect changes in the underlying load profi le as they emerge.
Figure 11: Strategic Linkages
Source: Asian Development Bank.
Philippine Energy Sector Sustainability and Aordability
Philippine Energy Plan 2012–2030: Energy Independence and Power Market Reform
Developindigenousresources
ADB Support Area 1:Energy E�ciency and
Renewable Energy
ADB Support Area 2:Access to Energy
for All
ADB Support Area 3:Sector Reform and Governance
Operational Priority:Tackling
Climate Change
Operational Priority:Addressing
Poverty
Operational Priority:Regional
Cooperationand Integration
Operational Priority:Accelerating
Gender Equality
Operational Priority:Strengthening
Governance andInstitutional Capacity
Promote newand renewable
energy
Promote energy
conservationand e�ciency
Privatizepower sector
Create aninductive
investmentclimate
Power SectorReform
StrengtheningDistribution Sector
Promoting New and Renewable Energy
Improving Access for Urban and Rural poor
ADB’s Strategy 2030
Strategic Assistance Areas
Lend
ing
Stra
tegy
AD
B Se
ctor
Stra
tegy
AD
B St
rate
gy20
30G
over
nmen
t Ene
rgy
Stra
tegy

44 Philippines: Energy Sector Assessment, Strategy, and Road Map
148. Explore additional policy support for green technology. While the Philippines committed to the Paris Agreement in 2017, the country is unlikely to achieve these goals without designing and implementing corresponding incentives in the market. Such incentives could include establishing binding emissions standards attributing an explicit or implicit cost to GHG emissions or assigning some value to green generation. There are no emissions standards in place for the electricity sector in the Philippines nor any incentives for reducing GHG emissions. An explicit cost to GHG emissions could be assigned in the form of a carbon tax. Similarly, GHG emissions could be capped and subsequently traded on a market, which would determine the value of avoiding such emissions. However, both a carbon tax and a cap-and-trade system can be politically difficult to implement due to their often adverse effects on tariffs although revenues from such programs can be used to offset these. Determining the true cost of carbon is very difficult and a rate that induces a certain amount of emissions avoidance is very difficult to calculate after the fact. As an alternative, efforts toward low-carbon generation could be incentivized through a number of mechanisms including the rollout of the RPS and associated renewable energy certificates market, the continuation of the FiT, or the introduction of renewable energy auctions.
149. Improve existing policies that are meant to incentivize renewables. The generally public nature of policy discussion around renewable energy programs lends itself to being influenced by parties that will push the Philippines closer to achieving its 2015 United Nations Climate Change Conference commitments while minimizing the total costs associated with reaching these goals. While some useful tools are already in place or are being mooted to incentivize renewable energy development (e.g., feed-in tariff [FiT] program, net metering, and the RPS), many have issues that still need addressing for their full potential to be realized. Suboptimal implementation of these programs can serve to undermine their goals:
(i) The FiT program will not function as a strong incentive for renewables development if the payments to eligible renewable energy developers are not honored in full, which has been the case since mid-2016. Introduction of regional differentiation of FiT rates could support renewable energy development in line with demand and transmission capacity rather than solely where the cost to develop is cheapest.
(ii) Enacting the RPS could provide an additional avenue for valuing the green nature of renewable energy projects. The RPS was defined in the 2009 Rules and Regulations Implementing Republic Act 9513, and in June 2016 the DOE released a draft department circular on its rules and guidelines. The rollout of the RPS is to follow a year after the implementation of a renewable energy market on which renewable energy certificates are to be traded, yet there are no plans in place for the rollout of a renewable energy market.
(iii) Net metering limits could be lifted to support maximal adoption of behind-the-meter renewable energy. Net metering arrangements are currently available to customers with a maximum of 100 kilowatts of capacity which leaves large industrial and commercial end users ineligible. An easing of this constraint would likely lead to greater penetration of distributed generation, but implications for long-term supply agreements and cost pass-through to the consumer should be considered.
150. Increase the interconnectivity of the grid. Although the grids of Luzon and the Visayas are currently interconnected, insufficient transmission capacity has exacerbated the effects of regional supply–demand mismatches. The overcapacity dynamic in Western Visayas has led to significant trapped capacity behind the Negros–Cebu interconnection, and the short-run cost of energy and managing grid stability would arguably be lower if sufficient interconnection capacity were in place to alleviate grid congestion. While there are plans for the Negros–Cebu interconnection to be expanded,

Sector Strategy 45
the implementation time line is unclear and contingent on approval by the Energy Regulatory Commission (ERC).
2. Access to Energy for All
151. Strengthen and expand the electricity distribution sector. A large number of people in the Philippines remain unconnected to the grid, mostly residing in Mindanao. The National Electrification Administration has overall responsibility for achieving electrification and the National Power Corporation is responsible for electrification efforts in missionary areas. Support to these two bodies may expedite the process and maximize potential cost and sustainability benefits of electrification of off-grid areas with renewable energy deployment. Elsewhere, the high rate of system losses particularly in areas operated by electric cooperatives remains a concern. The augmentation of the National Power Corporation’s and the National Electrification Administration’s funds would offer one way to bolster efforts toward connecting customers and reducing technical system losses, particularly in areas where electric cooperatives operate. Priority investments in line with these efforts include (i) upgrading substations and power transformers; (ii) rehabilitation of transformers, feeder lines, and other components of the electric cooperative distribution facilities; and (iii) re-conducting of the feeder lines and low-voltage networks.
152. Improve energy infrastructure in the Bangsamoro region. While the recent commitment of financial assistance from the Japan International Cooperation Agency is noteworthy, access to electricity and the quality of transmission and distribution infrastructure in Bangsamoro are poor and will need additional assistance to fully address. Energy sector interventions needed in the Bangsamoro area include (i) the rehabilitation of existing hydropower plant assets; (ii) development of indigenous energy resources (including geothermal and solar); and (iii) stabilizing power supply in the areas of Lanao. An interconnection between Mindanao and the Visayas would further enhance the region’s energy security including the Bangsamoro area.
153. Support renewable energy programs in off-grid areas. The archipelagic geography of the Philippines necessarily means that many barangays are off-grid and can be expected to remain so. At present, off-grid demand is largely met by a mixture of decentralized generator sets, mini-grids and micro-grids which predominantly use diesel or Bunker C fuel oil. Given the high generation costs associated with these fuels, the expansion and increased integration of renewable energy—particularly solar—at an off-grid level would appear to be highly attractive. Indeed, the modular nature of solar allows for more flexibility in meeting the requirements of small demand centers and can be used without a traditional grid. Furthermore, the natural profile of solar generation can align favorably with the shape of demand and if deployed with batteries, which are also experiencing cost declines represents a low-cost solution to providing basic electrification needs while increasing the hours of supply. The Philippine Rural Electrification Service of the Small Power Utilities Group has deployed diesel micro-grids and individual solar home systems in Masbate and Ticao, but sustainable implementation models should be identified for replication and scale-up taking into account the privatization mandate of the Small Power Utilities Group. Its current operations are limited to the bigger islands and many unserved islands within the franchise of electric cooperatives need additional support. The World Bank PV Mainstreaming program that is currently underway is using solar home systems to provide last mile electrification to around 40,500 households, predominantly in remote regions in Mindanao. Given recent successful pilots in island and remote communities, ADB is also well-positioned to help make the case for and assist in the development of off-grid small-scale renewable energy deployment, especially renewable energy hybrid mini-grids, to further electrification efforts in the Philippines while reducing the country’s carbon footprint.

46 Philippines: Energy Sector Assessment, Strategy, and Road Map
3. Sector Reform and Improved Governance
154. Conduct stocktaking of the Electric Power Industry Reform Act and understand energy price drivers. Electricity prices in the Philippines are high relative to many countries in Asia. The reasons vary widely but include differences in subsidy policies, fuel access and pricing, supply and demand conditions, extent and pricing of legacy contracts, historical costs, network-related cost drivers, and government policies. A clear understanding of these factors can support better policy and more accurate diagnosis of perceived problems. An expert-led review of the electricity value chain can be used to shape better targeted energy policies in the Philippines. A significant benefit can also be realized by mapping the specific objectives for reform back to the Electric Power Industry Reform Act (EPIRA) and identifying how to work within the EPIRA to achieve these objectives. An EPIRA stocktaking and review would assist by establishing a road map, identifying remaining gaps in EPIRA implementation and achievement, as well as identifying weaknesses and mapping these to appropriate value-enhancing next steps.
155. Evaluate potential changes to the regulatory model. The ERC operates in a quasi-judicial manner following a regulatory model that places greater emphasis on legal and case precedents than on the opportunity to introduce new forms of incentive regulatory structures. A hallmark of the existing model is that it proceeds methodically and could be more dynamic in adopting changes that would better align with the competitive energy sector. Determining how best to introduce new forms of regulation may require a reconsideration of the legal basis for the ERC’s current regulatory model. Such an evaluation should further include recommendations as to improving the funding process for the ERC and review of compensation arrangements to ensure independence and adequate compensation.
156. Enhance skills. Various stakeholders in the power sector in the Philippines could benefit from enhancing expertise in areas such as energy economics and energy analysis, which could promote linkages between the regulated market-based energy sector and academic research on regulatory issues to supplement more traditional disciplines of electrical engineering and accounting. A broader and more concerted mapping effort to identify needed skills and direct support or facilitation of their development via multiple channels would be beneficial.

47
VI Energy Sector Road Map and Results Framework
Country Sector Outcomes Country Sector Outputs ADB Sector Operations
Outcomes Supported by ADB
Indicators with Targets and
BaselinesOutputs Supported
by ADBIndicators with
Incremental TargetsConstraints to
Output DeliveryADB Interventions to Address Constraints
Adequacy, accessibility, and sustainability of energy system enhanced
• Households with electricity increased from 89.6% in 2016 to 100% by 2022
• Ratio of dependable capacity to peak demand plus required reserve increased from 107.2 in 2016 to 113 in 2022
• Share of renewable energy capacity increased from 7 GW in 2017 15.3 GW in 2030
• Energy intensity reduced from 6.32 TOE per million pesos in 2016 to 5.36 TOE per million pesos by 2022
• Increased electricity supply available in remote or off-grid areas
• Grid integration between regional grids
• Strengthening of transmission backbone
• Expanded energy efficiency
• Increased use of indigenous renewable energy resources
• Additional 100 MW of generation in off-grid areas by 2022
• Completion of the Visayas–Mindanao Interconnection Project by 2022
• Strengthening of the 500-kilovolt Luzon backbone by 2022
• Energy savings of 10% by 2030
• Additional installed renewable energy capacity of 8 GW by 2030
• Budgetary constraints of government agencies
• Actual realization dependent on private sector interest
Ongoing projects• Small island off-grid
renewable energy in Romblon and Antique ($0.3 million)
• Market transformation through introduction of energy-efficient electric vehicles (loans: $300 million and $100 million; grant: $5 million)
Planned public investment program projects (2018–2022)a
• Electrification Project for the Island Provinces of ARMM (₱10 billion)
• Strategized Sitio Electrification Program for Off-Grid Rural Electrification through Renewable Energy (₱2.8 billion)
Planned ADB intervention• Technical assistance
project to prepare the planned Sustainable Rural Power Supply Development Project ($1 million; 2018)
• Sustainable Rural Power Supply Development Project (amount to be confirmed; 2021–2022)
ADB = Asian Development Bank, ARMM = Autonomous Region in Muslim Mindanao, GW = gigawatt, KTOE = kiloton oil equivalent, kV = kilovolt, MW = megawatt, TOE = ton oil equivalent.a These are projects reflected in the government’s Public Investment Program 2017–2022 with planned commencement from 2018. Source: Asian Development Bank.

48
Appendix: Energy Sector Problem Tree
Core SectorProblem
Sector Impacts
Main Causes
Deficient SectorOutputs
Inconsistency in administrationof overall sector
Insu�cient risk managementmechanisms
Overlapping sectoral responsibilities
Spot market technical shortcomings
Regulatory interventionsinconsistent with spot market principles
Insu�cient financial and humanresources in critical areas
Weak power outagemanagement
Weak demarcation andaccountability across sectorinstitutions
National Impacts Reduced Socioeconomic Development and Energy Security
Prevailing Ine�ciency of Electricity Supply Subsector
Nonoptimal Energy Pricing
Complex and Slow Approval Process
Nonoptimal Market Mechanisms Institutional Capacity
Reduced EnergySecurity
AdverseEnvironmental
Impacts
EnergyInfrastructure Gaps

ASIAN DEVELOPMENT BANK
PhilippinesEnergy Sector Assessment, Strategy, and Road Map
This energy sector assessment, strategy, and road map documents the status and strategic priorities of the Government of the Philippines in the energy sector. It highlights sector performance, development constraints, government plans and strategies, past support of the Asian Development Bank (ADB) and other development partners, and the strategy for future ADB support in the energy sector. It also provides sector background information for investment and technical assistance operations. The assessment is based on a systematic review of the Philippines’ energy sector and consultations with the government and other development partners.
About the Asian Development Bank
ADB is committed to achieving a prosperous, inclusive, resilient, and sustainable Asia and the Pacific, while sustaining its efforts to eradicate extreme poverty. Established in 1966, it is owned by 67 members— 48 from the region. Its main instruments for helping its developing member countries are policy dialogue, loans, equity investments, guarantees, grants, and technical assistance.
AsiAn Development BAnk6 ADB Avenue, Mandaluyong City1550 Metro Manila, Philippineswww.adb.org
PHILIPPINESENERGY SECTOR ASSESSMENT, STRATEGY, AND ROAD MAPOCTOBER 2018
PHILIPPINES