phepared bf - ojp.gov
TRANSCRIPT

( ~k :¥
f .' :.~
II
~ " ... ~ ,~""
i ""
PhEPARED Bf
COORDINATING COUNCfL
ROBERT STERNHELL, Director of Evaiuation
STUART CARROLL, Evaluator
THE TARGET AREA CRiME SPECIFICS PROGF~Ahli,
J U \I E NIL E 0 ELI N QUE N eYE N FOR C E fvi != NT CO fYi PO N E (',11
was funded by the LavJ Enforcement A.ssistance
Administration, Grant Number 72-DF-OB-0042-TA-7
f~:;::-'
I'" I
THE MAYOR'S CRIMINAL JUSTICE COORDINATING COUNCIL
MAYOR MOON LANDRIEU Chairman
ANTHONY GAGLIANO Vice-Chai rman
I ! , I
If you have issues viewing or accessing this file contact us at NCJRS.gov.

MAYOR I S CRIMINAL JUSTICE COORDINATING COUNCIL .)----", '-., ..
IMPACT EvALUATION REPORT
project: Juvenile Delinquen(...y En~orcement component
Project Number: 72-DF-06-0042-TA-7
Subgrantee: City of New Orleans
Operating Agency: ~ew Orleans Police Department
Date of Report: September, 1976
Director of Evaluation: Robert Sternhell
prepared by: Stuart P. Carroll, projects Evaluation Specialist III
Evaluation Assistance: Marcia Slotnick, projects Evaluation Specialist II
Ruth de la Gueronniere, Grants Administrator
cheryl Lyle, Clerical and Graphics
Marci Onie, Student Intern
Grant Award: LEAA Subgrantee
$428,073 - $173,501
Total Budget - $601,574
Subgrant P~'lriod:
Project Staff:
7/15/73 to 3/31/76
Clarence Giarrusso, Superintendent of Police
Major August C. Lang, project Director
Lt. Charle~Rodriguez, project Coordinator
Ptn. Alan Latapie, Technical Services Officer
Authorized Official: Moon Landrieu, Mayor City of New Orleans
i

TABLE OF CONTENTS
.-Section Pag~
ACKNOWLEDGEMENTS . • • • • i
EXECUTIVE SUMMARY. • • • • iv
I INTRODUCTION. • • • • • .. .. • • 1 Background · • • • • • • 2 Project Description. • • • • • • 3 Eva,luation procedures. • 5
II PROGRAMMATIC FUNCTIONS. • • • 8 Administrative and Fiscal Responsibility • 8 Personnel Deployment ., • • • • 9 Adult Arrests. • • • • • • 12 Juvenile Arrests • • 14 Property Recovered · • • • • 17 Escapes. • • · '. • 17 Warrants · • .. • • • 18 Investigative Aids · • · ":- • • • • 18 Manpower · • • • • • • • • 22 Juvenile Crime · • • • • • • • • 26
Robbery · • • • • • • • 30 Burglary. • • • • 32 Escapes • " .' • • • • 32 Warrants. • • • • • • • · 34 Summary · • • • • • • 34
Arrest/Offense Ratio • • • • • • • • 37 Other Activities • • • • • • 46
III CONCLUSIONS • • • • • • • • • • • · 50 Federal Review • • • • • • • 50 Evaluation Follow-Up • • • • • • • • · 50 Summary and Conclusions. • • • • • • · 51
~ .. "r
ii

c>
'Table
1
2
3
4
5
6
7
8
9
10
11
12
13
,14
TABLES AND FIGURES
JDEC Financial Summary. . . . • • • • • • • • • 10
JDEC Officer Activities • . . . . . • • • • • • 11
Adult Arrests by JOEC Officers. ' • • • • • c' • • 13
Local Juvenile Arrest Incidents • • • · . . • • 15
Juven;1e Arrests by JDEC Officers •
Positive IO's From Photo Displays.
• • • • • • 16
• • · . • • 21
Actual Juvenile Division Manning. · . • • • • • 24
Estimated Juvenile Division Manning • • • • • • 24.
· . . Total Robberi~s CBA of a Juvenile
Armed Robberies CBA of a Juvenile • • •
• • 31
• 31 • • •
Burglaries CBA of a Juvenile. · . . . . . . . • 33
Escapes C~ of a Juvenile •
Warrants CBA of a Juvenile.
• • • • • • • • • • 33
• • • • • • • • • • 35
Summary - JDEC CM' s. • • • . • • · . . . . • • 36
15 Local First Offender and Repeater Arrests • • • 41
16
17
18
Figure
1
2
3
4
· . Charges Resulting From Juvenile Arrests •
Distribution of Charge Frequencies. • • • • •
• 45
• 45
JDEC Arrests by Type of Offense • • • • • • • • 47
Page
Total Offenses CBA of JUveniles • • • • • • • • 29
Juvenile Arrests and Clearances • • • • • • • • 39
Local Repeater Arrests. • • •
Local First Offender Arrests.
• • • • • • • •• 42
• • • • • • • • • 43
. iii
I

, ...
EXECUTIVE SUMMARY
. During the.1960·s and early 1970's, the juvenile crime
rate was increasing with great speed in frequency and
seriousness. At the same time, the manpoWer of the New Or
leans Police Department Juvenile Division was decreasing.
A Special Task Force report provided the impetus for a spe
cialized enforcement unit funded through the Mayor's criminal
Justice Coordinating Council. The unit was designed to deal
with the two problem areas.
Definition and Study'Objectives
The Juvenile Delinquency Enforcement Component (JDEC)
reprelsented an attempt to deal with the increasing juvenile
crime problem by increasing manpower in the Juvenile Divi
sion by means of a specialized enforcement unit and creat
ing innovative investigatory techniques.
Two previous evaluation reports have concentrated on
(1) program development and (2) progr~natic accomplish
ments and preliminary impact. This final evaluation report
focuses on project history and evaluates its functions as
they relate to the juvenile crime problem in New Orleans.
Programmatic FUnctions
In a primarily des~riptive analysis, the programmatic
"functions are viewed as a means of assessing whether or not
iv
I 'i
/1
;/' <
'.\'
, r,
..
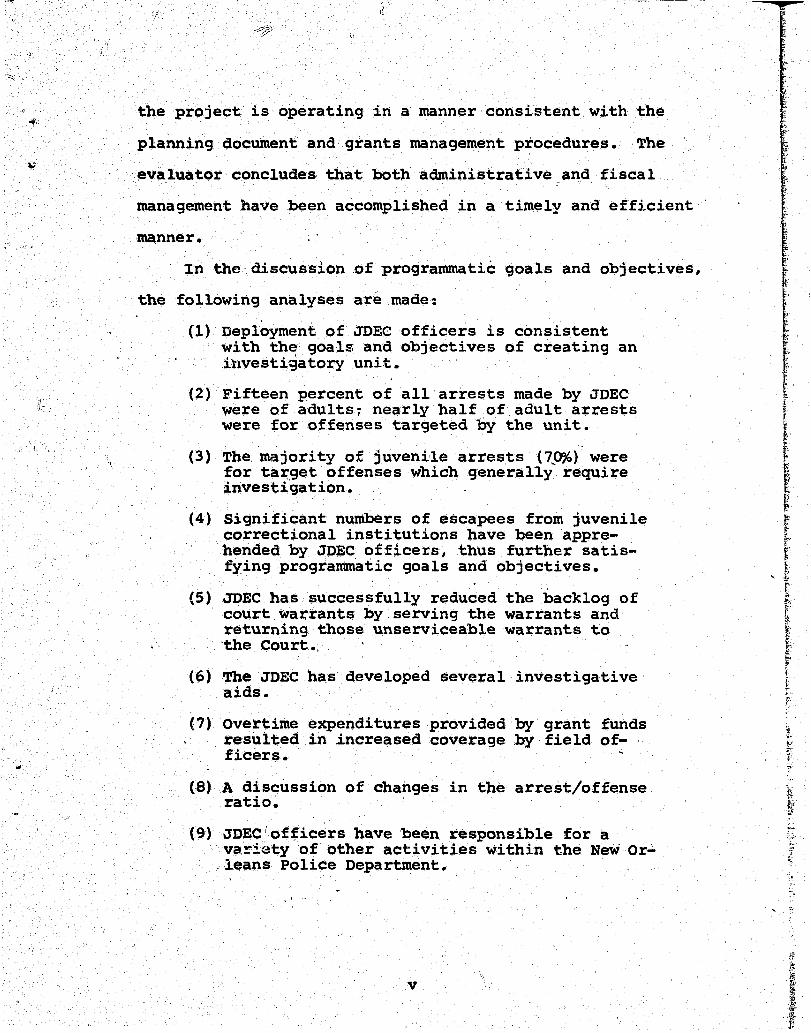
the project. is operating in a manner consistent with the
planning document and grants management procedures. The
'evaluator concludes that both administrative and fiscal
management have been accomplished in a timely and efficient
manner.
In the' discussion .of programmatic goals and objectives,
the following analyses are made:
,
(1) Deployment of JDEC officers is consistent with the goals; and objectives of creating an iflvestigatory unit.
(2) Fifteen percent of all arrests made by JDEC were of adults; nearly half of adult arrests were for offenses targeted by the unit.
(3) The majority of juvenile arrests (~~~) were for tar,get offenses which generally require investigation.
(4) Significant numbers of escapees from juvenile correctional institutions have been apprehended by JDEC officers, thus further satisfyingprogrammatic goals and objectives.
(5) JDEC has successfully reduced the backlog of court warrants by serving the warrants and returning those unserviceable warrants to 'the Court.,
(6) The JDEC has developed several investigative aids.
(7) overtime expenditures provided by grant funds resulted in .increased coverage .by field of-ficers •
(8) A discussion of changes in the arrest/offense ratio.
(9) JDEC of~icers have been responsible for a v~.ri<:!ty of other activities within the New Or";'
. leans Police Department.
v

.. Conclusions
The evaluator concludes that the primary goals of JDEC
have been accomplished during the 31 months of operation.
By following the objectives specified in the grant appli-
cation, the unit was able to create "an enforcement system
for juveniles" emphasizing "intensive research and investi-
gation for all crimes believed to be committed by juveniles;
the construction of appropriate data files; and the improve
ment in the transfer of information between the Juvenile
court system and the Juvenile Division. 1I
Secondary goals were directed to the overtime reduction
of juvenile crime in New Orleans. The evaluator concludes,
from available crime data, that some of the procedures i~~
plemented by JDEC have resulted in decreases in juvenile
crime: other procedures have "held the line" on the level
of juvenile crime.
vi

.. '
....
I
INTRODUcrION
This report is the third and fin~l impact evaluation
study of the JUvenile Delinquency Enforcement Component
(JDEC), which was funded as a discretionary grant under
the Target Area Crime Specifics Plan by the Law Enforce ....
mentAssistance Administration. The first evaluation report
concentrated On project implementation and the development I of the evaluation component. The second study emphasized
2 programmatic accomplishments and preliminary impact.
This current study reviews project history and evaluates
its functions as they relate to the juvenile crime problem
in New Orleans.
This section reviews the project background, describes
the project, and reviews evaluation criteria. Section II
describes programmatic functions and addresses the program
impact by relating programmatic functions to specific'areas
of the juvenile crime problem. The final section contains
the evaluator's conclusions.
ITarget Area Evaluation: A Six Month Report of the Development of Target Area projects and the Evaluation System, MCJCC, City of New Orleans, July, 1974, p. 39-48.
2 Systematic Juvenile Enforcement: A Preliminary
Evaluation of the Impact of Investigative Strategies on Juvenile Enforcement, MCJCC, City of New Orleans, December,
·1974.
1

....
Background
By 1~72 the severity of the juvenile crime problem
in New Orleans'prompted the Mayor to appoint a Special
Task Force to study the problem and recommend viable solu
tions. The Task Fo~ce found that the problems were varied
and serious in that the number of offenses which were at-,
tributable to juveniles had more than aoubled as had the
number of juvenile arrests. The number of local juveniles
arrest~d as first offenders in 1972 was 72% more than 1960,
and the number of repeat Qffenders remained about the same.
Perhaps most serious to the community was the fact that the
seriousness of the crimes being committed by juveniles was
increasing., The number of homicides, rapes, burglaries,
and thefts doubledi and the number of assault and battery
and robberies tripled, j~.cating that the overall increase
in juvenile crime was not in the categories of status and
nuisance offenses. In addition, the number of juveniles
who escaped from correctional institutions increased; and,
in the opinion of police administrators, the juveniles
committed serious crimes while on escape status.
It was apparent to the Task Force members that con-
ventional methods of juvenile enforcement were not achieving
success in retarding the spread of juvenile crime, and the
conception and implementation of new and innovative methods
of enforcement was required. prior to the implementation
of new techniques, the Task Force recommended the immediate
2

;.
..... '"
~1 !,
• ... t, . ""
" .s }f.
: .
!:
[)
assignment of more men to the Juvenile Division.3
With
. only 2. '" of the total manpower complement of the Police
Department being assigned to the ~uvenile Division, the
Division was well below the national standard of 5%. The
two problems of increasing juvenile crime and manpower
shortages were translated into an action program by the
Mayor's crfminal Justice Coordinating Coun~il through the 4
Target Area Crime Specifics Plan. Building on a previous
experiment conducted by the Commander of the Juvenile Divi
sion in 1959, the Crime Specifics Plan suggested the crea-
tion of a specialized, enforcement unit within the Division.
Project Description
The Juvenile Delinquency Enforcement component (JDEC)
was approved for LEAA discretionary funds in JUly, 1973,
and became operational in September, 1973. The total budget
for the project was $424,394 of which $312,493 was LEAA
cash, and the balance in-kind match, to be spread out over
a two-year period. Subsequent adjustments to the Crime
Specifics Plan increased the JDEC budget to $601,574 of
which $428,078 was LEAA cash and extend!3d its operational
period to 31 months.
3Report of the Mayor's Action Force on Delinquency Prevention, City of New Orleans, November, 1972.
4TargetArea Crime Specifics Plan, MCJCC, City of New Orleans, 1972.
3

it . ,.
The rationale for the project was that with an in-
',J "
crease in manpower vis-a-vis overtime payments to o,;ficers
and,vigorous and innovative investigation techniques,
. juvenile crime in New Orleans would decrease. To this end,
a small special squad composed of four investigators and
an administrator, with command assistance from a lieutenant
and sergeant.l was developed iIi the Juvenile Division. The
unit was to concentrate on crimes of burglary and robbery,
to apprehend escapees from juvenile correctional institu
tions, to execute the backlog of juvenile court warrants,
and to judiciously allocate overtime funds in order to
offset the manpower shortage in the division.
The primary goal for the unit was the creation of an
enforcement system which would emphasize intensive research
and investigation for all crimes believed to be committed
~ juveniles, the construction of appropriate data files,
and the improvement in the transfer of information between
the juvenile court system and the Juvenile Division.
Secondary project goals included a short-run increase in
arrests for juveniles committing the target crimes, and a
long-run decrease in the number of target offenses being
committed. The objectives or methods by which these goals
were to be reaChed included the creation and maintenance
of picture and .. slide files of previously arrestea juveniles
for the purpose of facilitating the identification of
suspected juvenile offenders. Secondly, the creation and
. 4

, '~
~ "
~
'. ~ , <:'~. ; ~.
! ~ ;' .t~
~t ., r ~
~ .. , ~~
,.; ,~
~ ~~ , ~7 ~ ,. " t ~
t ;;
t ~~
" ~ ~ ~'
f Z. ;;. ~:
~ . .-
"
f , "'. ,F.i.~ if, ;'.
· ',.
;, 1;-,,' ~ r; ... }"':. ~,
,-.. , ;)... ~:,
" ~,
" ~; ~-
Yr-
",: ;. "
i,/ t f~
~,
! I 7i, • ~.
',. ~,' · >t; l: ~',
I " , ,,~
"
maintenance of geographical~y-based offender' files. Third,
follow-up.investigations were to Qe performed by JDEC
personnel rather than district personnel, and lastly, in
teraction and coopera,tion between JDEC and other judicia 1
and planning agencies.
Evaluation Procedures
Because of the system improvement nature of this
project, the normal evaluation measures of efficiency and
effectiveness are ciosely related. Measures of efficiency
are used to demonstrate the project's ability to adhere to
implementation according to the planning document.
General measures of ,efficiency include time from notifi
cation of grant award to implementation, allocation of
resources, proper activities, and fiscal responsibility.
Measures of efficiency answer the question, "Is the pro-
ject doing what it said it would do?" In the case of JDEC
activities, several direct measures will be used and in-
clude:
(1) The number of black and white photographs processed of juveniles.
(2) The number of color slides processed of juveniles.
(3) The status of warrants in the Juvenile Division.
(4) The number of overtime hours used.
(5) The number of fingerprints taken.
5

(6) The number of juvenile arrests.
(7) The number of adult arrests. i i
Whereas measures of efficiency are descriptive, measures
of effectiveness are inferential. They attempt to eval-
uate the impact of project operations upon the target
problem. Thus, these measures proceed from a set of hy
potheses about what the project should do and, as such,
are "end" oriented rather than means oriented. 5 Indivi-
dual hypotheses will be restated in relevant portions of
this report in the context of the descriptive ~nalysis.
The data used for the evalu~tion was collec'ted from
monthly narrative progress reports submitted by JDEC and
the arrest and offense tapes maintained by the EDP Center.
Although research problems exist in all evaluations,
two warrant special attention here. The first comes from
the term "juvenile crime". Juvenile crime as it is used
in this report and as it is generally used is a descrip-
tive term indicating the level of criminal activity juve-
niles are involved in. However, in operational terms,
"juvenile crime." is not easily measured since no accurate
measures exist to determine exactly which crimes are com-
mitted by juveniles" As a result, "juvenile crime" is
measured as the number of offenses cleared by the arrest
of a juvenile. Obviously, this is not a measure of all
SSee Eval'!S,tion, December, 1974, p. 10-19.
6
, '~

~'
!,
'" ?'
J 1
i
1 •
I
. j ~ .. "
juvenile criminal activity: however, it is the only
reliable measure and can be used as an inJicator with some
degree of accuracy, although in practice it is really a
low estimate.
A second problem is the lack of control groups for
JDEC operations. Since the unit operated at-large, no
police zones or districts could be used for control pur-
poses. Instead, comparisons must be made on an at-large,
before-and-after project implementation basis which severely
dilutes possible programmatic impact. However, in some
instances where the unit participated in special short-term
operations, it is possible to show short-run impact.
7
1:".,-:
~~::~ ""-~t ,!.:+
'f~~ ;;B ""'" l4-~:
I~ ~ , ~ '"
''" w ,; • I i{
I .,,~,
II
PROGRAMMATIC FUNCTIONS
In order to determine whether the project is opera-
tional and adhering to the planning document and grants
management procedures, it is necessary to view programmatic
functions. This analysis is primarily descriptive in that
it views progress made toward operationalizing the objec-
tives or program methods. These descriptive measures or
measures of efficiency, when related to overall juvenile
crime, will be used to assess program impact. Other var-
iables such as the actions of juvenile court, i~plementa-
tion of juvenile serving programs and population have been
discussed in previous reports: and it should suffice here
to restate that the impact of JDEC is relative to these
other influences. While the efficiency of the unit can be
treated straightforwardly, the potential for impact must
be viewed as only one element in a complex set of inter-
vening factors in the juvenile justice system.
Administration and Fiscal Responsibility
The grant award for JDEC was received on July 15, 1973,
and funding was released during August, 1973. By September" ; .
all equipment was ordered, personnel were in place, and
operations began. Definitions of tasks and operating pro
cedures were formally developed during September, and the
result has been used as an operating manual.
8

. '
Monthly narrative progress reports began in September
and since. then "have be~n submitted in a timely and e£:fi-
cient manner. Fiscal management and the submission of
, quarterly fiscal report.s have been completed at an optimal
level. There were three grant adjustment requests during
the discretionary period, and each was submitted correctly
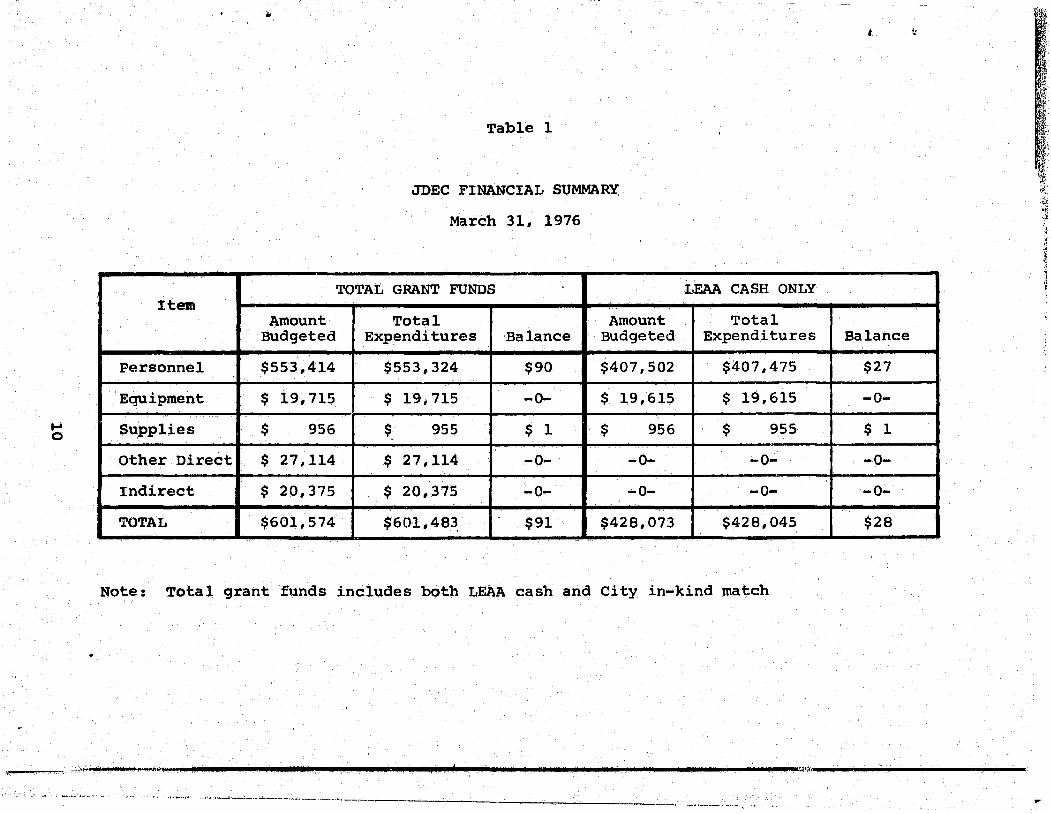
and subsequently approved. Table 1 gives a brief financial
summary for the project based on its revised budget. FUnds
; were expended in the categories budgeted with the bulk of
funds being allocated for personnel costs. Expendi~ures
for supplies include items mostly related to the photographic
capability of the unit, such as film, developing materials,
and processing costs. other expenses under supplies include
gas and maintenance for the unit's automobiles. Non-
recurring costs are included in the equipment category and
consist of major expenses for the purchase of automobiles
and UHF radios.
The overall administration for the project was profes-
sionally accomplished both in terms of grants management
and operations scheduling.
Personnel Deployment
Since the unit's primary goal ~'''\,S to establish an in
vestigatory unit, the, allocation of'personnel time should
clearly reflect time spent by officers on investigation.
Table 2 shows the distribution of time spent by officers
9
.... o
Table 1
JDEC FINANCIAL SUMMARY
March 31, 1976
TOTAL GRANT FUNDS LEAA CASH ONLY Item
Amount Total Amount Total Budgeted Expenditures Balance Budgeted Expenditures
Personnel $553,414 $553,324 $90 $407,502 $407,475
Equipment $ 19,715 $ 19,715 -0- $ 19,615 $ 19,615
Supplies $ 956 $ 955 $ 1 $ 956 $ 955
Other Direct $ 27,114 $ 27,114 -0- -0- -0-
Indirect $ 20,375 $ 20,375 -0- -0- -0-
TOTAL $601,574 $601,483. $91 $428,073 $428,045
Note: Total grant funds includes both LEAA cash and City in-kind match
Balance
$27
-0-
$ 1
-0-
-0-
$28
,~.,...,....".,..,.....,. .~" .... r. __ "",,_"'~W''''IIII_' ......... __ ...... ________ ........... """' __________________ :;u.~t:~\ ___ ..... __________ ...... ~
"'" ."--,,,'." ",,"-".~--,- ... ----.-------... --.-. "----.---~-------
"' j :1 I

-- .-, ... ' < ..... ,~ ~""
Table 2
JDEC OFFICER ACTIVITIES
September, 1973 - March, 1976
% OF ACTIVITY HOURS TOTAL
Investigations 13,049 .. 25 60.3%
patrol High Crime Areas 7,248 .. 00 33.5%
pedestrian Checks 332 .. 25 1.5%
f Residence Checks 287 .. 00 1 .. 3% .:
Vehicle Checks 130.00 <1.0%
General Assignment and Emergency 66.50 <1.0%
,.' Mardi Gras 515.00 2.4%
Meetings 28.25 <1.0%
TOTAL 21,656.25 100%
~ Note: This summary includes only time spent by the four ? detectives assigned to JDEC exclusive of overtime
.. ;.
11

by category of activity. More than 60''{' of the officers I
time was spent on investigations, with the bulk of the re
maining time being spent patroling those areas of the city
which were identified by the Research and Planning Division
of the New Orleans Police Department as potential areas for
juvenile crime occurrence. Thus, deployment of JDEC of-
ficers is consistent with the programmatic goals and ob-
jectives of creating an investigatory unit.
Adult Arrests
Because of the complex nature of police work, it is not
possible for officers in special units to ignore criminal
activity which might be observed even though that activity
is not directly their concern. As a result, officers of
the JDEC have made arrests of adult suspects. Many of those
arrests were made jointly with the arrests of juveniles or
on leads supplied directly by the juvenile at the time of
arrest. In some cases, the juvenile may have been the
vi-:'.~t.:tm. Although barely 15% of all arrests made by JDEC
(:Iffic(z:.rs were on adults, this activity does figure prom-
:t!i:1~t:r..·~.:J".;w in their activities. Table 3 shows the type of
C):tfen~lies for which adults were arrested by JDEC and those
fi9¥.~(res are exclusive of warrant arrests. It should be
:pointed out that 49% of all adult arrests were for the of
fenses being specifically targeted by the unit.
12
I j' 1
!

Table 3
,.
ADULT ARRESTS BY JDEC OFFICERS
% OF OFFENSE NUMBER TOTAL
Burglary 37 28%
Robbery 27 21%
Theft 15 11%
Contributing to the Delinquency of a Minor 15 11%
Drugs 11 8%
Other Violent Crimes 21 16%
Other Property Crimes 6 5%
TOTAL 132 100%
~i

Juvenile Arrests
Since the arrest of juveniles for target offenses is
one of the primary responsibilities of the unit, importance
shoul~ be placed on this activity. The number of local
juvenile arrests increased steadily during the 1960'sand
early 1970' s. The number of arrest in'cidents involving
local youth increased by 95% from 1960 to 1972. During the
period immediately preceding the grant award for JDEC, the
average yearly increase in the arrest incidents for local
youth was 8.63% per year as is illustrated in Table 4.
Since JDEC operations began, there has been an average de-
crease per year of 5.56%. One commonly accepted hypothesis
about arrest rates is rejected in this case. That hypo-
thesis states that increased emphasis' on law enforcement
should dramatically increase the number of arrests in the
short run. The alternative hypothesis for this project is
that because of improved investigative techniques, the nu~
her of arrest incidents will decrease because fewer juve-
niles will be initially arrested who are subsequently not
charged. In effect, improved investigatory techniques will
reduce or eliminate what is generally called IIdragnet
operations" in which investigation follows arrest.
Eighty-five percent of all JDEC .arrests were on juve
niles, and Table 5 shows the breakdown by offense category
excluding Juvenile Court warrants. Seventy percent of all
arrests made were for the target offenses of burglary,
14
-
y ••
~ ~
I
If'··· ·1
'. ,
t: r 1 :1

Table 4
LOCAL JUVENILE ARREST INCIDENTS
.' Difference < Year Number (F) (%)
1967 4,195 - -1968 5,012 +817 +19.47
1969 5;838 +826 +16 .. 48
1970 6,390 +552 + 9.45
1971 6,525 +135 + 2.11
1972 6,243 -282 - 4.32
1973 5,288 -995 -15.29
1974 4,971 -317 - 5.99
1975 5,199 +228 + 4.58
':i.
15
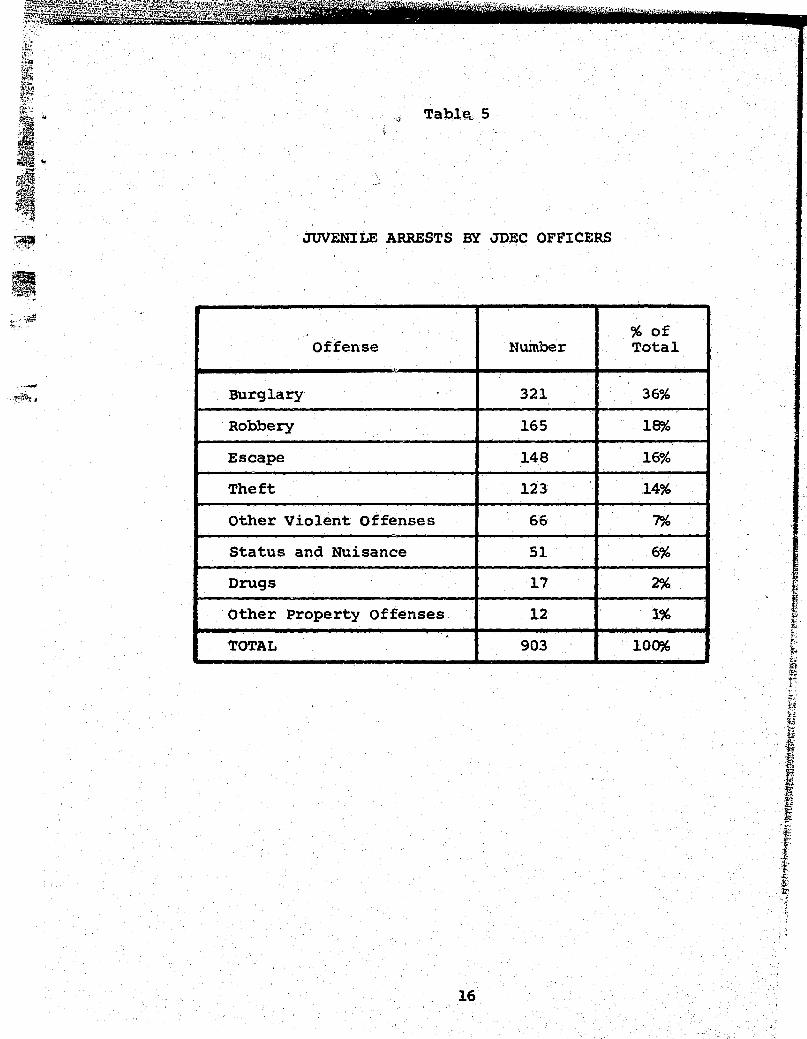
TablEt 5
JUVENILE ARRESTS BY JDEC OFFICERS
% of Offense Number Total
Burglary 321 36%
Robbery 165 18%
Escape 148 16%
Theft 123 14%
Other Violent Offenses 66 7%
Status and Nuisance 51 6%
Drugs 17 2%
Other Property Offenses 12 1%
TOTAL 903 100%
16

, I
\\
;, : i
.. ~"< ••
~.; ~.,~. ,
','
... .
"
~
" ~ '!'-
,:i;"
~.
",
~
~
t
"" "-
~
t·
"-
~i r·· .. ~." . lii ~',
({.
~, ~
i,
~,
t.; r )}~
~ !J;; .-;;,;.
~. 1;;"
~ -f!5it
:;::
robbery, and escape. Minor, statu~t and nuisance offenses
accounted for only 7% of arrests. This indicates that
'because of the proper allocation of time and resources that
'.results ir. the form of arrests for target offenses occur •
The offenses targeted are those normally requiring a con
siderable amount of investigation and follow-up.
propertY,Recovered
As a result of the above mentioned arrests, stolen
property valued at approximately $75,745 was turned over
to the juvenile court, for return to victims.
Escapees
The apprehension of escapees from Louisiana's juvenile
correctional institutions was a serious concern of JDEC.
Since New Orl~ans is responsible for most 9f the inmates of
these institutions, New orleans escapees are more highly
represented. Escape status per se is only one part of the
problem, since, it is the consensus of juvenile officers that
"escapees commit numerous offenses while on escape status.
Thus, the early ~otification of an4 swift apprehension of
. escapees is an essential element in re(lucing, juvenile
crime. JDEC has been responsible for the apprehension of
148 escapees, . and this accounts for 16% of all JDEC arrests.
Figures from the ~epartment of Corrections indicate that
at the end of ~~e discretionary grant period, only 6 escapees
17

. .
..
from the New Orleans area were still at large: and it is
suspected that most of these did not return to the area
. 'after escape. JDEC officers believe that the vigorous ap
prehension of escapees has had a residual effect on poten
tial escapees by making escape less attractive to them
because of the certainty of apprehension.
Warrants
One of the problems existing in the Juvenile Divi
sion at the time of grant inception was the backlog created
by unserved adult and juvenile warrants. JDEC was able to
reduce the backlog of 400 unserved warrants to 110 within
several months of operations. Procedures were then es-
tablished to have those warrants which could not be served,
such as those wh.ere the subject had moved, returned to
court for disposition. procedures were also implemented
'for notification to JDEC for warrants that had been re-
called. Since the backlog reduction, 1,230 warrants have
been received by JDEC, of which 35% were for adults and
65% for juveniles. Fifty-three percent of the warrants re-
ceived were successfully served, with the balance being
returned to the court •
Investigative Aids
An integral component of the JDEC concept was the de
velopment of investigative aids which would assist in the
18
I I I 1 I ! I
7'f';:~W~lfi,Jtili"7E1II,,_' _",II. %@!:'*i!lI.t~~F~"'-~ .. ~t ~=,.::, =.--,,::::::,::,=,::::;;,,=:::-,,=,,-,,= __ =,,=~~=-:_=,_.~, =-=_==M.-' __ .o--_ .. ,--'. __ ..•••.. ~~,« ................... "., ............. .. (/
" '~
r }i: ·:t
.' ~~
. ~
"J
,',
arrest of juveniles and/or clearances of offenses believed
to have been committed by juveniles. Aids were designed to
assist officers in systematically investigating leads and
enable them to. perform follow-up' investigations in cases
where there were and were not witnesses to the incident.
Several inv,estigative aids were developed or implemented by
JDEC for that purpose.
With the cooperation of the Research and Planning Di-
vision and the Data processing Section of the New Orleans
Police Department, a geographically-based offender file
was developed and implemented. This character trait or
"CT" file,has as its rationale that juvenile offenders tend
to commit offenses near their residence. With this in mind,
juveniles are sorted into the police zones of their resi
dence: and information relevant to fingerprints, photographs,
sociological characteristics, and police record is co~
puterized. When an offense occurs in a particular zone,
the investigating officer can request a print-out of pre
viously arrested j'uvenilc::~s in that area. By doing this,
the officer can pin-point likely suspects based on previous
behavior or eyewitness descriptions. If'this does not
prove fruitful, the officer can request a print-out of an
adjacent zone and 'so-on until he has exhausted the possi
bilities this file has to offer. In some cases where the
actual suspect is not identified from the file, leads fur
nished during this investiga'tion will lea.,d to the apprehen
sion of the proper individual •

As mentioned above, fingerprints are an essential
part of ,the CT file. During the project life, 1,774 fin
gerprints were taken of arrested sUbjects. Facilities were
established at the Juvenile Division which greatly enhanc.e
this process. Fingerprints as an investigative tool are
especially important in those cases where there is normally
no eyewitness, such as burg1a.ry. During the first year of
operations, 18 juveniles were arrested as a result of latent
fingerprint identification. Since that time, the use of
fingerprint identification has ceased pending a ruling of
the State Attorney General concerning this technique.
A photographic capability is an indispensib1e investi-
gative aid in those cases where an eyewitness is present.
JDEC instituted two types of photographic capabilities to
the division. Both black and white (mug shots) and color
slides are made of juveniles at the time of arrest. Black
and white prints are used in the traditional manner for
suspect identification, and 2,634 photographs have been
made by project personnel. The use of color slides is an
innovation necessitated by laws protecting juveniles from
personally appearing in "show up" or "1ine up" procedures.,
As an alternative, color slides are projected which corre
spond to the height. color, clothing, etc. of the suspect:
and the witness or victim has a clear representation from
which to make an identification. During the project, color
slides were made on 2,288 juveniles. Photographic displays
'I
l~~~~~%~~1;+J!~~T~~~0~l}~~~!~~~}~~1~~~~~~~:~~'~~~t~~l.t7h~\ It- ... ~_ ,,-' - - - -- ..
~ ~. ~ •• -.-.-~-, - .... ------~--~ ~~, ~ .......... < ••
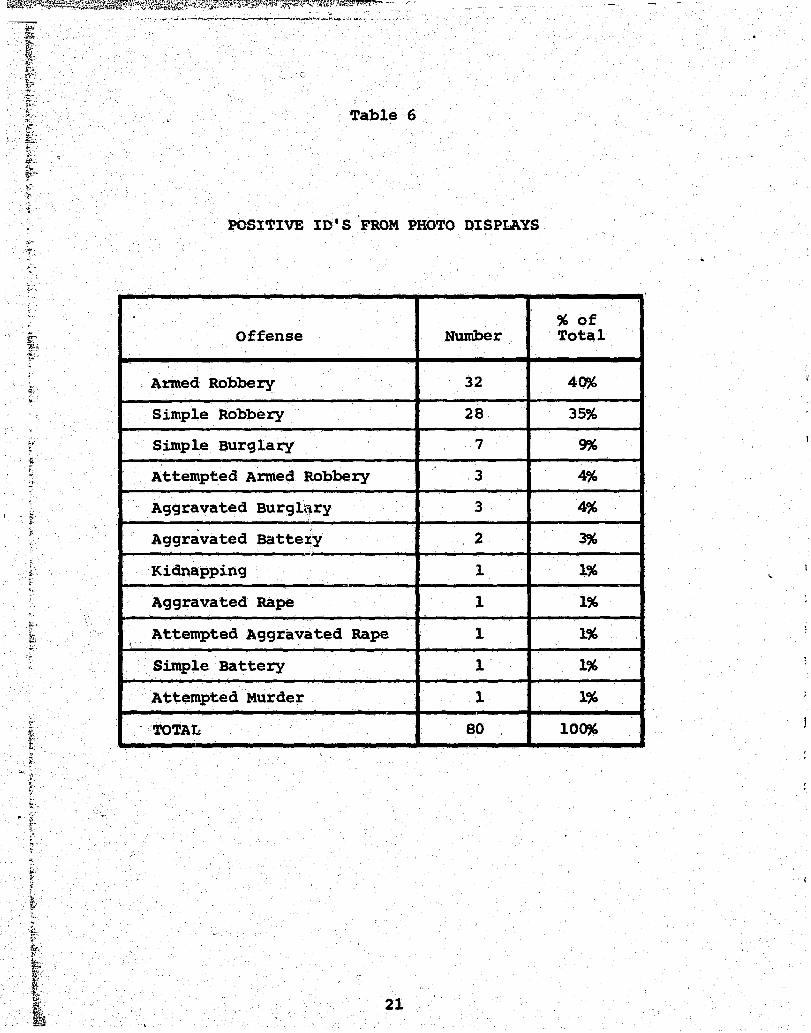
Table 6
POSITIVE IDIS FROM PHOTO DISPLAYS
,
. % of Offense Number Total
Al."med Robbery 32 40%
Simple Robbery 28 35%
Simple Bur9lary 7 9%
Attempted Armed Robbery 3 4%
A99ravated Burg11.~ry 3 4%
A9gravated Battex.y 2 3% -Kidnapping 1 1%
Aggravated Rape 1 1%
Attempted Aggravated Rape 1 1% \
Simple Battery 1 1%
Attempted Murder 1 1%
TOTAL 80 100%
21

were used 235 times and resulted in 80 positive identifica-
tiona. Eighty-eight percent of all positive identifications
were for the target offenses, thus emphasizing their utility
as an aid where follow-up investigation is necessary.
Photo identifications were responsible for about 15% of all
JDEC arrests for burglary and robbery.
Manpower
The judicious use of overtime funds by JDEC was an at
tempt to offset the manpower shortages existing in the
division. By taking the number of hours in a normal work
week (H) and the number of overtime hours used (0) and the
number of weeks in the period (W), it is possible to translate
the overtime figure into an approximate ,additional manpower
figure. In the preliminary report on this project, it was
determined that approximately 11.5 additional men resulted
from the use of overtime. For the period September, 1974,
through March, 1976, approximately 11.8 men were added using
the computational method below:
T $ 0 HxW
T = 36,726.5 40 x 78
= 36,726.5 = 11.77 3,120
By rounding off, it can be estimated that approximately
twelve officers were added to the Juvenile Division during
the grant period. Two aspects of this suggested manpower
increase must be viewed in order to assess its impact on
• i
I I I
i !
I I
I ,
I I J
.'.
. '
enforcement operations. First, what effect did it have on
total manning: and secor-d', what is th~ comparative cost for
overtime manpower vercus additional assigned manpower. One
question which is not dealt with here because of its extreme
qualitative nature is the comparative effe'ctiveness of of
ficarswho are working on overtime and officers entering
a shift fresh. It is the opinion of city police administra
tors that officers on overtime perform at a high level: and~
in fact, because of departmental manpower shortages, over
time has become a normal operating procedure. Because of
manpower shortages, most, if not all, special units in the
.-,
New Orleans Police Department are manned on an overtime basis.
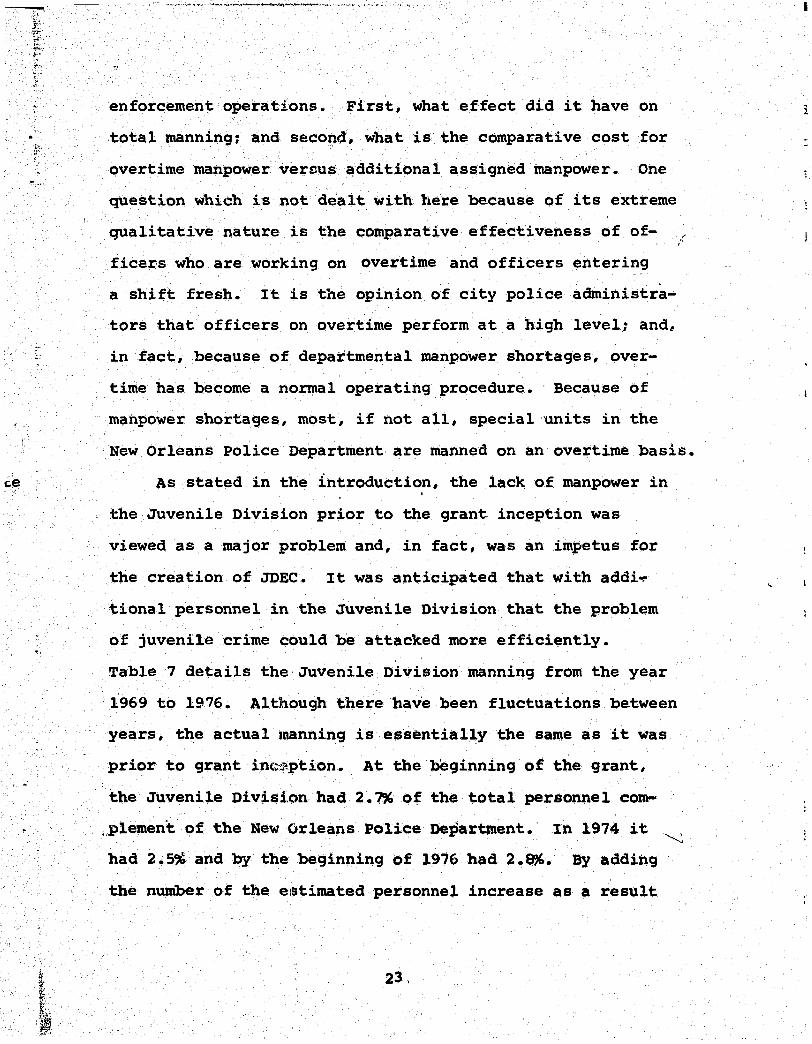
As stated in the introduction, the lack of manpower in
the Juvenile Division prior to the grant inception was
viewed as a major problem and, in fact, was an impetus for
the creation of JDEC. It was anticipated that with addi~
tional personnel in the Juvenile Division that the problem
of juvenile crime could be attacked more efficiently •
Table 7 details the Juvenile Division manning from the year
'1969 to 1976. Although there have been fluctuations between
years, t~e actual lrulnning is essentially the same as it was
prior to grant incs'~ption. At . the beginning of the grant,
the Juvenile Divisi.on had. 2.7% of the total personnel com-
,.plement. of the New Orleans Police Department. In 1974 it ~
had 2.5% and by the' beginning of 1976 had 2.8%. By adding
the number of the elstimated personnel increase as a result
i

::::~;;:~!!f~::;;!::;:~:;;::£J;i4]f~~~ •
Table 7
ACTUAL JUVENILE DIVISION MANNING
1/69 - 1/76
~ 1/69 1/70 1/71 1/72 1/73 1/74 1/75 1/76
Total 42 45 50 44 42 40 36 43
Line Only 22 21 23 26 25 19 21 26
Table 8
ESTIMATED JUVENILE DIVISION MANNING
1/69 - 1/76
1/69 1/70 1/71 1/72 1/73 1/74 1/75 1/76
Total 42 45 50 44 54 52 48 55
Line Only 22 21 23 26 37 31 33 38
, 24

- ---~ - -- - ~ ---- ----- - --- -----___ ... .." ""-~_,,._ " ...... """ .... -....> I~ __ """' ... T ..... ~ e,.
~' "
of" overtime " (Table 8) ,the percentag'~'changes to 3.3% for.
1974 and .3.6% for 1'976. While these increases helped, they
did not enable the division to reach the 5% figure .reco~
mended by the. National Standards and Goals.
In operational terms, overtime expenditures did result
in increased coverage by field officers. As an example,
the actual manning would allow an average of 23 field of
ficers for the division. BreaJdng this into shifts and
not adjusting for days off or holidays, a maximum of seven
field officers would be on duty during each shift. Con
sidering that there are eight police districts, this does
not even allow coverage for each district. By adding the
estimated increase, it is suggested that an average of 35
officers would be available for field assignment or ap
proximately 12 per.·shift, an increase of 71%. Total divi
sion manning, field, rank, administrative, and bicycle
section was increased an average of.3~.
Comparative costs of overtime versus regular manning
are extremely difficult to compute. Since there is
variance in individual officer's pay because of length of
service and state supplemental pay, it becomes necessary
to 'generalize. A comparison of costs in this case does not
indicate the appropriateness of spending the funds~ rather,
it is intended as an aid to decision makers concerning
future ~nning in the JUvenile Division. The average pay ,'" 1.'
~r officer was computed as a base pay rate for a patrolman
·25

with three years experience, excluding state supplemental
pay. Overtime rates were computed as those appropriate for
that scale. The cost "for an additional twelve officers at
regular pay ($4.5l per hour) during the grant period would
have amounted to approximately $270,.600. The cost for the
twelve additional men on an overtime basis was $407,745,
or a difference of 34%. If the difference, $137,145, was
used to purchase services at regular time, an additional
six officers would be added to the Juvenile Division, thus
increasing the total personnel complement by 18, or an
average of 46%.
Juvenile Crime
Once new investigative techniques were instituted '
and personnel was increased via overtime, it would be ex-
pected that some impact would be made on the level of juve
nile crime. Normally, the expectation would be that there
would be a short-term increa,se in both reported crime and
the number of arrests made. Problems arise, however, when
considering juve~ile crime because reported incidents are
not reported or categorized as juvenile or adult. It is
only until an arrest of a juvenile has been made and a
clearance of a reported incident takes place that an in
cident is categorized as a juvenile offense. Thus, the only
close indicator of ~Ijuvenile crime ll and the one most com-
monly used-is the ,number of offenses cleared by the arrest
26
I I I
;, ,
l' " i
I 1
I I I

y'
...,.. ....... ,- -- .... '
of a juvenile. By using this method, the process of hy
pothesizirl'g about expected trends in the increase or de
crease of "juvenile crimen becomes meaningless.
For the purpose of example only, consider the follow
ing: In New Orleans, the police annually clear by arrest
approximately 25% of reported crime. For the .purpose of
analyzing crime, the figure for reported crime is used.
~o if 50,000 qffenses were found to have been committed in
Orleans Parish, that is the figure that would be used to
illustrate the extent of crime. (This also would be a low
estimate since it does not include non~reported crime.)
If the police reported only those offenses cleax-ed by arrest,
that figure would. drop to 12,500, obviously a low indicator
of crime. By reversing this equation somewhat, it is pos
s~ble to arrive at a hypothetical upper limit for juvenile
crime. Suppose there were 5,000 offenses cleared by the
arrest of juveniles (nju:\Tenile crimen) and suppose the
police clear 4~~ of all !offenses committed by juveniles
(this assumes juveniles ax-e easier to catch than adults-
the percent is arbitrary).
Since using the number of offenses cleared by the ar
rest of a juvenile (CBA's) is concerned only with those
juveniles who got caught, the real utility of this measure
is that it can be used to display identifiable juvenile
crime. It can reasonably be expected that this identifiable
juvenile crime is, in reality, only a low estimate of youth
ful involvement in crime.
27

The problem of identifying programmatic impact on
juvenile crime is further compounded by the fact that if
estimates or projections are made for the actual extent of
juvenile crime, the development of categories from the
estimated aggregate data would make all conclusions from
the data tenuous.
Therefore, the following analysis of JDEC operations
as they relate to overall juvenile crime is primarily descrip
tive. Because most of the offenses to which JDEC devotes
its attention are basically follow-up investigations based
on leads supplied by others, dramatic shifts in trends could
not be expected. Rather, fhe impact of JDEC will be viewed
as its relative participation in the clearances of offenses
by the arrest of juveniles.
Juvenile crime as measured by offenses cleared by ar
rest experienced dramatic increases during the 1960's and
early 1970's as is illustrated in Figure 1. In 1973 (the
inception of JDEC, this trend began to reverse ~ decreasing
by over 4% in 1973, by over 5% in 1974, and increasing less
than 1% in 1975. Since the inception of JoEC, there has been
an overall decrease of 9% since 1972. During the two full
years of JDEC operations (1974 and 1975), the unit was re
sponsible for clearing 6.9% of all juvenile offenses.
Considering the relative size of JDEC and the f~ct that it
concentrates mainly on the more serious juvenile crime or
those requiring extensive follow-up investigation, this
28
l i
I 1 t

Fivurt 1
fTOTAL OFFENSES" CLEARED BY THE 1960 - 1975
5800 5600 5400 5200 5000 4.800 4600
<- 4400 !
4200 4000 3800 3600 3400 3200 3000 .2800
2600
ARREST OF JUVENI LES
I I I , '60 . '61 '62 '63 'S4 '65 '66· 'S7 '68' '69 '70
,:rH
160
f 2647;
FREQUENCY· DISTRIBUTION
a PERCENT CHANGE
16\ '62 '63 '641 '65 'ss 'S7 .168 '69
2810 2738 2802 3051 !426 3311 3580 "189 4970
change ••• 1 -2.5 t23 +8.8 .12,2 -,., t8.1 "7.0 fI8.'
Source: Juvenil. Division, NOPD Prepared by: CJCC .29
'70 17! '72 173 '74 '7S
11355 5682 5883 5431 5131 SIS'
f7.1 .8.11 0 -..... -5.4 0

percentage is respectable since the entire Juvenile Divi-
sion accounts for only 3.6% of the department manpower and
JDEC for less than 1%.
Since JDEC was created to target in on specific crimes,
it is necessary to view separate categories of offenses
and JDEC's contribution. JDEC was to concentrate on the
offenses of robbery, burglary, and escape and was to help
alleviate the backlog of Juvenile Court warrants.
1. Robbery
The number of robberies cleared by the arrest of a
juvenile and their proportion of total CBA's for the years
1970 through 1975 are displayed in Table 9. Since the in-
ception of JDEC, the frequency of robberies cleared ex-
perienced an increase initially and experienced a decrease
during the last full year of operations. By looking at the
proportion to total offenses, at least two possible con
clusions can be drawn. One, more youth are committing
robberies and getting caugh~or more emphasis is being
placed on investigative efforts to clear tbese offenses.
During 1974, JDEC cleared 68 of 306 robberies cleared
or 22%. In 1975, it cleared 45 of the 267 or 17%. Within
the robbery category, armed robbery is 'by far the most
serious type of offense. Table 10 displays the frequency
and proportion of armed robbery from 1970 through 1975.
A similar pattern to that of total robberies is apparent.
Forty-one percent of all robberies cleared were armed.
30
J
I

-, .;,
Year \ \ 'I'
ii
1970
1971
1972
1973
1974
1975
Year
1970
1971
1972
1973 c
1974
1975
Table 9
TOTAL ROBBERIES CLEARED BY THE "RREST OF A JUVENILE
Frequency % Change % of Total CBA
251 +3~
225 -10%
243 +8%
293 +21%
306. + 4%
267 -13%
Table 10
ARMED ROBBERIES CLEARED BY THE ARREST OF A JUVENILE
4.7rJ%.
3.95%
4.27%
5.39%
5.95%
5.17%
Frequency " Change " of Total CBA
112 +103% 2.09%
95 - 15" 1.67% . 92 - 3% 1.61"
121 +32% 2.22%
·125 + 3% 2.43%
99 - 21" l,..91"
31
Forty-six percent of all robberie s cleared by JDEC were
armed, and JDEC cleared 25% of the total armed robberies
cleared. The utility of investigative techniques can be
seen by the fact that 4~~ of JDEC armed robberies cleared
were as a result of photo identification.
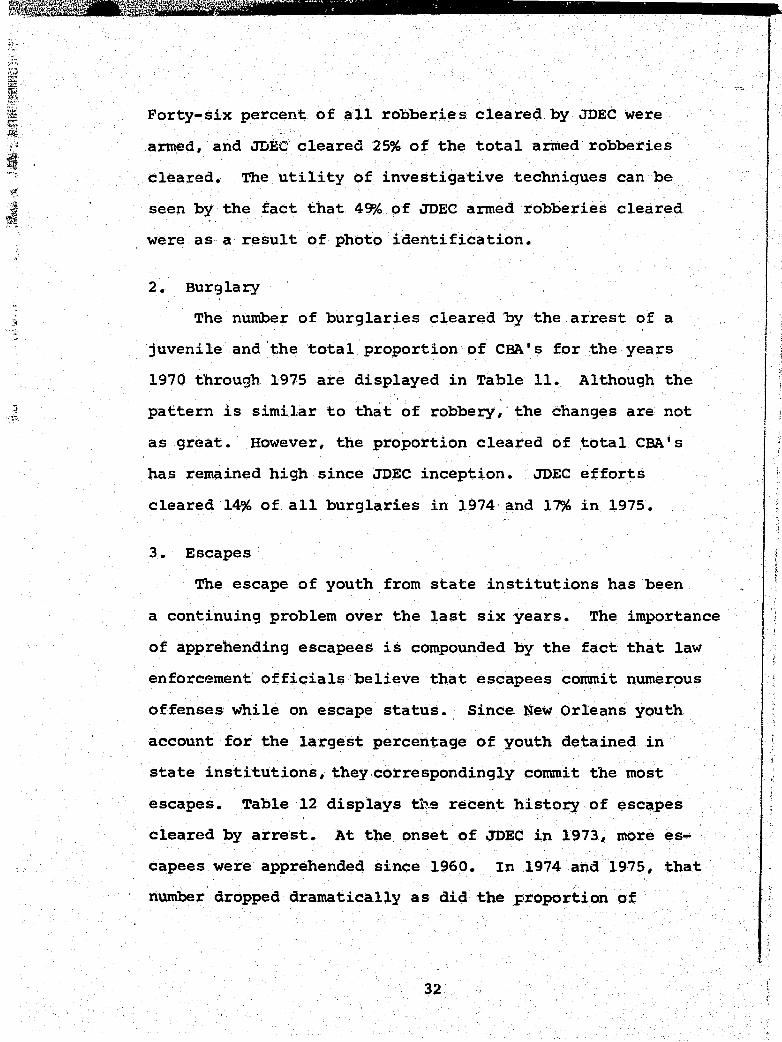
2. Burglary
The number of burglaries cleared by the arrest of a
juvenile and the total proportion of CBA's for the years
1970 through 1975 are displayed in Table 11. Although the ,
pattez:'n is similar to that of robbery, the changes are not
as grf~at. However, the proportion cleared of total CBA' s
has remained high since JDEC inception. JDEC efforts
cleared 14% of all burglaries in 1974 and 17% in 1975.
3. Escapes
The escape of youth from state institutions has been
a continuing problem over the last six years. The importance
of apprehending escapees is compounded by the fact that law
enforcement officials believe that escapees commit numerous
offenses while on escape status. Since New Orleans youth
account for the largest percentage of youth detained in
state institutions, they correspondingly commit the most
escapes. Table 12 displays the recent history of escapes
cleared by arrest. At the onset of JDEC in 1973, more es
capees were apprehended since 1960. In 1974 and 1975, that
number dropped dramatically as did the proportion of
32

Year
1970
1971
19'72
1973
1974
1975
Year
19'70
1971
1972
1973
1974
1975
T~ble 11
BURGLARIES CLEARED BY THE ARREST OF A JUVENILE
Frequency % Change
591 +21%
717 +21%
629 -12%
"727 +16%
674 -7%
676 N/C
Table 12
ESCAPES CLEARED BY THE ARREST OF A JUVENILE
Frequency % Change
191 +34%
143 -25%
198 +39%
260 +31%
198 -24%
101 -49% .
33
% of Total CBA
11.07%
12.61%
11.06%
13 .3ao~
13 .1~"
13.10%
% of Total CBA
3.58%
2.51%
3.48%
4.78%
3.85% }
1.95%
'.1

escapees of C~. While escapees are still a problem to
New Orleans, it is suggested that their certainty of capture
is working to discourage future escapes. During 1974 and
1975, one fourth of the escapees apprehend~d were caught by
JDEC officers.
4. Warrants
The inclusion of warrants in this discussion of offen
ses is necessitated because those youth picked up as a
result of a warrant issued by the Juvenile court are counted
as juvenile offenses.. Generally, these warrants are served
on youth who have violated the terms of their probation or
because they did not appear for their Juvenile Court hearing.
Thus, those C~ I S as a result of warrants caIn be viewed as
officers acting as representatives of the court rather than
clearing an actual offense. Table 13 displays the frequency
and proportion of warrant services during the past six years.
It is clear that at the inception of JDEC that efforts were
made to reduce the backlog of warrants. From 1972 to 1973,
the number of warrants successfully served more than
doubled. The number, although remaining high, has de
creased since the initial impetus. JDEC has assumed almost
total responsibility for warrant service, serving 84% of
all warrants in 1974 and 99% in 1975.
5. SUmmary
In each of the categories of offenses for which JDEC
was to exert its efforts, there was, by the last year of
34

Yea).'
1970
1971
.,1972
1973
1974
1975
Table 13
WARRANTS CLEARED BY THE ARREST OF A JUVENILE
Frequency % Change % of Total CBA
78 +24% 1.46%
118 +51% 2.07%
160 +36% 2.81%
252 +58% 4.64%
231 -9% 4~49%
198 -14% 3.83%
35

Table 14
SUMMARY OF JDECPARTICIPATION IN CBAuS
1974 1975
Total Offenses CBA 5,137 5,159
JDEC Offenses CBA 323 408
% JDEC of Total 6.2~" 7.90%
Total Robberies CBA 306 267
JDEC Robberies CBA 68 45
% JDEC of Total 22.22% 16.85%
Total Armed Robberies CBA 125 99
JDEC Armed Robberies CBA 31 18
% JDEC of Total 24.80% 18.18%
Armed Robbery/Robbery % 45.58% 40.00%
Total Burglaries CBA 674 676
JDEC Burglaries CBA 96 193
% JDEC of Total 14.24% 28.55%
Total Escapes CBA 198 101
JDEC Escapes CBA 47 26
% JDEC of Total 23.73% 25.74%
Total Warrants CBA 231 198
JDEC Warrants eBA 193 195
% JDEC 83.54% 98.48%
36

'the discretionary grant period, a reduction in the amount (' . .:.
;,of identifiable juvenile crime. The extent of juvenile ,I . . .:;: .
crime is a result of numerous and complex variables, of
which enforcement is only one. The operations of JDEC have
?been clearly aimed at reducing the target crimes and share
in those factors causing a decrease relative to their
(J participation.
Arrest/Offense Ratio
Lacking an adequate measure for offenses, an alterna-
tive measure was suggested. It was hypothesized that if
the project was effective, the relationship of offense~
cleared to arrest (axrest/offense ratio) would narrow sig-
nificantly and perhaps reverse itself. That is, the number
of clearances would exceed the number of arrests for a
finite period of time or more probably, the gap between
the two would close. Underlying this hypothesis are the
following assumptions: .",
First, improvements in the investigative techniques
" are designed to reduce the number of arrests. Particular-
istic investigative aids, i.e., fingerprints, photo iden-
tification, geographically-based offender files, should
narrow the range of suspects to be arrested, therefore re
ducing the number of arrests needed for clearance.
Second, the investigative teChniques are intended to
result in the increased arrest of mul~iple offenders,
37
.'.

~llil'iliii~1715IIlr11~1-1I1I""""""""""""",, ____________________ _
..
whose incarceration will clear several additional cases.
The n\uitiple offender is defined as that youth who commits
several offenses whether or not he is caught as a first
offender arrestee or a repeater. A repeater, on the other
hand, is that youth who has more than one arrest.
Third, given the unknown number of offenses actually
committed by juveniles, the upper limit of offenses sus
ceptible to clearance (by the arrest of a juvenile) may be
far greater than the level of cases presently being cleared.
Fourth, the best avaiiable historical indicator of the
arrest of a multiple offender is the percentage of repeaters
that have been arrested. This percentage has remained
relatively stable for local juvenile residents during the
years 1960 through the early 1970's. A rise in the percent-
a'ge of repeaters being arrested would have implied either
an' improvement in investigative techniques or a shift in
the nature of the juvenile criminal element.
. The introduction of new .investigatory techniques should
result in an increase of repeater arrests and mUltiple of
fender arrests. The effect of this increase will be to
narrow the ratio between arrests and offenses cleared as
was hypothesized.
In order to test this hypothesis and its'component as
sumptions, several methods are used. Fig'ure 2 shows tne
~rrest and offense history from 1967 through 1975. From
1967 through 1972, the average difference between the number
38

h .> ,.
".' ,
8000
7500
7000
6500
6000
5500
5000
4500
4000
3500
3000
> • •• Arrests o - Clearances
'67
Arrest f 4520
CBA f 3579
Difference 941
Ratio 1.26
Figure 2
JUVENILE ARRESTS AND CLEARANCES 1967 - 1975
-0 .. __ --0., ... -.
'68 > '69 '70 '71 ' 72 '73
5416 6323 6907 7199 7002 ~49
4189 4970 5335 5682 5683 5431
• ~ •• -- .. -o
'74 ' 75
>5497 5721
5137 5159
1227 1353 1572 1517 1319 518 360 562
1.29 1.28 1.29 1.27 1.23 1.10 1.07 1.10
39

of juvenile arrests and offenses cleared was 1,321 or,
stated differently, there was an average of 1.27 arrests
to clear one offense. Beginning in 1973, after the incep
tion of JDEC, the difference between the number of juveniles
arrested and the number of offenses cleared narrowed signif-
icantly. The average difference since JDEC inception was
480 or 1.09 arrests for every clearance. This means that
fewer arrests are necessary to cl~ar an offense. This dif-
ference, although attributed to improved investigative
strategies, is difficult to prove based on available data.
It was assumed that changes would appear in the distribution
of first offenders and repeaters and in the proportion of
multiple offenders.
Table 15 and Figures 3 and 4 show a breakdown of the
relationship between local first offender and repeater ar-
rests from 1970 to 1975. When considering first offender
and repeater arrests as a proportion of arrest incidents
(Table 15 (1», it can be seen that repeaters account for
fewer arrests in 1975 than they did in 1970, although the
change is slight. When considering first offenders and re- i ' peaters as a proportion of individuals arrested (Table 15
(2», it is apparent that the relationship has remained
fairly constant through the entire period. Thus, little
change in the distribution of first offenders and. repeaters
can be seen since the inception of JDEC activities.
40
f

1)
First Offender
Repeater
2)
First Offender
,Repeater
Table 15
LOCAL FIRST OFFENDER AND REPEATER· Al~RESTS
% of Total Arrest Incidents
197.0 1971 1972 1973
31.75 ~.o.85 30.05 31.95
68.25 69.15 69.95 68.05
% of Individuals Arres~ed
197.0 . 1971 1972 1973
60.68 6.0.77 59.29 58.7.0
39.32 39.23 4.0.71 41.3.0
41
1974 1975
34.60 36.55
65.40 63.45
1974 1975
59.68 60.S0
40.32 39.50

~~\? ...... --------------------------------------------------------
:~
1400
1300
1200
1100
1000
900
800
Flguro 3
LOCAL REPEATER ARRESTS (INDIVIDUALS) 1960 - 1975
FREQU!::NCY DISTRIBUTION
Be PERCENT CHANGE
PERCENT OF TOTAL LOCAL INDIVIDUAL ARRESTS
16011S\ 162 163 11641: '65 i 166
""..,.. f IlOS 859 919 119\ .
% change -28.7 +6.9 +29.5·
Re~eaters S2.4°,," 41.4°A 41.4 'Yo 48.5°1c
~ocal .
indo arrests
Source: Juvenile DivisIon, NOPD P,epoled by: CJCC
i7l1 IOS7 1039
-18.1 +8.4 -1.7
40.2 oil 42.1 °Il 40.7%
42
1671 ;68 169 170 171 '72
1043 llro 1221 1315 1299 1288
+.3 .10.2 +8.1 +7.6 -\.2 -.8
39.lI% 41.5% 40.3% 39.3°1c 39.27'0 40.7 oil:
1
; ~
,I
~ Ii I
II
1 Ii I I: ,
II l. I
I ,
173 174 7$ I
l I
1188 -1162 ,;;a,fe t . -7.7 -2.1 +f# .. 7 • I
41.2% 40.3" 3'l,11 i ;

\ Figure 4
LOCAL FIRST OFFfrENDER ARRESTS (INDIVIDUALS) '1960 - 197 S !
2100
2000
1900
1800
1700
1600
1500
1400
1300
1200
1100
1b"00 I I
'60 '61 165 '66· '67 '68 169 I " , , 1 1
'62 '63 164 I' 1
'70 '7& . '72' '73
FREQUENCY. DISTRIBUTION . .. Sc PERCENT CHANGE
a PERCENT' OF TOTAL LOCAL INDIVIDUAL ARRE:STS .'
'160 lSI 162 163 ,
f 1093 1213 1298 1366
% change .11.0 .7.0 .. !!I.2
1st Offenders 'f7.!!1 °lc 58.l5% !!IUO"" 63.4°1c Local ind arrests
- "
Souree: Juvenile Division, NOPD . Prepared by: CJCC
164
1446
• !!I.e
!59.7 "
1651 166 167 '63 169 170 17& '72 '73
1448 ISII '!!IS6 1620 1806 2029 2013 1876 168t
".1 .4.3 .!5.6 .1.:5 .11.4 +12.3 -.7 -8.8 -9.9
!!I7.8°1c !!I9.2°1c 60.4"/c !!I8.4"/c !!I9.8"/c 60.6°-, 60.7"/. !59.2"/c 58:7°"
. '43
>.
-- -----
174 175 ,
174 '75
1720 11100
+I.e +10eS
!5£l.601c 6o.S1

'L
"" ,-... iii. ~ ".
~ . ,!,
'A secon'd method can be used to test the hypothesis
which does not make the assumption that a strong corre-
lation exists between. repeaters and multiple offenders.
This is accomplished by using the charge file or the number
of charges resulting from the arrest of juveniles (not
clearances). Table 16 displays the nu:mber of arrests, t.he
number of charges resulting from the arrests, and their
ratio. 'As can be seen from this summary data, fewer ar-
rests are being made, yet more charges are resulting from
the arrests. One explanation for this is that juvenile ar-
restees, whether first offenders or repeaters, are being
charged as multiple offenders. While the bulk of arrestees
are only charged with one offense, Table 17 shows the dis
tribution of charges for the arrestees. The distribution
has changed slightly during the period, indicating that
proportionately more juvenile arrestees are having more than
one charge filed against them.
Since the changes evidenced, except for the arrest/
offense ratio, are slight, it is suggested that the opera-
tions of JDEC have not reached the scope to dramatically
alter the historical pattern. It should be remembered that
JDEC operates with only four fUll-time field officers and
that these officers are concerned primarily with follow
up investigations. If the operations of JDEC officers
are viewed as separate from the Juvenile Division as a
whole, the following information results.
44
i I j
I 1

····T~,ble 16
CHARGES RESULTING FROM JUVENILE ARRES~S
Year
1970
1971
1972
1973
1974
1975
Number of Charges During Year
1 only
2 or more
3 or more 2
Range .
Charges Arrests
7,637 6,907
8,209 7,199
8,159 7,002
7,802 5,949
7,115 5,497
7,048 5,721
Table 17
DISTRIBUTION OF CHARGE FREQUENCIES BY PERCENTAGE
1972 1973
69.2 65.8
30.8 34.2
1-36 1-50
4S
Ratio
1:11
1:14
1:17
1:31
1:29
1:23
1974
64.6
34.4
1-33
1975
62.8
37.2
1"!!'35

..
During the 31 months of operation, JDEC officers ef
fected 903 juvenile arrest incidents and by these arrests
cleared 918 cases. Thus, JDEC not only narrowed the gap
between arrests and offenses, it reversed the relationship
in those instances where it had primary respons~bility.
By using the JDEC data, two elements of the juvenile crime
problem which can affect hypotheses and projections become
apparent. First is the instance of one youth committing
numerous offenses and second, groups of youth being ar
rested for one offense. 6 T~ble 18 illustrates the number
of arrests effected to clear offenses by type of offense in
these cases except where a one to one relationship was
noted. This display illustrates how the arrest/offense
ratio can be effected by the type of offense being cleared
and the effects of elements of one youth versus several
youths committing offenses. Extreme examples are the youth
whose arrest cleared 47 cases of issuing worthless checks
and 7 youth being arrested to clear one case of negligent
homiclde.
Other Activities
JDEC personnel have coordinated their activities with
both the Headquarters Division and the Research and
6This second element is generally associated with urban juvenile gangs. While the presence of gangs in New Orleans is not viewed as a serious problem, it is not uncommon for groups of youth ~I:o be involved in one offense.
46

Table 18
JDEC ARRESTS PER OFFENSES BY TYPE
Offe'nse Arrests
Simple Burglary " 312
-~' 'Aggravated Burglary 8
Armed Robbery 71
Atte:n,'lpted Armed Robbery 6
Simple Robbery 88
Theft 97
Aggravated Battery 25
Molesting Pedestrians 13 -
Loitering in an Alcoholic Beverage Outlet 3
Runaways 10 ,
Negligent Homicide 7
. Weapons 12 .
Possessing Marijuana 17
Auto Theft 26 -,
Posses$ing Stolen Property 4
"Loitering, Causing Alarm 19
Simple Battery 14 ..
Attempted Simple Arson 3
Worthless Checks 1
47
'"
Cases
364
7
60
4
82
77
20
6
1
9
1
11
14
19
3
13
12
1
47
J'.'" .... ,:;J ~.,
•

~.
Planning Division of the New Orleans Police Department and
in both cases followed up 1er.tds supplied to them. In con-
junction with Research and Planning, specific areas of the
city were forecasted as likely crime areas, and patrol activ-
ity by JDEC fluctuated among these areas. In addition, JDEC
personnel have been instrumental in establishing positive
relationships with ou~side agencies such as the School Board,
Juvenile Court, and youth-serving agencies. They have also
cooperated with other agencies of the city in attempting to
implement change in the juvenile justice system through
participation on advisory boards, workshops, and seminars.
Further, members have represented the city at the state
capitol during the legislative sessions.
One of the most extensive special projects implemented
by JDEC was "Operation Crime Prevention.- a~ck to School".
There was a belief by juvenile officers that a strong cor
relation existed between truancy and crime. Officers were
instructed to ascertain reasons for juveniles l~ing on the
streets during school hours and loitering in .thigh crime
areas. The juveniles' names and reasons for absenteeism
were transmitted to the Orleans Parish school system, the
District Attorney, and the Juvenile Court. In some cases,
parents were called directly to notify them of their child's
absenteeism. The juveniles were .!12! arrested unless they
were in the ~ct of committing an offense: and the agenci.es
notified were expected to take remedial action. In those,
48
1 t
I
\ I 1
I I

.. '
areas of the city where this experiment was carried out,
there was a short-term drop in the frequency of cr~e,
particularly burglary, in some cases up to a 30% reduction •
49

•
III
CONCLUSIONS
Federal Review
On March 19, 1975, the program was visited .~ the Law
Enforcement Assistance Administration, Dallas Regional Of-
fice monitor, for the purpose of preparing an on-site mon-
itoring repor,t. This report was completed on April 14, 1975,
and was subsequently forwarded to this office by the
Louisiana Commission on Law Enforcement during June, 1976.7
The monitoring report was very positive concerning
program operations, and it was recommended that, it be given
approval to extend its operations. The approval was sub-
sequent1y granted.
Evaluation Fo~low-Up
Three recommendations were made in the preliminary eva1-
uation of this project in December, 1974. The firstrecom-
mendation concerned the process by which warrants were
maintained at the Juvenile Division. It was suggested
that procedures be established with the Juvenile Court
which would enable JDEC to return unserviceable or recalled , '
warrants to the court. This procedure was instituted •
7U• S.Goyernment memorandum, Department of Justice, LEAA, April 14; 1975, "On-Site Monitoring Report, 72-DF-06-0042-TA-7, Juvenile Delinquency Enforcement Component," from R06 Juvenile Delinquency Specialist, Frank M. Porpotage.
50
I I f
I 1 I !

,...
•
A second recommendation concerned the relationship of
the Juvenile Division to youth-serving agencies in the
New Orleans area. The Juvenile Division Commander and of-
ficers of JDEC have been involved in numerous meetings with
youth-serving agency personnel and have made literature
available at the Juvenile Division concerning the availa-
bility of these services.
The final recommendation was directed more toward
police administrators rather than the Juvenile Division.
It was suggested that the preliminary report indicated a
need for additional full-time officers to be assigned to
the Juvenile Division. Because of manpower shortages within
the entire police department, this recommendation was not
accomplished.
Summary and Conclusions
Within two months of grant notification, JDEC was oper
ational. The administrative ability to quickly implement
the project was carried through the project life as a result
of proper grants management and fiscal responsibility. All
components of the project were implemented; and activities
were maintained at a high level, resulting in an integrated,
innovative enforcement system for juveniles. Through the
proper allocation of overtime funds, the manpower comple
ment of the division was increased so that better coverage
by officers would result in more positive investigative
51

•
attempts. The construction of appropriate data and photo-
graphic files has demonstrated its usefulness as an inves
tigative aid. positive relationships developed with other
divisions and outside agencies have increased the city's
ability to react to the juvenile crime problem because of
the atmosphere of cooperativeness.
The primary goal of JDEC has been accomplished during
the 31 months of operation by following the objectives con
tained in the grant application. The primary goal of JDEC
was "the creation of an enforcement system for juveniles"
emphasizing "intensive research and investigation for all
crimes believed to be committed by juveniles: the construc
tion of appropriate data files: and the improvement in the
transfer of information between the Juvenile Court system
and the Juvenile Division." All of the following objec
tives or methods were used to accomplish this goal.
(1) The creation and maintenance of both picture
and slide files of previously arrested juve
niles for the purpose of facilitating the
identification of suspected juvenile offenders.
(2) The creation and maintenance of geographically
based offender files for the purpose of
speeding the investigatory process. These
files will be created through the cooperation
of the Data processing Department of the
New Orleans Police Department.
52
l'l i I i I· !
11 1 ; I'
I r
1
I J
I I I

-
';p.
., •
(3) The practice of follow-up investigation (by
members of the division, rather than district
personnel) as a means of increasing arrest/
crime ratios. Intense investigations will
focus upon designated target areas.
(4) The increased interaction with Police Planners
and CJCC personnel for the purpose of defining
new approaches to investigative and adminis-
trative procedures to be used with juvenile
offenders.
The secondary and tertiary goals of the project were
directed toward the overtime reduction of juvenile crime in
New Orleans. It has be,en shown in Section II that both the
number of arrests for juvenile offenders and the number of
offenses cleared by the arrest of a juven;~lE" have been less
since the inception of JDEC. Further, those of:fenses re
quiring intensive follow-up investigation (and 'those tar-
geted by JDEC) such as robbery and burglary experienced
increases in the short~run and during thE~ la.st year of JDEC
operations experienced decreases. The more subtle aspects
of the juvenile crime problem, i.e., repeaters and multiple
offenders, have been more difficult to analyze:, therefore
making conclusions based on their analyses inc::onclusive •
It appears that JDEC has not eliminated juvenile crime in
New Orleans, but has instituted procedures which, in some
53

..
cases, have resulted in decreases and in others, held the
line on juvenile crime. The procedures and policies of
JDEC appear to be leading toward improved methods which
could be instituted in the Juvenile Division as a whole •
54

~ .. !.
• ,
... f
,I