phenomena importance ranking table for a - …roadsafellc.com/nchrp22-24/qpr/attachmentk-10.pdf ·...
TRANSCRIPT

PHENOMENA IMPORTANCE RANKING TABLE FOR A
__ Modified G4(1S) Strong
Developer: Worcester Polytechnic Institute
Worcester, MA
Model Date: January 2002
Report Date: July 31, 2009
Barrier: The modified G4(1S)
beam rails supported by W150x13.5 steel posts
(i.e., the type of blockout used in the G4(2W)
Figure 1. The posts are spaced at
spliced together using
the rails are connected to the posts and
post location.
Figure 1: Modified G4(1S) guardrail with routed wood blockouts
Model: The guardrail model is shown in Figure
guardrail system with
W150x13.5 steel posts spaced at 1.905 m, and
blockouts. The up-stream end included the MELT guardrail terminal (validated in
PHENOMENA IMPORTANCE RANKING TABLE FOR A
Strong-Post Guardrail System w/Wood Blockouts __
Worcester Polytechnic Institute
G4(1S) guardrail with wood blockouts is composed of 12
beam rails supported by W150x13.5 steel posts with150x200 mm wood blockouts
, the type of blockout used in the G4(2W) guardrail system), as shown in
The posts are spaced at 1.905 m center-to-center. The w-beam
spliced together using eight 16-mm diameter bolts at each splice connection, and
are connected to the posts and blockouts using a single ___ bolt at each
Figure 1: Modified G4(1S) guardrail with routed wood blockouts
The guardrail model is shown in Figure 2. The model consists of 34.6 m o
guardrail system with thirteen 3.81-m sections of w-beam rail, twenty-six
W150x13.5 steel posts spaced at 1.905 m, and twenty-six 150 x 200-mm wood
stream end included the MELT guardrail terminal (validated in
__
is composed of 12-gauge w-
with150x200 mm wood blockouts
guardrail system), as shown in
beam rails are
at each splice connection, and
bolt at each
. The model consists of 34.6 m of the
six
mm wood
stream end included the MELT guardrail terminal (validated in

a previous study). The downstream anchor was modeled using nonlinear springs
representative of a MELT guardrail terminal.
Figure 2:
This form is used to construct a phenomena importance ranking table (PIRT) for either a vehicle
model or roadside hardware model. Text in a blue italic font indicates the user should enter
information for the particular test. The developer should perform the following steps to develop
the PIRT.
1. List all comparisons to physical experiments that were performed during the development
of the model in Table A-1. These may include laboratory tests of materials, dynamic or
static tests of components, full-model tests of suspension systems and any other type of
comparison between a physical test and the computational model.
2. For each comparison between an experiment and calculation, complete Table A-2, the
“Comparison Metric Evaluation Table. There should be one “Comparison Metric

Evaluation Table” for each comparison listed in Table A-1. Attach graphs of the
comparisons to the table.
3. Take the “phenomenon description” from the bottom of each “Comparison Metric
Evaluation Table” and enter it in the PIRT (i.e., Table A-3). If all the comparison metrics
are acceptable for that phenomenon, enter “Yes” in the right hand column of the PIRT.
If one or more metrics are unacceptable enter “no” in the right hand column.

Table A-1. List of Experiments to be used in the PIRT Development
1. Three-Point Bend Test of W150x13.5 Post About Weak Axis
2. Load-to-rupture of splice connection under quasi-static axial loading
3. Pull-through of post-bolt-head connection to w-beam using axial load machine
4. Full-scale bogie impact tests of the W150x13.5post embedded in soil (soil density = 1,980 kg/m3)
5. Full-scale bogie impact tests of the W150x13.5post embedded in soil (soil density = 1,980 kg/m3)
6. Full-scale bogie impact tests of the W150x13.5post embedded in soil (soil density = 1,980 kg/m3)
7.
8.
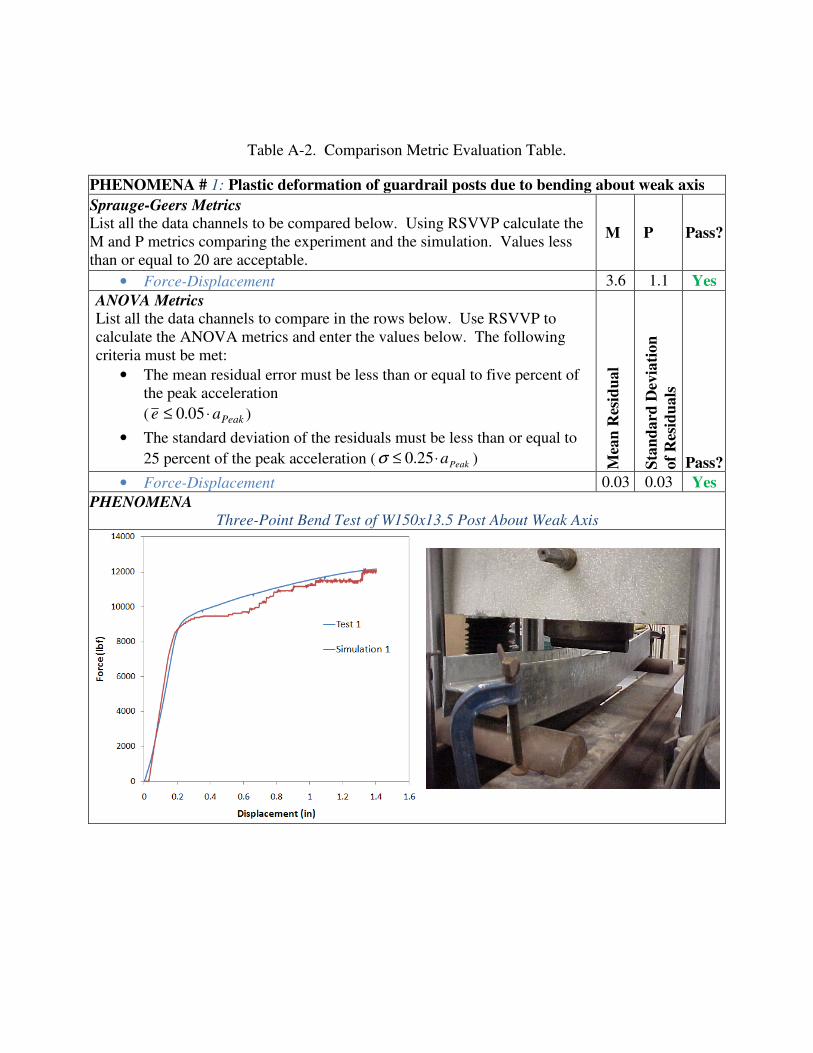
Table A-2. Comparison Metric Evaluation Table.
PHENOMENA # 1: Plastic deformation of guardrail posts due to bending about weak axis
Sprauge-Geers Metrics
List all the data channels to be compared below. Using RSVVP calculate the
M and P metrics comparing the experiment and the simulation. Values less
than or equal to 20 are acceptable.
M P Pass?
• Force-Displacement 3.6 1.1 Yes
ANOVA Metrics
List all the data channels to compare in the rows below. Use RSVVP to
calculate the ANOVA metrics and enter the values below. The following
criteria must be met:
• The mean residual error must be less than or equal to five percent of
the peak acceleration
( Peakae ⋅≤ 05.0 )
• The standard deviation of the residuals must be less than or equal to
25 percent of the peak acceleration ( Peaka⋅≤ 25.0σ )
M
ean
Res
idu
al
S
tan
dard
Dev
iati
on
of
Res
idu
als
Pass?
• Force-Displacement 0.03 0.03 Yes
PHENOMENA
Three-Point Bend Test of W150x13.5 Post About Weak Axis
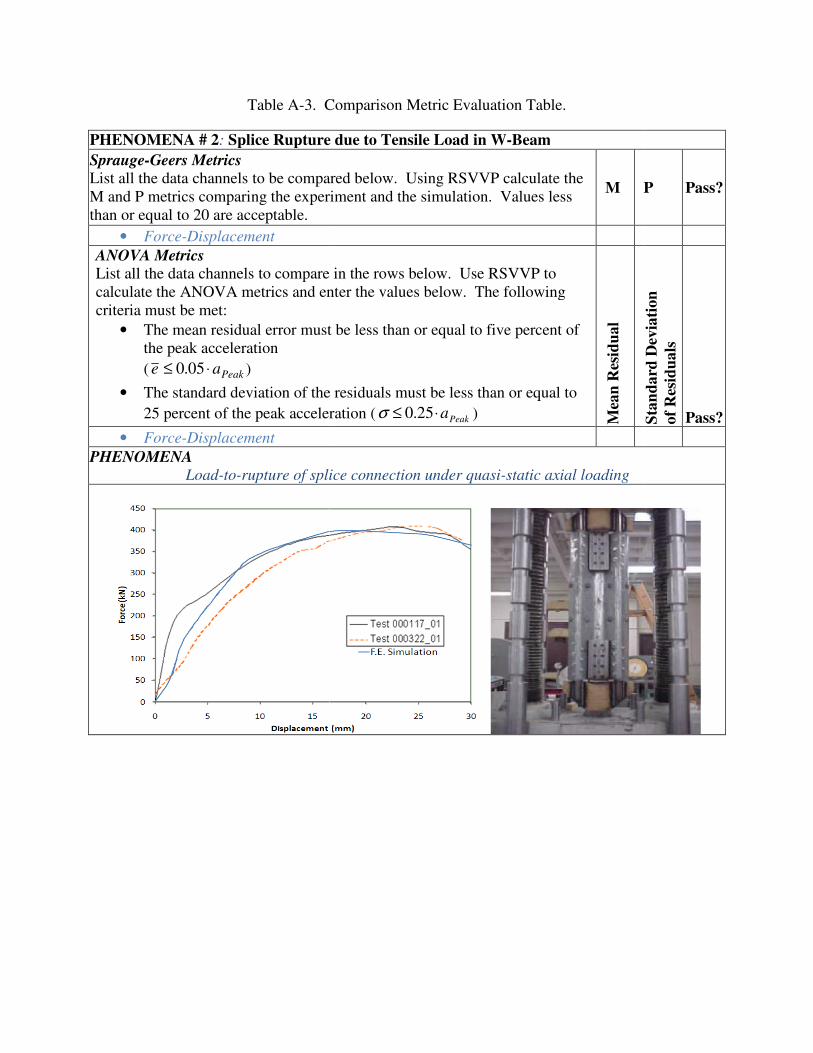
Table A-3. Comparison Metric Evaluation Table.
PHENOMENA # 2: Splice Rupture due to Tensile Load in W
Sprauge-Geers Metrics
List all the data channels to be compared below. Using RSVVP calculate t
M and P metrics comparing the experiment and the simulation. V
than or equal to 20 are acceptable.
• Force-Displacement
ANOVA Metrics
List all the data channels to compare in the rows below. Use RSVVP to
calculate the ANOVA metrics and enter the values below. The following
criteria must be met:
• The mean residual error must be less than
the peak acceleration
( Peakae ⋅≤ 05.0 )
• The standard deviation of the residuals must be less than
25 percent of the peak acceleration (
• Force-Displacement
PHENOMENA
Load-to-rupture of splice connection
. Comparison Metric Evaluation Table.
Splice Rupture due to Tensile Load in W-Beam
List all the data channels to be compared below. Using RSVVP calculate the
comparing the experiment and the simulation. Values less M
channels to compare in the rows below. Use RSVVP to
calculate the ANOVA metrics and enter the values below. The following
The mean residual error must be less than or equal to five percent of
The standard deviation of the residuals must be less than or equal to
percent of the peak acceleration ( Peaka⋅≤ 25.0σ )
M
ean
Res
idu
al
S
tan
dard
Dev
iati
on
rupture of splice connection under quasi-static axial loading
P Pass?
S
tan
dard
Dev
iati
on
of
Res
idu
als
Pass?
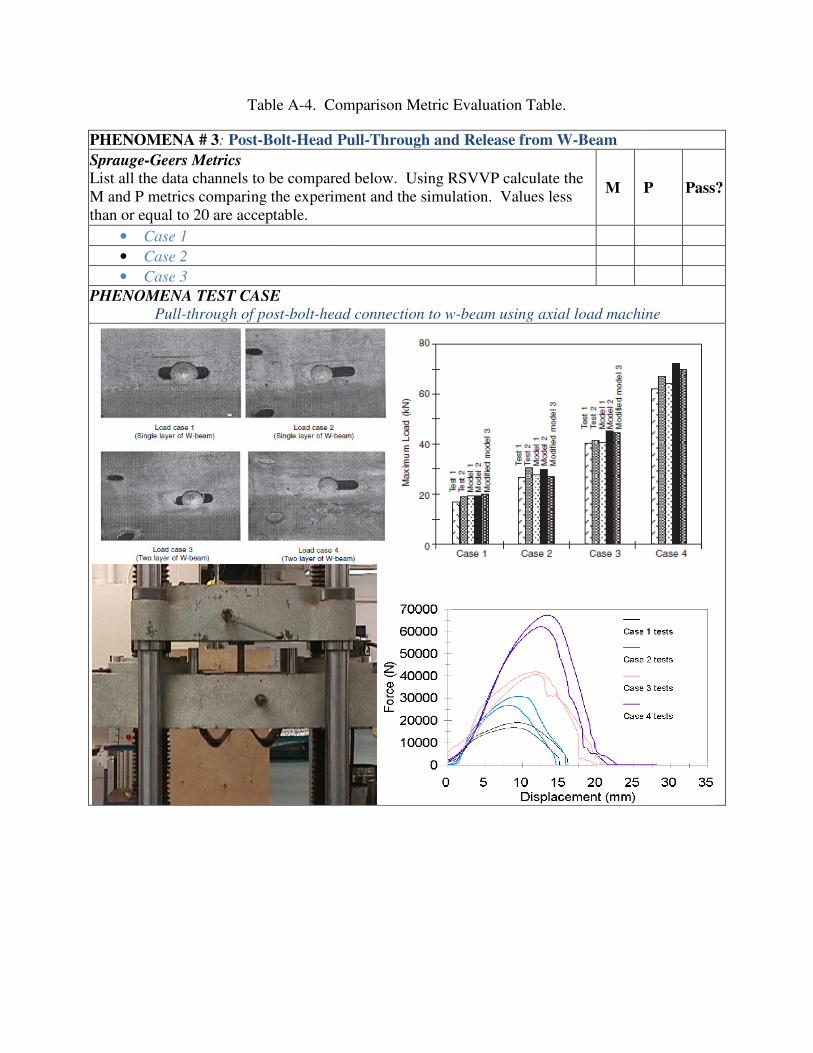
Table A-4. Comparison Metric Evaluation Table.
PHENOMENA # 3: Post-Bolt-Head Pull
Sprauge-Geers Metrics
List all the data channels to be compared below. Using RSVVP calculate t
M and P metrics comparing the experiment and the simulation. V
than or equal to 20 are acceptable.
• Case 1
• Case 2
• Case 3
PHENOMENA TEST CASE
Pull-through of post-bolt-head
. Comparison Metric Evaluation Table.
Head Pull-Through and Release from W-Beam
compared below. Using RSVVP calculate the
comparing the experiment and the simulation. Values less M
head connection to w-beam using axial load machine
P Pass?
using axial load machine
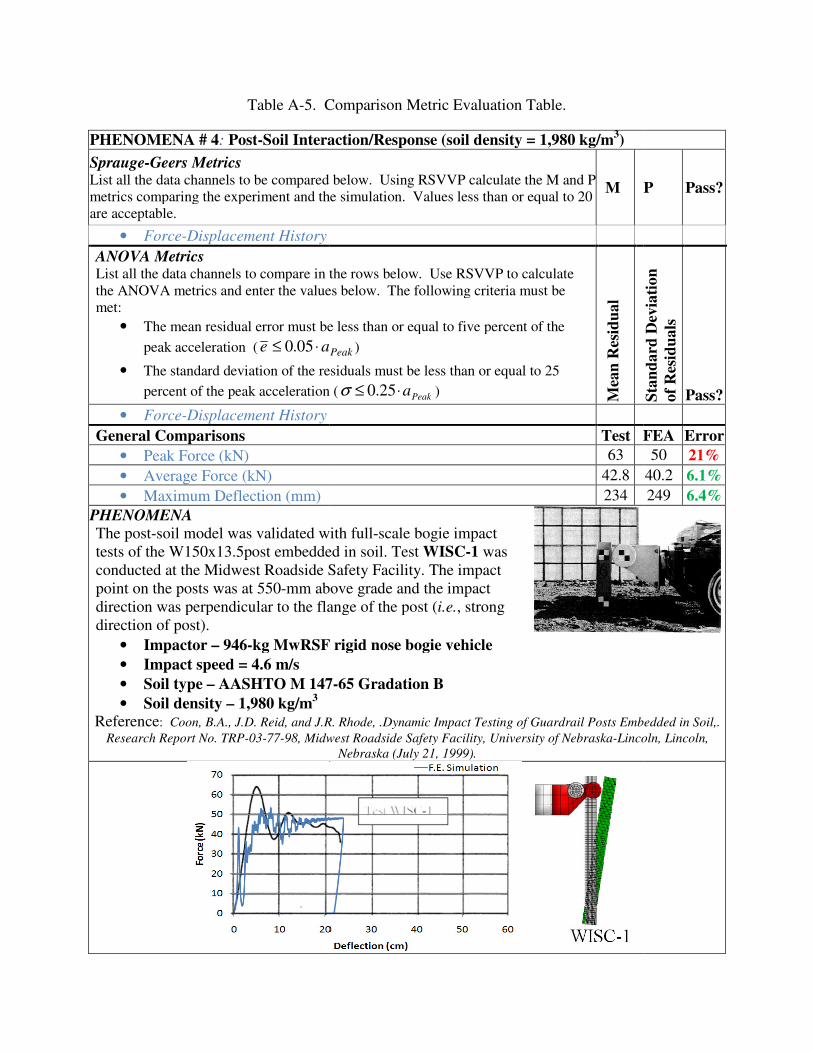
Table A-5. Comparison Metric Evaluation Table.
PHENOMENA # 4: Post-Soil Interaction/Response
Sprauge-Geers Metrics List all the data channels to be compared below.
metrics comparing the experiment and the simulation. Values less than or equal to 20
are acceptable.
• Force-Displacement History
ANOVA Metrics List all the data channels to compare in the rows below.
the ANOVA metrics and enter the values below. The following criteria must be
met:
• The mean residual error must be less than or equal to five percent of the
peak acceleration ( ae ⋅≤ 05.0
• The standard deviation of the residuals must be less than or equal to 25
percent of the peak acceleration (
• Force-Displacement History
General Comparisons
• Peak Force (kN)
• Average Force (kN)
• Maximum Deflection (mm)
PHENOMENA
The post-soil model was validated with full
tests of the W150x13.5post embedded in soil
conducted at the Midwest Roadside Safety
point on the posts was at 550-mm above grade and the impact
direction was perpendicular to the flange of the post (
direction of post).
• Impactor – 946-kg MwRSF rigid nose bogie vehicle
• Impact speed = 4.6 m/s
• Soil type – AASHTO M 147
• Soil density – 1,980 kg/m3
Reference: Coon, B.A., J.D. Reid, and J.R. Rhode, .Dynamic Impact Testing of Guardrail Posts Embedded in Soil,.
Research Report No. TRP-03-77-98, Midwest Roadside Safety Facility, Univers
5. Comparison Metric Evaluation Table.
Soil Interaction/Response (soil density = 1,980 kg/m3)
List all the data channels to be compared below. Using RSVVP calculate the M and P
metrics comparing the experiment and the simulation. Values less than or equal to 20 M
List all the data channels to compare in the rows below. Use RSVVP to calculate
the ANOVA metrics and enter the values below. The following criteria must be
The mean residual error must be less than or equal to five percent of the
Peak )
residuals must be less than or equal to 25
percent of the peak acceleration ( Peaka⋅≤ 25.0σ )
M
ean
Res
idu
al
S
tan
dard
Dev
iati
on
Test FEA
63
42.8
234
soil model was validated with full-scale bogie impact
tests of the W150x13.5post embedded in soil. Test WISC-1 was
conducted at the Midwest Roadside Safety Facility. The impact
mm above grade and the impact
direction was perpendicular to the flange of the post (i.e., strong
kg MwRSF rigid nose bogie vehicle
AASHTO M 147-65 Gradation B
Coon, B.A., J.D. Reid, and J.R. Rhode, .Dynamic Impact Testing of Guardrail Posts Embedded in Soil,.
Midwest Roadside Safety Facility, University of Nebraska-Lincoln, Lincoln,
Nebraska (July 21, 1999).
P Pass?
S
tan
dard
Dev
iati
on
of
Res
idu
als
Pass?
FEA Error
50 21%
40.2 6.1%
249 6.4%
Coon, B.A., J.D. Reid, and J.R. Rhode, .Dynamic Impact Testing of Guardrail Posts Embedded in Soil,.
Lincoln, Lincoln,

Table A-6. Comparison Metric Evaluation Table.
PHENOMENA # 5: Post-Soil Interaction/Response
Sprauge-Geers Metrics List all the data channels to be compared
metrics comparing the experiment and the simulation. Values less than or equal to 20
are acceptable.
• Acceration-Time History
ANOVA Metrics List all the data channels to compare in the rows
the ANOVA metrics and enter the values below. The following criteria must be
met:
• The mean residual error must be less than or equal to five percent of the
peak acceleration ( ae ⋅≤ 05.0
• The standard deviation of the residuals must be less than or equal to 25
percent of the peak acceleration (
• Force-Displacement History
General Comparisons
• Peak Force (kN)
• Average Force (kN)
• Maximum Deflection (mm)
PHENOMENA
The post-soil model was validated with full
tests of the W150x13.5post embedded in soil
conducted at the Midwest Roadside Safety
point on the posts was at 550-mm above grade and the impact
direction was perpendicular to the flange of the post (
direction of post).
• Impactor – 946-kg MwRSF rigid nose bogie vehicle
• Impact speed = 5.4 m/s
• Soil type – AASHTO M 147
• Soil density – 2,110 kg/m3
Reference: Coon, B.A., J.D. Reid, and J.R. Rhode, .Dynamic Impact Testing of Guardrail Posts Embedded in Soil,.
Research Report No. TRP-03-77-98, Midwest Roadside Safety Facility, University of
6. Comparison Metric Evaluation Table.
Soil Interaction/Response (soil density = 2,110 kg/m3)
List all the data channels to be compared below. Using RSVVP calculate the M and P
metrics comparing the experiment and the simulation. Values less than or equal to 20 M
List all the data channels to compare in the rows below. Use RSVVP to calculate
the ANOVA metrics and enter the values below. The following criteria must be
The mean residual error must be less than or equal to five percent of the
Peak )
of the residuals must be less than or equal to 25
percent of the peak acceleration ( Peaka⋅≤ 25.0σ )
M
ean
Res
idu
al
S
tan
dard
Dev
iati
on
Test FEA
66
43.9
314
soil model was validated with full-scale bogie impact
tests of the W150x13.5post embedded in soil. Test WISC-3 was
conducted at the Midwest Roadside Safety Facility. The impact
mm above grade and the impact
direction was perpendicular to the flange of the post (i.e., strong
kg MwRSF rigid nose bogie vehicle
ASHTO M 147-65 Gradation B
Coon, B.A., J.D. Reid, and J.R. Rhode, .Dynamic Impact Testing of Guardrail Posts Embedded in Soil,.
Midwest Roadside Safety Facility, University of Nebraska-Lincoln, Lincoln,
Nebraska (July 21, 1999).
P Pass?
S
tan
dard
Dev
iati
on
of
Res
idu
als
Pass?
FEA Error
50 24%
45.1 2.7%
306 2.5%
Coon, B.A., J.D. Reid, and J.R. Rhode, .Dynamic Impact Testing of Guardrail Posts Embedded in Soil,.
Lincoln, Lincoln,
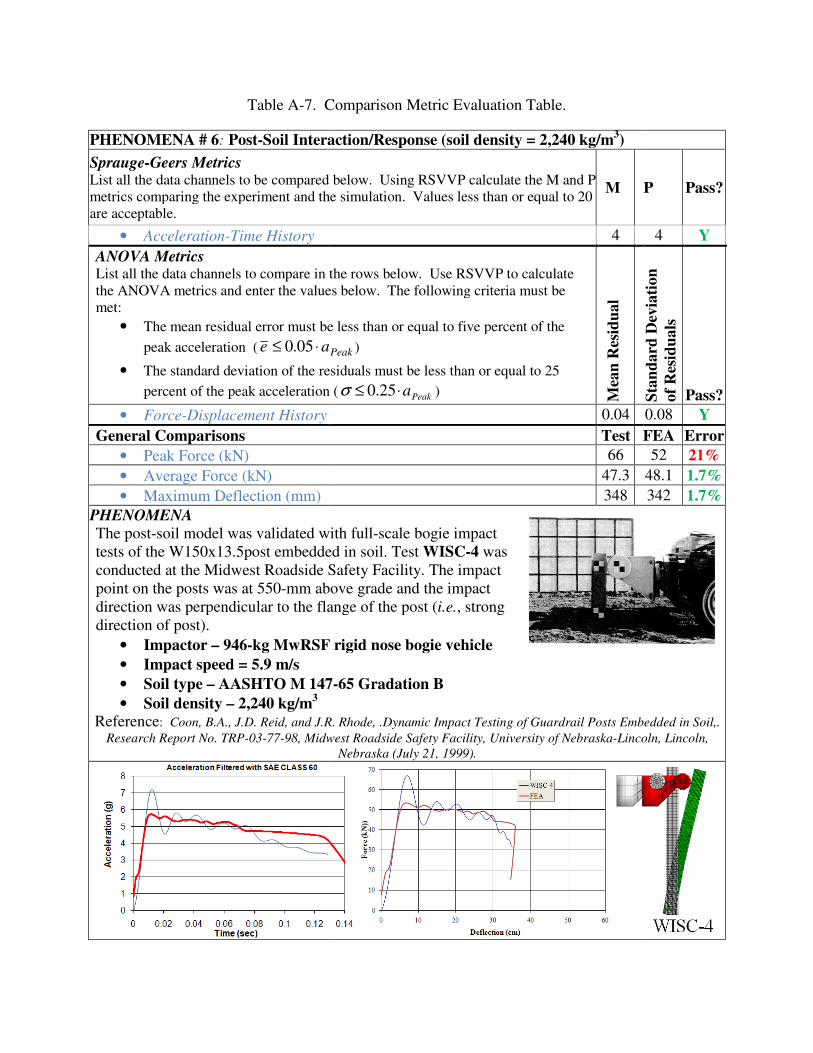
Table A-7. Comparison Metric Evaluation Table.
PHENOMENA # 6: Post-Soil Interaction/Response
Sprauge-Geers Metrics List all the data channels to be compared below.
metrics comparing the experiment and the simulation. Values less than or equal to 20
are acceptable.
• Acceleration-Time History
ANOVA Metrics List all the data channels to compare in the rows below.
the ANOVA metrics and enter the values below. The following criteria must be
met:
• The mean residual error must be less than or equal to five percent of the
peak acceleration ( ae ⋅≤ 05.0
• The standard deviation of the residuals must be less than or equal to 25
percent of the peak acceleration (
• Force-Displacement History
General Comparisons
• Peak Force (kN)
• Average Force (kN)
• Maximum Deflection (mm)
PHENOMENA
The post-soil model was validated with full
tests of the W150x13.5post embedded in soil
conducted at the Midwest Roadside Safety Facility. The impact
point on the posts was at 550-mm above grade and the impact
direction was perpendicular to the flange of the post (
direction of post).
• Impactor – 946-kg MwRSF rigid nose bogie ve
• Impact speed = 5.9 m/s
• Soil type – AASHTO M 147
• Soil density – 2,240 kg/m3
Reference: Coon, B.A., J.D. Reid, and J.R. Rhode, .Dynamic Impact Testing of Guardrail Posts Embedded in Soil,.
Research Report No. TRP-03-77-98, Midwest
7. Comparison Metric Evaluation Table.
Soil Interaction/Response (soil density = 2,240 kg/m3)
List all the data channels to be compared below. Using RSVVP calculate the M and P
metrics comparing the experiment and the simulation. Values less than or equal to 20 M
4
List all the data channels to compare in the rows below. Use RSVVP to calculate
the ANOVA metrics and enter the values below. The following criteria must be
The mean residual error must be less than or equal to five percent of the
Peak )
residuals must be less than or equal to 25
percent of the peak acceleration ( Peaka⋅≤ 25.0σ )
M
ean
Res
idu
al
S
tan
dard
Dev
iati
on
0.04
Test FEA
66
47.3
348
soil model was validated with full-scale bogie impact
tests of the W150x13.5post embedded in soil. Test WISC-4 was
conducted at the Midwest Roadside Safety Facility. The impact
mm above grade and the impact
direction was perpendicular to the flange of the post (i.e., strong
kg MwRSF rigid nose bogie vehicle
AASHTO M 147-65 Gradation B
Coon, B.A., J.D. Reid, and J.R. Rhode, .Dynamic Impact Testing of Guardrail Posts Embedded in Soil,.
Midwest Roadside Safety Facility, University of Nebraska-Lincoln, Lincoln,
Nebraska (July 21, 1999).
P Pass?
4 Y
S
tan
dard
Dev
iati
on
of
Res
idu
als
Pass?
0.08 Y
FEA Error
52 21%
48.1 1.7%
342 1.7%
Coon, B.A., J.D. Reid, and J.R. Rhode, .Dynamic Impact Testing of Guardrail Posts Embedded in Soil,.
Lincoln, Lincoln,
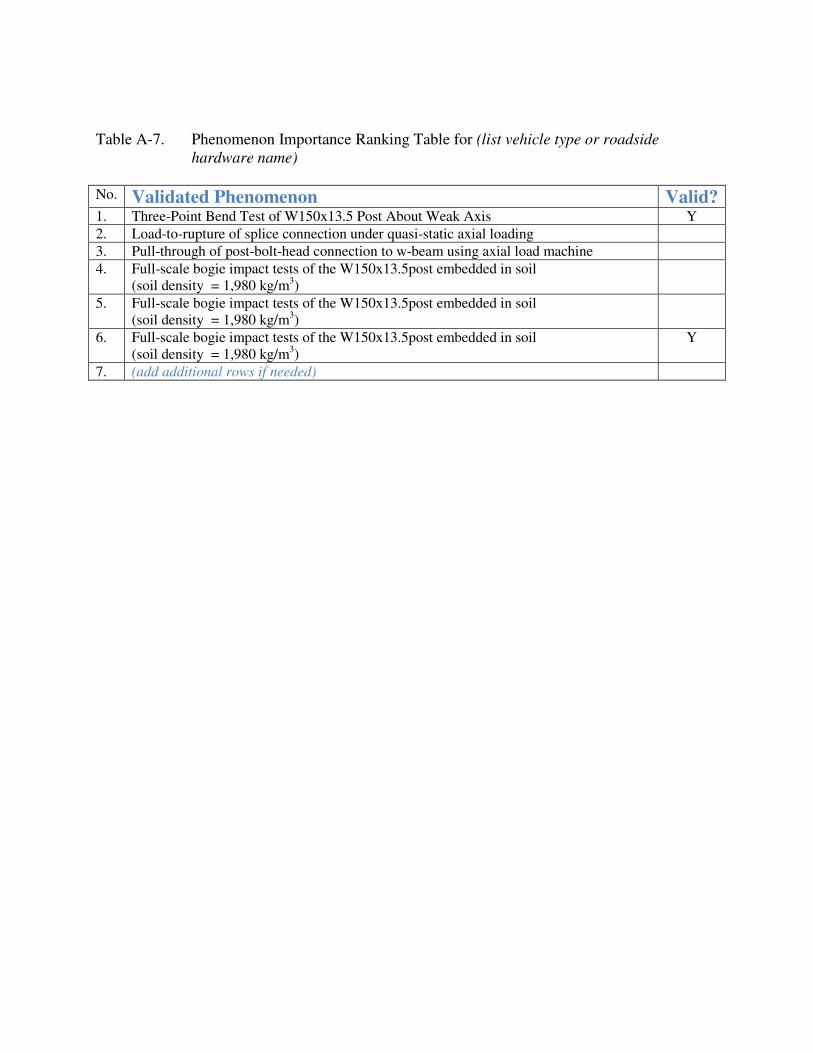
Table A-7. Phenomenon Importance Ranking Table for (list vehicle type or roadside
hardware name)
No. Validated Phenomenon Valid? 1. Three-Point Bend Test of W150x13.5 Post About Weak Axis Y
2. Load-to-rupture of splice connection under quasi-static axial loading
3. Pull-through of post-bolt-head connection to w-beam using axial load machine
4. Full-scale bogie impact tests of the W150x13.5post embedded in soil
(soil density = 1,980 kg/m3)
5. Full-scale bogie impact tests of the W150x13.5post embedded in soil
(soil density = 1,980 kg/m3)
6. Full-scale bogie impact tests of the W150x13.5post embedded in soil
(soil density = 1,980 kg/m3)
Y
7. (add additional rows if needed)