phd thesis biomolecular ions in accelerators and storage rings · • chapter 1 general...
TRANSCRIPT

PhD Thesis
Biomolecular Ions in Accelerators and Storage Rings
Bo Liu Department of physics and Astronomy
University of Aarhus 2004
Contents Preface List of Publication 1 Introduction 1.1 Building biomolecules 1.2 Soft ionization techniques 1.3 Study of biomolecules in the gas phase 2 Experimental details 2.1 Accelerator mass spectrometer 2.2 ELISA 2.3 Sample preparation 3 Biomolecular ions in an accelerator mass spectrometer 3.1 Cross section for formation of fragment ions after collision 3.2 Multiply-charged oligonucleotide anions in collisions with noble gas atoms 3.3 Electron attachment to nucleotide monoanions in collisions with Na: Formation of dianions 3.4 Electron capture to peptide cations 4 Biomolecular ions in ELISA 4.1 Decay of isolated biomolecular ions 4.2 Power law decay of collisionally excited amino acids and oligonucleotides and radiative cooling 4.3 Photodissociation of protonated nucleotides and peptides 4.4 Lifetime measurement of radical ions 5 Summary and outlook 6 Appendix 7 Reference
i
ii
15
9
101216
17
19
2737
50
57
6678
81
83
91

i
Preface The physics and chemistry of biomolecules in vacuo is a field that has attracted considerable interest in recent years. Investigations involve both gas-phase experiments and calculations in order to elucidate the intrinsic properties of biomolecules under well-defined conditions and at the single-molecule level. It is possible to vary the environment in a controlled manner, from a molecule isolated in vacuo to a gradual build-up of a solvation shell around the molecule, and this may lead to a better understanding of solvent effects and of the importance of the natural biological environment. This thesis describes the studies on biomolecular ions in the gas phase in our lab by two apparatus: accelerator mass spectrometer and electrostatic storage ring. High-energy collision-induced-dissociation technique is used in the experiments of accelerator mass spectrometer and electrostatic storage ring is used for measuring decay lifetimes of stored ions after excitation. The thesis is organized as follows:
• Chapter 1 General introduction to biomolecules and soft ionization techniques related to my PhD works.
• Chapter 2 This chapter deals with the experimental equipments and techniques which are applied in the thesis. Especially the electrospray ion source is described and the accelerator mass spectrometer and the storage ring are presented.
• Chapter 3 This chapter deals with the experiments done by the accelerator mass spectrometer. Especially the results from the collisional experiments between biomolecular ions and noble gas/sodium gas are presented. Ion radicals can be generated by high-energy collisions
• Chapter 4 This chapter is devoted to the experiments done by the storage ring. Especially the different decay laws are observed. Arrhenius parameters can be obtained by photodissociation experiments. Lifetime of ion radicals produced by high-energy collisions can be measured.
• Chapter 5 This is the summary of the whole thesis and the future plans are presented.

ii
List of publications 1. Hvelplund P, Liu B, Nielsen SB, Tomita S, Electron capture induced dissociation of peptide dications, Int J. Mass Spectrom. 225, 83, 2003. 2. Hvelplund P, Liu B, Nielsen SB, Tomita S, Electron capture and loss by protonated peptides and proteins in collisions with C60 and Na, Eur. Phys. J. D 22, 75, 2003. 3. Nielsen SB, Andersen JU, Forster JS, Hvelplund P, Liu B, Pedersen UV, Tomita S, Photodestruction of adenosine 5 '-monophosphate (AMP) nucleotide ions in vacuo: Statistical versus nonstatistical processes, Phys. Rev. Lett. 91, 048302, 2003. 4. Andersen JU, Bonderup E, Hansen K, Hvelplund P, Liu B, Pedersen UV, Tomita S, Temperature concepts for small, isolated systems; 1/t decay and radiative cooling, Eur. Phys. J. D 24, 191, 2003. 5. Nielsen AB, Hvelplund P, Liu B, Nielsen SB, Tomita S, Coulomb explosion upon electron attachment to a four-coordinate monoanionic metal complex, J. Am. Chem. Soc. 125, 9592, 2003. 6. Andersen JU, Cederquist H, Forster JS, Huber BA, Hvelplund P, Jensen J, Liu B, Manil B, Maunoury L, Nielsen SB, Pedersen UV, Schmidt HT, Tomita S, Zettergren H, Power-law decay of collisionally excited amino acids and quenching by radiative cooling, Eur. Phys. J. D 25, 139, 2003. 7. Liu B, Hvelplund P, Nielsen SB, Tomita S, Electron loss and dissociation in high energy collisions between multiply charged oligonucleotide anions and noble gases, Int. J. Mass Spectrom. 230, 19, 2003. 8. Liu B, Tomita S, Rangama J, Hvelplund P, Nielsen SB, Electron attachment to "naked" and microsolvated nucleotide anions: Detection of long-lived dianions, ChemPhysChem 4, 1341, 2003. 9. Liu B, Hvelplund P, Nielsen SB and Tomita S., Formation of C60
2- dianions in collisions between C60
- and Na atoms, Phys. Rev. Lett. 92, 168301, 2004. 10. Nielsen SB, Andersen JU, Hvelplund P, Liu B and Tomita S, Biomolecular ions in accelerators and storage rings, J. Phys. B. 37, R25, 2004. 11. Andersen JU, Cederquist H, Forster JS, Huber BA, Hvelplund P, Jensen J, Liu B, Manil B, Maunoury L, Nielsen SB, Pedersen UV, Rangama J, Schmidt HT, Tomita S and Zettergren H, Photodissociation of protonated amino acids and peptides in an ion storage ring. Determination of Arrhenius parameters in the high-temperature limit, Phys.Chem.Chem.Phys 6, 2676, 2004.

iii
12. Liu B, Hvelplund P, Nielsen SB and Tomita S, Modification of Isolated DNA and RNA Nucleotides upon Electron Attachment: Hydrogen Loss from Nucleobase Nitrogens, J. Chem. Phys. 121, 1st Sep. 2004. 13. Tomita S, Andersen JU, Echt O, Hansen K, Hvelplund P, Liu B, Nielsen SB, and Rangama J, Jahn-Teller splitting of the t1u and t1g orbitals in isolated C60
− from near-infrared spectroscopy, J. Am. Chem. Soc. submitted. 14. Boltalina OV, Ioffe IN, Streletskii AV, Hvelplund P, Liu B, Nielsen SB, Tomita S, Formation of C60Fn Di-and Trianions in Collisions between fluorinated C60 and Na, Angew. Chem. Int. ed. submitted. 15. Tomita S, Andersen JU, Cederquist H, Concina B, Huber BA, Hvelplund P, Jensen J, Liu B, Manil B, Maunoury L, Nielsen SB, Rangama J, Schmidt HT, and Zettergren H, Lifetimes of free C60
2- in a storage ring; observation of three electronic states (in preparation). 16. Liu B, Hvelplund P, Nielsen SB and Tomita S, Photodissociation of singly charged oligonucleotide cations (in preparation). 17. Liu B, Hvelplund P, Nielsen SB and Tomita S, Electron capture to microsolvated AMP monoanions: Fragmentation and capture cross sections (in preparation).

Introduction _____________________________________________________________
1
Chapter 1 Introduction 1.1 Building biomolecules Even though there are thousands of different molecules in a cell, there are only a few basic classes of biomolecules. The four major classes are fatty acids, monosaccharides, amino acids and nucleotides. These building blocks are used to build more complex and functional biomolecules, such as proteins and nucleic acids. Nucleotides A nucleotide has three components: 1. a heterocyclic molecule, 2. a 5-carbon, or pentose, sugar and 3. one or more phosphate groups. The ring-shaped molecule contains a nitrogenous base. These bases are classified as purines (two ring-shaped molecules joined together, one with six and one with five atoms) and pyrimidines (a single ring made from six atoms). There are five different bases: adenine (A), guanine (G), cytosine (C), thymine (T) and uracil (U) The first two are the larger purines while the other three are the smaller pyrimidines (fig.1.1).
The sugar in a nucleotide has two variants, one is called ribose and the other is called deoxyribose. Ribose is a "normal" sugar, with one oxygen atom attached to each carbon atom while deoxyribose is a modified sugar, lacking one oxygen atom (so the name "deoxy"). Fig. 1.2 shows the difference between ribose and deoxyribose where in ribose 2’ carbon is attached to OH group while in deoxyribose only hydrogen is attached to
Fig.1.1 Nucleobases in (a) DNA and (b) RNA.
N
N
N
N
NH2
H
N
N
N
N
O
NH2
H
N
NH
O
O
CH3N
NH
O
NH2
Adenine (A)
Guanine (G)
Thymine (T)
Cytosine (C)
N
N
N
N
NH2
H
N
N
N
N
O
NH2
H
N
NH
O
NH2
N
NH
OH
O
Adenine (A)
Guanine (G)
Cytosine (C)
Uracil (U)
(a) (b)

Building biomolecules _____________________________________________________________
2
2’ carbon. A sugar and a nucleobase can be combined by a glycosidic linkage to form a nucleoside (fig.1.3). The molecule shown in fig.1.3 is called adenosine. When a nucleoside joins together with a phosphate group by a phosphodiester bond, a nucleotide is formed (fig.1.4). The molecule shown in fig.1.4 is called Adenosine MonoPhosphate (AMP).
Amino acids An amino acid has three other groups attached to the α-carbon in addition to one hydrogen: 1. an amino group (NH2), 2. a carboxyl group (COOH) and 3. a characteristic side chain denoted as the R group. Because of this center carbon, amino acids have two isomers due to the different steric structures, L-amino acids and D-amino acids, analogous to left-handed and right-handed conformations. There are 20 common amino acids in a human body and they differ only in the side chain group.
O OH
OHOH
CH2
OH
O OH
HOH
CH2
OH
ribose deoxyribose
Fig.1.2 Ribose and deoxyribose.
O
OHOH
CH2
OH
N
N
N
N
NH2
Fig.1.3 Adenosine.
O
OH OH
N N
N N
NH2
CH2O
OH
P
O
OH
1
2
34
567
8
9
1'2'3'
4'
5'
Fig.1.4 Adenosine 5’-monophosphate (AMP).
NH2 CH2
COOH
Glycine
CHNH
CH2
CH
NH2 COOH
CH
CHCH
CH
Tryptophan
NH2 CH
COOHCH2
CH2
CH2
CH2
NH2Lysine
Fig.1.5 Amino acids with typical side chain groups.
Introduction _____________________________________________________________
3
The simplest amino acid is glycine whose side chain is only a hydrogen atom (fig.1.5). Some side chains contain an aromatic ring such as tryptophan that enables them to absorb UV light and some side chain has another amino group that is easily protonated. In fig.1.5 the amino acids with typical side chain groups are shown.
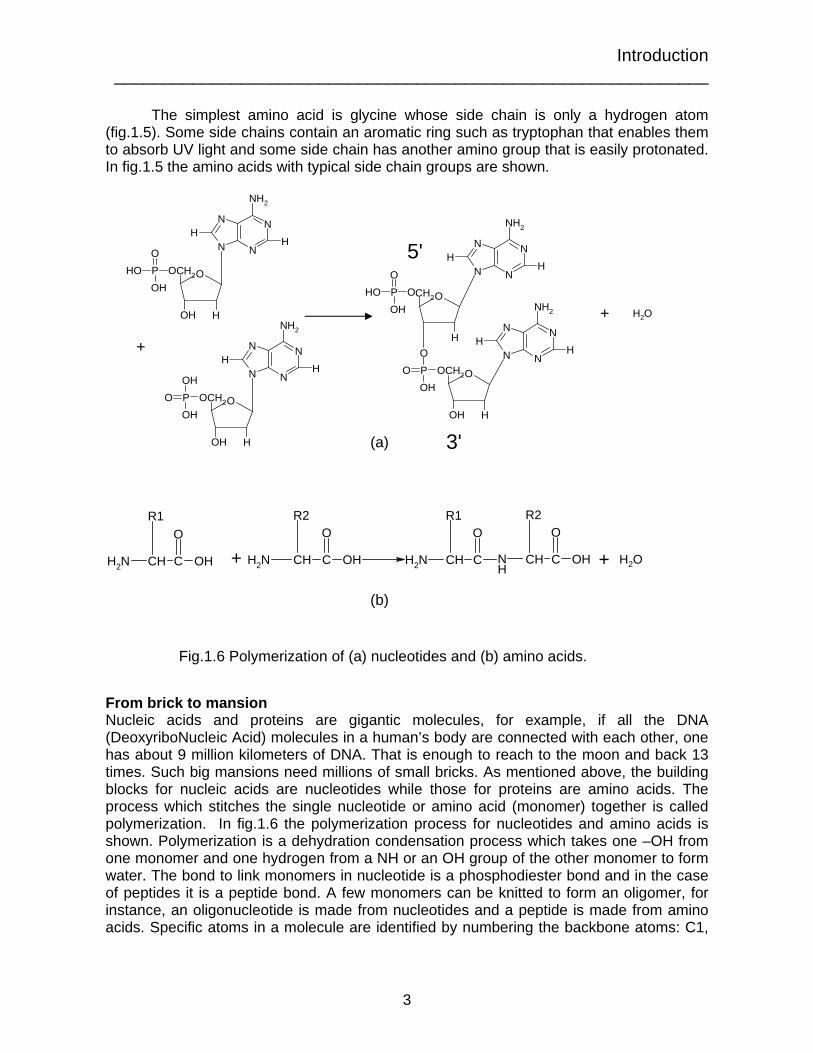
From brick to mansion Nucleic acids and proteins are gigantic molecules, for example, if all the DNA (DeoxyriboNucleic Acid) molecules in a human’s body are connected with each other, one has about 9 million kilometers of DNA. That is enough to reach to the moon and back 13 times. Such big mansions need millions of small bricks. As mentioned above, the building blocks for nucleic acids are nucleotides while those for proteins are amino acids. The process which stitches the single nucleotide or amino acid (monomer) together is called polymerization. In fig.1.6 the polymerization process for nucleotides and amino acids is shown. Polymerization is a dehydration condensation process which takes one –OH from one monomer and one hydrogen from a NH or an OH group of the other monomer to form water. The bond to link monomers in nucleotide is a phosphodiester bond and in the case of peptides it is a peptide bond. A few monomers can be knitted to form an oligomer, for instance, an oligonucleotide is made from nucleotides and a peptide is made from amino acids. Specific atoms in a molecule are identified by numbering the backbone atoms: C1,
O
HOH
CH2P OO
OHOH
N
N
N
N
NH2
HH
O
HOH
CH2P OOH
OOH
N
N
N
N
NH2
HH
O
H
CH2
N
N
N
N
NH2
HH
P OO
OOH
P OO
OHOH
O
HOH
CH2
N
N
N
N
NH2
HH+
+ H2O
5'
3'
C OHCH
R1O
NH2 C OHCH
R2O
NH2 CCH
R1
NH
O
NH2 C OHCH
R2O
+ + H2O
(a)
(b)
Fig.1.6 Polymerization of (a) nucleotides and (b) amino acids.

Building biomolecules _____________________________________________________________
4
C2, etc. In a complex nucleotide, the atoms of the purine or pyrimidine ring are first numbered 1, 2, 3, etc. Carbon atoms in the sugar are then numbered 1', 2', 3', 4', and 5' (see fig.1.4). A nucleotide has two ends: One end of the chain carries a free phosphate group attached to the 5'-carbon atom; this is called the 5' end of the molecule. The other end has a free hydroxyl (-OH) group at the 3'-carbon and is called the 3' end of the molecule (see fig.1.6). Also a peptide has two terminals: one end of the chain has the amino group called the N terminal; the other end has the carboxyl group called the C terminal.
DNA is the body's genetic architectural blueprint present in almost every cell of the body. In 1953 the double helix structure was discovered by Watson and Crick who deduced the base pairing between the two DNA molecules from the double helix structure (fig.1.7a) [1,2]. It is the sequence of DNA that stores the inherited information. Ribonucleic acid (RNA) molecules are usually single-stranded but by formation of hairpin loops RNA can also form a double-helical structure (fig.1.7b) [3]. Because of the influence of the steric interaction and hydrogen bonds, Watson and Crick deduced that adenine must pair with thymine and guanine must pair with cytosine. In hairpin loop RNA, adenine pairs with uracil since in RNA, thymine is replaced by uracil (fig.1.8).
(a) (b)
Fig.1.7 (a) DNA double helix (b) RNA hairpin loop.

Introduction _____________________________________________________________
5
Proteins are the most abundant and diverse molecules found in living cells. They typically make up about half the total weight of biomolecules in a cell (excluding water). Proteins can be enzymes, specific carriers as hemoglobins that carry oxygen (fig.1.9), and are important in contraction, such as actin fibers that interact in muscle tissue, etc. 1.2 Soft ionization techniques Biomolecules are studied intensively in solution and in the solid state. The structure of molecules can be elucidated using x-ray crystallography. It is however difficult to study biomolecules in the gas phase simply because the biomolecules are so fragile (the weakest covalent bond dissociation energy is of the order of 1 eV). Before the late 1960's, the ionization techniques available, such as electron impact ionization or photoionization could not be used for ionizing large biomolecules. The reason is that biomolecules are heated up during the ionization process and thus the biomolecules therefore decompose. A "gentle" ionization technique was therefore required. During the 70's chemical ionization (CI) [4], plasma desorption (PD) [5] and fast atom bombardment (FAB) were invented [6], enabling scientists to produce large biomolecular ions. These techniques achieved certain success, however, for biomolecules larger than 10 kamu it was difficult to ionize them in the gas phase, which meant that these techniques were not "soft" enough. In the late 80's, with the invention of true "soft" ionization techniques such as electrospray ionization (ESI) [7,8] and soft laser desorption ionization (SLD) [9,10], it became possible to generate
NN
O
O
H3C
H H NN
NH
H
H N H
NN
O
H
H NN
O
NH
N
N HHN H
H
H
Thymine Adenine Cytosine Guanine
Fig.1.8 Watson-Crick base paring.
Fig.1.9 Hemoglobin.
Soft ionization techniques _____________________________________________________________
6
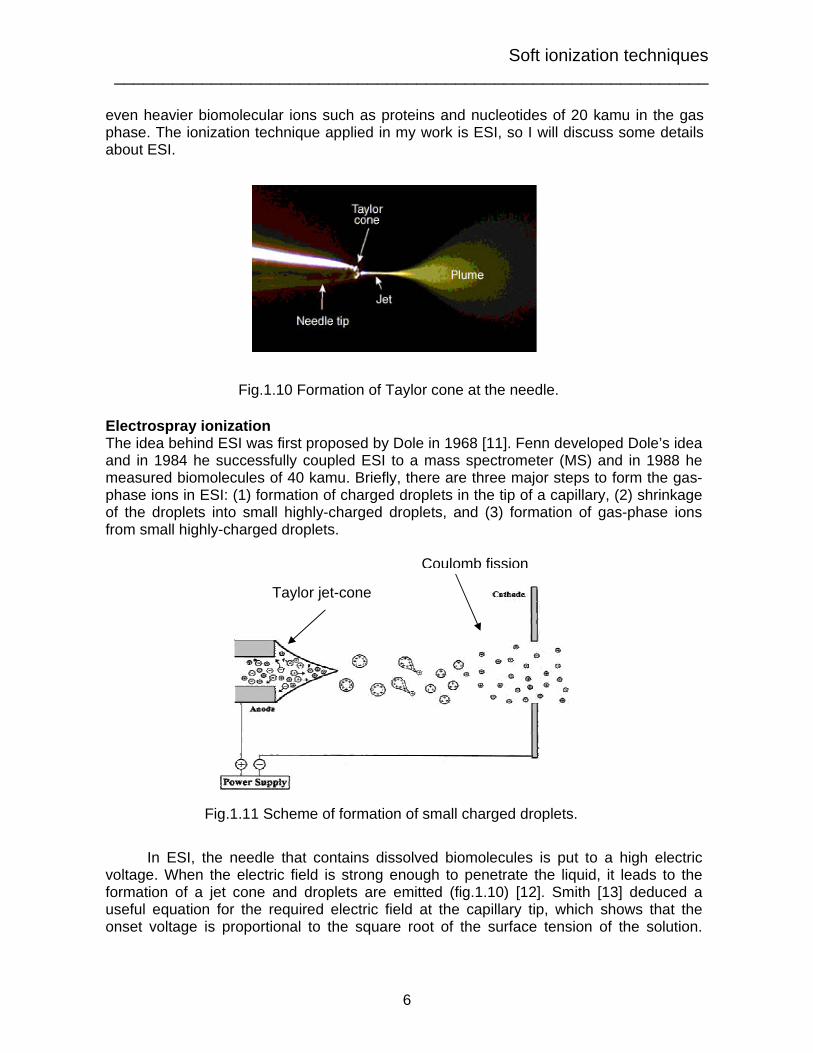
even heavier biomolecular ions such as proteins and nucleotides of 20 kamu in the gas phase. The ionization technique applied in my work is ESI, so I will discuss some details about ESI. Electrospray ionization The idea behind ESI was first proposed by Dole in 1968 [11]. Fenn developed Dole’s idea and in 1984 he successfully coupled ESI to a mass spectrometer (MS) and in 1988 he measured biomolecules of 40 kamu. Briefly, there are three major steps to form the gas-phase ions in ESI: (1) formation of charged droplets in the tip of a capillary, (2) shrinkage of the droplets into small highly-charged droplets, and (3) formation of gas-phase ions from small highly-charged droplets.
In ESI, the needle that contains dissolved biomolecules is put to a high electric voltage. When the electric field is strong enough to penetrate the liquid, it leads to the formation of a jet cone and droplets are emitted (fig.1.10) [12]. Smith [13] deduced a useful equation for the required electric field at the capillary tip, which shows that the onset voltage is proportional to the square root of the surface tension of the solution.
Fig.1.10 Formation of Taylor cone at the needle.
Fig.1.11 Scheme of formation of small charged droplets.
Taylor jet-cone
Coulomb fission

Introduction _____________________________________________________________
7
Therefore, a solution that has a high surface tension is difficult to spray. For example, in Smith’s paper, they needed 4 kV to spray a water solution while a voltage of 2.2 kV is enough to spray a methanol solution. As the solvent molecules evaporate from the droplets, the droplets shrink. The density of charge increases which means the Coulomb repulsion also increases. When the Coulomb repulsion is equal to the surface tension of the droplet, fission occurs and the droplet divides into several small droplets. Figure 1.11 is the scheme of the first two steps of ESI.
There are however two theories for the formation of gas-phase ions from the small highly charged droplets. Dole and Röllgen proposed a charged residue method in which the fission would continue until only one excess ion is left [11,14]. Iribarne and Thomson proposed a different mechanism, called the ion evaporation method [15,16], in which the radius of a droplet decreases until direct ion emission is possible. When the radius is less than 10 nm, ion emission dominates over fission. Experiments have been done to demonstrate the validity of the two theories and the results show that the ion evaporation model is preferred to the charged residue model [8,17,18], but there has been no decisive experiment to distinguish the two mechanisms. The charge state distribution of the final ions depends on the solution pH [19-21], solvent [22,23], analyte concentration [24,25] and counterion [13,25] in solution, etc. for example, variation of solution pH can change the acid-base equilibrium thus altering the degree of positive or negative charging through protonation or deprotonation. With a higher polarity of the solvent molecules, a higher degree of charge separation can be achieved leading to ions with a higher charge state. In general, electrospray tends to generate multiply charged ions, especially for molecules with molecular weight larger than 2 kamu. This allows analysis of high molecular weight proteins using analyzers with a lower mass/charge limit. In Fig.1.12 a typical ESI spectrum of the protein lysozyme (15154 amu) is shown [26]. Soft Laser desorption In 1987 Tanaka presented results for intact proteins in the gas phase with the weight more than 10 kamu. He pointed out that the key to ionize large biomolecules was the proper laser energy and wavelength with high absorbance and a good matrix to transfer heat. Karas and Hillenkamp developed a new crystalline matrix with an absorption maximum matched to the wavelength of the laser pulse. The technique is
Fig.1.12 Electrospray ion mass (m/q) spectra measured for disulfide-bond reduced lysozyme.
m/q

Soft ionization techniques _____________________________________________________________
8
Fig.1.13 Scheme of process of MALDI.
called matrix-assisted laser-desorption ionization (MALDI) [27,28]. Nowadays, the predominant SLD technique is MALDI.
In principle, there are two major steps to form gas-phase ions in SLD: (1) after absorbing the photon energy emitted by a laser, matrix molecules together with the analyte molecules are sublimated into the gas, and (2) the irradiation of the matrix induces electronic excitation of the matrix molecules, accumulating large amount of energy. Gas-phase ions are formed through proton transfer between the matrix molecules and the analyte molecules. Figure 1.13 shows the principle of SLD in the form of MALDI. One of the properties of SLD is that the resulting ions are dominantly singly charged. Fig.1.14 Sonic spray ionization source from reference [31].

Study of biomolecules in the gas phase _____________________________________________________________
9
Sonic spray ionization Sonic Spray Ionization (SSI) was developed in the 1990’s by Hirabayashi [29,30]. The original idea was to couple the liquid chromatographs (LC) and capillary electrophoresis to mass spectrometry. The property of SSI is its simplicity since no heating or high voltage is needed. This source thus delivers ions with very low internal energy such as clusters (fig.1.14). Cooks observed magic number of serine clusters and also studied the chirality recognition of L- and D- amino acids [31-33]. 1.3 Study of biomolecules in the gas phase After Fenn interfaced ESI to MS for the first time, intensive studies of biomolecules in the gas phase have been made. Collision-induced dissociation (CID) experiments can determine the sequence of peptides and nucleic acids [34,35]. It can also be used for studies of the dissociation dynamics of molecules. Recently, a technique called electron capture dissociation (ECD) was developed [36,37]. Compared to CID, ECD can induce a non-ergodic process which causes special fragmentations in biomolecules. Blackbody infrared radiative dissociation (BIRD) experiments can determine the activation energy and its corresponding preexponential factor for a unimolecular fragmentation [38,39]. Ion mobility experiments can reveal the conformation of a molecule depending on charge state or environment [40,41]. Photoelectron spectroscopy (PES) can be used to obtain the electron affinity of a molecule [42,43]. In other words, studies of biomolecules in the gas phase using soft ionization technique are a hot research field nowadays (fig.1.15) [44].
-1991 92-93 94-95 96-97 98-99 00-01 02-030
200
400
600
800
1000
1200
1400
1600
1800
2000
Pap
ers
Year
Fig.1.15 Research on biomolecules in the gas phase.

Experimental details _____________________________________________________________
10
ESI source
Magnet gas collision cell
Electrostaticanalyzer
50 kV Channeltrondetector
+ −
Chapter 2 Experimental details: 2.1 Accelerator mass spectrometer A tandem mass spectrometer is used in the collision experiments between biomolecular ions and target gases (fig.2.1). This equipment has five major parts: (1) ESI source, (2) accelerator tube, (3) magnet sector, (4) collision cell and (5) electrostatic analyzer. The equipment is operated in the way described in the following: The ESI source, together with rotary pumps and turbomolecular pumps, is mounted on the high-voltage platform of the accelerator. A stainless steel hypodermic needle is, via a fused silica capillary, connected to a syringe containing a solution of the analyte. A syringe pump (Harvard apparatus) delivers a constant flow through the needle. Increasing the flow rate helps to stabilize the signals. A typical flow rate is 1µl/min. A voltage of 3-4kV relative to the heated capillary is put on the needle. The electrospray produces highly charged droplets at atmospheric pressure and gaseous, multiply charged analyte ions are formed from the droplets in the heated capillary. The capillary is a 10-cm long stainless steel rod with a 0.4-mm bore, normally heated to 180 °C for desolvation of water from analyte molecules. At the exit of the capillary ions emerge into the first vacuum zone where a rotary pump maintains a pressure of around 1 Torr. The ions focused by a tube lens go through a skimmer into a second region. The voltage on the tube lens varies from 50 V to 200 V depending on the charge state of the desired ions [45,46]. This voltage dependence is due to in-source CID between biomolecules and residual gas. In-source CID can also lead to molecules with higher internal energy because the ions can have higher kinetic energy with higher tube lens voltage and collisions with gases heat up the “cold” molecules. This effect was observed in our lab (see appendix). The pressure in the second region is further reduced to 1 mTorr by a turbopump. The ions are steered through this section by an octopole beam guide, and enter the third vacuum region through lenses.
Fig.2.1 Schematic drawing of accelerator mass spectrometer.

Accelerator mass spectrometer _____________________________________________________________
11
This region is evacuated to 10-5 Torr by a second turbopump. An einzel lens assembly focuses the ions into the acceleration tube of the isotope separator in which the potential difference is 50 kV. The schematic drawing of the ESI source is shown in fig.2.2. After acceleration, an m/q analysis (m being the mass of the ion and q being the charge state) is performed by a large, 2-m radius, 72° bending magnet capable of deflecting singly charged ions with mass up to 5000 amu. After magnetic analysis the mass-selected ions pass through a target gas contained in a 3-cm long differentially pumped cell with entrance and exit apertures of 1 and 3-mm in diameter, respectively. Then the ions enter a computer-controlled 180° hemispherical electrostatic analyzer (ESA) with a radius of 15 cm. Finally, the transmitted ions are detected by a channeltron connected through amplifiers and discriminators to the PC that is operated in the particle counting mode. The principle of the ESA for mass analysis is that only ions with proper kinetic energy can pass through. The physics behind is that the centripetal force equals the electrostatic force that the ions experience, i.e.
kinESA
2ESA
2Erd
q1U
rmv
dUq
××=
= (1),
where v is velocity of the ions, respectively, UESA is the potential on the ESA, d is the distance between two conducting half spheres and r is the radius of the trajectory. From eq.1, the scan of UESA means the selection of ions with different kinetic energy per charge state. In our case, if precursor ions fragment in the collision cell, the velocity of the fragments is the same as that of the precursor; therefore, scanning the electric field can separate the fragments with different m/q ratios. This method of analysis is called mass-analyzed ion kinetic energy (MIKE) spectrometry.
1 mbar 10-3 mbar 10-5 mbar 10-6 mbar
Rotary pump Turbo
pump Turbo pump Heated
Capillary (~180°C)
ESI needle 4kV
Fused silica capillary
Tube lens
Skimmer
Octapole Lenses
Acceleration tube
Fig.2.2 Schematic drawing of electrospray ion source.

Experimental details _____________________________________________________________
12
1 m
Accelerator with electrospray ion source
Magnet
Ion bunch
Na oven Microchannel plate detector
Channeltron detector
2.2 ELISA Recently, an ELectrostatic Ion Storage ring Aarhus (ELISA), figure 2.3, has been built at the University of Aarhus [47,48]. Briefly, ELISA contains two 160° cylindrical deflectors with four 10° parallel-plate deflectors and two electrostatic quadrupole doublets. Ions can be stored using suitable parameters and neutrals originating from precursor ions are detected by the channel plate at the end of one of the straight parts of ELISA. Since it is electrostatic, ions with the same energy-to-charge ratio can be stored using fixed parameters (mass independent). ELISA is compact (the circumference is 8.35m). The vacuum in ELISA is 10-11 mbar, but when a geometrical cross-section measurement is performed, the pressure in the ring is increased to increase the production of neutral fragments. A pulsed laser can be applied on the side opposite to the detector to interact with the stored ion bunches. If the stored ions are multicharged, the production of neutral fragments could be very low and a channeltron detector is put just after one of the 10° deflectors. The position of the channeltron relative to the beam trajectory depends on the mass-to-charge ratio: if the m/q ratio of fragments is higher than that of the precursor i.e. fragments bent less than precursor, then the detector should be placed at a smaller angle relative to the trajectory. On the other hand, if the m/q of the fragments is lower than that of the precursor the detector should be put at a larger angle relative to the trajectory. When the injection beam line of ELISA is coupled to an electrospray ion source, biomolecular ions can be studied. The spray source used in ELISA is the same as the one in the accelerator MS instrument except that an 22-pole ion trap is used to store the beam and make ion-bunches for injection into ELISA. The ion trap can operate in two modes, trap mode and extraction mode. When it is in the trap mode, ions are accumulated. In the extraction mode, ions are expelled from the trap and injected as an ion bunch into ELISA. The ion trap is placed in the ESI source in the third stage before the Einzel lens. A voltage of 22kV is applied to the acceleration tube to accelerate the ions. After acceleration the ions are selected by a bending magnet according to their mass-to-charge ratio. Typical timing sequence for ELISA A typical timing sequence is shown in Fig. 2.4. The electrospray ion source runs continuously and ions are stored in the trap as shown at the top of Fig. 2.4 by the sine wave corresponding to the RF applied to the trap. A timer starts to generate a start signal,
Fig.2.3 Schematic drawing of the electrostatic storage ring (ELISA).

ELISA ____________________________________________________________
13
and after a fixed delay, a timing signal is sent to the computer to start the recording program, and also a signal to the ion trap to extract the stored ions. This extraction mode lasts several tens of microseconds, then the trap returns to the trap mode. After a delay of 1ms after the start signal, ELISA closes to circulate the bunched ions from the injection beam line. Different mass-to-charge ratios determine the flight time from the ion trap to the entrance of ELISA, determining the timing signal to the ion trap. Therefore, signals for extracting heavier ions must be earlier than those for lighter ions. In the timing sequence of 10 Hz above, nearly 100 ms is spent in the trap mode. A voltage can be put to the skimmer (fig. 2.2) to have different storage time, and therefore different timing signal can give different ion storage times. A typical timing for the laser is about 50 ms after the start signal. Because of some internal delay of the laser, the input timing for the laser is not the same as the real timing when laser irradiates. The actual timing of the laser is an important parameter because the laser pulse should overlap with the bunched ions. We monitor the Q-switch timing to obtain the actual time for the laser timing. In order to achieve maximum overlapping, we need to fine-tune the timing for the laser. The 22-pole ion trap The ESI source used in ELISA is almost identical to the one used in the accelerator MS except that a 22-pole ion trap is included. An ion trap should have (1) even-numbered electrodes that can trap the ions in the radial direction and (2) entrance-cap and end-cap ring electrodes that confine ions in the axial direction (fig.2.5 shows a quadrupole). A DC voltage is on the entrance-cap and end-cap ring electrode to prevent the ions from escaping. A RF voltage, )cos( tVU Ω± , is applied on the multipole electrodes. Ions in such conditions have two kinds of motions in the radial direction in the trap: (1) the motion around the center called secular motion whose frequency is quite slow compared with the RF frequency, Ω and (2) micromotion that has a frequency as high as the RF frequency and the center of micromotion is the simultaneous position where the secular motion
extraction signal
start PC
skimmer signal
ions accumulation
ELISA close timing
1 ms
Fig.2.4 Typical timing sequence for ELISA.

Experimental details _____________________________________________________________
14
moves. The amplitude of micromotion is proportional to the instantaneous amplitude of the secular motion that means in the return point of a secular motion, micromotion has its highest amplitude. In fig.2.6 is shown the combination of the two motions. From this figure, it is clear that the frequency of the secular motion is much lower than that of the micromotion, and the amplitude of the micromotion is at the maximum when the ions are on a return point. The secular motion of the ions can be considered to be driven by an effective potential (or psedopotential). The advantage of a 22-pole ion trap is that it can create a effective potential with a wider flat field-free region compared with that of quadrupole around the center trap. The ions traveling in the field-free region therefore have a diminishing micromotion. Therefore heating due to coupling from micromotion is also smaller. For example Gerlich [49] simulated temperature distributions for the storage of C+ in a H2 buffer gas at 80 K and the result was that a high tail was found both in multipole ion traps and quadrupoles, but in a quadrupole the tail was much higher than that in a multipole ion trap (see [49] for more details, see [50,51] for recent experiments based on 22-pole trap).
)cos( tVU Ω+
)cos( tVU Ω−
Fig.2.5 Illustration of quadrupole ion trap.
Fig.2.6 Combination of secular motion and micromotion.

ELISA ____________________________________________________________
15
In fig.2.7 the schematic drawing of the 22-pole ion trap in our lab is shown. The 22-pole ion trap follows the design of Gerlich [52,53]. It has a length of about 4 cm and the 22 rods with 1-mm radius form a cylinder with a radius of 5 mm. There are electrodes at each end to stop and extract ions. The five thin ring electrodes located just outside the 22 electrodes produce a weak electrostatic field in the axial direction for manipulation of the ions inside the trap. The RF voltage applied to the multipole electrode has an amplitude of 100 V and a frequency of 3 MHz. A DC voltage of several volts is applied to the entrance and end cap ring electrodes. AMP anions were used to test the ion trap. Fig. 2.8a shows a pickup signal [47] for a single bunch of deprotonated AMP ions circulating in ELISA. The trap ran in the mode of 1 Hz i.e., ion accumulation time is about 1 s (no voltage on skimmer). From the figure, the revolution time of AMP anions is determined to be 75 µs that agrees with the calculated value for this ion of mass 346 and with 22 keV kinetic energy. Fig. 2.8b shows the details around the peak. The time required to empty the trap is about 40 µs that should be less than the width of the extraction signal, 50 µs. Moreover, the peak area is proportional to the number of the ions in the bunch. Table 2.1 gives the details about the peak area and the corresponding number of ions. Comparing the number of ions with the storage times of 1 s 10 s and 25 s, it is found that the number of ions saturates. The reason for this is the space-charge effect that destroys the stability status of a trap leading to loss of ions. So the number of ions in the 10 s storage is only a factor of 5 higher than that in the 1 s storage. Table 1 number of ions in a bunch (calibration based on [54]). Repetition time Peak area
(mV?µs) Number of ions (?103)
1 Hz 5.65 226 0.1 Hz 26.1 1044 0.05 Hz 21.9 876
Fig.2.7 Illustration of 22-pole ion trap.

Experimental details _____________________________________________________________
16
2.3 Sample preparation Mononucleotides and peptides were brought from SIGMA-Aldrich and oligonucleotides were from DNA Technology, Denmark. The solution used for spraying anions was formed by diluting to yield 20 µM in a methanol/H2O (1:1 volume) solution. All the solutions for cations are formed by diluting to yield 20 µM in an acetic acid (0.1%) water/methanol (1:1) solution. The flow rate is set to 2 µl/min for the “anion solution” and 1 µl/min for the “cation solution”.
0 200 400 600 800 10000.0
0.2
0.4
0.6
0.8
1.0
Σ (m
V)
Time (µs)
(a)
400 420 440 460 480 5000.0
0.2
0.4
0.6
0.8
1.0
Σ (m
V)
Time (µs)
40 µs
(b)
75 µs
Fig.2.8 (a) Pickup signals for AMP anions stored in the 22-pole trap (b) the details of one peak.

Biomolecular ions in an accelerator mass spectrometer _____________________________________________________________
17
Chapter 3 Biomolecular ions in an accelerator mass spectrometer 3.1 Cross section for formation of fragment ions after collision After collision with the target gas, both fragment ions and parent ions are collected by an ESA, which enables one to measure the production cross section of a fragment ion by the so called growth rate method [55]. An example is given below to demonstrate this method. If an anion beam with a high translational energy is passing through a gas target, an extra electron can be captured from the target gas to the parent ions (fig. 3.1). Assuming that the density of target gas is 1, at any position x, the intensity changes of the primary ions is
−−
−−= IxI
tσdd (1)
where −tσ is the destruction cross section for the primary ions. At the position x, the intensity changes of the dianion is
−−−
−−= 2te
2
IIx
I2σσ
dd (2)
where eσ is the electron capture cross section and −2tσ is the destruction cross section for dianions. From eq. (1), the intensity of primary ions can be found as
xσ0
teII −−−− = (3) where −
0I is the intensity of primary ions before passing through the target. Substituting (3) into (2), we have
xσ0e
2t
2t
2 eIσIσdx
dI −−
−−−−
=+ (4)
This is a linear non-homogenous differential equation, and its analytical solution is
)σσ
Iσeσσ
Iσ(e(x)Itt
0e)xσ(σ
tt
0exσ2
2
t2t
2
2t
−−
−−
−−
−
−−
−=
−−
−−− (5)
However, what we can measure in the spectrum is the intensity of dianions and primary anions passing through the target gas, i.e., (x)I 2− and (x)I − which is equal to xσ
0teI −−− . So
eq. (5) is revised to
)σσ
Iσeσσ
Iσ(ee(x)Itt
0e)xσ(σ
tt
0e)xσ(σxσ2
2
t2t
2
2ttt
−−
−−
−−
−−−
−−
−⋅=
−−
−−−− (6)
Finally, we have
))xσ(σ
tt
0e
tt
0exσ2 2tt
22
t eσσ
Iσσσ
Iσ(e(x)I −−
−−−−
− −−−
−−
−−
−⋅= (7)

Cross section for formation of fragment ions after collisions _____________________________________________________________
18
So if the destruction cross section between anion and dianion is small, i.e., )xσ(σ 2tt −− − is a small value, we can expand the exponential, and eq. (7) becomes
))xσ(σ21(x)(xIσ(x)I 2
tte2
2 −− −−= −− (8)
From eq.(8), if we neglect second order effects, the ratio between the intensity of dianions and primary anions after collision is proportional to the target thickness. Deviations from a linear increase then give information about the difference between the destruction cross sections for these two ions. An example will be shown in section 3.2. The reason why the electron can be transferred from one ion to another can be explained by the classical over-the-barrier model. In the mid-1980s, this model was developed for charge transfer in slow ion-atom collisions [56-58]. This model is useful for estimates of the total and absolute cross sections for electron removal from an atomic target. The atomic models assume that electron transfer is possible when the over-the-barrier condition is fulfilled, i.e., when the potential seen by the electron moving from the target to the projectile equals the Stark-shifted binding energy for the active electron at the target. For big molecules such as biomolecules or clusters, the point charge approximation is no longer valid, so more sophisticated treatments of the targets and projectiles are needed. Recently, Cederquist and coworkers [59, 60] applied the over-the-barrier model to treat the electron transfer process in collisions between C60/Arq+ and multiply charged C60/C60 ions. They considered the C60 ion as a conducting sphere and the Arq+, for instance, as a point charge. In this case, the potential outside of the conducting sphere can be calculated by means of electrostatic image charges (see Fig.3 in ref. [59]).
0
l
x
−0I (x)I −
(x)I 2−
(l)I −
(l)I 2−
Fig.3.1 Schematic drawing of the collision process. The intensity of the primary beam is −
0I and when the beam arrives at point x, the intensity of the primary beam and the dianion are (x)I − and (x)I 2− , respectively. When they leave the collision cell, the intensities of these two ions measured by ESA are (l)I − and (l)I 2− .

Biomolecular ions in an accelerator mass spectrometer _____________________________________________________________
19
3.2 Multiply-charged oligonucleotide anions in collisions with noble gas atoms Total destruction cross sections The total destruction cross section was measured for [d(A)7-nH]n- in He, Ne and Ar by the beam attenuation technique for n between 2 to 5. The cross sections are shown in Fig. 3.2 and it should be noted that Ne and Ar give almost identical values whereas the cross sections in He are around 15% lower and the cross sections increase slowly with projectile charge state. We have earlier observed similar behaviors for high energy collisions between lysozyme ions and noble gases [61] and will adapt the model used then in the present case. The d(A)7 molecule (formula: C70H79N35O33P6) is approximated by a sphere with a radius of 6.8 Å based on the total destruction cross section in collisions with Ar or Ne. The destruction cross section for collisions with He has to be modified since the molecule is transparent to He atoms. The cross section for transfer of more than around 5 eV (a typical binding energy) to an atom in the molecule in a collision with a He atom is σ = 1.1 Å2. The average projected density of heavy atoms in the d(A)7 molecule is around t=1 atom/Å2 and we estimate the transparency factor by its value for a random two-dimensional distribution, T=e-tσ which gives T=0.32 for He and a negligible value for Ne and Ar. Multiplying the geometrical cross section by (1-T) we then arrive at a cross section of 120 Å2 for a He target as compared to around 200 Å2 for Ne and Ar targets. We believe that this simple model, in a qualitative way, explains the difference in cross sections measured in light and heavy target gases, respectively. From Fig. 3.2 it is evident that the measured cross sections increase as a function of projectile charge state. A similar charge state dependence of cross sections measured by ion mobility was reported earlier by Hoaglund et al. [62] for charge states between 2 and 6 of 10-residue oligonucleotide anions comprised entirely of thymine bases. They ascribed the increase in cross section with charge state to an unfolding of the molecule as a result of Coulomb repulsion. We believe that the increase in total destruction cross section as a function of charge state which we observe can also be explained by unfolding due to Coulomb repulsion.
0 1 2 3 4 5 60
50
100
150
200
250 He Ne Ar
Cro
ss s
ectio
n (Å
2 )
n
Fig.3.2 Total destruction cross sections for [d(A)7-nH]n- in He, Ne or Ar gas as a function of n.

Oligonucleotide anions in collisions with noble gas atoms _____________________________________________________________
20
Single and double electron loss from oligonucleotides When multiply-charged anions collide with noble gas, one or two electrons can be lost from the precursor anions (fig. 3.3). From fig. 3.3, it is seen that electron loss from precursor ions occurs and that electron lost radical ions dominate over the other fragment ions. This is also observed in peptides and proteins in high energy CID [63, 64], but is not observed in low energy CID since high energy is required in order to satisfy the Massey criterion [65] i.e., when the electron transfer time is equal to the collision time, the maximum electron capture cross section can be obtained. In fig. 3.4 is shown the ratio of the intensity of one electron reduced [d(A)5-3H]2- and its precursor [d(A)5-3H]3- as a function of He target thickness. The electron capture cross section can be obtained by a linear fit. The slope gives the cross section as discussed in the section above. In this way cross sections for single or double electron loss can be obtained as a function of charge state in different target gases. In fig. 3.5 the single electron loss cross section of dA7 in three gases is shown. From this figure, it can be seen that the capture cross section is proportional to the charge state, i.e. to the number of charged phosphate groups. The single electron loss cross sections of dA7
3- and dA53-, whose sizes are different, have
similar values (19.2 and 18.5 Å2, respectively). This means to a first approximation that the only factor that can influence the electron loss cross section is the number of charged phosphates, and the other factors, such as the size of the precursor ions can be neglected.
Fig.3.3 Spectra obtained for collisions between doubly and triply deprotonated d(A)5 and He. Note that the dominating “fragment” peaks correspond to single and double electron loss.
0 200 400 600 800 1000 1200 1400 1600
[d(A)5−3H]3−
[d(A)5−3H]−
[d(A)5−3H]2−
m/q
[d(A)5−2H]2−
[d(A)5−2H]−

Biomolecular ions in an accelerator mass spectrometer _____________________________________________________________
21
It should also be stressed that we have never observed any sign of three electron loss in the collision systems investigated. The ratio between double and single electron loss was found to be insensitive to both projectile charge state and target gas and amounted to around 0.25. The observations listed above allow us to propose a simple model for electron loss from nucleotide anions where the number of negatively charged phosphate groups is the decisive parameter. We assume that a number of separated O− ions attached to individual phosphate groups are responsible for the final charge state of the nucleotide. It is thus tempting to model the nucleotide anion as an assembly of independent oxygen anions imbedded in a passive medium. By linear fitting, the single-electron loss cross section (σe) of an individual oxygen anion could be obtained from the slope of the line. In Table 3.1, a comparison is shown between our experimental data obtained as described above and previous experimental data obtained for O− ions [66, 67]. This comparison is rather crude since the data for the atomic ions are based on reasonable extrapolations of the original measurements. On the other hand the favorable comparison between the two sets of data indicates that our simple model contains the essentials of the interaction between oligonucleotide anions and rare gas atoms in keV collisions. The observation that all the cross sections for double-electron loss amount to 25% of the cross sections for single-electron loss indicates that the two electrons are lost from the same O− ion in the molecule. A rough estimate shows that if two different O− ions were responsible for double-electron loss then the cross section should at most amount to a few percent of the cross section for single-electron loss and also depend on the charge state. Therefore, the double-electron loss process is most likely caused by autoionizing states in the phosphate group after one electron is lost from O−. The biomolecules are transparent to He atoms as described in the section about total destruction cross sections. This transparency will also influence the electron loss cross section. A He atom may penetrate the molecule and cause electron loss without fragmentation whereas a larger atom like Ne or Ar can cause only pure electron loss in
0.0 1.0x10⁻³ 2.0x10⁻³ 3.0x10⁻³ 4.0x10-30.00
0.01
0.02
0.03
0.04
0.05
0.06
0.07
0.08
σ=18.5Å2
Rel
ativ
e in
tens
ity
Target thickness (/Å2)
[dA5−3H]3−+He
Fig.3.4 Single electron loss cross section for [dA5-3H] 3- in He.

Oligonucleotide anions in collisions with noble gas atoms _____________________________________________________________
22
glancing collisions. This effect could explain why the measured electron loss cross section is around 40% larger for He than for Ne and Ar. We thus conclude that He is the ideal target gas if we aim at having large electron loss probabilities and small collisional induced fragmentation probabilities at the same time. Comparing Ar and He can tell us whether O- is located on the surface or in the interior. Table 3.1 Comparison of the single electron loss cross section of oxygen anions deduced from our experiments and the results from Matić and Čobić [66] and Penent et al. [67]. target gas σe (our exp.)/Å2 σe (O- exp.)/Å2 He 6.5 4.5 [67] Ne 3.2 2.0 [66] Ar 3.8 3.5 [66] Electron-loss induced dissociation The MIKE spectrum for two 5-mer oligonucleotides [d(A)5-2H]2- and [d(GCCCC)-2H]2- is shown in fig. 3.6. in addition to the electron loss peak, there are many fragment ions. These ions come from collisionally activated (induced) dissociation (CAD or CID). The CID process typically has two steps: (1) a fast collision process (10-14 to 10-16s) when a fraction of the ion translational energy is converted into the ion internal energy bringing the ion to an excited state, and (2) the energy is redistributed within the internal vibration modes, and unimolecular decomposition occurs. Depending on the collision energy, the CID technique can be divided into high-energy CID and low-energy CID. There is no rigorous definition about high-energy CID and low-energy CID. Roughly the typical energy of high energy CID is several keV for 1000 amu ions. In low energy CID, the typical energy ranges from 1-100 eV. Both high- and low-energy CID techniques have been extensively used in sequencing
0 1 2 3 4 5 60
10
20
30
40
electron loss cross section of dA7
He
ArNe
Cro
ss s
ectio
n (Å
2 )
Charge state
Fig.3.5 Electron loss cross section of dA7 as a function of charge state.

Biomolecular ions in an accelerator mass spectrometer _____________________________________________________________
23
of peptides and nucleotides. Because of the difference in the energy transferred, the fragmentation spectrum is quite different. The peaks in a low energy CID spectrum are few because the bond cleaved is that of low dissociation energy. In the high energy CID spectrum, more fragmentation channels are open so that the number of peaks is enhanced. Comparing the spectrum taken in low energy CID with that in high energy CID, one can have extra information about the molecules. In the beginning of the 90’s, low-energy CID experiments on oligonucleotide anions were preformed by McLuckey [68-70], and he pointed out that in low energy CID, there are two steps involved in the fragmentation: (1) loss of a nucleobase as a neutral or charged base, and (2) cleavage of the 3’C-O bond of the sugar from which the base was lost to produce the complementary “w” and “a-B” type ions (scheme 3.1) using his nomenclature for the fragments. These two types of fragments are useful in sequencing, for instance, the mass of B3=w3-w2-mass (sugar + phosphate). More sequencing of oligonucleotides was made for negative ions since it is easy to remove a proton from phosphoric acid. Very recently, progress has been made in sequencing oligonucleotides for cations [71-73]. The fragmentation pathway is similar for positive ions to that for negative ions, i.e., loss of a positively charged base followed by 3’ C-O bond cleavage
0 200 400 600 800 1000 1200 1400
0 200 400 600 800 1000 1200 1400 1600
b)
a)
EC
Σ3d3[−C]−
Σ4d4a2−B2
a4−B4
a2 a3
a4
w1 w2
w3
w4
m/q
EC
w1
a2−B2 w2
[−A]2−
a3
w3
∑3
a4−B4
a4
w4
∑4
[−A]−
Fig.3.6 CID spectra of two different 5-mer dianion oligonucleotides in collisions with He gas (a) [d(A)5-2H]2- and (b) [d(GCCCC)-2H]2-.
Oligonucleotide anions in collisions with noble gas atoms _____________________________________________________________
24
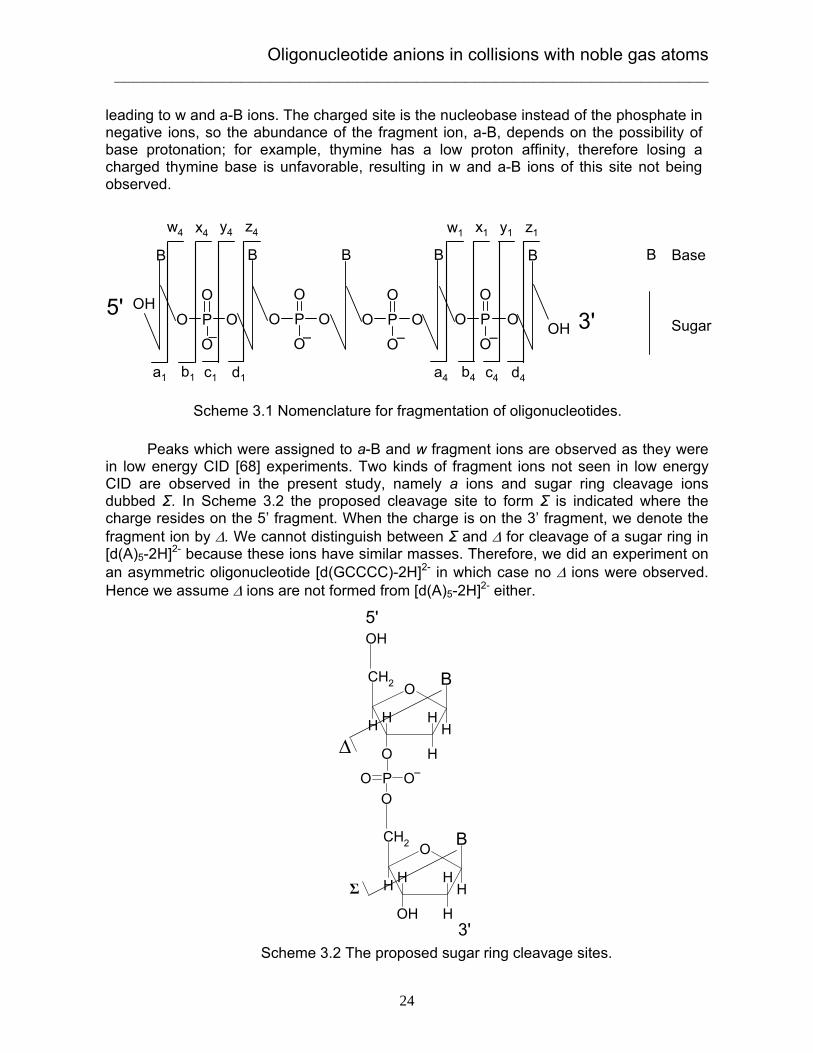
leading to w and a-B ions. The charged site is the nucleobase instead of the phosphate in negative ions, so the abundance of the fragment ion, a-B, depends on the possibility of base protonation; for example, thymine has a low proton affinity, therefore losing a charged thymine base is unfavorable, resulting in w and a-B ions of this site not being observed.
Peaks which were assigned to a-B and w fragment ions are observed as they were in low energy CID [68] experiments. Two kinds of fragment ions not seen in low energy CID are observed in the present study, namely a ions and sugar ring cleavage ions dubbed Σ. In Scheme 3.2 the proposed cleavage site to form Σ is indicated where the charge resides on the 5’ fragment. When the charge is on the 3’ fragment, we denote the fragment ion by ∆. We cannot distinguish between Σ and ∆ for cleavage of a sugar ring in [d(A)5-2H]2- because these ions have similar masses. Therefore, we did an experiment on an asymmetric oligonucleotide [d(GCCCC)-2H]2- in which case no ∆ ions were observed. Hence we assume ∆ ions are not formed from [d(A)5-2H]2- either.
P OO
OO
P OO
OO
P OO
OO
P OO
OO
OH
OH
BA
B B B BA
5' 3' Sugar
B Base
− − − −
a1 b1 c1 d1 a4 b4 c4 d4
w4 y4 z4x4 w1 y1 z1x1
Scheme 3.1 Nomenclature for fragmentation of oligonucleotides.
Scheme 3.2 The proposed sugar ring cleavage sites.
OH
OCH2
H
O
H
H
H
B
H
PO
OO
OCH2
H
OH
H
H
H
B
H
5'
3'
−
Σ
∆
Biomolecular ions in an accelerator mass spectrometer _____________________________________________________________
25
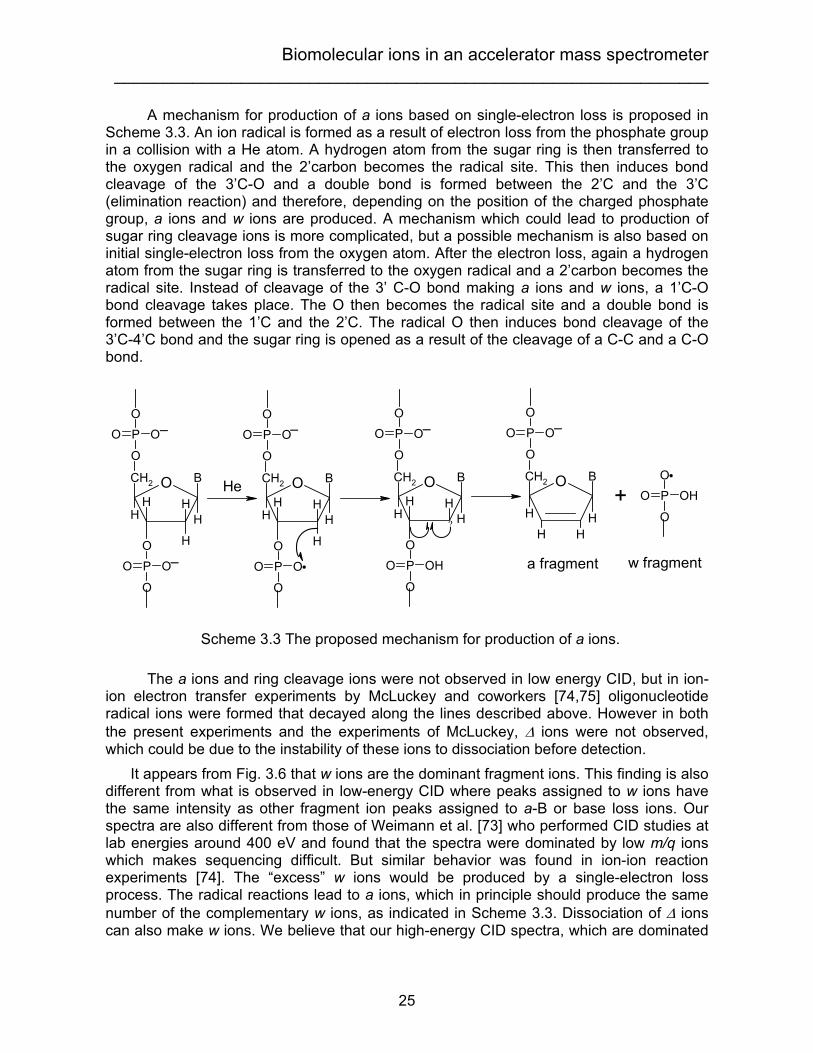
A mechanism for production of a ions based on single-electron loss is proposed in Scheme 3.3. An ion radical is formed as a result of electron loss from the phosphate group in a collision with a He atom. A hydrogen atom from the sugar ring is then transferred to the oxygen radical and the 2’carbon becomes the radical site. This then induces bond cleavage of the 3’C-O and a double bond is formed between the 2’C and the 3’C (elimination reaction) and therefore, depending on the position of the charged phosphate group, a ions and w ions are produced. A mechanism which could lead to production of sugar ring cleavage ions is more complicated, but a possible mechanism is also based on initial single-electron loss from the oxygen atom. After the electron loss, again a hydrogen atom from the sugar ring is transferred to the oxygen radical and a 2’carbon becomes the radical site. Instead of cleavage of the 3’ C-O bond making a ions and w ions, a 1’C-O bond cleavage takes place. The O then becomes the radical site and a double bond is formed between the 1’C and the 2’C. The radical O then induces bond cleavage of the 3’C-4’C bond and the sugar ring is opened as a result of the cleavage of a C-C and a C-O bond.
The a ions and ring cleavage ions were not observed in low energy CID, but in ion-ion electron transfer experiments by McLuckey and coworkers [74,75] oligonucleotide radical ions were formed that decayed along the lines described above. However in both the present experiments and the experiments of McLuckey, ∆ ions were not observed, which could be due to the instability of these ions to dissociation before detection. It appears from Fig. 3.6 that w ions are the dominant fragment ions. This finding is also different from what is observed in low-energy CID where peaks assigned to w ions have the same intensity as other fragment ion peaks assigned to a-B or base loss ions. Our spectra are also different from those of Weimann et al. [73] who performed CID studies at lab energies around 400 eV and found that the spectra were dominated by low m/q ions which makes sequencing difficult. But similar behavior was found in ion-ion reaction experiments [74]. The “excess” w ions would be produced by a single-electron loss process. The radical reactions lead to a ions, which in principle should produce the same number of the complementary w ions, as indicated in Scheme 3.3. Dissociation of ∆ ions can also make w ions. We believe that our high-energy CID spectra, which are dominated
Scheme 3.3 The proposed mechanism for production of a ions.
P
O
OO
O
OCH2
HH
H
HH
B
P
O
OO
O
P
O
O O
O
OCH2
HH
H
HH
B
P
O
OO
O
P
O
OHO
O
OCH2
HH H
H
B
P
O
OO
O
OCH2
H
H HH
B
P
O
OO
O
P
O
OHO
OHe +
a fragment w fragment
− − − −
−
?
Oligonucleotide anions in collisions with noble gas atoms _____________________________________________________________
26
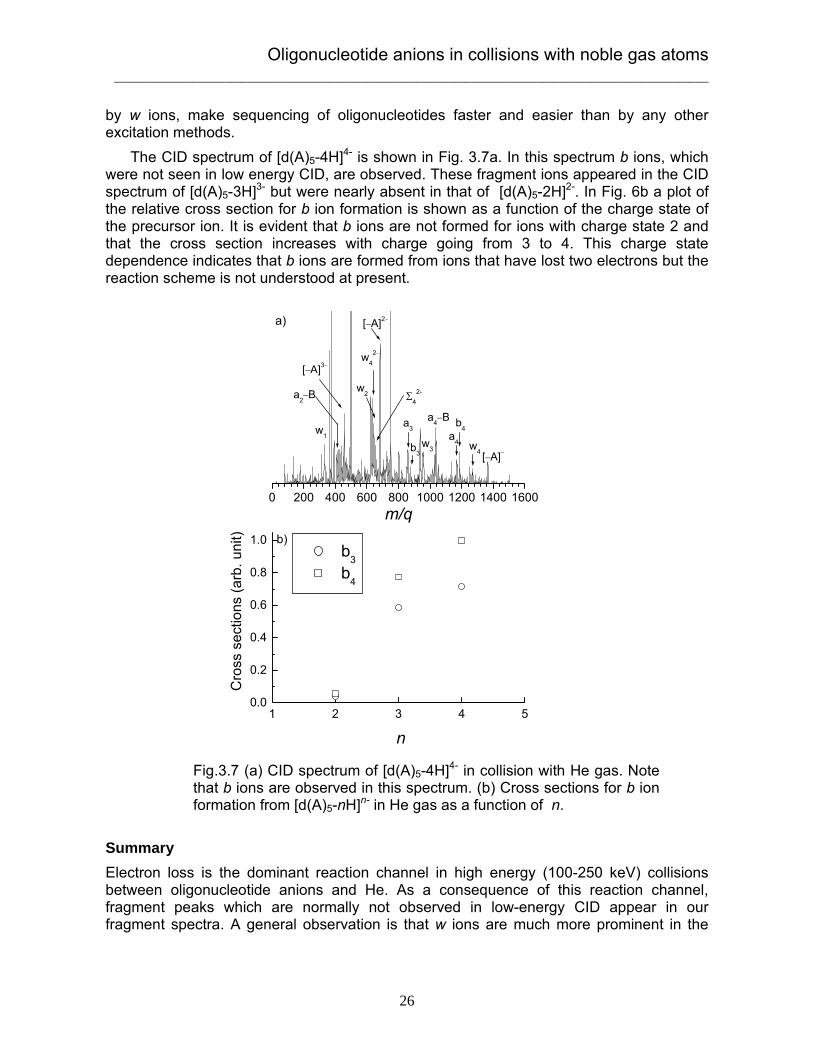
by w ions, make sequencing of oligonucleotides faster and easier than by any other excitation methods. The CID spectrum of [d(A)5-4H]4- is shown in Fig. 3.7a. In this spectrum b ions, which were not seen in low energy CID, are observed. These fragment ions appeared in the CID spectrum of [d(A)5-3H]3- but were nearly absent in that of [d(A)5-2H]2-. In Fig. 6b a plot of the relative cross section for b ion formation is shown as a function of the charge state of the precursor ion. It is evident that b ions are not formed for ions with charge state 2 and that the cross section increases with charge going from 3 to 4. This charge state dependence indicates that b ions are formed from ions that have lost two electrons but the reaction scheme is not understood at present. Summary Electron loss is the dominant reaction channel in high energy (100-250 keV) collisions between oligonucleotide anions and He. As a consequence of this reaction channel, fragment peaks which are normally not observed in low-energy CID appear in our fragment spectra. A general observation is that w ions are much more prominent in the
0 200 400 600 800 1000 1200 1400 1600
1 2 3 4 50.0
0.2
0.4
0.6
0.8
1.0
Σ42-a2−B
a4−B
b)
a)
w42−
[−A]3−
[−A]2−
b3
b4w1
w2
a3
w3
a4 w4 [−A]−
m/q
b3 b4
Cro
ss s
ectio
ns (a
rb. u
nit)
n
Fig.3.7 (a) CID spectrum of [d(A)5-4H]4- in collision with He gas. Note that b ions are observed in this spectrum. (b) Cross sections for b ion formation from [d(A)5-nH]n- in He gas as a function of n.

Biomolecular ions in an accelerator mass spectrometer _____________________________________________________________
27
present high-energy experiments than in low energy CID. We also observed a, sugar ring cleavage ions dubbed Σ, and b ions. We have proposed a mechanism for the production of a and Σ ions based on loss of an electron from the precursor ion. Such ions were observed earlier in ion-ion reaction experiments [74,75]. We suggest that b ions are formed as a result of double-electron loss.
3.3 Electron attachment to nucleotide monoanions in collisions with Na: formation of dianions When high-energy rays such as x-, β, or γ-rays irradiate living cells, genotoxic effects emerge. Impairment of genome is not induced by direct interaction with the high energy quanta. Instead it is the secondary species produced by ionization irradiation that destroys the DNA or RNA molecules. For example, singlet oxygen which is highly reactive and hence harmful to DNA or RNA can be indirectly produced by UV photon absorption [76]. Free electrons are most abundant among secondary species [77]. Recently, Sanche’s group [78] used low energy (3 to 20 eV) electrons to irradiate plasmid DNA single strands and double strands. They found that even when the electron energy is lower than the ionization energy of nucleobases they observed single strand break (SSB) and double strand break (DSB). Except for the strand break, transient molecular anions were observed by dissociated protons being detected which can explain SSB and DSB by low energy electrons attachment. In order to understand the mechanism of DNA damage by electron attachment, and since DNA is so large, a reductionist approach has been taken in the study of electron attachment to isolated nucleobases in vacuum to elucidate the electronic structure of the anion and to show how Watson-Crick base-pairing is affected [79-98]. In the following, we move one step further and describe electron binding to nucleotides. Formation of dianions Because a nucleotide carries a negative charge located on the phosphate group, direct attachment of low kinetic energy electrons (?0 eV) to anions in vacuum is hindered by a large Coulomb barrier and is only possible through tunneling. To circumvent this hindrance we have collided nucleotide monoanions which have high translational kinetic energy (50 keV) with gaseous sodium and looked for electron capture. The idea is that an electron jump might happen at close approach when the over-the-barrier condition is fulfilled. A MIKE spectrum obtained for the collision between AMP anions and sodium is shown in Fig. 3.8b. A spectrum for collisions with neon is included for comparison (Fig. 3.8a). The geometrical cross section of neon is similar to that of sodium but neon's much larger ionization energy prevents electron transfer. Peaks corresponding to fragment ions are seen in both spectra. Interestingly a peak at half the m/q value of the parent ion appears when sodium is used as the collision gas but is absent when neon is used. In dissociation processes kinetic energy is released resulting in broad peaks in the MIKE spectra. The peak width of the ion at half the m/q is smaller than that of other peaks, which implies that this ion is not a fragment ion but instead a dianion. The abundance of the dianion is about 3% of that of the total abundance of anionic product ions. Hence, in the collision the anion becomes vibrationally excited and/or an electron is transferred from the sodium (donor) to the anion (acceptor). Electron detachment results in either neutral or cationic products. The translational energy of the anions is important for the efficiency of the electron-transfer process to generate the dianion. In the 30 − 50 keV region, the

Electron attachment to nucleotide anions _____________________________________________________________
28
abundance of the dianion is the same but decreases at higher energies. At 100 keV the abundance is roughly two thirds of that at 50 keV. When the collision energy becomes too high, the interaction time may become too short. Assuming that the anion interacts with a sodium atom over a distance of 5 −15 Å, the interaction time is 3 − 9 fs (time of passage, 50 keV translational energy), which is shorter than the time of any vibrational period. The electron transfer is therefore assumed to be vertical. The lifetime of the dianion is at least of the order of microseconds as the flight time from the collision cell to the detector is 6 µs. In a similar experiment on the dAMP nucleotide anion (deoxyadenosine 5’−monophosphate, m/q 330) a peak was observed at half the m/q, again owing to the formation of a dianion (Figure 3.8c), when sodium was the collision gas. What is the electronic structure in the AMP and dAMP dianions? In the gaseous adenine anion the extra electron is dipole-bound by 12 meV, [82] but the dipole moment of adenine (2.6 Debye) is extremely close to the critical value for dipole-bound states.[99] Since the distance between the electron and the adenine molecule is 10 Å, the electron only slightly affects the structure of adenine. Recent DFT calculations on isolated nucleobases indicate that Watson−Crick base-pairing stabilizes a covalent anion
80 120 160 200 240 280 320 360
AMP2−
[dAMP−AH]−
[AMP−AH]−[AMP−O]−
AMP−
b
A−
H2PO4−
PO3−
dAMP2−
[dAMP−O]−
dAMP−cA−
H2PO4−
PO3−
m/q
a AMP−
[AMP−AH]−A−
H2PO4−
PO3−
Fig.3.8 Spectra obtained after collisions between AMP anions and neon (a) and sodium (b) and between dAMP anions and sodium (c).The inset in (c) shows the region around half the m/q of the dAMP anion for neon (grey curve) and sodium (red curve) as collision gases.

Biomolecular ions in an accelerator mass spectrometer _____________________________________________________________
29
structure[88−90] and, based on photoelectron spectroscopy experiments, Hendricks et al.[87] showed that hydration of the uracil base leads to a transformation from a dipole-bound anion to a covalent anion. In the AMP dianion a dipole-bound electron experiences the Coulomb repulsion of the negatively charged phosphate group, which raises the energy by about 1 eV (14.4 eVÅ/R, R?10 Å being the distance between the two charges). Hence it is unlikely that a long-lived, purely dipole-bound state, which is repulsive, exists for the AMP dianion. Furthermore, because a dipole-bound electron is very sensitive to the molecular geometry which continuously changes because of atomic motion, autodetachment within vibrational periods may occur [100]. Rotational motion of the dipole limits the lifetime as well when the electron begins to slip behind for high rotational quantum numbers.[100, 101] Most likely the electron goes into the LUMO of the anion located on the adenine base which is the lowest antibonding π orbital (Figure 3.9a). To understand the electronic structure of the covalent AMP dianion better, we performed theoretical calculations at the B3LYP6−311++G(2d,p)//PM3 level of theory by Gaussian [102]. We located a minimum of the dianion with a structure similar to that of the monoanion (Fig. 3.9b) and found that this dianion is 2.3 eV higher in energy than the monoanion. For comparison, we calculated that adenine has an EA value of -0.4 eV (covalent anion), in good agreement with previous calculations [81, 85]. The negative charge of the phosphate group therefore makes the electron more unbound by 1.9 eV. The SOMO (singly occupied molecular orbital) of the AMP dianion is similar to the LUMO of the monoanion though it has diffuse character at the NH2 group (Fig. 3.9b). Even though a dianion is unstable because of electron autodetachment to the continuum, the electron may be trapped because of the Coulomb barrier, a phenomenon previously observed for multiply charged anions [103]. A simple model often employed is that of an electron in a square well potential at short range and a repulsive Coulomb potential at long range [104, 105]. However, the large negative binding energy of the AMP dianion needs some chemical reactions to stabilize. Hydrogen Loss from Nucleobase Nitrogens
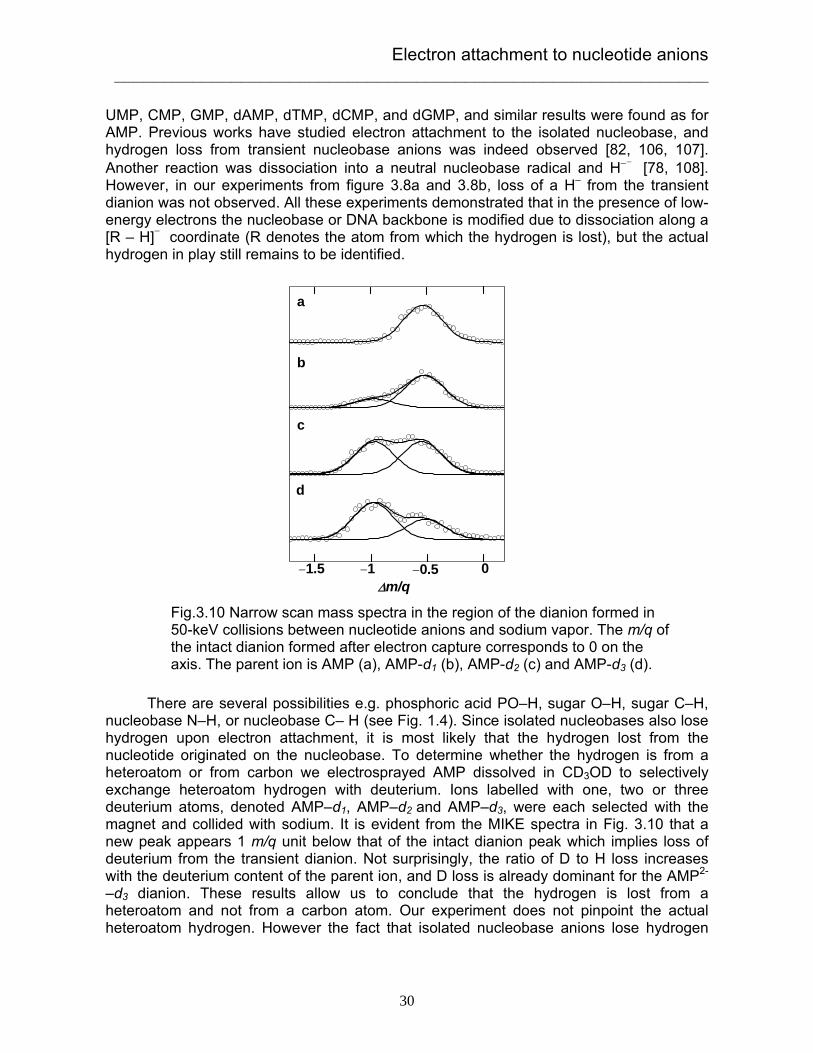
A careful calibration was made on our mass spectrometer. Indeed, a peak which is located 0.5 m/q below the intact dianions reveals that the AMP dianion is dehydrogenated dianion after electron capture (Fig. 3.10A). This fragment dianion is the only one that travels to the detector. Experiments were carried out for other nucleotide anions including
a b
Fig.3.9 (a) The LUMO orbital of the AMP anion (b) The SOMO orbital of the AMP dianion.
Electron attachment to nucleotide anions _____________________________________________________________
30
UMP, CMP, GMP, dAMP, dTMP, dCMP, and dGMP, and similar results were found as for AMP. Previous works have studied electron attachment to the isolated nucleobase, and hydrogen loss from transient nucleobase anions was indeed observed [82, 106, 107]. Another reaction was dissociation into a neutral nucleobase radical and H−- [78, 108]. However, in our experiments from figure 3.8a and 3.8b, loss of a H– from the transient dianion was not observed. All these experiments demonstrated that in the presence of low-energy electrons the nucleobase or DNA backbone is modified due to dissociation along a [R – H]- coordinate (R denotes the atom from which the hydrogen is lost), but the actual hydrogen in play still remains to be identified. There are several possibilities e.g. phosphoric acid PO–H, sugar O–H, sugar C–H, nucleobase N–H, or nucleobase C– H (see Fig. 1.4). Since isolated nucleobases also lose hydrogen upon electron attachment, it is most likely that the hydrogen lost from the nucleotide originated on the nucleobase. To determine whether the hydrogen is from a heteroatom or from carbon we electrosprayed AMP dissolved in CD3OD to selectively exchange heteroatom hydrogen with deuterium. Ions labelled with one, two or three deuterium atoms, denoted AMP–d1, AMP–d2 and AMP–d3, were each selected with the magnet and collided with sodium. It is evident from the MIKE spectra in Fig. 3.10 that a new peak appears 1 m/q unit below that of the intact dianion peak which implies loss of deuterium from the transient dianion. Not surprisingly, the ratio of D to H loss increases with the deuterium content of the parent ion, and D loss is already dominant for the AMP2-
–d3 dianion. These results allow us to conclude that the hydrogen is lost from a heteroatom and not from a carbon atom. Our experiment does not pinpoint the actual heteroatom hydrogen. However the fact that isolated nucleobase anions lose hydrogen
b
c
−1.5 −1 −0.5 0
a
d
∆m/q
Fig.3.10 Narrow scan mass spectra in the region of the dianion formed in 50-keV collisions between nucleotide anions and sodium vapor. The m/q of the intact dianion formed after electron capture corresponds to 0 on the axis. The parent ion is AMP (a), AMP-d1 (b), AMP-d2 (c) and AMP-d3 (d).

Biomolecular ions in an accelerator mass spectrometer _____________________________________________________________
31
indicates that the hydrogen is from the amino group of the adenine. Nucleobases differ in their number of N–H hydrogens, and comparisons between different nucleotides shed light on this issue as discussed in the following.
We have determined the cross section for the formation of the dianion for both RNA and DNA nucleotides. The cross section is a measure of the probability of forming a long-lived dianion on the microsecond time scale. The results are summarized in Table 3.2 (n is the number of hydrogens on nucleobase nitrogens), and it is seen that there is a strong dependence on the chemical structure of the nucleobase. Nucleotides that contain uracil or thymine have the lowest cross sections whereas the nucleotide with guanine has the largest. The cross sections for nucleotides that contain either cytosine or adenine are similar. There is no difference between RNA and DNA nucleotides within the uncertainty of the experiment which implies that the hydrogen lost from RNA nucleotides is not the C2’-OH hydrogen since the OH group is substituted by H in DNA nucleotides. Table 3.2 Cross sections (in Å2) for the formation of [nucleotide – H]2-
Nucleobase n RNA nucleotide
DNA nucleotide
Ura 1 0.10 ? 0.01 Thy 1 0.11 ? 0.01 Cyt 2 0.21 ? 0.03 0.24 ? 0.03 Ade 2 0.26 ? 0.03 0.25 ? 0.03 Gua 3 0.40 ? 0.04 0.34 ? 0.04
0 1 2 30.0
0.1
0.2
0.3
0.4
σ (Å
2 )
n
RNA nucleotide DNA nucleotide
Fig.3.11 The cross section σ for formation of the nucleotide dianion minus a hydrogen atom as a function of the number of hydrogens on nucleobase nitrogens.

Electron attachment to nucleotide anions _____________________________________________________________
32
Interestingly, the cross section correlates with the number of N–H hydrogens, n, in the nucleobase. Indeed, a linear dependence is found when the cross section is plotted as a function of n (Figure 3.11). Extrapolation to n = 0 predicts a cross section of nearly zero for a nucleotide composed of a hypothetical nucleobase with no N–H hydrogens. These two observations indicate that the origin of the lost hydrogen is indeed N–H in the nucleobase. At the B3LYP/6-311++G(2d,p)/PM3 level of theory we calculate the energy for vertical attachment of an electron to [AMP – H]- (N-dehydrogenated anion) to be slightly positive by 0.1 eV, while it is still negative when the lost H is from C2–H or C8–H of adenine.
Our findings are in good agreement with a very recent theoretical paper by Profeta et al. [109]. They found, based on density functional theory calculations, that the electron affinity of the thymine radical, thymine minus hydrogen, is significantly larger than that of thymine and, importantly that the radical with the largest electron affinity is the one that lacks hydrogen on nitrogen.
A nucleobase anion that lacks hydrogen on nitrogen is a strong base, and when it is in aqueous solution rapid protonation is expected to occur. Thus, the original nucleobase is recovered and in principle no damage has occurred. The water content in the interior of a DNA double helix is, however, limited to about 2.5 water molecules per base pair [110], and it is therefore interesting to consider how the Watson-Crick base pairing is affected by the formation of nucleobase anions that lack hydrogen. In other words, the environment in the interior of the helix is somewhat between bulk solution and vacuum. The Watson-Crick base pairs are shown in Figure 1.8. The loss of a hydrogen atom from a certain N-H groups is seen to lower the number of hydrogen bonds between two bases and hence to a weakening of the selectivity upon which the genetic code is based. Furthermore, it is evident that [thymine – H] − pairs preferentially with guanine (Figure 3.12) instead of adenine with possible implications for the genetic code and mutations. Preliminary results of electron attachment to microsolvated nucleotide and oligonucleotides A. Microsolvated nucleotide monoanions in collisions with Na Microsolvated ions are interesting cluster species because they bridge the gas phase and the solution phase. These ion clusters are fragile so that soft ionization techniques are needed to bring them into the vacuum. Fenn et al. [111] first observed the clusters of solute species with electrospray ionization. Since then, much research has been done
[Thymine−H]− Guanine
NN
O
O
H3C
H NN
O
NH
N
N H
H
H
-
Fig.3.12 Loss of genetic code due to base mispairing after hydrogen loss from the thymine anion.

Biomolecular ions in an accelerator mass spectrometer _____________________________________________________________
33
a
b
Fig.3.13 Electron attachment to microsolvated AMP anions. (a) AMP–?(H2O)4 (b) AMP–?(H2O)13.
[112-118]. For example, solvation shell structures were observed [113, 114] and large hydrated ions were also found to exhibit bulk solution properties [113]. In our studies, where a hydrogen atom loss from N-H was observed and where this loss could be one mechanism for DNA damage, it should be studied to what extent water molecules prevent hydrogen loss from the base? In the following, I present the preliminary results of electron attachment to microsolvated AMP anions. Microsolvated AMP–?(H2O)n (n=1∼20) anions are generated by electrospray ionization. The spray solution was made by dissolving AMP powder in pure methanol (containing 0.1% water). The temperature of the heated capillary was set to 60 oC. The spectrum for AMP–?(H2O)4 and AMP–?(H2O)13 are shown in Fig. 3.13. The major peaks are due to water loss from collisionally excited ions, although AMP dianions with water attached are formed as well. From the intensity distributions of the water loss peaks of monoanions, the collisional process can be concluded to be statistical [119]. However in the dianion region not all dianions are observed. Only 1 and 2 water attached dianions appeared in collisions between AMP–?(H2O)4 and Na. There were nearly no waters
0 100 200 300 400 500 600
AMP−·13H2O
m/q
AMP−170 180 190 200 210 220 230 240 250 260 270 280 290 300
+7H2O
+9H2O
+4H2O
m/q
AMP2-
120 160 200 240 280 320 360 400
− 4 H2O
− 3 H2O
− 2 H2O
AMP−·(H2O)4
m/z
− H2O
170 180 190 200
AMP2−·(H2O)2AMP2−·H2O
AMP2−

Electron attachment to nucleotide anions _____________________________________________________________
34
attached to dianions formed in collisions when n is less than 3. When n is larger for example greater than 13, the dianions with three or four water molecules are absent. One possible reason is that the water loss from dianions involves a non-statistical mechanism. AMP dianion and total dianion formation cross sections were measured as a function of number of water molecules and the results are shown in fig. 3.14. The cross section for AMP dianion formation increases up to four water molecules and then decreases as more water molecules are attached. This is because the AMP dianion resulting from hydrated AMP anion has lower internal energy compared with that from bare AMP anion. However, for large hydration the energy transferred is not enough to make a bare AMP dianion so that the cross section decreases. The cross sections for total dianion formation are increasing with the number of water molecules and the cross section for AMP–?(H2O)16 is a factor of 20 higher than that for bare AMP–. This is correlated with the second electron affinities (EA) of AMP. With the attachment of water molecules the possibility of electron capture to the nucleobase is much higher. Table 3.3 Electron binding energies calculated after proton/hydrogen transfer.
Proton/hydrogen donor
Proton/hydrogen acceptor
EBE Adiabatic [eV]
EBE vertical [eV]
Reaction
C1’H N3 -1.0 -0.5 IPT C2’H C2 0.2 IHT C2’H N3 -4.3 0.4 IHT
C2’OH N3 -1.6 0.2 IPT C2’OH C2 0.8 1.0 IPT C3’OH N3 -0.4 0.3 IPT POH N7 -2.6 -1.0 IHT
C6NH2 N7 -2.2 -1.1 IHT No detailed mass calibration was made to determine whether the dianions are intact or with a hydrogen loss. The second Vertical EA (VEA) of AMP is calculated based on
0 2 4 6 8 10 12 14 16 180
1
2
3
4
5
6
Dia
nion
form
atio
n cr
oss
sect
ions
(Å2 )
Number of water molecules n
AMP−.(H2O)n+Na
0 2 4 6 8 10
0.2
0.3
0.4
0.5
0.6
0.7
0.8
0.9
AMP
dian
ion
form
atio
n cr
oss
sect
ion
(Å2 )
Number of water molecules n
a b
Fig.3.14 Formation cross sections for (a) AMP dianions and (b) all dianions.

Biomolecular ions in an accelerator mass spectrometer _____________________________________________________________
35
B3LYP/6-311++G (2d, p)//PM3 level. Up to 4 water molecule AMP clusters, VEA is negative for the intact anions. However, if internal proton or hydrogen transfer (IPT or IHT) happens the intact dianion can be stabilized (table 3.3) [120]. From the calculation for AMP–?(H2O) with H loss from N–H, VEA is found to be 0.2 eV which means the water molecules can stabilize the dianion by 0.1 eV. When AMP is fully hydrated, the Coulomb repulsion is reduced a lot and therefore the dipole bound state for adenine can be formed or the extra electron can also be dipole bound by water clusters so that the hydrogen may not be lost. B. electron attachment to oligonucleotide anions In the next step we collided oligonucleotide anions with Na gas to make an electron transfer. This study toward a better understanding of DNA damage by low energy electrons. Nearly no studies of electron attachment to oligonucleotides are carried out because 1) the source used in the studies by the other groups is the thermo-evaporation source which can not produce intact oligonucleotide anions or neutrals in the gas phase and 2) free electrons cannot attach to oligonucleotide anions because of the strong Coulomb repulsion. Shown in fig. 3.15 is the MIKE spectrum of [d(A)2–H]– in collisions with Na gas. Fragment peaks are assigned according to the nomenclature of scheme 3.1. The dianion peak is clearly seen in the middle of the spectrum. In order to know whether there are peaks due to electron capture processes the mass spectrum of [d(A)2–H]– in collisions with neon is required. Recently, Simons et al. [92] proposed a mechanism to explain single strand breakage (SSB) by low energy electron attachment. In their mechanism the electron is
0 100 200 300 400 500 6000
200
400
600
800
1000
[dA2−H]2−
A−
w1/d1−A
Cou
nts
m/q
[dA2−H]−+Na
−A−
w1/d1
Fig.3.15 MIKE spectrum of dinucleotide anion in collisions with Na.

Electron attachment to nucleotide anions _____________________________________________________________
36
captured to a π* orbital of the nucleobase. When the sugar-phosphate C–O bond length exceeds 1.9 Å, the electron can migrate to the σ* orbital of the C–O bond inducing SSB. Sanche et al. [95] proposed another mechanism in which thermal electrons can attach to a neutral phosphate P=O bond thus rupturing the DNA. Very recently, Simons et al. [121] made a calculation showing that zero eV electrons have a low possibility to attach to phosphate P=O bond. Instead, the electrons with 2∼3 eV energy can attach to P=O bonds leading to damage. In order to understand which is the electron attachment site, cross sections for formation of trianions of [d(G)5–2H] 2– and [d(T)5–2H] 2– were measured (Scheme 3.4). From the studies above the cross sections of mononucleotides containing G and T have the largest difference when the electron is captured to the nucleobase. Hence, electron capture to the base still happens for oligonucleotides and then the cross section difference should be even larger. Otherwise, if the cross sections are independent of the nucleobase, it suggests that the site for electron attachment is the phosphoric acid P=O. Indeed, the cross sections we measured for [d(G)5–2H] 2– and [d(T)5–2H] 2– are 2.9 Å2 and 3.5 Å2 respectively. The site of electron attachment to oligonucleotides is the phosphate group. A MIKE spectrum for collisions with Neon is needed for comparison to understand whether the electron capture to P=O can induce “extra” fragmentations. Summary for electron attachment to nucleotides In conclusion, an isolated nucleotide with an extra electron was generated in collisions between nucleotide anions and sodium vapor and identified with a mass spectrometer. This is the first time the dianions produced by electron attachment has been detected. The excess electron is necessarily in a covalent orbital. The dianion is surprisingly long-lived (microseconds) which makes it a potentially hazardous reagent for chemical reactions. We also show that electron attachment to nucleotide anions results in loss of hydrogen from the nucleobase N–H. Dehydrogenation is most likely for guanine, and this nucleobase is therefore most sensitive to electron bombardment. In an aqueous environment the [nucleobase–H]– anion is rapidly protonated but when located within a DNA double helix, where the exposure to water molecules is less, it may survive long enough to cause severe structural changes in the Watson-Crick base pairs. To judge the importance of this mutation mechanism, rate constants for proton transfer from water and for base mispairing are needed. For microsolvated AMP anions the total dianion formation cross sections are monotonically increasing with the number of water molecules. The missing cluster dianions indicate there is a non-statistical process involved in the electron capture process. An
S P
B
?
SP
B
?
S P
B
e− e− ?
e− ?
Scheme 3.4 Electron capture to mononucleotide (left) and oligonucleotide (right). B denotes base, P phosphate group and S sugar.

Biomolecular ions in an accelerator mass spectrometer _____________________________________________________________
37
excess energy of 1.3 eV is estimated to be transferred into the dianions along with the electron capture. Trianions of oligonucleotide can also be produced in collisions with Na. The formation cross sections for trianions of oligonucleotides with different base are almost identical indicating the capture site for electrons is the phosphoric acid P=O bond.
3.4 Electron capture to peptide cations Electron capture cross sections by cations in collisions with C60 and Na The measurements of electron capture and loss is a classical discipline in ion atom collision studies and information about atomic structure and dynamics can be obtained from such studies. Recently there has been a growing interest in charge permutation reactions in collisions between cluster ions or large molecular ions with gases or with clusters. Electron transfer processes are reasonably well understood for atomic systems [122] but have not been fully investigated for collisions between more complex systems such as large molecule- or cluster-ions and atoms, molecules and clusters in the gas phase. Electron capture by multiply charged ions in collisions with C60 became an active field of investigation since the pioneering experiments of Walch et al. [123]. For further references see e.g. Cederquist et al. [59]. The over-the-barrier model has been very successful in estimating capture cross-sections for such collisions and, recently, it has been generalized to treat cases with polarizable projectiles and targets of finite geometrical dimensions [60]. An example here is the successful modeling of target charge state distributions in slow, non-fragmenting, C60
q+ –C60 collisions [60]. Electron capture in collisions between singly charged alkali clusters and Cs was studied as a function of cluster size and a strong dependence of the cross-section on the energy defect as well as on the collision energy was found [124]. Theoretical estimates for these cross-sections were performed within a microscopic framework called nonadiabatic quantum molecular dynamics [125], and the importance of the cluster temperature on charge transfer noted. Fig.3.16 Spectrum obtained for 100 keV collisions between [BK+2H]2+ and Na.

Electron capture to peptide cations _____________________________________________________________
38
A subgroup of electron transfer processes is the so-called charge inversion reactions. In these reactions the charge of the molecular ion is changed from positive to negative or vice versa in collisions with neutral gas atoms or molecules. Since the electron-transfer processes are nearly vertical, the charge-inverted ions are often highly vibrationally excited according to the Frank-Condon factors and their fragmentation may provide structural information. These processes, which are important in molecular mass spectrometry have recently been reviewed by Danell and Glish [126]. Hayakawa [127] has described how alkali metal targets can be used in charge inversion reactions to form negative ions from positive precursor ions. The present study focuses on measurements of electron capture cross-sections in collisions between multiply charged peptides or proteins with Na or C60. We find that the magnitude of the cross-sections depends strongly on the size of the collision partners, on ionization energies, on projectile charge state and on collision energy. We have applied the generalized over-the-barrier model to qualitatively account for the measured dependencies of the geometrical extensions of the collision partners, the target ionization energy and the projectile charge states. We have, further, deduced approximate values for the critical distances within which ubiquitin projectiles fragment in collisions with Na and C60. A spectrum showing electron capture in collisions between doubly protonated bradykinin [BK+2H]2+ and Na is shown in Figure 3.16. The dominant product peak in the
Fig.3.17 Spectra obtained for 350 keV collisions between [Ubi +7H]7+ and O2, C60 and Na.

Biomolecular ions in an accelerator mass spectrometer _____________________________________________________________
39
mass spectrum corresponds to [BK+2H]+ but peaks corresponding to collision-induced dissociation CID are also observed. Our mass resolution is not sufficient for differentiating between the masses of [BK+2H]+ and [BK+H]+. We can therefore not directly exclude that the peak corresponds to proton loss instead of electron capture. Control experiment in a Ne target where this peak is absent however strongly suggests that the peak should be assigned to electron capture. Electron capture should be much easier in the case of cations than that of anions because of the strong Coulomb attraction. Bradykinin is a peptide consisting of nine amino acid residues with a mass of 1062 amu. Spectra showing electron capture and loss in collisions between seven times protonated ubiquitin [Ubi +7H]7+ and O2, C60 and Na are shown in Figure 3.17. Ubiquitin is a protein consisting of 76 amino acid residues with a mass of 8.6 kamu. In all three spectra a background originating from CID is observed. On top of this, electron loss in O2, loss and capture in C60 and electron capture in Na are observed. Electron loss by cations of amino acid peptides or proteins in collision with O2 has been dealt with in ref [128,129] and there it was argued that electron transfer to O2 resulting in O2 plays an important role. The electron loss cross-section for [Ubi+7H]7+ colliding with O2 was determined to be ∼100 Å2 but only ∼6 Å2 for collisions with C60. Electron capture reactions are the dominating reaction channels for the targets Na and C60. Independent of theoretical approach the target ionization potential, the binding energy of the transferred electron and the relative particle velocity are important parameters. Since the target atoms (or molecules) are assumed to be in their electronic ground state before the collision, the ionization potentials of 5.138 eV for Na and 7.6 eV [130] for C60 were assumed. The projectile ion has a quasi continuum of excited states and we therefore expect the dominating electron capture process to be near-resonant which implies that the dependence on collision velocity is weak for low velocities. That was confirmed from the measured electron capture cross-section versus collision energy for [Ubi +7H]7+ interacting with Na (Fig. 3.18). It should however be noted that since the electron transfer process in reality is non-resonant the capture cross section will most likely approach zero at very low relative velocities. The two targets (Na and C60) also differ
Fig.3.18 Electron capture cross-section for collisions between [Ubi+7H]7+ and Na as a function of acceleration voltage.

Electron capture to peptide cations _____________________________________________________________
40
with respect to geometrical size. The radius of the C60 cage structure is 3.5 Å while the Na atom in this comparison is a point-like particle. The charge state dependence of the capture and loss cross-sections is illustrated in Figure 3.19, where m/q spectra are shown for ubiquitin with charge states from 5 to 11 interacting with C60. The cross section for electron loss is almost independent of charge state (∼6 Å2) while the electron-capture cross section increases with charge state. In Figure 3.20 is shown the electron-capture cross section dependence on charge state for collisions between ubiquitin with Na or with C60. The electron-capture cross section is around a factor of eight larger for interactions with Na compared to C60, and increases in both cases almost linearly with the charge state of the projectile ion.
Fig.3.19 Spectra obtained for collisions between protonated ubiquitin and C60 for charge states from 5 to 11.

Biomolecular ions in an accelerator mass spectrometer _____________________________________________________________
41
To obtain some insight into the electron capture mechanism we have applied the generalized over-the-barrier model for electron transfer between conducting spherical objects. The protonated, multiply charged ubiquitin ions are approximated by a conducting sphere with a radius of 16.0 Å. The estimate of the ubiquitin radius is based on its crystal structure which is determined by X-ray diffraction analysis. The multiply charged ubiquitin ions are assumed to possess enough internal energy to allow the excess protons to be mobile and to move quickly between the basic groups. The ion is, to a good approximation, spherical and we therefore use a simple conducting sphere model to describe the ions. Compared to the radius of projectile ions the radius of Na is considered to be 0. So, the potential which the electron feels at distant r is simplified as
))a(rr
a21
aRra
Rra
rR1
rq(eV(r) 222
3
22
−−
−+−
−−−= (9)
where R is the distance from Na+ to the center of projectile ions, q is the charge state of projectile ion and a is the radius of projectile ions. The first two terms of Eq. (9) are the interactions between the active electron and projectile ions and Na+, the third and fourth are between the electron and the image charge of Na+ and the last term is the interaction between the electron and its own image charge. The potential is shown in fig. 3.21 and has a maximum Vmax at r=rmax. The potential barrier decreases at closer distances. When it is below the ionization potential of the target gas, the electron can move from the target gas to the projectile ions. However, the ionization potential is shifted from the initial potential Ι to a Stark shifted ionization potential Ι* due to the nearby projectile ions.
∆III * += , where ))a(RR
a21
Rq(e∆I 222
32
−−= (10)
5 6 7 8 9 10 110
50
100
150
200
250
300
350 Na C60
Charge state q
Cro
ss s
ectio
n [Å
2 ]
Fig.3.20 Electron-captuross sections for collisions between protonated ubiquitin and C60 (circles) or Na (squares) as a function of projectile charge state. Full curve and broken line: cross sections calculated using the extended over-the-barrier model for electron capture.

Electron capture to peptide cations _____________________________________________________________
42
The potential curve shown in fig.3.21 is calculated for R=21.6 Å and q=5. From Eq. (9) Vmax=−8.13 eV and ∆Ι =−3.01 eV from Eq (10), therefore the Stark shifted ionization potential Ι* is equal to Vmax then the critical distance Rc between the two particles is 21.6 Å. Details can be seen in ref. [60]. For C60 as the target the radius is 3.8 Å. The cross-section for pure electron transfer from the target particle to the projectile ion, σc is defined as
)Rπ(Rσ 2f
2cc −= (11)
where Rf is the largest distance at which projectile fragmentation occurs. Calculated Rc values for collisions between protonated ubiquitin, with charge states n between 5 and 11, and Na or C60 are given in Table 3.4. The maximum distance between projectile and target particles at which fragmentation takes place, Rf, was used as a fitting parameter and the curves shown in Figure 3.20 show the best fit for Rf values of 20.56 Å and 21.79 Å. These values are reasonable since for collisions between “spherical” ubiquitin and C60, Rf corresponds to a surface-surface distance of about 2 Å. In such a collision several eV can be transferred to the ubiquitin ion leading to fragmentation [131]. In comparison, for collisions with Na the fragmentation distance corresponds to a distance between the ubiquitin surface and the Na nucleus of around 5 Å. This value is somewhat larger than expected and could indicate deviation from a spherical shape of the ubiquitin ion. However the total fragmentation cross section based on this Rf value σf = π20.562 = 1350 Å2 is in good agreement with cross section values based on drift tube ion mobility spectrometry [132]. However the ion mobility measurements also showed that the total fragmentation cross section depended on the charge state of the ubiquitin ion and the use of the same Rf value for all charge states is questionable. On the other hand, the calculated Rc values also depend on the size of the ubiquitin ion and therefore size and charge variations cancel to first order. Again these model calculations are crude and only serve as a framework for a discussion of the important parameters which enter the description of
16 18 20-10
-9
-8
-7
-6
-5
V(r)
(eV)
r (Å)
I
∆I
Vmax=I+∆I
Fig.3.21 The potential calculated for the critical distance.
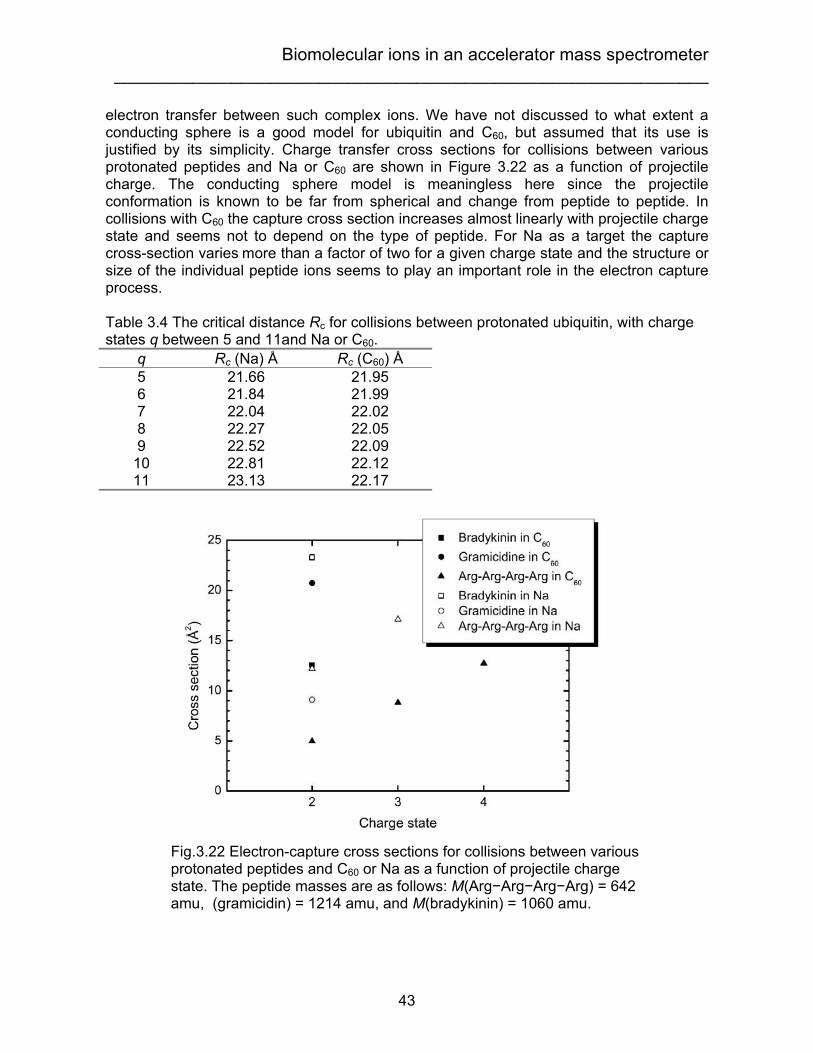
Biomolecular ions in an accelerator mass spectrometer _____________________________________________________________
43
electron transfer between such complex ions. We have not discussed to what extent a conducting sphere is a good model for ubiquitin and C60, but assumed that its use is justified by its simplicity. Charge transfer cross sections for collisions between various protonated peptides and Na or C60 are shown in Figure 3.22 as a function of projectile charge. The conducting sphere model is meaningless here since the projectile conformation is known to be far from spherical and change from peptide to peptide. In collisions with C60 the capture cross section increases almost linearly with projectile charge state and seems not to depend on the type of peptide. For Na as a target the capture cross-section varies more than a factor of two for a given charge state and the structure or size of the individual peptide ions seems to play an important role in the electron capture process. Table 3.4 The critical distance Rc for collisions between protonated ubiquitin, with charge states q between 5 and 11and Na or C60.
q Rc (Na) Å Rc (C60) Å 5 21.66 21.95 6 21.84 21.99 7 22.04 22.02 8 22.27 22.05 9 22.52 22.09
10 22.81 22.12 11 23.13 22.17
Fig.3.22 Electron-capture cross sections for collisions between various protonated peptides and C60 or Na as a function of projectile charge state. The peptide masses are as follows: M(Arg−Arg−Arg−Arg) = 642 amu, (gramicidin) = 1214 amu, and M(bradykinin) = 1060 amu.
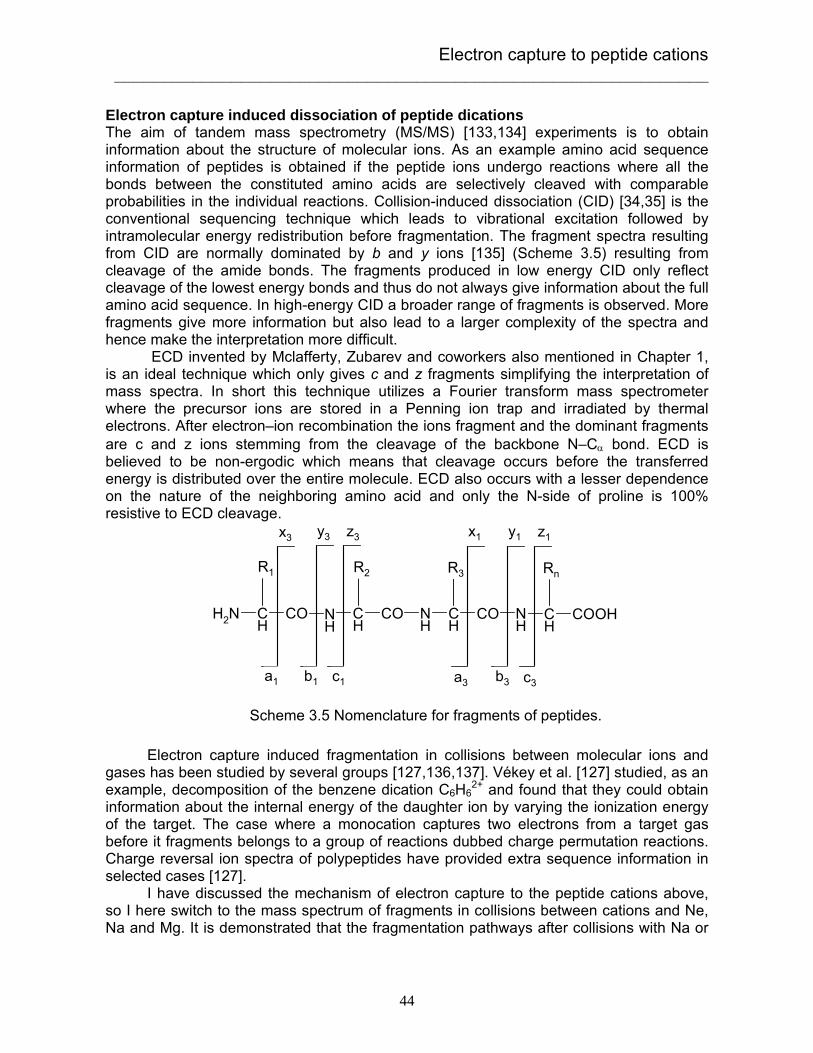
Electron capture to peptide cations _____________________________________________________________
44
Electron capture induced dissociation of peptide dications The aim of tandem mass spectrometry (MS/MS) [133,134] experiments is to obtain information about the structure of molecular ions. As an example amino acid sequence information of peptides is obtained if the peptide ions undergo reactions where all the bonds between the constituted amino acids are selectively cleaved with comparable probabilities in the individual reactions. Collision-induced dissociation (CID) [34,35] is the conventional sequencing technique which leads to vibrational excitation followed by intramolecular energy redistribution before fragmentation. The fragment spectra resulting from CID are normally dominated by b and y ions [135] (Scheme 3.5) resulting from cleavage of the amide bonds. The fragments produced in low energy CID only reflect cleavage of the lowest energy bonds and thus do not always give information about the full amino acid sequence. In high-energy CID a broader range of fragments is observed. More fragments give more information but also lead to a larger complexity of the spectra and hence make the interpretation more difficult. ECD invented by Mclafferty, Zubarev and coworkers also mentioned in Chapter 1, is an ideal technique which only gives c and z fragments simplifying the interpretation of mass spectra. In short this technique utilizes a Fourier transform mass spectrometer where the precursor ions are stored in a Penning ion trap and irradiated by thermal electrons. After electron–ion recombination the ions fragment and the dominant fragments are c and z ions stemming from the cleavage of the backbone N–Cα bond. ECD is believed to be non-ergodic which means that cleavage occurs before the transferred energy is distributed over the entire molecule. ECD also occurs with a lesser dependence on the nature of the neighboring amino acid and only the N-side of proline is 100% resistive to ECD cleavage. Electron capture induced fragmentation in collisions between molecular ions and gases has been studied by several groups [127,136,137]. Vékey et al. [127] studied, as an example, decomposition of the benzene dication C6H6
2+ and found that they could obtain information about the internal energy of the daughter ion by varying the ionization energy of the target. The case where a monocation captures two electrons from a target gas before it fragments belongs to a group of reactions dubbed charge permutation reactions. Charge reversal ion spectra of polypeptides have provided extra sequence information in selected cases [127]. I have discussed the mechanism of electron capture to the peptide cations above, so I here switch to the mass spectrum of fragments in collisions between cations and Ne, Na and Mg. It is demonstrated that the fragmentation pathways after collisions with Na or
NH2 CH
CO NH
CH
CO NH
CH
CO NH
CH
COOH
R1 R2 R3 Rn
a1 b1 c1
x3 y3 z3
a3 b3 c3
x1 y1 z1
Scheme 3.5 Nomenclature for fragments of peptides.

Biomolecular ions in an accelerator mass spectrometer _____________________________________________________________
45
Mg where electron capture plays a dominant role also includes those found in ECD. It indicates that also electron capture by peptide ions in collisions with atoms with low ionization energies leads to non-ergodic fragmentation as does capture of free electrons. This finding was actually predicted by McLafferty [138] before ECD was invented. When Ne is used as target gas, the fragment spectrum is similar to those obtained in high energy CID. Based on a naive picture of Na as a Ne atom and a loosely bound electron we have subtracted the Ne spectrum from the Na spectrum and obtained a spectrum consisting almost only of a capture peak and peaks that can be associated with c ions. In this way a simple fragment spectrum that gives the full amino-acid sequence of the peptide in question is obtained. We suggest that this method could be considered as an attractive alternative to ECD in single pass experiments where a free electron target is difficult to implement. The fragment spectra recorded for doubly protonated amidated Substance P ions that have collided with Ne or Na atoms are shown in Fig. 3.23. Substance P is a 11-mer peptide (Arg-Pro-Lys-Pro-Gln-Gln-Phe-Phe-Gly-Leu-Met) which in its doubly protonated form has a mass of 1348 amu. It has been used in the present investigations as a test case since its cleavage pattern has been previously studied by ECD. The signal intensity in Fig. 3.23 is normalized to the target thickness and the intensity of the initial beam. It is clearly seen that the electron capture peak, [M + 2H]•+ is the dominating one in the Na spectrum while it is very weak in the Ne spectrum. The electron-capture cross section of
0 200 400 600 800 1000 1200 14000
2
4
6
8
10
12
0
2
4
6
8
10
12
14
Ne
Na
c10
y10x9z9a8y8
b7a7a4a2
a3
Inte
nsity
m/q
c4
[M+2H]+
y10z9 c10c9
c8a8
c7c6
a7
a6
a82+
a4
a72+
a3c2a2
Fig.3.23 CID spectra of Substance P obtained with Na and Ne target gas.

Electron capture to peptide cations _____________________________________________________________
46
doubly protonated Substance P has been measured in the Na target, and the cross section for this electron capture reaction is found to be ∼13Å2. In both spectra, peaks that are characteristic for high energy CID are observed with comparable intensities. It is, however, also clearly seen that there is a strong enhancement of peaks corresponding to breaks of the N–Cα bonds the so-called c ions (c6, c7, c8, c9, c10) in the Na spectrum, peaks that are the dominating ones in ECD spectra. The main difference between the two target gases is the ionization energy, which is 5.14 eV for Na while it is 21.56 eV for Ne. This, together with the finding of a doubly protonated ion that has captured an electron in Na but not in Ne, suggests that the difference between the two cases is due to electron capture in the Na target. In Fig. 3.24 a difference spectrum is shown. This spectrum is very similar to the fragmentation spectrum obtained for Substance P in ECD. Mainly c ions are found which facilitates the sequence determination. However, the peaks corresponding to c1 and c3 are as in ECD, missing. It is well known that ECD is unable to break the amine backbone bonds on the N-terminal side of proline [36]. The predominance of N-terminal c ions can, as in ECD, be understood from the amino acid sequence of Substance P. The N-terminal amino acid is arginine which is likely to carry the charge since it is the most basic amino acid. The complementary z fragments are hence neutral and can not be detected in the present experiment. The fragment spectra recorded for dications of a tryptic decapeptide from signal recognition particle (SRP) of Saccharomyces cerevisiae that have collided with Ne or Na atoms are shown in Fig. 3.25. The (SRP) peptide (Ser-Asp-Arg-Glu-Tyr-Pro-Leu-Leu-Ile-Arg) has in its doubly protonated form a mass of 1262 amu. As for Substance P the two spectra show several peaks that are characteristic of high energy CID spectra but again the electron capture product peak, [M + 2H]•+ is the dominating peak in the Na spectrum while it is very weak in the Ne spectrum. It should also be noted that several peaks which are characteristic for ECD spectra [139] are observed in the Na case. In contrast to the case of Substance P both c ions and their complementary z ions are observed. This can
0 200 400 600 800 1000 1200 1400
0
2
4
6
8
10
12
14
c6 c7 c8c9 c10c1 c2 c3 c4 c5
[M+2H]+
Y(N
a)-Y
(Ne)
m/q
Substance PRPKQQFFGLM
Fig.3.24 Difference between two spectra of Substance P. The spectrum was obtained by subtracting the spectrum with Ne from the one with Na.

Biomolecular ions in an accelerator mass spectrometer _____________________________________________________________
47
be explained by the presence of two arginine amino acids in the SRP peptide as pos. 3 and 10 one of which is most likely to carry the charge. In the ECD spectrum of SRP in [139] the dominating peaks correspond to z6
+, c7+, c9
+ and [M + 2H]•+ ions peaks that are also prominent in the Na spectrum in the present experiment. We also clearly observe peaks that can be related to z9 and x9 ions in the Na spectrum. These peaks are almost absent in the ECD spectrum in [139]. The difference between ECD and our high energy electron capture-induced fragmentation measurements is not understood at present. It is also interesting to compare the present SRP (Na) spectrum with a spectrum obtained with the method “hot electron capture dissociation” (HECD) [139]. In HECD electrons with an energy of around 10 eV first excite the molecule, then thermalise before they are captured as low energy electrons. In HECD spectra some of the most abundant fragments are due to secondary fragmentation caused by the large electron energy which is transferred to the molecule. In the HECD SRP spectrum a peak corresponding to a z4 fragment that has lost a side chain group from leucine and become a so called w4 ion is a prominent peak. In the present Na spectrum this peak is missing which indicates that high energy electron capture-induced fragmentation in an alkali metal target is closer to ECD than to HECD. This observation is in good accordance with a simple picture of the capture process where a low energy quasi-free electron is transferred from a loosely bound state on the Na atom to the dication.
Fig.3.25 CID spectra of SRP obtained with Na and Ne.
Na
Ne

Electron capture to peptide cations _____________________________________________________________
48
In order to investigate the role of the ionization energy of the target atom we have performed fragmentation studies of Substance P and SRP also in a Mg target. The ionization energy of Mg is 7.64 eV while it is 5.14 eV for Na. In Fig. 3.26 and 3.27 we compare the relative intensity of fragment ions normalized to the intensity of [M + 2H]+ ions
Fig.3.27 Relative intensity of fragment ions of SRP with Na and Mg target gases. The intensities were normalized to the electron capture intensity.
Fig.3.26 Relative intensity of fragment ions of Substance P with Na and Mg target. The intensities were normalized to the electron capture intensity.

Biomolecular ions in an accelerator mass spectrometer _____________________________________________________________
49
for both Substance P and SRP in Na and Mg. It should be noted that the relative peak heights are similar in the two target gases. The correlation factor between the relative intensities of c and z fragments is 0.86 for both precursor ions. Thus, the binding energy of the active target electron does not seem to play a major role as long as electron capture is the dominating reaction channel in the collision. This observation supports the idea about a non-ergodic character of the electron capture-induced fragmentation process. Summary The study of collisionally induced electron transfer in collisions between protonated proteins or peptides and Na or C60 shows a dependence which is similar to that observed for atomic species. The cross section for electron transfer between multiply-charged ubiquitin and Na is as large as 200 Å2 while the total fragmentation cross section is about 1300 Å2 indicating that only glancing collisions leads to electron transfer without fragmentation. A precise estimate of the electron-capture cross section is difficult to obtain, but by describing the electron transfer process in the framework of the over-the-barrier model we have obtained qualitative agreement with measured cross section values for collisions between multiply charged ubiquitin with Na and C60. For the studies of fragmentation, we observe cleavage of most backbone amide bonds. It is argued that the Na spectrum of Substance P can be considered as a sum spectrum of a high energy CID part and an ECD part. The high energy CID part can be obtained separately by using Ne as a target and the difference spectrum is almost identical with an ECD spectrum. The present fragmentation method is thus complementary to ECD and can be used in beam experiments where low energy electron targets are difficult to implement.

Biomolecular ions in ELISA _______________________________________________________
50
Chapter 4 Biomolecular ions in ELISA 4.1 Decay of isolated biomolecular ions Canonical and microcanonical ensembles For a small system in contact with a large system with fixed energy, the small system is called a canonical system (fig.4.1). For the small system the probability P for energy E is
)(EE)(Eρ(E)P(E)
0
0
Ω−Ω
∝ (1)
where ρ is the level density of the small system, Ω is the level density of large system and E0 is the total energy. We assume that the energy E is a small fraction of the total energy so that
E)(E0 −Ωln may be expanded to first order in E,
)(EE
E)(EE)(E
000
0 Ω−≅Ω
−Ωln1ln
dd (2)
the second term in eq. (2) is equal to Tk
1B
, so eq. (1) becomes
TkE
Bρ(E)eP(E)−
∝ (3) After normalization the canonical distribution is obtained
/Qρ(E)eP(E) TkE
B
−
= , (4)
where ∫−
= dEρ(E)eQ TkE
B which is also known as the partition function. So in the canonical distribution the temperature is fixed, but there is a spread in energy. The decay rate is given by eq. (5)
ρ(E))Eρ(Evk(E) b−
= (5)
where v is the frequency factor and Eb is the binding energy (assuming no reverse barrier) of a small fragment. This equation can also be derived from detailed balance, provided that the system is in statistical equilibrium [140-142]. The decay rate as a function of temperature T is
∫−
=−
ρ(E))Eρ(Ev
Qρ(E)edEk(T) b
TE/kB
(6)
The Arrhenius law in terms of temperature is

Decay of isolated biomolecular ions _______________________________________________________
51
TkE
B
b
vek(T)−
= (7) The equation above is derived assuming a canonical ensemble. But for decay of isolated ions, eq. (7) is not valid because the total energy is conserved not the temperature. A microcanonical temperature is introduced to overcome this difficulty [143-147]. A microcanonical ensemble is the ensemble representing a system in statistical equilibrium at a well defined energy (fig.4.1) and for a system with excitation energy E and level density ρ(E), the microcanonical temperature Tm is defined as
ρ(E)dEd
Tk1
mB
ln= (8)
in analogy to the definition of the canonical temperature. To calculate the relation between E and Tm we consider a canonical system which is in equilibrium with a heat bath at temperature Tm. The average energy for this system is
)dεεP(ε)(Tε0
m ∫∞
= (9)
where mBTkε
ρ(ε)eP(ε(−
∝ . From differentiation of )(εP with respect toε the most probable value pε is seen to be equal to the energy E of the system. So what we shall do next is to make explicitly the relation between pε and the average energy ε at temperature Tm. To calculate the integral in eq.(9), the integrand is approximated by a Gaussian in eq. (10)
D(E )
S(E 0! E ) few degrees of freedom
other degrees of freedom
Fig.4.1 (Left) a canonical system in equilibrium with a heat bath, (Right) a microcanonical system in equilibrium with its own heat bath.

Biomolecular ions in ELISA _______________________________________________________
52
)./)(exp(1)( 22
2σ
πσ2εε
2εP p0 −−= (10)
The width σ is mmB TCk=σ , where Cm is the derivative of E with respect to Tm, i.e., Cm is the microcanonical heat capacity. Because of the skewness of the canonical energy distribution, a skewness factor S(ε) is introduced
))1()(61exp()( 2
3
σ−
−=E
εεεS p dd (11)
Substituting P(ε) in eq. (9) with eq. (10) and (11), we have
mB0m TkEεεSεεP)(Tε +≅= ∫∞
d)()(0
(12)
We also can have the relation between the canonical (Cc) and microcanonical heat capacities in eq. (13)
Bmc kCC += (13) From eq. (5) an expansion is made
)E21ρ(E
EE
ρ(E))Eρ(E
bbb −−≅
−lnln
dd (14)
The expansion is evaluated at the average energy before and after the unimolecular decay. According to the definition of microcanonical temperature (eq. (8)) we have the decay rate for microcanonical ensembles by substituting (14) into (8)
Fig.4.2 Microcanonical caloric curve of tryptophan.

Decay of isolated biomolecular ions _______________________________________________________
53
)T/kE(vk(E) eBb−= exp (15) where mbme /2CETT −= is called the effective temperature. In fig.4.2 the microcanonical caloric curve for tryptophan is shown (see appendix for details). The similar formulas were also derived by Klots [148,149] known as finite-heat-bath theory. Depletion and 1/t decay law For an isolated ensemble, the energy distribution g(E) at time 0 is depleted by a factor exp(-k(E)t) at a later time t. So the emission rate is given by
∫ −= k(E)t)(dEk(E)g(E)I(t) exp (16)
If )()( 0EEEg −= δ , an exponential emission rate is observed only in this condition. However if g(E) varies much more slowly than the decay rate it is not exponential decay any more. Comparing g(E) with k(E)exp(-k(E)t) (also called the weight function), the latter changes rapidly and we can find the maximum of weight function from the derivative with respect to E
0k(E)t))((k(E)dEd
=−exp .
We have
0k(E)t)((E))k(E)tk'k(E)
(E)k'( =−− exp
showing that the weight function has a maximum at 1/t)k(Emax = . So g(E) can be pulled out of the integral as a factor g(Emax). Also, the ratio k’/k=dlnk/dE varies slowly compared to k, and the integral is therefore approximately given by
∫ ∫∫ −− ≅−=−=−)(Ek')k(Etkt)(d(kt)
k'ktkkt)d(k
k'kkt)(dEk
max
max11 explnexpexp
This leads to eq. (16) as a 1/t decay law
)(Ek')k(E)g(EtI(t)
max
maxmax
1−= (17)
According to our assumption, the variation of the last two factors is much slower than t-1, and the time dependence of the emission rate is therefore close to a t-1 distribution. Tmax is the temperature conresponding to Emax is time dependent indicating that with increasing time, clusters with lower initial temperatures dominate the decay. This is a simple decay law. In contrast to the exponential, it does not contain a characteristic time. The law is also independent of the type of particle emitted, whether an electron or a massive fragment. However the 1/t decay law needs an absolute time zero when the ensemble was created. The depletion of an ensemble of isolated clusters is illustrated in Fig. 4.3. The main contribution to I(t) comes from a region around the energy Emax, which decreases slowly with time, and the number of decays within a small time interval dt is given by the hatched area of width -dEmax. There are small deviations from the n= −1 power law because of small contributions to the power of the last two factors in eq.(17).

Biomolecular ions in ELISA _______________________________________________________
54
For the last factor
)k(EdE
d1
)(Ek')k(E
maxmax
max
max
ln=
and inserting )T/kE(v)k(E maxBbmax −≅ exp into equation above
δ
b
2maxmaxB
max
max tE
TCk)(Ek')k(E −∝= (18)
The heat capacity C is also increasing with temperature but it approaches an asymptotic value at high temperatures. At temperatures below 1000 K it scales with a fairly low power of Tmax as η
maxmax TC ∝ (for example η=0.4 in the case of tryptophan, see fig.4.2). So, we need to know how η2
maxT + scales with time t. A mathematical trick is applied. In order to know the power of t we have to calculate the value of the following
expression, η2maxT
dtdt +ln . For example, if one would like to know how t-1 scales with
time t, one calculates 1tdtdt −ln , which gives the value −1.
Gη2
t1
(vt)1η)t(2
ln(vt)1η)(2
dtdtT
dtdt η2
max+
−=+−=+=+
lnlnln (19)
where (vt)G ln= is the Gspann parameter. Normally G∼20 when t∼10 ms. So, the last term adds −0.1 to the 1/t decay.
10 12 14 16 18 200.0
0.2
0.4
0.6
0.8
1.0
t = 1 ms t=10 µs
t=0
g(E
)
Internal energy (eV)Emax(t)
Fig.4.3 Illustration of depletion at time t of an energy distribution. The hatched area indicates the additional depletion during a small time interval dt.

Decay of isolated biomolecular ions _______________________________________________________
55
Now we consider the variation of power due to g(Emax). In a collision process, the high-energy tail of the energy distribution is due to scattering with the target gas. The distribution in energy transferred for a elastic collision is proportional to E−3/2
calculated by assuming the potential is a screened Coulomb potential proportional to R−2 [150]. The variation for power-law potentials is between an E−2 dependence for Coulomb potential and E−1dependence for a hard-sphere potential. Applying the same trick to g(Emax) we have
dtTtd
TdEd
Ed)g(Ed)g(E
dtdt max
max
max
max
maxmax
lnlnln
lnln
ln = (20)
The first term gives −1.5 from the energy distribution after collisions, the second
term gives max
maxmax
E)TC(E is around 2 (for example for tryptophan this value is 1.6
at around 1000 K) and the last term which is known from eq. (19) gives −1/G. So the total contribution of g(Emax) is around 3/G. it should be noted that g(Emax)
has the opposite sign to )(Ek')k(E
max
max . It can be rationalized in the way since g is a
decreasing function and the argument then decreases with time. So, including all the corrections the final result is that the power should be very close to n=−1. Quenching by radiative cooling Photon emission is often a competing process. If the hot molecular ions radiate on the time scale of the decay, their energy decreases and particle emission or dissociation is quenched nondestructively. A strong deviation from 1/t will appear. For small ions, emission of a single photon is usually sufficient to quench particle emission. Normally, the rate of photon emission varies more slowly with excitation energy than the decay rate and the photon energy is so low that the effect of emission can be considered as continuous cooling of the molecule. This is certainly fulfilled for IR radiation from vibrations. From the assumption above, with radiative cooling the energy E(t) at time t is given by tPEE(t) r−= , where rP is the radiation power. Now eq.(15) becomes
∫ ∫−= )))dt'k(E(t'((E)dEk(E(t))gI(t)t
0
exp (21)
with the Arrhenius law:
)t/()T/kE(v))C
tP(T/kE(vk(E(t)) eBbr
eBb cτ−−=−−= expexpexp
where ττ c
GCTPG
CTkPE1
e
r2
eB
rb ===
τ is the cooling time constant. Inserting into eq.(21)

Biomolecular ions in ELISA _______________________________________________________
56
∫ ∫ −−−= ))dt'/t'()k(E()g(E)t/(dEk(E)I(t)t
0cc ττ expexpexp (22)
After integrating the last term in eq.(22) we get ))t/(k(E)(1( cc ττ −−− expexp . So insertion into eq.(22) gives
∫ −−−−= ))t/(k(E)(1(dEk(E)g(E))t/(I(t) ccc τττ expexpexp (23)
Again the weight function is strongly peaked at ))t/((1
1)k(Emaxcc ττ −−
=exp
or
1bmaxB )))t/((1(v(ETk −−−= cc ττ expln
So the end result for eq. (21) is given by
1))(t/(1)g(E
)(Ek')k(EI(t) max
max
max
−≅
cc ττ exp (24)
According to Eq. (24), cooling is not important at short times, t<<τc, so the decay follows a power law, and the characteristic emission temperature decreases slowly due to depletion of the hottest clusters by decay. In the opposite limit, t∼τc depletion becomes unimportant and Tmax approaches a constant value, kBTmax= Eb/G. However, due to the cooling, the intensity in Eq. (24) decreases nearly exponentially with a lifetime τc. Conclusions For an isolated ensemble the excitation energy is conserved rather than temperature. As suggested by Bohr and Heisenberg energy and thermodynamic temperature may be regarded as complementary quantities as in the concept of position and momentum. In order to use the Arrhenius law to calculate the decay rate, a microcanonical temperature is introduced. The relation between energy in the canonical system and energy in the microcanonical system is given by eq.(12) or the relation between the heat capacities in eq.(13). Now the decay rate for excitation energy E has a similar formula as the ‘conventional’ Arrhenius except that the temperature now is replaced by the effective temperature. For an isolated system the energy distribution cannot be maintained as a canonical distribution if the molecules dissociate and so the decay of the ensemble depends on the initial energy. This energy dependence for the decay is different from the decay of the canonical system, e.g. BIRD experiments in the rapid energy exchange limit, where all ions decay by a common factor. The exponential decay can only be observed when the temperature distribution is narrow in a microcanonical system. In the case where the temperature distribution is broad the decay follows a power law, e.g. t−n with n∼1. Radiative emission is a competing channel with fragmentation decay. The power law decay can be cut off by an exponential decay with a longer time scale due to the radiative cooling. Recently, power law decay and radiative cooling have been found in fullerenes [146,151]. However in the next section, I will show some cases for amino acids and nucleotides that decay following a power law and for which radiative cooling is important.

Power law decay _______________________________________________________
57
4.2 Power law decay of collisionally excited amino acids and oligonucleotides and radiative cooling A storage ring is well suited for lifetime measurements because an absolute time scale is established by the ion injection, and the decay can easily be recorded turn by turn over several orders of magnitude in time. It covers from the microsecond revolution time to a storage time of several seconds. However it can be difficult to have a well-defined excitation energy of the injected ions. Photoabsorption has a narrow absorption band and therefore may not results in the desired temperatures. On the other hand in multiphoton absorption, electron impact or collisional activation process there is a considerable spread in excitation energy. Moreover, most conventional ion sources such as sputter sources or plasma sources produce ions with ill-defined internal excitation. It is therefore of interest to investigate what information can be obtained from measurements on ions with a broad distribution in internal energy. As discussed above with a wide-spread in the internal energy distribution the decay follows a 1/t law and radiative cooling from vibrational modes competes with the decay. When the decay is faster than radiative cooling, the characteristic quenching time τc can be observed. Therefore for longer lifetime decay, it can only be studied in the condition where the internal energy distribution is maintained either by photoabsorption or emission [38.39,152,153] or gas collisions [154]. Next I will show examples first from amino acids followed by results from oligonucleotides.
Fig.4.4 A gas inlet is mounted after the ion trap. Ions can collide with gas when extracted to the Einzel lens.
Ne gas

Biomolecular ions in ELISA _______________________________________________________
58
Power law decay of amino acid cations In order to produce a broad spectrum of excitation energies we introduced Ne gas into the last chamber, as illustrated in the fig.4.4. We also tried heavier gases, Ar and Xe, but they were found to be less effective. After extraction the ions were accelerated towards the Einzel lens with a potential on the first lens of about −300 V, and during this acceleration they may collide with Ne atoms. Even for the heaviest ions, tryptophan with mass number 205, the centre-of-mass energy in collisions with Ne can be up to 25 eV, and the collisions should therefore lead to a long tail in the distribution in internal energy where the decay should be faster than the radiative cooling and thus the quenching time τc may be measured. The neutral fragments originate partly from decay of metastable ions, partly from collisions with the rest gas in the ring. Gas collisions dominate at long times, as illustrated by the spectrum in Fig. 4.5, recorded with an injection rate of 0.05 Hz. Metastable ions, produced after collisions in the source, decay within several fractions of a second and the rest of the spectrum shows an exponential decay due to depletion of the ion bunch by collisions with residual gas with a lifetime of 9.3 s. But in the following experiments we only record the spectrum up to 80 ms and therefore the depletion due to collisions with the residual gas in ELISA is negligible and neutrals count rate from gas collisions can be considered as a constant.
Fig.4.5 Time spectrum for 20 s storage of protonated tyrosine. Except for the first fraction of a second, the yield of neutrals is dominated by dissociation induced by collisions with the rest gas, and the exponential decrease of the signal corresponds to the reduction of the number of stored ions.

Power law decay _______________________________________________________
59
In order to show the power law decay more explicitly, a log-log plot is used to show the spectrum and a semilog plot to illustrate the details of the spectrum. In fig.4.6 the spectrum for phenylalanine is shown both in a log-log plot and in a semilog plot. The logarithmic time scale is useful for observation of the power-law behavior, and up to about 10 ms the yield follows closely the 1/t dependence given by the dashed curve. The yield is then reduced by radiative cooling and, as illustrated more clearly with the linear time scale, it approaches a constant value corresponding to fragmentation by gas collisions. Based on eq.(24) the spectrum is fitted with the function,
K1e
1)tN(I(t) t/δ +
−=
cτcτ
(25)
where N is a normalization constant and the factor δ
τ)(
c
t corrects the effective
power in the power law decay due to the first two factors of eq.(24). K is the background due to collisions with the residual gas. So, the most important parameter τc can be deduced from the experiments. In fig.4.7 the spectra for the three typical amino acids discussed in chapter 1 are shown and the fitting parameters together with those for phenylalanine are listed in table 1. Table 1 fitting parameters for eq.(25) Molecule δ τc (ms) Phe+H+ 0.02 13 Trp+H+ 0.03 17 Lys+H+ -0.05 13 Gly+H+ 0.13 15
Fig.4.6 Time spectrum for 100 ms storage of protonated phenylalanine. The dashed line in the log-log plot in the left panel is proportional to 1/t while the solid curve is a fit with the expression in equation (25) with the parameters given in Table 1. A semilog plot is shown in the right panel.

Biomolecular ions in ELISA _______________________________________________________
60
Fig.4.7 As Fig. 4.6 but for tryptophan (top), lysine (middle), and glycine (bottom).
Time (ms)

Power law decay _______________________________________________________
61
The amino acids containing an aromatic ring show similar results with the power close to unity while for lysine with a long linear side chain the slope is slightly steeper and for smallest amino acid glycine the slope is less steep. As discussed in section 4.1, the power should be close to 1 but in the case of glycine this power somewhat deviates from 1. This deviation may result from the competing fragmentation channels. It is well-known from studies of collision induced dissociation of biomolecules that usually there are many competing fragmentation channels, and that the relative abundance of fragment ions depends on the collision energy [155]. So the Arrhenius parameters can be quite different for different channels. Suppose the rate constants for two fragmentation channels are equal at some excitation energy, the channel with the higher activation energy will dominate for higher excitation energies and the one with the lower activation energy (and smaller frequency ν) will take over at lower excitation energies which leads to the neutral rate increasing at longer time thus the logarithmic slope will be reduced (see ref.[144]). Experiments have been done on tyrosine (with aromatic side chain), arginine (with linear side chain) and alanine (with methyl side chain). Similar results were observed. However the quenching times τc lie between 10 and 20 ms. For the radiative cooling, we approximate the vibrations by one-dimensional harmonic oscillators. Classically the power radiated from a charge q oscillating with frequency ω is given by
3
224
r 3cxq2ωP ><
=
in Gaussian units. We can adapt it to a quantum system by replacing <x2> with E/mω2. This leads to the power radiated at temperature T,
1T)ω/kexp(ω
3Mcq2ωP
B3
22
r −=
h
h (26)
where the last factor is the average excitation energy. Since the radiated power is proportional to this quantity, the energy will decrease exponentially for an isolated oscillator. The formula also shows the freeze-out of high-frequency transitions at low temperatures. As an example we have carried out calculations for protonated tryptophan. The structure was optimized at the B3LYP/6-31+G(d) level of density functional theory with the Gaussian 98 package. All calculated frequencies are real, which confirms that the stationary point is a local minimum on the potential energy surface. The resulting caloric curve was already presented in Fig4.2. In addition to the frequencies also the IR intensities were calculated from the dipole derivatives, which replace the square root of the factor q2/M in equation (26). However since the units of q2/M are in km/mole, a unit conversion has been applied to change to Gaussian units. The whole calculation process is given in the appendix D for further reference. Based on the microcanonical caloric curve, we calculate the cooling rate defined as Pr/CTe in eq. (22) and the relation between cooling lifetime τ and quenching time τc is τ=Gτc. In fig.4.8 the calculated radiative cooling rate is shown. The calculated value can be compared with the value determined by experiments when the Gspann parameter and

Biomolecular ions in ELISA _______________________________________________________
62
activation energy are known. We observed that the dominant decay channel for tryptophan is the loss of a side chain. So we performed the calculation again for the primary ions and also for the fragments. The calculation level is at B3LYP/6-311+G(2d,p) level and corrected for zero-point motion [non-scaled B3LYP/6-31+G(d) values]. The activation energy for this fragmentation channel is Ed=1.5 eV. In order to get the frequency factor an estimation was made on the decay rate for a well defined energy from a measurement of laser induced fragmentation in ELISA. We measure that the lifetime is in the range 5 ∼15 µs. From observation of a linear dependence on laser power we conclude that the signal results from absorption of a single photon from fourth harmonic photons, which gives a total excitation energy of 4.95 eV, including the thermal energy at room temperature. The frequency factor in the Arrhenius formula is then calculated to be v ∼ 2 × 10¹¹ s−1 [156]. So we obtained for the Gspann parameter at 17 ms, G=ln(νt) ∼22. The effective temperature is obtained by Te = Ed/kBG ∼ 800 K corresponding to an initial microcanonical temperature of 950 K. With these parameters the cooling rate has been calculated from our measured quenching rate and, as shown in Fig.4.8, there is excellent agreement with the theoretical calculation. The experimental uncertainty is indicated by the error bar but there is also a considerable uncertainty in the theoretical calculation, stemming mainly from the evaluation of the dipole derivatives. It is difficult to calculate the accurate value of IR intensities even though a high level calculation was used for small molecules. For example Nielsen et. al. [157] applied B3LYP/LANL2DZ1+diffuse level to calculate the infrared spectrum of Br−HCHBr.
Fig.4.8 Calculated radiative cooling rate Pr/CT for protonated tryptophan, compared with the rate derived from the measured quenching lifetime given in Table 1.
Temperature (K)

Power law decay _______________________________________________________
63
The agreement with experiments in some cases is 4 or 5 times less than the experiments. When the molecules are larger, the ab initio calculation is too time-consuming and semiempirical methods have to be applied instead. Price and Williams [158] multiplied dipole derivative by a factor of 3 from AM1 calculations which was based on the comparison with calculations from RHF and MP2 method tending to give 2.5 times lower than the experiments [159,160]. However they concluded it was not known if AM1 transition dipole multiplication factor was valid for larger ions. Moreover, for big molecules in the potential energy surface a large number of local minima exist which correspond to different conformations. The calculation thus may end at some local minima which has a quite different dipole derivative. Concerning the discussion above the method applied to calculate the radiative power is rather crude and can only give information on the magnitude of cooling lifetime. Power law decay of oligonucleotide anions Experiments have also been done on oligonucleotide anions. The major fragmentation channel is loss of a nucleobase as discussed in chapter 2. Williams and coworkers [38] measured the activation energy and preexponential factor for this fragmentation channel which was 1.03 eV and 1010.3 s−1 respectively (loss of neutral adenine). So the major difference from the amino acids is that the activation energy is lower (1.5 eV for tryptophan dissociation). For an ensemble with a broad energy distribution the radiative cooling starts to compete with decay at the effective temperature, Te=Ed/kBG. When the molecule is big, the effective temperature approaches its corresponding microcanonical temperature. This temperature depends on two factors, the activation energy Ed and Gspann parameter. For a tight transition state the frequency factor is around 1011 s−1, and G is around 20. Changing the quenching time τc from 10 ms to 30 ms can only vary G about 5%. So the major determining factor of temperature is the activation energy Ed. In the case of oligonucleotides at the temperature, where cooling can compete with decay, is then around 550 K which is far lower than that for amino acids. Above this temperature the decay follows a power law but when the decay reaches this temperature, the cooling starts to quench the decay. So the quenching time τc for oligonucleotides is somewhat longer than that for amino acids (15 ms). On the other hand, if the activation energy is higher (e.g. 2 eV) for a certain system, the initial temperature for cooling should be much higher than for amino acids and the quenching time should be shorter than 15 ms of amino acids. This is true in the case of electron emission after laser excitation of C60
−
[161]. The electron binding energy of the C60 anion is 2.67 eV, so the initial temperature for cooling is about 1500 K and the characteristic quenching time is determined to be 5.5 ms which is shorter than the 15 ms for amino acids. The spectrum of [AMP−H]− is shown in fig.4.9. Two fitting functions are applied. One is eq.(25) including quenching time τc (red curve) and other is the normal power law fitting (blue curve). For the red curve in fig.4.9 τc is 25 ms and the power is −0.98 which is the same power as for the blue curve. These curves are almost identical except that there is small difference at longer time range in

Biomolecular ions in ELISA _______________________________________________________
64
the spectrum. However after 25 ms, background signals from residual gas dominate so that the quenching time is ill-defined. It is consistent with the discussion above that the quenching time of oligonucleotides should be longer than that of amino acids. Experiments have also been carried out on the same oligonucleotides with different charge states and the spectra are shown in fig.4.10. The idea behind is to obtain activation energy of weak fragmentation channel. It will be explained in the following: For a weak decay channel kW <<ks where kW is the decay rate for the weak channel and ks is the decay rate for the strong channel. However, if only the signal from the weak decay channel can be observed, the intensity is now given by
∫ −= t)g(E)k((E)dEkI(t) sw exp (27) Apply the Arrhenius law again
T)/kE(vkT),/kE(vk BsssBwww −=−= expexp and we have sw /EE
ssww )/v(kvk = where Ew and Es are the activation energies of weak and strong decays respectively. Insert into eq.(27) with sw /EEµ =
∫ −∝ t)g(E)k(dEkI(t) sµ
s exp which is equal to
0.1 1 10 100
10
100
1000
10000C
ount
s
Time (ms)
[AMP−H]−
Fig.4.9 Time spectrum for AMP anion for the 100 ms storage time. Red curve is a fit with eq. (25) with a quenching time and blue curve fits with simple power law decay.

Power law decay _______________________________________________________
65
∫ −−− t)dEk(kkt)(Ek')(Ek)g(Et s
's
1µs
µ
ms
msm
µ exp (28)
while 's
1µs
µ kkt − = µs )(tk
dEd
µ1 , so the integral in eq.(28) becomes ∫ − )x(dx
µ1 1/µexp
independent of time t.
Finally, the intensity )(Ek')(Ek)g(EtI(t)
ms
msm
µ−∝ (29)
Em now is determined by 0t))k((kdEd
sµs =−exp which gives µ/t)(Ek ms = .
From eq.(29) we have /µEE ws = . In the case of oligonucleotide fragmentation, the loss of a neutral base competes with loss of a charged base depending on the charge state of the primary ions [69,70]. For example, in the dissociation of [d(A)5−2H]2− loss of neutral adenine dominates while for [d(A)5−3H]3− loss of charged adenine dominated. From studying the power of [d(A)5−3H]3− decay we can obtain the
1
10
100
1000
0.1 1 10 10010
100
1000
[d(A)5−2H]2−
Cou
nts
Power = −0.98
Time (ms)
[d(A)5−3H]3−
Power = −0.97
Fig.4.10 Time spectrum of 100 ms storage for oligonucleotide d(A)5 anions with dianion (top) and trianion (bottom). Red curve is the fit with simple power law decay.

Biomolecular ions in ELISA _______________________________________________________
66
activation energy for loss of charged base (1.03/µ). The measured power −0.97 for [d(A)5−3H]3− indicates that the activation energy difference between loss of neutral and charged base is quite small. It has been applied to obtain the activation energy of C2 emission from excited C60 [162]. Summary We have performed measurements on molecules with a broad distribution in excitation energy, and have chosen representative examples of amino acid cations and nucleotide anions. The results confirm the approximate 1/t decay law which was observed for clusters. A strong reduction of power law decay is also observed for biomolecules which can be explained by radiative cooling. The quenching time strongly depends on the activation energy for dissociation. We measured around 15 ms for amino acids and >20 ms for nucleotides. The observed power-law spectra for a time shorter than τc give indications of a temperature dependence on competition between different fragmentation channels. The weak channel decay measurement for [d(A)5−3H]3− shows the activation energy for charged base loss is similar to the neutral base loss because a power of unity is nearly observed. However the power law decay diminishes all the characteristics of dissociation, e.g., the Arrhenius parameters can not be determined. In the next section, I will discuss the decays of some examples with the well-defined internal energy. Arrhenius parameters can be deduced. Other processes like dissociation via nonergoidc process can also be studied. 4.3 Photodissociation of protonated nucleotides and peptides If the initial energy is well defined, the excitation energy after photon absorption is also known. This is an advantage compared with methods based on excitation in collisions with other molecules or with a surface, e.g. threshold measurements of collision-induced dissociation [163]. The BIRD technique has been used successfully to study dissociation kinetics. Depending on the size of the molecules studied, it can roughly be divided into three regimes. For large biomolecules including both proteins and oligonucleotides, the decay temperature of the molecules is equal to the temperature of the surrounding walls in the rapid energy exchange (REX) limit where the rate of absorption and emission of infrared photons is higher than the dissociation rate. Thus the obtained Arrhenius parameters, e.g., Eb
obs, are equal to real dissociation kinetic parameters, e.g. Eb
? . For small molecules the decay is far faster than the absorption of infrared photons, so Dunbar proposed a method to relate Eb
obs with Eb? [164]. But for middle-sized molecules the system is quite
complex, e.g. a set of master equations are established to resolve the unimolecular decay rate as a function of temperature [165]. Pointed out, it is easier to study large molecules because the observed parameters are equal to the real Arrhenius parameters. However the problem how large is large is still
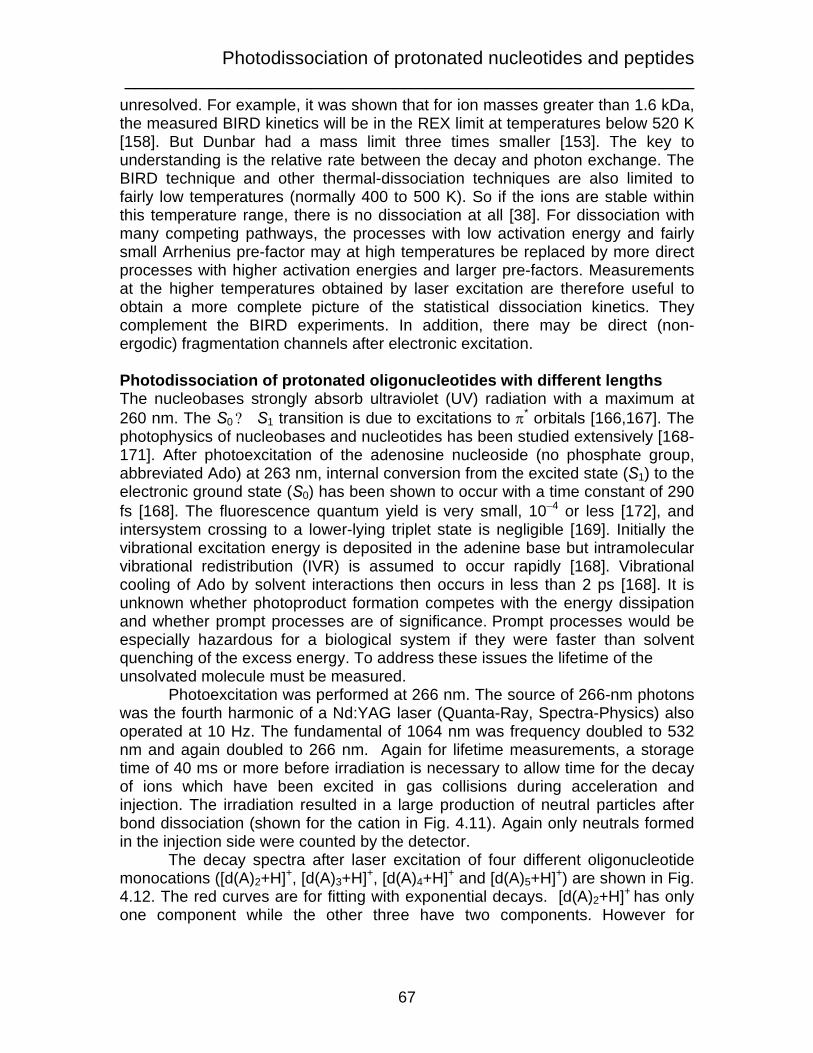
Photodissociation of protonated nucleotides and peptides _______________________________________________________
67
unresolved. For example, it was shown that for ion masses greater than 1.6 kDa, the measured BIRD kinetics will be in the REX limit at temperatures below 520 K [158]. But Dunbar had a mass limit three times smaller [153]. The key to understanding is the relative rate between the decay and photon exchange. The BIRD technique and other thermal-dissociation techniques are also limited to fairly low temperatures (normally 400 to 500 K). So if the ions are stable within this temperature range, there is no dissociation at all [38]. For dissociation with many competing pathways, the processes with low activation energy and fairly small Arrhenius pre-factor may at high temperatures be replaced by more direct processes with higher activation energies and larger pre-factors. Measurements at the higher temperatures obtained by laser excitation are therefore useful to obtain a more complete picture of the statistical dissociation kinetics. They complement the BIRD experiments. In addition, there may be direct (non-ergodic) fragmentation channels after electronic excitation. Photodissociation of protonated oligonucleotides with different lengths The nucleobases strongly absorb ultraviolet (UV) radiation with a maximum at 260 nm. The S0 ? S1 transition is due to excitations to π* orbitals [166,167]. The photophysics of nucleobases and nucleotides has been studied extensively [168-171]. After photoexcitation of the adenosine nucleoside (no phosphate group, abbreviated Ado) at 263 nm, internal conversion from the excited state (S1) to the electronic ground state (S0) has been shown to occur with a time constant of 290 fs [168]. The fluorescence quantum yield is very small, 10−4 or less [172], and intersystem crossing to a lower-lying triplet state is negligible [169]. Initially the vibrational excitation energy is deposited in the adenine base but intramolecular vibrational redistribution (IVR) is assumed to occur rapidly [168]. Vibrational cooling of Ado by solvent interactions then occurs in less than 2 ps [168]. It is unknown whether photoproduct formation competes with the energy dissipation and whether prompt processes are of significance. Prompt processes would be especially hazardous for a biological system if they were faster than solvent quenching of the excess energy. To address these issues the lifetime of the unsolvated molecule must be measured. Photoexcitation was performed at 266 nm. The source of 266-nm photons was the fourth harmonic of a Nd:YAG laser (Quanta-Ray, Spectra-Physics) also operated at 10 Hz. The fundamental of 1064 nm was frequency doubled to 532 nm and again doubled to 266 nm. Again for lifetime measurements, a storage time of 40 ms or more before irradiation is necessary to allow time for the decay of ions which have been excited in gas collisions during acceleration and injection. The irradiation resulted in a large production of neutral particles after bond dissociation (shown for the cation in Fig. 4.11). Again only neutrals formed in the injection side were counted by the detector. The decay spectra after laser excitation of four different oligonucleotide monocations ([d(A)2+H]+, [d(A)3+H]+, [d(A)4+H]+ and [d(A)5+H]+) are shown in Fig. 4.12. The red curves are for fitting with exponential decays. [d(A)2+H]+ has only one component while the other three have two components. However for

Biomolecular ions in ELISA _______________________________________________________
68
[d(A)2+H]+ one exponential does not represent the data well. The blue curve fitting will be explained in the following. As discussed in section 4.1, the decay can only have an exponential function when the initial energy distribution is narrow, e.g., a Dirac delta function. In the experiments the ions are in equilibrium with the ion trap before being extracted so the energy distribution is approximated by a Gaussian distribution given by
∝)(Tg ( )⎟⎟⎠
⎞⎜⎜⎝
⎛ −− 2
2
2exp
δexTT where =δ 0
0 TCkC B with ion trap temperature T0.
The decay rate is given by ( ) ( ) ( )∫ −= dTtTkTgTktI )exp()( (30)
Because of distribution of the energy, the neutral counting rate will increase at longer time so that a small deviation from exponential decay will be observed. It can be understood the same way as two fragmentation channels competing with each other with different Arrhenius parameters as discussed in section 4.2. The blue curve is from fitting to eq.(30) which is quite well representative of the data. For the spectra of the other three, one-exponential fitting with eq.(30) can not represent the data because the deviation from one exponential is quite large, and therefore a second component is introduced. In table 2 the fitting parameters are listed for the four oligonucleotide cations.
0 20 40 60 80
[d(A)2+H]+
Cou
nts
Time (ms)
Fig.4.11 Irradiation of dinucleotide cations [d(A)2+H]+ in ELISA. The initial count rate after injection is due to the decay of ‘‘hot’’ ions, but after ca. 20 ms the signal is dominated by collisional decay. Laser excitation after 60 ms of storage time causes a large increase in the count rate. The depletion of the ion beam is reflected in a lower rate of collisional decay after laser excitation than before.

Photodissociation of protonated nucleotides and peptides _______________________________________________________
69
0 1 2 3 4 5100
1000
10000
100000
Cou
nts
Time (ms)
[d(A)2+H]+
0 8 16100
1000
10000
100000[d(A)4+H]+
Cou
nts
Time (ms)5 10 15 20 25 30
10
100
1000
10000[d(A)5+H]+
Time (ms)
Fig. 4.12 Decay spectra of different oligonucleotide cations after laser excitation. See text for details
0 5 10 15 20 25 30 35 40
100
1000
Time (ms)
[d(A)3+H]+

Biomolecular ions in ELISA _______________________________________________________
70
Table 2. Measured lifetimes (in ms) for different nucleotides [d(A)n+H]+. n 2 3 4 5 First component # of photons
0.025 1
0.554 1
0.043 2
0.245 2
Scond component # of photons
3.65 1
3.32 1
1.02 2
In order to find the temperature after photoabsorption it would be better to measure the neutral yields as a function of laser power to determine how many photons are absorbed. However in order to change the laser power we have to change the power of the flash lamp of the Nd:YAG laser, which leads to variation of the size of the laser spots especially when the power of the flash lamp is quite small. Therefore plotting the yield as a function of laser power sometimes fails to give information about how many photons are absorbed. For a decay spectrum
0.0 0.1 0.2 0.3 0.4 0.5 0.6 0.7 0.8 0.9
[d(A)3+H]+
[d(A)4+H]+
Rat
io b
etw
een
two
com
pone
nts
(arb
. uni
t)
0
0
[d(A)5+H]+
Pulse energy (mJ)
0
Fig.4.13 the ratio between the two components after photoexcitation as a function of pulse energy.

Photodissociation of protonated nucleotides and peptides _______________________________________________________
71
with multicomponents, instead of plotting the yields as a function of laser power individually for each component, we plot the ratio between the different components as a function of laser power which then gives information on the relative number of photon absorbed. In Fig.4.13 the ratios of the two components for the three oligonucleotides are shown. In the case of d(A)3 and d(A)5, the ratio is independent of laser power indicating that the two components are due to the same number of photons, while for d(A)4 the ratio is linearly increasing which indicates that the slow component has absorbed one photon less than the fast component. The slow component for d(A)3 and d(A)5 could be due to an intersystem crossing between S1 and the lower-lying triplet state (T1). The triplet-state ions are long lived as the intersystem crossing to the electronic ground state is spin forbidden, which slows the decay by an order of magnitude. Concerning the lifetimes in table 2 and the relative numbers of photons absorbed, we can estimate the absolute number of photons absorbed. A simple approach is taken in the following. Roughly the heat capacity of oligonucleotides with different lengths is proportional to their length, so the heat capacity of d(A)2 is about half that of d(A)4. d(A)2 and the fast component of d(A)4 have similar lifetime, and they therefore have a similar final temperature after photoabsorption. Hence the numbers of photons absorbed by d(A)4 should be twice that of d(A)2. For example, if d(A)2 absorbs one photon then d(A)4 absorbs two (the slow component of d(A)4 is then due to one photon absorbed). In this way the fast components of d(A)3 and d(A)5 can be argued to absorb one and two photons, respectively. On the other hand if we instead assume that d(A)2 absorbs two photons and d(A)4 (fast component) absorbs four, then the slow component of
0 200 400 600 800 1000 1200 14000
5
10
15
20
25
30
35
40
d(A)5
d(A)4
d(A)3
d(A)2
Ener
gy (e
V)
Microcanonical temperature (K)
Microcanonical caloric curves
Fig.4.14 Microcanonical caloric curve of nucleotides with different sizes.

Biomolecular ions in ELISA _______________________________________________________
72
d(A)4 absorbs three photons. The lifetime of d(A)3 (fast component) is shorter than that of d(A)4 (slow component), so the temperature of d(A)3 is higher than that of d(A)4 (slow component). The only way for d(A)3 at higher temperature is to absorb more than three photons. If so, the lifetime of d(A)3 should be similar to or shorter than that for d(A)2. It is contradictory to the experimental results. Hence the first approach is most likely and the number of photons absorbed is summarized in Table 2. Next we perform a semiempirical PM3 level calculation to obtain the vibrational frequencies. The microcanonical caloric curves and heat capacities can be calculated (see details in appendix). In fig. 4.14 the microcanonical caloric curve is shown. Knowing the number of photons absorbed, the final temperature can be calculated. Then we can make an Arrhenius plot. A small correction has to be made to the Arrhenius decay formula because of the finite-heat-bath.
))
2CE(Tk
E(vkb
B
b
−= exp . So )
2CTE1
1(Tk
EvkbB
b
−−= lnln . Because the last term is
only a small correction for large molecules, an expansion is made for the last term
)2CTE(1
TkEvk b
B
b +−= lnln (31)
14 15 16 17 18 19 205
6
7
8
9
10
11
d(A)4 second component
d(A)3
d(A)5
d(A)4
lnk
1/kBT
d(A)2
Fig.4.15 Arrhenius plot for nucleotide cations. Solid line for fitting with four fast components and dashed line for fitting including the slow component of d(A)4.
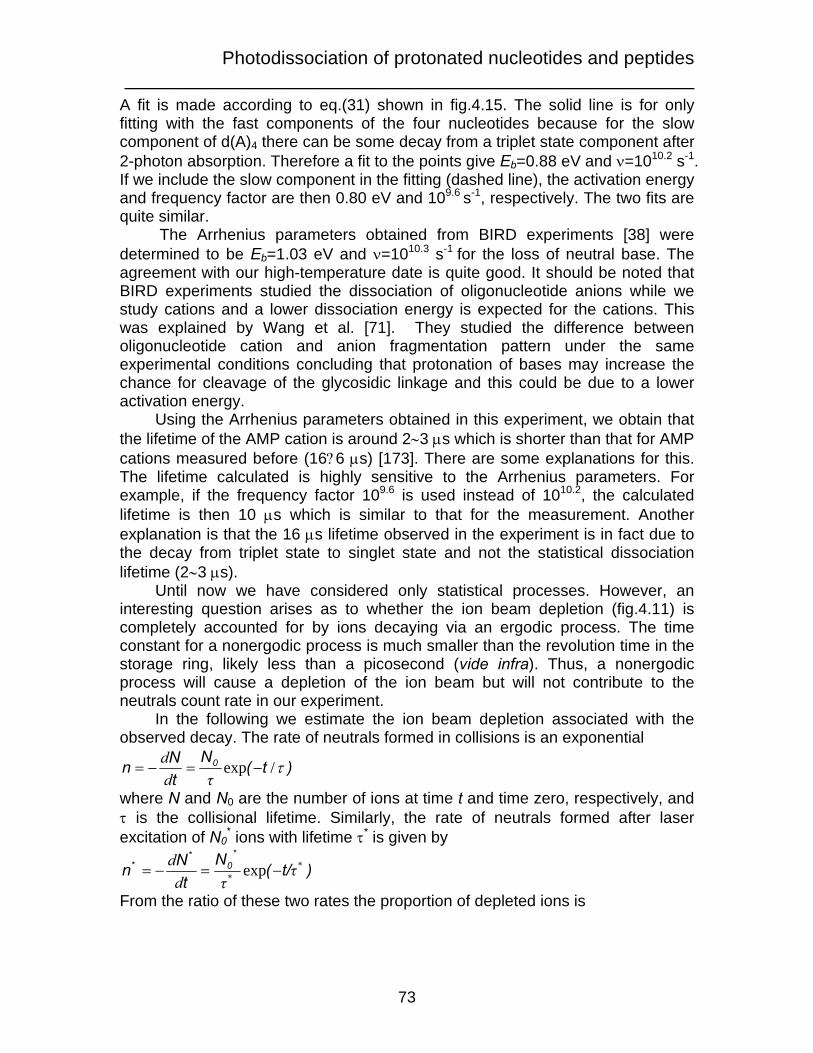
Photodissociation of protonated nucleotides and peptides _______________________________________________________
73
A fit is made according to eq.(31) shown in fig.4.15. The solid line is for only fitting with the fast components of the four nucleotides because for the slow component of d(A)4 there can be some decay from a triplet state component after 2-photon absorption. Therefore a fit to the points give Eb=0.88 eV and ν=1010.2 s-1. If we include the slow component in the fitting (dashed line), the activation energy and frequency factor are then 0.80 eV and 109.6 s-1, respectively. The two fits are quite similar. The Arrhenius parameters obtained from BIRD experiments [38] were determined to be Eb=1.03 eV and ν=1010.3 s-1 for the loss of neutral base. The agreement with our high-temperature date is quite good. It should be noted that BIRD experiments studied the dissociation of oligonucleotide anions while we study cations and a lower dissociation energy is expected for the cations. This was explained by Wang et al. [71]. They studied the difference between oligonucleotide cation and anion fragmentation pattern under the same experimental conditions concluding that protonation of bases may increase the chance for cleavage of the glycosidic linkage and this could be due to a lower activation energy. Using the Arrhenius parameters obtained in this experiment, we obtain that the lifetime of the AMP cation is around 2∼3 µs which is shorter than that for AMP cations measured before (16?6 µs) [173]. There are some explanations for this. The lifetime calculated is highly sensitive to the Arrhenius parameters. For example, if the frequency factor 109.6 is used instead of 1010.2, the calculated lifetime is then 10 µs which is similar to that for the measurement. Another explanation is that the 16 µs lifetime observed in the experiment is in fact due to the decay from triplet state to singlet state and not the statistical dissociation lifetime (2∼3 µs). Until now we have considered only statistical processes. However, an interesting question arises as to whether the ion beam depletion (fig.4.11) is completely accounted for by ions decaying via an ergodic process. The time constant for a nonergodic process is much smaller than the revolution time in the storage ring, likely less than a picosecond (vide infra). Thus, a nonergodic process will cause a depletion of the ion beam but will not contribute to the neutrals count rate in our experiment. In the following we estimate the ion beam depletion associated with the observed decay. The rate of neutrals formed in collisions is an exponential
)t(NtNn 0 τ/exp −=−=
τdd
where N and N0 are the number of ions at time t and time zero, respectively, and τ is the collisional lifetime. Similarly, the rate of neutrals formed after laser excitation of N0
* ions with lifetime τ* is given by
)t/(Nt
Nn*
0*
* ** ττd
d−=−= exp
From the ratio of these two rates the proportion of depleted ions is
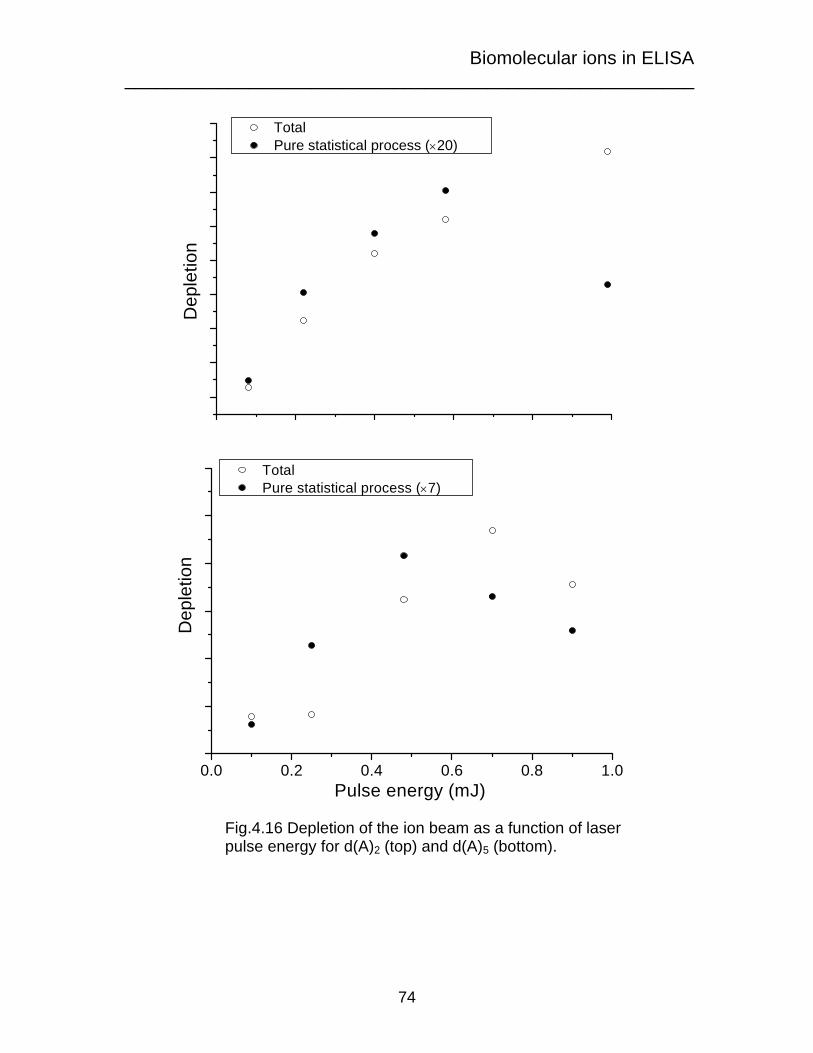
Biomolecular ions in ELISA _______________________________________________________
74
0.0 0.2 0.4 0.6 0.8 1.0
Dep
letio
n
Pulse energy (mJ)
Total Pure statistical process (×7)
Fig.4.16 Depletion of the ion beam as a function of laser pulse energy for d(A)2 (top) and d(A)5 (bottom).
Dep
letio
n
Total Pure statistical process (×20)

Photodissociation of protonated nucleotides and peptides _______________________________________________________
75
)(t/nn)t/exp(t/
nn
NNdepletion
**
0
*0 *
**
*
τττττ
ττ exp≈−== (32)
The approximation is made since the collisional lifetime is far longer than the time for decay after laser activation (τ>>τ*). The depletion determined by eq.(32) only accounts for the dissociation from the ergodic process. The total depletion is given by
nnndepletion L
t−
= ,
where nL is the neutrals counts rate at several tens of milliseconds after laser excitation. In fig.4.16 the beam depletion for d(A)2 as a function of laser power is shown. The collisional lifetime of d(A)2 is 5 s scaled from the lifetime of AMP (7 s) and τ* is listed in table 2 (25 µs). Time t is estimated to be half a revolution time of d(A)2. i.e., 49 µs. The uncertainty of eq.(32) comes from the estimation of time t, i.e., how long is the time for the stored ions to travel to the other side of ELISA and then give a signal in the detector. A time of 49 µs corresponds to traveling from the middle of the straight section of ELISA to the middle of the other straight section. So this time can vary by ?10 µs which corresponds to traveling from one end to the other end of the same straight section. This variation can change eq.(32) by factor of 2. From fig.4.16, the total depletion for d(A)2 is larger than that calculated from eq.(32) indicating that there more than 90% of the ions decomposes via a nonergodic process (factor of 2 uncertainty considered). This phenomenon was also observed in the photodissociation of AMP cations (more than 99% dissociation via nonergodic processes) while for AMP anions there was no indication of nonergodic dissociation [173]. In the case of oligonucleotide monocations, the protonation site is the nucleobase but the neutral bases may also absorb UV light. We consider a simple model. If the protonated base absorbs the photon then all ions dissociate via a nonergodic process while if the neutral base absorbs the photon then all ions dissociate via an ergodic process. Therefore the depletion of d(A)2 should be 50/50 via ergodic and nonergodic processes if the photon absorption cross section is the same for both. The fact that 90% ions decompose via a nonergodic process indicates that the absorption cross section for a charged base is higher than that for a neutral base. If this is true, increasing the number of neutral base can increase the photon-absorption probability by the neutral base thus decrease the ratio between total depletion and depletion from the ergodic process. In the case of d(A)5, there are four neutral bases so the ratio decreases to 7 times while for d(A)2 it is 20 times (fig.4.16). Photodissociation of protonated amino acids As discussed above, ions with well-defined initial energy will also have a well-defined internal energy leading to an exponential decay in ELISA. But there are exceptions. Here similar experiments as described above are done on protonated tryptophan, but instead of an exponential decay, a power law decay is

Biomolecular ions in ELISA _______________________________________________________
76
obtained (fig.4.17). As discussed in section 4.2, the power law decay indicates that the internal energy distribution is broad. In the present experiments, TrpH+ was thermally equilibrated at room temperature and the average internal energy E0 was 0.3 eV. The canonical internal energy distribution has a full width of 0.2 eV which is quite small compared to the photon energy (4.67 eV). Therefore there must be an additional process involved. In the following we consider the possible importance of fluorescence. Also the formation of the tryptophan radical cation after prompt loss of hydrogen from TrpH+ is discussed since its decay spectrum will be superimposed on that of TrpH+. If the ms lifetime component of the TrpH+ decay is due to a decay from the triplet state to the singlet ground state, there must be solvent quenching in water solution where the triplet-state lifetime is of the order of microseconds. Another possible process after photon absorption is fluorescence from the initially excited Trp. In aqueous solution, the fluorescence quantum yield of Trp is larger than 0.1 and highly dependent on the pH of the solution (low when pH<4) [174]. Since tryptophan has a higher fluorescence quantum yield than the other amino acids, its fluorescence is often used to study the structure and dynamics of proteins in solution [175]. The maximum light emission is around 350 nm and the internal energy of TrpH+ is about 1.4 eV after fluorescence. The width of the internal energy distribution includes the spread in the fluorescence energy, which is quite large at room temperature ∼0.6 eV [176] which is more than sufficient to explain a 1/t decay function. For example, with an activation energy of 1.2 eV and a pre-exponential factor of 5?1013 s−1 in the Arrhenius expression, the lifetime after fluorescence covers the range from 100 µs to 0.1 s.
Fig.4.17 Decay spectrum of TrpH+ after 266-nm photon absorption. The solid line is a fit to a 1/t decay curve including the backgrounds due to CID.

Lifetime measurement of radical ions _______________________________________________________
77
However, very recent evidence by Kang et al. [177] suggests another interpretation. The main dissociation channel of TrpH+ after 266-nm photon absorption appears to be loss of a hydrogen to give the Trp radical cation. The mechanism for this is believed to be a prompt direct process that involves an ion where the proton is located on the indole ring and not on the amino nitrogen. When the indole ring is protonated, fluorescence is strongly quenched. We have calculated the energy required for loss of a hydrogen from protonated 3-methylindole at the MP2/6-311++G(2d,p)//B3LYP/6-31+G(d) level to be 3.6 eV (corrected for zero-point kinetic energies). The remaining average energy in the Trp cations is then about 1 eV, and with an additional broadening of the distribution associated with the hydrogen loss we are likely in the regime of 1/t decay. Summary The width of the internal energy distribution of ions is highly important for the observed decay of the ions. By using an ion trap we can obtain the ions with a well-defined internal energy. The decay rate can be obtained by an exponential fitting of the decay spectrum. If the final temperature is known, an Arrhenius plot can be made and the activation energy and pre-exponential factor can be derived. This is a complementary to BIRD measurements to determine the kinetic parameters in the high temperature limit. In the case of the oligonucleotide cations, most of the ions dissociate via a nonergodic processes. A deviation from exponential decay is also observed for TrpH+ where instead a power law decay is observed. A possible explanation could be due to fluorescence or loss of a hydrogen from the indole ring. 4.4 Lifetime measurement of radical ions As discussed in chapter 3, high energy collisions can produce radical ions. If we inject the radical ions into ELISA, lifetimes of radical ions can be measured. In order to produce radical ions a sodium oven is mounted after the magnet in the injection section of ELISA. Lifetime measurement of a charge-reduced peptide cation We first produced the doubly protonated decapeptide Ser-Tyr-Ser-Met-Glu-His-Phe-Arg-Trp-Gly (fragment 1–10 of ACTH (Adrenocorticotropic Hormone Human)) by electrospray ionization. After 11-kV acceleration and selection of the peptide dications by a magnet, these ions were collided with sodium vapour and one-electron reduced ions, [M+2H]+·, of 22 keV translational energy were stored in the storage ring and their lifetime measured (fig.4.18). Two components with lifetimes of 0.3 ms and 1.8 ms are observed. Since the peptide is doubly charged and electron capture can occur to both charge sites, two singly charged ions are produced with different lifetimes. The exothermicity of the electron capture reaction is ca 6 eV. Direct cleavage after electron attachment (in less than 1 ps) is likely to be the major process (nonergodic fragmentation), but ions that decay in this way do not contribute to the millisecond decay. On the assumption that

Biomolecular ions in ELISA _______________________________________________________
78
capture occurs with equal probability to the two sites and that the branching ratios between nonstatistical and statistical decays are the same, the areas under the two decay curves should be equal. Indeed, this is the case for the fit in fig. 4.18. Lifetime measurement of nucleotide dianions Ions from an electrospray source were accumulated in an ion trap in which they were thermalized by collisions with helium. The ion trap was kept at either room temperature or −70 oC and emptied after nearly 0.1 sec. After acceleration to a kinetic energy of 22 keV, nucleotide ions were selected with a bending magnet and collided with sodium vapour. All ions in the bunch were injected into ELISA, but the storage ring parameters were optimized for the storage of dianions formed in the collisions. Monoanions, likely formed after electron autodetachment from dianions in the ring, were measured in a channeltron detector located opposite the injection side. The channeltron detector was positioned about 1 cm from the circulating ion beam, and it was used since the dominant reaction channel of the dianions is the production of monoanions. In another experiment, the ions were dumped after 34 milliseconds of storage at the multichannel plate (MCP) detector to identify any ions of long lifetime. The MCP is located at the injection side (Fig. 2.3). Decay spectra of the dianions formed after collisions with sodium vapour are shown in Fig. 4.19 for two different initial temperatures of the AMP monoanion (298 K and 203 K). There is no apparent temperature effect, and the
2 4 6 8 10 12 14 16 18 20101
102
103
1.8 ms
Cou
nts
Time (ms)
[M + 2H]+
0.3 ms
Fig.4.18 Decay spectrum for a one-electron reduced decapeptide radical cation. The data are fitted by two exponentials with the constraint that the areas under the two curves should be equal.

Lifetime measurement of radical ions _______________________________________________________
79
0.0 0.5 1.0 1.5 2.0
100
101
102 298 K 203 K
Cou
nts
Time (ms)
τ = 0.2 ms
Fig.4.19 Decay spectra of [AMP−H]2−. The spacing of the points is 74 µs, which is the revolution time in the ring. The signal is measured in the channeltron detector.
34.00 34.05 34.10 34.150
30
60
90
Cou
nts
Time (ms)
40 µs
Fig.4.20 The signal measured when the circulating [AMP−H]2− ion beam in ELISA is dumped in the MCP detector after 34 ms of storage. Because of the poor resolution of the magnet, the ion beam contains two isotope contributions (m/q 172.5 and m/q 173) which are separated in time by 40 µs (predicted separation 49 µs). Note, two singly charged fragments of m/q 172 and 173 would separate in time by 99 µs.

Biomolecular ions in ELISA _______________________________________________________
80
time constant is about 0.2 ms for both decays. This finding indicates that the internal energy of the ions is determined by the electron capture and concomitant hydrogen loss processes.
The count rate in the channeltron detector was too low to identify longer lived components, and therefore any remaining ions were dumped directly in the MCP detector after 34 milliseconds of storage. Indeed a signal is measured (Fig.4.20), and a fraction of the ions therefore has a long lifetime of at least ten milliseconds. At the B3LYP/6-311++G(2d,p)/PM3 level of theory we calculate the energy for vertical attachment of an electron to [AMP−H] − (N-dehydrogenated anion) to be slightly positive by 0.1 eV. Hence it is likely that the ions detected after long time are stable to electron autodetachment.

Summary and outlook ________________________________________________________________
81
Chapter 5 Summary and outlook The results of recent studies of biomolecular ions have been presented. Two experimental setups were used in these studies: an accelerator mass spectrometer and an electrostatic storage ring. The source for production of biomolecular ions is electrospray. All ions are accelerated by a high voltage acceleration tube and only interested ions are selected by a magnet. We have focused on the differences from experiments at lower energies. An aspect of high-energy collision experiments is the large cross section for electron transfer between collision partners, either electron loss or capture to the ion. Interesting radical ion chemistry can then be studied. For example, collisional electron transfer between peptide multiply charged cations and sodium gas generates radical ions that possess an additional electron. These radical ions display characteristic fragmentation patterns that are governed by their radical chemistry, Coulomb repulsion between charges, and/or fast nonstatistical processes. Electron detachment from oligonucleotide anions also promotes a selective enhancement of certain fragmentation processes. Exotic dianions can also be produced by high energy collisions between anions and sodium vapour. In the case of nucleotides, the excess electron is captured by the nucleobase inducing hydrogen loss from a N−H group. At the electrostatic storage ring we have studied the time dependence of the decay of large molecular ions. As an example, we have studied the power-law decay of collisionally activated amino acids and oligonucleotides and determined the quenching time for radiative cooling. The decay of nucleotide ions after photoexcitation has been analyzed to give information on the relative importance of statistical and nonstatistical fragmentation processes. In photoexcitation experiments the energy is initially located in the chromophore part of the molecule and then spreads to the rest of the molecule within about a picosecond. Fragmentation after intramolecular vibrational redistribution (IVR) is a statistical process whereas dissociation before IVR or from electronic excited states is nonstatistical. Only decay on a time scale of micro- to milliseconds can be measured directly in the ring, but prompt (nonstatistical) decay is revealed as a depletion of the beam after photoexcitation. In another experiment, we have taken advantage of the high cross section for electron capture in high-energy collisions with sodium vapour to produce radical ions, and we have measured the time dependence of their fragmentation in the storage ring. In the case of charge-reduced peptide ions, we identify two different species formed upon electron attachment to a peptide dication. Both of the two charged ends of the peptide can equally well capture an electron. In the measurement of AMP dianions, a lifetime of 0.2 ms is measured independent of the initial internal energy of the ions indicating that the internal energy of the ions is determined by the electron capture and concomitant hydrogen loss processes.

Summary and outlook ________________________________________________________________
82
Another electrostatic storage ring has been built recently in Tokyo [178], which is similar to ELISA with an electron target for merged beam experiments Also, Stockholm University has a project to build a double electrostatic storage ring named Double Electrostatic Storage Ion Ring ExpEriment (DESIREE). Positive and negative ions can be merged in the common straight section of the ring. Their interesting reactions can be studied. In future work collisions between multiply charged oligonucleotide anions and sodium are planned to study damage to nucleic acids by electron capture. Similar experiments can also be done on duplex oligonucleotides to reveal what the excess electron does to the duplex structure. Future work on the photoexcitation of amino acids, peptides and oligonucleotides is planned with the purpose of better understanding the photophysics of these molecules. We are especially interested in identifying ‘prompt’ nonstatistical processes on the picosecond timescale. Another theme will be the transition from isolated to solvated molecular ions. Stepwise solvation of the ions will be carried out to bridge the gap between gas phase and solution phase.

Appendix _______________________________________________________
83
Appendix A In-source activation between tube lens and skimmer As discussed in chapter 2, in-source collisional activation sometimes can change the fragmentation pattern especially for fragile primary ions. As shown in fig.2.2 the ions are accelerated between the tube lens and skimmer. During the passage the internal energy of the ions can be increased if the ions collide with the residual gas. This energy is enough to destroy the fragile ions. For example, putting a higher voltage on the tube lens can make the average charge state of the ions selected by the mass spectrometer shift to a lower value [45,46]. Here I present an example to demonstrate the importance of the tube lens voltage. Previously, collisions between 50-keV fluorinated fullerenes (C60Fx
-) and noble gas (Xe) resulted in observation of dianions of highly fluorinated fullerenes. Application of the plasma ion source and ESI source, afforded “hot” and “cold” fluorofullerene anion beams, respectively. In the latter case, non-dissociative electron capture process prevailed over a dissociative process, for which the cross sections measurements were performed [179]. Now instead of Xe gas we used sodium as a target. In addition to the dianions, trianions are observed in the MIKE spectrum (fig.1). One-fluorine-loss dianions are also observed but not dominant over the intact dianions when the tube lens potential is low. However if we apply a high tube lens voltage the fragment dianions have higher yields than the intact ones. In fig.2 the ratio of fragment dianions and intact dianions (γ) is shown as a function of tube lens voltage. Thus the ratio γ can be considered as a thermometer to measure the temperature of the primary ions. In fig.3 the relative formation cross section for the trianion is plotted as a function of γ. The cross section strongly depends on the temperature (γ) of the primary ions. At certain temperature the trianions can even be missing in the spectrum indicating the electron autodetachment is much faster than 10 µs. The electron autodetachment can be interpreted as tunnelling through the Coulomb barrier mainly from a thermally populated excited electronic state or with transfer of energy to the electron from hot vibrational bands. This phenomenon is discussed in details in the study of decay of free C60 dianions [180].

Appendix _______________________________________________________
84
0 200 400 600 800 1000 1200 1400 16000
10000
20000
30000
40000
50000
C60F3-47
C60F2−47
C60F−
47C
ount
s
m/q
C60F−
47+Na (190 oC)
×10
Fig. 1 MIKE spectrum obtained after collisions of C60F47− with Na
Note, that the intensity of the peak at 537.7 is multiplied by 10.
60 80 100 120 140 160 180 200 2200.0
0.2
0.4
0.6
0.8
1.0
1.2
1.4
I(C60
F 462-)/I
(C60
F 472-)
Tube lens voltage (V) Fig. 2 Ratio between fragment dianions and intact dianions as a function of tube lens potential. Note with a high tube lens voltage the ratio is larger than 1.

Appendix _______________________________________________________
85
0.0 0.2 0.4 0.6 0.8 1.0 1.20
2
4
6
8
10
12
14σ re
l
γ
Fig. 3 Relative formation cross section of trianions as a function of γ.

Appendix _______________________________________________________
86
Appendix B Biomolecular cluster ions There is an interest in clusters of biomolecules [31-33, 181,182]. For example, Cooks and coworkers found that the serine octomer had unusual stability in the gas phase and moreover L-and D-serine can recognize each other to form the stable cluster form [31-33]. We also performed the experiments on serine clusters shown in fig.1. It is obvious that the octomer is the most intense among all the clusters. In fig. 2 the chiral recognition is observed. For the mixture of L-and D-serine the peak of the octomer is comparable with the others. But in the case of D-serine, the octomer peak is dominant over other clusters. A sonic spray ion source is planned to be used for further studies of biomolecular clusters.
Fig. 1 Magnet scan of ions formed from ESI. In addition to single-charged serine clusters, multiply charged serine clusters are also observed. Serine octomer is most intense.
0
500
1000
1500
2000
2500
3000
3500
[Ser39+H]4+[Ser19+H]2+
[Ser10+H]+
945 997.5
Cou
nts
1050
[Ser9+H]+
600 800 1000 1200 1400 16000
2000
4000
6000
8000
[Ser7+H]+
[Ser6+H]+
[Ser5+H]+
Cou
nts
m/q
[Ser8+H]+

Appendix _______________________________________________________
87
550 600 650 700 750 800 850 900 950
550 600 650 700 750 800 850 900 950 D only
m/q
[Ser9+H]+
[Ser8+H]+
[Ser7+H]+
[Ser6+H]+[Ser5+H]+
Mixture of L and D
Fig. 2 Magnet scan of mixture of L- and D-serine and D-serine only. The octomer is not dominant in mixture of L- and D- serine, while for only D-serine the octomer again becomes most intense.

Appendix _______________________________________________________
88
Appendix C Calculating the microcanonical caloric curve The vibrational frequencies can be calculated from the Gaussian 98 program. Then the canonical caloric curve is given by
∑−
=i
B
ii
1)Tk
hw(K
1KhwE(T)exp
(1)
where K is 1.24×10⁻⁴, the conversion factor for energy from cm-1 to eV. The last term is eq.(1) is the average number of oscillators at temperature T with frequency ω. So the derivative with respect to temperature T gives the canonical heat capacity as a function of T (eq.(2)).
2
B
ii B
i2
B
i )1)
Tkhw(K
1()Tk
hw(K)Tk
hw(KC(T)−
= ∑exp
exp (2)
Then the microcanonical caloric curve is calculated given by eq.(3)
Bm
Bm
kC(T)(T)CTkE(T)(T)E
−=−=
(3)

Appendix _______________________________________________________
89
Appendix D Calculating the radiation power from hot molecules The radiative power can be calculated according to eq.(26) in chapter 4.
1T)ω/k(ω
3Mcq2ωP
B3
22
r −=
h
h
exp (1)
From the Gaussian calculations not only frequencies are calculated but also IR Intensities (q2/M) which is in units of km/mol. What we need for radiative power is eV/s, so the unit conversion is carried out in the following: IR intensity divided by 42.255 gives unit of D2/Å2⋅amu. 1 D2/Å2⋅amu is equal to
2803.41 e2/amu. So eq.(1) now becomes
1T)ω/k(ω
camueω
32
4.80342.255IRP
B3
22
2r −⋅⋅=
h
h
exp where IR stands for IR intensity.
e2 is equal to 14.4 eV⋅Å while 1 amu⋅c2 is equal to 931.5×10⁶ eV, so the upper equation can be simplied by
ωcωn(Å)
10931.514.4
32
4.80342.255IRP
2
62r h><×⋅
= with 1T)ω/k(
1nB −
>=<hexp
Multiplying 1.24×10⁴ to ωh converts from cm-1 to eV. The frequency given by Gaussian is not the circular frequency so we have to multiply frequencies ( f given by Gaussian) by 2π. We have to multiply the speed of light c to the
frequency to convert from cm-1 to s-1. Concerning Å in the equation, cω2
gives a
factor of 4π2⋅300. So, finally the radiative power is given by
IRfn101.243004π10931.5
14.432
4.80342.2551P 342
62r ⋅><×⋅⋅×⋅
= − (eV/s)
Appendix _______________________________________________________
90
Appendix E Absorption rate from blackbody radiation When we cool down the ions in the ion trap, ions are in equilibrium with the trap. After injection to ELISA, the ions can absorb photons emitted from the walls of ELISA. This absorption heats up the molecules from the original temperature of the trap. It is necessary to calculate the absorption rate. Absorption rate R is given by
20
2
εµπhh6
ncυ8R 3
3
><= (1)
where µ is the transition dipole moment. In Gaussian calculation 22
ωωµ hIR=
so insert into eq.(1)
0επ
6IRn
cυ8R 3
2
><= (2) (in SI unit)
In Gaussian unit, eq.(2) becomes
6IRn
cυ32R 3
22
><=π
By applying the same procedure in Appendix C Finally absorption rate R is given by
IRfn30010931.5
14.44.80342.255
16
32πR 262
2
⋅⋅><×⋅
= (s-1)

Reference _____________________________________________________________
91
Reference 1. Watson J.D. and Crick F.H.C., Molecular structure of nucleic acids - a structure for deoxyribose nucleic acid, Nature 171, 737, 1953. 2. Watson J.D. and Crick F.H.C., Genetical implications of the structure of deoxyribonucleic acid, Nature 171, 964, 1953. 3. Sick C., Ohlenschlager O., Ramachandran R., et al., Structure of an RNA hairpin loop with a 5'-CGUUUCG-3' loop motif by heteronuclear NMR spectroscopy and distance geometry, Biochemistry 36, 13989, 1997. 4. Munson M.S.B. and Field F.H., Chemical ionization mass spectrometry .4. Aromatic hydrocarbons, J. Am. Chem. Soc. 88, 2621, 1966. 5. MacFarlane R.D. and Torgerson D.F., Californium-252 Plasma desorption mass-spectroscopy, Science 191, 920, 1976. 6. Miller J.M., Jones T.R.B, Kenny T., et al., Fast-atom-bombardment study of the lead isotope ratios in early 19th-century Niagara peninsula pottery glazes, Canadian journal of chemistry-revue canadienne de chemie 64, 488, 1986. 7. Yamashita M. and Fenn J.B., Electrospray ion-source-another variation on the free-jet theme, J. Chem. Phys. 80, 4451, 1984. 8. Fenn J.B., Mann M., Meng C.K., et al., Electrospray ionization for mass-spectrometry of large biomolecules, Science 246, 64, 1989. 9. Tanaka K., Ido Y., Akita S., et al., Detection of high mass molecules by laser desorption time-of-flight mass spectrometry, Proceedings of the Second Japan-China Joint Symposium on Mass Spectrometry, 185, 1987. 10. Tanaka K., Waki H., Ido Y. et al., Protein and polymer analysis up to m/z 100.000 by laser ionisation time-of-flight mass spectrometry, Rapid Commun. Mass Spectrom. 2, 151, 1988. 11. Dole M., Mach L.L., Hines R.L., et al., Molecular beams of macroions, J. Chem. Phys. 49, 2240, 1968. 12. Taylor G.I., Disintegration of water drops in an electric field, Proc. R Soc. London A280, 383, 1964. 13. Smith D.P.H., The electrohydrodynamic atomization of liquids, IEEE transactions on industry applications 22, 527, 1986. 14. Schmelzeisen-Redeker G., Bütfering L. and Röllgen F.W., Desolvation of ions and molecules in thermospray mass spectrometry, Int. J. Mass Spectrom. Ion Processs 90, 139, 1989. 15. Iribarne J.V. and Thomson B.A., Evaporation of small ions from charged droplets, J. Chem. Phys. 64, 2287, 1976.

Reference _____________________________________________________________
92
16. Thomson B.A. and Iribarne J.V., Field-induced ion evaporation from liquid surfaces at atmospheric pressure, J. Chem. Phys. 71, 4451, 1976. 17. Smith R.D., Wahl J.H. and Hofstadtler J.A., Capillary electrophoresis/mass spectrometry, Anal. Chem. 65, A574, 1993. 18. Loscertales I.G. and Fernandez de la Mora J., Experiments on the kinetics of the field evaporation of small ions from droplets, J. Chem. Phys. 103, 5041, 1995. 19. Bailey A.G., Electrostatic spraying of liquids, Wiley: New York, 1988. 20. Cloupeau M. and Prunet-Foch B., Electrohydrodynamic spraying functioning modes-a critical review, J. Aerosol. Sci. 25, 1021, 1994. 21. Blades A.T., Ikonomou M.G. and Kebarle P., Mechanism of electrospray mass spectrometry-electrospray as an electrolysis cell, Anal. Chem. 63, 2109, 1991. 22. Hayati I., Bailey A.I. and Tadros T.F., Investigations into the mechanisms of electrohydrodynamic spraying of liquids. 1. effect of electric-field and the environment on pendant drops and factors affecting the formation of stable jets and atomization, J. Colloid. Interface Sci. 117, 205, 1987. 23. la mora F. and locertales I.G., The current emitted by highly conducting Taylor cones, J. Fluid Mech. 243, 561, 1994. 24. Loo J.A., Udseth H.R. and Smith R.D., Solvent effects on the charge-distribution observed with electrospray ionization-mass spectrometry of large molecules, Biomed. Environ. Mass Spectrom. 17, 41, 1988. 25. Ikonomou M.G, Blades A.T. and Kebarle P., Electrospray mass spectrometry of methanol and water solutions suppression of electric-discharge with SF6 gas, J. Am. Soc. Mass Spectrom. 2, 497, 1991. 26. Hvelplund P., Nielsen S.B., Sørensen M., et al., Electron loss from multiply protonated lysozyme ions in high energy collisions with molecular oxygen, J. Am. Soc. Mass Spectrom. 2, 889, 2001. 27. Karas M., Buchmann D. and Hillenkamp F.H., Influence of the wavelength in high-irradiace ultraviolet-laser desorption mass spectrometry, Anal. Chem. 57, 2935,1985. 28. Karas M. and Hillenkamp F., Laser desorption ionization of proteins with molecular masses exceeding 10000 Daltons, Anal. Chem. 60, 2229, 1988. 29. Hirabayashi A., Sakairi M. and Koizumi H., Sonic spray mass spectrometry, Anal. Chem. 67, 2878, 1995. 30. Hirabayashi A., Sakairi M. and Koizumi H., Sonic spray ionization method for atmospheric pressure ionization mass spectrometry, Anal. Chem. 66, 4557, 1994. 31. Takats Z., Nanita S.C., Cooks R.G., et al., Amino acid clusters formed by sonic spray ionization, Anal. Chem. 75, 1514, 2003.

Reference _____________________________________________________________
93
32. Takats Z., Nanita S.C., Cooks R.G., et al., Serine octamer reactions: Indicators of prebiotic relevance, Angew. Chem. Int. Ed. 42, 3521, 2003. 33. Takats Z., Nanita S.C., Cooks R.G., et al., Atmospheric pressure gas-phase H/D exchange of serine octamers, Anal. Chem. 75, 6147, 2003. 34. Loo J.A., Edmonds C.G. and Smith R.D., Tandem mass spectrometry of very large molecules- serum-albumin sequence information from multiply charged ions formed by electrospray ionization, Anal. Chem. 63, 2488, 1991. 35. McLuckey S.A. and Habibi-Goudarzi S., Decompositions of multiply-charged oligonucleotide anions, J. Am. Chem. Soc. 115, 12087, 1993. 36. Zubarev R.A., Kelleher N.L. and McLafferty F.W., Electron capture dissociation of multiply charged protein cations. A nonergodic process, J. Am. Chem. Soc. 120, 3265, 1998. 37. Zubarev R.A., Kruger N.A., Fridriksson E.K., et al., Electron capture dissociation of gaseous multiply-charged proteins is favored at disulfide bonds and other sites of high hydrogen atom affinity, J. Am. Chem. Soc. 121, 2857, 1999. 38. Klassen J.S., Schnier P.D. and Williams E.R., Blackbody infrared radiative dissociation of oligonucleotide anions, J. Am. Soc. Mass Spectrom. 9, 1117, 1998. 39. Schnier P.D., Klassen J.S., Strittmatter E.E., et al., Activation energies for dissociation of double strand oligonucleotide anions: Evidence for Watson-Crick base pairing in vacuo, J. Am. Chem. Soc. 120, 9605, 1998. 40. Clemmer D.E. and Jarrold M.F., Ion mobility measurements and their applications to clusters and biomolecules, J. Mass Spectrosc. 32, 577, 1997. 41. Jarrold M.F., Peptides and proteins in the vapor phase, Annu. Rev. Phys. Chem. 51, 179, 2000. 42. Wu H.B., Desai S.R. and Wang L.S., Evolution of the electronic structure of small vanadium clusters from molecular to bulklike, Phys. Rev. Lett. 77, 2436, 1996. 43. Wang X.B., Ding C.F. and Wang L.S., Vibrationally resolved photoelectron spectra of TiCx
- (x=2-5) clusters, J. Phys. Chem. A 101, 7699, 1997. 44. ISI Web of Science, Thomson ISI, keyword=(ESI OR MALDI) AND (peptide* OR amino acid* OR protein* OR nucleotide* OR oligonucleotide* OR nucleic acid*). This keyword covers all studies of proteins and nucleic acids and their building blocks using ESI or MALDI. 45. Ashton D.S., Beddell C.R., Cooper D.J., et al., Mechanism of production of ions in electrospray mass spectrometry, Org. Mass Spectrom. 28, 721, 1993. 46. Smith R.D., Loo J.A., Barinaga C.J., et al., Collisional activation and collision-activated dissociation of large multiply charged polypeptides and proteins produced by electrospray ionization, J. Am. Soc. Mass Spectrom. 1, 53, 1990.

Reference _____________________________________________________________
94
47. Møller S.P., ELISA, An electrostatic storage ring for atomic physics, Nucl. Instrum. Meth. A 394, 281, 1997. 48. Møller S.P. and Pedersen U.V., Small Electrostatic storage rings; also for highly charged ions, Phys. Scripta T92, 105, 2001. 49. Gerlich D., Inhomogeneous RF fields: a versatile tool for the study of processes with slow ions, Adv. Chem. Phys. 82, 1, 1992. 50. Schlemmer S., Lescop E., von Richthofen J., et al., Laser induced reactions in a 22-pole ion trap: C2H2
++hν3+H2 -> C2H3++H, J. Chem. Phys. 117, 2068, 2002.
51. Wang Y.S., Tsai C.H., Lee Y.T., et al., Investigations of protonated and deprotonated water clusters using a low-temperature 22-pole ion trap, J. Phys. Chem. A 107, 4217, 2003 . 52. Gerlich D., Experimental investigations of ion-molecules reactions relevant to interstellar chemistry, J. Chem. Soc. Faraday T. 89, 2199, 1993. 53. Gerlich D., Ion-neutral collisions in a 22-pole trap at very low energies, Phys. Scripta T 59, 256, 1995. 54. Andersen J.U., Hvelplund P., Nielsen S.B., et al., The combination of an electrospray ion source and an electrostatic storage ring for lifetime and spectroscopy experiments on biomolecules, Rev. Sci. Instrum. 73, 1284, 2002. 55. Tawara H. and Russek A., Charge changing process in Hydrogen beams, Rev. Mod. Phys. 45, 178, 1973. 56. Ryufuku H., Sasaki K. and Watanabe T., Oscillatory behavior of charge-transfer cross-sections as a function of the charge of projectiles in low-energy collisions, Phys. Rev. A 21, 745, 1980. 57. Bárány A., Astner G., Cederquist H., et al., Absolute cross-sections for multi-electron processes in low-energy Arq+ Ar collisions-comparison with theory, Nucl. Instrum. Methods Phys. Res. B 9, 397, 1985. 58. Niehaus A., A classical model for multiple-electron capture in slow collisions of highly charged ions with atoms, J. Phys. B 19, 2925, 1986. 59. Cederquist H., Fardi A., Haghighat K., et al., Electronic response of C60 in slow collisions with highly charged ions, Phys. Rev. A 61, 22712, 2000. 60. Zettergren H., Schmidt H.T., Cederquist H., et al., Static over-the-barrier model for electron transfer between metallic spherical objects, Phys. Rev. A 66, 32710, 2002. 61. Jørgensen T.J.D., Andersen J.U., Hvelplund P., et al., High-energy collisions of multiply charged lysozyme ions in gases, Int. J. Mass Spectrom. 207, 31, 2001.
62. Hoaglund C.S., Liu Y.S., Ellington A.D., et al., Gas-phase DNA: Oligothymidine ion conformers, J. Am. Chem. Soc. 119, 9051, 1997.

Reference _____________________________________________________________
95
63. Nielsen S.B., Andersen J.U., Hvelplund P., et al., Triply charged bradykinin and gramicidin radical cations: their formation and the selective enhancement of charge-directed cleavage processes, Int. J. Mass Spectrom. 213, 235, 2002. 64. Hvelplund P., Liu B., Tomita S., et al., Electron capture and loss by protonated peptides and proteins in collisions with C60 and Na, Eur. Phys. J. D. 22, 75, 2003. 65. Massey H.S.W., Theory of the scattering of slow electros, Rev. Mod. Phys. 28, 199, 1956.
66. Matić M. and Čobić B.C., Electron loss by C- and O- ions in gaseous targets, J. Phys. B 4, 111, 1971.
67 Penent F., Grouart J.P., Hall R.I., et al., Fundamental processes in collisions of O- with atoms and molecules; mechanisms of one- and two-electron loss, J. Phys. B. At. Mol. Phys. 20, 6065, 1987.
68. McLuckey S.A., Habibi-Goudarzi S., Ion-trap tandem mass-spectrometry applied to small multiply-charged oligonucleotides with a modified base, J. Am. Soc. Mass Spectrom. 5, 740, 1994. 69. McLuckey S.A., Vaidyanathan G. and Habibi-Goudarzi S., Charged vs neutral nucleobase loss from multiply-charged oligonucleotide anions, J. Mass Spectrom. 30, 1222, 1995. 70. McLuckey S.A. and Vaidyanathan G., Charge state effects in the decompositions of single-nucleobase oligonucleotide polyanions, Int. J. Mass Spectrom. Ion Processes 162, 1, 1997. 71. Wang P.P., Bartlett M.G., Martin LeRoy B., et al., Electrospray collision-induced dissociation mass spectra of positively charged oligonucleotides, Rap. Comm. Mass Spectrom. 11, 846, 1997. 72. Ni J.S., Mathews M.A.A. and McCloskey J.A., Collision-induced dissociation of polyprotonated oligonucleotides produced by electrospray ionization, Rap. Comm. Mass Spectrom. 11, 535, 1997. 73. Weimann A., Iannitti-Tito P. and Sheil M.M., Characterisation of product ions in high-energy tandem mass spectra of protonated oligonucleotides formed by electrospray ionization, Int. J. Mass Spectrom. 194, 269, 2000. 74. McLuckey S.A., Stephenson J.L. Jr. and O’Hair R.A.J., Decompositions of odd- and even-electron anions derived from deoxy-polyadenylates, J. Am. Soc. Mass Spectrom. 8, 148, 1997.

Reference _____________________________________________________________
96
75. Stephenson J.L. Jr. and McLuckey S.A., Charge reduction of oligonucleotide anions via gas-phase electron transfer to xenon cations, Rapid Commun. Mass Spectrom. 11, 875, 1997.
76. Sinha R.P. and Häder D.P., UV-induced DNA damage and repair: a review, Photochem. Photobiol. Sci. 1, 225, 2002.
77. Frongillo Y., Goulet T., Fraser M.J. et al, Monte Carlo simulation of fast electron and proton tracks in liquid water - II. Nonhomogeneous chemistry, Radiat. Phys. Chem. 51, 229, 1998.
78. Boudaiffa B., Cloutier P., Hunting D., et al., Resonant formation of DNA strand breaks by low-energy (3 to 20 eV) electrons, Nature 287, 1658, 2000.
79. Anbar M. and St. John G.A., Formation of negative-ions under inverted field-ionization conditions, Science 190, 781, 1975. 80. Desfrancois C., Abdoul-Carime H., Schulz C.P., et al., Laser separation of geometrical-isomers of weakly-bound molecular-complexes, Science 269, 1707, 1995. 81. Sevilla M.D., Besler B.B. and Colson A.O., Ab-initio molecular-orbital calculations of DNA radical ions .5. Scaling of calculated electron-affinities and ionization-potentials to experimental values, J. Phys. Chem. 99, 1060, 1995. 82. Desfrancois C., Abdoul-Carime H. and Schermann J.P., Electron attachment to isolated nucleic acid bases, J. Chem. Phys. 104, 7792, 1996. 83. Hendricks J.H., Lyapustina S.A., de Clercq H.L., et al., Dipole bound, nucleic acid base anions studied via negative ion photoelectron spectroscopy, J. Chem. Phys. 104, 7788, 1996. 84. Aflatooni K., Gallup G.A. and Burrow P.D., Electron attachment energies of the DNA bases, J. Phys. Chem. A 102, 6205, 1998. 85. Wesolowski S.S., Leininger M.L., Pentchev P.N., et al., Electron affinities of the DNA and RNA bases, J. Am. Chem. Soc. 123, 4023, 2001. 86. Smith D.M.A., Jalbout A.F., Smets J. et al., Cytosine anions: ab initio study, Chem. Phys. 45, 260, 2000. 87. Hendricks J.H., Lyapustina S.A., de Clercq H.L., et al., The dipole bound-to-covalent anion transformation in uracil, J. Chem. Phys. 108, 8, 1998. 88. Richardson N.A., Wesolowski S.S. and Schaefer H.F., The adenine-thymine base pair radical anion: Adding an electron results in a major structural change, J. Phys. Chem. B 107, 848, 2003. 89. Li X., Cai Z. and Sevilla M.D., Energetics of the radical ions of the AT and AU base pairs: A density functional theory (DFT) study, J. Phys. Chem. A 106, 9345, 2002.

Reference _____________________________________________________________
97
90. Reynisson J. and Steenken S., DFT studies on the pairing abilities of the one-electron reduced or oxidized adenine-thymine base pair, Phys. Chem. Chem. Phys. 4, 5353, 2002. 91. Candeias L.P., Wolf P., O'Neill P., et al., Reaction of hydrated electrons with guanine nucleosides-fast protonation of carbon of the electron adduct, J. Phys. Chem. 96, 10302, 1992. 92. Barrios R., Skurski P. and Simons J., Mechanism for damage to DNA by low-energy electrons, J. Phys. Chem. B 106, 7991, 2002.
93. du Penhoat M.A.H., Huels M.A., Cloutier P., et al., Electron stimulated desorption of H- from thin films of thymine and uracil, J. Chem. Phys. 114, 5755, 2001. 94. Zheng Y., Cloutier P., Hunting D.J., et al., Glycosidic bond cleavage of thymidine by low-energy electrons, J. Am. Chem. Soc. 126, 1002, 2004. 95. Li X.F., Sevilla M.D. and Sanche L., Density functional theory studies of electron interaction with DNA: Can zero eV electrons induce strand breaks?, J. Am. Chem. Soc. 125, 13668, 2003. 96. Ptasinska S., Denifl S., Abedi A., et al., Dissociative electron attachment to gas-phase glycine, Anal. Bioanal. Chem. 377, 1115, 2003. 97. Pan X., Cloutier P., Hunting D., et al., Dissociative electron attachment to DNA, Phys. Rev. Lett. 90, 208102, 2003. 98. Huels M.A., Boudaiffa B., Cloutier P., et al., Single, Double, and multiple double strand breaks induced in DNA by 3-100 eV electrons, J. Am. Chem. Soc. 125, 4467, 2003. 99. Desfancois C., Abdoul-Carime H., Khelifa N., et al., From 1/r to 1/r2 potentials electron-exchange between Rydberg atoms and polar-molecules, Phys. Rev. Lett. 73, 2436, 1994. 100. Brinkman E.A., Berger S., Marks J., et al., Molecular rotation and the observation of dipole-bound states of anions, J. Chem. Phys. 99, 7586, 1993. 101. Lykke K.R., Neumark D.M., Andersen T., et al., Autodetachment spectroscopy and dynamics of CH2CN− and CD2CN−, J. Chem. Phys. 87, 6842, 1987. 102. Gaussian 98, Revision A.9, , G. W. Trucks, H. B. Schlegel, G. E. Scuseria, M. A. Robb, J. R. Cheeseman, V. G. Zakrzewski, J. A. Montgomery, R. E. Stratmann, J. C. Burant, S. Dapprich, J. M. Millam, A. D. Daniels, K. N. Kudin, M. C. Strain, O. Farkas, J. Tomasi, V. Barone, M. Cossi, R. Cammi, B. Mennucci, C. Pomelli, C. Adamo, S. Clifford, J. Ochterski, G. A. Petersson, P. Y. Ayala, Q. Cui, K. Morokuma, D. K. Malick, A. D. Rabuck, K. Raghavachari, J. B. Foresman, J. Cioslowski, J. V. Ortiz, B. B. Stefanov, G. Liu, A. Liashenko, P. Piskorz, I. Komaromi, R. Gomperts, R. L. Martin, D. J. Fox, T. Keith, M. A. Al-Laham, C. Y. Peng, A. Nanayakkara, C. Gonzalez, M. Challacombe, P. M. W. Gill, B. G. Johnson, W. Chen, M.W. Wong, J. L. Andres, M. Head-Gordon, E. S. Replogle, J. A. Pople, Gaussian, Inc. , Pittsburgh, PA, 1998.
Reference _____________________________________________________________
98
103. Wang X.B. and Wang L.S., Observation of negative electron-binding energy in a molecule, Nature 400, 245, 1999. 104. Wang X.B., Ding C.F. and Wang L.S., Electron tunneling through the repulsive Coulomb barrier in photodetachment of multiply charged anions, Chem. Phys. Lett. 307, 391, 1999. 105. Wang X.B., Ding C.F. and Wang L.S., Photodetachment spectroscopy of a doubly charged anion: direct observation of the repulsive coulomb barrier, Phys. Rev. Lett. 81, 3351, 1998.
106. Gohlke S., Abdoul-Carime H. and Illenberger E., Dehydrogenation of adenine induced by slow (< 3 eV) electrons, Chem. Phys. Lett. 380, 595, 2003.
107. Hanel G., Gstir B., Denifl S., et al., Electron attachment to uracil: Effective destruction at subexcitation energies, Phys. Rev. Lett. 90, 188104, 2003.
108. Sanche L., Nanoscopic aspects of radiobiological damage: Fragmentation induced by secondary low-energy electrons, Mass Spectrom. Rev. 21, 349, 2002.
109. Profeta L.T.M., Larkin J.D. and Schaefer H.F., The thymine radicals and their respective anions: molecular structures and electron affinities, Mol. Phys. 101, 3277, 2003. 110. Swarts S.G., Sevilla M.D., Becker D., et al., Radiation-induced DNA damage as a function of hydration .1. release of unaltered bases, Radiat. Res. 129, 333, 1992. 111. Meng C.K. and Fenn J.B., Formation of charged clusters during electrospray ionization of organic solute species, Org. Mass Spectrom. 26, 542, 1991.
112. Blades A.T., Ho Y. and Kebarle P., Free energies of hydration in the gas phase of some phosphate singly and doubly charged anions: (HO)2PO2- (orthophosphate), (HO)O2POPO2(OH)2- (diphosphate), ribose 5-phosphate, adenosine 5’-diphosphate, J. Phys. Chem. 100, 2443, 1996.
113. Wang X.B., Ying X. and Wang L.S., Probing solution-phase species and chemistry in the gas phase, Int. Rev. in Phys. Chem. 21, 473, 2002.
114. Wong R.L. and Williams E.R., Dissociation of SO42-(H2O)n clusters n=3-17, J. Phys.
Chem. A 107, 10976, 2003.
115. Wang X.B., Ying X., Nicholas J. B., et al., Photodetachment of hydrated oxalate dianions in the gas phase, C2O4
2-(H2O)n (n=3-40): from solvated clusters to nanodroplet, J. Chem. Phys. 119, 3631, 2003. 116. Liu D.F., Wyttenbach T., Barran P.E., et al., Sequential Hydration of small protonated peptides, J. Am. Chem. Soc. 125, 8458, 2003.

Reference _____________________________________________________________
99
117. Yang X., Fu Y.J., Wang X.B., et al., Solvent-mediated folding of a doubly charged anion, J. Am. Chem. Soc. 126, 876, 2004.
118. Liu D.F., Wyttenbach T., Carpenter C.J., et al., Investigation of noncovalent interactions in deprotonated peptides: Structural and energetic competition between aggregation and hydration, J. Am. Chem. Soc. 126, 3261, 2004. 119. Tomita S., Forster J.S., Hvelplund P., et al., High energy collisions of protonated water clusters, Eur. Phys. J. D 16, 19, 2001. 120. Liu B., Tomita S., Rangama J., et al., Electron attachment to "naked" and microsolvated nucleotide anions: Detection of long-lived dianions, ChemPhysChem 4,1341, 2003. 121. Berdys J., Anusiewicz I., Skurski P., et al., Damage to model DNA fragments from ery low-energy (<1 eV) electrons, J. Am. Chem. Soc. 126, 6441, 2004. 122. Bransden B.H. and McDowell M.R.C., Charge Exchange and the Theory of Ion-Atom Collisions, Clarendon Press, Oxford, 1992. 123. Walch B., Cocke C.L., Voelpel R., et al., Electron capture from C60 by slow multiply charged ions, Phys. Rev. Lett. 72, 1439, 1994. 124. Brechignac C., Cahuzac P., Concina B., et al., Charge transfer between alkali cluster ions and atoms in the 1 to 10 keV collisional energy range, Eur. Phys. J. D 12, 185, 2000. 125. Knospe O., Jellinek J., Saalmann U., et al., Charge transfer in cluster-atom collisions, Eur. Phys. J. D 5, 1, 1999. 126. Danell A.S. and Glish G.L., Charge permutation reactions in beam type mass spectrometers, Int. J. Mass Spectrom. 212, 219, 2001. 127. Hayakawa S., Internal energy distribution in charge inversion mass spectrometry using alkali metal targets, Int. J. Mass Spectrom. 212, 229, 2001. 128. Hvelplund P., Jørgensen T.J.D., Nielsen S.B., et al., Electron loss from multiply protonated lysozyme ions in high energy collisions with molecular oxygen, J. Am. Soc. Mass Spectrum. 12, 889, 2001. 129. Tomita S., Forster J.S., Hvelplund P., et al., Coincidence studies of O2
−, O− and electron formation in electron-stripping of cationic biomolecules by molecular oxygen, Int. J. Mass Spectrom. 214, 57, 2002. 130. Hertel I.V., Steger H., Vries de J., et al., Giant plasmon excitation in free C60 and C70 molecules studied by photoionization, Phys. Rev. Lett. 68, 784, 1992. 131. Larsen M.C., Hvelplund P., Larsson M.O., et al., Fragmentation of fast positive and negative C60 ions in collisions with rare gas atoms, Eur. Phys. J. D 5, 283, 1999. 132. Purves R.W., Barnett D.A., Ells B., et al., Investigation of bovine ubiquitin conformers separated by high-field asymmetric waveform ion mobility spectrometry: Cross section

Reference _____________________________________________________________
100
measurements using energy-loss experiments with a triple quadrupole mass spectrometer, J. Am. Soc. Mass Spectrom. 11, 738, 2000. 133. McLafferty F.W., Tandem Mass Spectrometry, Wiley, New York, 1983. 134. Busch K.L., Glish G.L. and McLuckey S.A., Mass Spectrometry/ Mass Spectrometry: Technique and Applications of Tandem Mass Spectrometry, VCH, New York, 1998. 135. Roepstorff P. and Fohlman J., Proposal for a common momenclature for sequence ions in mass-spectra of peptides, J. Biomed. Mass Spectrum. 11, 601, 1984. 136. Vékey K., Brenton A.G. and Beynon J.H., Electron-capture induced decomposition of the Benzene C6H6
2+ ion, J. Phys. Chem. 90, 3569, 1986. 137. Horning S.R., Kotiaho T., Dejarme L.E., et al., Dissociative charge-transfer of singly-charged and doubly-charged rare-gas ions with W(CO)6, Int. J. Mass Spectrom. Ion Processes 110, 1, 1991. 138. McLafferty F.W., in: McNeal C.J. (Ed.), Mass Spectrometry in the Analysis of Large Molecules, Wiley, New York, 1986, p. 107. 139. Kjeldsen F., Haselmann K.F., Budnik B.A., et al., Dissociative capture of hot (3–13 eV) electrons by polypeptide polycations: an efficient process accompanied by secondary fragmentation, Chem. Phys. Lett. 356, 201, 2002. 140. Blatt J.M. and Weisskopf V.F., Theoretical Nuclear Physics, 1952, Wiley. 141. Hansen K., Statistical emission process of clusters, Phil. Mag. B 79, 1413, 1999. 142. Andersen J.U., Bonderup E. and Hansen K., Thermionic emission from clusters, J. Phys. B, 35, R1, 2002. 143. Andersen J.U., Andersen L.H., Hvelplund P., et al., Studies of clusters and biomolecules in ELISA, Hyperfine interactions 146, 283, 2003. 144. Andersen J.U., Cederquist H., Forster J.S., et al., Power-law decay of collisionally excited amino acids and quenching by radiative cooling, Eur. Phys. J. D 25, 139, 2003. 145. Andersen J.U., Bonderup E., Hansen K., et al., Temperature concepts for small, isolated systems; 1/t decay and radiative cooling, Eur. Phys. J. D 24, 191, 2003. 146. Hansen K., Andersen J.U., Hvelplund P., et al., Observation of a 1/t decay law for hot clusters and molecules in a storage ring, Phys. Rev. Lett. 87, 123401, 2001. 147. Tomita S., Andersen J.U., Gottrup C., et al., Dissociation energy for C2 loss from fullerene cations in a storage ring, Phys. Rev. Lett. 87, 073401, 2001. 148. Klots C.E., Thermal kinetics in small systems, J. Chem. Phys. 90, 4470, 1989. 149. Klots C.E., Thermal kinetics in small systems . 2. Generalized Arrhenius plots with applicatios to the dissociation of benzene and substituted benzene cations, J. Chem. Phys. 93, 2513, 1990. 150. Lindhard J., Nielsen V. and Scharff M., Approximation method in classical scattering by screened Coulomb Fields, Matemat-Fysis. Meddel. 36, 3, 1968.

Reference _____________________________________________________________
101
151. Andersen J.U., Brink C., Hvelplund P., et al., Radiative cooling of C60, Phys. Rev. Lett. 77, 3991, 1996. 152. Dunbar R.C. and McMahon T.B. Activation of unimolecular reactions by ambient blackbody radiation, Science 279. 194, 1998. 153. Dunbar R.C., BIRD (Blackbody Infrared Radiative Dissociation): evolution, principles and applications, Mass Spectrom. Rev. 23, 127, 2004. 154. Butcher D.J., Asano K.G., Goeringer D.E., et al., Thermal Dissociation of Gaseous Bradykinin Ions, J. Phys. Chem. A 103, 8664, 1999. 155. Papayannopoulos I.A., The interpretation of collision.induced dissociation tandem mass-spectra of peptides, Mass Spectrom. Rev. 14, 49, 1995. 156. Andersen J.U., Cederquist H., Foster J.S., et al., Photodissociation of protonated amino acids and peptides in an ion storage ring. Determination of Arrhenius parameters in the high-temperature limit, Phys. Chem. Chem. Phys. 6, 2676, 2004. 157. Nielsen S.B., Ayotte P., Kelley J.A., et al., Infrared spectra of hydrogen-bonded ion–radical complexes: I2.HCH2 and Br2.HCHBr, J. Phys. Chem. A 111, 10464, 1999. 158. Price P.D. and Williams E.R., Activation of Peptide Ions by Blackbody Radiation: Factors That Lead to Dissociation Kinetics in the Rapid Energy Exchange Limit, J. Phys. Chem. A 101, 8844, 1997. 159. Yamaguchi Y., Frisch M., Gaw J., et al., Analytic evalution and basis set dependence of infrared-spectra, J. Chem. Phys. 84, 2262, 1986. 160. Green W.H., Willetts A., Jayatilaka D., et al., Ab initio prediction of fundamental, overtone and combination band infrared intensities, Chem. Phys. Lett. 169, 127, 1990. 161. Andersen J.U., Hvelplund P., Nielsen S.B., et al., Statistical electron emission after laser excitation of C60 ions from an electrospray source, Phys. Rev. A 65, 053202, 2002. 162. Hansen K. and Echt O., Thermonic emission and Fragmentation of C60, Phys. Rev. Lett. 78, 2337, 1997. 163. Armentrout P.B., Threshold Collision-Induced Dissociations for the Determination of Accurate Gas-Phase Binding Energies and Reaction Barriers, Topics in current chemistry, 225, 233, 2003. 164. Dunbar R.C., Kinetics of low-intensity infrared laser photodissociation. The thermal model and application of the Tolman theorem, J. Chem. Phys. 95, 2537, 1991. 165. Gilbert R.G. and Smith S.C., Theory of unimolecular and recombination reactions, Oxford, 1990. 166. Petke J.D., Maggiora G.M. and Christoffersent R.E., Ab initio configuration interaction and random phase approximation calculations of the excited singlet and triplet states of adenine and guanine, J. Am. Chem. Soc. 112, 5452, 1990. 167. Clark L.B., Transition moments of 2'-deoxyadenosine, J. Phys. Chem. 99, 4466, 1995.

Reference _____________________________________________________________
102
168. Pecourt J.L., Peon J. and Kohler B., DNA Excited-State Dynamics: Ultrafast Internal Conversion and Vibrational Cooling in a Series of Nucleosides, J. Am. Chem. Soc. 123, 10370, 2001. 169. Longworth J.W., Rahn R.O. and Shulman R.G., Luminescence of Pyrimidines, Purines, Nucleosides, and Nucleotides at 77°K. The Effect of Ionization and Tautomerization, J. Chem. Phys. 45, 2930, 1966. 170. Ismail N., Blancafort L., Olivucci M., et al., Ultrafast decay of electronically excited singlet cytosine via a π,π* to no,π* state switch, J. Am. Chem. Soc. 124, 6818, 2002. 171. Brady B.B., Peteanu L.A. and Levy D.H., The electronic spectra of the pyrimidine bases uracil and thymine in a supersonic molecular beam, 147, 538, 1988. 172. Andréasson J., Holmén A., and Albinsson B. The photophysical properties of the adenine chromophore, J. Phys. Chem. A 103, 9782, 1999. 173. Nielsen S.B, Andersen J.U., Foster J.S., et al., Photodestruction of adenosine 5 '-monophosphate (AMP) nucleotide ions in vacuo: Statistical versus nonstatistical processes, Phys. Rev. Lett. 4, 048302, 2003. 174. Lakowicz J.R., Principles of fluorescence spectroscopy, 2nd edn., Kluwer Academic/Plenum, New York, 1999. 175. Engelborghs Y., The analysis of time resolved protein fluorescence in multi-tryptophan proteins, Spectrochim. Acta A 57, 2255, 2001. 176. Ideue S., Sakamoto K., Honma K. et al., Conformational change of electrosprayed cytochrome c studied by laser-induced fluorescence, Chem. Phys. Lett. 337, 79, 2001. 177. Kang H., Dedonder-Lardeux C., Jouvet C., et al., Photo-induced dissociation of protonated tryptophan TrpH+: A direct dissociation channel in the excited states controls the hydrogen atom loss, Phys. Chem. Chem. Phys.6, 2628, 2004. 178. Tanabe T., Chida K., Noda K., et al., An electrostatic storage ring for atomic and molecular science, Nucl. Instrum. Meth. A 482, 595, 2002. 179. Boltalina O.V., Hvelplund P., Jørgensen T.J.D., et al., Electron capture by fluorinated fullerene anions in collisions with Xe atoms, Phys. Rev. A 62, 023202, 2000. 180. Tomita S., Andersen J.U., Cederquist H., et al., Lifetimes of free C60
2- dianions in a storage ring; observation of three electronic states, in preparation. 181. Aggerholm T., Nanita S.C., Koch K.J., et al., Clustering of nucleosides in the presence of alkali metals: Biologically relevant quartets of guanosine, deoxyguanosine and uridine observed by ESI-MS/MS, J. Mass Spectrom. 38, 87, 2003. 182. Shi X.D., Mullaugh K.M., Fettinger J.C., et al., Lipophilic G-quadruplexes are self-assembled ion pair receptors, and the bound anion modulates the kinetic stability of these complexes, J. Am. Chem. Soc. 125, 10830, 2003.