phd thesis 4apr2012 final accepted for award
TRANSCRIPT

1
CARDIFF UNIVERSITY
INVESTMENTS AND INNOVATION: REGIONAL VENTURE CAPITAL ACTIVITY, BUSINESS INNOVATION
AND AN ECOLOGY OF INTERACTIONS
Ioannis Pierrakis
April 2012
A thesis submitted in fulfilment of the requirements
of Cardiff University for the degree of Doctor of Philosophy
2
Abstract
This research adds to the growing literature from recent years on innovation finance, innovation
systems, and regional economic and innovation policy. Although the role of business has been seen
as critical within the regional innovation system, the role of business financing intermediaries has
received considerably less attention despite its recognised role as a central actor of the system. This
research focuses on an innovation player that seems to have been neglected by scholars to date,
namely the venture capital industry. The research examines the role of different types of venture
capital, public and private, in fostering innovation at the regional level. In examining this
relationship, this thesis empirically analyses the characteristics of 4117 investments deals made to
2359 companies, the innovation outputs of these businesses and the responses to a survey of 50
venture capital professionals. The contribution of this thesis is threefold:
First, this thesis investigates whether and how the supply of private sector venture capital and
supportive public interventions has changed the availability of venture capital at the regional level. It
examines the combination of venture capital in the UK regions by providing a detailed analysis of the
extent of venture capital public dependency in each UK region. It also elaborates on the potential
implications of the public sectors’s domination in venture capital provision in several UK regions. The
regional dimension of the analysis is of special interest as it is the first comprehensive analysis of the
source of VC investments (public or private) for each UK region. From a regional perspective, the UK
now appears to have two venture capital markets. In London, the South East and, to a lesser extent,
the East of England, private sector investors dominate investment activity. This contrasts with the
remainder of the UK where the venture capital market is underpinned by extensive public sector
involvement.
Second, this thesis also investigates the role of venture capital in innovation using patents as a proxy
variable for business innovation. In this way, it contributes to the literature by analysing the relation
between patenting practices of venture capital backed firms, paying particular attention to two
aspects: first, the company’s acquisition of venture finance and progress through the venture capital
journey and second, the relationship between patent practices and source of venture capital finance
(public or private) in UK regions. The analysis shows a clear relationship between venture capital
and patents. Companies with patents are more likely to secure follow up venture capital finance
compared with companies without patents. The econometric analysis results also suggest that UK
companies with moderate public venture capital support are positively associated with patents while
companies with extensive public venture capital support are negatively associated with patents,
compared to companies with solely private venture capital support
The final part of the thesis investigates whether the environment in which funds operate may
explain observed differences in the ability of these funds to invest in companies with the potential to
innovate. It does this by examining the ecology of interaction between venture capital and regional
innovation systems. This is the first detailed empirical investigation of the relationship between
different types of venture capital (private or public) and other players of the innovation system such
as universities incubators, research institutes, and regional authorities. Three important findings
emerge from this analysis. First, venture capital public dependence is strongly and significantly
associated with higher volumes of interactions with the outside world. The more publicly dependent
a fund is, the more it interacts with other players of the innovation system. Second, the role of

3
proximity is still important within the VC industry. Venture capitalists from both the private and the
public sector, are more likely to interact with their counterparts from the same region. Third, there is
evidence to suggest that operators of publicly backed funds are lacking close connections with their
counterparts from the private sectors. This may have implications for their ability to approach and
attract private heavy weighted venture capital funds and limited partners that can provide follow on
investments or raise further funding for the fund.
Although publicly backed venture capitalists interact to a greater extent than the private
counterparts, they experience less success (measured as financial performance of the fund or
performance of their portfolio companies). It is widely acknowledged that interactions between
venture capitalists and other players promotes tacit knowledge, but the results of this thesis
suggests that interaction on its own is not enough to provoke success.
Overall, the findings of this research suggests that the distinction between the two venture capital
markets in the UK, publicly or privately driven, is not limited to the volume or type of venture capital
activity but also relates to the ecology of interactions between venture capitalists and other players
of the regional innovation system. Since publicly backed funds do not promote innovation to the
same extent that private funds do when they invest alone, UK regions that are heavily dependent on
public investments may not be able to receive the benefits of a functional venture capital industry.
However, regions in which public venture capital funds work closely with private funds, demonstrate
a relatively higher volume of venture capital backed companies with the potential to innovate. From
a policy perspective, this finding suggests that from an innovation point of view, free public standing
investments should be minimised while co-investments between publicly backed and private
venture capital funds should be further encouraged.

4
Acknowledgements
I am very grateful to several individuals which without their support, this thesis would not have been
possible. First and foremost, I would like to acknowledge my supervisors – Gillian Bristow and Kevin
Morgan - for their continuing support, enthusiasm and the time that have spent working with me on
this thesis. I would also like to thank John Lovering for the very detailed and constructive feedback
which enabled me to advance this study further. I would also like to extend my gratitude to several
people that helped me in conducting this research: Colin Mason for his expert advice and support
throughout this study; the 50 professionals from several venture capital funds including Abingworth
LLP, Avlar Bioventures Ltd, Cre8Ventures, Creative Advantage Fund, Eden Ventures UK Ltd,
Enterprise Ventures Ltd, Finance South East, Finance Wales, Hafren Ventures LLP, Index Ventures,
London Technology Fund, NESTA, NorthStarr Equity Investors, PUK Ventures, Seraphim Capital,
Sigma Capital Group plc, South East Growth Fund, TTP Ventures, Viking Fund, WME, YFM Group, that
kindly accepted to complete the survey; the UK Patents Office for their assistance with the patent
application data; Albert Bravo-Biosca, Liam Collins, Mark Fenwick, Hugh Gardner, Ivan Griffin,
Anthea Harrison, Alex Hook, Libby Kinsey, Nick Moon, Meirion Thomas, George Whitehead and Iain
Wilcock, for their support in various parts of this study. I would also like to thank two friends
beyond my professional environment, Glyn and Sasha Evans, for their support, trust, encouragement
and the significant time they spent in helping me with this study. They now know far more about
venture capital than they ever wished to. Finally, I would like to thank my family for their continuing
support and encouragement to fulfil this life time aspiration.

5
Table of Contents
1 CHAPTER 1: INTRODUCTION ................................................................................ 13
1.1 Background ................................................................................................................ 13
1.2 The area of the study ................................................................................................ 14
1.3 Research questions ................................................................................................... 16
1.4 Methodology ............................................................................................................. 18
1.5 Structure of the thesis ............................................................................................... 19
2 CHAPTER 2: REGIONAL DEVELOPMENT, INNOVATION POLICY AND VENTURE CAPITAL:
THEORETICAL APPROACHES AND HISTORIC OVERVIEW ............................................. 22
2.1 Innovation and the regions ....................................................................................... 22
2.1.1 Regional economic development theories ........................................................ 23
2.1.2 Why some regions grow and develop faster than others? ............................... 24
2.1.2.1 External economies .................................................................................... 25
2.1.3 Regional development and innovation .............................................................. 28
2.1.4 From regionalisation to regionalism: the birth of regional innovation systems
30
2.1.5 Clusters policy .................................................................................................... 32
2.1.6 Critical reflection on new regionalism and knowledge regions ........................ 33
2.2 Access to finance ....................................................................................................... 34
2.2.1 Financing innovation .......................................................................................... 35
2.2.2 Defining venture capital ..................................................................................... 37
2.2.3 Venture capital and the firm .............................................................................. 38
2.3 The role of venture capital in innovation and regional development ...................... 40
2.3.1 Venture capital and company growth ............................................................... 41
2.3.2 Creation of new industries ................................................................................. 42
2.3.3 Networking and clustering ................................................................................. 43
2.3.4 Patents and business R&D expenditure ............................................................ 43
2.4 The regional dimension of the venture capital industry ........................................... 44
2.4.1 The demand and supply side argument ............................................................ 48
2.4.2 Policy responses to the equity gap .................................................................... 50
2.4.3 Venture capitalists skills in public sector funds ................................................. 53
2.5 Venture capital, interactions and proximity ............................................................. 55
2.5.1 Information asymmetries .................................................................................. 55
2.5.2 Interaction as a mean of minimising asymmetries ............................................ 57
2.6 Conclusion ................................................................................................................. 61
3 CHAPTER 3: POLICY FRAMEWORK FOR VENTURE CAPITAL IN THE UK ............... 64
3.1 Introduction............................................................................................................... 64

6
3.2 Historical overview of venture capital in the UK ...................................................... 65
3.3 The place and size of venture capital in the UK’s financial architecture .................. 68
3.3.1 Informal venture capital .................................................................................... 69
3.3.2 External sources of firm finance ........................................................................ 70
3.4 Venture capital finance ............................................................................................. 71
3.5 The role of government in early stage investment ................................................... 72
3.5.1 Supporting innovation through publicly backed VC initiatives ......................... 74
3.5.2 Evaluations of government schemes ................................................................ 76
3.6 The impact of the global financial crisis on UK growth finance ................................ 79
3.6.1 No signs of recovery ........................................................................................... 83
3.7 Conclusion ................................................................................................................. 84
4 CHAPTER 4: METHODOLOGY ............................................................................... 85
4.1 Introduction............................................................................................................... 85
4.2 Hypotheses and research questions ......................................................................... 85
4.3 Methodological approaches...................................................................................... 88
4.4 Research design ......................................................................................................... 93
4.4.1 Analysis of academic literature and the policy framework pertaining to the
venture capital industry ................................................................................................... 93
4.4.2 Collection and analysis of data on the UK VC investments activity .................. 93
4.4.2.1 Aggregated data ......................................................................................... 93
4.4.2.2 Disaggregated data ..................................................................................... 94
4.4.3 Investigating the relationship between venture capital and innovation .......... 96
4.4.4 Examining the relationship between the potential of a business to innovate
and the type of venture capital investments ................................................................... 97
4.4.5 Collection and analysis of primary data through a survey of individual venture
capitalists ......................................................................................................................... 99
4.4.5.1 Identifying the study sample .................................................................... 100
4.4.5.2 Descriptive statistics and sample bias control ......................................... 102
4.4.5.3 Variables ................................................................................................... 104
4.4.6 Semi-structured and face to face in depth interviews with professional finance
agents 106
4.4.7 Insight knowledge of the market through personal work experience ............ 107
4.4.8 Case study approach ........................................................................................ 107
4.5 Conclusion ............................................................................................................... 108
5 CHAPTER 5: VENTURE CAPITAL ACTIVITY IN UK REGIONS ................................. 109
5.1 Introduction............................................................................................................. 109
5.2 Venture capital trends in the UK regions ................................................................ 110
5.2.1 The distribution of risk capital investments in the UK regions by stage ......... 112
5.3 Regions’ expected share of the VC market ............................................................. 115
5.3.1 Regions’ expected share of early stage VC investment in time ...................... 117
5.4 Source of investments ............................................................................................. 121
5.4.1 Types of investor - early stage investments .................................................... 125

7
5.5 The regional distribution of venture capital investments: types of investors ........ 127
5.6 A historic overview of the venture capital activity in Wales .................................. 131
5.6.1 Venture capital activity in Wales ..................................................................... 131
5.7 Conclusion ............................................................................................................... 135
6 CHAPTER 6: THE RELATIONSHIP BETWEEN VENTURE CAPITAL AND INNOVATION139
6.1 Introduction............................................................................................................. 139
6.2 Theories and hypothesis ......................................................................................... 140
6.2.1 Measures of innovation ................................................................................... 140
6.3 Relationship between venture capital and innovation, country and regional-level
analysis ............................................................................................................................... 143
6.3.1 Country level analysis ...................................................................................... 143
6.3.2 The relationship between VC activity and regional innovation outputs: A
regional regression analysis ........................................................................................... 147
6.4 Firm level analysis ................................................................................................... 150
6.4.1 Limitations........................................................................................................ 150
6.4.2 Patents and venture capital investment journey ............................................ 152
6.4.2.1 Source of finance ...................................................................................... 155
6.4.2.2 Industry variations .................................................................................... 157
6.4.2.3 The relationship between industry and investment characteristics ........ 159
6.4.2.4 The relationship between size of deals and regions ................................ 160
6.4.3 The relationship between patents and regions ............................................... 162
6.4.4 The relationship between investment characteristics and regions ................ 164
6.5 Regression analysis – Source of venture capital and potential of firms to innovate
166
6.5.1 The impact of different source of VC investments in company’s innovation
outputs: A multivariate sub-regional analysis ............................................................... 166
6.5.2 Estimation technique ....................................................................................... 167
6.5.3 Extending the analysis to incorporate cluster effects – firm level analysis ..... 167
6.5.4 Additional tests ................................................................................................ 174
6.5.5 Summary results .............................................................................................. 174
6.6 Conclusions.............................................................................................................. 175
7 CHAPTER 7: EXAMINING THE ECOLOGY OF INTERACTION BETWEEN THE INNOVATION
AND FINANCE COMMUNITIES ................................................................................... 179
7.1 Introduction............................................................................................................. 179
7.2 Descriptive statistics ................................................................................................ 181
7.2.1 Source of funds ................................................................................................ 181
7.2.2 Fund characteristics ......................................................................................... 183
7.2.3 Source of deals ................................................................................................. 185
7.2.4 Industry focus................................................................................................... 187
7.2.5 Investment criteria ........................................................................................... 189
7.2.6 Personal characteristics of venture capitalists ................................................ 190
7.2.7 Rate of interaction ........................................................................................... 191

8
7.3 Limitations ............................................................................................................... 197
7.4 Are these differences robust? ................................................................................. 197
7.5 Ecology of interactions within the Welsh VC community ....................................... 204
7.6 Conclusions.............................................................................................................. 206
8 CHAPTER 8 : CONCLUSIONS ............................................................................... 211
8.1 Introduction............................................................................................................. 211
8.2 Theoretical and empirical contributions to broader academic debates ................ 212
8.2.1 Theoretical contributions................................................................................. 212
8.2.2 Empirical contributions .................................................................................... 217
8.3 Summary of research findings ................................................................................ 219
8.3.1 Public venture capital investments .................................................................. 219
8.3.2 Relationship between venture capital and innovation ................................... 220
8.3.3 Ecology of interactions..................................................................................... 222
8.3.4 The region of Wales ......................................................................................... 225
8.4 Policy implications and contributions ..................................................................... 227
8.4.1 What kind of policy is needed? ........................................................................ 229
8.5 Future research questions ...................................................................................... 232
9 REFERENCES ....................................................................................................... 234
10 APPENDICES ....................................................................................................... 249
10.1 - Appendix I: Venture capital Government schemes .......................................... 249
10.2 Appendix II: Data sources and analysis .............................................................. 252
10.2.1 Descriptive statistics and sample bias control ................................................. 256
10.2.1.1 Chi-square goodness of fit analysis .......................................................... 257
10.3 Appendix III: List of contacted venture capital funds ......................................... 259
10.4 Appendix IV: Survey questionnaire ..................................................................... 261

9
List of Tables
Table 1: Aspects of regional and private innovation systems .............................................................. 47
Table 2: UK early stage investments 2000-8 ......................................................................................... 67
Table 3: Economic geography theories ................................................................................................. 91
Table 4: Description of variables ........................................................................................................... 98
Table 5: Response rate ........................................................................................................................ 101
Table 6: Geographical representation of the sample ......................................................................... 102
Table 7: Size of the funds in the sample ............................................................................................. 104
Table 8: List of responders .................................................................................................................. 105
Table 9: Names and organisation of professionals that have been interviewed ............................... 107
Table 10: Proportion of cumulative invested risk capital by region, 1985-2007 ................................ 113
Table 11: Regional distribution of risk capital by stage in the UK regions 1998-2007 ....................... 114
Table 12: Location quotient 1992-1998 and 1999-2007 .................................................................... 116
Table 13: Regional distribution of venture capital and private equity 1998-2007 ............................. 117
Table 14: Distribution of early stage investments in the UK: number and region ............................. 118
Table 15: Distribution of early stage investments in the UK: amount invested and region ............... 118
Table 16: Main investors in Wales ...................................................................................................... 135
Table 17: Innovation related indicators for the period 1995-2007 .................................................... 143
Table 18: Correlations between venture capital and innovation related indicators .......................... 146
Table 19: Relationship between venture capital, patent application and business R&D at the region
level ..................................................................................................................................................... 148
Table 20: VC investment made to companies .................................................................................... 152
Table 21: Descriptive statistics ............................................................................................................ 154
Table 22 : Investments by source of finance ...................................................................................... 155
Table 23: Descriptive Statistics – Financial source of publicly backed funds ..................................... 156
Table 24: Descriptive statistics – Industry and source of VC .............................................................. 157
Table 25: Correlations between deal characteristics and industry .................................................... 159
Table 26: Tests for differences in the means of size of deal and funding rounds, 2000-2008 ........... 161

10
Table 27: Proportion of patents by region and source of finance ...................................................... 163
Table 28: OLS and Probit estimates of factors affecting patents creation – Public investments ....... 168
Table 29: OLS and Probit estimates of factors affecting patents creation – Solely public investments
and co-investments ............................................................................................................................. 171
Table 30: Proportion of funds under management received by a public body .................................. 182
Table 31: Sources of public finance .................................................................................................... 182
Table 32: Fund size, portfolio companies revenue and co-investments ............................................ 183
Table 33: Preferred co-investor .......................................................................................................... 184
Table 34: Preferred stage of development ......................................................................................... 185
Table 35: Deal sources ........................................................................................................................ 186
Table 36: Source of deals by type of fund .......................................................................................... 186
Table 37: Correlation between sources of deals and type of funds ................................................... 187
Table 38: Preferred industries ............................................................................................................ 188
Table 39: Investment criteria .............................................................................................................. 189
Table 40: Venture Capitalists personal characteristics ....................................................................... 190
Table 41: Rate of interaction with the internal community ............................................................... 193
Table 42: External interactions ........................................................................................................... 196
Table 43: Regression analysis, rate of interaction between VC and the internal finance community
............................................................................................................................................................ 198
Table 44: Regression analysis, rate of interaction between VC and the innovation community ....... 202
Table 45: Response rate ...................................................................................................................... 255
Table 46: Geographical representation of the sample ....................................................................... 256
11
List of Figures
Figure 1: Area of the study .................................................................................................................... 15
Figure 2: Early stage VC investments as a proportion of GDP per country, 2008 ................................ 65
Figure 3: UK Private Equity investments by BVCA members, 1995-2009 ............................................. 65
Figure 4: Business Finance Architecture ............................................................................................... 68
Figure 5: External sources of finance - percentage of business using various financial products ........ 71
Figure 6: Regional Innovation System and Regional Finance System ................................................... 72
Figure 7: Traditional Approach of Regional Systems of Innovation ...................................................... 74
Figure 8: Financial Activity within the Regional Innovation System ..................................................... 75
Figure 9: Venture Capital Investments, number of companies by stage, 2000-2009 .......................... 80
Figure 10: Venture Capital Investments, amount invested by stage (£m), 2000-2009 ........................ 80
Figure 11: Number of funds closed by stage, 2000-2009 ..................................................................... 82
Figure 12: Amounts raised by stage, 2000-2009 .................................................................................. 82
Figure 13: Study Sample ....................................................................................................................... 95
Figure 14: Regional coverage .............................................................................................................. 103
Figure 15: VC backed companies by region and by stage, 1998-2008 ............................................... 111
Figure 16: Venture Capital amounts invested by region, 1995-2008 ................................................ 112
Figure 17: Proportion of investments by type of investor, 2000-2008.............................................. 122
Figure 18: Co-investments as a proportion of deals ........................................................................... 123
Figure 19: Distribution of deals sizes by type of investor, 2007 ......................................................... 124
Figure 20: Proportion of deals with Business Angels involvement ..................................................... 125
Figure 21: Early stage investments by year and type of investor 2000-2008 ..................................... 126
Figure 22: Proportion of different types of investors in early stage deals in the UK regions 2000-2008
............................................................................................................................................................ 127
Figure 23: Proportion of investments involving the public sector by year by region ......................... 129
Figure 24: Proportion of early stage deals involving Business Angels by region ................................ 130
Figure 25: Investment Activity in Wales since 1984 ........................................................................... 133
Figure 26: Venture capital Investments and regional gross added value in 2007 .............................. 134

12
Figure 27: Trends in venture capital investments and business R&D expenditure, 1995-2007 ......... 144
Figure 28: Trends in Venture Capital investments and patent applications, 1995-2005 ................... 145
Figure 29: Patents by stage and source of finance ............................................................................. 154
Figure 30: Proportion of investments that were made to companies with and without patents, 2000-
2008 .................................................................................................................................................... 162
Figure 31: Source of finance and regions............................................................................................ 165
Figure 32: Preferred industry .............................................................................................................. 188
Figure 33: Investment criteria ............................................................................................................. 189
Figure 34: Internal interactions of the venture capital community (rating average) ......................... 192
Figure 35: External interactions of the venture capital community (rating average) ........................ 195
Figure 36: Ecology of interactions in Wales (internal finance community) ........................................ 205
Figure 37: Ecology of interaction in Wales (innovation system) ........................................................ 206

13
1 CHAPTER 1: INTRODUCTION
1.1 Background
The study of venture capital (VC) and its relationship with regional development remains relatively
underdeveloped in comparison to some of the core economic geography topics such as innovation,
technology transfer, the knowledge economy and clusters. Venture capital is defined as
“independent, professionally managed, dedicated pools of capital that focus on equity or equity-
linked investments in privately held, high growth companies” (Gompers and Lerner, 2001:146)
However, the role that venture capital plays in underpinning vibrant economies and supporting the
entrepreneurial process is in fact well established (Zook 2000; Cooke 2001; Mason and Harrison
2002a, 2003). The impact of VC in innovation is also well documented mainly by studies undertaken
in the United States. A study conducted by Kortum and Lerner (2000) suggests that increases in
venture capital activity are strongly associated with increases in innovation activity and that by 1998
the provision of venture capital funding to firms accounted for about 14 percent of U.S. innovative
activity. Another study, again conducted in the U.S by Puri and Zarutskie (2008), suggests that the
amount of employment generated by VC backed firms accounts for nearly 10 percent of
employment in the US in the late 1990s and early 2000s, steadily rising from about 5 percent in the
1980s. Illustrating the diversity of factors involved in the “innovation growth engine” of a leading
region, namely Silicon Valley, Cooke (2003) highlights that venture capital is crucial as the means by
which ideas have been screened and selected given a chance to fly as commercial products or
services. Komninos (2004) regards funding organisations amongst the critical components of a
regional innovation system and argues that integration takes place between the separate
components of the regional innovation process: R&D, innovation finance, technology transfer, new
product development, and co-operation production.
To date, most of the work conducted on UK venture capital and its regional impact, has been
concerned with mapping the spatial distribution and take up of venture capital investment and
drawing out the possible implications for regional development (Mason 1987; Mason and Harrison
2002a, 2003; Sunley et al. 2005, Murray 2007). Particular focus has also been given to the
geographical heterogeneity of the finance industry which has highlighted the high concentration of
risk capital investments in South East and East England (notably Cambridge), regions with, commonly

14
acknowledged, effective regional innovation systems in place (see SQW ‘The Cambridge
Phenomenon’ 1985). It is believed that the concentration of both venture capital and knowledge
based firms established in these two regions has provided significant advantages and opportunities
for their regional innovation systems to flourish. Despite this strong belief, little attention has been
given in documenting the actual impact of VC in innovation at the UK regional level or in mapping
the linkages between the players of the regional innovation systems and VC community. This is thus
the purpose of this study which focuses on understanding the role of the supply-side of the VC
industry.
1.2 The area of the study
A strong regional innovation system can be seen as one with systemic linkages between different
sources of knowledge production (universities, research institutions, and other intermediary
organisations) and both large and small firms (Cooke 2003). These organisations contribute to the
generation and diffusion of knowledge by establishing stable pathways of information with a
distinctive group of regional players. Amongst these players, finance organisations have a prominent
role and constitute an essential part of the innovation system as finance capital (defined broadly as
capital that is invested in companies, new products, shares, stock etc.) is essential for any type of
economic development. One particular source of capital, the VC industry, is an integral part of the
innovation system as it tends to establish operational frameworks and close working relationships
with other players of such system in particular universities, incubators, laboratories, research
institutes etc. The VC community therefore, shares common ground with both the finance
community and the innovation community. Figure 1 graphically illustrates the area of study of this
thesis, the area in which the innovation and the finance community overlap.

15
Figure 1: Area of the study
Some of the most developed regional innovation systems (such as Silicon Valley and Cambridge) are
widely acknowledged to have a range of networks, stakeholders and institutions that help explain
their innovation and economic success (see Porter 1998, Cooke 2001, 2002). These regions typically
host world class universities and research institutions which are actively involved in the creation of
spin out firms and the exploitation of intellectual property rights. However, a further key part of the
explanation offered for high levels of innovation and new firm creation is that these regions have
attracted, or had easy access to, substantial venture capital investment through funds that are either
based in the region or in an adjacent geographical area (SQW 1985). Boston and Cambridge (UK) are
interesting instances of world-class science attracting critical mass in venture capital (Cooke 2002).
It is believed that the extreme concentration of both venture capital and knowledge based firms
established in these two regions has created significant opportunities for their regional innovation
systems to flourish.
In recent years government policy in the UK has sought to encourage the replication of such
conditions through the creation of publicly funded and inspired regional venture capital funds
operated by the public sector or in a partnership between the public and private sector. Since early
2000, a number of government backed initiatives allowed many of the traditional players of the
innovation system to benefit from the establishment of venture capital funds e.g. several
universities established their own VC funds through the University Challenge Funds (UCFs)
government scheme. Through another government initiative, regional development agencies (RDAs)
set up Regional Venture Capital Funds (RVCFs) which invest together with private investors in
companies that are based regionally. Furthermore, the regions of Wales and Scotland set up their
Innovation Community
Finance
Community

16
own regional venture capital funds (Finance Wales and Scottish Enterprise respectively). Although
these schemes increased the supply of finance to regional firms, their role in enhancing prospects
for regional innovation has not yet been evaluated.
1.3 Research questions
Despite the increasing importance of private equity as an asset class, the economic and social impact
of the industry has not yet been fully understood. Among the growing literature, one strand is
focused on the impact of venture capital in innovation. This thesis aims to make a contribution with
respect to this topic which has been mainly influenced by the work of Gompers and Lerner (2001) on
the impact of VC in innovation, the work of Cooke (1985, 1995, 2002, 2003a, 2003b, 2008), Cooke
and Morgan (1994, 1998) on the regional innovation systems, and the work of Zook (2000), Mason
and Harrison (2002a, 2003) on regional finance systems.
More particularly, this study examines the argument that the venture capital community plays an
important role in the operation of vibrant and successful regional innovation systems, especially in
the early, commercialization stage of the innovation process. Given this spread of venture finance
activities amongst the key players of the regional innovation system, several research questions arise
concerning the impact that these activities have in the innovation performance of the region.
Venture capital is not equally distributed in all parts of the UK and there is a concentration of
venture capital activity in London and the South East (Mason and Harrison 2002a, Mason 2007). In
order to allow all UK regions to benefit from a fully functional venture capital market, several
regional VC funds were established with government support. Such funds aimed not only to address
the regional equity gaps by increasing the availability of finance to small start-ups in each region
(Murray 2007) but also to stimulate regional entrepreneurial activity and spill over effects (Mason
and Harrison 2002a, Martin et al. 2002). Several years after the introduction of such schemes, a
natural question is what has been the impact of these schemes in achieving their objectives.
Therefore, the first research question of this thesis is concerned with changes in the availability of
venture capital finance in each UK region:
1) Has the supply of private sector venture capital and supportive public interventions changed
the availability of venture capital at the regional level?
Linked to the supply of venture capital finance is the second question of this thesis which examines
the relationship between venture capital and innovation. More particularly, the literature suggests
that there is a strong relationship between venture capital and innovation. Venture capital backed

17
companies are responsible for a disproportionate number of patents and bring more radical
innovations to the market compared with firms that rely on other types of finance (Kortum and
Lerner 2002, Gompers and Lerner 2001). In addition, there is a close relationship between the
patenting behaviour of start-ups and the progress of those firms through the venture capital cycle
(Mann and Sager 2007). The second question of this thesis therefore, investigates whether such a
relationship is present in UK VC backed companies:
2) Is a higher volume of VC investments positively correlated with higher volume of patent
applications?
The positive relationship between venture capital and innovation is often credited to the ability of
venture capital professionals to select innovative opportunities and to also provide mentoring and
support (Mondher and Sana 2009). The capabilities of public sector venture capital professionals
however, are often questioned in terms of both selecting and “nurturing” business opportunities.
Such professionals are often criticised for a lack of track record, limited experience and political
motivations (Mason and Harrison 2003, NESTA 2009, Munary and Toschi 2010). Some relatively
recent evaluations of the schemes have found that publicly backed funds underperform relative to
private funds in terms of financial returns (NAO 2009), and that their impact in business
performance has been marginal (NESTA and BVCA 2009). However, little is currently known about
the role of these funds in stimulating innovation. A third question for this thesis as thus:
3) Are publicly backed funds less effective in investing in companies with the potential to
innovate, than private funds?
Innovation policy approaches embrace the role of local linkages, tacit knowledge and interaction
amongst different players (Morgan 1997). The benefits of interaction and networking between
investors and investee companies are well documented (Hochberg et al. 2007, Sorenson and Stuart
2001, Sapienza and Amason 1993, Pinch and Sunley 2009). However, very little is currently known
about how venture capital funds interact with other players of the innovation system, and whether
there are differences in the extent and type of interactions between public and venture capital
funds. The dynamics of the regional environment and the attitudinal and behavioural characteristics
of the different types of venture capital funds (public or private), may influence the ability of
different types of VC funds to identify and invest in companies with the potential to innovate. The
final question of this thesis is therefore concerned with the ecology of interactions between
different players of the innovation system:

18
4) What is the ecology of interaction between venture capital and regional innovation systems,
how does this differ spatially and why, and how does the venture capital community fit
within the regional innovation system?
1.4 Methodology
In order to test this hypothesis, this research is being conducted around two intertwined strands:
i) Measuring and analysing the volume and the role of VC in the UK regions:
By capturing and measuring the formal and partially the informal VC investment activity and also
their role in the region’s innovation performance this research analyses the significance of provision
of venture capital in regional economies.
ii) Mapping the networks that enable VC in a region:
By tracing the relational networks of fund managers with other players of the innovation systems
(e.g. universities, regional development agencies etc.) this research highlights the connections of the
regional finance community with the mainstream players of the regional innovation system, its
linkages to decisive circuits of human capital and influence on institutional architectures. It also
investigates the spatial dimension of these networks and how the interactions between different
bodies of the system are shaped by their specific regional contexts which are in turn influenced by
economics, culture and governance characteristics of the region.
Adopting a two strand approach allows important results on the role of VC to be obtained and
analysed, while steadily building a more complete and purposeful map of the networks and systems
within which VC operates in the regions.
To answer the four research questions, the thesis employs a combination of research techniques. To
measure the impact of publicly backed VC in the supply of finance at the regional level, commercial
databases are used that contain individual VC deals. Investments are separated by region, type
(public or private) and by year in order to unveil market trends. To examine the role of VC in the
volume of innovation in the UK regions, the relationship between VC and patents creation using
econometric models, is analysed. Finally, in order to map the ecology of interaction between VC and
regional innovation systems, a survey of individual venture capitalists is conducted and the results
are analysed in an econometric framework. This specific research methodology thus contributes to
the debate between economists and economic geographers regarding the use of quantitative and
qualitative techniques and their ability to identify impact and determine causality.

19
The research provides important new insights into, inter alia, the impact of different forms of risk
capital (private vs public, formal vs informal etc.) on regional economies; the extent and type of
network relationships which enable risk capital to achieve its impact within a regional economic
system, and the potential policy options and prescriptions available to ensure that risk capital and
VC investors maximise their impact and influence of regional economic growth, competitiveness
and, crucially, innovation performance.
This thesis extends the existing academic literature in the following three ways: first, by using
disaggregated data that has not been used before in academic studies, it is possible to examine the
regional landscape of venture capital investments in the UK paying particular attention to the impact
of public policy interventions; second, using a combination of aggregated and disaggregated data it
is possible to examine the role of VC and public intervention in influencing the volume of innovation
expressed through patents creation; third, using the respondents of 50 venture capitalists to a
survey, it was possible to examine what may drive innovation performance differences between
private and public funds by analysing the ecology of interaction between different types of VC funds
with other players of the innovation system. Finally, the combination of these findings provide a
better understanding of the spatial dimension of the VC activities and their role in the innovation
environment of different UK regions.
1.5 Structure of the thesis
The thesis is organised as follows: chapter 2 provides a comprehensive review of the literature
concerned with the main topics of this thesis. It first examines the role of the region in economic
development and the uneven regional development. It then reviews the central theories of regional
economic development, examining how they have changed overtime and emphasising innovation
policy approaches. It then focuses on the role of finance in regional development and highlights the
growing literature on the role of venture capital as a central means of financing innovation. It details
the benefits of venture capital investments to the firm and also to the region as a whole. The
chapter then concentrates on the regional dimension of the venture capital industry, outlines the
localised effects of the industry in the UK and the main arguments of the closely linked “demand and
supply side” and “market failure” debate. The policy responses to this failure are also outlined. The
chapter concludes by reviewing the existing literature on the interactions and proximity of venture
capital investments.
Chapter 3 provides the policy framework and reviews the “grey literature” of venture capital while
also describing its evolution in the UK. It provides a historic overview of the UK venture capital

20
industry and positions it within the UK financial ecosystem. It then outlines regional imbalances in
terms of VC activity and details policy initiatives undertaken as a response to these imbalances. The
chapter concludes with an analysis of the impact of the current financial crisis in the VC industry.
Chapter 4 presents and justifies the research methodology employed by this study. It analyses the
benefits and limitations of alternative methods of data collection and analysis used in undertaking
the research. Influenced by the work of economic geographers and economists, this chapter draws
particular attention to the debate related to the use of quantitative and qualitative analysis. The first
part of this chapter illustrates the hypotheses to be tested and formulates the research questions.
Part two, reviews the theoretical debates and philosophical assumptions that accompany the
research methods. Part three includes a description of the quantitative and the qualitative methods
used in this research. The final part of this chapter provides a detailed description of how this work
has been conducted.
Chapter 5 presents the first set of findings of this thesis. It provides a detail empirical picture of the
supply of early stage venture capital and it updates earlier evidence on the uneven geography of
venture capital in the UK. In doing this, it examines the involvement of publicly backed funds in VC
market and their contribution in the supply of VC finance at the regional level. This chapter
addresses the first research question of the thesis which is concerned with the effect of increased
government intervention in the supply of venture capital on the geography of venture capital in the
UK in the early 21st century. This chapter provides a regional perspective on VC literature that to
date has been primarily focused on the national level.
Chapter 6 examines the relationship between venture capital and innovation and analyses the likely
impact of different sources of venture capital (public or private) on the innovation potential of
companies. This chapter builds on previous empirical research which shows that venture capital
spurs innovation through the creation of patents and increases in business R&D expenditure, and
extends it to the UK level. The data allows the relations between financing and innovation outputs
to be compared across regions and therefore seeks to illuminate the under-researched issue of
regional variations in venture capital investments and the role of venture capital in fostering
innovation. An important contribution here is the investigation of the relation between different
sources of finance of VC funds and the innovation potential of the companies with which these funds
are engaged. This chapter investigates the likely impact of these public interventions on innovation
and provides answers to research questions 2 and 3.

21
Chapter 7 examines the role of the venture capital community in enhancing regional linkages and
networks within the regional innovation system. It empirically maps the linkages and examines the
extent of interaction between venture capitalists with other professionals in the regional innovation
system. More particularly, this chapter studies the ecology of interaction between venture capital
funds and other players in the innovation system by examining the responses to a survey completed
by 50 UK based early stage venture capitalists. It measures the rate of interactions and explores
their professional network of contacts in an attempt to understand the different regional
environments in which venture capital funds operate. Therefore the aim of this chapter is twofold,
first to measure how often UK venture capitalists interact with other players of the regional
innovation system, and second, to investigate what parameters may influence the extent of such
interaction.
Finally chapter 8 concludes the thesis by identifying the theoretical and empirical contribution of this
thesis to the existing knowledge base. It also elaborates the policy implications of the research
findings and provides a set of questions for future research.

22
2 CHAPTER 2: REGIONAL DEVELOPMENT, INNOVATION POLICY
AND VENTURE CAPITAL: THEORETICAL APPROACHES AND
HISTORIC OVERVIEW
The purpose of this chapter is to provide an overview of the academic literature concerned with the
main topics of the research as outlined in the previous chapter. It reviews the theories related to
uneven regional development and regional innovation policy. It also reviews the literature
concerned with understanding geographies of finance, the role of venture capital in supporting
innovation and interaction frameworks within the finance community. By tracing the different
approaches taken to understanding regional development, innovation, financial practices and
geographies of money, this chapter indicates how and why these literatures are related to the thesis.
The chapter begins by reviewing the central theories of regional development and innovation. It
continues by examining the literature on financing business innovation, illustrating the
characteristics of venture capital and its benefits to firms and regions. It then examines the literature
on the role of venture capital in regional innovation and concludes by surveying the theories on
interaction and their importance in minimising information asymmetries within the financial system.
2.1 Innovation and the regions
The changing nature of the region and its increasing importance, have become an important subject
for debate. Regions (and places) have been at the heart of geographical discourse since the
institutionalisation of the discipline (Paasi 1991). In the early 1980s, it was asserted that the region
might be a fundamental basis of economic and social life. At the heart of this argument was the
notion that the nation state was undergoing some form of crisis to which state management (and
response) was required across a number of spatial scales (Deas and Ward 2000). The formation of
Regional Development Agencies (RDAs) in the UK regions reflected the appeal of the notion that the
nation-state had become increasingly dysfunctional and that instances of successful economic
transformation had been organised around regional networks of institutions (Cooke 1995; Deas and
Ward 2000). Indeed,
“since new successful forms of production – different from the canonical mass production systems of
the postwar period - were emerging in some regions and not others, and since they seemed to

23
involve both localisation and regional differences and specificities (institutional, technological), it
followed that there might be something fundamental that linked late twenty century capitalism to
regionalism and regionalisation” (Storper 1997, p. 3).
By the 1990s the ‘region’ quickly emerged as a determinate ‘space of competitiveness’ (Brenner
1998), and it had widely been identified as a key territorial zone and institutional arena for the
promotion and pursuit of competitiveness strategies (Bristow 2005). It has risen to particular
prominence in the UK where RDAs have been explicitly tasked with the responsibility for making
their regions ‘more competitive’ and akin to benchmark competitive places such as Silicon Valley
(HM Treasury 2001, cited by Bristow 2010).
The widespread belief in the concept of regional competitiveness carries the implicit assumption
that ‘the region’ is both clearly understood and unequivocally defined, which is not the case
according to Bristow (2010). Regional geographers have long struggled to define the boundaries of
their fundamental object of study to the extent that what actually constitutes a region remains an
object of mystery (Harrison 2006). In recent decades, there has been a shift from the mainstream
views and conception of region and cities as territorial entities with discrete regional systems of
economy and leadership, to entities that are increasingly open and characterised by complex
linkages between places both within and beyond their boundaries (Taylor et al. 2006). The new
relational thinking in defining regional boundaries has impacted in the economic activity theories
and economic geographers have been exploring alternatives to the strictly territorial sources of
regional boundaries. The result is an intricate geographical mosaic of spaces juxtaposing instances of
the knowledge and service economies and new pockets of affluence alongside the remnants of
traditional industry and deprived neighbourhoods (Taylor et al. 2006). The regions provide an
appropriate 'relational' space that allows for the sharing of tacit knowledge (Uyarra 2007). An
economic definition of a region would focus on company production patterns, interdependencies
and market linkages, and labour markets. A broader functional definition would add patterns of
social interaction, including leisure, recreation and travel patterns. But however drawn, they are
often unstable, changing their contours according to economic and social trends (Keating 1998).
2.1.1 Regional economic development theories
Malecki defines regional development as “a combination of qualitative and quantitative features of
a region’s economy, of which the qualitative or structural are the most meaningful” (Malecki 1991,
p.7). He argues that the growth and decline, as quantitative changes in economic activity, gauge the

24
impact on region, in jobs and incomes, of decisions both from within and external sources. The
qualitative attributes include the type of jobs – not only the number – and long-term structural
characteristics, such as the ability to bring about new economic activity and the capacity to maximize
the benefit which remains within the region. He continues by arguing that the standard theory of
economic growth and development has concentrated on quantitative changes, despite an increasing
awareness that regional growth depends, often crucially, on aspects that are understood only in
comparison with other regions or nations. The facts of regional development suggest that it is not
enough to rely on concepts of growth without an equivalent concern for the forces which permit
growth to take place or prevent it from occurring (Malecki 1991).
Regional economic problems include inequality of income, employment rates, infrastructure and
social inclusion. Growth rates, of income or of jobs, are customary indicators of regional economic
differences (Malecki 1991). Malecki (1991) points out that:
‘the fact that regions do not grow at equal rates, so don’t provide equal numbers of jobs or hobs
sufficient for those seeking employment is a complex issue ‘(p.12).
The regional differences found in developed countries can be summed up in Clark’s observation
“prosperity is tied more to where you live” (Clark 1988, cited by Malecki 1991). Analysis of the data
on regional economic performance and innovation indicators shows that there are significant
differences across regions in terms of economic growth, R&D intensity and innovation activity (for
example see Frenz and Oughton 2005). Frenz and Oughton (2005) found that R&D and innovation
activity are regionally concentrated. This is true especially for the UK and for other European
economies. Moreover, the differences across regions seem to be persistent and to be related to
differences in regional competitiveness as measured by labour productivity and GDP per capita.
Using CIS data Frenz and Oughton (2005) found that there is also a significant variation across
regions in novel product innovation, organizational innovation, patenting, R&D activity, employees
with science degrees and other degrees, expenditure on machinery for R&D and cooperation with
suppliers, universities and public research institutes.
2.1.2 Why some regions grow and develop faster than others?
The causes and effects of regional variations in economic performance and their link with innovation
have attracted growing attention from various scholars: ‘Thus, while national differences matter,
regional differences within nations are a more important source of total variation in regional
innovation and competitiveness than national differences’ (Frenz and Oughton 2005, p. 12).

25
Endogenous growth models have specified business investment in knowledge (R&D) as an additional
factor input to explain technological change, however, empirical studies show that this still leaves a
significant part of growth unexplained. More particularly, empirical studies based on regional
growth accounting models have shown that both R&D activity and total factor productivity (TFP)
growth vary significantly across regions, which raises the question as to why there is a regional
dimension to R&D and innovation activity (Frenz and Oughton 2005)? This question has been
addressed by the literature on the geography of innovation and regional innovation systems.
Drawing on this literature it is possible to identify a number of theoretical explanations of regional
uneven development. These centre around different types of agglomeration economies, knowledge
or R&D spill overs and the role of regional infrastructure.
2.1.2.1 External economies
Marshall (1890, cited in Frenz and Oughton 2005) drew a distinction between internal economies –
which depend on the internal organisation, capabilities and management of the firm – and external
economies – which depend upon the overall progress and development of the industrial
environment in which firms operate. Marshall identified a number of sources of external economies,
these include: pecuniary external economies, agglomeration economies; pools of skilled labour and
what he termed ‘industrial atmosphere’ which is now referred to as R&D or knowledge spill-overs.
Pecuniary external economies
According to Marshall pecuniary external economies arise as a result of the expansion of production
and the realisation of internal economies of scale. Provided markets are competitive, internal
economies are translated into pecuniary external economies as firms lower prices in response to
reductions in the cost of production. If production is geographically concentrated, reductions in a
firm’s costs that arise as a result of an increase in the scale of production will yield an external
benefit for that region (though the benefits may also be reaped elsewhere).
Agglomeration economies
Agglomeration economies have the effect of shifting the cost curve of individual firms downwards,
lowering barriers to entry and facilitating new firm formation. Improvements in local transport and
infrastructure, public investment in the research base and the growth and development of related
trades, including finance and venture capital, can all give rise to agglomeration economies. For
example, the existence of a well-developed local supply chain can lower transport costs. It can also
lower the costs of improving and refining inputs, as this frequently involves repeated interaction

26
between buyer and supplier and such interactions are easier and cheaper if they are local (Frenz and
Oughton 2005).
Pools of skilled labour and human capital
Marshall argued that the geographic concentration of industry and related infrastructure encourages
the growth of pools of skilled labour. The concentration of employment in specific industries within
a geographic proximity provides a pool of skilled employees for firms. At the same time, the
existence of an extensive and geographically concentrated set of job opportunities attracts skilled
labour into the area, as employees know there are significant employment prospects. As the
industry grows and develops, the capabilities of the workforce are enhanced via both formal and
informal mechanisms. The Marshallian concept of pools of skilled labour was richly formulated to
recognise the role of human capital and ingenuity in product and process innovation (Frenz and
Oughton 2005).
Industrial atmosphere and knowledge spill-overs
Marshall also recognised the cumulative nature of knowledge creation, spill-overs and diffusion,
describing these processes using the concept of “industrial atmosphere”. With regard to innovation,
industrial atmosphere speeds up the diffusion process, facilitating continuous improvements in
technology and organisation. This idea of knowledge spilling over in a cumulative manner has been
embodied in contemporary analysis of the geography of R&D and innovation, and in the literature
on the economics and sociology of knowledge (Frenz and Oughton 2005).
Cooperation and networking
In his later work - Industry and Trade – Marshall stressed the importance of constructive cooperation
between firms that results in a further type of external economy realised via networking
relationships between firms and firms and other organisations. (Frenz and Oughton 2005).
The recent literature on the geography of innovation has extended Marshall’s insights in a number
of directions and provided a rich and formal analysis of the importance of geography in shaping
innovation performance. As a result,
‘there is now a compelling body of theoretical evidence to suggest that there is a strong regional or
geographic dimension to innovation activity’ (Frenz and Ougton 2005, p.26).
Interest in the role of external economies and spill over effects as an influence on regional growth
has grown remarkably in recent years. Industry clusters policy approaches are based on the logic

27
that external economies shared by a group of collocated firms will elevate the level of
competitiveness and rate of growth of the group overall (Rosensfeld 1996). The level of interest in
external economies has been further bolstered by developments in mainstream economics, where
increasing returns and externalities have become a central element in neoclassical growth and trade
theory: ‘Even economists, traditionally unconcerned with spatial issues, have begun referring to the
advantages of cities and industrial districts as a possible explanation for externalities that drive the
new endogenous growth and trade models’ (Feser 1998, p.284).
Much of the recent work has been concerned with the technological externalities, spill over effects,
clusters, networking and the prominent role of universities and the public sector. The regional
innovation systems approach has also covered the role of institutions, trust, tacit knowledge, social
capital and governance. These approaches have significantly influenced the policy approaches to
regional development.
The Keynesian approach, which has dominated economic development policy since the 1960s, has
relied on income redistribution and welfare policies to stimulate demand in the less favoured
regions (LFRs), as well as the offer of direct and indirect incentives (from state aids to infrastructural
improvements) to individual firms to locate in such regions (Amin 1998). The neo-liberal approach
which followed during the 1980s, focused on the market mechanism and sought to stimulate
entrepreneurship through a variety of small-firm policies and to deregulate markets, notably the
cost of labour and capital. As Amin puts it:
“Keynesian regional policies, without doubt, helped to increase employment and income in the LFRs,
but they failed to secure increases in productivity comparable to those in the more prosperous
regions, and more importantly, they did not succeed in encouraging self-sustaining growth based on
the mobilisation of local resources and inter-dependencies (by privileging selective sectors and firms,
or externally-led growth). The “market therapy” has threatened a far worse outcome, by removing
financial and income transfers which have proven to be vital for social survival, by exposing the weak
economic base of the LFRs to the chill wind of ever enlarging free market zones, and by failing
singularly to reverse the flow of all factor inputs away from the LFRs (i.e. no proof of price-seeking
inflow of opportunities leading to regional specialisation in the appropriate industries) (Amin 1998,
p.3).”

28
2.1.3 Regional development and innovation
The literature in the fields of economic geography and technological development has placed
considerable emphasis on trying to investigate the territorial development of innovation, in the
national, regional, local or city level. As Komninos (2004) pointed out, this started with the
“explosion” of the innovation process out of research labs and the consequent extension of the
spatiality of innovation over the entire regional space. The growing body of literature on regional
innovation and development was given the label of ‘New Regionalism’ (Lovering 1999). This
describes the normative assertion of the region as the most appropriate scale for economic
governance, whereby academics, policy-makers and consultants are increasingly focusing upon the
region as ‘the crucible’ of economic development. In the 1970s and 1980s regional development
policies had a simple sectoral focus on developing and attracting “high tech” industries and building
science parks (Cooke 1985; Howells 2005). These industries tended to import high tech products
from the laboratories based in more advanced regions mainly due to the fact that the highly skilled
human capital was already based in such regions. Attracting exogenous investment or “smokestack
chasing” was seen as a way of building up endogenous capacity, innovation and competitiveness
(McCarthy 2000).
Quite often, such policies were successful in physically bringing large plants into the region and
creating employment, but the regional supply chain had limited benefits. As a result, the impact of
such policies was found to be very limited and inadequate for regional development (Cooke 1985),
and did not significantly improve the region’s innovative capacity. Whilst the impact of science parks
in terms of innovative potential was found to be greatest in already “innovation rich” environments
(Massey et al. 1992, cited in Howells 2005).
In order to overcome these issues, Cooke (1985) argued that an obvious redirection of regional
policy was needed towards substantially improving regional innovation potential. He argued that the
basic problem that regions faced was the lack of potential to encourage technical innovation. Cooke
argued that because R&D is poorly represented in typical assisted areas and because such areas tend
to depend on large plants in declining industries or on branches of firms producing technologically
mature commodities, they are unlikely to contain the personnel or units capable of substantial and
sustained innovative technological activity. In a context of competition from low-wage economies in
traditional mass-product markets (for example, motor vehicles and consumer electronics), it
behoves developed economies to exploit their elaborate knowledge-producing systems by
developing markets for advanced technological products and processes (Cooke 1985).

29
Innovation policy was seen as a solution to this problem because of the link between innovation,
growth and economic performance (Howells 2005). Howells (2005) argued that innovation poor
regions will not benefit as much in terms of economic development and growth and that they will
suffer in future rounds of innovative activity and investments and so can be locked into a vicious
circle of innovation stasis or decline. Other scholars have also argued that regional policies needed
more than conventional or incremental approaches and saw innovation as a faster speed towards
the region’s escape from its own path-dependency (see Cooke and Morgan 1998; Fuchs and Shapira
2005; Hassink 2005). The term “path-dependence” here is borrowed from evolutionary economics
(see Nelson and Winter 1982) and has been adopted by the scholars of national and regional
innovation. The concept of path dependence provides a theoretical framework within which to
understand the different historical economic trajectories followed by different regions. Martin and
Sunley (2006, p. 402) define path dependency as:
“a probabilistic and contingent process (in which) at each moment in historical time the suite of
possible future evolutionary trajectories (paths) of a technology, institution, firm or industry is
conditioned by (is contingent on) both the past and the current states of the system in question.”
The concept of path dependence is intended to capture the way in which small, historically
contingent events can set off self-reinforcing mechanisms and processes that lock in particular
structures and pathways of developments (Martin and Sunley 2006). Martin and Simmie (2008)
argue that the sectoral development of regional economies, evolves over long periods of time in a
path dependent manner and that “as a consequence” condition the scope and possibilities of future
development. However, Martin and Sunley (2006) note that whilst path dependency is an important
feature of the economic landscape, the concept requires further elaboration if it is to function as a
core concept in an evolutionary economic geography.
This debate led to the belief that a new set of policies was needed, aiming to promote economic
competitiveness by mobilising the endogenous potential of the regions through efforts to upgrade
the local supply-side infrastructure for entrepreneurship. According to Amin,
“an understanding of the economy as something more than a collection of atomised firms and
markets driven by rational preferences and a standard set of rules. Instead the economy emerges as:
a composition of networks and collective influences which shape individual action; a highly diversified
set of activities owing to the salient influence of culture and context; and subject to path-dependent
change due to the contribution of inherited socio-institutional influences” (Amin 1998, p.5).

30
2.1.4 From regionalisation to regionalism: the birth of regional innovation systems
Although during the 1980s and 1990s innovation was identified as a key driver for economic
development by various scholars, another debate was emerging concerned with how to better
stimulate such innovation. A new generation of regions has emerged throughout the world to meet
the challenges of knowledge-based development and globalisation. These have variously been
labelled “new industrial spaces”, ‘innovative milieux’ “innovative”, “innovating”, or “learning
regions”, and “regions of knowledge”. These different explanatory schemes were formed based on
theories on innovating by networking (Cooke and Morgan 1994, Morgan and Nauwelaers 1999,
Oughton et al. 1999, 2004), technology districts, innovative clusters and agglomeration economies
( Porter 1990, 1994, 1996, 2000a, 2000b), regional innovation systems, tacit knowledge and learning
regions (Cooke and Morgan 1994, 1998; Florida 1995; Lundvall 1996, Landabaso et al. 1999, 2001;
Nielsen & Lundvall 2003), and more recently, intelligent cities and regions (Komninos 2004).
More particularly, Cooke and Morgan (1998) expanded the concepts of the evolutionary process of
regions between regionalisation (a top down approach marking of boundaries by an overarching
political administrative body) and regionalism (a bottom up approach which incorporates the
cultural dynamics of an area with the political and economic systems). A principle feature of
innovative regions is their capacity to create environments favourable to turning knowledge into
new products, disseminating information, building organisational learning, integrating skills, and in
the end generating innovations (Komninos 2004).
The bottom up perspective where a series of coordination and interactions between regionally
based players such as private firms, public institutions and agencies seemed to be of much
importance (Morgan 1997; Cooke and Morgan 1998). In such systems, much more focus has been
put on the processes of improving intangibles which assumes the existence of regional strengths
such as the capacity of regional firms to innovate; the quality of management; entrepreneurship
culture; an institutional framework which encourages inter-firm and public-private co-operation; and
a minimum level of R&D expenditures (Landabaso 2001). This debate led to the birth of a new
concept, the “Regional Innovation System” (Cooke and Morgan 1994) that incorporates the
evolutionary thinking of regional development and attracted particular interest in both academic
and policy making communities including the European Commission (for example Landabaso et al.
1999, Oughton et al. 1999).
In order to explain such processes at the regional level, an emerging dialogue between innovation
researchers, sociological scientists and economic geographers took place, and regionally-oriented

31
innovation policy approaches became popular during the second half of the 1990s (Koschatzky
2000). Within this context, the spatial dimension of innovation and learning received great attention
in the economic geography literature. Innovation and learning tend to be conceived as socially
embedded and spatially structured processes (Cooke and Morgan 1994) and most successful
regional economies are those which are characterised by the capacity of firms and institutions to
learn – in products, processes and organisational structures – and adapt to changing competitive
pressures (Maskell and Malmberg 1999). Learning is seen as an alternative social process (Lundvall
1992) and learning through training has also been seen as significant factor. Howells (2005) argues
that scientific knowledge is embedded in individuals and organisations, and bodies (especially
publicly funded) should provide training and collaboration.
Innovation processes involve many different players and successful innovation may entail a transfer
of technology - for instance, from a university or research centre to a company – but this is rarely an
isolated event (Cooke and Morgan 1994). The speed and the success of the transfer almost certainly
depends on other interactions, before and after the transfer itself. As Cooke and Morgan (1994)
suggest innovation is first and foremost a collective social endeavour, a collaborative process in
which the firms, especially the small firm, depends on the expertise of a wider social constituency
than is often imagined (workforce, suppliers, customers, technical institutes, training bodies).
The institutional framework of such systems it is expected to consist of universities, basic research
laboratories, applied research laboratories, technology transfer agencies, regional public and private
(e.g. trade associations, chambers of commerce) governance organizations, vocational training
organizations, banks, venture capitalists and interacting large and small firms. Moreover they should
demonstrate systemic linkages through concentration programmes, research partnerships, value-
adding information flow, and policy action lines from the governance organizations. These are
systems that combine learning with upstream and downstream innovation capability and thus
warrant the designation regional innovation systems (Cooke and Morgan 1998). Integration takes
place between the separate components of the regional innovation process: R&D, innovation
finance, technology transfer, new product development, and co-operation production. Komninos
(2004) argues that integration also takes place between the physical, institutional, and digital spaces
within which innovation process occur. He uses the term intelligent cities/regions to illustrate the
multi-level localised system of innovation which assures the coherence of practice of organisations
involved in product, process and organisational innovation (Komninos 2004).

32
2.1.5 Clusters policy
Porter asserted that geographic proximity between firms, located in what he referred to as clusters
of industries, plays an important role in improving productivity and encouraging continuous
innovation. Competitive nations, according to Porter, are made up of competitive regions, and
competitive regions consist of localised collections of firms that share common factors, exchange
information and yet still engage in rivalrous competition (Porter 1990). Clusters, which are defined
by Porter (1998) as geographic concentrations of interconnected companies and institutions in a
particular field, encompass an array of linked industries and other entities important to competition.
Many clusters include governmental and other institutions – such as universities, standards setting
agencies, think tanks, vocational training providers and trade associations – that provide specialised
training, education, information, research and technical support (Porter 1998) all integrated within a
given territorial dimension.
Porter (2000a) argues that clusters suggest that a good deal of competitive advantage lies outside
companies and even outside their industries, residing instead in the locations at which their business
units are based. This creates important new agendas for management that rarely are recognized. For
example, clusters represent a new unit of competitive analysis along with the firm and industry.
Clusters also represent an important forum in which new types of dialogue can and must take place
among companies, government agencies, and institutions such as schools, universities, and public
utilities.
The concept of the cluster attracted particular attention by policy makers around the globe and
thousands of cluster initiatives were established, based on Porter’s argument around regional
competitiveness. However, according to Woodward and Guimaraes (2005) Porter’s arguments have
often been misinterpreted by policy makers who have seen his policy prescriptions as compatible
with industrial targeting, while in fact Porter rejects targeting and argues that all clusters matter.
Other scholars raised concerned related to the definition of the cluster concept, its theorisation, its
empirics, the claims made for its benefits and advantages, its use in policy-making (Martin and
Sunley 2001) and the relatively limited empirical evidence on Porter’s work (Woodward and
Giumaraes 2005). Martin and Sunley (2001) question why is that cluster have gate-crashed the
economic policy arena when the work of economic geographers on industrial localization, spatial
agglomeration of economic activity and the growing salience of regions in the global economy, has
been all but ignored, and argue for a much more cautious and circumspect use of the notion of
clusters, especially within a policy context. Finally, Adams et al. (2003) argue that many of initiatives
that governments implemented in the area of promoting innovation at the regional level, such as

33
clusters, do not have a strong central narrative. Instead, policy seems to have been driven by vague
concepts such as the creation of a “knowledge-based economy” and by a small number of
individuals who have become skilled at promoting their own ideas.
2.1.6 Critical reflection on new regionalism and knowledge regions
Various criticisms have been levelled against the new regionalist school of thought from the 1990s
onwards (Hudson and Odgard 1998; Lovering 1999; Hudson 1999, 2002; Robinson 2001; McLeod
2001; Leitner et al. 2002; Adams et al. 2003; Simonsen 2005) with a number of questions raised as
to the viability of new regionalism policies in achieving their stated aims.
Lovering (1999) argues that this style of analytical and policy thinking is in fact deeply problematic as
it fails to explain contemporary regional development in general. Correspondingly it is a poor general
guide to regional policy formation. Lovering believes that the policies in question are most unlikely
to make significant difference to the majority of the population of the regions in question as they
prioritise one set of activities (those that can be presented as involving learning) and devalue others.
As a result such policies represent a social bias in favour of some groups and against others. He
criticises the sole emphasis on firms as the only type of regional economic actor while neglecting the
investor, public sector and the community. He also argues that the references to innovation leave
out important theories concerning macroeconomics and class dynamics and as a result, little is said
about innovation that is either new or significant. Furthermore, much of the discussion is little more
than a debate about how to create collaborators. He also argues that there is a complete lack of
attention to the significance of the global reach of finance capital:
‘’The dogma that ‘regions are resurgent’ as a result of global transformations implied by the growth
of ‘informational economies’ has almost reached the point of an orthodoxy. But like the fashion for
postfordism which preceded it, this represents the triumph of fashion and the influence of academic
authority figures over social science. Treating these claims as accounts of the key causal influences
on real regional development in general has led the New Regionalists to overlook far more important
influences on the economic dynamics of many, and probably most, real world regions‘’ (Lovering
1999, p. 386).
Lovering uses the example of Wales, a region that has been widely cited by various innovation
scholars (Morgan 1997, Cooke 2001), in order to provide evidences for his arguments. He argues
that with the exception of the Cardiff area the rest of Wales remains an extremely peripheral part of

34
the UK with poor performance in all economic indicators. The application of New Regionalism in
Wales has had completely misleading effects despite its enormous influence in regional policy
making circles. He argues that it has narrowed rather than broadened the intellectual horizons
within which explanations are framed, and has been mobilised to narrowed the practical agenda in
ways which dovetail with the concerns of vested interests (Lovering 1999).
The argument of the New Regionalism school as to its potential benefits to regions has also been
criticised by other scholars. Robinson (2001) gives three reasons as to why little, if anything should
be done to assist regions through the new regionalism policies. First, he states that such targeting is
an inefficient practice implemented in the name of equity. It is reasoned that directing capital to
these areas will thwart economic growth at the national level. Next, he believes that areas lack a
competitive advantage due to inherent inferior qualities specific to the region. Third, regional
disparities are functionally interpreted. He states that such areas are typically classified according to
unemployment and low-income levels. However, socio-cultural conditions can give regions a distinct
sense of place, and these qualitative characteristics are difficult to measure objectively. Finally,
Robinson (2001) believes that as locational constraints continue to relax with the benefits of new
technology the rationale for supporting under-performing regions weakens. In short, places are less
important as technology improves and proximity is not necessary for effective communication
(however, for an argument about the use of digital spaces and proximity see Komninos 2004).
2.2 Access to finance
It is evident from the literature on regional innovation that although the role of the firm has been
seen as critical within the innovation system, the role of firm financing intermediaries has received
less analysis despite its recognition as a central actor of the system (Zook 2004). In fact, while there
is a strong body of research on the innovation systems and its functionalities, the financing of such
systems have received considerably less attention.
The provision of sufficient finance to high growth companies requires the establishment of effective
financial systems that support innovation and growth. Public policy has dedicated significant energy
to opening regional and global markets for trade, attempting to fill skills gaps, promoting academic
science and technology, and developing infrastructure (NESTA 2008b). The provision of finance for
high-growth start-ups is a tougher challenge. As the White Paper, New Industry, New Jobs (HM
Revenue 2008, p. 14), states:
35
“access to finance is an important barrier for business to develop their full potential and the
government clearly states that any constraint on the ability of UK-based businesses to exercise
comparative advantage on the basis of high levels of skills or knowledge must be regarded as a
serious impediment to the UK’s economic success.”
2.2.1 Financing innovation
In the early 1980s, the growing interest in innovation stimulated the academic debate around the
role of the firm and technology within the innovation system. In fact such theories placed the firms
at the forefront of action. Within traditional neo-classical theory, technology was considered to be
exogenous to the economic system but the new evolutionary approach, placed it at the very centre
of all economic activities. A main vehicle of technological development, exploitation and diffusion is
the firm. The competitive advantage of a nation or even a region is considered to rest increasingly
on the innovative performance of firms, and in particular on their capacity to create, diffuse, apply
and adapt technological knowledge (Soete and Arundel 1993). Firms do not operate in a blank
environment, but within an “innovation system”. As Thomas (2000) pointed out, the definition of
innovation within the policy discourse has been stretched in recent years in order to encompass a
broad business development agenda where all companies, not just high technology firms, can be
seen to benefit. “Technology” seen as knowledge in the broadest sense (of products, processes,
technologies, markets, management techniques, organisational modes, etc.) becomes fundamental
to the competitive survival of firms (Corvers 2000).
However, it is commonly argued that business innovation activities, including R&D, are difficult to
finance, and governments around the world have implemented various schemes and interventions
which take the form of R&D tax incentives, government R&D expenditure, incentives for
collaboration between business and research institutes etc. Several factors make investments in
innovation and R&D difficult. Half of the total investments in R&D are mainly allocated to salaries of
highly educated scientists and their efforts to create intangible assets, the firm’s knowledge base
(Hall and Lerner 2010). To the extent that this knowledge is “tacit” rather than codified, it is
embedded in the human capital of the firm’s employees and is therefore lost if they leave or are
fired (Hall and Lerner 2010). A second important feature of R&D investment is the degree of
uncertainty associated with its output which tends to be greater at the beginning of a research
programme or project (Hall and Lerner 2010).
Public intervention in support of innovation through investment in basic research, yields
economically useful knowledge that can be used by firms to develop new product and processes

36
(Howells 2005). This addresses the classic “market failure” reason for policy intervention in relation
to innovation whereby, as Howells (2005) argues, there is an under-investment in R&D and
technology because of the existence of uncertainties, externalities and knowledge spill-overs, which
create dis-incentives for investments in innovation. Many firms in technologically demanding
industries need to combine a variety of technologies in complex ways, and publicly supported
research provides an extensive pool of resources from which these firms may draw (Howells 2005).
Therefore, there is a need to support investment in knowledge, which would otherwise be under-
funded by the private sector (i.e. left to themselves, firms will under-invest in innovative activities
because of their inability to appropriate all the benefits arising from these activities), (Musyck and
Reid 2007).
Howells (2005) argues that rates of return investments in public R&D remain good, if not excellent.
A review undertaken by Scott et al. (2002) noted that attempts to calculate the returns to public
research have generally resulted in high rates of return, from 20 percent to 50 percent and higher.
Equally, at the regional level, government funding of R&D can benefit regional growth, and Hicks and
Lee (1994) found that U.S. federal R&D funding had a statistically significant regional employment
effect over the period 1986-88.
Against the argument for public investments in science and technology, a study by the OECD (2003),
investigating the relationship between R&D and economic growth over a period 1981-1998, revealed
a significant effect of R&D activity on the growth process, across 17 countries. However, it was the
business performed R&D that drove the positive association between total R&D intensity and output
growth, and not the non-business R&D, performed mainly through public research grants. The OECD
indeed found the negative results for public R&D surprising. A possible explanation for the result is
that publicly performed R&D may be “crowding out” resources that could be used by the private
sector, so that public funded R&D is displacing private investments in science and technology
(Guellec and van Pottelsberghe 2000).
Nevertheless, financing R&D through public or private means is an important aspect of regional
development and innovation due to the close relationship between R&D and innovation. However
innovation is not only a result of R&D expenditure. Innovation is seen as something new, a new
product or service in the market. It often comes from research laboratories and institutes but in
some cases does not involve R&D at all, e.g. software and internet based companies.
An important tool of promoting innovation and R&D business expenditure is venture capital (Kortum
and Lerner 2000). Building on these theoretical premises that put R&D at the forefront of business

37
innovation but also emphasise the difficulties in financing innovation activities, this thesis
concentrates on venture capital investments as a mean of financing R&D and innovation activities. It
also elaborates on the public interventions aiming at promoting venture capital investments and
investigates the relationship between venture capital and innovation at the regional level. The
following sections survey the theories on the role of venture capital in innovation, aiming to address
the question of why financing innovation is important and what type of finance can encourage and
support innovative business which in turn will foster the innovation system.
2.2.2 Defining venture capital
Venture capital firms are financial intermediaries focused on providing capital to small, fast growth
start-up companies that are typically high risk and not amenable to more traditional financing
alternatives (Mondher and Sana 2009). A venture capital company usually invests in early stage
ventures, while a private equity company targets later stage deals such as expansion financing and
MBOs. The distinction between venture capital and private equity is blurred (Manigart and
Meuleman 2004). Venture capital professionals are either specialised in a particular industry e.g.
biotechnology, or in the absence of such specialisation, commission independent experts to assess
the product of the business opportunity. By doing so, venture capital firms reduce the inherent risk
that small innovative companies experience. In addition, the way that finance is structured (i.e. the
investments is made in funding rounds and not one off investment - staging capital) allows the
venture capitalist to gather information and monitor the progress of the firms with maintaining the
option to periodically abandon projects (Mondher and Sana 2009). The role of staged funding (i.e.
funding rounds) is similar to that of debt in highly leveraged transactions, keeping the owner or
manager on a “tight leash” and reducing potential losses from bad decisions (Mondher and Sana
2009). Hall and Lerner (2010) argue that staged capital infusion is the most potent control
mechanism a venture capitalist can employ and the shorter the duration of an individual round of
financing, the more frequently the venture capital monitors the entrepreneur’s progress. They
continue by arguing that venture capitalists should invest in firms where asymmetric problems are
likely, such as early stage and high technology firms with intangible assets. In fact, Gompers (1995)
shows that venture capitalists concentrate their investments in early stage companies and high
technology industries.
It is often argued that the value added by experienced venture capital rests not only in its ‘hard’
financing aspects but also in ‘soft’ advice and knowledge roles (Kaplan and Stromberg 2001; Pinch
and Sunley 2009). Knowledge regarding the target company’s industry allows the venture capitalist

38
to oversee investments more efficiently and more effectively, in part because industry experience
enhances the venture capitalist’s ability to recognize signs of trouble at an early stage (Sonerson and
Stuart 2001). Venture capitalists provide several critical services in addition to providing money such
as helping the company to raise more money, reviewing and helping to formulate business strategy,
filling in the management team, and introducing the company to potential customers and suppliers
(Gorman and Sahlman 1989). Venture capitalists carefully screen firms, structure contracts to
strengthen incentives and monitor firms (Kaplan and Stromberg 2001), promote their
professionalisation and induce them to behave more aggressively. Gompers and Lerner (2001),
argue that venture capital helps entrepreneurial firms to invest more than they would otherwise,
grow more quickly, and sustain performance in the long term – even after going public.
The question that arises is why other source of business finance cannot borrow or duplicate such
features process of the venture capital industry. Hall and Lerner (2010) summarise these reasons
very well:
“Economists have suggested several explanations for the apparent superiority of venture funds in this
regard. First, because regulations limit banks’ ability to hold shares, at least in the U.S., they cannot
freely use equity. Second, banks may not have the necessary skills to evaluate projects with few
collateralizable assets and significant uncertainty. Finally, venture funds’ high-powered
compensation schemes give venture capitalists incentives to monitor firms closely. Banks sponsoring
venture funds without high-powered incentives have found it difficult to retain personnel” (Hall and
Lerner 2010, p. 34).
2.2.3 Venture capital and the firm
There are three main sources of finance available to business: First, debt finance – most commonly
the provision of a loan of some form that is subsequently repaid at a pre-agreed interest rate. These
may be available from a High Street Bank or specialist finance providers. There are many sources of
debt finance: the corporate bond market for the largest firms; bank financing facilities; small
business loans; and small-scale entrepreneurs financing their businesses through re-mortgaging or
credit card debt. Second, equity finance – whereby capital is provided to the company in return for a
shareholding in the business by corporate investors, Business Angels, venture capital/private equity
or public sector schemes. There are a wide range of services provided by the public markets,
accessible through flotations or other share issues by the largest firms, through private equity,
leveraged buy-outs, management buy-outs and buy-ins. Third, ‘soft capital” – typically associated
with grant funding or financial subsidies provided from the public sector through grants, R&D tax

39
incentives, innovation vouchers or other means. Such financial support is typically available through
Regional Development Agencies, government departments and devolved administration
departments in Scotland and Wales.
The majority of firms accessing finance rely on small-scale debt finance: credit cards, overdrafts and
commercial loans (CBR 2008). The high-growth innovative firms often do not fit into this category,
especially in their early years. These companies require significant capital up-front, and this is very
hard to obtain from conventional sources of debt finance. They tend to have intangible assets, and
show a significant delay before generating revenue making than a high risk investment (NESTA
2009). These firms are, of course, some of the most attractive growth prospects, and include
startups in the information technology, life sciences and advanced engineering sectors. Innovative,
high-growth firms which are essential for the regional innovation system to flourish, need different
kinds of support depending on their stage of development. They thrive if there is a smooth
progression from one type of funding to the next (CBR 2009). As a result, savings are inadequate and
debt finance is inappropriate but venture capital is an alternative form of finance that is structured
to address these challenges (NESTA 2007).
Knowledge-based firms have significant intangible assets (e.g. product ideas or inventions that may
be protected by patents). They are likely to need funding to cover what may be a lengthy period of
negative earnings as they turn these intellectual assets into products in advance of sales. Their lack
of tangible assets which could be used as collateral and their uncertain prospects of commercial
success mean that they are unlikely to be able to access bank loans. Venture capital is better able to
address these challenges on account of its value in screening investment opportunities, providing
post-investment monitoring and support and structuring investments because of the equity-based
nature of its investments. As a consequence, it is the most important institution supporting
technology entrepreneurship (Saxenian and Sabel 2008).
A growing number of critics argue that conventional 'balance sheet' accounting is based on a fiction,
namely that the valuations which auditors produce reflect the real value of the firms they audit
(Morgan 2004). The over-emphasis on physical assets (land, plant, capital, etc.) and the under-
emphasis on intangible assets, transmits totally inappropriate signals to managers, employees,
shareholders, and investors (Morgan 2004). However, in the case of venture capital these intangible
assets are taken into account during the valuation process of the firm. Venture capital professionals
measure the value of the business not solely based on its physical infrastructure, but on the
intangible assets that the business may possess such as the calibre of its personnel and its potential

40
to innovate. To this extent, by contributing to the development of innovative firms, venture
capitalists directly contribute to the development of the innovation system.
2.3 The role of venture capital in innovation and regional
development
Venture capital cohabits with other players of the innovation system and has positive implications
for economic growth. Venture capital investments are mainly made to companies that exhibit strong
intangible assets and the potential to grow. The goal of improving intangible assets as basic
elements for the innovation process has also gained considerable currency amongst academics
concerned with the development of the regional innovation system approach over the last two
decades (for example Morgan 2004). As a result, both venture capital and regional innovation
scholars share a similar view on the importance of knowledge creation and intangible assets.
Investments in innovation and development through learning are seen as essential factors in
increasing the innovation capacity of a firm and a region. The role of investors, which has been
largely neglected by the regional innovation scholars (Lovering 1999; Zook 2004), is the main focus
of this section and more particularly the important role that venture capital plays within the regional
innovation system (Saxenian and Sabel 2008).
Venture capital’s importance in regional and national economic development is mainly based on U.S.
evidence of its role in encouraging innovation by funding the emergence and growth of new
technology-based companies. This section, reviews the joint literature of these two theoretical
frameworks, venture capital and regional innovation, and it is concerned with the role that venture
capital plays within the regional innovation system.
The role of venture capital in economic development increasingly is recognised as central to the
development of an entrepreneurial economy (Mason and Harrison 2002a) and venture capital firms
have become a key component of the innovation process (Powell et al. 2002). There is an emerging
consensus that venture capital is a key component of “new economy innovation systems” formed by
highly dynamic sets of interrelationships between VCs, market conditions and new firm incubators
(Cooke 2001; Rosenberg 2002; Pinch and Sunley 2009)
On the basis of his study of the Internet industry in the US, for example, Zook (2005, p. 6) concludes
that: “Financial institutions of innovation are probably more important for economic growth in this
knowledge economy than the location of research universities.”

41
Kenney and Florida (2000) argue that VCs play a key role within regional innovation networks by
providing their investee firms with ‘smart money’ – combining both money with non-monetary
inputs and especially technological and business knowledge VCs act as catalysts or ‘technological
gatekeepers’ who facilitate and direct innovations within localised clusters.
Zook (2000) argues that crucial to the operation of the regional financing system are the feedback
loops that emerge over time as venture capitalists, entrepreneurs and labour come together in
various new ventures. These new or strengthened connections within a regional system provide the
basis for subsequent efforts to form innovative firms. If the new firms are successful, there are an
additional number of valuable feedback mechanisms that emerge. The most basic result, the
generation of new wealth, can give an added surge to the investing process. However,
“more important than the actual money, is the reputation and prestige that comes with it. This
success allows institutionalized venture capital to successfully raise future venture rounds and allows
some entrepreneurs the opportunity to change their role in the system, either as angel or as a
partner with a venture capital firm. It is through this process of information exchange, investment
and feedback that a region's venture capital system develops and matures’’ (Zook 2000, p. 3).
Analysis of the significance of venture capital in innovation and economic development is available
at four levels: i) company growth, ii) creation of new industries; iii) networking and clustering iv)
patents and R&D expenditure.
2.3.1 Venture capital and company growth
In 2007, IE Consulting and BVCA (2007) conducted a survey of over 1,000 risk capital company
recipients. The analysis of their responses saw that over the five-year period to 2006/7, venture
firms in the sample increased their worldwide employment by 8 per cent p.a., a much higher rate of
growth than FTSE Mid-250 companies (at 3 per cent p.a.). Their UK employment also grew by 6 per
cent, compared to a national rise in employment of 1 per cent p.a. Equally, exports in venture-
backed companies grew by 14 percent a year, compared with a national average of 4 percent.
The evidence from the US, where venture activity has a longer pedigree, is even more compelling.
Puri and Zarutskie (2008), suggests that the amount of employment generated by VC backed firms
accounted for nearly 10 percent of employment in the US in the late 1990s and early 2000s, steadily
rising from about 5 percent in the 1980s. A study undertaken in the US by Global Insights and NVCA
(2007), revealed that U.S. companies that received venture capital from 1970-2006 accounted for
10.4 million jobs and $2.3 trillion in revenues in 2006. The total revenue of venture capital-financed

42
companies comprised 17.6 percent of the nation’s GDP and 9.1 percent of U.S. private sector
employment in 2006. Venture capital-backed companies outperformed their non-ventured
counterparts in job creation and revenue growth. Employment in venture-backed companies
jumped by 3.6 percent, while national employment grew by just 1.4 percent, between 2003 and
2006. At the same time, venture capital-backed company sales grew by more than 11.8 per cent,
compared to an overall rise in U.S. company sales of 6.5 per cent during the same period.
2.3.2 Creation of new industries
Creating new industries requires sustained investment over the long-term, continued commitment
and long term resources. The semiconductor and microcomputer industries are good examples of
this lengthy and capital-intensive process. In both cases, it took up to ten years of continued risk
capital investing before the industries properly took off and virtually every other new industry since
have followed this pattern (Bygrave and Timmons 1992).
In the words of Bygrave and Timmons (1992, p. 2), their effects have included “the creation of
hundreds of thousands of new jobs, new expenditures for research and development, increased
export sales, and the payment of hundreds of millions of dollars in state taxes. By mobilizing and
later recycling scarce risk capital and entrepreneurial talent, venture capital firms have transformed
the economy”.
Venture capital has played a unique role in the information and commercialisation of entire new
industries (Bygrave and Timmons 1992; Mason and Harrison 2002) personal computers, cellular
communication, microcomputer software, biotechnology , and overnight delivery. In recent days,
venture capital became a major source for finance in cutting edge industries such as healthcare and
internet firms. This underline’s Zook’s (2000) observation about the high positive correlation
between internet firms and venture capitalists in the US. In the case of biotechnology, “it is safe to
say that without venture capital and regional agglomeration, the industry would not exist in the form
that it does today” (Powell et al. 2002, p.304).
Zook (2004) has analysed how the spatial structure of knowledge used by venture capitalists during
the development of the internet industry contributed to its clustering. He argues that “venture
capital are best understood as tacit information brokers who acquire and create tacit knowledge
about industries, market conditions, entrepreneurs and companies through a constant process of
Marshallian interaction and observation” (Zook 2004, p. 628).

43
2.3.3 Networking and clustering
Private intermediaries like venture capitalists, management accountants, specialised law firms and
consultants cohabit the same place, facilitating systemic interactions (as shown for Silicon Valley in
Saxonian 2008). Norton (2000) explores the importance of geographical proximity for
entrepreneurial innovation and concluded that ‘new economy’ places are characterized by the
geographical concatenation of scientists, engineers, entrepreneurs and venture capitalists looking
for value from technological discontinuities: the more disruptive, hence rare, the better. Cooke et
al. (2002) argue that VC managers recognize certain areas in which their companies can operate
more effectively by trading with each other rather than staying with an established supplier. These
companies operate as a mini-cluster, something that is in the interests of the firms and the venture
capitalist seeking to enhance his investment. It also fits in with regional economic development
policy which advocates supply chain clusters in target industries (Cooke et al. 2002).
The advantage of location is very much based on access and information and increasing returns are
present in the form of overlapping networks, recombinant projects, personal and professional
relationships, and interpersonal trust and reputation, all of which are thickened over time (Powell et
al. 2002). Thus,
“venture capital is itself a powerful search network: investors support a diverse portfolio of
entrepreneurial experiments and combine hands-on monitoring and mentoring with market
selection; this institutionalizes a continuous and rigorous process of new market identification,
selection, replication , and adaptation, as well as learning and the accumulation of knowledge”
(Saxenian and Sabel 2008, p. 3).
2.3.4 Patents and business R&D expenditure
A variety of studies suggest that venture-backed firms are responsible for a disproportionate
number of patents and new technologies (Kortum and Lerner 2000), and they seem to bring more
radical innovations to market faster than lower growth businesses that rely on other types of finance
(Gompers and Lerner 2001). More particularly, Kortum and Lerner (2000) examined the influence of
venture capital on patented inventions in the United States across twenty industries over three
decades. They found that increases in venture capital activity in an industry are associated with
significantly higher patenting rates. While the ratio of venture capital to R&D averaged less than 3
percent from 1983-92, they estimated that venture capital may have accounted for 8 percent of
industrial innovations in that period. The strong relationship between venture capital and patenting
on an industry level is also indicative of a relationship between venture disbursements and

44
innovative output. Kortum and Lerner (2000) also examined the possibility of venture capital firms
being more keen to patent inventions compared with no venture capital backed firms due to mainly
two reasons: venture backed firms may fear that the venture investors will exploit their ideas and
investors are keener to invest in companies with patents already granted. In order to address these
issues, the researchers examined three additional measures of innovation activity: i) number of
patent citations and the economic importance of a patent; ii) frequency and extent of patent; and iii)
trade secret litigation in which firm has engaged. All the tests of differences in means and medians in
these three categories are significant at least at the five-percent confidence level, as well as when
they employed regression specifications. Given the rapid increase in venture funding since 1992 in
the US, the report suggested that by 1998 venture funding accounted for about 14 percent of U.S.
innovative activity.
Mann (2005) reports qualitative work (a series of interviews of venture capitalists, lenders and
executives at software start-ups and large software firms) suggesting that patents have a variety of
potential positive effects. Mann and Sager (2007) have also analysed the relation between the
patenting behaviour of start-up firms and the progress of those firms through the venture capital
cycle. Linking the data relating to venture capital financing of software start-up firms with data
concerning the patents obtained by those firms, they found a significant and robust positive
correlation between patenting and several variables measuring the firm’s performance (including
number of rounds, total investment, exit status, receipt of late stage financing and longevity).
It is important to highlight that most of the studies above demonstrate a significant and highly
positive association between venture capital and innovation rather than direct causality. This thesis
expands on the existing literature on the relationship between venture capital and patenting by
including an additional parameter in this relationship, which is the source of venture capital (public
or private). As such, the thesis responds to the gap in the literature discussed above, by analysing
the relation between patenting practices of VC backed firms paying particular attention to two
aspects: first, their acquisition of venture finance and progress through the venture capital journey,
and second, the relationship between patent practices and the source of VC finance.
2.4 The regional dimension of the venture capital industry
The new economic geography has attracted particular attention by various scholars (e.g. see Martin
1999), however, there has been much less progress in understanding the spatial characteristics of
venture capital or its role in local and regional development (Mason and Harrison 1999). This thesis
aims to reveal new characteristics of the venture capital communities in regions and to contribute to

45
the debate about regional dimension of the venture capital industry and its role in regional
development. The thesis therefore seeks to explore whether geography is still important for
interactions for VC professionals and how it may differ between regions led by publicly provided VC
systems and those led by private ones.
The importance of interaction and proximity between VC funds and businesses has been highlighted
by Zook (2004) who argues that venture capitalists’ ability to assist successful Internet firms was
dependent upon largely regional systems of personal contacts and networks (know-who) through
which difficult to acquire knowledge about technology, companies, strategies and markets (know-
how) was created and quickly exchanged. Proximity is often a central factor because of the largely
tacit nature of the knowledge used by venture capitalists (Zook 2004). The importance of networks
in generating investment opportunities affects the spatial distribution of investment activity because
social relations tend to cluster in both geographic and social spaces (Sorenson and Stuart 2001).
Experienced venture capitalists have abundant contacts and deep knowledge of particular
industries; thus, referrals to relevant sources of expertise are another important resource they
provide and this social network is also more readily tapped into when firms are geographically
proximate (Powell et al. 2002).
Inter-firm relationships in the venture capital community effectively reduce spatial limitations on the
flow of information. In their analysis Sorenson and Stuart (2001) focus on how the network
connecting the members of the VC community – built up through the industry’s widespread use of
syndicated investing – facilitates the diffusion of information across spatial boundaries, thereby
decreasing the space-based constraints on economic exchange.
The role of spatial proximity in the diffusion of knowledge and construction of social networks has
also been praised by Zook (2004). At least two dimensions of a venture capitalist's contact network
can tribute to the localization of investments by influencing the venture capitalist's ability to
appraise investment opportunities under asymmetric information. First, individuals have greater
confidence in information collected from trusted parties. Consistent with this disposition, reports on
the VC industry indicate that venture capitalists repeatedly finance investments that they learn
about through referrals from close contacts, including entrepreneurs that the capitalist previously
financed, fellow venture capitalists, family members, or friends (Fried and Hisrich 1994). These
individuals have an interest in conveying accurate information and bringing high-quality investment
opportunities to the attention of the venture capitalist because they typically wish to maintain an
ongoing relationship with the venture capitalist. Second, lacking a strong tie, multiple and
46
corresponding sources of information might offer the venture capitalist some assurance regarding
the quality of a potential investment (Sorenson and Stuart 2001).
Powell et al. (2002) investigating the spatial concentration of ideas and money in the biotech sector,
found that both research-intensive biotech firms and venture capital firms that fund biotech are
highly clustered in a handful of key US regions. They also argued that the importance of tacit
knowledge, face-to-face contact and the ability to learn and manage across multiple projects are
critical reasons for the continuing importance of geographic propinquity in biotech.
Despite the incentives for choosing from a broad array of opportunities, various scholars argue that
venture capitalists continue to exhibit highly localized investment patterns in both physical and
industry space (Gupta and Sapienza 1992; Norton and Tenenbaum 1993, Sorenson and Stuarts
2001). Some more recent studies reveal that the importance of localisation may have declined to
some extent. For example, Wiltbank (2009) found that Business Angels are now prepared to invest
even within 250km, and a quarter of them were also prepared to invest outside the UK.
It is now well established that venture capital is not equally available in all parts of a country (Florida
and Kenney 1998; Florida and Smith 1991, 1992; Mason and Harrison 2002a; Zook 2002; Martin et
al. 2005; Schwartz and Bar-el 2007). In the USA venture capital investments are highly concentrated
at all spatial scales: regional, state and metropolitan areas. The pattern at the regional scale is bi-
coastal, with venture capital investing concentrated in California, New England and New York. At the
metropolitan area scale San Francisco, Boston and New York account for the majority of all
investments (NESTA 2011). The geographical distribution of venture capital investing in the UK
favours London and the South East (Mason and Harrison 2002a; Mason 2007). Because of the
dominance of MBO investments in the UK there is a much weaker relationship between venture
capital investing and high-tech clusters (Martin et al. 2002). However, early stage investments
continue to be disproportionately concentrated in London, the South East and Eastern regions and
are more closely linked to high-tech clusters (such as Cambridge) and more generally to the
locational distribution of high-tech firms (Mason and Harrison, 2002). In contrast, there is greater
dispersal of venture capital investment in Germany. Munich is the biggest single host to venture
capital firms but accounts for less than 20 per cent of the total (Fritsch and Schilder, 2006). In total,
six cities account for 65 per cent of venture capital firms: nevertheless, all of them are major banking
and financial centres (Martin et al. 2005).
Various scholars suggest that substantial differences exist between regions’ venture capital
institutions; especially their ability to produce and use tacit knowledge (Zook 2004). Cooke et al.

47
(2003) observed a close relationship between venture capital activity and regional innovation
systems. He pointed out that less innovative US regions (compared with California, Massachusetts
and Texas) also tend to rely more upon public venture capital and enterprise support, and regional
innovation systems here are both rare and newly discovered. Advanced regions are dependent on
public research funds for basic scientific investigation, but exploitation and commercialisation of
scientific findings is looked after by private bodies (Cooke et al. 2001). This include venture
capitalists, corporate venturing of larger firms, contracts and milestone payments by big
pharmaceutical, media or ICT firms, Business Angels, patent lawyers, specialist corporate lawyers,
merchant banks, consultants and management accountants (Cooke et al. 2001).
Table 1: Aspects of regional and private innovation systems
Regional innovation system (RIS) Private system of innovation (PSI)
Research & development driven Venture capital driven
User-producer relations Serial start-ups
Technology-focused Market-focused
Incremental innovation Incremental & disruptive
Bank
borrowing Initial public offerings
External supply-chain networks Internal EcoNets
Science park Incubators
Source: Cooke et al. 2001
The geography of venture capital investing closely relates to the locations of high-tech clusters
(Florida and Kenney, 1988a; 1988b; Florida and Smith, 1991; 1992). The role and importance of
cluster in regional innovation has been examined in previous sections. The availability of venture
capital funds is argued to have been central not only in terms of providing risk capital but also in
supplying a vital co-ordinating mechanism (see Langlois and Roberston 1995). In Europe however,
the argument is that there is a lack of geographical clustering and existing cluster lack the critical
mass to generate the mutually enforcing networking synergies and venture capitalists that are
needed to give such cluster the strong growth dynamic found in US examples (Martin et al 2001).
Linked to this argument is the debate on the role of venture capital in clusters formation and more
particularly the two contrasting views on the clustering or the dispersion of venture capital
investments. More particularly, policy initiatives on venture capital often contradict the clustering
approaches. Martin et al. (2001) for example note:

48
“such arguments tend to run counter to the other view, also found in official policy circles, that
instead of lacking spatial concentration venture capitalism is already too geographically localised,
being disproportionately located in, and orientated to, more dynamic and buoyant region to the
detriment of less prosperous areas which as a consequence face a “risk capital gap. According to this
argument there should be greater regional dispersal of venture capital funds to less developed and
economically lagging regions so as to stimulate and support new ad small firms activity – especially
innovation activity – in such areas” (p.15).
Thus under the clustering view, the supply of venture capital is too fragmented geographically and
should be more spatially concentrated in the regions that are leading high-technology development;
while under the dispersion view the supply of venture capital tends to be too biased towards a few
selected areas at the expense of unmet demand in other regions (Martin et al. 2001)
The lack of venture-based high technology in many regions is to a substantial degree a reflection of
regionally uneven economic structures so that the problem many regions face goes far deeper than
merely venture financing i.e. there is implicitly a lack of private sector demand.
Martin et al. (2001) suggest that the promotion of a more even geographical spread of venture
capitalism – the dispersal argument – is not only likely to be difficult, but of itself will not
automatically stimulate the development of local high-technology activity. The supply of venture
capital – whether spatially concentrate or dispersed – will not automatically create its own high-tech
demand. The debate on the supply and demand side has important implication in the VC policy
which is mainly based on the implicit assumption that government intervention is intended to act as
a stimulant to demand and signal to the private sector that there is latent demand in a region.
2.4.1 The demand and supply side argument
The supply side approach which emphasises the creation of firms, jobs and wealth based on internal
resources, is a part – albeit an important part – of the development process (Sweeney 1987; cited by
Malecki 1991). The debate on the supply and demand side of finance for companies, especially SMEs
has received attention by various scholars (Mason and Harrison 2002, Martin et al. 2005). In the UK
there is a perception that there is a mismatch between the demand and supply of investment
especially at the seed and early stage market. Companies often complain that they cannot secure
external finance, while investors argue that the problem is that there are not enough valuable
opportunities to invest. This perceived mismatch between demand and supply of capital, it is
argued, has created several gaps in the financing chain, what is often called “equity gaps”.

49
The development of the venture capital market itself has often been viewed as a potential solution
to the small-firm funding gap, namely by providing risk capital or equity to enterprises that find it
difficult (or prefer not) to raise medium-term to long- term finance either from banks or from the
normal capital markets (Martin et al. 2005). However, even within the venture capital market, there
are concerns that the equity gap persists.
In fact, the question on whether an equity gap truly exists is notoriously difficult to answer (for a
discussion see Martin et al. 2005). Such a gap may exist in specific business development stages or
industries and the debate on whether such gaps exist at the regional level has recently received
particular attention from several economic geography scholars (Mason and Harrison 2002 and
Martin et al. 2005). A common conclusion amongst these scholars is that there is an uneven
geography of venture capital investments. At the European level, there has been a concern that less
prosperous areas in Europe are particularly disadvantaged when it comes to venture capital backed
new enterprise development. According to this view, venture capital funds are vital to economically
lagging regions in order to stimulate and support new and small-firm activity especially innovative
activity in such areas (Martin et al. 2005, p. 1209)
On the one hand, policy makers often argue that there is a shortage of young innovative companies
in less prosperous regions and this is partly attributed to the undersupply of risk finance in these
regions. They also believe that there is distortion of the market due to overconcentration of venture
capital activity in more prosperous regions. On the other hand, venture capital fund managers argue
that “the venture capital market operates efficiently because venture capitalists will make an
investment if the potential return is higher than their assessment of alternative proposals for a given
level of risk” ( Queen 2002, p2). As a result, it is argued that, venture capital investments are fewer in
some less prosperous regions only because these regions are home to fewer investable
opportunities. This debate is nicely captured by Martin et al. 2005:
“are ‘regional gaps’ merely the geographical expressions of other gaps (for example, gaps in the new
start-up or new high-tech venture sectors of the market) that arise because of regional differences in
economic, industrial, and business structure? Or are there explicit spatial biases in the operation of
the venture capital market that give rise to an inherent regional dimension to equity gaps?” (p.
1209).
In order to provide some light into these issues, Martin et al. (2005) analysed the responses to a
survey from venture capital professionals in the UK and Germany. The survey results saw that “the

50
lack of proposals with prospects of decent returns” is the most prominent constraint in the UK and
second most important in Germany.
Mason and Harrison (2003b) identified three aspects to demand side constraints: first the
population of business capable of generating the returns that are sought by venture capital investors
is relatively small in the UK and that given the regional variations in business start-ups and growth, in
some regions the demand for venture capital will be particularly low. Second, entrepreneurs either
forgo significant growth in order to retain 100 percent ownership of their business or else they seek
to grow on the basis of either insufficient finance or inappropriate forms of finance often with
disastrous consequences. Third, a significant proportion of the SMEs which put themselves forward
as candidates for equity capital are unsuccessful in raising venture capital because they are not
investment ready.
2.4.2 Policy responses to the equity gap
Government schemes in support of the VC industry have been seen as a response to the belief that
there are significant funding gaps, particularly for small high-technology start-ups (Sunley et al.
2005) or in particular regions (Mason and Harrison 2002a). Such publicly backed schemes help in
leveraging private money (Lerner 2002), stimulating regional entrepreneurial activity (Mason and
Harrison 1999) and generating R&D spill overs (Lerner 2002). Venture capital is no longer a sole
activity of private players, but various public bodies of the innovation system are now actively
involved in venture capital activities as a result of a number of schemes implemented by the
governments around the world. Public venture capital initiates are defined as ‘’programs that make
equity or equity-like investments in young firms, or encourage other intermediaries to make such
investments’’ (Lerner 2002, p. 2). The UK policy response to the “equity gap” has often included a
regional perspective. As Sunley et al. (2005, p. 257) observe:
‘’the addition of a regional dimension is usually justified in two ways. First, policy-makers often point
to the potential efficiency benefits arising from a regional method. They suggest that venture capital
programmes work best when they are regionally constructed and operated because this facilitates
closer relations between investors, investees and supporting specialist firms. The programmes can
thereby better respond to specific regional conditions and problems.’’
Murray (1998) has also provided justifications for regionalizing venture capital centres on the need
to address regional equity gaps and market failures that may exist in particular regions. Indeed,
“policy-makers view venture capital as playing a central role in both innovation policy – facilitating

51
the commercialisation the science base – and entrepreneurship policy - facilitating the emergence of
high growth businesses - and so will intervene to address gaps in its supply“ (Murray 2007, p. 174).
The inclusion of a regional dimension in the government schemes is also based on the importance
of proximity and local networks. As Zook (2000) puts it: ‘’the close integration of venture capital with
the historical development of a region's industry emphasizes the importance of local networks to the
venture capital investment process. These systems of venture capital are very dynamic and, as
demonstrated with the internet industry, are capable of evolving with market opportunities. It is
likely that this ability to adapt to the changing dynamics of the economy will prove even more
important in the future as regions attempt to reinvent their economies, enter new industries and
innovate’’ (Zook 2000, p. 23).
In the UK, venture capital funds have been established by consecutive governments with
(sometimes) implied objectives to increase innovation and regional development. The aim of these
funds has been very well summarised in a phrase of the Head of Small Business service, DTI, “we are
setting a floor on what the private sector will risk” (Cambell 2000, cited by Mason and Harrison
2003). It becomes obvious from the literature that ‘’access to finance’’ is only one part of the
support package and public funds aim to equip firms with greater capacity, laying the ground work in
the hope that private funds will come in and wider tacit knowledge be brokered.
Regional Venture Capital Funds for example, were intended to address market weaknesses in the
availability of finance for small and medium sized enterprises (SMEs) by stimulating the supply of
new sources of finance. This was intended to ensure that each region (in England) has access to
regional based VC funds and demonstrating that investors in early stage funds can make robust
returns, thereby promoting the private sector venture capital industry (Mason and Harrison 2003).
Regional Venture Capital funds (RVCFs) had the following objectives: To increase the amount of
equity finance available to growing SMEs to enable them to realise their full potential; to ensure that
each English region has access to at least one viable regionally based venture capital fund making
equity –based investments in smaller amounts; to demonstrate to potential investors in early stage
venture capital funds that robust returns can be made by funds investing in the equity gap, thereby
promoting the private sector venture capital industry (DTI 1999, cited by Mason & Harrison 2003).
The government’s intention was that ultimately the public sector will be able to withdraw its support
form the funds having demonstrated the viability of early stage venture capital investing, leaving the
private sector to invest in such funds without further support (Mason and Harrison 2003). A global
study undertaken by Brander et al. (2010) provides significant evidence on the role of government

52
VC in stimulating innovation. The researchers analysed over 28,800 enterprises based on 126
different countries that received venture capital funding in the 2000-2008 period. The enterprises
cover a wide range of industries but were dominated by high-tech firms. The performance of
enterprises financed by some form of government venture capital was compared with those
supported by private venture capitalists in order to determine the impact of public involvement on
performance. The key findings of the study was that enterprises with moderate government venture
capital support, outperform enterprises with only private venture capital support and those with
extensive government venture capital support, both in terms of value creation and patent creation
(Brander et al. 2010). However, such publicly backed schemes have been criticised in the UK for their
sole focus on the supply side, ignoring demand side constraints. As Martin et al. (2001) note:
“in practice of course , the geographical location of venture capital investment is the outcome of a
complex interaction of demand and supply processes. To some extent the concentration of venture
capital funds in high-growth regions is demand-induced and thus venture capitalism can be expected
to follow and thus accentuate the geography of uneven economic development” (Martin et al. 2001,
p. 17).
As a result, a spatial bias is likely to be built into the supply of venture finance, and due to the role of
proximity and face to face contacts in venture capital investing, it will tend to favour enterprises
located close to venture capital institutions (Martin et al. 2002). According to Martin et al. (2002): “a
strong mutually reinforcing process seems to be at work: venture capital firms emerge and develop
where there is a high level of SMEs - and especially innovative SME – activity, and this in turn
stimulate further expansion of the local venture capital market which in turn contributes yet further
to the formation and development of local SMEs and so on” (p. 18).
Mason and Harrison (2003, p. 864) conclude that “the clear implication is that simply creating pools
of venture capital will not, of itself, lead to an increase in the amount of early stage venture capital
that is invested. Indeed, the likely effect of creating an additional supply of early stage venture
capital, operating on a less than fully commercial basis as a result of government financial support, in
a situation in which there is a restricted supply of viable, high potential businesses, will be to create
distortion in the Market which over longer term could drive out existing private sector investors. A
supply side approach is therefore insufficient to solve the equity gap. The proposal to support
regional venture capital funds requires to be complemented by initiatives that address these
demand-side constraints.”

53
2.4.3 Venture capitalists skills in public sector funds
The competence of the venture capitalist investment managers arises from active business
involvement in the respective industry. It cannot be acquired in short order, nor is it easily
transferable (Kanniainen and Keuschnigg 2004). Gompers and Lerner (1999, p. 4) note that: ‘‘not
only is it difficult to raise a new venture capital fund without a track record, but the skills needed for
successful venture capital investing are difficult and time-consuming to acquire”. Therefore
Kanniainen and Keuschnigg (2004) argue, it is expected that the limited supply of informed VCs,
rather than the availability of financial capital, is the scarce factor in launching innovative firms.
This has direct implications for the creation and management of the publicly backed funds. Despite
their commitment to act as commercial funds, various scholars (Mason and Harrison 2003;
Kanniainen and Keuschnigg 2004; Shäfer and Shilder 2009) have found there to be a lack of venture-
capital skills to enable effective fund management.
As Mason and Harrison (2003) point out, venture capitalist competence is based on experience -
classic venture capitalists cannot be hired straight out of MBA courses or consulting firms, so there is
a limited scope for quickly increasing the supply of classic venture capital skills. Moreover in the case
of publicly backed funds,
“experienced venture capitalists with classic investing skills are unlikely to be attracted to the
Regional Enterprise Funds because of this unattractive level of remuneration. In this circumstances
and given that there is a considerable degree of political capital invested in this initiative, there is a
risk that fund managers will be appointed whose competence is predominantly in financial
engineering and who have little ability to provide these value-added skills to support young growing
firms, or even to identify promising new and early stage ventures” (Mason and Harrison 2003, p.865).
This argument is also supported by the work of Shäfer and Shilder (2009) in the case of Germany
which suggests that public sector venture capital funds may not be as ‘smart’ as private sector
venture capital in terms of adding value. The capabilities of public sector fund managers are
therefore often questioned, both in terms of their ability to make good investments (quality of deal
flow, domain knowledge, effectiveness of their due diligence) and to add value to their investee
companies (e.g. mentoring skills, strategic insights, networks) (see NESTA 2009). According to
Munary and Toschi (2010), even if the public intervention was targeted to companies with a real
need for government aid, this financial support could be inefficiently managed by local VCs due to
their lack of experience and skills. On the other hand, examining the case of Southampton, Pinch and

54
Sunley (2009) suggest that the ability of private sector venture capitalists to add value may be
exaggerated.
Pissarides (1999), has observed in the case of the European Bank for Reconstruction and
Development’s (EBRD) SMEs support funds that a crucial element in these type of funds is the
experience of the fund managers…”the main reason why a few funds are not performing
satisfactorily is that they lack expertise” (Pissarides 1999, p. 530).
There are two additional factors that are directly related to the skills of venture capitalists operating
in publicly backed funds. First, such funds have multiple objectives: “explicit non-financial objectives
also make it harder to recruit an appropriate team: investment professionals with the skills to
undertake economic development work are rarely those with the best track records of backing and
developing profitable companies’’ (NESTA 2008a, p. 19). The second factor is related to the
investment strategies adopted by such funds. For example, Allen (2001, cited in Mason and Harrison
2003) notes that one consequence of the investment of public monies in the funds, and the
consequent need for fund managers to be accountable for the use to which it is put, will be to
encourage even more risk averse behaviour with the result that there will be less likelihood of
investment at seed stage (p. 86).
However, the route of the problem may also lie in the way that public funds are established. The fact
that fund managers with previous experience in running public funds are also selected to run newly
established funds if of great concern according to Mason and Harrison (2003), since the credentials
of these fund managers are derived from their long experience in regional public sector venture
capital (e.g. WM Enterprise and Yorkshire Enterprise). This certainly does not necessarily imply that
these fund managers will not be able to manage the funds; however, it does raise questions whether
they can bring fresh thinking to the activities of these funds (Mason and Harrison 2003, p. 862).
The more limited skills of public venture capitalists may also be related to the fact that regions
outside the core venture capital centres of London and South East often lack the pool of people with
the necessary skills to effectively run the funds. As Mason and Harrison (2003) point out,
experienced VCs with sophisticated investing skills and wide relational networks are more likely to
be located in economically advanced regions, due to the spatial concentration of VC activity.
In general, the relationship between the venture capital industry and regional coverage and
institutions of governance has been mainly explored from the point of the government’s role (and
the need) in supporting the industry (see Lerner 2002, 2009; Murray 2007). Although the demand

55
side is an important part of the argument, in this research the focus is given to the supply side for
two main reasons. First, government schemes are mainly intended to close the gaps in the supply of
venture capital at both the national and regional levels Second, there has been limited research in
the supply side of VC at the regional level (see Mason and Harrison 2003). Therefore this thesis
bypasses many of the public policy questions that those controversies entail, and instead focuses on
the supply of finance through VC.
This thesis thus aims to examine whether the introduction of the publicly backed funds in the UK
supports the relationship observed by Cooke et al. (2003) between public venture capital and
regional innovation in the US, i.e. that less innovative regions also tend to rely on public venture
capital in the UK. This thesis will thus seek to examine this question: Do publicly oriented regional
innovation systems also attract publicly backed venture capital funds in the UK, and if yes, what does
this mean for the regional innovation system?
2.5 Venture capital, interactions and proximity
The role played by geography and spatial proximity in structuring interaction between different
bodies of the regional innovation system has long interested economic geographers and sociologists.
Morgan (1992,2004) highlights the importance of local linkages and tacit knowledge, trust and the
development of interegional networks and organisation proximity. As mentioned earlier, these
particular attributes are also found in venture capital community. Trust, tacit knowledge and
personal interaction are necessary elements of a successful VC community. This section reviews the
literature concerned with the importance of the networks of interactions within the venture capital
community and identifies gaps that this thesis aims to fill.
2.5.1 Information asymmetries
Potential investors face major difficulties in realising the potential of an investment in R&D mainly
due to what it is widely called “asymmetric information” between entrepreneur and investor
(Sorenson and Stuart 2001). Several scholars on venture capital note that information asymmetries
play an important role in venture identification and finance (Lerner 1994, 1995; Gompers 1995,
Sorenson and Stuart 2001; Mondher and Sana 2009). The venture capital industry is characterized
by great uncertainty about returns and information asymmetries between principals and agents
(Mondher and Sana 2009). Venture capital investments entail higher intensities of uncertainty and in
general higher intangible assets (Gompers 1995). Sapienza and Gupta (1994) argue that as the task

56
uncertainty - defined as the difference between information required to perform a task and the
information already possessed – facing the managers of a venture increases, the information-
processing capacity of the VC-CEO decision-making unit must increase to facilitate joint decision
making. They suggest that the magnitude of task uncertainty is a function of the state of a venture’s
development and the degree of innovation it is pursuing.
In the innovation setting, the asymmetric information problem refers to the fact that an inventor
frequently has better information about the likelihood of success and the nature of the
contemplated innovation project than potential investors (Hall and Lerner 2010). As Sorenson and
Stuart (2001, p. 1552) put it, “information asymmetries exist because entrepreneurs know more than
venture capitalists about the opportunities they seek funding to pursue and venture capitalists
cannot simply rely upon entrepreneurs for accurate information about the quality of their business
plans”. Investors have great difficulty in distinguishing good business opportunities from bad, and
the entrepreneur is reluctant to reduce these information asymmetries by revealing more
information to potential competitors.
Venture capital firms, address the problem of information asymmetries by scrutinising the business
proposal through a lengthy due diligence process. Multiple and corresponding sources of
information might offer the venture capitalist some assurance regarding the quality of a potential
investment (Sorenson and Stuart 2001). In the absence of public sources of information about early
stage companies, personal and professional relationships provide one of the primary vehicles for
disseminating timely and reliable information about promising new ventures (Sorenson and Stuart
2001).
Sorenson and Stuart (2001) investigated patterns of exchange in the U.S. venture capital industry
from 1986-1998 and empirically demonstrated that the social networks in the VC community—built
up through the industry’s extensive use of syndicated investing—diffuse information across
boundaries and therefore expand the spatial radius of exchange. Venture capitalists that build axial
positions in the industry’s co-investment network invest more frequently in spatially distant
companies (Sorenson and Stuart 2001). Sapienza and Amason (1993) also found that the pursuit of
greater technological innovation is associated with greater openness in venture capitalists –
entrepreneurs relationships especially for ventures that have overcome some of the liabilities of
newness.
57
2.5.2 Interaction as a mean of minimising asymmetries
Innovation is an interactive process between the firms and the basic science infrastructure, between
different functions within the firm, between produces and uses at the inter-firm level and between
firms and their wider institutional milieu (Morgan 1997). Interaction is a significant element of the
venture capital industry and it is essential in all aspects of its activity, from the business proposal
identification to the final exit through floatation or trade sale. In such a milieu, access to reliable
information about new opportunities occurs through personal and professional networks, and these
ties are critical in reducing uncertainty about projects that are not well understood by non-experts,
exceedingly risky in terms of their payoff and unclear in terms of their eventual market impact
(Powell et al. 2002). In the venture capital market some venture capitalists presumably have better-
quality relationships and enjoy more influential network positions than others, implying differences
in clout, investment opportunity sets and access to information (Hochberg et al. 2007).
As the industry amasses ever larger pools of capital to dispense, venture capitalists expand their
influence in determining who receives funding to pursue their entrepreneurial visions and to that
extent these spells of entrepreneurship affect socioeconomic trajectories, venture capitalists
become agents for social stratification (Sorenson and Stuart 2001). Personal relationships and
networks between scientists, entrepreneurs and VCs are crucial to the growth of high technology
clusters, as they act as channels for knowledge dissemination (Powell et al. 2002).
Existing literature is mainly concerned with the interactions between the investor and the investee
company providing information on the particular characteristics of these interactions – before and
after the investment - and their potential benefits to both investors and investee companies. While
the literature documents the prevalence of networks in many financial markets, the performance
consequences of the venture capital community organisational structure remain largely unknown
(Hochberg et al. 2007). There is some theoretical evidence to support the argument that interaction
and networking is important for the venture capital industry. Interactions can attribute towards pre-
investment and post-investment knowledge exchange (Sorenson and Stuart 2001) and are more
important at the early stage of the investment (Bygrave and Timmons 1992; Sapienza and Amason
1993; Pinch and Sunley 2009).
Pre-investment knowledge exchange includes identifying suitable opportunities by mobilising a wide
network of contacts, assessing market trends and general macroeconomic factors. Because each of
these tasks becomes increasingly difficult at a distance, even passive investors – those who invest

58
without intending to play an active role in managing the new venture – will likely invest locally
(Sorenson and Stuart 2001).
After investing in a start-up, venture capitalists perform two important functions. First, they monitor
their investments. Because venture capitalists make substantial investments in young companies
with managers whose interests may conflict with the venture capitalists' objectives, venture
capitalists actively monitor their investments to mitigate agency problems (Sorenson and Stuart
2001). A substantial body of (primarily theoretical) work in corporate finance concerns the optimal
design of contracts between venture capitalists and target companies to attenuate the agency
problems inherent in providing capital to new ventures (for a review, see Kaplan and Stromberg
2001). Several aspects of the contracts between venture capitalists and the entrepreneurs they fund,
such as staged financing (Gompers 1995; Bergemann and Hege 1998) and the allocation of control
rights (Hellman 1998), help mitigate this concern. Although these contracts reduce the need for
monitoring, they do not eliminate it. Thus, monitoring the managers of their portfolio companies
remains an important post-investment activity for the venture capitalist (Sorenson and Stuart 2001).
Once the investment is made, venture capitalists make their most important contributions in the
earliest stages of new ventures (Bygrave and Timmons1992) and therefore the amount and style of
interactions between venture capitalists and entrepreneurs is different in earlier stage ventures than
in later stage ventures (Sapienza and Amason 1993). During the post-investment period, venture
capital professionals provide added value services (Sorenson and Stuart 2001) by monitoring closely
their portfolio company, search for clients for the company, acquire a deep knowledge of the
product, assess marketing, operational and financial strategies, seek to identify co-investors for
further investment rounds, potential ways of exits. In order to facility post-investment knowledge
exchange, venture capitalists take a sit in the board of directors and deploy their professional
network of contacts.
Because of the uncertain circumstances, entrepreneurs managing early stage ventures would like to
turn to their venture capitalists more frequently for advice and informal counselling than those with
later ventures (Sapienza and Amason 1993). Further, both investors and investee are more likely to
rely on informal channels of communication in the early stage (Daft and Lengel 1986). The trust that
develops through repeated interactions stream-lines the interaction process and Sapienza and
Amason (1993) found that as managers share increasing amounts of tacit knowledge, overt
communication becomes less important and therefore the venture stage is negatively related to the
frequency of venture capitalists – portfolio companies interactions. In terms of policy making the

59
higher frequency of venture capitalists- entrepreneurs interaction in earlier stages supports the view
that venture capitalists are more important in the early stages of the venture (Sapienza and Amason
1993).
The extent of interaction between the venture capital fund and its portfolio companies has also
been examined by Gorman and Sahlman (1989). Venture capitalists spend more than half their time
with their portfolio companies, and when they play a lead investor role, they devote much more
time than non-lead investors or late-stage investors do (Gorman and Sahlman 1989). The absolute
amount of time devoted to companies by active investors would not support a view of venture
capitalists as individuals deeply involved on a day-to-day basis in the management activities of their
portfolio investments. Indeed a typical early stage investment gets a little more than two hours of
direct attention per week from its lead venture capitalist. Non-lead venture capitalists contribute
another three-quarters of an hour per week. Even when another VC firm leads the investing, a
venture capitalist will still typically visit the company at least once per quarter. In total, monitoring
and advising occupies about half of the venture capitalist's time (Gorman and Sahlman 1989).
Gorman and Sahlman (1989) found that the most performed service for portfolio companies it to
help raise additional funds, with strategic analysis and management recruiting also mentioned as
important roles.
Hochberg et al. (2007), examined the performance consequences of networking in the context of
relationships established when venture capitalists syndicate portfolio company investments. They
found that strong relationships with other VCs likely improve the chances of securing follow-on VC
funding for portfolio companies, and may indirectly provide access to other VCs’ relationships with
service providers such as headhunters and prestigious investment banks (Hochberg et al. 2007).
Controlling for other known determinants of VC fund performance such as fund size as well as the
competitive funding environment and the investment opportunities available to the VC, they found
that venture capitalists that are better-networked at the time a fund is raised subsequently enjoy
significantly better fund performance, as measured by the rate of successful portfolio exits over the
next 10 years (Hochberg et al. 2007).
The literature review shows that there is a strong body of research concerned with VC fund-business
interactions, analysing and measuring the extent of interaction and also the reasons that may
influence such extent (Gorman and Sahlman 1989; Sahlman 1990). However, the analysis of VC
funds with other bodies outside the strictly VC-business framework but still within the finance
community is very scarce. This thesis extent the literature by investigating, mapping and measuring

60
the extent of interaction between venture capital funds with other members of the finance
community such as business angel networks, banks, companies outside the portfolio. There is also
little analysis on how the VC community interacts with the outside world. Therefore, this thesis aims
to provide the first detailed empirical investigation of the relationship between VC and other
players of the innovation system such as universities incubators, research institutes, and regional
authorities.
Universities are seen as important means of knowledge creation and diffusion. A large exploitation
of knowledge transfer and commercialisation activities began after 1997 (UNICO 2005). University
spin-out companies attract a significant proportion of the UK’s venture capital. According to the
Library House (2007) university spin-out companies raised almost 12 percent of all venture capital
investment in the UK.
Business incubators - a facility that provides affordable space, shared office services, and business
development assistance in an environment conducive to new venture creation, survival, and early-
stage growth (Allen and McCluskey 1990) – are also important players of the regional innovation
system. Recently, the concept of business incubation has been expanded in order to accommodate
the needs of the internet economy:
‘’dubbed "business accelerators" "campuses," "econets," and "Internet keiretsus," these
organizations have become the hot new way to nurture and grow start-ups in the Internet economy.
They offer fledgling companies a number of benefits - office space, funding, and basic services such
as recruiting, accounting, and legal - usually in exchange for equity stakes’’ (Morten et al. 2000, p.
75).
The nature and range of such institutions and their interrelationships might be expected to vary
across regions due to regional government and governance structures, differential investment in
regional innovation systems and policies and the regions dependency on public or private
institutions (see Cooke et al. 2003).
There has been very little research to date on mapping and understanding the relationships between
the different regional bodies and how they may affect the overall innovation system (with the only
exception of universities where considerable amount of work has been undertaken on the role of VC
in stimulating university spin outs). The ambition of publicly backed funds to meet “soft” objectives
has led them to expand their network of contacts inside and outside the venture capital community
in order to include bodies that would not have been included had it not been for these objectives.
61
Previous studies have shed light on the relationship between venture capitalists and their portfolio
companies (Gorman and Sahlman 1989) between venture capital funds with other venture capital
funds (Hochberg et al. 2007), networks of service providers such as head hunters, patent lawyers,
investment bankers (Gorman and Sahlman 1989, Sahlman 1990) and universities (Wright et al.
2006). The common parameter in these studies has been an investigation on how these
relationships may affect the VC backed company’s performance and consequently the financial
performance of the fund. However, these studies have two important limitations that impede their
relevance to the research questions of this thesis. First, they do not distinguish between private and
public funds and therefore their findings may not necessary apply to publicly backed funds since
such funds have often additional or different objectives to private funds. Second, existing studies are
mainly concerned with the likely impact that interactions between VC funds and other bodies may
have on the fund’s financial performance and therefore do not investigate the likely impact of these
interactions in regional innovation. As a result, very little is currently known as to the role of the
publicly VC backed funds in spurring innovation at the regional level.
2.6 Conclusion
There has been a growing interest amongst scholars in the relationships and interactions that
constitute regional innovation systems. The policy implications of this new approach have been
dramatic, since they have involved a fundamentally different way of government intervention than
the traditional neo-classical emphasis on knowledge creation. Instead, public intervention is now
encouraged to focus on facilitating knowledge diffusion, which requires a policy of creating
conditions in which the dynamic process of technological development can prosper (Corvers 2000).
The aim of this chapter has been to provide a comprehensive overview of the literature on issues
that are closely related to the study of venture capital and its role in innovation, with a particular
emphasis on public policy and its regional dimension. It began by illustrating the change in the
meaning of the regional boundaries and how it has moved away from the strictly territorial and
administrative definitions. It then reviewed the central theories to regional development and how
they have changed in time, emphasising the theoretical link between innovation and economic
development which has significantly strengthened by a number of scholars that argued for the
importance of intangible assets. It continued by illustrating the importance of venture capital as a
source of finance and the growing literature on the role of venture capital in spurring innovation and
growth, and highlighted the importance of space in the VC industry. It concluded by reviewing the
theories on information asymmetries in the venture capital industry.

62
The importance of intangible assets has become synonymous with innovation capacity in space.
Investments in R&D, technological innovation and personal development through learning are seen
as essential factors of increasing the innovation capacity of the region. In that sense, venture capital
has been identified as a key element of innovation finance. Despite the importance of this type of
finance and its relationship to innovation, the literature review shows that very little research has
been undertaken on the relationship between venture capital and regional innovation. Indeed,
research on the role of venture capital in the regional innovation system has been very limited to
date.
In pursuing the examination of the relationship between venture capital and regional innovation, the
thesis mainly builds on the following theoretical premises: the work of Mason and Harrison (2001,
2002) who found large disparities amongst the UK regions with London and South East dominating
the industry, on pioneering work of Gompers and Lerner (2001) and Kortum and Lerner (2000) who
found that venture capital spurs innovation, the work of Brander et al. (2010) on the relationship
between government backed venture capital and patenting and on the work of various scholars that
examined interactions within the VC community (Sorenson and Stuart 2001; Rosenberg 2002; Smith
2005; Pinch and Sunley 2009). However, in the present study an attempt has been made to go
beyond the work of those researchers in three ways: first, in their examination of regional
differences, Mason and Harrison (2001, 2002a) focused only on the supply of VC in this regions and
the potential impact of the publicly backed VC in a regional context; in contrast, although this thesis
also focuses on the supply side, it investigates the combination of VC in this regions by providing a
detailed analysis of the extent of VC public dependency of each UK region. It also elaborates on
previous analysis undertaken by those researchers on the potential implications of t public sector
dominance in several UK regional innovation systems. Second, this study extend the work of
Kortum and Lerner (2000) who measured the impact of VC in innovation using patents as a proxy
variable for business innovation and Brander et al. (2010) who examined the relationship between
patenting and government backed VC funds using a global sample. This thesis extends this analysis
by investigating the relationship between different sources of VC and their impact on innovation
using again patents as a proxy variable for business innovation but focusing on the UK regional level
and using a much larger study sample than Brander et al. (2010). Third, in looking at the interactions
between VC with the external world, the literature mainly focuses on the relationship between
venture capitalists and investee companies. Sapienza and Amason (1993), Smith (2005) and others
have examined potential factors that may impact on the former relationship and have collected data
from matched pairs between venture capitalists and investee. In contrast, this thesis investigates the
extent of interaction between venture capitalists and other internal and external bodies such as

63
business angel networks, universities, and business incubators. Although it does not analyse
empirical factors that may be responsible for such relationship and it collects data from VC fund
managers only, it provides a new insight into the differences in the extent of interactions between
different types of venture capitalists and the outside world.

64
3 CHAPTER 3: POLICY FRAMEWORK FOR VENTURE CAPITAL IN THE
UK
3.1 Introduction
Governments around the world have taken measures to support venture capital by creating a
favorable environment with regulatory frameworks which effectively stimulate private investments
and channel high risk resources to innovative SMEs.
As Lerner et al. (2005, p.3) remarked, “it is instructive to observe that all venture capital markets of
which we are aware were initiated with some form of government support. These markets do not
appear to emerge without some form of assistance.”
As previously mentioned, the spatial concentration of venture capital funds and investments in
London and the South East, alongside the considerably lower firm start ups in the non core regions,
prompted the UK government to inject a regional dimension to venture capital policy in 2001 by
introducing Regional Venture Capital Funds (RVCFs) for each of the English regions managed by local
fund managers who are assumed to have local knowledge about the area. By increasing the supply
of equity in all the English regions this policy response reflected the government’s perception that
the low rate of business R&D expenditure, start up and successful development in the non core
regions is partly attributable to a ‘funding gap’ in the availability of equity. Consequently the
availability of venture capital now occupies a prominent position in the UK policy agenda. This
chapter outlines the role of public money in the UK early stage finance market, and how the 2008
financial crisis has exacerbated the market failures that public intervention sets out to address.
More particularly, this chapter is concerned with four issues. First it provides a historic overview of
the UK venture capital industry and illustrates where it sits within the UK financial ecosystem. Then
it continues by highlighting regional imbalances and shortages in terms of VC activity. It continues by
analysing policy initiatives undertaken as a response to these imbalances, and the persisting equity
gap. It concludes with an analysis of the impact of the current crisis in the VC industry.
This review is important for this research as it emphasises the volatility of the industry and the
important role of public policy in filling the ‘equity gap’ and encouraging venture capital activity in
the UK regions. In addition, it scopes certain spatial differences in the VC industry in the UK which is
an important aspect of the research.
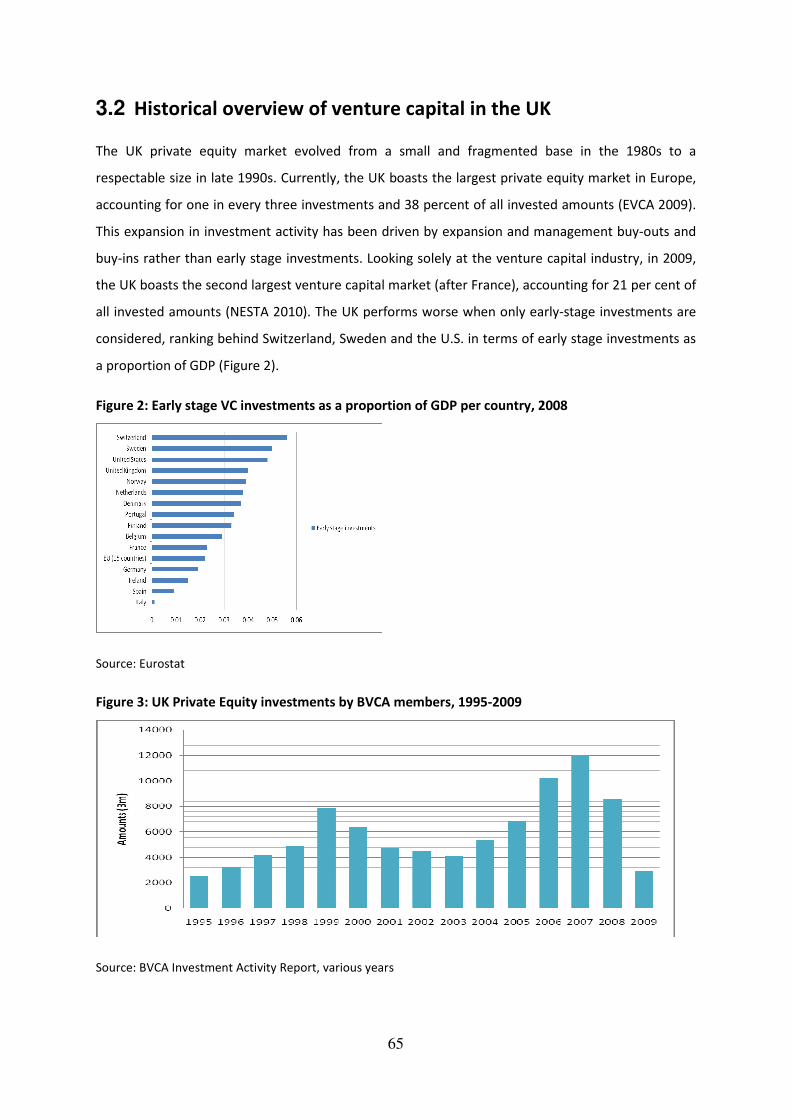
65
3.2 Historical overview of venture capital in the UK
The UK private equity market evolved from a small and fragmented base in the 1980s to a
respectable size in late 1990s. Currently, the UK boasts the largest private equity market in Europe,
accounting for one in every three investments and 38 percent of all invested amounts (EVCA 2009).
This expansion in investment activity has been driven by expansion and management buy-outs and
buy-ins rather than early stage investments. Looking solely at the venture capital industry, in 2009,
the UK boasts the second largest venture capital market (after France), accounting for 21 per cent of
all invested amounts (NESTA 2010). The UK performs worse when only early-stage investments are
considered, ranking behind Switzerland, Sweden and the U.S. in terms of early stage investments as
a proportion of GDP (Figure 2).
Figure 2: Early stage VC investments as a proportion of GDP per country, 2008
Source: Eurostat
Figure 3: UK Private Equity investments by BVCA members, 1995-2009
Source: BVCA Investment Activity Report, various years

66
UK private equity investments (venture capital, expansion, replacement capital, management
buyout and management buy-in), grew enormously during the 1990s. By 1999, some £8 billion was
invested in promising companies (Figure 3). Overall 1997-2000 saw a rapid increase in capital
volumes throughout the capital markets and in the market value of listed companies. Internet-
related companies, bolstered by massive market capitalisation, buoyed common stock indices to
unprecedented highs: many companies participated in public stock offerings without having concise
business plans, workable operating models or even a hint of profitability (Cegielski et al. 2003).
These extremes in investors’ behaviour “defied common sense”, and many scholars and industry
practitioners have tried to identify what went wrong. Dave and Rein (2004) examined the investors’
behavioural characteristics, arguing that there was a perception that the e-business models did not
need to follow traditional, tried and true, financial criteria for success. Min et al. (2008) highlighted
attributes that led to the dotcom crash including: excessive advertising and promotional costs;
failure to identify a niche area; underestimation of upfront infrastructure costs; customer acquisition
costs; and order fulfilment costs. The collapse of the market in 2000 is probably due to a
combination of all these factors.
Whatever the reason, the result was that private equity severely contracted during the crisis.
Statistics on investment activity collected by the British Venture Capital Association (BVCA) (Figure 3)
show a collapse in private equity investment in the immediate aftermath (2001-2003). As a response
to a growing “funding gap” that followed, consecutive UK governments implemented initiatives to
improve access to finance for small high growth firms. Several high-profile interventions, designed to
facilitate early-stage investment, have focused on the ‘supply-side’ of the investment market. These
included the High Technology Fund in 2000, University Challenge Funds 1999-2001, Regional
Venture Capital Funds and Early Growth Funds between 2002 and 2004, and more recently
Enterprise Capital Funds (2005). Tax incentives that were introduced in the mid 1990s, including the
Enterprise Investment Scheme (1994) and the Venture Capital Trust (1995), were reinforced and
supplemented by the Corporate Venture Scheme (2000). These schemes represented an attempt by
government to address the supply-side problem by using fiscal incentives to draw more capital into
the VC market by providing incentives to individuals and corporations to invest in high growth
companies. A detailed description of all venture capital publicly backed initiatives is available in
Appendix I.
During 2003-2007, the market saw strong signs of recovery. According to BVCA (Figure 3), the value
of private equity investments trebled between 2003 and 2007 from £4bn to nearly £12 billion.
Detailed examination of these aggregate statistics indicates that this upward trend in investment

67
activity has been driven by a huge increase in funding for management buy-outs and buy-ins (MBOs
and MBIs) rather than VC investments. The most important factors contributing to this recovery of
the private equity market have been liquidity in the credit market, the tremendous growth of Private
Equity funds and the rise of hedge funds (Acharya et al. 2007). This liquidity boom was propelled by
increased investment from petrodollars, huge government surpluses, particularly from Asia, as well
as pension, foundation and private wealth (Altman 2007). This explosion of liquidity which fuelled an
unprecedented supply of finance to the industry ended with the banking crisis in 2008.
The current financial crisis and the accompanying downturn are severely affecting the VC industry.
First, falling stock markets and poorer trading environments make it harder for funds to sell or float
their existing investments. Second, several limited partners suffering from liquidity problems are
unable to fund further investments. Third, several institutional investors have reduced their
exposure to the VC market while others are leaving the early stage market (NESTA 2009).
Table 2: UK early stage investments 2000-8
(a) Amount invested (£m)
Finance stage 2008 2007 2006 2005 2004 2003 2002 2001 2000
Start-up 172 190 531 160 96 73 99 163 175
Other early stage 187 244 415 222 188 190 196 227 528
Total early stage 359 434 946 382 284 263 295 390 703
Early stage as a % of
total investment
4.1
3.6 9.3 5.6 4.2
6.5
6.6
8.2
11.0
Source: BVCA Report on Investment Activity (various years)
(b) Number of companies
Finance stage 2008 2007 2006 2005 2004 2003 2002 2001 2000
Start-up 170 207 245 208 190 185 165 190 153
Other early stage 285 295 255 285 264 242 233 218 256
Total early stage 455 502 500 493 454 427 398 408 409
Early stage as a % of
total investment
36 38 38 38 35
34
33
31
35
Source: BVCA Report on Investment Activity (various years)
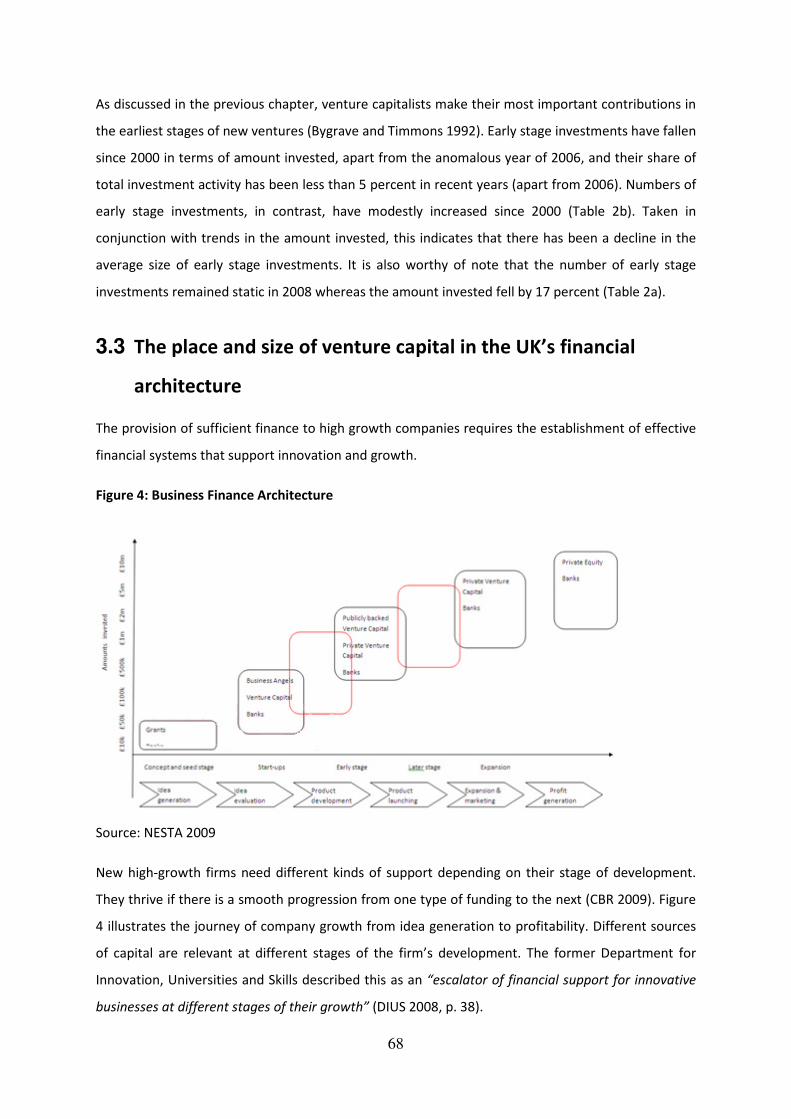
68
As discussed in the previous chapter, venture capitalists make their most important contributions in
the earliest stages of new ventures (Bygrave and Timmons 1992). Early stage investments have fallen
since 2000 in terms of amount invested, apart from the anomalous year of 2006, and their share of
total investment activity has been less than 5 percent in recent years (apart from 2006). Numbers of
early stage investments, in contrast, have modestly increased since 2000 (Table 2b). Taken in
conjunction with trends in the amount invested, this indicates that there has been a decline in the
average size of early stage investments. It is also worthy of note that the number of early stage
investments remained static in 2008 whereas the amount invested fell by 17 percent (Table 2a).
3.3 The place and size of venture capital in the UK’s financial
architecture
The provision of sufficient finance to high growth companies requires the establishment of effective
financial systems that support innovation and growth.
Figure 4: Business Finance Architecture
Source: NESTA 2009
New high-growth firms need different kinds of support depending on their stage of development.
They thrive if there is a smooth progression from one type of funding to the next (CBR 2009). Figure
4 illustrates the journey of company growth from idea generation to profitability. Different sources
of capital are relevant at different stages of the firm’s development. The former Department for
Innovation, Universities and Skills described this as an “escalator of financial support for innovative
businesses at different stages of their growth” (DIUS 2008, p. 38).

69
The blank boxes in Figure 4 represent those steps where finance is hardest to obtain. They need
particular attention from policymakers. Most investors and entrepreneurs observe that an “equity
gap” exists for investments from £250.000 to £2 million; others have identified a second equity gap
which stretches up to £5 million (especially for the medical and pharmaceutical sector) (NESTA
2009).
3.3.1 Informal venture capital
Informal venture capital investments which are mainly made by Business Angels play an important
role in first stages of company’s growth. Venture capital, because it is typically organized around
limited and general partnerships, has formal reporting requirements such that the activity,
strategies, and financial returns are at least well publicized, and possibly well understood. Angel
capital on the other hand, is typically invested by individuals investing their own money directly into
opportunities that they find attractive. They have no partners to formally report to, make smaller
investments than formal VC’s, and as a result we know relatively little about the activity, strategies,
and financial returns to business angel investing (Wiltbank 2009).
Over the past decade Business Angels have become an increasingly important source of equity
finance for new and nascent businesses (HM Treasury 2008) as venture capital funds are not able to
accommodate a large number of small deals with heavy due diligence requirements (EC 2002). The
UK Government recognises the vital role that Business Angels play in the funding of early stage
businesses and in helping to fill a difficult void in supply, where businesses are graduating from debt
to equity finance but are also a critical source of advice, guidance and support for entrepreneurs
(HM Treasury 2008).
Despite their increasing importance, in depth information on the outcomes of Business Angels
investing, returns and exits has been lacking to date in the UK. Mason and Harrison (2002b)
conducted the first attempt to identify the returns and characteristics of the UK Business Angel
Investors, pointing out the lack of evidence on the outcomes of investments by Business Angels. In
that research they suggest that this represents a significant gap in our knowledge and understanding
of an important segment of the venture capital market. NESTA (see Wiltbank 2009) conducted a
study on the Business Angels characteristics, performance and activities. The study surveyed 158 UK
based angel investors that made over 1000 investments and found that on average they made 22
percent returns (IRR). Most angel investing is done within 250 kilometres of the investor’s home,
though 25 per cent of investor were willing to make investments abroad. Angel investors are
typically male (93 per cent) and they invest on average £42,000 each. The typical age of the business
angel was 53 with significant professional experience in large companies (13 years). Most have

70
founded several new ventures themselves, virtually all had university degrees and more than half
had advanced degrees.
Business Angel investors generally represent the first significant outside capital invested in start-up
companies. After an entrepreneur or team of entrepreneurs identify a business opportunity and
invest their own resources, they often turn to business angel investors to provide seed or early
capital. At this point in the development of new ventures the risk of failure is significant as
frequently parts of the business model, customer relationships, pricing strategy, talent, and other
key factors are still exposed to high ambiguity.
Although there is no comprehensive survey of business angel activity available in the UK, it is
estimated that in 2000 there were between 4,000 and 6,000 Business Angels, investing up to £1bn
annually (Lord Sainsbury 2007). A latest estimate puts this figure at £469m per year (BIS 2011). In
the US as a comparison, there are currently approximately 258,200 active business angel individuals
which invested over $26 billion in 2007 in 57,120 entrepreneurial ventures according to the Centre
for Venture Research at the University of New Hampshire Centre for Venture Research. It is
therefore clear that there is considerable scope for further investigation and development of this
area of investing.
3.3.2 External sources of firm finance
Bank finance is by far the main source of finance for UK based businesses. As Figure 5 shows over 50
per cent of businesses use credit cards or overdrafts to finance their ventures while approximately
one quarter of them use bank loans.
At first glance, finance for growth businesses appears to present only a limited problem. A recent
European Commission report (EC 2009) showed that only 19 per cent of UK small and medium-sized
enterprises saw limited access to finance as a constraint. Although this figure was higher than that in
other European countries (it was just 7 per cent and 9 per cent respectively in Finland and Denmark),
it at least implied that the vast majority of the UK firms are able to secure external finance.
However, this figure conceals a difference between different types of firm. As Figure 5 shows, the
majority of firms accessing finance relied on small-scale debt finance: credit cards, overdrafts and
commercial loans.

71
Figure 5: External sources of finance - percentage of business using various financial products
Source: CBR 2008
The high-growth firms described earlier often do not fit into this category, especially in their early
years. These companies require significant capital up front. And this is very hard to obtain from
conventional sources of debt finance. They tend to have intangible assets, and show a significant
delay before generating revenue making than a high risk investment. These firms are some of the
most attractive growth prospects, and include start-ups in the information technology, life sciences
and advanced engineering sectors. They rely on early-stage equity finance: venture capital and angel
investment.
3.4 Venture capital finance
Different estimates put the number of businesses in the UK that are reliant on venture capital are
approximately one to two thousand (Thomson One, Reuters).

72
Figure 6: Regional Innovation System and Regional Finance System
Source: Author’s research and Thomson Reuters
The financial system contains three main sources of finance as we saw earlier (debt, soft and equity)
but this thesis concentrates only on the part of the financial systems which is more connected to
innovation i.e. venture capital. In Figure 6, the lighter shaded part of the finance community cycle
represents debt and soft finance. The darker shaded part of the cycle which partly overlaps with the
innovation system cycle represents the venture capital community and includes the 1000 to2000
innovative companies that receive VC funding.
Venture capitalists' location in the centre of a system of tacit knowledge exchange provides them
with a great deal of hard to acquire know-how and know-who but they are not the only actors who
possess these skills and connections. Others are well informed about technological breakthroughs
and key players in industries or are familiar with growing companies. Entrepreneurs themselves can
make connections with suppliers, customers and strategic partners, although it may take
considerably more time to do so. What sets venture capitalists apart is their ability to speed up this
process to the extent that companies gain a significant competitive advantage (Zook 2004).
3.5 The role of government in early stage investment
The UK government has increasingly recognised the importance of early-stage equity investment for
economic growth and innovative activity and the existence of an equity gap – the inability of small
Innovation
community
Finance
Community
Dept and soft
finance
Venture Capital
Funds
1000-2000
Venture capital
backed firms

73
firms to access the finance they need to grow – has been a long-term challenge for British
governments. Successive administrations have acknowledged the importance of the VC industry and
implemented various initiatives in support of early stage venture capital investment, including seed
and start-up funding. There are three main categories of UK government programs which intend to
mobilise venture capital in support of SMEs: 1) direct supply of capital to small firms, 2) direct
supply of capital to investment funds which will then invest in small firms, 3) financial incentives for
investing in SMEs (e.g. tax credits) particularly focused on the informal VC investors i.e. Business
Angels. But six decades after the first government intervention in support of finance to SMEs, there
is still no consensus as to what constitutes an effective model of government intervention.
Around the time of the Second World War, government thinking focused on plans to institutionalise
business finance, by creating new organisations to provide funding to small and medium enterprises
(the Industrial and Commercial Finance Corporation, ICFC, which later evolved into 3i). Tax incentive
schemes to promote investments and the availability of external finance to business were originally
introduced in 1983 and were replaced in 1990s by the Enterprise Investment Scheme and Venture
Capital Trusts. Towards the end of the 1990s, a number of new initiatives were introduced,
targeting different sub-segments of the early stage market, namely the regional Venture Capital
markets (Regional Venture Capital Funds), university spin outs (University Challenge Funds) and very
small business (Enterprise Guarantee Funds).
The introduction of Enterprise Capital Funds (ECFs) in the new century saw the government’s focus
shift to incentivising private investors to co-invest with publicly backed venture funds, in the case of
ECF by providing 2:1 matching of private capital.
This, in turn, has prompted a profusion of public sector schemes both in the UK and elsewhere which
Murray (2007, p. 174) notes was a clear signal “of venture capital’s status as an important
instrument of entrepreneurial and innovation policy.” Many of these government venture capital
programmes have been regionally-based, notably the Regional Venture Capital Funds and various
funds established by the Regional Development Agencies in England and the Regional Development
Agencies in Wales, Scotland and Northern Ireland. This has been partly for efficiency reasons (e.g. to
use local knowledge and networks, co-ordinate better with other local economic policies) and partly
to address gaps in the supply of finance in specific regions (regional equity gaps) (Sunley et al. 2005).
Between 2000-2009, the government placed around £337.9m in these schemes. Other investors
contributed a further £438.2m making a total of £776.1 million available to business (NAO 2009).
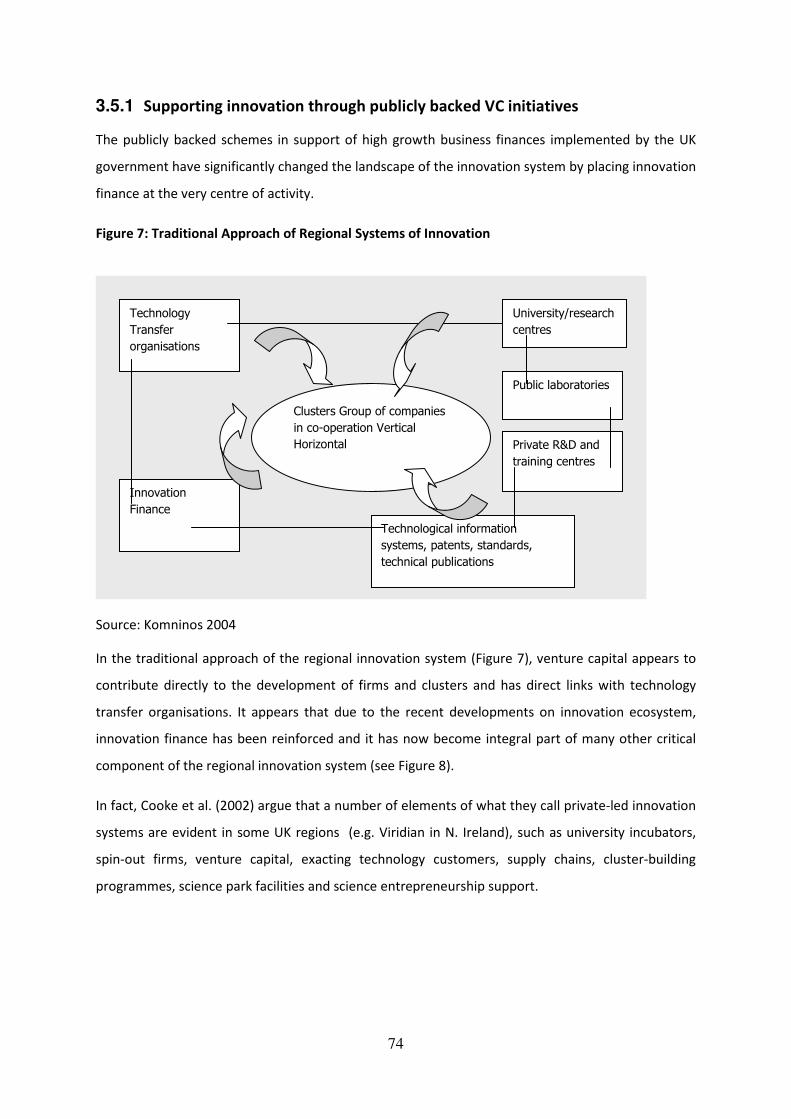
74
3.5.1 Supporting innovation through publicly backed VC initiatives
The publicly backed schemes in support of high growth business finances implemented by the UK
government have significantly changed the landscape of the innovation system by placing innovation
finance at the very centre of activity.
Figure 7: Traditional Approach of Regional Systems of Innovation
Source: Komninos 2004
In the traditional approach of the regional innovation system (Figure 7), venture capital appears to
contribute directly to the development of firms and clusters and has direct links with technology
transfer organisations. It appears that due to the recent developments on innovation ecosystem,
innovation finance has been reinforced and it has now become integral part of many other critical
component of the regional innovation system (see Figure 8).
In fact, Cooke et al. (2002) argue that a number of elements of what they call private-led innovation
systems are evident in some UK regions (e.g. Viridian in N. Ireland), such as university incubators,
spin-out firms, venture capital, exacting technology customers, supply chains, cluster-building
programmes, science park facilities and science entrepreneurship support.
Technology
Transfer
organisations
Technological information
systems, patents, standards,
technical publications
Innovation
Finance
Private R&D and
training centres
Public laboratories
University/research
centres
Clusters Group of companies
in co-operation Vertical
Horizontal

75
Figure 8: Financial Activity within the Regional Innovation System
Source: Komninos 2004, author’s research
A current look at the main components of the regional innovation system reveals that most of them
have been actively involved with some type of venture capital activity in the last decade (Figure 8).
For example, there has been a culture change in the UK’s universities over the past decade. The
University Challenge Fund Scheme was announced by the Chancellor of the Exchequer, in March
1998 as collaboration between the Government, the Welcome Trust and the Gatsby Charitable
Foundation to assist universities in turning research projects into viable businesses. The competition
was launched in June 1998 and all universities were invited to apply. Collaborative bids involving
other Higher Education Institutions and Public Sector Research Establishments were also invited.
The first University Challenge Competition created 15 seed funds allowing 37 institutions (31
universities and 6 institutes) access to investment capital. The total value of the funds created
(including the 25 percent matching funds required from the participants) was in excess of £60
million. The seed funds established from the first competition have been between £1m and £5m
with the ability to make single investments to a maximum of £250,000 per investment. The progress
of the funds will be monitored for 10 years by collecting annual reports to a common format. The
second annual report (2000-2001), showed that £11.9 million of investment has already been
committed. A total of 143 projects have been supported by the 15 seed funds with an average
investment of £83,000. The University is the trustee for the funds, which are held in a dedicated
account (Druilhe and Garnsey 2004).
Technology
Transfer
organisations
Technological information
systems, patents, standards,
technical publications
Innovation
Finance
Private R&D and
training centres
Public R&D
laboratories
University/researc
h institutes
Clusters Group of companies
in co-operation Vertical
Horizontal
UCFs
Ad hoc
RVCFs

76
Knowledge transfer and commercialisation activities have steadily increased since the early 1980s,
however the large exploitation of such activities began only after 1997 (UNICO 2005). In 2007, there
were over 590 university spin-out companies in the UK which attract approximately 12 percent of all
the UK’s substantial venture capital finance, and to date these companies have raised a total of over
£2bn in external investment and many have floated at substantial valuations (Library House 2007).
3.5.2 Evaluations of government schemes
There have been several evaluations of the government schemes so far. The first one conducted by
NESTA (2009) performed a qualitative evaluation of the public funds and highlighted several
operational issues concerned with their effectiveness. NESTA argues that many publicly backed
funds (e.g. Regional Venture Capital Funds and University Challenge Funds) face difficulties owing to
the fact that they have multiple objectives: for example to deliver both a commercial and a social
return, or to encourage regional development (NESTA 2009).Indeed, the more objectives a fund has
(either explicitly or tacitly), the less likely it is to satisfy any of them. Explicit non-financial objectives
also make it harder to recruit an appropriate team: at present, investment professionals with the
skills to undertake economic development work are rarely those with the best track records of
backing and developing profitable companies (NESTA 2008c).
According to NESTA (2009), public funds also frequently suffer from problems of size. Firstly, they
are in some cases too small to operate effectively, either not being able to do make enough
investment to justify their operating costs, or not spending sufficient money on staff and operations
to make good investments. Secondly, small funds are particularly likely to make small investments,
which can often be self-defeating, as investees spend too much time looking for their next funding
round and not enough time building their business.
A number of publicly backed funds are geographically focused, with a requirement to concentrate on
certain English regions or UK nations. NESTA (2009) argues that although venture capital certainly
has a role to play in stimulating regional economies, limiting funds to regions has significant risks.
Firstly, it is often associated with being very small and having mixed investment objectives, as
outlined above. Secondly, it constrains funds’ ability to source high-quality investments: economic
activity frequently crosses the borders between regions, which in the UK are relatively small in
geographic terms. This means that a fund that can only invest in its local region is likely to turn down
many potentially attractive but non-local investments it encounters, reducing its chances of striking
good deals.

77
Another evaluation conducted by NESTA and BVCA (2009) focused on the effectiveness of these
funds on business performance. The researchers conducted an econometric analysis of the impact of
investment from six UK government backed venture capital schemes was conducted on a detailed
data-set of 782 funded young firms over the period 1995-2008. The impact of these schemes on firm
performance, was compared to a matched control sample with companies that have never received
VC investment. The study found that the size of this impact remains small to date albeit longer term
trends appeared encouraging (from limited information). The analysis finds repeated positive and
encouraging evidence of firms that have received funding engaging in venture capital style ‘equity
investment’ behaviour. While producing an initial negative impact on firm performance, firm growth
rebounds strongly after a number of years. The analysis suggests it takes approximately 4-5 years to
turn performance around.
The report recommends that government backed, hybrid venture capital funds should be
substantially larger than they have been in the past in order to allow them to provide follow-on
funding, diversify their investments and spread their high fixed costs. Government policy should also
recognise a tension between regional policy and innovation policy. Outside the major metropolis of
Greater London and the South-East, funds that are limited to certain geographical regions are
unlikely to have a sufficiently large enough pool of high-potential firms to be commercially viable.
Large, specialised and successful venture capital funds are increasingly likely to operate at a
continental and/or transatlantic scale in the European Union.
The National Audit Office (2009) conducted an evaluation of the schemes to assess the financial
performance of these funds. The evaluation found that the government has set multiple aims for
each fund but these have not been translated into clear measurable objectives, or been
appropriately prioritised. With the exception of the Enterprise Capital Funds no clear financial
objective was set for the impact of the funds to the taxpayer, such as whether they were expected
to break-even and over what timescale, and the Department did not specify objectives for wider
economic benefits. Therefore the evaluation could not conclude whether the funds met their
objectives or not, since these objectives were never clearly identified.
The authors of the report surveyed business groups, businesses and fund managers that were
involved in the schemes. Eighty four per cent of businesses surveyed by NAO for three of the funds
reported that the initial funding had made it easier for them to obtain additional finance from other
sources. Without support, most of those who would have proceeded anyway would have delayed
their plans or reduced the scale of their activity. Publicly supported venture capital was not the only
source of funding available to these start-up companies. Thirty two per cent of businesses reported

78
they would have been unable to obtain any finance without support from the funds. Around 23 per
cent reported that they would not have gone ahead with their planned activity in the absence of
finance from the Department’s funds.
The financial performance of the funds has also been very poor (although not untypical when
compared with private VC returns over the same period). The report also argued that the
performance of the RVCFs was impeded by their design and that due to geographical restrictions the
pool of viable business propositions targeted by the funds was restricted. In some cases restrictions
were on the basis of investment criteria, for example their regional focus and the total allowable
investment limit for a business was £500,000, which restricted the size of initial and follow-on
investments.
CI Research (2007) conducted an interim evaluation of Regional Venture Capital funds (RVCFs) and
Early Growth Funds on behalf of the government. Evidence from business and stakeholder surveys
has revealed that both the RVCF and EGF programmes have provided finance to companies who
would have been unlikely to have received equity finance from the private sector. More particularly
the evaluation found that recipient businesses reported a range of benefits, from the introduction of
new products and services and entry into export markets, through to the benefits received from the
advice and guidance of Fund Managers. The majority of businesses have already experienced growth
in employment and turnover, and many reported that much of this was a direct result of the
investment of public funds. The general view amongst stakeholders (such as fund managers) was
that the funds operate within the equity gap, albeit at the lower end. The funds have leveraged a
substantial amount of funding into the equity gap, with very few suggesting that RVCFs and EGFs
had displaced private sector funds. The predominant view amongst stakeholders was that most
recipient businesses would not have secured the finance through other routes. Investment rules, in
particular the upper limit on investment deals, are felt to have hindered fund performance. The
upper limit has been set higher for successor programmes (e.g. Enterprise Capital Funds) but there
was some concern that this would lead to a lack of supply at the lower end of the equity gap.
Stakeholders report the funds have had wider benefits, including the establishment and growth of
investor networks. However, a common belief was that neither scheme would deliver a lasting
impact on the equity gap, meaning there was a continued role for public funds.

79
3.6 The impact of the global financial crisis on UK growth finance
The 2008 financial crisis has made government action even more relevant to the financing of early-
stage businesses. As we shall see below, it has made private capital for venture finance a scarce and
dwindling phenomenon. Many small businesses face financial challenges in the recession, as banks
(the main source of credit for most smaller firms) become more risk averse. But the effect on high-
growth firms and the equity capital on which they depend has been even more damaging. NESTA’s
research (2009) has shown that existing venture funds have very little money remaining to invest,
and that the rate at which new venture funds are raised has slowed dramatically. All of this raises
severe challenges for the cohort of 1,000 high-potential firms, most of which will require new
finance in the next 12-18 months.
The effect of the financial crisis and the accompanying downturn is the most obvious cause. Falling
stock markets and poorer trading environments make it harder for funds to sell or float their existing
investments, which then require further investment to keep them running, severely limiting the
amount available for new investments. In addition, some funds’ limited partners (financial investors)
are suffering in the current liquidity crisis; there is anecdotal evidence that this too is affecting their
ability to fund further investments (NESTA 2009). Finally, some observers have also noticed a trend
for institutional investors (who provide the money for some venture capital funds) to reduce the
amount of money going into private equity of all kinds, which makes it harder to raise venture
capital funds (even though the bulk of the asset class is dominated by leveraged buy-outs, a very
different type of investment).
The effect of the credit crunch on other sources of venture funding, such as angel investors, has not
been studied in depth, but it seems likely that the poor performance of most asset classes in recent
years will leave these rich investors with less money to invest in high-growth firms.
Figure 9 and Figure 10 show the number of recipient companies and total amount invested
respectively, by stage and year for the decade from 2000-2009. Reported figures include only
disclosed amounts. The decade is split into four chronological periods: 2000-boom year; 2001-2003
– crash years; 2004-2007 – recovery years; and finally 2008-2009 – financial crisis.

80
Figure 9: Venture Capital Investments, number of companies by stage, 2000-2009
Source: VentureSource Dow Jones
Figure 10: Venture Capital Investments, amount invested by stage (£m), 2000-2009
Source: VentureSource Dow Jones
In 2009, venture capital investments saw a double digit decrease. The number of companies
receiving Venture Capital decreased by 17 percent compared with 2008, from 322 to 266 (Figure 9).
In 2009, £677m was invested by VC funds in UK companies - a drop of 27 percent compared with
the year before, when £930m was invested (Figure 10). This follows falls in activity in 2008.
First time financing (seed and first round) experienced a substantial drop of 53 percent in total
amounts invested and 29 percent in term of the number of companies backed since 2008. The

81
number of companies receiving VC finance declined by 50 percent since 2007. In the two year period
2007-2009, the UK VC market contracted by about 40 percent. More particularly, the number of
companies receiving VC finance decreased by 38 percent while the total amount invested fell by 37
percent. By comparison, there was a more radical decrease between 2000-2002 where the number
of recipient companies fell by 54 percent while total investment was 77 percent lower by 2002.
Strikingly, in both crises, seed and first round investments (first-time financing) have been extremely
volatile and suffered the most. In fact, between 2007-2009, total investment in seed and first round
companies decreased by 58 percent with 52 percent fewer companies backed. A more severe drop
was experienced between 2000-2002 where amounts invested dropped by 90 percent and first
stage financed companies fell by 73 percent.
The number of companies receiving VC finance (Figure 9) increased slowly but steadily between
2002 and 2005, slightly falling in 2006 and picking up in 2007. With the start of the financial crisis
(2008) the number of investments fell back dramatically to 2002 levels, dropping in 2009 to the
lowest level of the decade. Total amounts invested in 2009 were the same as in 2003 (Figure 10),
(both after crash years).
Seed and first round recipient companies have fallen from 71 percent of all companies receiving VC
investment in 2000 to 42 percent in 2002, rising to 61 percent in 2006 and dropping to 44 percent in
2009. Their contribution to the market share in terms of total investment fell from 51 percent in
2000 to 22 percent in 2002, rising to 46 percent in 2006 and falling back to 24 percent in 2009.
Second stage investments have been less volatile than other investments. Their proportion of
transactions has ranged from 17 percent (2006) to 41 percent (2003) and their proportion of total
amounts invested has ranged from 18 perccent (2006) to 30 percent (2002). Later stage investments
have consistently attracted the largest share of investment funding compared with the other
investment stages apart from in 2000 and 2006 where more money went into first and second stage
investments. Second and later stage investments have been modestly increasing at the expense of
seed and first round investments during the last four years.
Total amounts invested and the number of companies receiving VC finance show similar
distributions in both 2002 and 2009. The decline in deals and total investment reflect the
diminishing fundraising trends in the UK VC market.
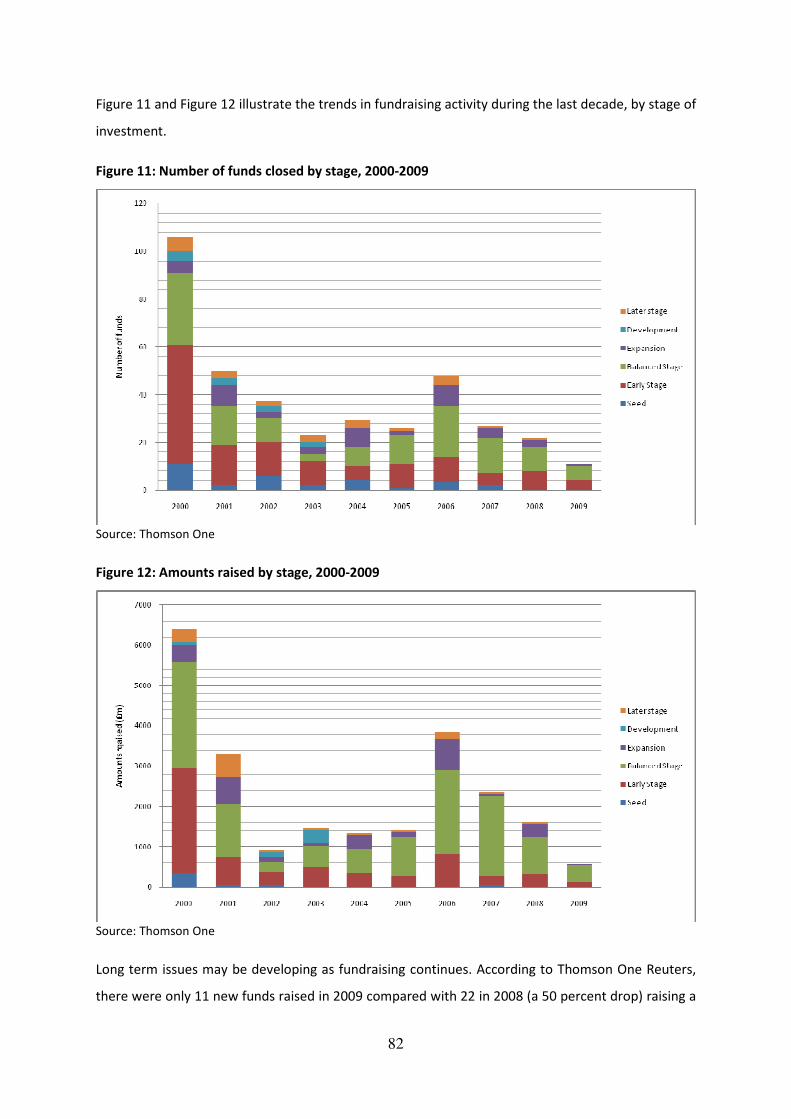
82
Figure 11 and Figure 12 illustrate the trends in fundraising activity during the last decade, by stage of
investment.
Figure 11: Number of funds closed by stage, 2000-2009
Source: Thomson One
Figure 12: Amounts raised by stage, 2000-2009
Source: Thomson One
Long term issues may be developing as fundraising continues. According to Thomson One Reuters,
there were only 11 new funds raised in 2009 compared with 22 in 2008 (a 50 percent drop) raising a

83
total of £573.6m compared with £1,613m in 2008 (a drop of 64 percent). Early Stage funds have
also been severely affected, from eight funds in 2008 to four funds in 2009 raising £128m in 2009
compared with £329m the year before (a drop of 50 and 61 percent respectively).
The decrease in fundraising is significant and worrying as it puts at risk the VC market as a whole.
The market experienced a similar decrease during the dotcom crisis. The number of funds closed fell
from 106 funds worth £6,409m in 2000 to 37 funds raising £919.5m in 2002, representing a decrease
of 65 percent for the number of funds and 86 percent on the amounts raised.
Early stage investments have fallen since 2000 as a proportion of total Private Equity investment and
their share of total investment activity has been less than 5 per cent in recent years (NESTA 2008a).
This trend is set to continue with fundraising activity for Early Stage funds further diminished.
The pattern of venture capital funding over the last decade has been characterised by a sharp
decrease in the supply of funds during the dotcom crash, a steady increase during the recovery
period and another sharp decrease during the current financial crisis. More particularly, the annual
flow of money into VC funds increased after the earlier crisis peaking at approximately £4 billion in
2006.
3.6.1 No signs of recovery
Aggregated data suggest that there has clearly been a decline in all indicators of VC activity since
2008. In 2009, investment activity saw double digit decline, marking the lowest venture investment
level of the last decade, with first time financing experiencing the steepest decline. In both the
dotcom and financial crises, venture capital activity was severely hit with first time financing facing
the greatest burden. Similarly, both crises resulted in a significant reduction in the number of new
VC funds established in the aftermath of the crisis, when the total VC amounts raised plummeted. It
is worth noting that current fundraising activity is considerably lower than in 2001.
NESTA’s (2010) empirical analysis shows a significant and unprecedented increase in the time taken
to exit. Companies now need approximately three extra years to realise a return compared with
companies exited during the previous crisis. In addition, there is now less certainty as per the
expected years needed for a company to exit. As a result, venture capitalists have slowed their
appetite for investments into new companies, concentrating instead on existing portfolios that now
require additional funding rounds and more time to exit. The uncertainty of the duration that a fund
is expected to keep a company within its portfolio, significantly impacts in the fund’s strategy which
now has to reserve resources and minimise its risk appetite.
84
3.7 Conclusion
Rapidly growing entrepreneurial enterprises are viewed as important sources of innovation,
employment and productivity growth and therefore it is natural that governments would be
interested in the provision of finance for high-technology enterprises through venture capital
schemes (Brander et al. 2010). The UK government has implemented various initiatives in support of
the venture capital industry aiming to address the ‘’market failure’’ that may arise in entrepreneurial
finance and also aiming to generate positive spill over effects throughout the economy. However,
notwithstanding the possible merits of government support for venture capital, such intervention
may be subject to the usual problems often attributed to government (Brander et al. 2010). In the
case of the UK, such problems include small size and poor structure of the funds, multiple objectives
and geographical restrictions.
Despite their problems, the UK government schemes have helped firms to access finance. The NAO
(2009) evaluation of the schemes revealed that around one third of the firms that received
investments from publicly backed funds would have been unable to receive any finance without the
support of the government schemes while one quarter of them, would not have gone ahead with
their planned activity had it not been for the finance from the public funds. This results, illustrates
that such funds help ‘oil the wheels’ but they are not panacea as they are not enough on their own
to attract large scale private venture capital investments into the early stage market.
Finally, the current financial crisis has initiated a debate amongst scholars on the future of the
venture capital industry. Some observers argue this is a permanent shift towards lower returns,
raising doubts about the sustainability of the VC model (Kedrosky 2009). However, VC returns
relative to the overall stock market since 2002 have not been much different than the long-term
historical average, so recent returns may reflect the natural evolution of a competitive market
(Kaplan and Lerner 2010).

85
4 CHAPTER 4: METHODOLOGY
4.1 Introduction
This chapter presents and justifies the research methodology employed by this thesis. It analyses the
benefits and limitations of alternative methods of data collection and analysis used in undertaking
the research. Influenced by the work of economic geographers and economists, this chapter draws
particular attention to the debate related to the use of quantitative and qualitative analysis. The
research utilises quantitative methods which are coupled with a mixture of qualitative research
techniques such semi-structured interviews that aim to unveil hidden characteristics and likely
causalities that are impossible to be identified by a quantitative analysis. The first part of the
chapter illustrates the hypotheses to be tested and formulates the research questions. Part two,
reviews the theoretical debates and philosophical assumptions that accompany the research
methods. Part three includes a description of the quantitative and the qualitative methods used in
this research. The final part of this chapter provides a detailed description of how this work has been
conducted.
4.2 Hypotheses and research questions
The research aims to test several hypotheses related to venture capital activity in the UK regions and
the role of the publicly backed VC funds in those activities. More particularly, it investigates the
potential impact of publicly backed funds in the supply of VC finance to regional businesses and
subsequently, it analyses how different to private venture capital funds these funds are, in terms of
supporting innovation in businesses and consequently in regions.
In a research hypothesis, a single concept (e.g. type of venture capitalists – pubic or private) might
explain others (e.g. innovation performance of business that they back or the extent to which
venture capitalists interact with the outside world). The theoretical considerations result in an
expectation about what should be observed if the theory is correct (Babbie 2004). The notation
X=f(Y) is a conventional way of saying that X (business innovation or rate of interaction) is a function
of (depends on) Y (extend of public dependency of the VC fund). At this level, X and Y still have
rather general meanings that could result in different observations and measurements. But
operationalization specifies the procedures that will be used to measure the variables and this
operationalization process results in the formation of a testable hypothesis (Babbie 2004), such as:

86
‘’ability of the venture capital fund to invest in business with potential to innovate is a function of the
type of money that it manages – public or private’’, and
‘’self-reported frequency of interaction between venture capitalists and the outside word, is a
function of the type of venture capital funds – public or private.”
Observations aimed at finding out whether these statements accurately describe reality are part of
what is typically called hypothesis testing (Babbie 2004).
For instance, given the large number of the publicly backed funds and the (collectively) large assets
under management, it is likely that such funds have become important players of the regional VC
communities and in some cases dominate the regional VC landscape (Hypothesis 1).
The literature suggests that there is a close relationship between venture capital and innovation
(Gompers and Lerner 2000) and it is expected that this relationship (one of association and not
causation) will be present at the UK regional level and higher volumes of venture capital will be
positively correlated with higher volumes of patents application (Hypothesis 2).
Due to the fact that publicly backed funds have not performed well in terms of financial returns
(NAO 2009) and the business that they backed did not show a noticeable improvement (NESTA and
BVCA 2009), the expectation is that such funds do not invest in companies with the potential to
innovate to the same extent that private funds do (Hypothesis 3).
There is a belief that publicly backed venture capitalists would be keener to engage with the regional
innovation community than private venture capitalists, mainly due to their linkages with their
funding bodies (e.g. Government, RDAs, Universities etc.). Therefore the hypothesis is that
professionals from publicly backed funds have established active communication and networking
with several local incubators, Business Angel networks, universities and they appear to be more
active than their counterparts from the private sector (Hypothesis 4). Having set out these
hypotheses, a number of questions for testing them were identified.
1. Have the public funds changed the landscape of the supply of VC finance in UK regions?
2. Is a higher volume of VC investments positively correlated with higher volume of patent
applications?
3. Are public funds less effective in investing in companies with the potential to innovate, than
private funds?

87
4. Are those VCs employed by public VC funds more active in engaging with the regional
innovation bodies than those who are employed by private VC funds?
As a starting point, and common to research questions 1, 3 & 4 there was the need to identify which
VC funds were publicly backed. In order to address question 4 it was also necessary to identify
individual venture capitalists. Using the BVCA directory, commercial databases, venture capital funds
websites, government websites such as BIS and Capital for Enterprise, and utilising personal
knowledge of the market, it was possible to identify venture capital funds that receive public money.
The questionnaire which was constructed for the purpose of investigating question 4 (see section
4.4.5), included questions that provided information on the proportion of public money that the
fund had under management. Once the survey data was collected and analysed, such an expectation
was clearly confirmed.
Since the four hypotheses can have more than two variables each (e.g. potential of business to
innovate does not only depend on the type of VC it receives), it was necessary to identify other
factors that may influence any potential relationship.
Based on the literature and also on discussions with several venture capital professionals, a number
of possible factors that could influence the dependent variables were identified. For example, apart
from the type of fund – public or private - the ability of a fund to invest in companies with the
potential to innovate may be related to factors such as:
Industry focus - does the industry in which a VC fund invests have a close relationship to innovation
(i.e. biotechnology) or not (i.e. retail sector). If the fund mainly invests in companies that operate in
an industry that is not associated with innovation, then its potential to invest in innovation
companies would be limited.
Location of the fund - does the region in which the fund operates have innovation bodies that are
willing to engage with the VC activities; are the companies located in this region innovative (i.e. is
there sufficient demand for VC investments). As shown earlier, the literature suggests that proximity
is an important factor in the venture capital industry and therefore a VC fund is likely to make most
of its investments in the region it is based. In addition, most of the publicly backed funds have
geographical restrictions as to where they can invest. If the companies that are located in the region
where the fund is based are not innovators, and there is no sufficient demand for VC investments,
then the funds may find it hard to identify and invest in companies with the potential to innovate.

88
Average size of deal – Companies that operate in particular industries e.g. medical devices are in
need of large investments. Funds that can only provide small size investments inevitably miss out all
companies that require larger investments.
Investment stage – the stage of the investment could also be associated with innovation.
Investments in early funding rounds entail more risk than those in later stages. Companies at later
stages may have the ability to develop more innovation and create more patents.
In research question 4, the ability of a venture capitalist to engage and interact with the regional
innovation community may be influenced by some of the factors outlined above, namely industry
focus and location of the fund. In addition, other variables including years of experience in the firm,
years living in the region, may also play an important role in the ability or willingness of the venture
capitalists to interact with other bodies.
Years of experience in the firm - years of experience could be related to the rate of interaction, with
professionals with more experience being more active than younger ones in interacting with
external bodies.
Years living in the region - years of working in the same region could be related to the rate of
interaction, with professional with more years living in the region being more active than
professionals with fewer years.
Revenue – the company’s revenue is an indication of the maturity of the firm. Therefore funds that
invest in companies with little or no revenue take more risk than funds that invest in companies with
revenues. As shown in the literature, pre revenue companies are in need of more active engagement
from the venture capitalists side and may require more frequent interactions compared with more
mature companies. It was not possible to distinguish between different stages of investments in the
survey since the VCs indicate that invest in more than one investment stage. However, the variable
revenue provides some indication as per the company’s investment stage.
In order to ensure that several of these possible explanations are also taken into account when
analysing information, an econometric analysis framework was adopted which allowed control for
various alternative hypotheses.
4.3 Methodological approaches
From the 1980s onwards, economic geography moved away from traditional economic analysis and
transformed into a more interdisciplinary approach using insights from social, cultural and political

89
sciences (Boschma and Frenken 2005). The quantitative revolution has been side-stepped and
displaced by a more qualitative and speculative mode of analysis in the hope of representing the
spatial scope and diversity of economic life. Thus while quantitative economic geography persists in
the discipline, it is no longer the customary mode of analysis (Clark 1998).
Recent work in economic geography and the geography of finance is based upon in-depth
interviews, or close dialogues with industry respondents (Clark 1998). Not all economic geographers
use or even accept the use of close dialogue relative to stylized facts (a simplified presentation of
empirical findings) and according to Clark (1998) this may prove to be a basic difference between
geographers’ economic geography and economists’ economic geography. Clark (1998) argues that
close dialogue can play an important role in promoting theoretical innovation in economic
geography, in general, and in the geography of finance, in particular. He believes that the
widespread acceptance of the market-efficiency hypothesis has led many researchers to ignore the
spatial and temporal diversity of agents and institutions:
‘’ missing in the literature are explanations of apparent trends in local decision making, the process
of product innovation in “thin” (incomplete and missing) markets, and an understanding of the
interaction between the prejudices of investment institutions with respect to the urban economy in
all its variety…Not surprisingly, the stylised facts claimed to be relevant to the geography of finance
are so lacking content that cutting against their abstraction is one object of geographers’ research’’
(Clark 1998, p. 79).
Close dialogue is useful in this context because of the potential richness of substantive observation,
the opportunity it promises for intellectual innovation, and its relative independence from the
doctrine of market efficiency (Clark 1998). Close dialogue can be used, as it is used in the industry, to
document and assess the actual practice of investment decision making, given the extraordinary
variety of practice and the decentralized nature of market behaviour (Clark 1998).
Amin and Thrift (2000) note that economic geographers have developed their own skills base
depending upon the understanding of open systems, appreciation of context, and qualitative
techniques:
‘’what is striking about the current state of the social science is the explosion of work on economics
by scholars who either have left mainstream economics to found new domains of knowledge or do
not have formal background in economics’’ (Amin and Thrift 2000, p. 5).

90
“Here the literature has moved well beyond formal models of technological innovation and learning
into the territory of evolutionary and institutional economics, to identify the role of habits, routines,
convention, path-dependencies, variety in the selection environment, and so on as key influence on
the pace and direction of learning and adaptation in firms” (Amin and Thrift 2000, p7).
Amin and Thrift (2000) argue that economic geographers have made a central contribution in their
turn through their work on the effects of proximity, distance, and local context – on, what they call –
the softer sources of innovation.
‘’Without a feel for the processes and practices that sustain learning, there can be no proper theory
of the firm and therefore also no proper understanding of the sources of economic
competitiveness…Policy makers and practitioners are also turning to evidence-based economic
research and to social, cultural and institutional understandings of the economy in order to stimulate
innovation, entrepreneurship and competitiveness at varying spatial scales’’ (Amin and Thrift 2000,
p. 8).
The debate between the different schools of economic geography - Neoclassical and Institutional
Economics - has been nicely captured by Boschma and Freken (2005) who also provided support to
an alternative school, the Evolutionary Economics. Neoclassical economists are renewing their
interest in geography while geographers are moving away from economics (Boschma and Frenken
2005). The application of neoclassical economics in economic geography which was named New
Economic Geography (see Krugman 1991) was seen as a revolutionary approach (Boschma and
Frenken 2005). In his paper, ‘’Increasing returns and economic geography’’, Krugman (1991, p. 484)
suggests that:
‘’application of models and techniques derived from theoretical industrial organisation now allow a
reconsideration of economic geography, that it is now time to attempt to incorporate the insights of
the long but informal tradition in this area into formal models.”
Krugman’s approach can be considered as a recent extension of neoclassical thinking to explain
trade, specialisation and agglomeration, relaxing the frequently used assumptions of perfect
competition and constant returns to scale (Boschma and Frenken 2005). At the meantime the
economic geographers, adapted an institutional approach arguing that differences in economic
behaviour are primarily related to differences in institutions (Boschma and Frenken 2005). This has
led to an extensive and inconclusive debate between geographers’ and neoclassical economists’ on
the issue of the economic geography (Amin and Thrift 2000; Boschma and Frenken 2005). Some
geographers dispute the relevance of general or even partial equilibrium models of spatial economic

91
systems, while recognising the commonalities of such models with analytical and mathematical
techniques, there is a suspicion that analytical elegance and tractability drive the focus of analysis
rather than the empirical problems (Clark 1998). At base, geographers dispute the plausibility of
assumptions like homogeneous information, limited transaction and adjustment costs, and the
presumption of spatial-economic convergence (Clark 1998).
The New Economic Geography and the Institutional Economic Geography differ in methodology they
use. These differences are nicely captured by Boschma and Frenken (2005):
‘’ institutional economic geographers dismiss a priori the use of formal modelling and econometric
specifications derived from these. Instead, they apply an inductive, often, case-study research
approach, signalling out the local specificity of ‘real places’. One of the objectives of institutional
analysis is to understand the effect of the local specificity of ‘real places’ on economic development,
which is mainly attributed to place-specific institutions at different spatial scales. Thus, an
institutional approach takes differences between localities as the starting point of the analysis and
analyses how place-specific institutions affect local economic development. In contrast, the New
Economic Geography approaches the matter deductively using formal models assuming utility
maximization and representative agents, and using equilibrium analysis to come to theoretical
conclusions or predictions’’ (Boschma and Frenken 2005, p.3).
Boschma and Freken (2005) suggest that Evolutionary economics can be considered a third approach
in economic geography, yet it has not received much attention, perhaps due to the fact that
economic geographers tend to refer to evolutionary economics and institutional economics as being
more or less indistinguishable.
Table 3: Economic geography theories
Key issues Neoclassical Institutional Evolutionary
Methodology
Deductive
Formal modelling
Inductive
Appreciative theorising
Both
Both
Key assumptions
Optimising agent
A-contextual
Rule-following agent
Contextual (macro)
Satisficing agent
Contextual (micro)
Conceptualisation of
time
Equilibrium analysis
Micro-to-macro
Static analysis
Macro-to-micro
Out-of-equilibrium
analysis/ Recursive
Geography
Neutral space
Transport costs
Real place
Place dependence
Neutral space --> real
space
Path dependence
Source: Boschma and Freken (2005)

92
The methodology that has been used in this thesis borrows elements from both schools –
Neoclassical and Institutional - depending on the research questions aiming to answer. More
particularly, to investigate Hypothesis 2 - higher volumes of venture capital will be positively
correlated with higher volumes of patents application, and hypothesis 3 - publicly backed funds do
not invest in companies with the potential to innovate to the same extent that private funds do -
equilibrium modelling has been used and in that respect, these sections follows neoclassical
economic geographers. Econometrics has been widely used as methods of estimation and for the
purpose of testing hypotheses (Babbie 2004). A basic concern in econometric analysis is the
identification and measurement of functional relationships between the variables in question. The
value of the dependent variable is related to a set of independent (or explanatory) variables by a
function. However, influenced by the work of Clark (1998) and Amin and Thrift (2000) this thesis
takes the position that the use of econometric techniques in the standard fashion cannot be
expected to yield fruitful results when examining spatial proximities, interactions and the geography
of finance. In these situations many things are going on at once and there is a lack of means which
are open to many natural scientists to isolate particular processes in experiments (Sayer 2000).
Achen (1982) provides a guide on the use on regressions for social science. Since the survey chapter
of this thesis (chapter 7) is concerned with the ecology of interactions and tries to examine a social
phenomenon, it is appropriate that a regression style analysis should be interpreted within the
framework of absence of statistical causality. Thus following Achen’s suggestion, the aim of the
regression is not to prove causality. In his book on interpreting regressions he notes:
“several different sets were described in a variety of ways until every other reasonable interpretation
became improbable. There was no attempt at specifying the true functional form; it remained
unknown and unwanted. Nor was any pretence made that the regression coefficient being estimated
represented true effects constant across space and time. Instead the goal was to construct a
statistical description faithful to the data set and to draw causal inferences from the overall pattern,
not just from particular coefficients” (Achen 1982, p 29).
Good social data analysis oriented to theory construction usually begins with a non-functionally –
specific hypothesis. A suitable data set is found to check the claim, and a substantively reasonable
statistical description of it is constructed. If the original hypothesis proves consistent with the data,
the researcher plays at being his or her own hardest critic by constructing plausible alternate
explanations (Achen 1982).

93
Therefore, a more qualitative framework was adopted in order to test hypothesis 4 which looks at
the ecology of interaction between venture capitalists and other bodies of the regional innovation
system. Although econometric analysis is also used to analyse survey responses, it has been coupled
with close dialogue with industry practitioners and a case study approach in accordance with
suggestions from the institutional economic geography scholars.
4.4 Research design
The outline of the multi methods used for this research is set as follows: analysis of academic
literature and the policy framework pertaining to the regional innovation and venture capital
industry; collection and analysis of secondary data; econometric analysis; collection and analysis of
primary data through a survey of individual venture capitalists; semi-structured and face to face in
depth interviews with professional finance agents; and insights acquired from professional
experience at NESTA.
4.4.1 Analysis of academic literature and the policy framework pertaining to the
venture capital industry
The academic literature was gathered through searching library databases such as Scopus and
BI/INFORM Global (Proquest) (accessed by Cardiff University website), Cardiff University library,
Google Scholar and academic journals for which NESTA is subscribed to. The academic literature was
supplemented by policy reports published by various organisations such as the European
Commission, British Venture Capital Association (BVCA), European Venture Capital Association
(EVCA), the British Business Angels Association (BBAA), the Department for Business, Innovation and
Skills (BIS), the National Endowment for Science Technology and the Arts (NESTA).
4.4.2 Collection and analysis of data on the UK VC investments activity
This section outlines the sources of data used in chapter 5. Chapter 5 examines hypothesis 1, and
aims to provide a detailed map of the investments activity in the UK regions, particularly the extent
of publicly backed dependency of each region. The analysis of this chapter is based on two types of
data, aggregated and disaggregated.
4.4.2.1 Aggregated data
Chapter 5, investments activity in the UK regions, draws on aggregated data at the national and
regional level and on detailed records of investments deals. For venture capital activity data the
annual reports on investment activity published by the British Venture Capital Association (BVCA)

94
have been used. This is based on a survey - undertaken by PriceWaterhouseCoopers - of the
Association’s members which comprise the vast majority of private equity and venture capital firms.
It achieves a very high response rate, often 100 percent. The main limitation is that the statistics are
reported in aggregate form, although are broken down into detailed categories, for example, by
stage, industry and region.
4.4.2.2 Disaggregated data
In order to probe beyond the BVCA’s aggregate figures the Library House data (now absorbed into
Dow Jones Venture Source) has been utilised. The Library House database reports individual
investments along with various additional information on the investor and business which enabled
customised tables to be generated. The availability of such information on individual deals allows
considerable flexibility in analysis. However, its coverage is restricted to publicly reported
investments, with attendant limitations in information capture and classification. Using Library
House database, a dataset of 4117 individual investments to 2359 UK based companies spread to all
UK regions for the period 2000-2008 was created. The period covered in the analysis, 2000-2008 was
determined by data availability.
It is important to note that Library House’s coverage of investment activity is narrower than that of
the BVCA, and in particular does not extend to private equity investments. In addition, its database is
built up from reported investments and so does not capture all the investments that BVCA reports in
its annual investments activity reports. In addition, the amount of information that is provided about
each investment in Library House’s database is limited, which restricts the amount of disaggregation
possible. On the other hand, it does capture some investments, notably those by angel groups and
high net worth individuals making large business angel investments, which are not included in BVCA
investment statistics. However, there is no source which provides a comprehensive coverage of
angel investments (Mason and Harrison 2008). Despite these data constraints, this thesis aims to
bring an original perspective on the changing nature of the early stage venture capital market both
by re-working some of the BVCA’s published statistics and by combining the BVCA’s statistics on
investment activity with Library House’s database. Using these sources it is possible to present a
series of perspectives on different ‘slices’ of the market and specific details for the size and type of
investments in each UK region.
The Library House database disaggregates the type of investments into two categories: First, those
involving one or more private sector investors. This category primarily captures venture capital
firms, but also identifies investments made by some types of Business Angels, notably investor
networks (e.g. angel syndicates), family offices and named and un-named high net worth individuals.

95
On account of their size these investments are much more visible than those of typical Business
Angels. However, a key limitation of the data is that investments by Business Angels are only
identified where they have co-invested with either private or public sector funds. Second, those
involving one or more publicly backed funds (e.g. Regional Venture Capital Funds, University
Challenge Funds). These are funds which have received some or all of their capital from the public
sector, including central government departments, regional development agencies and the
European Union (e.g. ERDF). They are normally managed by independent fund managers.
This information has allowed for the classification of investments into the following three categories:
First, deals involving solely private sector investors. This includes both venture capital funds and
Business Angels. Second, deals solely made by publicly-backed funds. Third, deals - which are termed
as co-investments here - in which one or more private sector investors has invested alongside one
or more public sector funds. Investments in this category include both ad hoc syndications between
public sector funds and private investors, and also investments involving Co-Investment Funds that
have been established specifically to invest alongside private investors (Figure 13)
Figure 13: Study Sample
Variable Obs Mean Std. Dev. Min Max
Year of investment 4117 2004 2.44 2000 2008
Size of deal 3173 2978.14 5454.03 4 60000
Number of round 4117 1.85 1.21 1 10
Type of investments
Solely public investments 4117 0.16 0.36 0 1
Solely private investments 4117 0.64 0.48 0 1
Co-investments 4117 0.16 0.36 0 1
Business Angels investments 4117 0.17 0.37 0 1
Source: Library House database and author’s research
The analysis of this data in chapter 5 is graphically presented using tables and bar charts with
stacked columns which compare the contribution of each value to a total across categories by using
vertical rectangles. By aggregating the individual deal level data by region, it was possible to capture
specific characteristics of the regional VC markets such as stage, sector and finance source
preferences. The same data is also used in chapter 6 in an econometric analysis framework.
Defining early stage investments
A lack of consistency in definitions is one of the primary reasons for the lack of consensus about the
scale of early stage investment activity. The British Venture Capital Association (BVCA) defines the
96
early stage into two sub-categories: start-up: financing provided to companies for product
development and initial marketing. Companies may be in the process of being set up or may have
been in business for a short time, but have not sold their product commercially. Other early stage:
financing provided to companies that have completed the product development stage and require
further funds to initiate commercial manufacturing and sales. They will not yet be generating a
profit.
The European Venture Capital Association (EVCA) definition of early stage separates the seed stage
from the start-up stage to create an additional sub-category. Seed capital is defined as financing
provided to research, assess and develop an initial concept before a business has reached the start-
up phase.
Library House classifies its investments in terms of financing rounds rather than stages of finance.
However, it does identify companies at the product development stages, defined as companies that
have produced prototypes with a product being improved for commercialisation.
A limitation of these definitions is that they do not take account of the amount invested. The ‘equity
gap’ concept includes both stage of investment and size of investment components. Government
regards the upper limit of the equity gap to be £2m (HM Treasury 2003). Therefore for the purpose
of this analysis early stage investments are defined as investment made for less than £2m in funding
rounds 1, 2 and 3.
4.4.3 Investigating the relationship between venture capital and innovation
In order to investigate the relationship between VC and innovation (hypothesis 2) there was a need
to conceptualise the meaning of innovation and identify measurable values that can be assessed
against venture capital activity. As examined in chapter 2, the literature suggests that there are a
number of factors that contribute towards the improvement of innovation performance of a country
or a region such as increases in business and government R&D expenditure, employment in R&D and
production of patents.
Data analysis
In order to examine the relationship between venture capital and innovation, the number of patent
applications and the business R&D expenditure were identified as proxies for the volume of
innovation. A patent application may suggest that the business has the potential to get a patent. In
addition, a patent application is the preferred proxy rather than a patent grant, since there might be
a significant time lag between filing an application and receiving a grant (Hall et al. 2001). At the

97
aggregated level, data related to the performance of the 12 UK regions over a 12 year period (1995-
2007) has been explored using data from the European Patents Office for the number of patent
applications, and data from the Office of National Statistics (ONS) and EUROSTAT for the R&D
expenditure data.
The data is analysed at two levels, space and time. First, the analysis aims to test whether time has
an impact in the relationship between VC and innovation – in other words, whether the relationship
changes according over time. Second, it aims to examine whether space plays any role in the
relationship - whether the differences over time are also related to location. The region fixed effects
model is used in the examination of the relationship between VC and innovation in order to identify
space-invariant factors such as the industrial specialization of individual regions. It is important to
note this analysis does not prove causality (see Achen 1982). As Achen (1982) suggested, in social
science, it is appropriate that a regression style analysis should be interpreted within the framework
of absence of statistical causality.
“Functionally correct casual specification in social science is neither possible nor desirable. Social
scientists neither have nor want correct, stable functional forms for their explanations. Good social
theory avoids such things” (Achen 1982, p. 16).
Correlation coefficients between venture capital and several innovation related indicators such as
government R&D expenditure and employment in R&D are also provided in the analysis.
4.4.4 Examining the relationship between the potential of a business to innovate
and the type of venture capital investments
To examine the relationship between the potential of a business to innovate – expressed as the
company’s possession of a patent or a patent application - and the type of venture capital
investments it receives – public or private - data must be available for a wide range of industries,
regions and be comparable across years. BVCA provides only aggregated data, so it does not allow
to unveil particular characteristics of the deals such as name of company that received finance, stage
and source of finance and industry focus or whether they received a patent or not. Hence, in order
to perform the analysis, disaggregated data has been collected from two sources i.e. the Library
House database and that of the Patent Office.
Dependent variable
As discussed earlier, patents grants or patent applications have been widely used by scholars as
proxies for innovation (see Ueda and Hirukawa 2006, Hirukawa and Ueda 2011). Using the EPO

98
online search facility which is integrated in the UK Patents Office website, it was possible to identify
individual companies that have been granted or applied for an EPO patent. Matching the Library
House database with the EPO database, it was possible to check which of the 2359 companies that
received one or more of the 4117 individual VC investments had received or applied for a patent.
Explanatory variables
Similarly to chapter 5, investments made by publicly backed funds, private funds and Business
Angels were identified. Investments made by publicly backed funds were then grouped into two
categories: investments made by solely public funds, and investments made by a syndication of
public and private funds (co-investments).
Solely public investments are investments made to companies solely by publicly backed funds (in
syndication or alone). Co-investments are investments made to companies by a syndication between
a publicly backed fund and a private fund. It is worth noting that it was not possible to identify who
was the lead investor in each syndicate. Business Angel are syndicate venture capital deals in which a
Business Angel individual or network has participated in (since it was not possible to collect data for
investments made solely by Business Angels).
Control variables
Data for a number of control variables were collected: Size of deal indicates the size (in British
pounds) of the investment made to the company. Number of round is the number of the funding
round that the investment took place. Regional dummies are dummies that take the value 1 if the
company that received the investment is located in a particular region and 0 otherwise. Industry
dummies are dummies that take the value 1 if the company that received the investment operates
in a particular industry, and 0 otherwise. Year dummies are dummies that take the value 1 if the
investment took place in a particular year and 0 otherwise (Table 4).
Table 4: Description of variables
Variable Description Source
Patents
Dummy that takes the value 1 if the company has a patent or has applied
for one, and 0 otherwise EPO
Solely private investments
Dummy that takes the value 1 if the deal is made solely by one or more
private funds
Library House,
desk research
Solely public investments
Dummy that takes the value 1 if the deal is made solely by one or more
public funds
Library House,
desk research
Co-investments
Dummy that takes the value 1 if the deal is a syndicate between a public
and a private fund, or a public fund and a business angel
Library House,
desk research
Business Angels
Dummy that takes the value 1 if a Business Angel or Business Angel
network has participated in the deal Library House

99
Deal size A measurement of the size of the deal Library House
Number of round
An ordinal variable indicating the number of funding round when the deal
took place (1-9) Library House
Regional dummies
Dummies that take the value 1 if the company that received the
investment is located in a particular region and 0 otherwise Library House
Industry dummies
Dummies that take the value 1 if the company that received the
investment operates in a particular region, and 0 otherwise Library House
Year dummies
Dummies that take the value if the investment took place in a particular
year and 0 otherwise Library House
Statistical analysis
Regression analysis is commonly used in research on venture capital (see Kortum and Lerner 2000;
Lerner et al. 2005) aiming to measure the likely impact of venture capital in innovation as shown in
the literature review. Following these steps, the current research employs a set of regression
techniques. All regressions have been performed using the statistical software STATA.
Ordinary Least Squares (OLS) and Probit models are used in the examination of the relationship
between the type of venture capital (public or private) and innovation expressed as the innovation
outputs of the firm (patent applications). In this case the dependent variable indicates whether a
company has (or has applied for) a patent (regardless of the time of the investment). Such answers
are transferred into the number 0 and 1, where 0 is equal to a company without a patent or patent
application and 1 is equal to company with a patent or patent application. In statistical terms such
variables are Bernoulli variables. Therefore the chosen model used is a Binomial statistical model.
This assumes that the trials are independent. In other words, the fact that one company has a patent
does not influence whether another company has a patent or not. Hypothetically, a company may
seek to receive patent because its competitor has one. However in this study it was not possible to
investigate this hypothesis and therefore it was assumed that the trials are completely independent
from company to company. There are two types of binomial models, logistic and probit. Both
models have been used in this study and the results are similar. Therefore only probit regression
results are reported.
4.4.5 Collection and analysis of primary data through a survey of individual
venture capitalists
In quantitative research the hypothesis is deduced from the theory and is tested (Bryman 2004).
However, with cross-sectional designs of the kind used in most social survey research, there is an
ambiguity about the direction of causal influence in that data concerning variables are
simultaneously collected.

100
‘’A criterion of good quantitative research is frequently the extent to which there is confidence in the
researcher’s causal inferences. Research that exhibits the characteristics of an experimental design is
often more highly valued than cross-sectional research, because of the greater confidence that can
be enjoyed in the causal findings associated with the formed” (Bryman 2004, p. 21).
Therefore, in this analysis a dataset is used that has been collected from a survey in order to conduct
econometric analysis which reveals the extent of confidence in my findings.
4.4.5.1 Identifying the study sample
The data collected for this study included responses to a questionnaire from 50 different venture
capitalists and multiple interviews with 10 venture capitalists, lawyers and other finance
practitioners.
The venture capitalists were geographically dispersed across the UK and in a variety of industries. In
order to minimise sample bias each venture capitalist was asked to fill out the questionnaire for the
fund that he or she is most heavily involved in (GPs often manage more than one venture capital
fund). The survey was restricted to venture capitalists that mainly invest in seed and very early stage
companies. This allowed the research to focus exclusively on the interactions of the key individuals
within the early stage technology venture capital community and to control for the variations on the
findings that the inclusion of other sectors might have caused (e.g. retail sector).
As a starting point, 48 early stage venture capital funds were identified and the employees from 43
of them were contacted. Those funds contacted met the criteria of being sufficiently sized, active in
the last three years, focused on high tech innovative companies and invest in seed, start-up, early
growth, late growth and expansion stage. Five funds were either closed or too small (i.e. less than
£5m). Using desk research (internet, brochures and the BVCA directory) 309 individual venture
capitalists that worked in these 43 early stage venture capital fund were identified. These funds are
specialised in high technology and innovative ventures and are members of the British Venture
Capital Association (BVCA). Correct and update details were acquired for 273 of them. A list of the
funds that took part in the survey together with copy of the questionnaire can be found in Appendix
II.
The questionaire itself was developed in three stages. In the first stage two academics were
consulted and asked to provide feedback on the draft questionnaire. At a second stage, the revised
questionaire was presented to five venture capitalists and similalry, their feedback was provided.
During this process several questions were changed or added. When the questionnaire was ready
two venture capitalists were asked to complete it and provide feedback.

101
The questionnaire was sent out via personalised emails in an electronic format. The survey was
completed in four stages, the first stage took place on 8-9 July 2009, the second stage on 15-16 July
2009, the third on 22-23 July 2009 and a final reminder was sent out on the 27th July 2009. This was
then followed by a number of personal telephone calls to various selected individuals to encourage
them to complete the survey or forward the questionnaire to the appropriate person at the fund.
During the survey completion, some individuals were reluctant to answer the questions, either
because they did know the answers to some of the questions or thought that they did not need to
complete the survey because a colleague of them completed it already on behalf of the VC fund.
Indeed, several emails were received stating that the answer to the survey represented all the staff
from the fund.
Table 5: Response rate
Value Percentage
Total number of people identified as
relevant to complete the survey 368
Total number of people contacted 309 100.00%
Total number of valid email addresses 273 88.35%
Total number of responses related to
the number of people contacted 52 16.8%
Total number of responses as a
percentage of valid email addresses 52 19%
Total number of fully completed
responses 50
The response rate of completed questionnaires is 19 percent (Table 5). Due to the sensitivity of the
industry the questionnaire was completed on an anonymous basis however, participants were
invited to complete the name of their fund and their job title and a few of them did. Therefore, it is
known that venture capitalists from at least 20 named venture capital funds took part in the survey
(49 percent of contacted funds). The remaining 30 questionnaires were completed by venture
capitalists from different or the same funds. Therefore, the response rate of 19 percent of the
venture capitalists contacted represents a much larger sample of the contacted individuals and at
least 49 percent of the venture capital funds that were contacted and currently operate in the early
stage market and invest in high technology and innovative companies.

102
It is worth mentioning that it is commonly acknowledged that people in the venture capital and
private equity industry are reluctant to provide information about their funds related activity due to
high level competition and the sensitivity of the issue. Indeed, some of the interviewed venture
capitalists were surprised with the number of the completed surveys received saying that “this is a
very good response if you think that venture capitalists do not normally reply to this type of survey
due to their workload and sensitivity of the issues” (interviewed venture capitalists).
The responses collected were transformed into numbers and in order to be analysed using SPSS and
STATA (statisatical softwares).
Once the field work was completed, multiple meetings with 10 venture capital managers and other
professionals were arranged to discuss the findings of the survey and to investigate the likely cause
of some surprising results. This was a very revealing process that allowed for more in-depth
interrogation of some of the more puzzling findings of the survey. Quotes from these interviews
have been used on various occasions to support the numerical findings.
4.4.5.2 Descriptive statistics and sample bias control
In order to check whether the sample generated is representative of the population of UK early
stage venture capitalists in 2009, a number of tests were conducted. First, the study sample was
compared with the population on two characteristics, geographical distribution and size.
Geographical coverage
Table 6: Geographical representation of the sample
Early stage (2008)
Amount
invested (£m)
BVCA %
No of responses in
the study sample %
South East 64 18% 5 11%
London 172 48% 18 38%
South West 12 3% 4 9%
East of England 20 6% 3 6%
West Midlands 12 3% 4 9%
East Midlands 9 3% 0 0%
Yorkshire 5 1% 3 6%
North West 23 6% 2 4%
North East 10 3% 1 2%
Scotland 24 7% 2 4%
Wales 2 1% 5 11%
Northern Ireland 7 2% 0 0%
360 100% 47* 100%
* 3 venture capitalists did not indicate the region they are based

103
BVCA data was used to measure the proportion of amount invested in each UK region in 2008. The
results are illustrated in the third column of Table 6. The last column of the table illustrates the
proportion of responses by each UK region. With the exeption of Wales which has provided more
responses than expected (perhaps due to personal links) the percentages between the two
proportion columns do not significanly vary. In order to minimise bias in the geographical sample ,
two responses from Wales were randomly excluded. For a Chi-square goodness of fit analysis please
see Appendix III. The geographical distribution of survey responses is graphically presented in
Figure 14.
Figure 14: Regional coverage
*5 respondents did not indicate any region
Size
Potential selection bias in the reporting of sizes in the sample was also checked. In order to control
for the size of the funds in the study sample, the Thomson Reuters VentureXpert database was used
to capture the size variance of the funds which share similar characteristics with the funds in the
study sample. The funds selected met the following criteria: invest in seed, ealry stage, expansion
and later stage, based in the UK, being active during the last three years and invest in the following
idustries communication and media, computer hardware, computer software and services, internet
specific, semiconductors, biotechnology, medical/health, consumer related and industrial energy.

104
Table 7: Size of the funds in the sample
Fund size
No of funds in the
study sample %
No of funds in
VentureXpert %
Up to £30m 20 43% 18 44%
£31m-£50m 12 26% 8 20%
£51m-£100+* 15 32% 15 37%
Total 47 41
* For the VentureXpert dataset analysis only funds that invested between £51-£150m were
captured
Table 7 shows summary statistics for the distribution of the size of venture capital funds in the study
sample and the population. The third column illustrates the proportion of funds by size in the study
sample (47 completed questionnaires contained information about the size of the fund). The final
column of the table illustrates the proportion of fund by size contained in the commercial database
VentureXpert Thomson Reuteurs (whish is representative of the total population). It is clear that
the size fund variation of the study sample does not signifiantly vary from the total population
expressed using a commercial database.
The average size in the Venturexpert database does not appear to differ systematically from the
fund sizes in the study sample. It can be easily observed that the characteristics of the two
distributions are quite similar and it is concluded that the study sample is by and large
representative of the population of UK early stage venture capital fund managers.
4.4.5.3 Variables
This subsection describes the main variables and the way they are defined and collated.
Public_funds: is a dummy variable that takes the value 1 if the venture capitalist is employed by a VC
fund that receoved more than half of its assets from public money (example of such funds: Scottish
Enterprise, Advantage Early Growth Ltd, Finance Wales etc) and 0 otherwise.
Private_funds: is a dummy variable that takes the value 1 if the venture capitalist is empoyed by a VC
fund that receive no public money at all and therefore we call them private funds (such as Index and
Eden)
Partnership_funds: is a dummy variable that takes value 1 if the venture capitalist is employed by a
VC fund that receive the minority (1-49 percent) of its assets from the public sector (such as
Enterprise Ventures Ltd and WME).

105
Fund_size: measures the total size of each fund
Portfolio_companies: measures the extent of interactions between the venture capitalists and their
portfolio companies. It can take the following values (1= “never”, 2= “hardly ever - once a year at
most”, 3= “occasionally – a few times a year”, 4= “regularly – once a month”, 5= “often – more than
once a month”, 6= “very frequently – at least once a week”).
Similarly the following variables measure the extent of interactions between the venture capitalist
and the various bodies: Companies outside your porfolio; Other private venture capital funds (within
your region); Other private venture capital funds (outside your region); Other publicly backed venture
capital funds (within your region); Other publicly backed venture capital funds (outside your region);
Business Angel networks (within your region); Business Angel networks (outside your region);
Business Angel individuals; Banks; Universities with no flexible IP policy; Universities with flexible IP
policy; Regional R&D institutes (if not universities); RDAs (when applicable); Other public regional
bodies (e.g. endowments, councils etc); Regional authorities, Law companies, Specialists (e.g. experts
in a particular technology); Community organisations and charities; Managers of technology parks or
incubators; Companies based in technology parks or incubators; IP protection bodies; Investment
forums organised by private bodies; Investment forums organised by public bodies; Networking
events organised by private bodies; Networking events organised by public bodies; Internet forums
and blogs
Revenue_sales: measure the proportion of company portfolio that had revenue sales at the time of
investment
Time_in_region: measures the duration of the venture capitalist residence in his region and
Time_in_company: measure the length of employment within the venture capital fund
Named funds and job titles
51 percent of the respondents did not disclose their job title, while 62 percent of them disclosed the
name of their fund. From the disclosed information provided, it is apparent that at least 20 different
funds took part in the survey (Table 8).
Table 8: List of responders
Fund Job title
1 Enterprise Ventures Ltd CEO
2 YFM Group Investment Manager
3 Finance Wales Investment Director

106
4 Creative Advantage Fund Non exec Director
5 NESTA Investment Manager
6 NESTA Investment Director
7 NESTA Business Development Director
8 Eden Ventures UK Ltd
9 NorthStarr Equity Investors Investment Manager
10 Sigam Capital Group plc Investment Director
11 Index Ventures
12 WME Investment Manager
13 PUK Ventures
14 Finance South East Fund Manager
15 London Technology Fund Chairman
16 South East Growth Fund Fund Principal
17 Cre8Ventures (NASDAQ:MENT) European Director
18 TTP Ventures Associate
19 Finance Wales Fund Manager
20 Finance Wales Strategy and Communication Director
21 Seraphim Capital Investment Manager
22 Viking Fund Managing Director
23 Hafren Ventures LLP Partner
24 Abingworth LLP Principal, Science & Technology
25 Avlar Bioventures Ltd Director
4.4.6 Semi-structured and face to face in depth interviews with professional
finance agents
A number of interviews with industry professionals have been conducted in order to discuss with
them the findings of the survey. The first set of interviews with two venture capitalists took place in
June 2009, in order to discuss the survey questions. The questions were emailed to them in advance
of the interview meetings in order to allow sufficient time to study the questions and identify
potential gaps. During the interview meetings, several suggestions were made on how to improve
the questionnaire with the aim to make it easily readable by the venture capitalists.
A second set of interviews with a small group of VC professionals took place sporadically during
2009. All interviews were semi structured: a small number of questions were prepared in advance of
the meeting but the interview often led to a discussion of the overall situation in the VC market in
the UK (Table 9).
All findings from the research were presented to the VCs and specific questions were directed to
different people. For example, the survey saw that publicly backed funds interact much more often

107
with law firms than the private funds. This finding was presented to a professional from a law firm
that is specialised in VC investments and his response is included in the analysis.
Table 9: Names and organisation of professionals that have been interviewed
1 Ivan Griffin, NESTA Investments
2 Libby Kinsey, NESTA Investments
3 George Whitehead, NESTA Investments
4 Anthea Harrison, Independent VC consultant
5 Alex Hook, NESTA Investments
6 Hugh Gardner Marriot Harrison Law Company
7 Mark Fenwick, Public VC Fund Manager, North East
8 Iain Wilcock, NESTA Investments
9 Nick Moon, Finance Wales
10 Meirion Thomas, CM International
4.4.7 Insight knowledge of the market through personal work experience
Working almost 4 years for NESTA, one year full time and three years part-time, has allowed me to
acquire first hand professional experience of the venture capital industry. My association with
NESTA has allowed me access to expensive commercial databases that may have been difficult to
acquire otherwise. In addition, throughout my time with NESTA I established a network of venture
capital professionals whom I mobilised for the purpose of my thesis.
However, my association with NESTA also raised concerns to some of the survey participants. More
particularly, many of the funds that were included in the survey see NESTA as a direct competitor,
therefore several venture capitalists where sceptical when I first approached them. I provided them
with reassurances that all the survey responses will be anonymous and all their feedback will be
used solely for research purposes and will not be shared with my NESTA colleagues. In addition, I
used my university email account for all my email correspondence associated with the survey in
order to provide evidence of my position as an independent PhD student.
4.4.8 Case study approach
The region of Wales represents an interesting example of a region heavily dependent on public
sector, which is also reflected in its regional innovation system and its financial system. Aiming to
identify similarities and differences between privately and publicly led regional innovation systems,
108
the region of Wales was selected as appropriate comparative case study to illuminate further the
key findings of the research.
Wales has been at the forefront of regional development theories during the last decade and it has
been a pioneer of regional innovation systems and policy approaches. This case study aims to
highlight the role of the public venture capital community in Wales and to identify similarities and
differences with privately led venture capital communities. This helps to illuminate some of the key
findings from the thesis concerning the role of publicly led venture capital activity at a regional level
and the ecology of interaction between the innovation and the venture capital community within a
public oriented regional innovation system.
The case study considers the regional innovation environment and the economic and policy context
within which the Welsh venture capital community operates. It provides a historic overview of the
development of the VC industry in Wales. It also compares the main characteristics of the Welsh
venture capital market with those in privately and publicly led venture capital markets. Finally, it
provides some policy recommendation related to the development of the venture capital market in
Wales. Learning points derived from the Wales case have relevance to other publicly oriented
regional innovation environments and in the effective provision of publicly backed venture capital
finance.
4.5 Conclusion
In recent years there has been a growing convergence between students of economic geography
and students of innovation; the former are becoming more interested in innovation capacity as a
way of explaining uneven regional development, while the latter are no longer so impervious to
spatial considerations in their work on technological change (Morgan 1997, p. 494).
By adopting a mixture of research methodologies, including quantitative and qualitative research
techniques, this thesis aims to contribute to the ‘’growing confluence between economic geography
and innovation studies which creates a potentially significant research agenda with respect to the
interactive model of innovation and the role of institutions and social conventions in economic
development’’ (Morgan 1997, p. 500).
This chapter has presented some of the theoretical debates that accompany the mainly quantitative
research methods employed in this research. It has also provided a detailed description of the
research design, the methods used and the way in which the research was undertaken. The next
chapter now proceeds to the analysis of the venture capital activity at the UK regions.

109
5 CHAPTER 5: VENTURE CAPITAL ACTIVITY IN UK REGIONS
5.1 Introduction
The aim of this chapter is threefold: first, to provide a detailed empirical picture of the supply of
early stage venture capital; second, to update earlier evidence on the uneven geography of venture
capital in the UK (Mason and Harrison 2002a); and third, to probe below the aggregate statistics
provided by the British Venture Capital Association using deal specific information to highlight
regional variations in the composition of venture capital. By doing this, it examines the involvement
of publicly backed funds in the VC market and their contribution in the supply of VC finance at the
regional level. This chapter addresses two empirical questions: first, does the geography of venture
capital investment in the UK continue to be characterised by regional inequalities, as previous
studies have indicated (Mason 1987; Martin 1989; Martin et al. 2002; Mason and Harrison 2002a)?
And second, what has been the effect of the changes in the supply of venture capital, as described in
chapter 3 , on the geography of venture capital investments? The answers to these questions will, in
turn, inform the first research question of the thesis: what has been the effect of the increased
government intervention in the supply of venture capital on the geography of venture capital in the
UK in the early 21st century?
Several observations have emerged from this analysis mainly related to the wide heterogeneity
between the UK regions in terms of VC activity and the extent of public intervention. The regional
dimension of the analysis is therefore of special interest as it is the first comprehensive analysis of
the source of VC investments (public or private) for each UK region. This chapter provides a regional
perspective on VC literature that to date has been primarily focus on the country level (with the
exception of the U.S), and contributes to the literature on the role of government in fostering
venture capital activity by examining the investments and source of finance in the UK and its regions.
Perhaps the most important contribution is the investigation of the relationship between the type of
VC funds (private or public) and the investment activities in which they are engaged. The data allows
the relations between private and public VC investments to be compared across regions and
therefore brings some light into the underdeveloped literature on the regional variations in venture
capital markets.
110
5.2 Venture capital trends in the UK regions
It is well established that venture capital is not equally available in all parts of a nation (Florida and
Kenney 1988; Mason and Harrison 2002a; Zook 2002; Martin et al. 2005). The uneven geography of
venture capital investing is typically explained as an outcome of the clustering of venture capital
funds in a small number of cities, and the localised nature of venture capital investing as a means of
reducing uncertainty and thereby minimising risk (Florida and Kenney 1988; Sorensen and Stuart
2001; Mason 2007). Venture capital firms do make long distance investments, particularly as they
mature (De Clercq et al. 2001; Sorensen and Stuart 2001), but this is normally in the context of
syndicated investments with one or more other investors, and where one of the other investors –
usually the lead investor - is local to the investee business (see Rosiello and Parris 2009 on the UK
biotechnology sector).
Several UK government interventions have specifically focused on the ‘regional equity gap’ with
initiatives designed to increase the supply of venture capital in specific regions and localities (Murray
1998; Sunley et al. 2005). Not everyone is convinced of the need for government intervention to
increase the supply of early stage venture capital. Indeed, there are inherent difficulties in
differentiating between deserving companies unable to access finance because of market
inefficiencies, and those that cannot raise finance because they fail to meet appropriate investment
criteria; the latter simply reflects the effective operation of the market. Moreover, many private
sector venture capital fund managers are critical of the investment objectives of publicly backed
funds and the quality of their management (Almeida 2005).
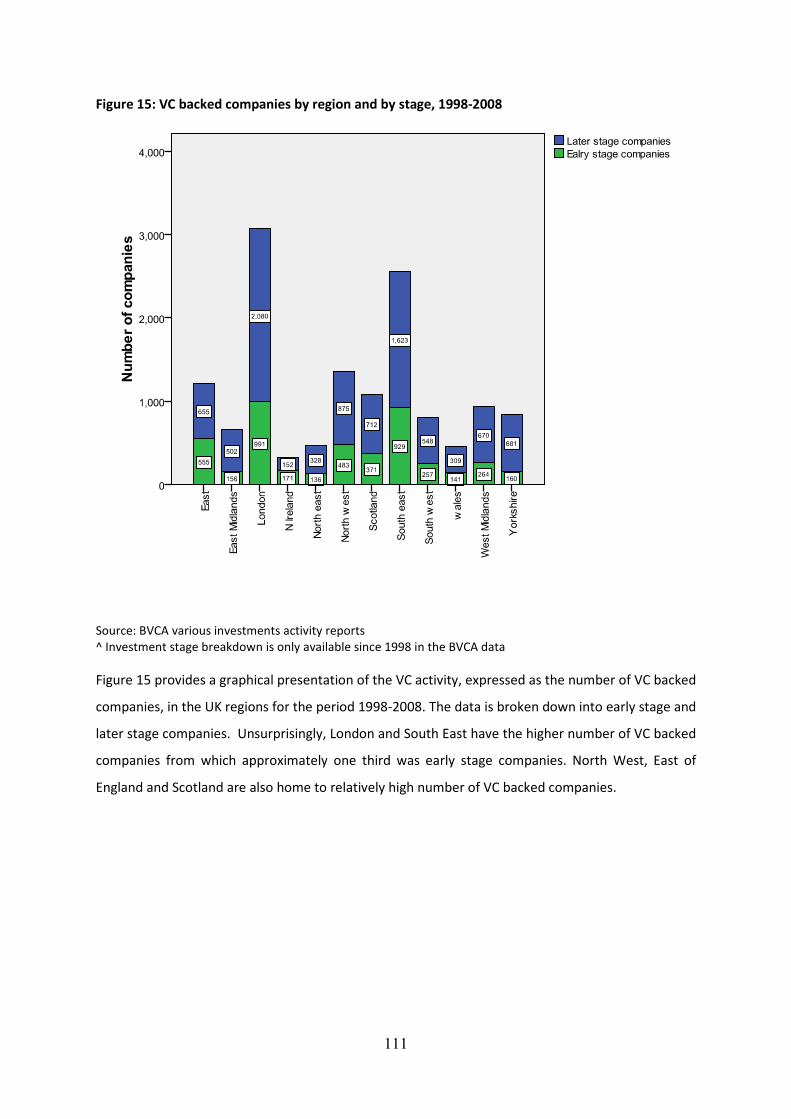
111
Figure 15: VC backed companies by region and by stage, 1998-2008
Source: BVCA various investments activity reports
^ Investment stage breakdown is only available since 1998 in the BVCA data
Figure 15 provides a graphical presentation of the VC activity, expressed as the number of VC backed
companies, in the UK regions for the period 1998-2008. The data is broken down into early stage and
later stage companies. Unsurprisingly, London and South East have the higher number of VC backed
companies from which approximately one third was early stage companies. North West, East of
England and Scotland are also home to relatively high number of VC backed companies.
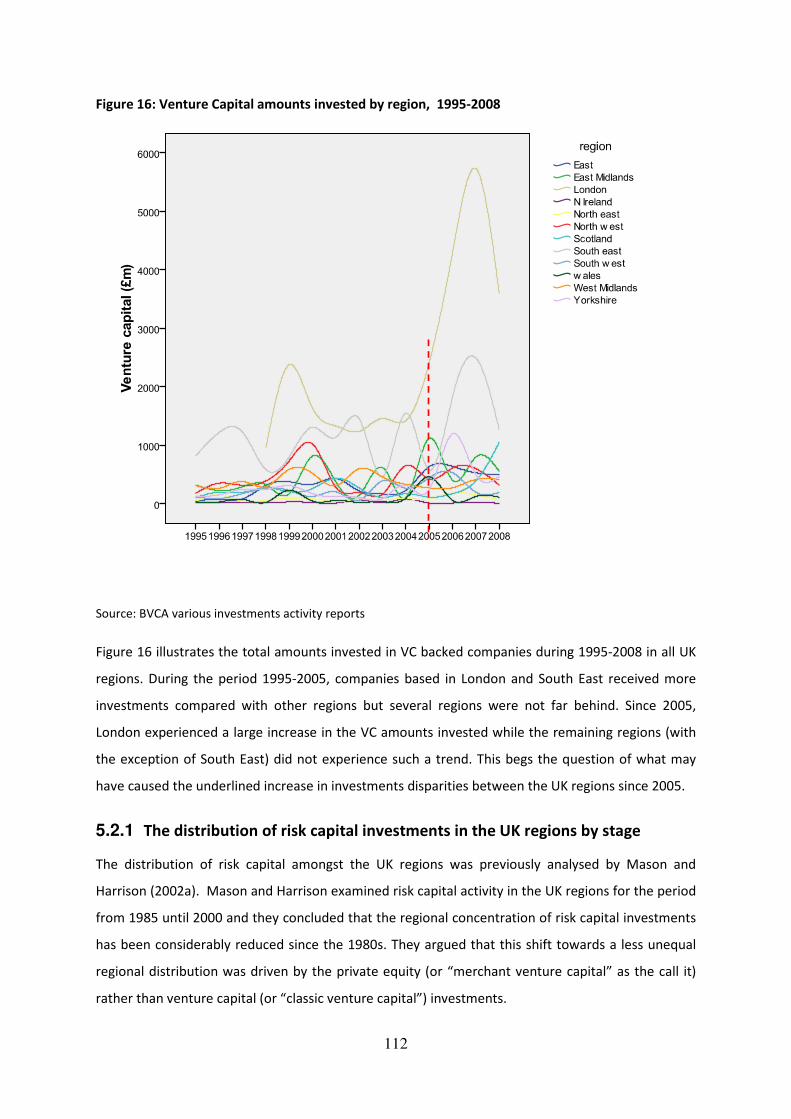
112
Figure 16: Venture Capital amounts invested by region, 1995-2008
Source: BVCA various investments activity reports
Figure 16 illustrates the total amounts invested in VC backed companies during 1995-2008 in all UK
regions. During the period 1995-2005, companies based in London and South East received more
investments compared with other regions but several regions were not far behind. Since 2005,
London experienced a large increase in the VC amounts invested while the remaining regions (with
the exception of South East) did not experience such a trend. This begs the question of what may
have caused the underlined increase in investments disparities between the UK regions since 2005.
5.2.1 The distribution of risk capital investments in the UK regions by stage
The distribution of risk capital amongst the UK regions was previously analysed by Mason and
Harrison (2002a). Mason and Harrison examined risk capital activity in the UK regions for the period
from 1985 until 2000 and they concluded that the regional concentration of risk capital investments
has been considerably reduced since the 1980s. They argued that this shift towards a less unequal
regional distribution was driven by the private equity (or “merchant venture capital” as the call it)
rather than venture capital (or “classic venture capital”) investments.
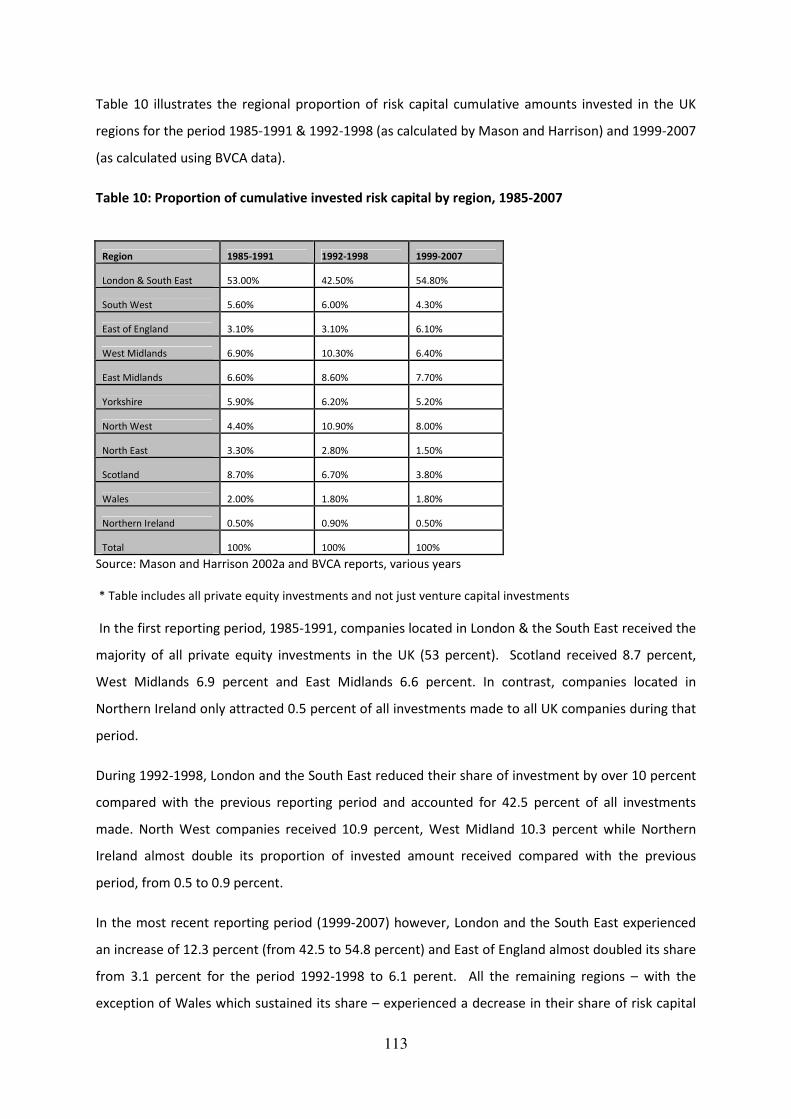
113
Table 10 illustrates the regional proportion of risk capital cumulative amounts invested in the UK
regions for the period 1985-1991 & 1992-1998 (as calculated by Mason and Harrison) and 1999-2007
(as calculated using BVCA data).
Table 10: Proportion of cumulative invested risk capital by region, 1985-2007
Region 1985-1991 1992-1998 1999-2007
London & South East 53.00% 42.50% 54.80%
South West 5.60% 6.00% 4.30%
East of England 3.10% 3.10% 6.10%
West Midlands 6.90% 10.30% 6.40%
East Midlands 6.60% 8.60% 7.70%
Yorkshire 5.90% 6.20% 5.20%
North West 4.40% 10.90% 8.00%
North East 3.30% 2.80% 1.50%
Scotland 8.70% 6.70% 3.80%
Wales 2.00% 1.80% 1.80%
Northern Ireland 0.50% 0.90% 0.50%
Total 100% 100% 100%
Source: Mason and Harrison 2002a and BVCA reports, various years
* Table includes all private equity investments and not just venture capital investments
In the first reporting period, 1985-1991, companies located in London & the South East received the
majority of all private equity investments in the UK (53 percent). Scotland received 8.7 percent,
West Midlands 6.9 percent and East Midlands 6.6 percent. In contrast, companies located in
Northern Ireland only attracted 0.5 percent of all investments made to all UK companies during that
period.
During 1992-1998, London and the South East reduced their share of investment by over 10 percent
compared with the previous reporting period and accounted for 42.5 percent of all investments
made. North West companies received 10.9 percent, West Midland 10.3 percent while Northern
Ireland almost double its proportion of invested amount received compared with the previous
period, from 0.5 to 0.9 percent.
In the most recent reporting period (1999-2007) however, London and the South East experienced
an increase of 12.3 percent (from 42.5 to 54.8 percent) and East of England almost doubled its share
from 3.1 percent for the period 1992-1998 to 6.1 perent. All the remaining regions – with the
exception of Wales which sustained its share – experienced a decrease in their share of risk capital

114
investments compared to the previous reporting period. In fact, the West Midlands and Scotland
have significantly decreased their proportion of risk capital, 10.3 to 6.4 percent and from 6.7 to 3.8
percent respectively.
It is clear that there has been an increase in the regional disparities amongst the UK regions during
the last decade. The regional distribution of risk capital in the period 1999-2007 has significantly
changed since the period 1992-1998 and is now back to the 1985-1991 levels. It seems that the
progress towards narrowing the regional distribution gap experienced in the previous decade (1992-
1998) is well over. The disaggregate analysis in the following table provides some useful insights as
to the type of the investments that are responsible for these changes and mainly the shift of
investments towards London and the South East. Details on investments are broken down by date
and investments stage and are only available since 1998 from BVCA. Therefore it is only possible to
investigate the changes by investments stage since this year. The examining period is split into two
“sub periods” of five years (1998-2002 & 2003-2007) in order to clearly observe the changes that
occurred.
Table 11: Regional distribution of risk capital by stage in the UK regions 1998-2007
1998-2002 2003-2007 1998-2002 2003-2007 1998-2002 2003-2007 1998-2002 2003-2007 1998-2002 2003-2007 1998-2002 2003-2007
South East 446 506 22.05% 21.91% 1357 2666 19.09% 25.19% 3492 3753 21.29% 14.70%
London 676 642 33.42% 27.80% 1653 3855 23.25% 36.43% 5202 10831 31.71% 42.42%
South East and
London 1122 1148 55.46% 49.72% 3010 6521 42.33% 61.62% 8694 14584 53.00% 57.12%
South West 85 163 4.20% 7.06% 239 345 3.36% 3.26% 568 1330 3.46% 5.21%
East of England 240 339 11.86% 14.68% 414 390 5.82% 3.69% 1033 1479 6.30% 5.79%
West Midlands 72 34 3.56% 1.47% 482 454 6.78% 4.29% 1764 1271 10.75% 4.98%
East Midlands 51 171 2.52% 7.41% 483 1126 6.79% 10.64% 1312 1760 8.00% 6.89%
Yorkshire 71 163 3.51% 7.06% 230 544 3.23% 5.14% 662 1642 4.04% 6.43%
North West 135 128 6.67% 5.54% 1330 375 18.71% 3.54% 1162 1957 7.08% 7.67%
North East 18 21 0.89% 0.91% 117 183 1.65% 1.73% 239 384 1.46% 1.50%
Scotland 164 70 8.11% 3.03% 644 336 9.06% 3.17% 648 560 3.95% 2.19%
Wales 27 47 1.33% 2.04% 111 260 1.56% 2.46% 254 482 1.55% 1.89%
Northern Ireland 38 25 1.88% 1.08% 50 49 0.70% 0.46% 68 81 0.41% 0.32%
Total 2023 2309 100% 100% 7110 10583 100% 100% 16404 25530 100% 100%
Region
Early Stage Expansion MBOs/MBIs
Amounts %Amounts % Amounts %
Source: BVCA Investments Activity Reports, various years
Table 11 reveals some interesting trends: first, early stage investments have increased by £286m (12
percent) between 1998-2002 and 2003-2007. London and the South East experienced a marginal
increase of £26m (from £1122m to £1148m), while East of England and East Midlands saw a
significant increase in the amounts invested in their early stage companies (from £240m to £339m
and from £51m to £171m respectively). The changes in the amounts invested in each region are
reflected in their share of venture capital investments. London and South East lost approximately 6
percent and Scotland percent of their share in the early stage market, while East Midlands,

115
Yorkshire, East of England, and the South West gained 5 percent, 3.5 percent, 3 percent and 2.8
percent respectively.
Second, expansion stage investments have increased by £3,473m (33 percent) between the period
1998-2002 and 2003-2007 from £7110m to £10583m respectively. This increase is mainly evident in
London and the South East - two regions that saw a jump in their share of this segment of the
market by 19.3 percent. East Midlands and Yorkshire experienced a much more moderate increase
of 3.8 percent and 1.9 percent respectively. The North West on the other hand, lost 15.2 percent of
its share in the expansion market, followed by Scotland with 5.9 percent, West Midlands and East of
England with 2.5 percent and 2.1 percent decrease respectively.
Finally, MBOs/MBIs (Management Buyout’s/Management Buyin’s) investments saw an increase of
£9,126m (36 percent) during the same reporting periods, from £16404m to £25530m. London and
the South East saw an increase of 4.1 percent followed by Yorkshire with 2.4 percent. West Midlands
and Scotland lost 5.9 percent and 1.8 percent of their share in the MBOs/MBIs market respectively
and all remaining regions either experienced small losses or remained static.
While some regions such as London and the South East performed remarkably well in expansion and
MBOs/MBIs, Scotland and the West Midlands seem to have lost significant values of investments in
all segments of investments and this is reflected in the reduced size of the investments share they
currently possess. This development shows that while private equity in the 1980s and 1990s helped
close the risk capital distribution gap between the UK regions – as observed by Mason and Harrison
– private equity has now been responsible for widening the regional distribution gap between the
UK regions. In addition, it is clear that early stage investment was the only segment of the market in
which the investments gap amongst the UK regions has been narrowed, while it has been widened in
expansion and MBOs/MBIs investments. The question on what may have led to the narrowing of
the early stage disparity gap will be investigated later in this chapter.
5.3 Regions’ expected share of the VC market
The question that now arises is whether this distribution of investments to the regions is “fair”. For
example, is it fair for Wales to receive around 2 percent of all VC amounts invested (see Table 10).
Should Wales expect to have more or less? In order to answer these questions there is a need to
identify a measurement of fairness or what might be regarded as an expected level of investment
activity.

116
BVCA statistics on investment activity are disaggregated by region and by stage, and have been used
in previous studies to examine the uneven geography of venture capital investments. There are
various ways in which to measure the regional distribution of venture capital investments.
Essentially there are three critical decisions. First, are venture capital investments measured in terms
of number of investments or amount invested? Second, what types of venture capital investments
are included? Investment statistics are disaggregated by stage of investment (start-up, other early,
expansion and MBO/MBI). Third, should venture capital investment in each region be compared
with that region’s stock of companies, new firms or employment? Different conclusions may arise
depending on the choices made. The following table presents the regional distribution of venture
capital in the form of location quotients which indicate each region’s share of private equity
investments as a ratio of that region’s share of national business activity (measured by the number
of VAT-registered companies, which is one proxy for what might be regarded as the average
expected level of investments activity). A value of over one indicates that a region has more than its
expected share of venture capital investments based on that region’s share of the national business
population whereas a value of less than one indicates that its share is less than expected.
Table 12: Location quotient 1992-1998 and 1999-2007
Region 1992-1998 1999-2007
South East n.a. 1.19
London n.a. 2.12
South East and
London 1.21 1.67
South West 0.65 0.48
East of England 0.78 0.60
West Midlands 1.21 0.77
East Midlands 1.25 1.12
Yorkshire 0.83 0.72
North West 1.21 0.79
North East 0.74 0.56
Scotland 0.88 0.60
Wales 0.36 0.47
Northern Ireland 0.26 0.19
Source: Mason and Harrison 2002 , ONS 2008 and BVCA various reports
Table 12 illustrates that London and South East have significantly more private equity investments
than “expected” (1.67 location quotient). Mason and Harrison (2002a) had calculated London and
South East location quotient as 1.21 for the period 1992-1998. In fact, during the last decade, only
London and Wales experienced an increase in their location quotient and all the remaining regions

117
saw even fewer investments in relation to their “fair” or “expected” share than the decade before.
Table 13 examines the expected share of investments by stage.
Table 13: Regional distribution of venture capital and private equity 1998-2007
Region
Number of
active
business %
Early stage
investment
s (£000) %
Location
quotient
Early stage
&
Expansion
Investment
s (£000) %
Location
quotient
MBOs/MBI
s %
Location
quotient
Total
investment
s (£000) %
Location
quotient
South East 369,240 16.05% 952 21.98% 1.37 4975 22.59% 1.41 7245 17.28% 1.08 12220 19.11% 1.19
London 388,600 16.89% 1318 30.42% 1.80 6826 30.99% 1.84 16033 38.23% 2.26 22859 35.74% 2.12South East and
London 757,840 32.93% 2270 52.40% 1.59 11801 53.58% 1.63 23278 55.51% 1.69 35079 54.85% 1.67
South West 205,635 8.94% 248 5.72% 0.64 832 3.78% 0.42 1898 4.53% 0.51 2730 4.27% 0.48
East of England 233,400 10.14% 579 13.37% 1.32 1383 6.28% 0.62 2512 5.99% 0.59 3895 6.09% 0.60
West Midlands 191,390 8.32% 106 2.45% 0.29 1042 4.73% 0.57 3035 7.24% 0.87 4077 6.37% 0.77
East Midlands 157,270 6.83% 222 5.12% 0.75 1831 8.31% 1.22 3072 7.33% 1.07 4903 7.67% 1.12
Yorkshire 166,400 7.23% 234 5.40% 0.75 1008 4.58% 0.63 2304 5.49% 0.76 3312 5.18% 0.72
North West 232,935 10.12% 263 6.07% 0.60 1968 8.94% 0.88 3119 7.44% 0.73 5087 7.95% 0.79
North East 62,310 2.71% 39 0.90% 0.33 339 1.54% 0.57 623 1.49% 0.55 962 1.50% 0.56
Scotland 145,395 6.32% 234 5.40% 0.85 1214 5.51% 0.87 1208 2.88% 0.46 2422 3.79% 0.60
Wales 90,985 3.95% 74 1.71% 0.43 445 2.02% 0.51 736 1.76% 0.44 1181 1.85% 0.47
Northern Ireland 57,665 2.51% 63 1.45% 0.58 162 0.74% 0.29 149 0.36% 0.14 311 0.49% 0.19
Total 2,301,225 100.00% 4332 100.00% 22025 100.00% 41934 100.00% 63959 100.00%
^Number of active businesses in 2007
By disaggregating the data into stages of investments it is revealed that London has significantly
more early stage, early stage and expansion and MBOs/MBIs investments than expected (1,80, 1,84
and 2,26 respectively). However, when taking into account that early stage investments and
expansion and early stage investments count for only 7 percent and 34 percent of all investments
respectively while MBOs & MBIs count for 66 percent, it becomes obvious that the unequal
distribution of risk capital is due to the high concentrations of MBOs and MBIs investments.
Early stage investments are over concentrated in three regions, London, South East and East of
England (location quotients of 1.80, 1.37 and 1.32 respectively) followed by Scotland (0.85), East
Midlands and Yorkshire (0.75). West Midlands (0.29), North East (0.33), Wales (0.43) and Northern
Ireland (0.58) all had far less share than expected.
5.3.1 Regions’ expected share of early stage VC investment in time
Since this thesis is more concerned with venture capital rather than the private equity as a whole,
the following table focuses on the early stage (i.e. start-up and other early stage) venture capital
investments and investigates the expected share of the UK regions since 1998 (both by number of
investments and amount). The analysis is presented for four separate time-periods which conform
to aggregate investment trends. This also has the advantage of smoothing some of the year-on-year
fluctuations in investment activity that are apparent at the regional scale.

118
Table 14: Distribution of early stage investments in the UK: number and region
region 1998-2000
(‘boom years’)
2001-3
(‘crash years’)
2005-7
(‘recovery years’)
2008
(‘financial crisis’)
No. % LQ* No. % LQ no. % LQ No. % LQ
London 252 27.70 1.86 217 17.60 1.14 289 19.36 1.15 78 17.14 1.08
South East 190 20.90 1.36 233 18.90 1.20 282 18.89 1.18 74 16.26 1.03
South West 36 3.96 0.41 56 4.54 0.48 106 7.10 0.79 25 5.49 0.58
East of
England
107 11.76 1.17 205 16.63 1.66 161 10.78 1.06 29 6.37 0.63
West
Midlands
39 4.29 0.51 57 4.62 0.56 92 6.10 0.73 45 2.42 0.35
East
Midlands
28 3.08 0.45 31 2.51 0.37 60 4.02 0.59 11 9.89 1.20
Yorkshire &
The
Humber
37 4.07 0.55 44 3.57 0.50 49 3.29 0.46 28 6.15 0.86
North West 56 6.15 0.63 117 9.49 1.00 212 14.20 1.40 79 17.36 1.81
North East 22 2.42 0.95 40 3.24 1.29 45 3.01 1.11 22 4.84 1.88
Scotland 106 11.65 1.59 101 8.19 1.15 110 7.37 1.17 33 2.86 0.67
Wales 15 1.65 0.35 57 4.62 1.28 50 3.35 0.85 13 7.25 1.04
N Ireland 22 2.42 0.72 75 6.08 1.83 38 2.54 1.01 18 3.96 1.21
TOTAL 910 1233 1493 455
Table 15: Distribution of early stage investments in the UK: amount invested and region
region 1998-2000
(‘boom years’)
2001-3
(‘crash years’)
2005-7
(‘recovery years’)
2008
(‘financial crisis’)
£m % LQ* £m % LQ £m % LQ £m % LQ
London 329 22.0 1.43 229 24.9 1.56 524 29.74 1.76 172 47.8 1.13
South East 522 34.9 2.10 238 25.8 1.64 353 20.03 1.25 64 17.8 3.02
South West 67 4.5 0.50 26 3.9 0.42 144 8.17 0.91 12 3.3 0.35
East of
England
111 7.4 0.76 216 23.5 2.32 228 12.94 1.28 20 5.6 0.55
West
Midlands
62 4.1 0.50 17 1.8 0.22 28 1.59 0.19 12 3.3 0.41

119
East Midlands 45 3.0 0.44 22 2.4 0.35 144 8.17 1.20 9 2.5 0.36
Yorkshire &
The Humber
76 5.1 0.72 10 1.1 0.16 137 7.76 1.07 5 1.4 0.19
North West 103 6.9 0.76 54 5.9 0.61 99 5.62 0.56 23 6.4 0.67
North East 15 1.0 0.40 6 0.7 0.26 16 0.91 0.34 10 2.8 1.08
Scotland 129 8.6 1.19 64 6.9 0.99 49 2.78 0.44 24 6.7 0.13
Wales 14 0.9 0.20 31 3.4 0.78 29 1.65 0.42 2 0.6 0.95
N Ireland 24 1.6 0.48 25 2.7 0.85 11 0.62 0.25 7 1.9 0.60
TOTAL 1497 921 1762 360
The regional distribution of early stage venture capital investments (Table 14) contrasts sharply with
the regional distribution measured in terms of amounts invested (Table 15). For the period 2005-7,
regions with more than their expected share of venture capital investments by number included
both the core regions of London, the South East and East of England and also several peripheral
regions (the North East, the North West and Scotland). Regions with fewer than expected
investments included Yorkshire, the East Midlands, the West Midlands, the South West, Wales and
Northern Ireland. It is worth noting that all regions with the exception of London and the South
East, have either increased their share of investment or remain relatively stable between the period
1998-2000 and 2005-2007, indicating a narrowing of regional disparities. In 2008, when the onset of
the financial crisis resulted in a downturn in venture capital activity, London and the South East
continued to have more than their expected share of venture capital investments, along with the
North West, the North East, Scotland and also the West Midlands and Northern Ireland (Table 14).
However, a rather different picture emerges when the amount invested is considered. For both the
2005-7 and 2008 periods London and the South East both had more than their expected shares of
early stage venture capital. The East of England, East Midlands and Yorkshire also had more than
their expected shares of investment activity in the 2005-7 period, but in the latter two regions
(which both had lower than expected shares of early stage venture capital investments by number)
this is an outcome of one atypical year and in the other years their location quotients were less than
one. In 2008 the regional distribution of early stage venture capital by amount was dominated by
London which attracted almost half of the total. Only London and the South East, along with the
North East, attracted more than their expected shares of early stage venture capital by amount
(Table 15).

120
Several regions therefore have significantly less than expected shares of venture capital investment
by value but a greater number of venture capital investments than expected. This group comprises
the North East (2005-7 only), North West, Northern Ireland, Scotland and the West Midlands (2008
only). The greater than expected volume of venture capital investments in these regions clearly
reflects their large numbers of small scale investments, a point returned to later when considering
the nature of these deals.
The geographical distribution of venture capital investment over time has not been stable.
Comparing the boom period of the late 1990s, the post 2000 downturn, the mid-decade recovery
and the onset of the financial crisis (2008) reveals some contrasting trends for different regions.
London and the South East have both consistently attracted more than their expected shares of
early stage venture capital (both number and amount) across all four periods. However, whereas
London’s share of early stage venture capital in terms of amount invested has steadily increased
over the past 10 years, from 22 percent in the boom years to 48 percent in 2008 (Table 15), the
South East’s share of both the number of investments and amount invested has fallen over the same
period. The East of England attracted more than its expected investment in the crash (2001-3) and
recovery (2005-7) periods. Scotland’s position has deteriorated over the four periods in terms of its
share of venture capital investment by value, having more than its expected investment in the boom
of the late 1990s but less than its expected share in subsequent periods. However, it has consistently
had more than its expected share of investments by number, reflecting the active role of Scottish
Enterprise in the venture capital market and, in particular, the launch of its very successful co-
investment scheme in 2003 (Hayton et al. 2008). The North East and the North West have
significantly improved their positions since 2001 in terms of having had more than their expected
shares of venture capital investments, but only in terms of numbers of investments.
From the above analysis it becomes obvious that in the current decade we experience a more
“even” distribution of early stage investments (in terms of number of deals) in the UK regions
compared with the previous decade. Table 15 also suggests that London based companies receive
significantly larger deals compared with the rest of the regions. In order to investigate the reasons
behind this development, it is necessary to analyse each regions’ investments landscape. Who are
the main sources of venture capital investment in the UK regions? How they have changed since the
late 90s? Who is responsible for the more “even” distribution of early stage investments (in terms of
number of deals) in the UK regions compared with the previous decade? What has been the effect of
the changes in the sources of venture capital on the geography of venture capital investments? The

121
following part of this chapter seeks to address these questions by analysing the regional investment
characteristics of each region.
5.4 Source of investments
Concerns about the diminishing volume of early stage venture capital investment have been a
recurring theme throughout the post-war era (Mason and Harrison 1991a). As mentioned in chapter
3, the favoured approach since the Labour Government came into office in 1997, has been hybrid
funds involving a combination of public and private investment, with incentives which enhance the
returns or lower the risk to attract private sector institutions to invest, and are managed by private
sector fund managers (Murray 2007). Examples include the Early Growth Funds, University Challenge
Funds; Regional Venture Capital Funds, and Enterprise Capital Funds inter alia (see Appendix I).
Many of these funds are regionally focussed. Both the English Regional Development Agencies and
the development agencies in Scotland and Wales have also created their own funds, using ERDF or
other public sources. A more recent development has been the creation of publicly-funded co-
investment funds which invest alongside private investors in the same deals (i.e. the Scottish Co-
investment fund). These funds are intended to enhance their liquidity of private sector investors so
that they can make new investments which in many cases they would not otherwise make.
Figure 17 reveals that deals involving public sector funds, either investing on their own or co-
investing with private investors (funds or individuals), have more than trebled between 2001 and
2007, although both fell by 18 percent in 2008. This represents an increase in their share of
investments from 19 percent in 2001 to 44 percent in 2008. Meanwhile, free-standing private sector
investments – although increasing in numerical terms from 2002 until 2006 – have declined as a
proportion of total investment activity from 81 percent in 2001 to 56 percent in 2008. These trends
– two sides of the same coin - underline the growth and current scale of the public sector’s
involvement in one form or another in the supply of venture capital.

122
Figure 17: Proportion of investments by type of investor, 2000-2008
Source: calculated using data from Library House database
The increasing significance of the public sector has risen on account of its growing use of co-
investment as an investment model. Co-investments accounted for 26 percent investments in 2008
compared with just 7 percent of all investments in 2001 (Figure 17). Indeed, public-private co-
investments are now the dominant form of public sector venture capital investment, reaching a peak
of 67 percent of all deals involving the public sector in 2007 compared with 37 percent in 2001, and
since 2005 have exceeded the annual number of free-standing investments by public-sector funds
(Figure 18a). One-third of private sector investments were co-investments with public sector funds
in 2008 compared with just 8 percent in 2001 (Figure 18b), underlining that a significant proportion
of private venture capital investment activity is now supported by the public sector.

123
Figure 18: Co-investments as a proportion of deals
(a) Public private co-investments deals as a proportion of all deals involving public sector
(b) Public private co-investments deals as a proportion of all deals involving private sector
Source: calculated using data from Library House database

124
Figure 19: Distribution of deals sizes by type of investor, 2007
0
5
10
15
20
25
30
35
40
45
50
100 250 500 1000 2000 5000 10000 10000+
Amounts (£000)
Nu
mb
er
of
deals Freestanding deals made by
publicly backed funds
Deals made by private & other
funds
Public/private co-investments
deals
Source: calculated using data from Library House database
These trends can be unpacked in two further respects. First, the various types of investors occupy
different parts of the funding spectrum (Figure 19). Private investors (funds and individuals) had an
average size of £3.7m in 2007 but a very wide size distribution, with 11 percent of deals below
£250,000 but 45 percent above £5m. The average public-private co-investment is smaller at £1.5m,
with 81 percent of investments at £2m and below. Deals involving only public sector funds were
largely confined to £500,000 and under (83 percent) (£378,000 average size). Second, Business
Angels have become more significant in both absolute and relative terms. Their investments
increased more than threefold between 2001 and 2007, but then dropped back in 2008, while their
share investment rose from 13 percent to over 36 percent (Figure 20).
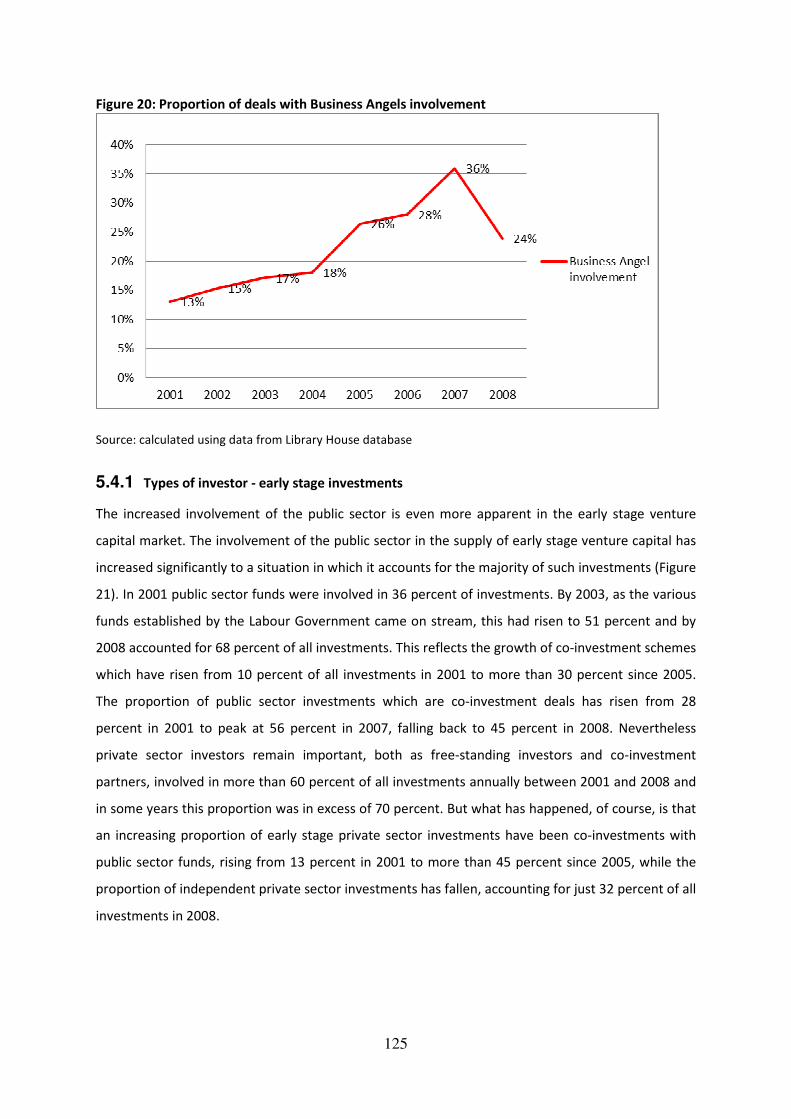
125
Figure 20: Proportion of deals with Business Angels involvement
Source: calculated using data from Library House database
5.4.1 Types of investor - early stage investments
The increased involvement of the public sector is even more apparent in the early stage venture
capital market. The involvement of the public sector in the supply of early stage venture capital has
increased significantly to a situation in which it accounts for the majority of such investments (Figure
21). In 2001 public sector funds were involved in 36 percent of investments. By 2003, as the various
funds established by the Labour Government came on stream, this had risen to 51 percent and by
2008 accounted for 68 percent of all investments. This reflects the growth of co-investment schemes
which have risen from 10 percent of all investments in 2001 to more than 30 percent since 2005.
The proportion of public sector investments which are co-investment deals has risen from 28
percent in 2001 to peak at 56 percent in 2007, falling back to 45 percent in 2008. Nevertheless
private sector investors remain important, both as free-standing investors and co-investment
partners, involved in more than 60 percent of all investments annually between 2001 and 2008 and
in some years this proportion was in excess of 70 percent. But what has happened, of course, is that
an increasing proportion of early stage private sector investments have been co-investments with
public sector funds, rising from 13 percent in 2001 to more than 45 percent since 2005, while the
proportion of independent private sector investments has fallen, accounting for just 32 percent of all
investments in 2008.

126
Figure 21: Early stage investments by year and type of investor 2000-2008
Source: calculated using data from Library House database
Year-on-year trends in early stage venture capital investment since the post-2000 dotcom crisis have
been volatile. Amounts invested have not recovered to their 2000 peak although the number of
investments have risen, reflecting an increase in investments of under £500,000. The public sector
has become proportionately more significant as an investor, largely on account of the growth of
public-private co-investment which is now the dominant way in which the public invests in early
stage companies (Figure 21). Private sector investors remain prominent in terms of the number of
investments they make, but according to the empirical results, are now much more likely to
investment alongside the public sector in co-investment deals. This could be driven by the fact that
several publicly backed funds can only invest alongside private funds due to state aid constraints.
Alternatively, private funds may want to share the costs of due diligence with public funds. Another
explanation could be that since there are not many private funds operating in the early stage
market, private funds do not have many options but to co-invest with public funds. The composition
of early stage private sector investors has also changed, with an increase in the significance of
investments by private individuals, including ‘mega angels’ investing alone, angel syndicates and
other forms of organised angel investing, and a decline in the significance of private sector venture
capital funds –publicly backed funds on average invest smaller amounts than private funds, making
them attractive partners to individual investors that operate in the seed and early stage market.

127
5.5 The regional distribution of venture capital investments: types
of investors
Using Library House data it was possible to decompose the types of venture capital investors in each
region (Figure 22).
Figure 22: Proportion of different types of investors in early stage deals in the UK regions 2000-
2008
Source: calculated using data from Library House database
Looking at the entire 2000-2008 period, and only considering early stage investments, there is a
clear distinction between, on the one hand, London, the South East and East of England and, on the
other hand, the rest of the country in terms of the proportion of deals involving private and public
sector investors. Looking at the period as a whole, deals exclusively involving private investors
accounted for more than 70 percent of all investments in London, nearly two-thirds in the South East
and 60 percent in the East of England. In the South West and East Midlands the proportion of free-
standing private sector investments was around 40 percent, dropping to 32 percent in Scotland,
around 25 percent in Yorkshire, the North West, North East and Wales, and around 15 percent in
West Midlands and Northern Ireland. This means that in regions North and West of the Humber-
Severn axis, the public sector is involved in upwards of three-quarters of early stage venture capital
investments. Moreover, the proportion of deals involving the public sector has risen over time,
reaching over 90 percent in several regions in 2008 (Figure 23). However, the form of public sector
intervention varies. In Northern Ireland, Scotland and the North East co-investments between the

128
public and private sector dominate, accounting for 64 percent, 52 percent and 42 percent
respectively of all investments, whereas in the other regions with high proportions of public sector
involvement – notably the West Midlands, Wales, Yorkshire and the North West – free-standing
public sector investments account for 50 percent or more of all investments.

129
Figure 23: Proportion of investments involving the public sector by year by region
Source: calculated using data from Library House database

130
Figure 24: Proportion of early stage deals involving Business Angels by region
Source: calculated using data from Library House database
The Library House data also provides some insight into regional variations in the relative significance
Business Angels. However, as noted earlier, the data is partial, with Business Angels only identified
in deals where they have invested alongside venture capital funds. With this important caveat,
Business Angels are most prominent in Scotland, accounting for over one-third of early stage
investments and the North East where they account for 30 percent. They are least significant in
Yorkshire and The Humber, North West, Northern Ireland and Wales (Figure 24). One way in which
to interpret this regional pattern is in terms of the dominant form of public sector intervention (fund
131
or co-investment), discussed in the previous paragraph. There is an association, at least in those
regions that are at the extremes of the distribution, between the relative importance of co-
investments by the public sector and the relative importance of Business Angels. It might be that
Business Angels are crowded out in regions where the public sector invests on its own whereas their
numbers are boosted in regions with co-investment funds. But based on the Scottish experience it
may be that a well-developed angel market is actually a pre-requisite for the successful operation of
co-investment funds. The Scottish experience also suggests that the successful operation of a co-
investment fund provides a further boost to the development of new angel groups (Hayton et al.
2008).
5.6 A historic overview of the venture capital activity in Wales
Over the last 25 years, Wales, mainly through the, now abolished, Welsh Development Agency has
attempted to stimulate innovation by working through the supply chain feeding into large inward
investors as the stimulus for local companies to increase their innovation activity. Indigenous supply
chain firms were pressed by their parent companies and the WDA to be more innovative and they
succeeded to the extent that Wales was considered as “darling” (Cooke 2003) of the Regional Policy
Directorate of the European Union and together with 5 other European Regions Wales was first to
introduce the Regional Technology Plan in 1994. Despite a relatively large share of inward
investment, the manufacturing sector remains a small and declining source of employment. In fact,
inward investment created over the past decade created very few jobs (Lovering 1999).
A number of innovation studies involving Wales have been conducted since 1996 (when the first RTP
ended) i.e. Innovation Networks and Regional Policy in Europe Landabaso et al. 1999, On-going
evaluation of the RIS projects, ECOTEC 1999, Assessment of the regional innovation and technology
strategies and infrastructure (RITTS) scheme, Charles et al. 2000). The common claim is that
RTP/RITTS and RIS have positive organisational inputs building consensus amongst regional Welsh
actors. However, questions have been raised as to its impact on long-term structural changes in
Wales and its transformative capacity in relation to what Cooke calls “Institutional Regional
Innovation Systems (IRIS)” (Cooke 2003).
5.6.1 Venture capital activity in Wales
The report “Finance Wales: A reflection on the first 5 years” (CMI 2007)provides a valuable source of
information for the long history of publicly backed venture capital investments in Wales, from the

132
inception of WDA in 1975 to the establishment of Finance Wales in 2001 and onwards. The report
argues that from its inception in 1975, the WDA made various attempts at creating a favourable
environment for investments in Wales. These began with a policy at investing in Welsh quoted
companies, attracting foreign direct investments and more recently, by setting up venture capital
investments initiatives.
The first such effort was the establishment of the Wales Venture Capital Fund (WVCF) with a modest
£5m budget and with no significant success. WVCF was followed by the Welsh Enterprise Fund which
had similar performance as its predecessor and came to its natural end in the late 90s. In mid 90s
the Wales Fund Managers were also established. Between 1996 and 2000, the WDA’s Finance
Programmes Department developed and launched a Business Angels network, a University Spin out
programme, support for firms seeking access to capital and a senior business mentor programme.
During this period, three supply side activities were also launched – the Wales Innovation Fund
(WIFL); the Wales Small Loan Fund (WSLF) and a University focussed interest free loan scheme
delivered as part of the Wales Spin out programme (CMI 2007). The decision of the European
Commission to allow regions to use ERDF money to support regional investments funds and the
successful example of the use of such money by English and Scottish based regional development
funds, whetted the appetite of the Welsh regional stakeholders for the creation of a similar
organisation in Wales. In this context, in 1999 the argument was won for the creation of a similar
initiative in Wales in order to take advantage of the European Funding opportunity in 2000 to 2006.
Thus, Finance Wales was established in 2001. On formation, Finance Wales inherited from the WDA
a suite of equity and loan funds and obtained large tranches of European funding from the Objective
1 & 2 Programme combined with private sector finance from Barclays Bank. These public/private
sector funds made more than £80m available for investments in Welsh SMEs (CMI 2007).
Since the inception of Finance Wales in 2001, the majority of venture capital investments that took
place in Wales involved one or more publicly backed investors (Library House). As shown earlier, the
importance of publicly backed investors especially at the early stage companies has been increased
in all UK regions. All these developments significantly increase the role of publicly backed funds in
Wales and placed pressure one the government to enhance its policies in the context of creating a
self sustaining financial community in Wales.
Between 1984 and 2007, £1.6 billion of risk capital have been invested in over one thousand
companies based in Wales, with £1.2 billion of which, invested in the last decade (BVCA). While

133
formal venture capital in Wales represents only 0.13 percent of the welsh GDP1, it compares
favourably with the UK average of 0.05 percent and it is similar to the US average (0.14 percent).2
Figure 25: Investment Activity in Wales since 1984
0
50
100
150
200
250
300
350
400
450
500
Year 1
984
Year 1
985
Year 1
986
Year 1
987
Year 1
988
Year 1
989
Year 1
990
Year 1
991
Year 1
992
Year 1
993
Year 1
994
Year 1
995
Year 1
996
Year 1
997
Year 1
998
Year 1
999
Year 2
000
Year 2
001
Year 2
002
Year 2
003
Year 2
004
Year 2
005
Year 2
006
Year 2
007
Am
ou
nts
(£m
)
0
10
20
30
40
50
60
70
80
90
100
Nu
mb
er
of
co
mp
an
ies
Amounts Invested (£m)
Number of Companies
Source: Table created using BVCA data
Figure 25 illustrates the increasing trend in venture capital investments in Wales since 1984. In 1999
and in 2004 two large MBO are clearly apparent in the graph. However, there is an upward trend on
the number of companies receiving VC investments since the late 1990s.
1 Based on 2006 figures, GDP for Wales was £47b (Wikipedia)
2 See NESTA (2011), Atlantic Drift, NESTA

134
Figure 26: Venture capital Investments and regional gross added value in 2007
Figure 26 illustrates the relationship between Gross Added Value (GAV) per capita as a percentage of
the total UK, and the venture capital investments for all UK regions. Wales together with the North
East and Northern Ireland belong to a group of regions which have relatively low GAV and VC
investments activity.
There are only few VC players that are currently operating in Wales with the largest of them being
Finance Wales. There are only three venture capital Funds that are currently based in Wales, Finance
Wales and Welsh Fund Managers and the University Challenge Fund (UCFs) run by Cardiff University.
The Welsh Assembly government has also been active in VC market by investing independently.
Another investment scheme operating in Wales is Biofusion which explores IP opportunities coming
out from Cardiff University. Several other VC funds that are not located in Wales have been investing
in Welsh based companies during the last decade.

135
Table 16: Main investors in Wales
VC firm No of investments Share of market
Finance Wales 46 39%
Wales Fund Managers 12 10%
HSBC 7 6%
Cardiff UCF 5 4%
Advent 4 3%
Welsh Assembly 4 3%
3i 3 3%
Scottish Equity Partners 3 3%
NWD Invest 3 3%
Source: Thomson Reuters
The sample dataset that was used in previous analysis (see chapter 5) contains 119 venture capital
investments that were made to Wales based companies. Sixty percent of these investments were
made by one or more publicly backed funds. The domination of Finance Wales which is a publicly
backed VC fund, is clearly evident in Table 16. Finance Wales has been involved in 46 of those deals
which is equivalent to 39 percent of all deals and 61 percent of publicly backed deals. Wales is
currently receiving an expected share of VC investments (location equation 0.95) performing better
than regions such as West Midlands, East Midlands, Yorkshire and the Humber, South West. In the
absence of FW the location equation would have been much lower.
5.7 Conclusion
On a national scale, the supply of early stage venture capital recovered during the mid 2000s after its
collapse in the wake of the dotcom crisis in 2001 but fell back in 2008 with the onset of the financial
crisis. During this period the provision of early stage venture capital has changed, with public sector
venture capital funds becoming more important, largely as a result of the growth of co-investment
schemes which invest alongside Business Angels and private sector funds. Both public sector funds
investing on their own and private investors investing on their own have declined in both relative
and absolute significance since 2004-2005. The composition of private sector investors has also
changed, with funds declining in significance and various types of Business Angels (high net worth
individuals and angel groups) becoming more important.
On a regional scale, the disparity gap between regions has been narrowed and several regions have

136
more than their expected shares of early stage venture capital investments, measured by number of
deals, mainly due to the increase in publicly backed investments. At first glance this appears to be a
positive development. However, closer inspection reveals potentially problematic features. First,
the high level of investment activity is largely a function of the public sector venture capital funds,
either investing on their own or in conjunction with private sector investors. Indeed, over the period
as a whole the public sector has been involved in more than three-quarters of the early stage
investments made in the midlands and north, rising to more than 90 percent in some regions in
2008. The proportion of free-standing private sector deals in these regions is correspondingly low.
Second, the average size of these investments is small, reflecting the small fund sizes and maximum
investment thresholds of public sector schemes. Early stage venture capital, measured in terms of
the amount invested, continues to be over-concentrated in core regions of southern England as it
always has been (Mason 1987; Martin 1989, 1992; Mason and Harrison 1991, 2002a). So, from a
regional perspective the UK now appears to have two early stage venture capital markets. In
London, the South East and, to a lesser extent, the East of England, private sector investors
dominate investment activity, investing for the most part on their own rather than with public sector
co-investors. This is in contrast with the remainder of the UK where the early stage venture capital
market is under-pinned by extensive public sector involvement. In some regions this takes the form
of free-standing investments by public sector funds whereas in other regions it takes the form of co-
investments with the private sector. Private investors investing on their own, account for only a
minority of investments in these regions and have been more likely to invest alongside the public
sector in co-investment deals than entirely independently. Moreover, this gap between London and
the South East and the rest of the country has widened since 2001, during periods of both declining
and expanding venture capital investment activity.
As a result, the effect of the increased government intervention in the supply of venture capital on
the geography of venture capital in the UK has been twofold. First, the public sector has now
become an important co-investor partner especially at the early stage investments, leveraging high
proportion of private investments. Second, on one hand it has helped narrow the regional disparity
gap in early stage investments but, on the other hand, it has resulted in several regional VC markets
now becoming dominated by public funds. The key question is whether this matters and why.
The aim of the public sector schemes has been to stimulate the supply of new sources of finance,
ensuring that each region has access to regional based VC funds and demonstrating that investors in
early stage funds can make robust returns, thereby promoting the private sector venture capital

137
industry (Mason and Harrison 2003). The question regarding how significant these interventions
have been in terms of increasing the supply of early stage finance to SMEs can only be addressed in
fairly narrow terms. On one hand, these funds increased the supply of VC finance to regional SMEs
by making available to them approximately £1b during the last decade (SQW 2010). This poses the
question as to whether or not this increased public sector involvement in early stage venture capital
investing has ‘crowded out’ private sector investors. While, given the limitations of the data, it is not
possible to provide a conclusive answer to this question, there is no evidence that this is occurring.
First, the increase in public sector investment since 2000 has reduced the average size of
investments in the sub-£2 million category; this would suggest that they have filled a gap in the
supply of small investments. Second, co-investment schemes would appear to have boosted angel
investment activity, and therefore attract more private money into the early stage market.
On the other hand, the financial returns of the publicly backed funds have been negative and below
industry average (NAO 2009). In addition, companies that received VC finance from publicly backed
funds have not performed significantly better than matched firms which did not receive funding
from such sources (NESTA and BVCA 2009). These findings are open to several possible
interpretations. From a demand-side perspective they suggest that the UK does not have a large
stock of high potential firms that are only being held back by a simple lack of equity funding. This
interpretation also allows for the possibility that savvy entrepreneurs positively discriminate in
favour of private sector investors when making their choice of financial partner. Alternatively, from
a supply side perspective it may reflect the limitations of the public sector venture capital model.
First, the focus of such funds on specific geographical areas restricts the supply of suitable
investment opportunities, particularly in smaller regions (see NESTA 2009). Second, the investments
made by the public sector venture capital funds is typically too small to meet the funding needs of
high-growth firms (SQW, 2009), or allow follow up investments (NESTA 2009).
Overall, the empirical results which suggest that the overwhelming majority of early-stage venture
capital investments in many UK regions and nations are publicly backed, in itself is not necessarily a
cause for concern: if the alternative is sensible investments not being made, public intervention may
be justified. However, as the NESTA and BVCA (2009) study suggests, regions which are dominated
by public VC investment will also be overwhelmed by VC backed companies that do not perform
much better than those that receive no VC investments.
Alternatively, if the problem is not in the demand side, but the funds are not able to effectively assist
businesses due to the way they are structured, this becomes more problematic: businesses in

138
publicly backed dominated regions may not receive any added value by a VC investments; private
investors may not be attracted into the region and finally; it may be difficult for General Partners
(GPs) that operate public funds to raise new funds from Limited Partners (LPs) due to the poor
financial records and their lack of contacts with private investors.
In both cases, regions with high dependency on public VC investments are faced with the prospect
of having a large pool of companies that do not behave as typical VC backed companies and
therefore these regions do not benefit from a regional VC industry. As mentioned earlier, companies
that receive VC create more jobs and are more innovative than non VC companies.
The following chapter examines whether the implications of the potentially problematic domination
of publicly backed funds in several regions influence the innovation performance of these regions: if
regions are dominated by publicly backed VC funds, what might this mean for the innovation
performance of these regions?

139
6 CHAPTER 6: THE RELATIONSHIP BETWEEN VENTURE CAPITAL
AND INNOVATION
6.1 Introduction
Venture capital plays an important role in the financing and nurturing of high tech, high potential
companies. A variety of studies have shown that venture-backed firms are responsible for a
disproportionate number of patents and new technologies, and bring more radical innovations to
the market faster than lower growth businesses that rely on other types of finance (Kortum and
Lerner 2000; Hellmann and Puri 2000, 2002; Hall and Lerner 2010). In fact, venture capital has
played an important role in the development of some of the most significant scientific inventions
and industries of our times and high-growth, venture-backed firms are also more likely to generate
new industries (see Bygrave and Timmons 1992; Timmons and Spinelli 2003). The aim of this chapter
is twofold: first to investigate the relationship between venture capital and innovation; and second,
to analyse the likely impact of different sources of venture capital (public or private) on the
innovation potential of companies. This in turn will provide answers to research questions 2 and 3,
namely: Is a higher volume of VC investment positively correlated with a higher volume of patent
applications? And are public funds less effective in investing in companies with the potential to
innovate than private funds?
The significant impact of venture capital on innovation has not been unobserved by policy makers.
As demonstrated in previous chapters, successive UK governments have introduced different
schemes in support of venture capital finance. Recent evaluations of the government VC schemes
have highlighted that publicly backed funds have had a negative financial performance and their
overall Internal Rate of Return (IRR) was substantial lower than the IRR reported by private funds
(NAO 2009). Furthermore, they have had only a marginal impact on business performance (NESTA
and BVCA 2009). Despite their limitations however, public interventions have significantly increased
the supply of finance for business seeking equity finance, and the public sector has become
considerably more important as an investor in both absolute and relative terms as seen in the
previous chapter. This chapter investigates the likely impact of these public interventions on
innovation.
This chapter builds on previous U.S. based empirical research which shows that venture capital spurs
innovation through the creation of patents and increases in business R&D expenditure, and extends
it to the UK level. It investigates the relationship between venture capital and innovation at two

140
scales, the country and regional scale, using aggregated data for all UK regions on factors that are
traditionally considered to indicate innovation activity. The data allows the relations between
financing and innovation outputs to be compared across regions and therefore seeks to illuminate
the under-researched issue of regional variations in venture capital investments and the role of
venture capital in fostering innovation.
An important contribution of this section to the literature is the investigation of the relation
between different sources of finance of VC funds and the innovation potential of the companies with
which these funds are engaged. This analysis provides preliminary answers to the question: “do
publicly backed funds promote innovation to the same extent that private funds do?”
6.2 Theories and hypothesis
There are few, if any, dissenters from the view that venture capital plays a central role in the
emergence of new industries by funding and supporting innovative companies which later dominate
these industries. Indeed, Lerner and Watson (2008) argue that the venture capital model is more
effective in commercialising scientific discoveries than the corporate sector, despite the latter’s large
expenditure on Research and Development (R&D). Venture capital investment speeds the
development of companies, enabling them to transform ideas quickly into marketable products and
become industry leaders through first mover advantages (Zhang 2007). The process of innovation is
a crucial aspect of economic growth, the problem of measuring innovation has not yet been
completely resolved (Acs et al. 2001).
6.2.1 Measures of innovation
Patents, number of applications or grants, and business R&D expenditure have been widely used by
scholars as proxies of innovation (see Mann and Sager 2007; Hirukawa and Ueda 2011). Both proxies
are widely available at industry or country level and partially available at the regional level. Both of
these measurements of innovations have important limitations. According to Frenz and Oughton
(2005), there are three main weaknesses of patent data. Firstly, patents do not capture innovation
by firms that are Schumpeterian imitators, that is, firms that introduce products or processes that
are new to their firm but not new to the market or industry. Secondly, not all innovations that are
new to the market are patented. Moreover, the propensity to patent may vary significantly across
industries and sectors, for example, between manufacturing and services. Thirdly, patents are often
registered at the Head Office of an enterprise, thus there are regional distortions that arise as a
result of administrative features of the patent system (Smith 2005). In addition, patents are not

141
always introduced on the market and their economic value can be questionable (Jaffe and Lerner
2004). Griliches summarises these concerns nicely:
“not all inventions are patentable, not all inventions are patented and the inventions that are
patented differ greatly in “quality”, in the magnitude of inventive output associated with them”
(Griliches, 1990, p.296).
In addition to these limitations, Verdoni and Galeotti (2009) argue that patent data cannot provide
any insight on, what they call, disembodied technological change, such as for example the learning
process by which individuals can increase the productivity of the production process thanks to
“learning by doing”, is clearly left out of a study based on patent data (Verdolini and Galeotti 2009)
Business R&D expenditure although commonly used as a measure of innovation, is an input for
innovation rather than an output or product of innovation itself. The scale of innovation depends
not only on how much R&D expenditures are spent but also on how efficiently they are spent. As a
result R&D expenditures are indirect measures of innovation, whereas patents are a direct measure
of innovation (Hirukawa and Ueda 2011). R&D expenditure suffers from measuring only the
budgeted resources allocated towards trying to produce innovative activity (Acs et al. 2001). In
addition, it is also concentrated in few industries (for example biotechnology and defence industry).
According to Frenz and Oughton (2005), for a given industrial structure, the extent to which R&D is a
good proxy for (novel) innovation depends on: the amount of ‘unsuccessful’ R&D expenditure that
fails to result in an invention; the extent to which successful inventions are commercialised; and the
degree of spillover effects (Frenz and Oughton 2005). Regional R&D figures also suffer from the fact
that some R&D is not carried out in the same region as the reporting unit providing the data, thus
the figures may be affected by ‘head office bias’ (Frenz and Oughton 2005).
Conventional measures of innovation activity such as patents and R&D expenditure fail to capture a
number of interactive features of research and innovation activity that have been highlighted by the
systems of innovation literature. These include: non-pecuniary knowledge acquisition (accidental
and deliberate knowledge spill-overs); cooperative agreements between firms; networking between
firms and research organizations (Frenz and Oughton 2005).
Keeping in mind the limitations outlined above, and the absence of a more suitable and easily
identifiable measurement for innovation for the purpose of this research, the use of patent data
with the purpose of investigating the relationship between VC and innovation has several
advantages and as Chrilliges puts it:

142
“after all, patent does represent a minimal quantum of invention that has passed both the scrutiny of
the patent office as to its novelty and the test of the investment of effort and resources by the
inventor and his organization into the development of this product or idea, indicating thereby the
presence of a non-negligible expectation as to its ultimate utility and marketability” (Chrilliches 1998
p.296).
Business R&D expenditure is used as both depended and explanatory variable in the analysis. It is
worth noting that patent application is simply a proxy for business innovation and additional proxies
for innovation could be used in a future research. In addition, the relationship between the two
variables, venture capital investment and patent application, may only show association and not
necessarily causation.
The basic theoretical premise of this section is that VC spurs innovation and in particular that VC
promotes business innovation by fostering patent creation (Kortum and Lerner 2000; Hellmann and
Puri 2001). Building on this premise, three hypotheses have been developed, dealing with the
relationship of venture capital with innovation at the regional and at the firm level
Hypothesis 1: Increases in venture capital activity (amounts and deals) will be positively associated
with increases in volumes of innovation (patents and business R&D expenditure).
Hypothesis 2: Companies with patents are more likely to secure follow up VC finance compared with
companies without patents.
Hypothesis 3: The potential of a firm to innovate (expressed as the ability of a firm to acquire a
patent) is associated with the source of VC finance (public or private).
In testing these hypotheses empirically, several controls have been included for the potential
confounding effects: stage of investment, industry of operation, size of investment, and year of
investment. These controls have been identified in the literature as factors that could potential
influence the dependent variables of each analysis and further information on these controls have
been outlined in the Research Methodology chapter.

143
6.3 Relationship between venture capital and innovation, country
and regional-level analysis
6.3.1 Country level analysis
This section investigates the relationship between several innovation related indicators with the
venture capital activity performance variations in time and in space. Table 17 provides descriptive
statistics on several innovation related indicators for the UK for the period 1995-2007.
Table 17: Innovation related indicators for the period 1995-2007
Year
Number of
companies
receiving VC
investment
Venture
Capital
disbursements
(£m)
Number of
companies
receiving
early stage
VC
investment
Early stage VC
disbursements
(£m)
Business
R&D
Expenditure
(£m)
Government
R&D
Expenditure
(£m)
Employment
in R&D
(000s)
Employment
in HRST
(000s)
Patent
application
(EPO)
Patents
granted
(UKPO)
Ratio of
Venture
Capital to
R&D
1995 n.a 2140 n.a. n.a. 9118 2042 145 n.a. 93 n.a. 0.23
1996 1106 2806 n.a. n.a. 9298 2070 141 n.a. 219 n.a. 0.3
1997 1178 3066 n.a. n.a. 9555 2017 137 10016 2014 n.a. 0.32
1998 1147 3775 288 288 10133 2078 147 n.a. 3542 n.a. 0.37
1999 1109 6169 347 427 11303 1788 151 10427 4960 n.a. 0.55
2000 1182 6371 394 703 11510 2135 145 10765 5268 2934 0.55
2001 1307 4752 383 390 12239 1829 153 10942 5016 2642 0.39
2002 1196 4480 373 295 12485 1752 159 11160 4882 3203 0.36
2003 1274 4074 427 263 12506 2067 156 11544 5044 3540 0.33
2004 1301 5336 454 284 12661 2168 148 12088 5180 3670 0.42
2005 1307 6813 491 382 13734 2288 146 12314 4812 3661 0.5
2006 1318 10227 500 946 14560 2313 147 12862 2676 2933 0.7
2007 1330 11972 502 434 16109 2238 163 13296 n.a. 2028 0.74
2008 1278 8556 455 360 n.a. n.a. n.a. 13985 n.a. 2042 n.a
Source: BVCA, ONS, Eurostat; Note: All figures are in millions of 2008 pounds. The ratios of venture capital
disbursement to R&D expenditure are computed using all venture capital disbursement only.
Table 17 illustrates that the number of companies receiving venture capital investments (including
early stage companies) has remained relatively stable since 1995, although the amounts invested
have been dramatically increased, indicating large investment deals. Business R&D spending has
increased during the last decade while government R&D spending remained relatively stable as well
as employment in R&D. Employment in science and technology is steadily increasing.

144
Table 17 also shows that the patent count declined since 2004 (patent applications and patents
granted), reflecting the increasing importance of other forms of intellectual property protection such
as licenses and design trademarks.
The final column of Table 17 shows the ratio of venture capital to Business R&D Expenditure. The
ratio between venture capital disbursements and Business R&D expenditure has been constantly
increasing from 0.23 in 1995 to 0.74 in 2007. This mainly reflects the higher annual increase in VC
disbursements compare with the increase in business R&D expenditure. Figure 27 illustrates the
trends in venture capital investments and business R&D expenditure for the period 1995-2007.
Figure 27: Trends in venture capital investments and business R&D expenditure, 1995-2007
Source: BVCA, ONS
A shown in Figure 27, the two measures, Business R&D Expenditure and VC investments seem to be
partially correlated. More particularly, between 1995-2000 and 2005-2007 there seems to be a
close correlation. However, during the period 2001-2004 the VC investments experienced a
significant decline driven by the crisis in dotcom businesses , while business R&D expenditure
continued (although modestly) to increase.

145
Figure 28: Trends in Venture Capital investments and patent applications, 1995-2005
Source: Eurostat, BVCA
Figure 28 summarizes the time series of VC investments and number of patent applications. VC
investments show a rapid increase during the dotcom era (1999-2000) and then declined until 2003.
Since then, VC investments have rapidly increased. Figure 28 also shows a reduction of EPO
(European Patent Office) patent applications since 2000, but show no signs of recovery unlike the VC
market. The two series appear to be closely correlated before 2003 but show no signs of correlation
after 2003. This may be due to the fact that there has been an increase in other forms of copyright
protection and the decline in EPO patents reflects the increase in license, trademarks and other
forms of intellectual right protection.
Together with the observation between VC investments and Business R&D expenditure (Figure 27),
it is clear that there is a relationship between VC investments and innovation as expressed by
number of patent applications and Business R&D expenditure. However, this relationship is not
always positive or strong.
Unlike the time series data in Figures 27 and 28, a clear and positive relationship between VC
investments and several indicators of innovation is observed in cross-sectional data (Table 18).
Correlations coefficients are widely used as measurements of relationship between two
independent indicators. Table 18 examines how related venture capital activity is with several
innovation indicators using one observation for each region for each year.

146
Table 18: Correlations between venture capital and innovation related indicators
Source: BVCA, ONS, Eurostat
Table 18 reports correlations between several innovation related indicators and VC (amounts of
venture capital invested, amounts of early stage venture capital invested, business R&D expenditure,
employment in R&D sectors, number of people employed in R&D sectors, number of patent
applications and patents granted). Business R&D expenditure and VC investments correlations are
all positive and high on many occasions. More particularly, Business R&D expenditure is closely
related to venture capital activity with the highest coefficient with the number of companies that
receive early stage finance (0.67). Government R&D spending is closely related with all the
expressions of venture capital activity with - surprisingly – often higher coefficients compared with
the business R&D spending. The number of companies receiving VC finance is closely related to
business R&D and government R&D expenditure with coefficients of 0.49 and 0.69 respectively.
Employment in science and technology is more closely related to the VC activity (number of
companies and investments) compared with employment in R&D. Patents (applications and granted)
are more closely related to the number of VC companies than VC invested amounts. This is mainly
due to the fact that total amounts invested per year can be easily skewed by large amounts invested.
As expected there is a very close relationship between employment in Science and Technology and
R&D.
Number of
companies
receiving
VC
Venture
Capital
disbursements
(£m)
Number of
companies
receiving
early stage
VC
Early stage VC
disbursements
(£m)
Business
R&D
Expenditure
(£m)
Government
R&D
Expenditure
(£m)
Employment
in R&D
(000s)
Employment
in ST (000s)
Patent
applications
Patents
granted
Venture Capital
disbursements (£m) 0.78 1.00
Number of companies
receiving early stage
VC 0.91 0.66 1.00
Early stage VC
disbursements (£m) 0.76 0.78 0.73 1.00
Business R&D
Expenditure (£m) 0.49 0.23 0.67 0.47 1.00
Government R&D
Expenditure (£m) 0.69 0.42 0.76 0.61 0.74 1.00
Employment in R&D
(000s) 0.53 0.23 0.68 0.45 0.95 0.76 1.00
Employment in ST
(000s) 0.94 0.72 0.87 0.73 0.57 0.76 0.60 1.00
Patent applications 0.91 0.60 0.83 0.68 0.64 0.79 0.69 0.92 1.00
Patents granted 0.82 0.45 0.78 0.58 0.68 0.79 0.75 0.83 0.93 1.00

147
The observations suggest that, at the cross-sectional level, there is a positive association of VC
activity with innovation as expressed by Business R&D expenditure, patent applications and patents
granted. In what follows, this claim is examined in more detail at the regional level using regression
analysis.
6.3.2 The relationship between VC activity and regional innovation outputs: A
regional regression analysis
The strong relationship between venture capital and patenting as illustrated above, is indicative of a
relationship between venture capital activity and innovation output. A natural next step is to
identify how significant this relationship is. In order to answer this question it is necessary to deploy
a form of regression analysis and measure the likely impact of VC investments on innovation as
expressed by the volume of patent application and business R&D expenditure. This section is
inspired by Kortum and Lerner (2000) who examined the influence of venture capital on patented
inventions in the United States across twenty industries over three decades and found that increases
in venture capital activity in an industry are associated with significantly higher patenting rates.
The following quantitative analysis aims to measure the relationship between venture capital and
the inputs and outputs of innovation by exploring how variations in regions’ inputs (venture capital
investments) relate to variations in their outputs (patents and business R&D expenditure). As
mentioned before Business R&D expenditure can be considered as an input of innovation and an
output of VC investments (VC investments may spur more R&D spending), and for the purpose of
this analysis it is treated as both innovation output and input.
Table 19 examines the relationship between venture capital activity and innovation (expressed by
the number of patent applications and business spending on R&D) controlling for regional GDP and
regional variations. The dependent variable is the number of patent applications instead of patents
granted for two reasons. First, patent application is likely to be a better indicate of a company’s
willingness to innovate regardless of the outcome of its application. Second, there might be a
significant time lag between filing an application and receiving a grant (Hall et al. 2001).
Venture capital activity is expressed as the amounts invested in each UK region and year using data
from the British Venture Capital Association (BVCA). Region fixed effect (regional dummies that take
the value 1 for each UK region) is used in order for the relationship between venture capital and
innovation to be measured relatively to the average performance of a given region and year. For
instance, if London has more VC investments than South East, the regression examines whether
these two regions perform better or worse over time as compared with the average performance of

148
VC investments across all regions, and whether the variations in performance are more or less
dramatic.
Table 19: Relationship between venture capital, patent application and business R&D at the region
level
(1) (2) (3) (4) (5) (6)
Dependent variable:
Patent
Applications
(log)
Patent
Applications
(log)
Patent
Applications
(log)
Business
R&D (log)
Business
R&D (log)
Business
R&D (log)
VC investments (log) 0.395 0.423 0.356 0.477 0.068 0.046
(4.48)*** (2.15)* (2.48)** (3.38)*** (2.01)* (1.76)*
Business R&D (log) 0.603 3.930 -0.290
(7.33)*** (3.55)*** (0.32)
GDP (log) 7.570 0.870
(6.55)*** (5.37)***
Patent applications (log) 0.182 0.068 -0.002
(3.05)** (3.13)*** (0.07)
Constant -0.440 -9.968 -38.809 1.269 2.457 -2.032
(1.66) (3.10)** (9.86)*** (4.80)*** (25.42)*** (2.32)**
Regional fixed effects NO YES YES NO YES YES
Observations 117 117 117 129 129 129
R-squared 0.36 0.52 0.74 0.54 0.97 0.98
Robust t statistics in parentheses
* significant at 10%, ** significant at 5%, *** significant at 1%
London is the reference region
Columns 1-3, includes data for 1995-2004 and columns 4-6 includes data for 1995-2008
Table 19 Column (1) shows regression coefficients for the natural log of the number of patent
application to the natural log of venture capital investments and the natural log of Business R&D
expenditure. Both coefficients are positive and significant at 1 percent level. Column (2) presents the
same regressors but this time controlling for regional variations. The results remain positive and
significant but this time the coefficient for Business R&D expenditure increases, suggesting a
stronger relationship between Business R&D and patent applications. When controlling for regional
GDP, Column (3), such coefficient is no longer significant. However, the coefficient for VC
investments remains positive and significant in all regressions, suggesting that there is a strong and
positive relationship between patent applications and VC investments. However, this result has to be
interpreted with caution since there may be an issue of multicollinearity (the correlation between VC
investment and patent application is relatively high, see Table 18). Columns 4-6 show results of the
business R&D regression with VC investment and patent application again controlling for regional
GDP and regional variations. There is a positive and significant relationship between Business R&D
expenditure and VC investments in all regressions, suggesting that increases in region VC activity
levels are positively related with increases in the amount of Business R&D spending in a region.

149
These findings reinforce the argument of the importance of VC activity in regional innovation
performance as it shows a strong relationship between venture capital and innovation. However,
this relationship may also be explained by a third unobserved factor, the arrival of technological
opportunities (Hall and Lerner 2010). Thus, there could be more innovation at times when more
venture capital was available, not because the venture capital caused the innovation, but rather
because the venture capitalists reacted to some fundamental technological shock which was likely
to lead to more innovation (Hall and Lerner 2010). In this case, the innovative firms selected venture
capital financing rather than venture capital fund enabled the firm to be more innovative, and
therefore the role of venture capital in spurring innovation is questionable. To address this concern,
Kortum and Lerner (2000) examined the possibility that venture capital backed firms are more keen
to patent their inventions compared with no venture capital backed firms due to mainly two
reasons: venture capital backed firms may fear that the venture investors will exploit their ideas and
investors are keener to invest in companies with patents already granted. The latter explanation
reserves reverse causality (cause and effect in reverse): since one of the criteria that venture
capitalists use to assess business proposal is the existence of patents, a company may deliberately
acquire a patent in order to increase its chances of receiving VC capital. Therefore, the coefficient
would be positive not because more VC investments lead to more patents, but because companies
receive patents in order to receive VC funding. In order to address these issues, Kortum and Lerner
(2000) examined three additional measures of innovation activity: i) the number of patent citations
and the economic importance of a patent; ii) the frequency and extent of a patent; and iii) trade
secret litigation in which a firm has engaged. All the tests of differences in means and medians in
these three categories are significant at least at the five-percent confident level, as well as when
they employed regression specifications, which indicate that venture capital indeed spurs
innovation. Given the rapid increase in venture funding since 1992 in the US, the report suggested
that by 1998 venture funding accounted for about 14 percent of U.S. innovative activity. The results
of the regression analysis in Table 19 should be seen in relation to the findings of Kortum and Lerner
(2000) which although conducted at the industry level and in the US, nevertheless provides strong
evidence on the likely impact of VC in innovation activity.
The next section deploys disaggregated data at the firm level aiming to reveal specific characteristics
of the individual investments such as industry, stage and location and also to examine whether
different types of VC investments have a potentially different impact on innovation and how this is
reflected at the regional level.

150
6.4 Firm level analysis
To address these issues it is necessary to employ a different research design which puts the firm at
the centre of analysis instead of the region. Using a combination of commercial databases and
publicly available information, a data set was constructed that allows several characteristics of the
VC backed companies (amounts received, funding rounds, patent applications etc.) to be observed.
The main strength of the database is that it distinguishes between private and publicly backed
venture capital investments. The database also provides information on industry operation and the
geographical base of the companies. Using this database it is possible to investigate two issues:
First, does the relationship between venture capital and patents become stronger as the venture
capital investment journey progresses? Or in other words, are companies with patents more likely to
secure follow up VC finance compared with companies without patents (hypothesis 2)? Companies
may be geared up to receive patents even after their first finance round in order to increase their
likelihood to receive further VC funding in follow up rounds. In addition, companies with patents
may be more likely to receive follow up VC investment compared with companies without patents.
One might expect to observe a large heterogeneity in the volume of patent applications across
companies operating in different industries. Similarly, due to regional characteristics and the
specific industrial focus of some regions, one would expect to observe large regional variations in the
volume of company patent application.
Second, analysis in previous sections shows that there are now two distinctive source of VC finance
since publicly backed investment have become an important source of finance especially at the early
stage level. It has also been demonstrated that some regions are particularly dependent on publicly
backed funds as the main source of VC finance, while other regions are better connected with
private funds. In the light of this development a natural question is raised: Do different sources of
venture capital affect the relationship between VC and innovation outputs in different ways?
Answering this question will provide evidence for research question 3 of this thesis: Are public funds
less effective in investing in companies with the potential to innovate, than the private funds?
6.4.1 Limitations
This analysis has several important limitations. First, the time when the company was granted or
applied for the patent is not known. Therefore, it is not possible with the given data to examine
whether the patent was granted or applied for before or after the VC investment. Therefore the aim
of the research is not to investigate the role of VC investments in promoting innovation within the

151
company. Rather the aim of this research is to examine the association between venture capital
investments and patents within the investment journey and the role of the source of finance in
supporting companies with patents (or the ability to acquire patents). A future study could capture
the date of patent application and associate it with the date of VC investment. Second, the quality
of the patents has not been accessed. Patents backed by publicly backed funds may be of better
quality of those backed by private funds or the opposite. Lerner et al. (2008) research on patent
quality (using number of citations as a proxy for economic importance) found that patents applied
by firms in private equity transactions are more cited, and such research could be undertaken within
the framework of a follow up study. Third, patents have been used as a proxy for innovation.
Although the literature accepts that patent creation is an important figure for innovation, additional
proxies for innovation could be used in future analysis such as licenses, trademarks, number of new
products in the market, copyrights etc. Forth, additional depended variables could be used in future
analysis such as the performance of the VC backed companies and its association with patent and
public or private investment. In this sense, performance could be defined as company turnover,
employment growth etc. Finally, a further research could control for other characteristics of the firm
that may affect its innovation outputs, such as size of firm, foreign ownership, export activity,
openness, structure, R&D activity etc.
It is important to note that the reported statistical analysis is not adequate to distinguish between
the possibility that patents facilitate progress through the investment cycle and the possibility that
the investment has facilitated the firm’s ability to apply for patents. This issue is nicely explained by
Mann and Sager (2007):
‘’on one hand, venture financing contributes to the ability of start-up firms to apply for patents in
several ways; the venture capitalist facilitates patenting both by providing funds and by providing
management expertise to assist the portfolio firm in the development process. On the other hand,
the interviews reported in Mann (2005a) suggest that patents (or the prospect of patents) often can
be useful in obtaining funding. Most obviously, patents can solve one of the most difficult problems
for a start-up: convincing the venture capitalist that the start-up can sustainably differentiate itself
from its competitors. Similarly, as the firm advances through the venture capital cycle, patents often
are useful to protect the firm against larger incumbent firms that might try to drive the start-up from
the market. Many investors also value patents because of information they convey about the
operational competence of the firm’s management” (Mann and Sager 2007, p. 200).

152
6.4.2 Patents and venture capital investment journey
A venture capital backed company normally receives several rounds of finance called funding
rounds. Each time a company needs new finance (for example in order to launch a new product, to
conduct new trails etc.), it raises a new round. This happens until the company is ready to exit
through an IPO or a Merger or Acquisition. Some companies need only few rounds before exit while
others need several. Companies that are not able to raise further funding rounds are normally
acquired or cease operations. A venture capital fund may take part in one or several funding rounds.
Table 20 presents the number of VC backed companies that had one or more patents or patent
applications at each funding round.
Table 20: VC investment made to companies
Funding Rounds
Number of
investments
made to
companies
without patent
Number of
investments
made to
companies with
patent Total
Proportion of
investments
made to
companies
without patent
Proportion of
investments
made to
companies with
patent
(1) (2) (3) (4) (5) (6)
1 1,496 687 2,183 69% 31%
2 572 465 1,037 55% 45%
3 208 291 499 42% 58%
4 81 147 228 36% 64%
5 39 68 107 36% 64%
6 13 21 34 38% 62%
7 6 9 15 40% 60%
8 2 7 9 22% 78%
9 0 3 3 0% 100%
10 0 2 2 0% 100%
Total 2,417 1,700 4,117 59% 41%
Column (1) of Table 20 includes funding rounds from one to ten. Because the structure of venture
capital financing gives venture capitalists a realistic opportunity to terminate firms after each round,
and makes each additional round a substantial indicator of progress, the number of rounds is also a
good proxy for performance (Gompers and Lerner 2001; Mann and Sager 2007). Column (2) shows
153
the number of investments that were made to companies that had no patents or patent
applications, and column (3) shows companies that had one or more patents or patent applications.
Column (4) shows the total number of companies that received funding in each funding round (from
1 to 10). The last two columns of the table present these figures in percentages.
2,183 investments from the sample were made to companies at the 1st funding round. 687 or 31
percent of them were made to companies with one or more patents. From the 1,037 investments in
round 2, approximately half (45 percent) were made to companies that had one or more patents at
the time of investment. In later funding rounds the proportion of investments that were made to
companies with patents exceeds 60 percent. It is clear that the percentage of investments that is
made to companies with patents rises as the funding of the company progresses. This clear
relationship between funding rounds and patents is in line with the literature as it confirms that a
patent is an important factor in venture capital finance. For example, Hellmann and Puri (2000)
found that firms earning more patents are more likely to obtain VC funding and it is apparent that
patents appear increasingly important to the business of VC-backed firms (Kaplan et al. 2009).
Haeussler et al. (2009) found that patenting is important for the general VC investment decision and
that they help firms to attract VC faster than would be possible without patents. However, this
finding is open to two interpretations: First, companies are more likely to progress to the next level
of funding if they have a patent or second, companies acquire patents during their investments
journey. As the dataset does not include information on patent applications dates, it is not possible
to investigate the latter potential interpretation. Therefore, it is not possible to provide an answer to
the question as to whether the company applied for a patent before or after the investment was
made, which could have provided some clues as to the role of VC finance in encouraging the
business to acquire patents.
Since no information was obtained on firms that have never received VC finance, this section does
not examine the question whether patents are important in order to secure first round finance.
Rather it examines the question whether patents relate to subsequence investment decisions.
Table 21 investigates the relationship between the source of finance (public or private) and patents.

154
Table 21: Descriptive statistics
Public deals Private deals
Round N
No of deals
with patents % N
No of deals
with patents %
1 837 267 31.9% 1346 420 31.2%
2 339 146 43.1% 698 319 45.7%
3 143 74 51.7% 356 217 61.0%
4 60 36 60.0% 168 111 66.1%
5 29 17 58.6% 78 51 65.4%
6 14 8 57.1% 20 13 65.0%
7 5 2 40.0% 10 7 70.0%
8 3 2 66.7% 6 5 83.3%
9 2 2 100.0% 1 1 100.0%
10 0 . 2 2 100.0%
1432 554 38.7% 2685 1146 42.7%
Around 68-69 percent of all first round investments (public or private) were made to companies
without a patent and the remaining 31 to 32 percent to companies with a patent. However, in later
stage deals, it is clear that a higher proportion of private investments were made to companies with
patents compared with the public investments. This trend is better observed in a graphical
illustration.
Figure 29: Patents by stage and source of finance

155
Figure 29 graphically presents the proportion of investments made to companies with patents
during the investment journey, from the first until the final round. While only 31 to32 percent of
first investments made by either private or public funds are made to companies with patents, as the
investment’s journey progress, public funds become less geared towards investing in companies
with patents compared with their private counterparts. The convergence at the very latest rounds
may be explained by the very small number of investments made.
The sequence analysis investigates how significant these differences in patents between public and
private investments are at the regional level controlling for various factors that may affect the
presence of patents such as, where the company is based, in which industry it operates, from where
it receives VC finance, the amounts it receives and the stage of finance. For example, the differences
outlined above may be skewed by some regions with large number of investments or a focus on an
industry that does not require patents.
6.4.2.1 Source of finance
Table 22 presents descriptive statistics of the 4,117 investments included in the study sample. The
investments are presented by source of finance and are broken down into three categories (Public,
Private and Business Angels). Data on the size of the individual investments were not always
available. Data on patents have been collected using the EPO (European Patent Office) on line
database (see chapter 4 for details).
Table 22 : Investments by source of finance
All Publicly backed deals
N Mean Std Dev Min Max N Mean Std Dev Min Max
Year 4117 2004 2.45 2000 2008 Year 1467 2005 2.10 2000 2008
Amounts 3173 2978.14 5454.03 4 60000 Amounts 1098 732.46 1459.86 4 21600
Rounds 4117 1.85 1.21 1 10 Rounds 1467 1.72 1.13 1 9
Patents 4117 0.41 0.49 0 1 Patents 1467 0.38 0.49 0 1
Private deals Business Angels deals
N Mean Std Dev Min Max N Mean Std Dev Min Max
Year 2579 2004 2.54 2000 2008 Year 692 2005 2.17 2000 2008
Amounts 2008 4175.45 6415.64 8 60000 Amounts 597 1937.83 4158.47 20 60000
Rounds 2579 1.90 1.22 1 10 Rounds 692 1.93 1.27 1 9
Patents 2579 0.42 0.49 0 1 Patents 692 0.46 0.50 0 1
Investment characteristics. The average size of a VC investment in the study sample is £2978k, but
there is considerable heterogeneity between different source of finance. In the overall sample the

156
smallest investments is £4k and the largest one is £60m. The average size of investments in which
public funds participate in is £732k, private funds £4.18m and Business Angels £1.94m.
The average funding round of the sample was 1.85, 1.72 for Public funds, 1.90 for Private funds and
1.93 for Business Angels. This is not surprising as Public funds face several constraints in follow up
investments (NESTA 2009). Forty one percent of the investments in the sample were made to
companies with patents. Thirty eight percent of investments in which a Public fund participated
were made to companies with patents, 42 percent when only Private funds participated and 46
percent when a Business Angel participated.
The sample contains investments that were made between 2000 and 2008 and the average
investment in the sample was made in 2004. Average Public funds and Business Angel investment
was made in 2005 while Private fund investments was made in 2004.
Forty one percent of all investments in the sample were made to companies with patents. Thirty
eight percent of investments in which one or more public fund participated were made to
companies with patents (or patent applications). Forty two percent of investment in which only
private funds participated were made to companies with patents (or patent applications).
Publicly backed investments can be further broken down into two categories: investments made by
solely Private Funds (Solely Private); and, investments in which one or more in which one or more
private sector investors has invested alongside one or more public sector funds (Co-investments).
Table 23: Descriptive Statistics – Financial source of publicly backed funds
Co-investments Solely Public
N Mean Std Dev Min Max N Mean Std Dev Min Max
Year 811 2005 1.96 2000 2008 Year 651 2005 2.20 2000 2008
Amounts 621 1046.15 1815.39 5 21600 Amounts 473 325.48 570.85 4 7500
Rounds 811 1.92 1.26 1 9 Rounds 651 1.47 0.88 1 7
Patents 811 0.48 0.50 0 1 Patents 651 0.27 0.44 0 1
Investment characteristics. The average size of a co-investment is £1046 and the smallest investment
is £5k and the largest one is £21.6m. The average size of investments in which solely public funds
participate in is £325k, the smallest investment is £4k and the largest one is £7.5m. The small
average size of a solely public investment reflects the limited ability of the public funds to invest
large amounts (NESTA 2009).
The average funding round of a co-investment is 1.92 and for solely public investment is 1.47. Again
this reflects the constraints that public funds face in following up investments.
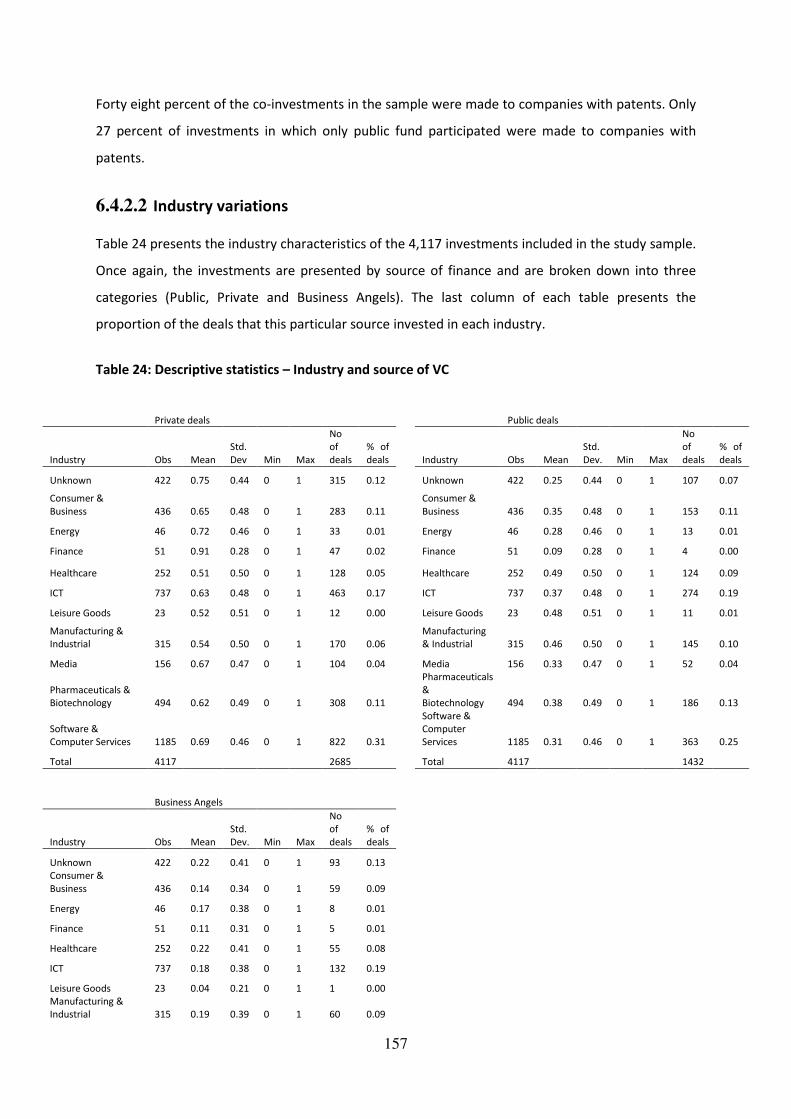
157
Forty eight percent of the co-investments in the sample were made to companies with patents. Only
27 percent of investments in which only public fund participated were made to companies with
patents.
6.4.2.2 Industry variations
Table 24 presents the industry characteristics of the 4,117 investments included in the study sample.
Once again, the investments are presented by source of finance and are broken down into three
categories (Public, Private and Business Angels). The last column of each table presents the
proportion of the deals that this particular source invested in each industry.
Table 24: Descriptive statistics – Industry and source of VC
Private deals Public deals
Industry Obs Mean
Std.
Dev Min Max
No
of
deals
% of
deals Industry Obs Mean
Std.
Dev. Min Max
No
of
deals
% of
deals
Unknown 422 0.75 0.44 0 1 315 0.12 Unknown 422 0.25 0.44 0 1 107 0.07
Consumer &
Business 436 0.65 0.48 0 1 283 0.11
Consumer &
Business 436 0.35 0.48 0 1 153 0.11
Energy 46 0.72 0.46 0 1 33 0.01 Energy 46 0.28 0.46 0 1 13 0.01
Finance 51 0.91 0.28 0 1 47 0.02 Finance 51 0.09 0.28 0 1 4 0.00
Healthcare 252 0.51 0.50 0 1 128 0.05 Healthcare 252 0.49 0.50 0 1 124 0.09
ICT 737 0.63 0.48 0 1 463 0.17 ICT 737 0.37 0.48 0 1 274 0.19
Leisure Goods 23 0.52 0.51 0 1 12 0.00 Leisure Goods 23 0.48 0.51 0 1 11 0.01
Manufacturing &
Industrial 315 0.54 0.50 0 1 170 0.06
Manufacturing
& Industrial 315 0.46 0.50 0 1 145 0.10
Media 156 0.67 0.47 0 1 104 0.04 Media 156 0.33 0.47 0 1 52 0.04
Pharmaceuticals &
Biotechnology 494 0.62 0.49 0 1 308 0.11
Pharmaceuticals
&
Biotechnology 494 0.38 0.49 0 1 186 0.13
Software &
Computer Services 1185 0.69 0.46 0 1 822 0.31
Software &
Computer
Services 1185 0.31 0.46 0 1 363 0.25
Total 4117 2685 Total 4117 1432
Business Angels
Industry Obs Mean
Std.
Dev. Min Max
No
of
deals
% of
deals
Unknown 422 0.22 0.41 0 1 93 0.13
Consumer &
Business 436 0.14 0.34 0 1 59 0.09
Energy 46 0.17 0.38 0 1 8 0.01
Finance 51 0.11 0.31 0 1 5 0.01
Healthcare 252 0.22 0.41 0 1 55 0.08
ICT 737 0.18 0.38 0 1 132 0.19
Leisure Goods 23 0.04 0.21 0 1 1 0.00
Manufacturing &
Industrial 315 0.19 0.39 0 1 60 0.09

158
In absolute terms, more private investments are made to every single industry compared with any
other source of VC finance but this is driven by the largest number of private deals compared with
the publicly backed. Perhaps the most interesting column is the last, which presents the proportion
of deals that were made by each source to each particular industry. Eleven percent of both private
and public investments and 9 percent of Business Angel investments went to Consumer & Business.
Only 1 percent of all types of investment went to companies operating in Energy. Finance companies
attracted 2 percent of all private investments, 1 percent of Business Angels and almost none from
public funds investments. Healthcare companies received 5 percent of all private deals, 9 percent of
all public deals and 8 percent of Business Angels deals. Companies operating in ICT sector attracted
17 percent of all private deals, 19 percent of all public and Business Angel deals, making ICT the
second most preferred sector for VC investments.
One percent of public investment went to companies operating in Leisure Goods while private funds
and Business Angels invest even less. Manufacturing & Industrial attracted 6 percent of private and
10 percent of public investment and 9 percent of Business Angels. Four percent of private and public
and 3 percent of Business Angel investments were made to Media companies. Pharmaceutical
companies attracted 11 percent of all private, 13 percent of all public and 12 percent of all Business
Angels investments. Finally, Software & Computer services attracted 31 percent of all private and 25
percent of all public and Business Angel investments making it the most preferred sector of
investment for all types of VC finance.
Interestingly, there are differences in terms of sector preferences between private and public VC
funds such as Software and Computer companies where private funds allocated 6 percent more of
their total investment compared with the public fund. In contrast, Public funds invest 4 percent
more of their total investments to Manufacturing and Industrial and Healthcare companies,
compared with the Private funds. How significant these differences are is something that will
examine in a later stage of this chapter.
Media 156 0.12 0.32 0 1 18 0.03
Pharmaceuticals &
Biotechnology 494 0.17 0.38 0 1 85 0.12
Software &
Computer Services 1185 0.15 0.36 0 1 176 0.25
Total 4117 692
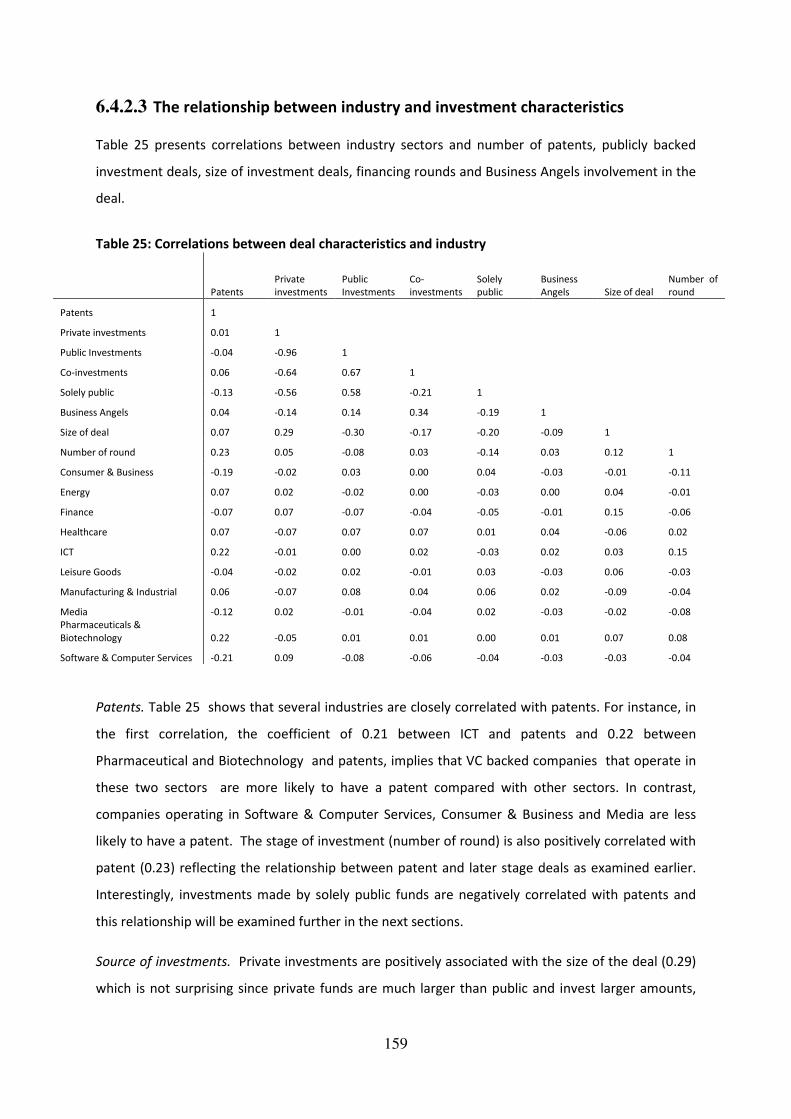
159
6.4.2.3 The relationship between industry and investment characteristics
Table 25 presents correlations between industry sectors and number of patents, publicly backed
investment deals, size of investment deals, financing rounds and Business Angels involvement in the
deal.
Table 25: Correlations between deal characteristics and industry
Patents
Private
investments
Public
Investments
Co-
investments
Solely
public
Business
Angels Size of deal
Number of
round
Patents 1
Private investments 0.01 1
Public Investments -0.04 -0.96 1
Co-investments 0.06 -0.64 0.67 1
Solely public -0.13 -0.56 0.58 -0.21 1
Business Angels 0.04 -0.14 0.14 0.34 -0.19 1
Size of deal 0.07 0.29 -0.30 -0.17 -0.20 -0.09 1
Number of round 0.23 0.05 -0.08 0.03 -0.14 0.03 0.12 1
Consumer & Business -0.19 -0.02 0.03 0.00 0.04 -0.03 -0.01 -0.11
Energy 0.07 0.02 -0.02 0.00 -0.03 0.00 0.04 -0.01
Finance -0.07 0.07 -0.07 -0.04 -0.05 -0.01 0.15 -0.06
Healthcare 0.07 -0.07 0.07 0.07 0.01 0.04 -0.06 0.02
ICT 0.22 -0.01 0.00 0.02 -0.03 0.02 0.03 0.15
Leisure Goods -0.04 -0.02 0.02 -0.01 0.03 -0.03 0.06 -0.03
Manufacturing & Industrial 0.06 -0.07 0.08 0.04 0.06 0.02 -0.09 -0.04
Media -0.12 0.02 -0.01 -0.04 0.02 -0.03 -0.02 -0.08
Pharmaceuticals &
Biotechnology 0.22 -0.05 0.01 0.01 0.00 0.01 0.07 0.08
Software & Computer Services -0.21 0.09 -0.08 -0.06 -0.04 -0.03 -0.03 -0.04
Patents. Table 25 shows that several industries are closely correlated with patents. For instance, in
the first correlation, the coefficient of 0.21 between ICT and patents and 0.22 between
Pharmaceutical and Biotechnology and patents, implies that VC backed companies that operate in
these two sectors are more likely to have a patent compared with other sectors. In contrast,
companies operating in Software & Computer Services, Consumer & Business and Media are less
likely to have a patent. The stage of investment (number of round) is also positively correlated with
patent (0.23) reflecting the relationship between patent and later stage deals as examined earlier.
Interestingly, investments made by solely public funds are negatively correlated with patents and
this relationship will be examined further in the next sections.
Source of investments. Private investments are positively associated with the size of the deal (0.29)
which is not surprising since private funds are much larger than public and invest larger amounts,

160
while public investments are negatively associated (-0.30). Similarly, private investments are
positively associated with larger funding rounds, while public investments are negatively associated.
Interestingly, private investments are negatively associated with Business Angels (-0.14), perhaps
reflecting the fact that Business Angels normally participate in small investments, while Public
investments are positively associated (0.14). Industry wise, several differences between private and
public investments are observed with the most noticeable ones, in Software & Computer Services,
Finance, Manufacturing & Industrial and Healthcare.
Size of deal. General Financial is positively associated with higher amounts of deals followed by the
Pharmaceutical sector to a much lower extent. Companies operating in Chemical, Mobile
Telecommunication, Pharmaceutical and Biotechnology sector also received larger amounts
compared with those operating in other sectors.
Number of funding rounds. Although the differences are quite small amongst industries, companies
in the Pharmaceutical & Biotechnology sector followed by Electronics & Equipment and Mobile
Telecommunications seem to attract slightly more funding rounds than companies from other
sectors, reflecting the larger amounts that they receive. In contrast, Media and Support Services
companies seem to attract fewer number of funding rounds compared with companies from other
sectors. Interestingly, companies in these two sectors are the most unlikely to have a patent as
shown earlier.
Business Angels involvement in the deals. Technology Hardware & Equipment together Industrial
Engineering and Healthcare Equipment & Services are more closely associated with investment deals
in which one or more business angel has participated. In contrast, companies from the Support
Services and Mobile Telecommunication are less likely to have patents.
6.4.2.4 The relationship between size of deals and regions
Table 26 reports summary statistics for the explanatory variables size of investments and number of
funding rounds. This table tests for differences in sample means between each region and London in
terms of size of venture capital deal and number of funding rounds that a company receives. The
table includes all deals with disclosed amounts. The number of observations is as recorded in the
second column.
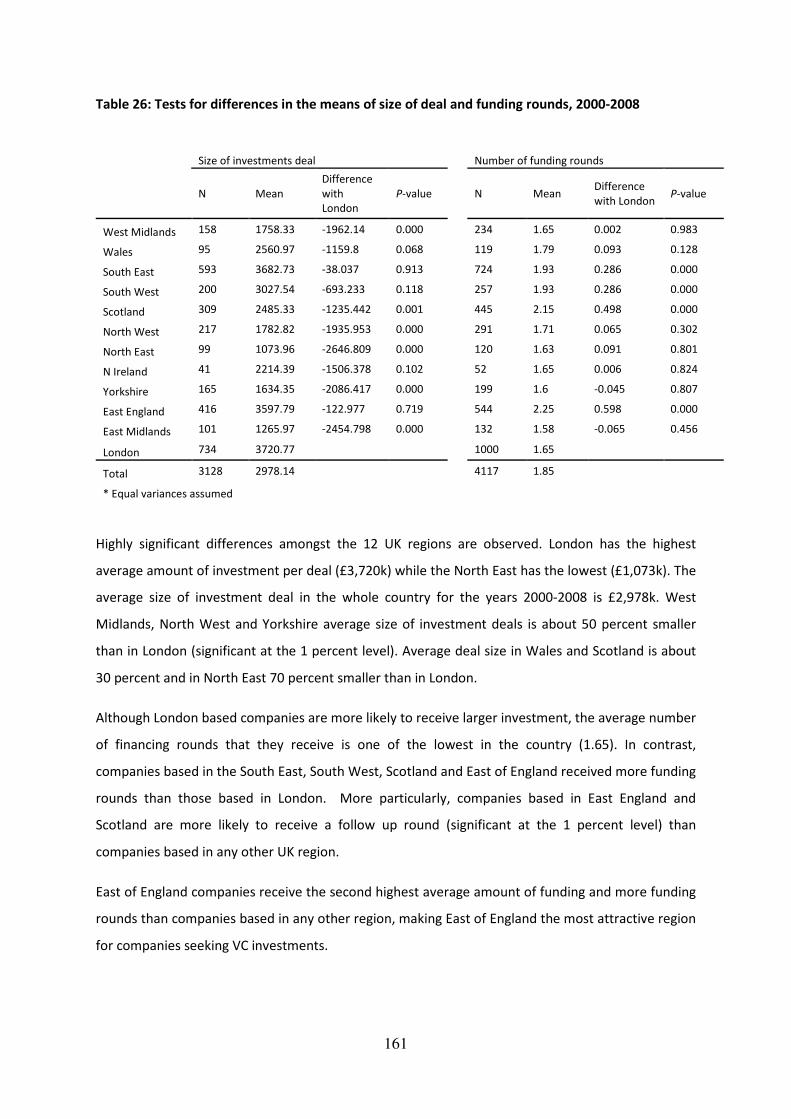
161
Table 26: Tests for differences in the means of size of deal and funding rounds, 2000-2008
Size of investments deal Number of funding rounds
N Mean
Difference
with
London
P-value
N Mean Difference
with London P-value
West Midlands 158 1758.33 -1962.14 0.000
234 1.65 0.002 0.983
Wales 95 2560.97 -1159.8 0.068
119 1.79 0.093 0.128
South East 593 3682.73 -38.037 0.913
724 1.93 0.286 0.000
South West 200 3027.54 -693.233 0.118
257 1.93 0.286 0.000
Scotland 309 2485.33 -1235.442 0.001
445 2.15 0.498 0.000
North West 217 1782.82 -1935.953 0.000
291 1.71 0.065 0.302
North East 99 1073.96 -2646.809 0.000
120 1.63 0.091 0.801
N Ireland 41 2214.39 -1506.378 0.102
52 1.65 0.006 0.824
Yorkshire 165 1634.35 -2086.417 0.000
199 1.6 -0.045 0.807
East England 416 3597.79 -122.977 0.719
544 2.25 0.598 0.000
East Midlands 101 1265.97 -2454.798 0.000
132 1.58 -0.065 0.456
London 734 3720.77
1000 1.65
Total 3128 2978.14
4117 1.85
* Equal variances assumed
Highly significant differences amongst the 12 UK regions are observed. London has the highest
average amount of investment per deal (£3,720k) while the North East has the lowest (£1,073k). The
average size of investment deal in the whole country for the years 2000-2008 is £2,978k. West
Midlands, North West and Yorkshire average size of investment deals is about 50 percent smaller
than in London (significant at the 1 percent level). Average deal size in Wales and Scotland is about
30 percent and in North East 70 percent smaller than in London.
Although London based companies are more likely to receive larger investment, the average number
of financing rounds that they receive is one of the lowest in the country (1.65). In contrast,
companies based in the South East, South West, Scotland and East of England received more funding
rounds than those based in London. More particularly, companies based in East England and
Scotland are more likely to receive a follow up round (significant at the 1 percent level) than
companies based in any other UK region.
East of England companies receive the second highest average amount of funding and more funding
rounds than companies based in any other region, making East of England the most attractive region
for companies seeking VC investments.

162
These findings show that the characteristics of the deals vary substantially between the UK regions.
Overall, the observed differences appear to document an edge of East of England, London and South
East investments deals over the remaining regions.
6.4.3 The relationship between patents and regions
Figure 30 examines the geography aspect by measuring the volume of patents for companies that
received VC investments at each particular region and shows that there are significant differences
amongst UK regions. Figure 29 illustrates the proportion (and the number) of VC investments that
were made to companies with and without patents for the period 2000-2008.
Figure 30: Proportion of investments that were made to companies with and without patents, 2000-2008
Over 60 percent of all VC deals that took place in the East of England were made to companies that
had one or more patents (or had applied for one) during 2000-2008. Over 50 percent of investments
that took place in Scotland and South West and over 40 percent of investments that took place in
East Midlands, South East and North West were made to similar companies. In contrast, only a small
proportion of investments were made to companies with patents that were located in London,
Northern Ireland, North East and Wales (approximately 30 percent) and even smaller proportion to
companies located in West Midland and Yorkshire (below 20 percent).
Approximately half of all VC backed companies located in Scotland and East Midlands have one or
more patents. In contrast, the vast majority of VC backed companies located in West Midlands,
Yorkshire and London do not have any patents. These findings are open to three interpretations:

163
First, it may suggest that venture capital funds allocated in those two regions do not consider
patents as a priority in investments decision making. Second, these regions do not contain a
sufficient pool of investable companies with patents or that companies in these regions operate in
industries that do not require patents. Third, it may also mean that companies in these regions
receive more follow up investments (i.e. a larger number of individual deals were made to the same
companies) and consequently, it appears that more investments are made to companies with
patents.
Table 27 presents the proportion of patents by different type of investments (private, public, co-
investment and solely public) broken down by region.
Table 27: Proportion of patents by region and source of finance
All deals
Private deals
Region Obs Mean Std.
Region Obs Mean Std.
East Midlands 132 0.48 0.50
East Midlands 61 0.52 0.50
East of England 544 0.66 0.48
East of England 429 0.66 0.47
London 1000 0.30 0.46
London 847 0.28 0.45
N Ireland 52 0.37 0.49
N Ireland 22 0.41 0.50
North East 120 0.29 0.46
North East 29 0.28 0.45
North West 291 0.43 0.50
North West 160 0.51 0.50
Scotland 445 0.56 0.50
Scotland 165 0.63 0.48
South East 724 0.45 0.50
South East 568 0.44 0.50
South West 257 0.52 0.50
South West 161 0.58 0.49
Wales 119 0.34 0.47
Wales 54 0.31 0.47
West Midlands 234 0.13 0.34
West Midlands 73 0.15 0.36
Yorkshire 199 0.17 0.38
Yorkshire 82 0.21 0.41
Public deals (deals involving one or more public
investments)
Co-investment deals (deals involving one or more
public investment and one or more private
investments)
Region Obs Mean Std.
Region Obs Mean Std.
East Midlands 71 0.44 0.50
East Midlands 32 0.63 0.49
East of England 115 0.63 0.48
East of England 57 0.70 0.46
London 153 0.41 0.49
London 85 0.54 0.50
N Ireland 30 0.33 0.48
N Ireland 24 0.29 0.46
North East 91 0.30 0.46
North East 49 0.33 0.47
North West 131 0.34 0.48
North West 49 0.39 0.49
Scotland 280 0.52 0.50
Scotland 245 0.53 0.50
South East 156 0.47 0.50
South East 89 0.62 0.49
South West 96 0.42 0.50
South West 51 0.53 0.50
Wales 65 0.35 0.48
Wales 29 0.45 0.51
West Midlands 161 0.12 0.33
West Midlands 59 0.17 0.38
Yorkshire 117 0.15 0.35
Yorkshire 46 0.20 0.40

164
Solely public deals (deals involving only investments
made by publicly backed funds)
Region Obs Mean Std.
East Midlands 39 0.28 0.46
East of England 58 0.55 0.50
London 68 0.24 0.43
N Ireland 6 0.50 0.55
North East 42 0.26 0.45
North West 82 0.30 0.46
Scotland 35 0.43 0.50
South East 67 0.28 0.45
South West 45 0.29 0.46
Wales 36 0.28 0.45
West Midlands 102 0.10 0.30
Yorkshire 71 0.11 0.32
6.4.4 The relationship between investment characteristics and regions
Figure 31 visually presents the relationship between VC investments made to companies with
patents (or companies that had applied for patents) and publicly backed investments. Regions with
high dependency on public investments such as the North East, West Midlands, Northern Ireland
and Wales, also have low proportion of VC investments made to companies with patents. In
contrast, regions with high level of VC investments to companies with patents such as East of
England, South West and South East, are less depended on publicly backed investments.

165
Figure 31: Source of finance and regions
At a first glance this visual illustration may indicate that publicly backed venture capital fund
investments could be related to the negative performance in terms of patents production from VC
backed companies of those regions. However, there may be other factors influencing the lower
performance of patent production in each region. These are: First, and foremost, the relationship
observed in the graph may be explained not because of the extensive public involvement but by the
domination of the early stage deals in these regions (which as shown earlier are not associated with
patents to the same extent as the later stage deals are). Second, publicly backed funds based in
these regions do not encourage companies to get a patent once invested. Third, companies in these
regions may be operating in sectors that do not require a patent and consequently the VC funds can
only choose amongst the companies without patents.
Is the difference between the observed proportions significantly large to indicate a genuine
difference in the ability between public and private funds to invest in companies with the potential
to innovate, or it could have arisen simply as a consequence of experimental variation when in fact
there is no underlying difference? In order to investigate all these issues a regression framework
analysis is conducted.
166
6.5 Regression analysis – Source of venture capital and potential
of firms to innovate
A substantial amount of research has been conducted into the question of what likely impact the VC
has in the innovation performance of a company (Gompers and Lerner 2001). However, little is
known about the potential impact that different types of VC finance (e.g. publicly backed VC funds
and Business Angel) have on innovation. In particular, do public funds and Business Angels invest in
companies that have the potential to innovate in the same extent as private funds do? Do they
perform better or worse compared with their private counterparts in identifying and investing in
such companies?
This section investigates whether there is an association between different types of investments
(publicly backed, private or Business Angel investments) and company patents. The analysis
examines a variety of factors that may affect the existence of patents (or patent applications) within
a company such as stage of development, industry operation and year of investment as shown
earlier.
In order to explore whether the relationships uncovered by visually examining the data in the
previous section, are statistically significant as well as not driven by other factors not captured in the
previous graphs, it is necessary to conduct a regression analysis. Several regression models have
been estimated to analyse the likely ability of publicly backed funds to spur innovation as expressed
by the existence of patents (or patent applications) while accounting for characteristics of the
investment deal, such as size and stage, and the industry.
As previously discussed, most existing empirical work emphasizes the poor financial performance of
the publicly backed funds (NAO 2009, NESTA and BVCA 2009). This section aims to address a new
question that has not received much attention in the literature, namely the potential role that
publicly backed investments play in spurring innovation.
6.5.1 The impact of different source of VC investments in company’s innovation
outputs: A multivariate sub-regional analysis
This section examines several factors that may affect the innovation performance of a firm using two
models of regression analysis, Ordinary Least Squares (OLS) and Probit regression. For the
subsequent analysis individual investments at the company level is used as the unit of analysis, that
is, each investment to a single company is treated as a separate observation. The analysis regresses
the presence of a patent in a company on a dummy for publicly backed fund involvement in the deal,

167
and control variables for industry specialisation, size, funding round and the geographical location of
the company.
6.5.2 Estimation technique
Multivariate statistical techniques, such as Probit regression analysis, enable the analysis to take
account of the complexity of the factors associated with the use of VC investments, and to
investigate the interrelationships between variables (see Johnson et al. 2007). The large size of the
database and the range of information collected allows such an analysis to be performed. In doing so
it is possible to build a picture of the type of VC investments that are most (and by implication least)
likely to spur or support innovation in the investee firm.
The models used are estimated through ordinary least squares and Probit regression analysis.
Because the outcome variable is binary (either the company has a patent or does not), it is necessary
to use a model that handles this feature correctly. Therefore the Probit regression model has been
chosen.
The individual firm operates in a sector which might have similar characteristics. An obvious
extension, therefore, would be to integrate sector heterogeneity in order to allow for a degree of
dependency within sectors and then to estimate the usual model parameters with sector effects
(Johnson et al. 2007). Therefore, the regression model is reconsidered in order to take into account
sectoral heterogeneity that may be attributable to the sector in which the firm is operating. Regional
dummies are also included in order to take into account regional variations. Previous analysis
identified that they are significant differences between sectors and regions in terms of the likelihood
of a VC backed company to have a patent. Companies operating in particular sector (e.g. finance
industry) are by definition less likely to create patents compared with other sectors (e.g.
pharmaceuticals). Therefore, it is important to ensure that the selected model controls for sector
effects in order to avoid drawing erroneous conclusions (Johnson et al. 2007).
6.5.3 Extending the analysis to incorporate cluster effects – firm level analysis
A possible limitation of the above analysis is that the OLS and Probit regressions implicitly assume
that each of the units of observation (investment deals) included in the sample is random. However,
this is not the case as firms normally attract more than one investment deal. A firm for example can
receive one investment from a solely public fund and another from a solely private fund or from a
syndication of public and private funds. The standard binary Probit model ignores any potential firm

168
unobserved heterogeneity. For example, in the case of firm level data, unobserved heterogeneity
could reflect management ability or strategy (Harris et al. 2003).
Therefore, the units of observation (investment deals) could be clustered according to firm, as
otherwise using standard Probit estimation may produce biased results. As the data in the database
were collected at the investment level, it is possible to cluster them according to the firm in which
these deals were made. The solution to this problem is to use a model in which the degree of
dependency within clusters is jointly estimated with the usual model parameters (Johnson et al.
2007). In order to estimate the model, maximum-likelihood estimator (Probit) that incorporates
clustering to control for heterogeneity has been used. The clustered estimates allow the analysis to
gauge the significance of the unobserved individual effects as well as the extent of the inconsistency
in the random estimates when the individual effect and some of the regressors are correlated
(Amuedo-Dorantes and Kimmel 2005).
The clustering of firms in this way might be a significant improvement over other types of estimation
and may control for the heterogeneity such as the difference in probability of a firm possessing or
applying for a patent to different firms in different sectors.
The data available contains an innovation status variable (0 = no patent, 1 = patent) that measures
whether the firm that received the investment has or has applied for a patent. This is a proxy for the
“potential” of the firm to innovate. Innovation potential (patent) is therefore the dependent
variable. The independent variables are two types of investments: public and private. London is the
omitted category from the set of UK region dummies.
Table 28: OLS and Probit estimates of factors affecting patents creation – Public investments
Dependent variable: Patent
(1) (2) (3) (4)
(5) (6) (7) (8) (9)
Dummies for different
type of investments:
(comparison category is
investment made by
private funds)
OLS
Probit
Marginal
effects in
probability
Public investments -0.052 -0.025 0.006 -0.020
-0.135 -0.066 0.016 -0.074 -0.028
(3.26)** (1.00) (0.23) (0.76)
(3.25)** (0.98) (0.21) (0.90) -1.17
Business Angel
Investments 0.062 0.051 0.035 0.027
0.158 0.133 0.098 0.082 0.032
(2.95)** (1.87) (1.35) (1.04)
(2.98)** (1.88) (1.36) (1.00) 1.16
Size of deal
0.000 0.000 0.000
0.000 0.000 0.000 0.071
(1.52) (1.49) (1.24)
(1.45) (1.47) (1.20) (7.54)***
Number of round
0.085 0.074 0.056
0.226 0.208 0.181 0.001
(9.37)** (6.85)** (5.14)**
(8.23)** (6.23)** (4.89)** 1.57
Regional dummies
West Midlands
-0.187 -0.244
-0.639 -0.891 -0.294

169
(3.51)** (4.57)**
(2.99)** (3.88)** -8.21
Wales
0.055 0.004
0.149 0.016 0.006
(0.70) (0.05)
(0.70) (0.06) 0.1
South East
0.095 -0.034
0.254 -0.133 -0.051
(2.31)* (0.70)
(2.31)* (0.92) -1.44
South West
0.210 0.104
0.559 0.286 0.113
(3.66)** (1.92)
(3.64)** (1.74) (2.52)**
Scotland
0.228 0.130
0.605 0.377 0.149
(4.70)** (2.71)**
(4.60)** (2.60)** (3.86)***
North West
0.091 0.045
0.250 0.138 0.054
(1.57) (0.89)
(1.63) (0.89) 1.25
North East
0.003 -0.086
0.015 -0.291 -0.11
(0.04) (1.14)
(0.07) (1.22) (-1.97)**
N Ireland
0.013 -0.057
0.038 -0.163 -0.062
(0.11) (0.54)
(0.12) (0.51) -0.76
Yorkshire
-0.149 -0.264
-0.487 -0.914 -0.3
(2.84)** (4.96)**
(2.56)* (4.42)** (-8.89)***
East England
0.300 0.144
0.791 0.397 0.157
(6.57)** (3.20)**
(6.12)** (2.85)** (4.55)***
East Midlands
0.189 0.083
0.507 0.226 0.089
(2.64)** (1.36)
(2.71)** (1.21) 1.46
Industry dummies
Energy
0.510
1.561 0.493
(5.52)**
(4.95)** (12.51)***
Finance
0.042
0.198 0.078
(0.46)
(0.58) 0.68
Healthcare
0.389
1.212 0.433
(7.08)**
(6.59)** (12.39)***
ICT
0.416
1.276 0.469
(9.72)**
(8.09)** (14.52)***
Leisure Goods
0.143
0.365 0.144
(0.95)
(0.59) 0.82
Manufacturing & Industrial
0.395
1.248 0.444
(7.54)**
(6.95)** (13.27)***
Media
0.004
-0.029 -0.011
(0.07)
(0.10) -0.16
Pharmaceuticals & Biotechnology
0.481
1.480 0.515
(10.44)**
(8.68)** (18.03)***
Software & Computer Services
0.102
0.381 0.15
(2.74)**
(2.56)* 3.74
Year fixed effects No No Yes Yes No No Yes Yes
Constant 0.424 0.267 0.168 0.061
-0.192 -0.608 -0.901 -1.363
(42.41)** (11.87)** (4.38)** (1.46)
(7.52)** (9.65)** (8.01)** (8.44)**
Observations 4117 3173 3173 2857
4117 3173 3173 2852
R-squared 0.00 0.05 0.13 0.26
Robust t statistics in parentheses

170
* significant at 10%, ** significant at 5%, 1% significant
Reference region is London, and reference industry Consumer and Business
Table 28 presents the results from the ordinary least squares and clustered Probit estimations. The
dependent variable in both types of regression is whether the company has a patent or has applied
for a patent, and the independent variables in both type of regressions is investments made by
public funds. The table contains the results from the two preliminary models. Models 1-4 produce
OLS estimates while Modes 4-8 Probit estimates.
Columns (1) and (5) provide significant coefficients for the independent variables (although quite
small). When controlling for the size of the deal and the number of the round of the deal (Columns 2
and 6) the coefficients are no longer significant. Similarly when dummies for the industry and the
region (Columns 3, 4, 7 and 8) are added, the coefficients continue to be insignificant. As a result,
after controlling for the size and round of the investment, sector and region, the initial results
suggest that the type of finance (public or private) may not be associated with the company’s
potential to innovate. However, there may be another interpretation of these results: the publicly
backed funds may play a passive role in the investment syndication and it is the private funds that
are responsible for picking companies with potential to innovate and public funds just follow. In
order to investigate this issue further, all publicly backed investments are separated into two groups,
solely public investments and co-investments (between private and public funds).
The independent variables are now three types of investments: Investments solely made by publicly
backed funds (Solely Public); investments made by solely Private Funds (Solely Private); and,
investments in which one or more in which one or more private sector investors has invested
alongside one or more public sector funds (Co-investments). Solely Public, Co-investments and
Business Angels take the value 1 if they participated in the deal in question and 0 otherwise.

171
Table 29: OLS and Probit estimates of factors affecting patents creation – Solely public
investments and co-investments
Dependent variable:
Patent
(1) (2) (3) (4) (5) (6) (7) (8) (9)
Dummies for different
type of investments:
(comparison category is
investment made by
private funds)
OLS Probit
Marginal
effects in
probability
Solely public
investments -0.167 -0.143 -0.097 -0.103 -0.456 -0.395 -0.295 -0.352 -0.134
(8.33)*** (4.57)*** (3.03)*** (3.13)*** (7.78)*** (4.37)*** (3.04)*** (3.15)*** (3.15)***
Co-investments 0.045 0.064 0.084 0.047 0.114 0.166 0.236 0.137 0.054
(2.14)** (2.13)** (2.80)*** (1.61)* (2.15)** (2.14)** (2.84)*** (1.51)* (1.51)*
Business Angel
investments 0.005 -0.004 -0.010 -0.012 0.012 -0.009 -0.027 -0.037 -0.015
(0.21) (0.13) (0.37) (0.44) (0.21) (0.12) (0.36) (0.44) (0.44)
Size of deal 0.000 0.000 0.000 0.000 0.000 0.000 0.000
(1.28) (1.32) (1.09) (1.21) (1.31) (1.04) (1.04)
Number of round 0.082 0.072 0.054 0.219 0.202 0.177 0.069
(9.16)*** (6.75)*** (5.07)*** (8.07)*** (6.14)*** (4.83)*** (4.83)***
Regional dummies
West Midlands -0.174 -0.233 -0.607 -0.856 -0.285
(3.25)*** (4.35)*** (2.79)*** (3.70)*** (3.70)***
Wales 0.062 0.011 0.178 0.035 0.014
(0.80) (0.14) (0.84) (0.15) (0.15)
South East 0.094 -0.034 0.254 -0.134 -0.052
(2.32)** (0.70) (2.31)** (0.93) (0.93)
South West 0.210 0.105 0.561 0.288 0.114
(3.66)*** (1.94)* (3.63)*** (1.75)* (1.75)*
Scotland 0.206 0.113 0.546 0.324 0.128
(4.24)*** (2.35)** (4.14)*** (2.23)** (2.23)**
North West 0.105 0.057 0.294 0.179 0.071
(1.86)* (1.15) (1.94)* (1.15) (1.15)
North East 0.005 -0.084 0.023 -0.283 -0.107
(0.06) (1.11) (0.11) (1.18) (1.18)
N Ireland -0.022 -0.085 -0.059 -0.251 -0.095
(0.20) (0.81) (0.19) (0.78) (0.78)
Yorkshire -0.132 -0.249 -0.450 -0.878 -0.291
(2.55)*** (4.73)*** (2.37)** (4.26)*** (4.26)***
East England 0.302 0.147 0.805 0.411 0.163
(6.65)*** (3.28)*** (6.20)*** (2.94)*** (2.94)***
East Midlands 0.199 0.092 0.543 0.261 0.104
(2.85)*** (1.56) (2.92)*** (1.42) (1.42)
Industry dummies
Energy 0.504 1.542 0.491
(5.51)*** (4.91)*** (4.91)***
Finance 0.039 0.189 0.075
(0.42) (0.55) (0.55)
Healthcare 0.388 1.206 0.432
(7.13)*** (6.53)*** (6.53)***
ICT 0.416 1.273 0.468
(9.76)*** (8.08)*** (8.08)***
Leisure Goods 0.137 0.344 0.136
(0.92) (0.56) (0.56)
Manufacturing &
Industrial 0.393 1.236 0.442
(7.49)*** (6.84)*** (6.84)***
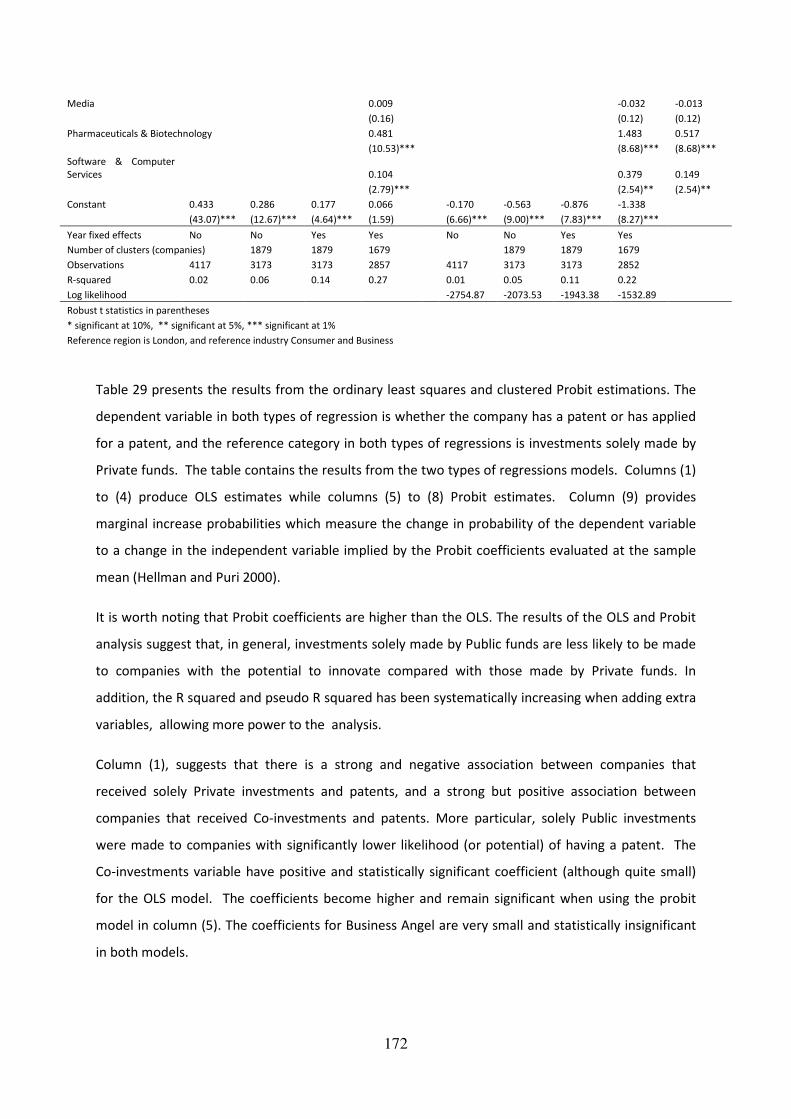
172
Media 0.009 -0.032 -0.013
(0.16) (0.12) (0.12)
Pharmaceuticals & Biotechnology 0.481 1.483 0.517
(10.53)*** (8.68)*** (8.68)***
Software & Computer
Services 0.104 0.379 0.149
(2.79)*** (2.54)** (2.54)**
Constant 0.433 0.286 0.177 0.066 -0.170 -0.563 -0.876 -1.338
(43.07)*** (12.67)*** (4.64)*** (1.59) (6.66)*** (9.00)*** (7.83)*** (8.27)***
Year fixed effects No No Yes Yes No No Yes Yes
Number of clusters (companies) 1879 1879 1679 1879 1879 1679
Observations 4117 3173 3173 2857 4117 3173 3173 2852
R-squared 0.02 0.06 0.14 0.27 0.01 0.05 0.11 0.22
Log likelihood -2754.87 -2073.53 -1943.38 -1532.89
Robust t statistics in parentheses
* significant at 10%, ** significant at 5%, *** significant at 1%
Reference region is London, and reference industry Consumer and Business
Table 29 presents the results from the ordinary least squares and clustered Probit estimations. The
dependent variable in both types of regression is whether the company has a patent or has applied
for a patent, and the reference category in both types of regressions is investments solely made by
Private funds. The table contains the results from the two types of regressions models. Columns (1)
to (4) produce OLS estimates while columns (5) to (8) Probit estimates. Column (9) provides
marginal increase probabilities which measure the change in probability of the dependent variable
to a change in the independent variable implied by the Probit coefficients evaluated at the sample
mean (Hellman and Puri 2000).
It is worth noting that Probit coefficients are higher than the OLS. The results of the OLS and Probit
analysis suggest that, in general, investments solely made by Public funds are less likely to be made
to companies with the potential to innovate compared with those made by Private funds. In
addition, the R squared and pseudo R squared has been systematically increasing when adding extra
variables, allowing more power to the analysis.
Column (1), suggests that there is a strong and negative association between companies that
received solely Private investments and patents, and a strong but positive association between
companies that received Co-investments and patents. More particular, solely Public investments
were made to companies with significantly lower likelihood (or potential) of having a patent. The
Co-investments variable have positive and statistically significant coefficient (although quite small)
for the OLS model. The coefficients become higher and remain significant when using the probit
model in column (5). The coefficients for Business Angel are very small and statistically insignificant
in both models.

173
Columns (2) and (6) include two investment-specific controls which is the number of the round when
the investment took place and the size of the investment. The main results described above are not
affected by the inclusion of these controls. The coefficient for the number of the round is positive
and significant reflecting the fact observed earlier that later stage rounds are more likely to happen
in companies with patents. Interestingly, the direct effect of the size of the investment is not
significant indicating that it has no effect on the likelihood of a company having a patent.
Columns (3) and (7) include dummies for the region in which the company operates. The
coefficients remain remarkably stable. There is strong evidence of regional effect suggesting that
the location of the firm is important. The geographical location of the companies is significantly
associated with patents in several regions.
Columns (4) and (8) include dummies for the industry that the company operates in. The results
remain unchanged and highlight the importance of the influence of sectoral heterogeneity in
assessing the factors associated with the innovation performance of a firm.
It is worth noting that the reported results have a relatively low explanatory power. This is not
surprising (see Mann and Sager 2007), since venture capital backed firms might perform well or
poorly for reasons that have nothing to do with patents.
‘’it is important to take account of the low explanatory power in trying to understand what the data
suggest about the real world of investment decision making and venture-backed firm performance‘’
(Mann and Sager 2007, p.200).
Overall, the results suggest that solely Public investments are strongly and negatively associated
with the potential of a firm to have a patent. The marginal effect in the likelihood is -13.4 percent,
which is significant at 1 percent (see Column 9). This suggests that obtaining solely Public
investment is associated with a significant decrease in the likelihood of company to have a patent or
to have applied for one. In contrast, obtaining Co-investments is associate with an increase in the
likelihood of the company to have a patent (5.4 percent) compared with those that receive
investment from Private funds. It appears that the likely effect of the type of VC finance increases
with respect to the existence of patent (or patent application), suggesting that companies that
receive investments from a syndicate of public and private funds hold or produce more patents than
companies that receive investments from solely publicly backed funds. This is in line with prior
literature which suggest that enterprises with moderate government venture capital support,
outperform enterprises with only private venture capital support and those with extensive
government venture capital support in terms of patent creation (Brander et al. 2010).

174
The results of this analysis suggest a strong association between the source of VC finance of the firm
and the innovation potential of the firm. These results provide valuable guidance to public policy
makers concerned with venture capital investments and innovation, and suggest a number of
avenues for future research.
6.5.4 Additional tests
One of the caveats of this research is that the database only includes investments made to UK firms
between 2000-2008. This means that the database contains some firms that receive only one
investment during this period, either because this investment was the last one (and took place for
example in 2000 or the first one and took place in 2008). Similarly, other firms received only two
investments during this period. In order to control for this effect, an additional analysis (not reported
here) has been performed with a restricted sample of companies with more than three investments.
Companies were grouped according to the type of the majority of the investments they received:
solely publicly supported companies, syndication support companies and solely privately supported
companies. Four hundred companies where identified using this methodology. The regression
analysis confirmed the findings from the above analysis.
All the investments have been also partitioned into first round investments which include only
companies that received first round investment but no follow up investments. 676 companies were
identified using this methodology. This sample allows one to observe whether the company had a
patent (or had applied for one) at the time of its first investment. For this purposes, a new variable
was created which is a dummy and which takes the value 1 when a company received only one
investment and this was the first round investment, and the value 0 otherwise. The results of this
analysis (not reported here) also confirm the findings from the previous analysis.
6.5.5 Summary results
The results consistently indicate that there is a strong and negative association between companies
that received Solely Public investments and patents, and a strong but positive association between
companies that received Co-investments and patents.
This is in line with Hochberg et al. (2007)’s comment on the importance of investment syndication:
“syndication relationships are a natural starting point not only because they are easy to observe, but
also because there are good reasons to believe they affect the two main drivers of VC’s performance,

175
namely, the ability to source high-quality deal flow and the ability to nurture investments (i.e. add
value to portfolio companies)‘’ (Hochberg et al. 2007, p. 252).
This could also provide some explanation on the negative relation between solely public funds
investments and patents, due to the fact that such funds quite often do not invest in syndicate and
therefore miss out the added value that a syndicate brings into the deal.
These findings support the hypotheses that were set out drawing on the likely relationship between
the different source of VC finance and the company’s innovation potential and suggesting that ‘’the
potential of a company to innovate (expressed as the ability of a company to acquire a patent) is
associated with the source of VC finance (public or private).’’ To summarize the results, first, a
company is more likely to keep receiving VC finance if it has a paten (or it has applied for one).
Second, if a company does not have a patent, it is more likely to get later stage finance from public
rather than from private funds.
There are several interpretations of the results of this analysis that can only be explained by
additional analysis. For example, the positive relationship between co-investment and patents could
be potentially explained by the fact that venture capitalists that take part in a syndicated deal
between public and private funds receive more deal proposals from patent oriented sources
(universities, research institutes or laboratories). To investigate all these possible explanations a
survey of venture capital professionals from the public and private sector operating in early stage VC
industry has been conducted. The following chapter presents the findings of the survey and revisits
the findings of the empirical analysis to cross-check previous findings.
6.6 Conclusions
This chapter aimed to test three different hypotheses. Hypothesis one was concerned with the
relationship between VC activity and volume of innovation. More particularly, the analysis aimed to
examine whether increases in venture capital activity, expressed as number of deals or invested
amounts, is positively associated with increases in volume of innovation, expresses as number of
patent application and business R&D expenditure.
A strong and positive relationship between VC activity and volume of innovation is observed in
cross-sectional data analysis. VC invested amounts and the number of companies receiving VC
finance is closely related to patents creation and business R&D expenditure. Unlike the cross-
sectional data analysis, the results of the time series data analysis is less clear. The graphical analysis
shows a relationship between VC investments and innovation as expressed by number of patent

176
applications and Business R&D expenditure, but this relationship is not always positive or strong. To
investigate this relationship further and to quantify the effect of VC on volume of innovation, a
regression framework analysis is deployed. The results of this analysis reinforce previous
suggestions that there is a strong relationship between venture capital and innovation.
The second hypothesis of this chapter posited that companies with patents are more likely to secure
follow up VC finance compared with companies without patents. To test the previous hypothesis,
the country or region was the unit of analysis. To test hypothesis two it was necessary to deploy a
different level of analysis which allowed for the investigation of such a hypothesis in great detail: the
firm level analysis.
An important finding of this analysis, which is in line with the literature and with the findings of
hypotheses one and two, is that there is a clear relationship between VC and patents. Companies
that have one or more patents (or patent applications) are more likely to receive follow up
investments compared with companies without patents. As the funding progresses to sequence
rounds, companies with patents are more likely to proceed to follow up investments (subject to
noted caveats).
Due to the importance of patents in the VC investments, the analysis examined whether there are
any factors that may affect the company’s possession of a patent, such as where the company is
located, industry operation, source of VC finance, amounts received and stage of finance. The results
of this analysis show that there are significant variations between companies that operate in
different industries. Several industries have significant higher number of patents. For instance, VC
backed companies from the Pharmaceutical and Biotechnology sector are more likely to have a
patent compared with other sectors. Similarly, companies operating in Technology Hardware and
Equipment, Electronic & Electrical Equipment, Mobile Technology, Healthcare Equipment and
Services sector are more likely to have a patent. In contrast, Software & Computer Services, Media,
Support Services, General Retailers, General Financial and Travel & Leisure companies are less likely
to have a patent at the time of investment.
The geography aspect and the volume of patents for companies that received VC investments in
each particular region has also been examined and showed that there are significant differences
amongst UK regions. More particularly, over sixty percent of all VC deals that took place in East of
England were made to companies that had one or more patents during 2000-2008. Over 50 percent
of Investments that took place in Scotland and the South West were made to companies with
patents while over 40 percent of investments that took place in the East Midlands, the South East

177
and the North West were made to companies with patents. In contrast, only a small proportion of
investments were made to companies with patents that were located in London, Northern Ireland,
North East and Wales (approximately 30 percent) and an even smaller proportion to companies
located in the West Midlands and Yorkshire (below 20 percent). This finding may suggest that either
venture capital funds allocated in those two regions do not consider patents as a priority in
investments decision making or that these regions do not contain a pool of sufficient pool of
investable companies with patents or that companies in these regions operate in industries that do
not require patents.
The findings of this chapter posited that the potential of a firm to innovate (expressed as the ability
of a firm to acquire a patent) is associated with the source of VC finance (public or private). By
identifying the source of finance from each VC funds that participated in the 4117 deals of the
sample database it was possible to examine the relationship between source of VC finance and
innovation performance of the firm. The results of this analysis show that there is a statistically
significant relationship between patents and the source of finance. This raises two questions: why
this may be the case and why does it matter?
This statistically significant and negative association between solely publicly backed investments
and the firm’s potential to innovate remains strong, even after controlling for a variety of factors
associated with sectoral structures or investments characteristics: differences between regions,
industry focus, investments size or investments stage. This suggests that this relationship is the
result of some unmeasured investment characteristics or the environment in which funds operate.
The plausibility of this suggestion will be examined in the next chapter.
The analysis in chapter 5 illustrated that there are currently two distinctive VC markets in the UK
regions, a privately driven market and a publicly driven one. The findings of this chapter suggest
that publicly backed funds do not support innovation to the same extent that private funds do, when
they invest alone, which has important implications for regional development. Innovative companies
that are based in regions with high dependency on public VC funds may find it more difficult to raise
VC finance compared with similar companies based in regions with a strong presence of private VC
funds. As a result, such companies may decide to relocate to regions with active private VC markets.
However, Mason (2007) suggests that companies move to what is called ‘convergence’ regions in
order to benefit from European funding.
The alternative explanation for the negative relationship between solely publicly backed investments
and companies with the potential to innovate suggests that this is due to the lack of innovative

178
companies in the region. However, this does not seem plausible. Private investments are more likely
to be made to companies with the potential to innovate compared with solely public investments
even in the regions with relatively low innovation capacity. For example, in the East Midlands, 52
percent of all private VC investments were made to companies with the potential to innovate and
only 28 percent of solely public investments were made to similar companies. Again, this difference
is not driven by the industry focus, size or stage of the investments.
There is also the possibility that savvy entrepreneurs positively discriminate in favour of private
sector investors when making their choice of financial partner (NESTA 2009) and as a result, the
pool of business from which public funds choose to invest is much smaller and of questionable
calibre. It would be expected that this could be the case in regions where the private sector funds
have substantial presence e.g. London, East of England and South East.
On the other hand, co-investments (when public and private funds invest together) are more likely
to be made to companies with the potential to innovate than private or solely public investments. As
a result, regions with proportionally higher volume of co-investments would also demonstrate a
higher volume of VC backed companies with the potential to innovate. From a policy perspective,
this finding suggests that from an innovation point of view, public free standing investments should
be minimised while co-investments should be further encouraged.
In that respect, when a region is dominated by publicly backed funds, it would be hard for these
funds to find co-investors from the private sector and therefore the amount of co-investments
would be limited. Alternatively, public funds in publicly dominated regions should be encouraged to
attract private investments from outside investors. They should be seen as the pipeline of valuable
information about investable opportunities in peripheral regions to London and South East based
private VC funds.
The following chapter examines the environment in which the two distinctive VC communities
operate. It identifies characteristics associated with the operational framework of public and private
VC funds that may be related to their ability to identify, invest and support companies with the
potential to innovate.

179
7 CHAPTER 7: EXAMINING THE ECOLOGY OF INTERACTION
BETWEEN THE INNOVATION AND FINANCE COMMUNITIES
7.1 Introduction
Chapter 7 examines the role of the venture capital community in embracing regional linkages and
networks within the regional innovation system. It empirically maps the linkages and examines the
extent of interaction between venture capitalists with other professionals of the regional innovation
system. More particularly, this chapter studies the ecology of interaction between venture capital
funds and other players of the innovation system by examining the responses to a survey completed
by 50 UK based early stage venture capitalists. It measures the rate of interactions and explores
their professional network of contacts in an attempt to understand the different regional
environments in which venture capital funds operate. By examining the dynamics of the regional
environment, the attitudinal and behavioural characteristics of the different types of venture capital
funds (public or private) it is possible to provide some preliminary clues as to the factors that may
influence the ability of different types of VC funds to identify and invest in companies with the
potential to innovate, as identified in the previous chapter.
Chapter5 provided a detailed analysis of the regional breakdown of the size and the nature of the
venture capital activity in the UK, showing that there are significant differences amongst UK regions
in terms of size, activity and public involvement in the early stage VC industry. The majority of the
regions are dependent on public support while few regions are dominated by private VC investments
(London, East of England and South East). Chapter 6 illustrated that there is a close relationship
between venture capital activity and innovation. It provided empirical evidence which suggests that
the nature of the venture capital community is closely associated with the potential of the firm to
innovate by showing that when investing alone, publicly backed funds are less likely to invest in
companies with the potential to innovate compared with the private venture capital funds. In
contrast, when investing in a syndication deal with private funds, they are more likely to invest in
companies with potential to innovate compared with the private venture capital funds.
The subsequent analysis attempts to explain what may drive these observed differences in the
ability of the VC funds to invest in companies with the potential to innovate, by examining the
behavioural characteristics of the different types of venture capital funds. More particularly, it
investigates the ecology of interactions between the venture capital community and other players of

180
the regional innovation community and examines whether the nature of the fund has any potential
affect in their frequency of interactions and overall behaviour. It is well documented by various
scholars that a necessary element for effective innovation systems is the interaction and networking
between the various players of the system and almost by definition, maintaining strong ties requires
frequent interaction (Sorenson and Stuart 2001). This chapter addresses the question as to whether
the venture capital community follows this pattern and how it fits within the innovation system.
The empirical basis of this chapter is the completed questionnaires of 50 UK early stage venture
capitalists. An extensive analysis of the questionnaire including descriptive statistics and bias
controls can be found in chapter 4 , Research Methodology.
The type of interactions between venture capitalists and other players in the innovation system have
been grouped into two categories. One category focuses on the interactions of the venture
capitalists within the internal finance community which includes, portfolio firms, firms seeking
equity finance, public and private venture capital funds, business angel networks and individuals and
banks. The second category of indicators examines the interactions between the venture capitalists
with other players of the regional innovation system, such as universities, other research institutes,
RDAs, regional authorities, specialists, law companies, IP bodies, managers of incubators, companies
based on incubators.
The first aim of this study is to measure how often UK venture capitalists interact with other players
of the regional innovation system. Since the focus of the study is the early stage VC activity, the
attention of this chapter is limited to those venture capitalists which engage in early stage financing
of a technology and innovative start-ups. Given the nature the industry, it is expected that venture
capitalists interact with each other more often that they do with the main players of the regional
innovation system i.e. Universities, R&D institutes, RDAs, incubators etc.
Because both the pre-investment activities (opportunity identification and appraisal) and the post-
investment roles (monitoring and the provision of value-added services) favour local investing
(reference), it is anticipated that there will be stronger linkages and interactions with actors within
the region in which the funds are based.
The second aim of this chapter is to investigate what parameters may influence the extent of such
interaction. This will in turn inform Hypothesis 4 of this thesis: It is expected that there will be
differences in the way that venture capitalists interact depending on the nature of their funds and
their size. There is a belief that publicly backed venture capitalists would be keener to engage with
the regional innovation community than the private venture capitalists, mainly due to their linkages

181
with their funding bodies (e.g. Government, RDAs, Universities etc.). Therefore the hypothesis is that
professionals from publicly backed funds have established active communication and networking
with several local incubators, Business Angel networks, and universities, and they appear to be more
active than their counterparts from the private sector (Hypothesis 4).
The analysis presented in this chapter establishes a series of findings that contribute to the literature
in economic geography. Its findings have implication for regional economic development policies as
venture capital firms and Business Angels now play an important role in the UK economy. The
venture capital industry plays an important role in the UK economy and the individual regions as
examined in previous chapters. It is therefore necessary that policy makers acquire detailed
knowledge of the functionality of the market.
7.2 Descriptive statistics
Following the analysis in the previous chapter, all funds that took part in the survey have been
grouped into three categories, according to proportion of public money that they received. One
group includes funds that received more than 50 percent of their assets from public bodies (solely
public funds), second group, funds that receive between 1- 49 percent of their assets from public
bodies (co-investment funds) and finally a third group which includes funds that are solely private
and did not receive any finance from a public organisation (solely private funds).
7.2.1 Source of funds
The proportion of public money that each VC fund receives varies according to the particular
government intervention. Fifty two percent of the venture capitalists that took part in the survey
worked for a fund which received the majority of its assets from a public organisation (Regional
development agency, European Union, University, Government department, Devolved
administration, Regional authority), (Table 30). Thirty two percent of the venture capitalists worked
in a co-investment fund (when a minority of the assets came from the public sector) and the
remaining 16 percent of them were employed by a solely private VC fund.
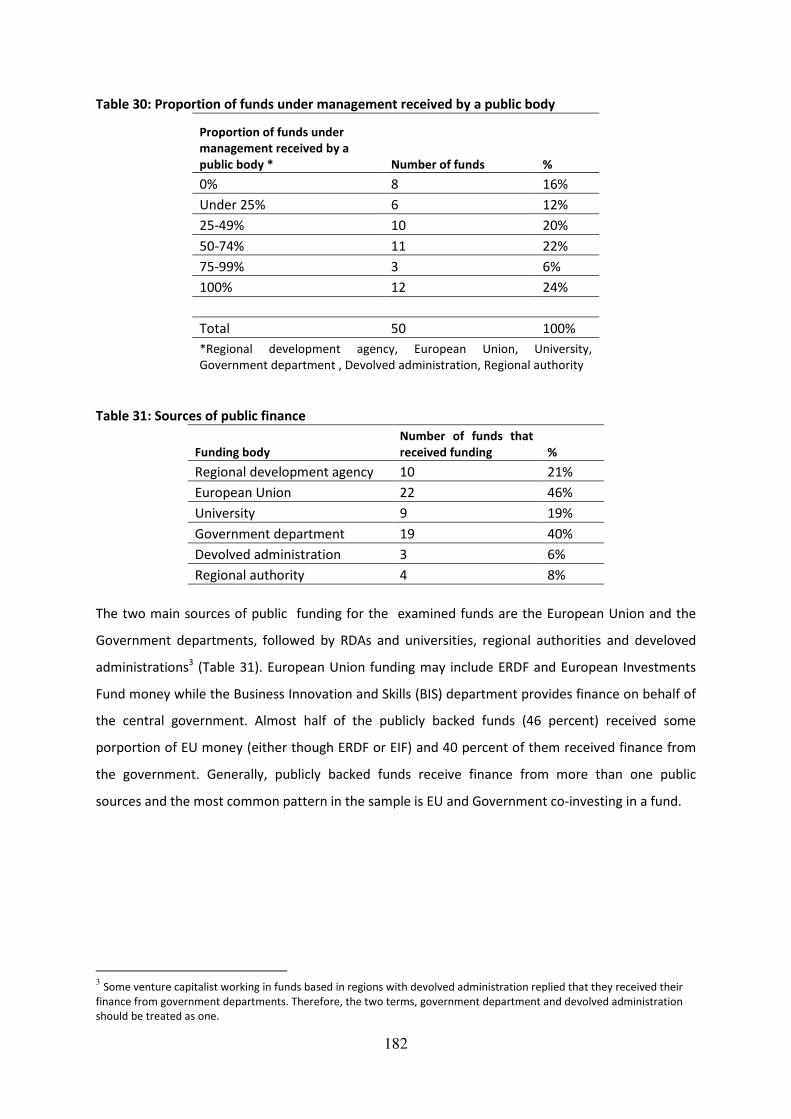
182
Table 30: Proportion of funds under management received by a public body
Proportion of funds under
management received by a
public body * Number of funds %
0% 8 16%
Under 25% 6 12%
25-49% 10 20%
50-74% 11 22%
75-99% 3 6%
100% 12 24%
Total 50 100%
*Regional development agency, European Union, University,
Government department , Devolved administration, Regional authority
Table 31: Sources of public finance
Funding body
Number of funds that
received funding %
Regional development agency 10 21%
European Union 22 46%
University 9 19%
Government department 19 40%
Devolved administration 3 6%
Regional authority 4 8%
The two main sources of public funding for the examined funds are the European Union and the
Government departments, followed by RDAs and universities, regional authorities and develoved
administrations3 (Table 31). European Union funding may include ERDF and European Investments
Fund money while the Business Innovation and Skills (BIS) department provides finance on behalf of
the central government. Almost half of the publicly backed funds (46 percent) received some
porportion of EU money (either though ERDF or EIF) and 40 percent of them received finance from
the government. Generally, publicly backed funds receive finance from more than one public
sources and the most common pattern in the sample is EU and Government co-investing in a fund.
3 Some venture capitalist working in funds based in regions with devolved administration replied that they received their
finance from government departments. Therefore, the two terms, government department and devolved administration
should be treated as one.

183
7.2.2 Fund characteristics
Table 32: Fund size, portfolio companies revenue and co-investments
All funds Public funds
Variable Obs Mean Std. Dev. Min Max Variable Obs Mean Std. Dev. Max
Fund size 50 4.82 2.69 0 8 Fund size 26 4.12 2.44 0 8
Proportion of
portfolio companies
generating revenue 45 39.62 29.52 0 100
Proportion of
portfolio companies
generating revenue 23 39.91 30.17 0 100
Proportion of co-
investments 45 74.67 28.11 0 100
Proportion of co-
investments 24 79.38 31.11 0 100
Invested alongside*: Invested alongside:
Private funds 50 3.08 1.74 0 5 Private funds 26 2.88 1.66 0 5
Public funds 50 1.14 1.32 0 5 Public funds 26 1.42 1.42 0 5
Bank loans 50 0.78 1.17 0 4 Bank loans 26 0.96 1.31 0 4
Loan funds 50 0.26 0.56 0 3 Loan funds 26 0.35 0.69 0 3
R&D grant 50 0.88 1.15 0 5 R&D grant 26 0.81 1.06 0 3
Co-investment funds Private funds
Variable Obs Mean Std. Dev. Min Max Variable Obs Mean Std. Dev. Min Max
Fund size 16 5.44 2.85 0 8 Fund size 8 5.88 2.80 1 8
Proportion of
portfolio companies
generating revenue 14 40.36 30.60 10 100
Proportion of
portfolio companies
generating revenue 7 32.14 27.36 0 75
Proportion of co-
investments 13 62.31 24.12 20 100
Proportion of co-
investments 7 78.57 20.35 50 100
Invested alongside: Invested alongside:
Private funds 16 3.06 1.95 0 5 Private funds 8 3.63 1.85 0 5
Public funds 16 0.75 1.24 0 4 Public funds 8 0.88 1.13 0 3
Bank loans 16 0.75 1.13 0 3 Bank loans 8 0.25 0.46 0 1
Loan funds 16 0.13 0.34 0 1 Loan funds 8 0.25 0.46 0 1
R&D grant 16 1.06 1.44 0 5 R&D grant 8 0.75 0.89 0 2
*1=<20%; 2=21-40%; 3=41-60%; 4=61-80% and 5=81-100%
Fund size. The fund size variable is a categorical variable which takes values from 1 to 8 as follows:
1= <£5m, 2= £6m-£10m; 3= £11m- £20m; 4= £21m - £30m; 5= £31m - £40m; 6= £41m - £50m; 7=
£51m - £100m; 8= >£100m. The average value of the fund size variable of the whole sample is close
to 5 (4.82), between £31m-£40m. Public funds are much smaller than both co-investment and
private funds.
Proportion of companies. This particular segment of the investments market that the study
investigates - as highlighted in the research methodology chapter - is mainly concerned with
companies at a very early stage of their development that do not normally generate revenue from
sales at the time of the investment. This is also evident in Table 32. Only around forty percent of all

184
portfolio companies generate any revenue and in the case of portfolio companies from private
funds, this proportion is even lower (32%), perhaps reflecting the greater risks that private venture
capitalists are willing to take (Table 32: private funds). This results is not surprising. Companies
seeking risk finance at this level, do not normally have revenues yet and entail high risk. At later
stages of the VC industry, companies generate reveunes and therefore lower the risk of investments
for the venture capitalists.
Proportion of co-investments and company revenue .As shown in chapter 5, co-investments is now
the dominant way of investing in this segment of the market. Venture capitalists were asked to
indicate the proportion of their investments that have been made together with other bodies. On
average, seventy five percent of all deals that venture capitalists make are co-investment deals.
Public and private funds have higher proportion of co-investment deals compared with the co-
investment funds.
Preferred co-investors. Venture capitalists were also asked to state the proportion of their co-
investments made with one or more of the following bodies (private funds, publicly backed funds,
bank loans, fund loans and R&D grant). Their responses are analysed below.
Table 33: Preferred co-investor
Proportion of
investments
0%-
20%
21%-
40%
41%-
60%
61%-
80%
81%-
100% Total
Private VC fund 8 17% 6 13% 8 17% 9 19% 16 34% 47 98%
Public (publicly
backed) VC fund 16 52% 4 13% 7 23% 2 6% 2 6% 31 65%
Bank Loan 10 48% 2 10% 8 38% 1 5% 0 0% 21 44%
Loan Fund 10 91% 0 0% 1 9% 0 0% 0 0% 11 23%
R&D Grant 11 44% 9 36% 4 16% 0 0% 1 4% 25 52%
Total 48
The extent to which the venture capitalists co-invest with other finance bodies varies significantly.
Private funds are by far the preferred co-investment partner and all but one of the venture
capitalists that took part in the survey co-invest with private funds to some extent. For over half of
them (53 percent) the majority of their co-investments (between 60 percent-100 percent) were
made with private funds. Half of the venture capitalist polled co-invest with publicly backed funds
but these investments count for a modest proportion of their co-investments portfolio (between 0-
20 percent). Banks, loan funds and R&D grants constitute a small proportion of co-investments
sources.

185
Preferred stage of investment. Venture capitalists that took part in the survey were asked to state
the preferred stages of investment. Participants were able to make multiple choices.
Table 34: Preferred stage of development
All funds Public funds Co-investment funds Private funds
Variable Obs Mean Std. Dev. Obs Mean Std. Dev. Obs Mean Std. Dev. Obs Mean Std. Dev.
Seed 50 0.48 0.50 26 0.46 0.51 16 0.44 0.51 8 0.63 0.52
Start up 50 0.64 0.48 26 0.58 0.50 16 0.69 0.48 8 0.75 0.46
Early growth 50 0.78 0.42 26 0.73 0.45 16 0.75 0.45 8 0.88 0.35
Late growth 50 0.32 0.47 26 0.19 0.40 16 0.50 0.52 8 0.38 0.52
Expansion 50 0.26 0.44 26 0.19 0.40 16 0.44 0.51 8 0.13 0.35
The most preferred stage of investments for the surveyed venture capitalist is the early growth (78
percent) followed by start-up (64 percent) and seed (48 percent). Later stages such as late growth
and expansion are not preferred by public venture capital funds, mainly due to restrictions on the
size of funding that is imposed.
Unsurprisingly, the majority of all venture capitalists in the study indicated that seed, early stage and
early growth are their preferred stages of investments. Professionals from co-investment funds
were keener in investing in late growth and expansion compared with their counterparts from the
public or private funds, perhaps reflecting their larger size.
7.2.3 Source of deals
An important element of venture investing is the quality of business proposals. Venture capitalists
receive business proposals in various ways e.g. from their colleagues from other publicly backed or
private funds, Business Angels, personal contacts or from ambitious entrepreneurs who approach
them directly. The executives and employees at funded companies may forward potential
investment opportunities that they learn about through friends, relatives and co-workers (Sorenson
and Stuart 2001). Venture capitalists were asked to indicate the proportion of their investments
sources by the above bodies.
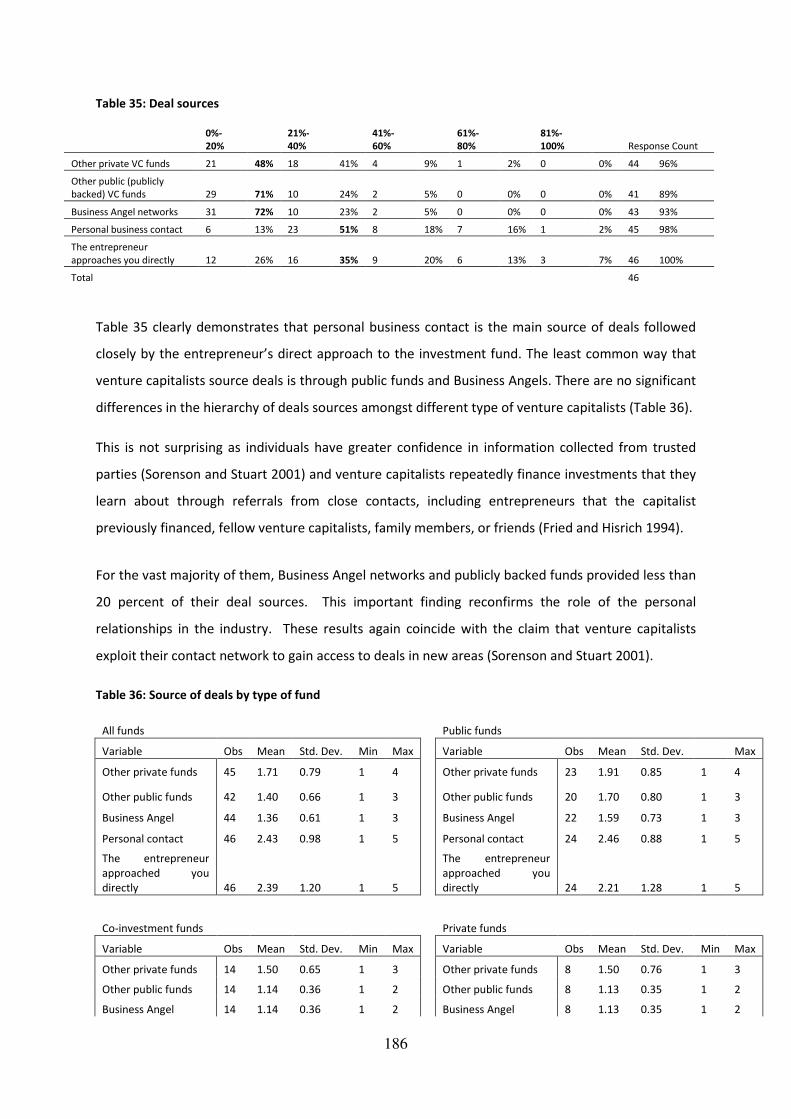
186
Table 35: Deal sources
0%-
20%
21%-
40%
41%-
60%
61%-
80%
81%-
100% Response Count
Other private VC funds 21 48% 18 41% 4 9% 1 2% 0 0% 44 96%
Other public (publicly
backed) VC funds 29 71% 10 24% 2 5% 0 0% 0 0% 41 89%
Business Angel networks 31 72% 10 23% 2 5% 0 0% 0 0% 43 93%
Personal business contact 6 13% 23 51% 8 18% 7 16% 1 2% 45 98%
The entrepreneur
approaches you directly 12 26% 16 35% 9 20% 6 13% 3 7% 46 100%
Total 46
Table 35 clearly demonstrates that personal business contact is the main source of deals followed
closely by the entrepreneur’s direct approach to the investment fund. The least common way that
venture capitalists source deals is through public funds and Business Angels. There are no significant
differences in the hierarchy of deals sources amongst different type of venture capitalists (Table 36).
This is not surprising as individuals have greater confidence in information collected from trusted
parties (Sorenson and Stuart 2001) and venture capitalists repeatedly finance investments that they
learn about through referrals from close contacts, including entrepreneurs that the capitalist
previously financed, fellow venture capitalists, family members, or friends (Fried and Hisrich 1994).
For the vast majority of them, Business Angel networks and publicly backed funds provided less than
20 percent of their deal sources. This important finding reconfirms the role of the personal
relationships in the industry. These results again coincide with the claim that venture capitalists
exploit their contact network to gain access to deals in new areas (Sorenson and Stuart 2001).
Table 36: Source of deals by type of fund
All funds Public funds
Variable Obs Mean Std. Dev. Min Max Variable Obs Mean Std. Dev. Max
Other private funds 45 1.71 0.79 1 4 Other private funds 23 1.91 0.85 1 4
Other public funds 42 1.40 0.66 1 3 Other public funds 20 1.70 0.80 1 3
Business Angel 44 1.36 0.61 1 3 Business Angel 22 1.59 0.73 1 3
Personal contact 46 2.43 0.98 1 5 Personal contact 24 2.46 0.88 1 5
The entrepreneur
approached you
directly 46 2.39 1.20 1 5
The entrepreneur
approached you
directly 24 2.21 1.28 1 5
Co-investment funds Private funds
Variable Obs Mean Std. Dev. Min Max Variable Obs Mean Std. Dev. Min Max
Other private funds 14 1.50 0.65 1 3 Other private funds 8 1.50 0.76 1 3
Other public funds 14 1.14 0.36 1 2 Other public funds 8 1.13 0.35 1 2
Business Angel 14 1.14 0.36 1 2 Business Angel 8 1.13 0.35 1 2

187
Personal contact 14 2.36 1.08 1 4 Personal contact 8 2.50 1.20 1 4
The entrepreneur
approached you
directly 14 2.64 0.93 1 4
The entrepreneur
approached you
directly 8 2.50 1.41 1 5
*1=<20%; 2=21-40%; 3=41-60%; 4=61-80% and 5=81-100%
Table 37: Correlation between sources of deals and type of funds
Pubic fund
Co-
investment
fund
Private
fund
Other
private
funds
Other
public
funds
Business
Angel
networks
Personal
contact
Source of deals
Other private funds 0.30 -0.18 -0.16 1
Other public funds 0.39 -0.20 -0.25 0.58 1
Business Angel networks 0.39 -0.26 -0.16 0.07 0.10 1
Personal contact 0.03 -0.11 0.10 -0.14 -0.30 -0.16 1
The entrepreneur
approaches you directly -0.35 0.22 0.17 -0.43 -0.48 -0.25 0.32
A closer analysis of the survey results reveals that Business Angel networks and publicly backed
funds are most frequent sources of deals for publicly backed funds rather than for private or co-
investment funds. In contrast, personal contacts are more closely related to private funds.
Interestingly, the above tables suggests that the entrepreneur approaches directly co-investment or
private funds much more often that he or she approaches public funds. Public funds are more likely
to source their deals from Business Angels or other public funds than private or larger funds are. It is
also very unlikely that the entrepreneur will approach a public fund directly as he or she would
prefer to approach co-investment and private funds.
7.2.4 Industry focus
According to the literature, venture capital funds normally invest in sectors that have high growth
potential. Venture capitalists were asked to choose the industries they prefer to invest in and the
results of their responses are illustrated below.
The most preferred industry for investments is software where 72 percent of the venture capitalist
polled chose it as one of their preferred sectors of investments (Figure 32). The second most
preferred industry is medical devices and equipment (64 percent), followed closely by
electronics/instrumentation (58 percent) and industry/energy (56 percent). Financial services and
retail/distribution are the least preferred sectors of investments with 10 percent and 16 percent
response rate respectively. Interestingly, the top three sectoral preferrences are the same in all
examined types of funds.

188
Venture capitalists from public funds expressed their interest in several sectors, on average, these
professional selected over half of all sectors (0.56). In contrast, venture capitalists from the private
funds selected only few sectors (0.27) indicating that they are more specialised than their
counterparts from the other type of funds.
Figure 32: Preferred industry
Table 38: Preferred industries
All funds Public funds Co-investment funds Private funds
Variable Obs Mean S. D. Obs Mean S. D. Obs Mean S. D. Obs Mean S. D.
Biotechnology 50 0.54 0.50 26 0.65 0.49 16 0.38 0.50 8 0.38 0.52
Business product and services 50 0.36 0.48 26 0.46 0.51 16 0.25 0.45 8 0.13 0.35
Computer and peripherals 50 0.44 0.50 26 0.65 0.49 16 0.13 0.34 8 0.25 0.46
Electronics/instrumentation 50 0.58 0.50 26 0.81 0.40 16 0.38 0.50 8 0.13 0.35
Financial services 50 0.10 0.30 26 0.15 0.37 16 0.00 0.00 8 0.00 0.00
Healthcare services 50 0.42 0.50 26 0.58 0.50 16 0.19 0.40 8 0.38 0.52
Industry/energy 50 0.56 0.50 26 0.65 0.49 16 0.50 0.52 8 0.25 0.46
IT services 50 0.52 0.50 26 0.58 0.50 16 0.38 0.50 8 0.50 0.53
Media and entertainment 50 0.42 0.50 26 0.46 0.51 16 0.38 0.50 8 0.38 0.52
Medical devices and equipment 50 0.64 0.48 26 0.77 0.43 16 0.44 0.51 8 0.50 0.53
Networking and equipment 50 0.56 0.50 26 0.73 0.45 16 0.38 0.50 8 0.25 0.46
Retail/distribution 50 0.16 0.37 26 0.12 0.33 16 0.19 0.40 8 0.13 0.35
Semiconductors 50 0.48 0.50 26 0.62 0.50 16 0.31 0.48 8 0.25 0.46
Software 50 0.72 0.45 26 0.81 0.40 16 0.50 0.52 8 0.75 0.46
Telecommunication 50 0.54 0.50 26 0.77 0.43 16 0.38 0.50 8 0.13 0.35
Other 50 0.28 0.45 26 0.38 0.50 16 0.25 0.45 8 0.13 0.35
Industry specialisation 50 0.46 0.28 26 0.56 0.25 16 0.33 0.29 8 0.27 0.22

189
7.2.5 Investment criteria
Venture capitalists were asked to indicate the top 3 strengths of a business opportunity that
normally motivates their investment. Their answers are illustrated in the graph below.
Figure 33: Investment criteria
The management team expertise is by far the most important strength of a business opportunity
followed by the customers and market potential and great product or services. Financial track record
and remarkable value proposition are the least important strenghts of a business proposal.
Table 39: Investment criteria
All funds Public funds
Variable Obs Mean
Std.
Dev. Min Max Variable Obs Mean
Std.
Dev. Min Max
Management team
expertise 47 0.957 0.204 0 1
Management team
expertise 25 0.92 0.28 0 1
Business model
scalability 47 0.319 0.471 0 1
Business model
scalability 25 0.28 0.46 0 1
Great
products/services 47 0.468 0.504 0 1
Great
products/services 25 0.52 0.51 0 1
Defensible I.P. 47 0.298 0.462 0 1 Defensible I.P. 25 0.24 0.44 0 1
Costumers and market
potential 47 0.702 0.462 0 1
Costumers and market
potential 25 0.76 0.44 0 1
Financial track records 47 0.149 0.36 0 1 Financial track records 25 0.16 0.37 0 1
Remarkable value
proposition 47 0.106 0.312 0 1
Remarkable value
proposition 25 0.12 0.33 0 1
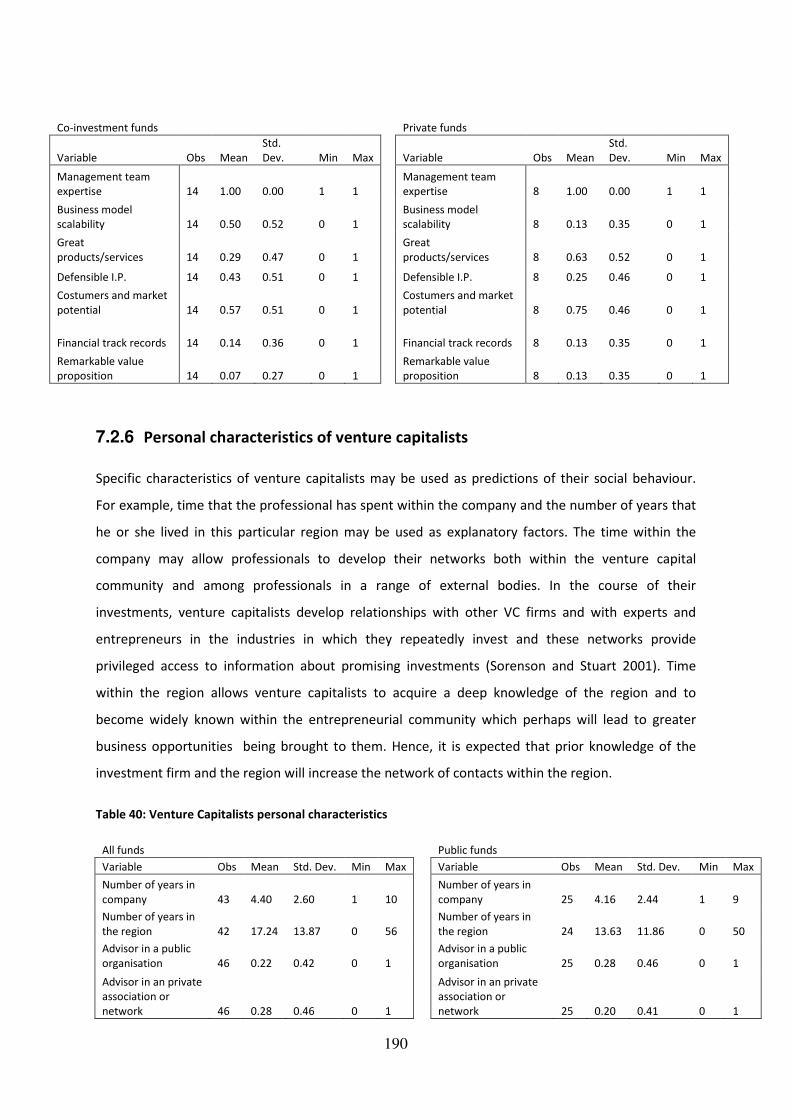
190
Co-investment funds Private funds
Variable Obs Mean
Std.
Dev. Min Max Variable Obs Mean
Std.
Dev. Min Max
Management team
expertise 14 1.00 0.00 1 1
Management team
expertise 8 1.00 0.00 1 1
Business model
scalability 14 0.50 0.52 0 1
Business model
scalability 8 0.13 0.35 0 1
Great
products/services 14 0.29 0.47 0 1
Great
products/services 8 0.63 0.52 0 1
Defensible I.P. 14 0.43 0.51 0 1 Defensible I.P. 8 0.25 0.46 0 1
Costumers and market
potential 14 0.57 0.51 0 1
Costumers and market
potential 8 0.75 0.46 0 1
Financial track records 14 0.14 0.36 0 1 Financial track records 8 0.13 0.35 0 1
Remarkable value
proposition 14 0.07 0.27 0 1
Remarkable value
proposition 8 0.13 0.35 0 1
7.2.6 Personal characteristics of venture capitalists
Specific characteristics of venture capitalists may be used as predictions of their social behaviour.
For example, time that the professional has spent within the company and the number of years that
he or she lived in this particular region may be used as explanatory factors. The time within the
company may allow professionals to develop their networks both within the venture capital
community and among professionals in a range of external bodies. In the course of their
investments, venture capitalists develop relationships with other VC firms and with experts and
entrepreneurs in the industries in which they repeatedly invest and these networks provide
privileged access to information about promising investments (Sorenson and Stuart 2001). Time
within the region allows venture capitalists to acquire a deep knowledge of the region and to
become widely known within the entrepreneurial community which perhaps will lead to greater
business opportunities being brought to them. Hence, it is expected that prior knowledge of the
investment firm and the region will increase the network of contacts within the region.
Table 40: Venture Capitalists personal characteristics
All funds Public funds
Variable Obs Mean Std. Dev. Min Max Variable Obs Mean Std. Dev. Min Max
Number of years in
company 43 4.40 2.60 1 10
Number of years in
company 25 4.16 2.44 1 9
Number of years in
the region 42 17.24 13.87 0 56
Number of years in
the region 24 13.63 11.86 0 50
Advisor in a public
organisation 46 0.22 0.42 0 1
Advisor in a public
organisation 25 0.28 0.46 0 1
Advisor in an private
association or
network 46 0.28 0.46 0 1
Advisor in an private
association or
network 25 0.20 0.41 0 1
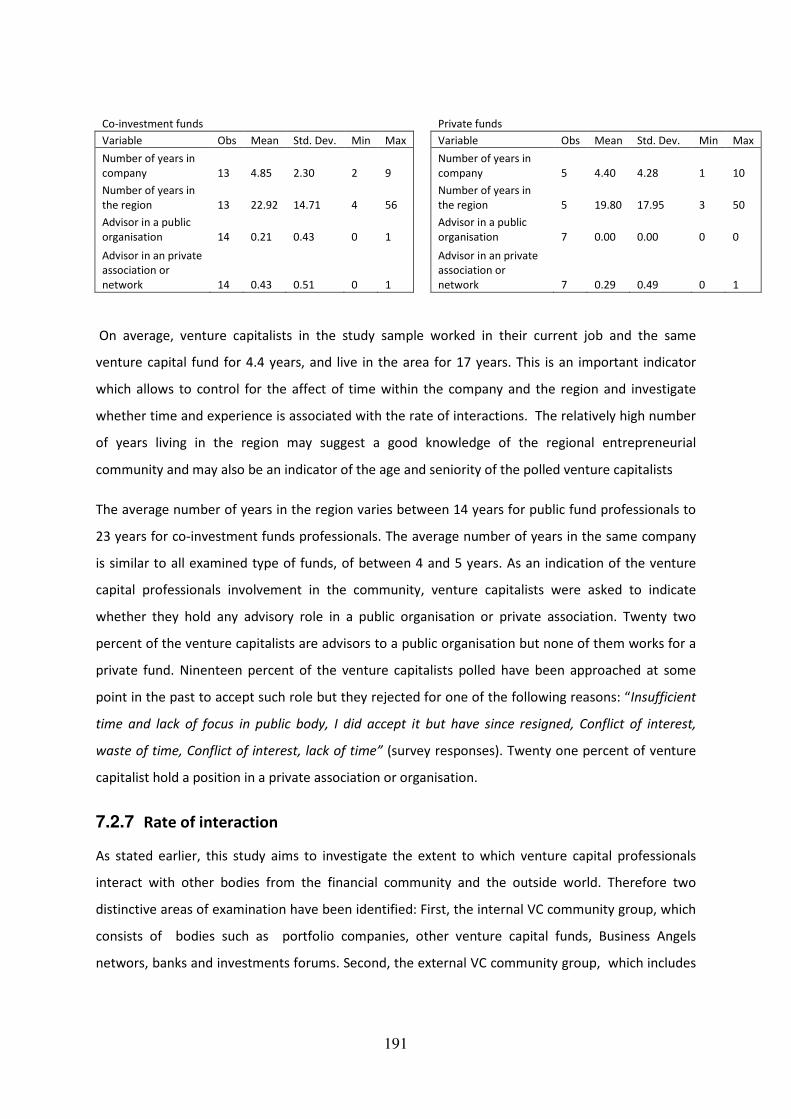
191
Co-investment funds Private funds
Variable Obs Mean Std. Dev. Min Max Variable Obs Mean Std. Dev. Min Max
Number of years in
company 13 4.85 2.30 2 9
Number of years in
company 5 4.40 4.28 1 10
Number of years in
the region 13 22.92 14.71 4 56
Number of years in
the region 5 19.80 17.95 3 50
Advisor in a public
organisation 14 0.21 0.43 0 1
Advisor in a public
organisation 7 0.00 0.00 0 0
Advisor in an private
association or
network 14 0.43 0.51 0 1
Advisor in an private
association or
network 7 0.29 0.49 0 1
On average, venture capitalists in the study sample worked in their current job and the same
venture capital fund for 4.4 years, and live in the area for 17 years. This is an important indicator
which allows to control for the affect of time within the company and the region and investigate
whether time and experience is associated with the rate of interactions. The relatively high number
of years living in the region may suggest a good knowledge of the regional entrepreneurial
community and may also be an indicator of the age and seniority of the polled venture capitalists
The average number of years in the region varies between 14 years for public fund professionals to
23 years for co-investment funds professionals. The average number of years in the same company
is similar to all examined type of funds, of between 4 and 5 years. As an indication of the venture
capital professionals involvement in the community, venture capitalists were asked to indicate
whether they hold any advisory role in a public organisation or private association. Twenty two
percent of the venture capitalists are advisors to a public organisation but none of them works for a
private fund. Ninenteen percent of the venture capitalists polled have been approached at some
point in the past to accept such role but they rejected for one of the following reasons: “Insufficient
time and lack of focus in public body, I did accept it but have since resigned, Conflict of interest,
waste of time, Conflict of interest, lack of time” (survey responses). Twenty one percent of venture
capitalist hold a position in a private association or organisation.
7.2.7 Rate of interaction
As stated earlier, this study aims to investigate the extent to which venture capital professionals
interact with other bodies from the financial community and the outside world. Therefore two
distinctive areas of examination have been identified: First, the internal VC community group, which
consists of bodies such as portfolio companies, other venture capital funds, Business Angels
networs, banks and investments forums. Second, the external VC community group, which includes

192
bodies such as universities, regional development agencies, public bodies, regional authorities, law
companies, specialists, technology parks and incubators, networking event etc.
By making this separation between internal and external groups of contacts, it is possible to examine
whether VC professionals interact with other professionals from finance community but not with the
overall innovation community or vice versa. Venture capitalists were asked to state the extent of
interaction with various bodies from the two groups, by choosing one of the following options:
never, hardly ever - once a year at most, occasionally – a few times a year, regularly – once a month,
often – more than once a month, very frequently – at least once a week. The results are illustrated
below:
Figure 34: Internal interactions of the venture capital community (rating average)
(1= “never”, 2= “hardly ever - once a year at most”, 3= “occasionally – a few times a year”, 4= “regularly – once a month”, 5= “often –
more than once a month”, 6= “very frequently – at least once a week”)

193
Table 41: Rate of interaction with the internal community
All funds Public funds
Variable Obs Mean S.D. Min Max Variable Obs Mean S.D. Min Max
Your portfolio companies 47 5.15 0.81 3 6 Your portfolio companies 25 5.00 0.82 3 6
Companies outside your
portfolio 45 4.11 1.42 1 6
Companies outside your
portfolio 24 4.00 1.44 1 6
Other private venture capital
funds (within your region) 45 4.31 1.28 1 6
Other private venture capital
funds (within your region) 23 4.22 1.00 3 6
Other private venture capital
funds (outside your region) 46 3.96 1.28 1 6
Other private venture capital
funds (outside your region) 24 3.92 1.21 2 6
Other publicly backed venture
capital funds (within your
region) 44 3.48 1.13 1 6
Other publicly backed venture
capital funds (within your
region) 23 3.91 0.90 2 6
Other publicly backed venture
capital funds (outside your
region) 44 3.18 1.19 1 6
Other publicly backed venture
capital funds (outside your
region) 23 3.57 1.12 2 6
Business Angel networks
(within your region) 47 3.70 1.10 2 6
Business Angel networks
(within your region) 25 4.24 1.01 3 6
Business Angel networks
(outside your region) 46 2.96 1.05 1 6
Business Angel networks
(outside your region) 24 3.50 0.98 2 6
Business Angel individuals 45 3.87 1.27 2 6 Business Angel individuals 23 4.22 1.20 2 6
Banks 45 3.22 1.40 1 6 Banks 23 3.26 1.42 1 6
Investment forums organised
by private bodies 47 3.32 0.96 1 6
Investment forums organised
by private bodies 25 3.40 1.26 1 6
Investment forums organised
by public bodies 47 2.83 0.89 0 5
Investment forums organised
by public bodies 25 3.04 1.02 0 5
Co-investment funds Private funds
Variable Obs Mean S.D Min Max Variable Obs Mean S.D. Min Max
Your portfolio companies 14 5.29 0.73 4 6 Your portfolio companies 8 5.38 0.92 4 6
Companies outside your
portfolio 14 4.14 1.41 2 6
Companies outside your
portfolio 7 4.43 1.51 2 6
Other private venture capital
funds (within your region) 14 4.64 1.55 1 6
Other private venture capital
funds (within your region) 8 4.00 1.51 2 6
Other private venture capital
funds (outside your region) 14 3.93 1.27 1 6
Other private venture capital
funds (outside your region) 8 4.13 1.64 2 6
Other publicly backed venture
capital funds (within your
region) 14 3.00 1.24 1 5
Other publicly backed venture
capital funds (within your
region) 7 3.00 1.15 2 5
Other publicly backed venture
capital funds (outside your
region) 13 2.69 0.85 1 4
Other publicly backed venture
capital funds (outside your
region) 8 2.88 1.55 1 5
Business Angel networks
(within your region) 14 3.29 0.91 2 5
Business Angel networks
(within your region) 8 2.75 0.71 2 4
Business Angel networks
(outside your region) 14 2.57 0.76 1 4
Business Angel networks
(outside your region) 8 2.00 0.76 1 3
Business Angel individuals 14 3.43 1.22 2 6 Business Angel individuals 8 3.63 1.41 2 6
Banks 14 3.57 1.34 1 6 Banks 8 2.50 1.31 1 5
Investment forums organised
by private bodies 14 3.21 0.43 3 4
Investment forums organised
by private bodies 8 3.25 0.46 3 4
Investment forums organised
by public bodies 14 2.64 0.63 1 3
Investment forums organised
by public bodies 8 2.50 0.76 1 3

194
Portfolio companies . As expected, there is an extremely high rate of interactions between the fund
managers and their portfolio companies. On average, venture capitalists interact with their portfolio
companies more than once a month, while a large percentage of them at least once a week. This
interaction may include site visits, telephone calls, email exchanges or meeting. This finding is in line
with Gorman and Sahlman (1989) argument that venture capitalists spend an average of four to five
hours per month on site at each of the companies in which they play a lead role. In total, monitoring
and advising occupies about half of the venture capitalist’s time (Gorman and Sahlman 1989).
Venture capitalists can offer more assistance to targets when they interact with startups’
management frequently and in person (Sonerson and Stuart 2001).
Private venture capital funds. On average, venture capitalists interact with other private funds
within their region on a regular basis (at least once a month) and they interact less with private
funds outside their region. This suggests that geography is important when examining the rate of
interaction of venture capitalists with private funds.
Business Angels. As shown in chapter 5, Business Angels have become a prominent source of early
stage finance and their importance has been widely acknowledged in the recent years by various
scholars (Mason and Harrison 2002b, 2008). The analysis shows that the majority of venture
capitalists interact with Business Angel networks within their region and individual Business Angels
at least a few times a month and many of them at least once a month. There is a significant lower
rate of interaction with Business Angels network outside their region.
Investments forums. On average, venture capitalists participate in privately organised investments
forums occasionally and at least few times a year but they attend similar events organised by public
funds to a lesser extent.
Overall, the clear preference of venture capitalists to interact more with other professionals
(venture capitalists from private and public funds and business angel networks) that have closer
proximity is in line with the literature that suggests localised investment pattents (Sorenson and
Stuart 2001).
Figure 35 analyses the rate of interaction between the VC community with what is traditionally
considered as the regional innovation community. This community includes organisations and bodies
such as Universities, regional development agencies, public bodies, regional authorities, law
companies, specialists, IP protection bodies, technology parks and incubators and networking
events. As previously, venture capitalists were asked to state the extent of interaction with all the
above bodies.
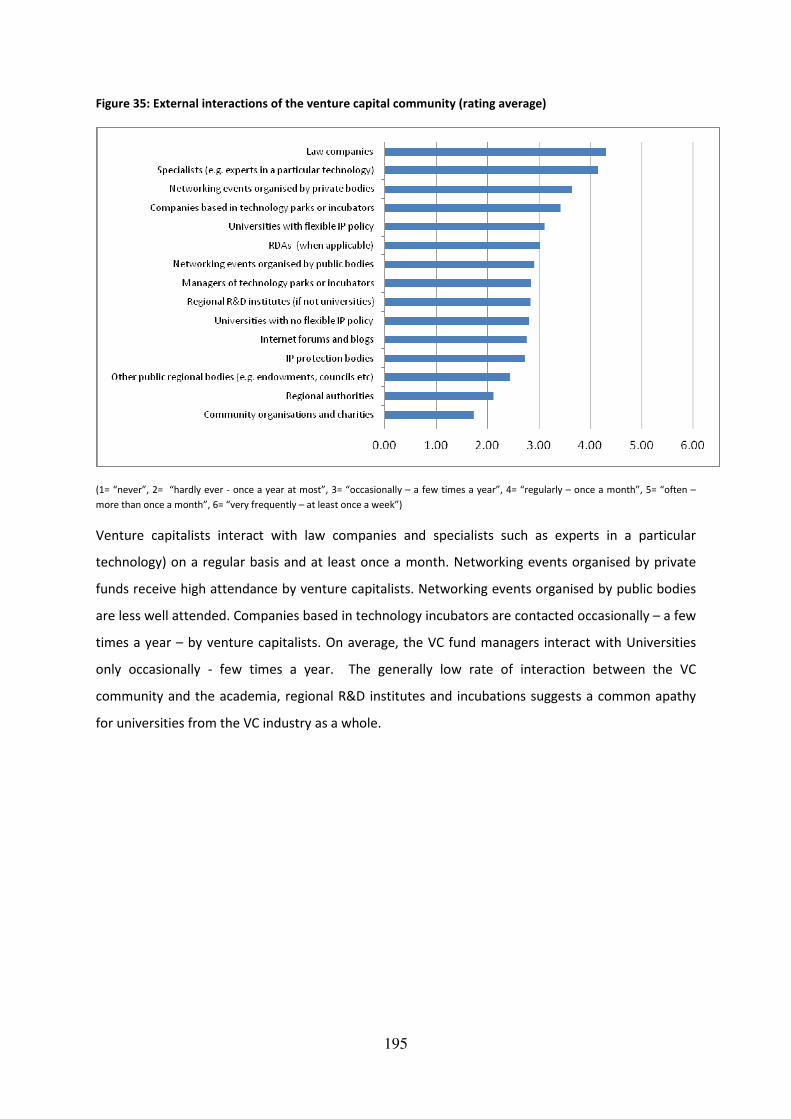
195
Figure 35: External interactions of the venture capital community (rating average)
(1= “never”, 2= “hardly ever - once a year at most”, 3= “occasionally – a few times a year”, 4= “regularly – once a month”, 5= “often –
more than once a month”, 6= “very frequently – at least once a week”)
Venture capitalists interact with law companies and specialists such as experts in a particular
technology) on a regular basis and at least once a month. Networking events organised by private
funds receive high attendance by venture capitalists. Networking events organised by public bodies
are less well attended. Companies based in technology incubators are contacted occasionally – a few
times a year – by venture capitalists. On average, the VC fund managers interact with Universities
only occasionally - few times a year. The generally low rate of interaction between the VC
community and the academia, regional R&D institutes and incubations suggests a common apathy
for universities from the VC industry as a whole.
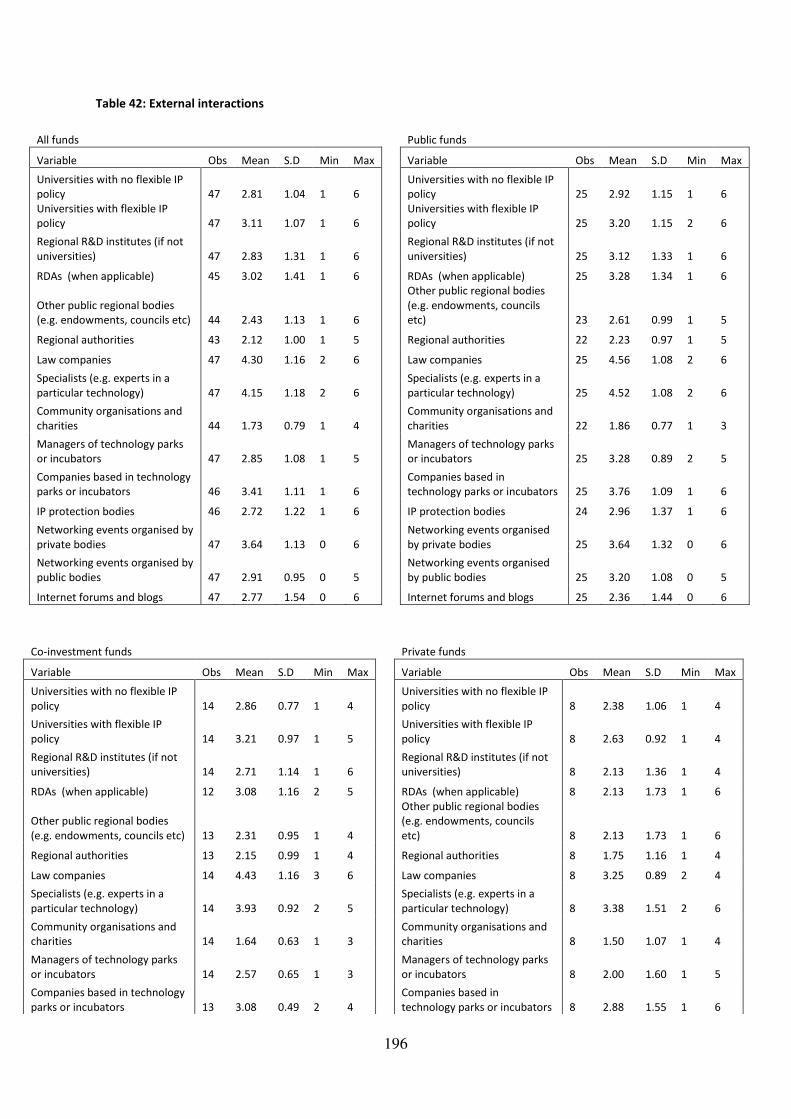
196
Table 42: External interactions
All funds Public funds
Variable Obs Mean S.D Min Max Variable Obs Mean S.D Min Max
Universities with no flexible IP
policy 47 2.81 1.04 1 6
Universities with no flexible IP
policy 25 2.92 1.15 1 6
Universities with flexible IP
policy 47 3.11 1.07 1 6
Universities with flexible IP
policy 25 3.20 1.15 2 6
Regional R&D institutes (if not
universities) 47 2.83 1.31 1 6
Regional R&D institutes (if not
universities) 25 3.12 1.33 1 6
RDAs (when applicable) 45 3.02 1.41 1 6 RDAs (when applicable) 25 3.28 1.34 1 6
Other public regional bodies
(e.g. endowments, councils etc) 44 2.43 1.13 1 6
Other public regional bodies
(e.g. endowments, councils
etc) 23 2.61 0.99 1 5
Regional authorities 43 2.12 1.00 1 5 Regional authorities 22 2.23 0.97 1 5
Law companies 47 4.30 1.16 2 6 Law companies 25 4.56 1.08 2 6
Specialists (e.g. experts in a
particular technology) 47 4.15 1.18 2 6
Specialists (e.g. experts in a
particular technology) 25 4.52 1.08 2 6
Community organisations and
charities 44 1.73 0.79 1 4
Community organisations and
charities 22 1.86 0.77 1 3
Managers of technology parks
or incubators 47 2.85 1.08 1 5
Managers of technology parks
or incubators 25 3.28 0.89 2 5
Companies based in technology
parks or incubators 46 3.41 1.11 1 6
Companies based in
technology parks or incubators 25 3.76 1.09 1 6
IP protection bodies 46 2.72 1.22 1 6 IP protection bodies 24 2.96 1.37 1 6
Networking events organised by
private bodies 47 3.64 1.13 0 6
Networking events organised
by private bodies 25 3.64 1.32 0 6
Networking events organised by
public bodies 47 2.91 0.95 0 5
Networking events organised
by public bodies 25 3.20 1.08 0 5
Internet forums and blogs 47 2.77 1.54 0 6 Internet forums and blogs 25 2.36 1.44 0 6
Co-investment funds Private funds
Variable Obs Mean S.D Min Max Variable Obs Mean S.D Min Max
Universities with no flexible IP
policy 14 2.86 0.77 1 4
Universities with no flexible IP
policy 8 2.38 1.06 1 4
Universities with flexible IP
policy 14 3.21 0.97 1 5
Universities with flexible IP
policy 8 2.63 0.92 1 4
Regional R&D institutes (if not
universities) 14 2.71 1.14 1 6
Regional R&D institutes (if not
universities) 8 2.13 1.36 1 4
RDAs (when applicable) 12 3.08 1.16 2 5 RDAs (when applicable) 8 2.13 1.73 1 6
Other public regional bodies
(e.g. endowments, councils etc) 13 2.31 0.95 1 4
Other public regional bodies
(e.g. endowments, councils
etc) 8 2.13 1.73 1 6
Regional authorities 13 2.15 0.99 1 4 Regional authorities 8 1.75 1.16 1 4
Law companies 14 4.43 1.16 3 6 Law companies 8 3.25 0.89 2 4
Specialists (e.g. experts in a
particular technology) 14 3.93 0.92 2 5
Specialists (e.g. experts in a
particular technology) 8 3.38 1.51 2 6
Community organisations and
charities 14 1.64 0.63 1 3
Community organisations and
charities 8 1.50 1.07 1 4
Managers of technology parks
or incubators 14 2.57 0.65 1 3
Managers of technology parks
or incubators 8 2.00 1.60 1 5
Companies based in technology
parks or incubators 13 3.08 0.49 2 4
Companies based in
technology parks or incubators 8 2.88 1.55 1 6

197
IP protection bodies 14 2.71 0.91 1 5 IP protection bodies 8 2.00 1.07 1 4
Networking events organised by
private bodies 14 3.71 0.99 2 6
Networking events organised
by private bodies 8 3.50 0.76 3 5
Networking events organised by
public bodies 14 2.71 0.47 2 3
Networking events organised
by public bodies 8 2.38 0.92 1 3
Internet forums and blogs 14 3.21 1.63 1 6 Internet forums and blogs 8 3.25 1.49 1 5
7.3 Limitations
One of the limitations of this study has been the relatively small sample size which is a result of the
reluctance of venture capitalists to participate in academic studies. Several other limitations should
also be kept in mind in interpreting the results of this study. First, because the data is based on self-
reports, one must be cautious as regards their analysis and interpretation. Future studies may seek
to supplement the self-reported measures used in this study with objective measures of interactions
(such as number of emails exchanged, number of meetings attended, duration of telephone calls,
and number of visits to the sites).
7.4 Are these differences robust?
The subsequent regression analysis examines the robustness of the findings controlling for several
characteristics that may affect the rate of interaction between venture capitalists and several
bodies. The rate of interaction between the venture capitalists and various bodies is regressed on a
set of dummies for the type of venture capital funds (public or private) and control variables for size
of fund, proportion of portfolio companies that generate revenue at the time of the investment (a
proxy variable for risk), time that the venture capitalist has spent within the company and the
region.
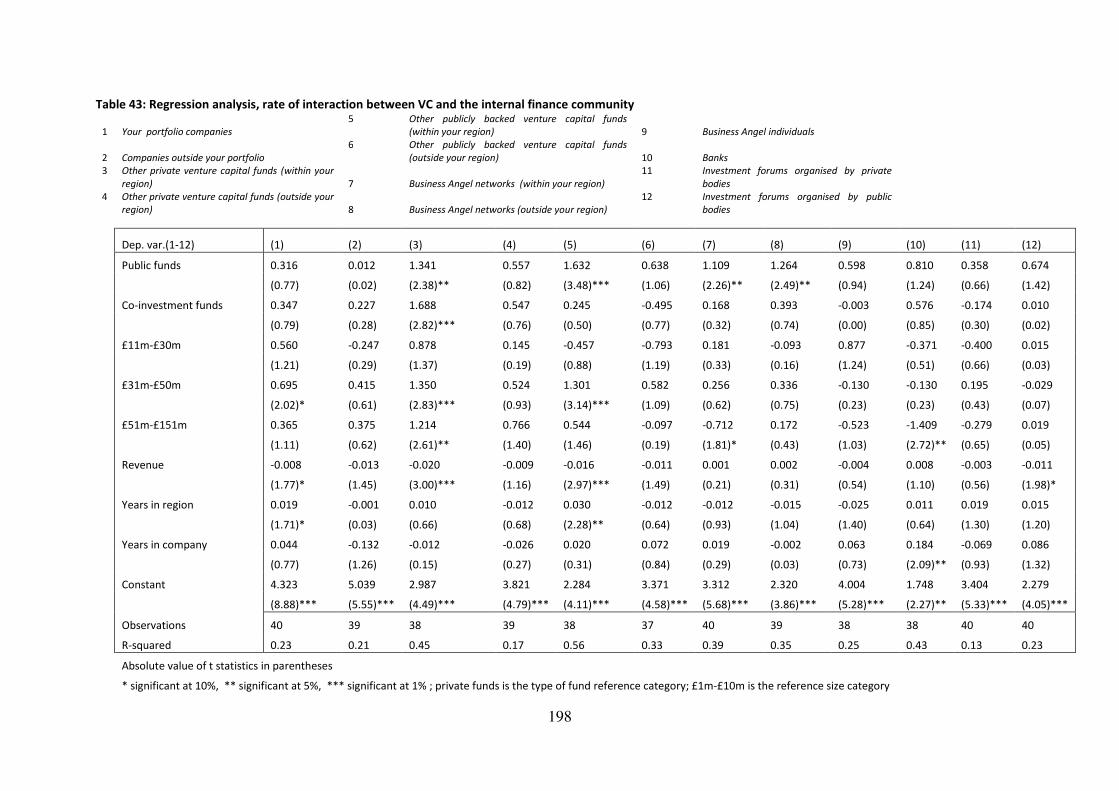
198
Table 43: Regression analysis, rate of interaction between VC and the internal finance community
1 Your portfolio companies
5 Other publicly backed venture capital funds
(within your region) 9 Business Angel individuals
2 Companies outside your portfolio
6 Other publicly backed venture capital funds
(outside your region) 10 Banks
3 Other private venture capital funds (within your
region) 7 Business Angel networks (within your region)
11 Investment forums organised by private
bodies
4 Other private venture capital funds (outside your
region) 8 Business Angel networks (outside your region)
12 Investment forums organised by public
bodies
Dep. var.(1-12) (1) (2) (3) (4) (5) (6) (7) (8) (9) (10) (11) (12)
Public funds 0.316 0.012 1.341 0.557 1.632 0.638 1.109 1.264 0.598 0.810 0.358 0.674
(0.77) (0.02) (2.38)** (0.82) (3.48)*** (1.06) (2.26)** (2.49)** (0.94) (1.24) (0.66) (1.42)
Co-investment funds 0.347 0.227 1.688 0.547 0.245 -0.495 0.168 0.393 -0.003 0.576 -0.174 0.010
(0.79) (0.28) (2.82)*** (0.76) (0.50) (0.77) (0.32) (0.74) (0.00) (0.85) (0.30) (0.02)
£11m-£30m 0.560 -0.247 0.878 0.145 -0.457 -0.793 0.181 -0.093 0.877 -0.371 -0.400 0.015
(1.21) (0.29) (1.37) (0.19) (0.88) (1.19) (0.33) (0.16) (1.24) (0.51) (0.66) (0.03)
£31m-£50m 0.695 0.415 1.350 0.524 1.301 0.582 0.256 0.336 -0.130 -0.130 0.195 -0.029
(2.02)* (0.61) (2.83)*** (0.93) (3.14)*** (1.09) (0.62) (0.75) (0.23) (0.23) (0.43) (0.07)
£51m-£151m 0.365 0.375 1.214 0.766 0.544 -0.097 -0.712 0.172 -0.523 -1.409 -0.279 0.019
(1.11) (0.62) (2.61)** (1.40) (1.46) (0.19) (1.81)* (0.43) (1.03) (2.72)** (0.65) (0.05)
Revenue -0.008 -0.013 -0.020 -0.009 -0.016 -0.011 0.001 0.002 -0.004 0.008 -0.003 -0.011
(1.77)* (1.45) (3.00)*** (1.16) (2.97)*** (1.49) (0.21) (0.31) (0.54) (1.10) (0.56) (1.98)*
Years in region 0.019 -0.001 0.010 -0.012 0.030 -0.012 -0.012 -0.015 -0.025 0.011 0.019 0.015
(1.71)* (0.03) (0.66) (0.68) (2.28)** (0.64) (0.93) (1.04) (1.40) (0.64) (1.30) (1.20)
Years in company 0.044 -0.132 -0.012 -0.026 0.020 0.072 0.019 -0.002 0.063 0.184 -0.069 0.086
(0.77) (1.26) (0.15) (0.27) (0.31) (0.84) (0.29) (0.03) (0.73) (2.09)** (0.93) (1.32)
Constant 4.323 5.039 2.987 3.821 2.284 3.371 3.312 2.320 4.004 1.748 3.404 2.279
(8.88)*** (5.55)*** (4.49)*** (4.79)*** (4.11)*** (4.58)*** (5.68)*** (3.86)*** (5.28)*** (2.27)** (5.33)*** (4.05)***
Observations 40 39 38 39 38 37 40 39 38 38 40 40
R-squared 0.23 0.21 0.45 0.17 0.56 0.33 0.39 0.35 0.25 0.43 0.13 0.23
Absolute value of t statistics in parentheses
* significant at 10%, ** significant at 5%, *** significant at 1% ; private funds is the type of fund reference category; £1m-£10m is the reference size category

199
Table 43 column shows coefficients for the extent of interaction between venture capitalists and
several bodies from the internal VC community, controlling for size of funds, proportion of portfolio
companies generating revenues, years that the venture capitalists spent in the region and in the
fund.
Column (1) shows that there is no statistically significant difference on the rate of interaction
between the three examined type of funds (public, private and co-investment fund) and their
portfolio companies. The size controls coefficients provide some indication that larger the fund is
the more interactions it has with its portfolio companies. The variable ‘’revenue generation’’ is a
measure of the proportion of the portfolio companies that generate revenue. The coefficient for the
variable revenue is negative and significant suggesting that the higher the proportion of portfolio
companies generating revenue, the less the fund interacts with its portfolio companies. This is in line
with the existing literature. Sapenza and Amason (1993) found that the rate of interaction between
venture capitalists and entrepreneurs is very high at the early stages of finance and gradually is
becoming less intense in the later stages. As they point out, apart from the money that is being put
into the VC industry, the effectiveness of communication is often crucial to the realization of
technological advances. Finally, the coefficient for the variable ‘years in the region’ is also positive
and significant suggesting that the longer a venture capitalist spends in the regions the more often
he or she interacts with the portfolio companies.
Companies outside portfolio (column 2). Venture capitalists interact at least once a month with
portfolio companies outside their portfolio. These companies will most likely be companies seeking
to raise finance from the funds. In this case, there is no significant difference in the extent of
interaction between these companies and the type of funds.
Private venture capital funds (columns 3 & 4). On average, publicly backed venture capitalists and
co-investment funds interact significant more often with private VC funds from their regions
compared with their private counterparts and the coefficient is high and statistically significant. The
size controls indicate that larger funds interact more often with private VC funds form the region
compared with smaller funds. The coefficient for the variable revenue is again negative and
significant. The coefficients for the dependent variable ‘’other private funds outside your region’’
are not significant, suggesting that there is no difference on the extent of interaction between any
type of funds and private funds that are not based in the same region.
Public venture capital funds (columns 5 & 6). A very similar picture emerges when looking at the
extent of interaction with other public funds. Public funds interact with public funds from the same

200
region to a much higher extent than private or co-investment funds do. Funds with assets between
£31m-£50m interact with public funds from the same region to a much larger extent than smaller or
larger funds. The coefficients for the variables revenue and years in the region continue to be
statistically significant. The coefficients suggests that public funds interact more with other public
funds than private funds, while there is no difference in the rate of interaction between public and
co-investment funds. Public funds employees interact with each other at a higher rate within their
region. Based on the interviews with the VC managers, “this is possibly due to the fact that publicly
backed fund managers have developed closer relationships with the counterparts from the public
rather than the private sector” (interviewed venture capital manager). There are no differences in
the extent of interaction between public funds outside the region and any type of venture capital
funds.
Business Angels (columns 7 & 8) suggest that there is a considerable difference between the rates of
interactions between the Business Angel networks (inside or outside the region) and the different
types of venture capital funds. Public funds interact with BAs networks over twice as many times as
their private counterparts. A venture capitalist that works in a publicly backed fund is twice as likely
to interact with a business angel than a venture capitalist from the private sector. Professionals
from funds with size between £51m - £151m interact with BAs networks from the region less often
than smaller funds. The strong and positive relationship between public funds and Business Angels is
also reflected in the source of deals that was examined earlier in this chapter. There is no significant
difference between the extent of interaction between individual Business Angels and different type
of funds. As expected, large funds are less likely to interact with Business Angels than smaller funds.
The time that a venture capitalists spent in the company is positive and significantly associated with
the extent of interaction between individual Business Angels and professionals, indicating the
importance of personal relationships in the sector.
Investments forums (column 10 & 11). There are no significant differences on the rate of
participation in investment forums between different types of venture capitalists.
Overall, there is a clear pattern of the ecology of interaction between different types of venture
capitalists and the internal community. First, professionals from public funds interact more often
with professionals from the same region compared with their private counterparts. Second, public
funds interact significantly more often with Business Angel networks than private funds do. Third,
medium size funds (£31m-£50m) seem to be more active than smaller or larger funds in interacting
with the internal community. Forth, the less revenue the portfolio companies generate, the more

201
active the venture capitalists are; and finally, there are some indications that the more time a
venture capitalist spent in the region the more he or she interacts with bodies from the same region.

202
Table 44: Regression analysis, rate of interaction between VC and the innovation community
1 Universities with no flexible IP policy 6 Regional authorities 11 Companies based in technology parks or incubators
2 Universities with flexible IP policy 7 Law companies 12 IP protection bodies
3 Regional R&D institutes (if not universities) 8 Specialists (e.g. experts in a particular technology) 13 Networking events organised by private bodies
4 RDAs (when applicable) 9 Community organisations and charities 14 Networking events organised by public bodies
5 Other public regional bodies (e.g. endowments, councils
etc)
10 Managers of technology parks or
incubators
Dep var Public funds (1) (2) (3) (4) (5) (6) (7) (8) (9) (10) (11) (12) (13) (14) (15)
Public funds 0.967 1.052 1.590 1.114 0.086 0.115 1.767 1.157 0.634 1.288 0.767 1.525 0.662 0.787 -0.410
(1.75)* (1.88)* (2.66)** (1.83)* (0.15) (0.21) (3.09)*** (2.01)* (1.68) (2.61)** (1.55) (2.50)** (1.12) (1.66) (0.52)
Co-investment funds 0.763 0.930 0.882 0.751 -0.188 0.239 1.277 0.521 0.443 0.439 0.033 1.006 0.482 0.082 0.618
(1.30) (1.56) (1.38) (1.13) (0.31) (0.42) (2.09)** (0.85) (1.13) (0.83) (0.06) (1.55) (0.77) (0.16) (0.73)
£11m-£30m -0.157 0.249 0.779 -0.320 0.357 0.305 1.003 0.352 -0.808 0.299 -0.392 0.044 -1.148 -0.343 -0.747
(0.24) (0.37) (1.08) (0.44) (0.51) (0.46) (1.46) (0.51) (1.78)* (0.50) (0.66) (0.06) (1.62) (0.60) (0.78)
£31m-£50m -0.186 -0.225 0.167 -0.730 0.478 0.715 -0.012 0.379 -0.386 0.052 -0.080 -0.370 -0.687 -0.288 0.649
(0.29) (0.34) (0.24) (1.03) (0.72) (1.15) (0.02) (0.56) (0.90) (0.09) (0.14) (0.52) (0.99) (0.52) (0.70)
£51m-£151m -0.342 -0.373 0.369 -0.488 0.745 0.832 0.613 0.366 -0.310 0.295 -0.187 0.276 -0.134 -0.149 -0.263
(0.55) (0.59) (0.55) (0.71) (1.16) (1.38) (0.95) (0.56) (0.74) (0.53) (0.33) (0.40) (0.20) (0.28) (0.29)
Revenue -0.016 -0.015 -0.025 -0.022 -0.013 0.003 0.003 -0.014 -0.002 -0.007 -0.012 -0.010 -0.009 -0.013 0.006
(2.48)** (2.30)** (3.65)*** (2.99)*** (1.93)* (0.50) (0.38) (2.11)** (0.35) (1.28) (2.03)* (1.39) (1.35) (2.28)** (0.67)
Years in region -0.001 -0.004 0.008 -0.006 -0.021 -0.031 0.016 -0.008 -0.008 -0.004 -0.011 0.005 0.015 0.009 -0.005
(0.06) (0.24) (0.51) (0.35) (1.23) (1.93)* (1.09) (0.53) (0.79) (0.30) (0.81) (0.33) (0.93) (0.75) (0.25)
Years in company 0.149 0.166 0.102 0.377 0.202 0.129 -0.004 0.006 0.098 0.144 0.073 0.060 0.034 0.120 -0.211
(1.97)* (2.16)** (1.24) (4.29)*** (2.54)** (1.73)* (0.05) (0.08) (1.90)* (2.12)** (1.08) (0.71) (0.42) (1.85)* (1.94)*
Constant 2.261 2.349 1.736 2.027 1.949 1.218 2.090 3.704 1.363 1.547 3.623 1.645 3.600 2.512 3.570
(2.93)*** (3.00)*** (2.07)** (2.38)** (2.42)** (1.61) (2.61)** (4.60)*** (2.62)** (2.23)** (5.22)*** (1.92)* (4.35)*** (3.78)*** (3.22)***
Observations 40 40 40 38 37 36 40 40 37 40 39 39 40 40 40
R-squared 0.24 0.26 0.42 0.46 0.31 0.25 0.34 0.30 0.29 0.34 0.30 0.27 0.25 0.29 0.23
Absolute value of t statistics in parentheses
* significant at 10%, ** significant at 5%, *** significant at 1%; private funds is the type of fund reference category; £1m-£10m is the reference size category

203
Universities (Columns 1 & 2). The coefficients for public funds and universities (with or without
flexible IPs) are both positive and significant suggesting that public venture capital funds interact
more often with universities than the private venture capitalists do. In addition, the variable revenue
is negative and statistically significant suggesting that funds which are more interested in companies
that do not generate revenue are more likely to interact with universities. The time that a venture
capitalist has spent in the fund is positive and significant associated with the extent of interaction
with universities, perhaps suggesting that it takes time for a professional to establish contacts with
the universities. Alternatively, and more likely, the positive coefficient of this variable, which is often
positive and significant for several regressions in the table, may indicate that the people that have
established these relationships are professionals that spent many years in the public sector and
therefore are better connected with other public organisations.
Regional R&D institutes (column 3). There is a significant difference between the rate of interactions
between different type of venture capitalists i.e. venture capitalists from the public sector interact
with R&D institutes more than twice as much that professionals from the private sector. The results
also strongly suggest that the more revenue the portfolio companies generate, the less interaction
the fund has with the regional R&D institutes.
Regional development agencies (column 4). A similar picture emerges when looking at the extent of
interaction with regional development agencies. Publicly backed venture capitalists interact much
more often with RDAs than their private counterparts. This is not surprising as many of these funds
have been set up by RDAs.
Other public regional bodies (columns 5 & 6). Venture capitalists of any type have not established
strong links with other public regional bodies or regional authorities, and those that they had, have
spent several years in the same company.
Law companies, Specialists and IP protection bodies (columns 7, 8 & 12). There is strong evidence
that venture capitalists working for publicly backed funds or co-investment funds interact with law
companies, specialists and IP protection bodies much more often than their counterparts from the
private sector. There is also evidence that the size of funds determines the rate of interaction as
indicating that very small funds are less likely to interact with law companies, specialists or IP
protection bodies. The positive coefficient between public funds and law companies may be
explained by “the way the fund managers are rewarded under the public funds as opposed to private
funds. In other words, it would be worth exploring whether private fund managers have more of an
incentive to minimise costs by suppressing legal fees (perhaps foolishly in the long run!). Along the

204
same thinking, public funds may suffer from the fact that it is always easier to spend someone else's
money rather than one's own”, as a professional from a law company has commented (interview). In
addition, public funds may interact more often with specialists than private funds due to their “lack
of skills, expertise, and inability to recruit specialised people in house” (interview).
Technology parks and incubators (columns 10 & 11). The high and positive coefficient between the
public venture capitalists and the managers of incubators demonstrates that venture capitalists
working for a publicly backed fund are substantially more likely to interact with incubator managers
than their private counterparts. On average, private venture capitalists interact with the managers
of technology parks or incubators hardly ever and once a year at most. This is an interesting finding
which suggests that by and large, business incubators have not succeeded in attracting the interest
of private venture capitalists.
7.5 Ecology of interactions within the Welsh VC community
Figure 36 visually compares the rate of interaction between the venture capitalists and other players
of the financial community in Wales with the average rate of interaction of all UK regions. It suggests
that there are several differences in the way that the Welsh and other VC communities interact with
the rest of the internal finance community. More particularly, professionals from other regions,
based on both private fund and other publicly backed funds, interact with companies (inside or
outside their portfolio) much more often than their counterparts from Wales. Similarly, they
interact more often with other funds (private or public), inside and outside the region than the
Wales based venture capitalists. Interestingly, Wales based VC funds have much more active
interactions with banks than all other regions, mainly reflecting the fact that FW is also operating
several loan funds that require close collaboration with banks.

205
Figure 36: Ecology of interactions in Wales (internal finance community)
Figure 36 indicates that Welsh venture capital professionals interact significantly less with several
bodies of the finance community compared with their counterparts from both the public and the
private sector (companies outside their portfolio, other private venture capital funds inside or
outside Wales and other public venture capital funds within Wales). Their rate of interaction with
Business Angels is in line with public venture capital VCs on average but show a significanly higher
interaction with banks.

206
Figure 37: Ecology of interaction in Wales (innovation system)
The ecology of interactions amongst venture capitalists and other players of the regional innovation
system in Wales, shares similar characteristics with the ecology of interaction of the average publicly
backed UK region. Figure 37 also suggests above average rate of interactions with the Universities
with flexible IP policy (perhaps due to Cardiff University and its relationship with Biofusion) but
below average rate of interactions with companies based in technology parks and incubators.
Finally, venture capitalists based in Wales do not make use of the internet to the same extent as
their counterparts from other regions, regardless of the type of funds.
7.6 Conclusions
This chapter analysed the rate of interaction between venture capitalists and other players of the
innovation system and presented clear evidence that the volume of interaction is strongly associated
with the nature of the fund. Two important findings emerged from this analysis.
First, public dependence is strongly and significantly associated with higher volumes of interactions.
The more publicly dependent a fund is, the more it interacts with other players. This suggests that
publicly backed venture capitalists have the capacity to activate the search and screening process
over a wide network of contacts within a geographical space and can deploy the extensive reach of
their networks to identify and evaluate investments opportunities.

207
Second, the results also show that operators of publicly backed funds are lacking close connections
with their counterparts from the private sectors. This may have implications for their ability to
approach and attract private heavy weighted venture capital funds and LPs that can provide follow
on investments or raise further funding for the fund.
This reinforces previous findings from this thesis, suggesting that there are currenlty two distincitve
venture capital communities in the UK: one which is privately led and includes London, the South
East and the East of Engalnd, and one which is publicly led and includes all the remaining regions.
Although the findings from this analysis cannot be generalised for the whole venture capital
industry, they provides significant insights for the UK early stage technology focused venture capital
industry. There are some common characteristics in the way that the two communities operate, and
also some distinctive differences.
Common characteristics
In line with the findings from chapter 5, the majority of the venture capital funds deals are co-
investments. The extent to which the venture capitalists co-invest with other finance bodies varies
significantly. Almost all of the venture capitalist polled co-invest with private funds to some extent.
However, the extent of public dependency of the fund is highly associated with the proportion of co-
investment deals. In other words, the more public finance a fund has the more it co-invests with
other funds. This is of course oblibagory in most cases due to state aid legislation.
Personal business contact is the main source of deals for all type of funds, followed closely by the
entrepreneur’s direct approach to the investment fund.
The majority of the venture capitalists invest in companies that do not generate sales revenue at the
time of initial investments.
The most prefered industry for investments is software. The second most preferred industry is
medical devices and equipment followed closely by electronics/instrumentation and
industry/energy. Financial services and retail/distribution are the least preferred sectors of
investments.
The management team expertise is by far the most important strenght of a business opportunity
followed by the costumers and market potential and great product or services. This is in line with
previous research that found that good management is by far the most important attribute in
making a company attractive to potential VC investors (more important even than the initial product
or service proposition), as VCs consider it is this which will help ensure good returns (SQW 2009).

208
Financial track record and remarkable value proposition are the least to important strenghts of a
business proposal. There is no evidence to suggest that publicly backed fund managers have
different criteria when investing.
Differences
All panels show that venture capitalists employed by a publicly backed fund interact with the other
bodies more often than the private venture capitalists do, and are more engaged with the
innovation community. The extent of public dependency significantly affects the extent of
interaction, the more public money under management, the more engaged the fund is with the
regional community.
Publicly backed venture capital professionals interact with public funds within their region
substantially more than their private counterparts. More particularly, private venture capitalists
interact twice as much with their private counterparts than the publicly backed ones.
Publicly backed fund professionals interact with Business Angel networks within or outside their
region to a much greater extent than their counterparts from the private sector. Business Angels
networks are much more connected with the publicly backed rather with the private funds.
As a general observation, all venture capitalists do not interact to a great extent with their external
community. However, the differences in the extent of interaction between different types of venture
capitals and players of the external community are quite substantial suggesting that public venture
capitalists are responsible for the vast majority of interaction that takes place between the VC and
the innovation community.
Publicly backed venture capitalists interact twice as much with regional R&D institutes, RDAs, law
companies, specialists, managers of technology parks, companies based in technology parks, IP
protection bodies and networking events organised by public bodies compared with their
counterparts from the private sector. This suggests that:
First, professionals from the publicly backed funds have the – sometime implied – objective to
interact with other players of the regional innovation system in order to foster the entrepreneurial
and innovation community. In order to meet these objectives, such professionals have established
links with the above bodies.
Second, public organisations such as RDA, technology parks and incubators did not manage to
attract the interest of the private VC funds. This is open to two interpretations. First, either the
professionals of these bodies are not active enough in the area and have not made the private VC
209
funds aware of their pool of opportunities, or second, these organisations do not contain a pool of
business proposals that the private venture capitalist would be interested in investing.
Public funds are mainly responsible for most of the interaction that is taking place between the
Business Angel networks and the formal VC community. This is an important finding that policy
makers need to take into consideration given the fact that BAs are emerging as prominent players in
the early stage risk finance community. This relationship is also reflected in the source of deals.
Although it is widely acknowledged that interactions between venture capitalists and other players
promote tacit knowledge (Zook 2004), the results of this study suggest that interaction on its own is
not enough to provoke success. Publicly backed venture capitalists interact with the internal and the
external to the VC community organisations to a greater extent than their private counterparts, but
they experience less success, measured by the financial performance of the funds (NAO 2009) or
business performance of their portfolio companies (NESTA and BVCA 2009). In addition, when they
invest alone they are less likely to invest in companies with the potential to innovate compared with
private funds. In other words, the rate of interaction between venture capitalists and other
professionals is not correlated with greater success and the funds that interact more, are less
successful that funds that interact less. Why may this be happening?
First, it is important to note that publicly backed funds are a relatively new concept. The systems and
stores of tacit knowledge used by venture capitalists do not emerge overnight and a simple supply of
money is not the same as a well-developed venture capital system (Zook 2004). The structure of
social and professional relations is likely to influence which actors in the VC business become aware
of promising, early stage investments opportunities, and timely information regarding high-quality
investment opportunities often reaches a venture capitalist through his network (Sorenson and
Stuart 2001). Publicly backed fund professionals therefore are dependent not only on their personal
capacity to mobilise their network of contact but also on how reliable information the members of
the network can exchange. Venture capitalists with deep contact networks in an industry or a
geographic area can often better assess the veracity of the information they receive about the
quality of an investments opportunity (Sorenson and Stuart 2001) which means that public VC
professionals may not have this deepness required.
Second, higher rate of interaction does not necessary mean that venture capitalists become aware
of better opportunities that those who interact less. As Fried and Hisrich (1994) put it, weakly
affiliated actors may lack the incentive to refer only high quality investments (Fried and Hisrich

210
1994), and therefore private venture capitalists compensate by relying more heavily on their
personal ability to access quality differences among business opportunities.
However, when public funds co-invest with private funds, they are more likely to invest in companies
with the potential to innovate compared with those that private funds invest in. The co-investment
model seems to be the most effective model of VC investing especially for regions with high
dependency on public sector. However, publicly backed funds based in highly publicly depended
regions may experience difficulties in identifying private sector investment partners and as a result,
these regions are likely to experience low rate of co-investment activities and consequently high
rates of solely public deals. As a result there is a danger of a vicious circle where public VC funds of
some regions will continue to underperform private funds - making it hard to raise more funds; their
portfolio companies will continue to benefit very little from the investments; and they will continue
to support relatively fewer companies with the potential to innovate compared with private funds.
The findings of this chapter suggest that the mobilisation of the innovation network within the
regions is not enough on its own to boost innovation performance of the VC backed companies. Just
networking and exchanging information between innovation bodies and financial bodies is not
adequate. The existence of private funds in the region is crucial in order to bring the skills and
characteristics that public funds lack. Alternatively, public funds in publicly dominated regions
should be encouraged to attract private investments from outside investors. They could be seen as
the pipeline of valuable information about investable opportunities in peripheral regions to London
and South East based private VC funds.
As discussed earlier, co-investment activity is a learning process for the public funds and eventually
professionals from the public funds will acquire the same skills as their private counterparts.
However, this assumes that these funds and schemes are sustainable in the long term, invest into
human capital and appropriately incentivise their personnel. Small funds, with a short life span are
not likely to create this environment in the public sector dominated UK regions.

211
8 CHAPTER 8 : CONCLUSIONS
8.1 Introduction
Since the beginning of the century, a variety of venture capital schemes were introduced in the UK.
These schemes established several publicly backed funds that have become important players in the
regional financial and innovation systems. The main sources of public funding for such funds have
been the European Union and Government departments or devolved administrations, followed by
RDAs, universities and regional authorities.
An important objective of the publicly backed funds has been to attract funds from private investors
and develop a vibrant private venture capital market in each UK region. The evidence from the UK
regions suggest that this has not happened at least at the early stage VC market, as the majority of
the regions are currently dominated by publicly backed funds. Outside London, Cambridge and the
South East, public sector VC investments vastly outweigh private sector ones. This longer trend of
private venture capital funds exiting from the early stage market could not be stopped by the
establishment of publicly backed regional funds. This trend may be a result of several reasons: since
the dotcom crash, the early stage venture capital industry has been generating poor returns; there
may be a lack of early stage investable opportunities in several regions. Alternative, there is a
problem of ‘thin markets’ where limited numbers of investors and entrepreneurial growth firms
within the economy have difficulty finding and contracting with each other at reasonable costs
(NESTA 2009).
This thesis sought to map and measure the extent of public involvement in the UK VC market and to
access the potential implications of such involvement in the companies and regions. More
particularly, as outlined in chapter one, this research was concerned with the following questions:
1. Has the supply of private sector venture capital and supportive public interventions changed
the availability of venture capital at the regional level?
2. Is a higher volume of VC investments positively correlated with higher volume of patent
applications?

212
3. Are public funds less effective in investing in companies with the potential to innovate, than
private funds?
4. What is the ecology of interaction between venture capital and regional innovation systems,
how does this differ spatially and why, and how does the venture capital community fit
within the regional innovation system?
8.2 Theoretical and empirical contributions to broader academic
debates
8.2.1 Theoretical contributions
The literature review reveals the importance of context when exploring the link between innovation
finance and regional development. Innovation finance is a critical resource in the development and
growth of many new firms. To date, few studies have attempted to understand the role of
finance within the regional innovation system. In part this can be explained by the relatively
newly established literature on regional innovation and the complexity of the financial
mechanisms that favour innovation creation. While entrepreneurial finance includes a range of
financial instruments, the majority of work has focused on venture capital and public markets as
these also have the most data (Dee and Minshall 2011). Nonetheless the literature indicates
several features of innovation financing, especially venture capital investments, that may affect
the regional innovation system which this thesis has explored further with the support of
qualitative and quantitative data. This thesis contributes to the literature of regional development,
regional innovation and venture capital in several ways.
Economic geography theories
Although innovation has often been categorised as a one-way linear flow from R&D to new
products, studies have shown the process of innovation to be less structured and to involve multiple
interactions and networks (Freeman 1992; Malecki 2000). While the linear model has theoretical
elegance, the majority of studies suggest more dynamic and complex processes involved in
innovation and industrial emergence (Dee and Minshall 2011). This is also the case for venture
capital. Venture capital activity does not support the linear approaches to innovation i.e. investment
into a company will simply increase R&D expenditure and therefore promote innovation. A common
perception in the literature is that venture capital investment is a complex process that involves

213
extensive and multiple interactions, tacit knowledge and networks, and in that sense it fits well with
the evolutionary theories of innovation. According to Cooke et al. (1997):
“the evolutionary approach is well-suited to the analysis of innovation practices because of its
emphasis upon process, learning and cooperative, as well as competitive, dimensions of interfirm
relations. This contrasts with the static equilibrium, arm's length exchange and atomistic utility-
maximisation assumptions of the neoclassical economics perspective” (Cooke et al. 1997, p.476).
A major concern is the ability to direct financial resources towards those activities most likely to
contribute to the development of an entrepreneurial culture within the regional innovation system.
The entrepreneurial financing industry continues to release reports arguing for linear
approaches: more money will lead to more innovation and the creation of new industries, yet
the literature suggests the relationship is not as straightforward as such claims suggest (Dee and
Minshall 2011). This requires a more complete perspective of entrepreneurial activity rather than
reliance on a linear innovation process where funding gaps are identified and filled. The literature,
for example, suggests entrepreneurial ventures may experience greater difficulty accessing required
finance when they are at the early stage of development. Whilst a decline in the availability of
entrepreneurial financing may occur, they do not necessarily reflect a decline in the financing needs
of investable firms (Dee and Minshall 2011). Instead the supply of entrepreneurial finance seems
predominantly driven by other factors in the business environment, such as the confidence in public
markets (Dee and Minshall 2011) or the environment in which the firms operate (NESTA 2011).
The evolutionary economics approach can better conceptualise the units of co-operation that
interact within the venture capital operational frameworks and explain its dynamics. As seen in the
findings of this research, successful venture capital communities cannot be generated in a pre-given
order, but instead they are created through a complex puzzle of quality interactions and networks.
These networks of associations generate the dynamics that add value to the pre and post
investment processes. These dynamics can be better function within an effective innovation system
which facilitates the generation, diffusion and absorption of new knowledge and it has the
appropriate mechanisms in place to commercialise such knowledge.
This thesis therefore suggests that effective venture capital activity is based on theoretical insights
found in institutional and evolutionary economic theories such as locally embedded knowledge,
social and cultural characteristics and the importance of proximity as a source of knowledge and
learning. More particularly, venture capital supports the main attributes of the evolutionary
theories and those of innovation systems in several respects by promoting knowledge transfer, tacit

214
knowledge, learning, networking and associated spill over effects. It co-habits with innovative firms
and promotes clustering spill over effects.
Regional development
The geography of venture capital investments in the UK continues to be characterized by regional
Inequalities as previous studies have indicated (Mason 1987, 2007; Mason and Harrison 1991, 2002;
Martin 1989, 1992 and Martin et al. 2005). As shown in chapter 5, investment activity in the UK is
regionally concentrated in London and the South East followed by the East of England. In these three
regions, and especially London, there is an easy access of venture capital firms to the pools of
knowledge and expertise and therefore funds based in these three regions are more likely to invest
locally (Martin et al. 2001). This is also based on the evidence in the literature which suggest that
personal contact and face to face meetings is of great importance in venture capital investing. As
shown in chapter 5, the relative growth of venture capital activity in the Midlands and North England
is an outcome of the increased supply of public venture capital funds.
The findings of this research affirm the findings from previous analyses showing that there are only
few regional concentrations of venture capital investments in the UK. The role of venture capital in
clusters development is evident (see Porter 1998, 2000) but there is an absence of strong clusters in
the UK – apart from the South East and a much smaller cluster in Cambridge (Martin et al 2001).
Following on from the “clustering versus dispersal” debate (see Martin et al. 2001), on the one hand,
venture capital can be more effective if concentrated in clusters of high-technology companies, and
as it is evident in chapter 5 the current market supports the concentration of venture capital
activities in specific agglomerations. One the other hand, there is increasing need for peripheral
regions to have access to early stage funding which is necessary for the development of
entrepreneurial activity and thus reducing regional inequalities. Clearly, meeting these apparently
opposing imperatives poses a real challenge, as it implies that both core and peripheral regions will
need to develop their own specialised venture capital agglomerations (Martin et al. 2001).
The finding of this thesis suggest that venture capital investments will continue to be clustered
around these three areas and any attempt to artificially disperse the venture capital activity around
the country will not be successful unless it is followed by a “dispersion of the demand for venture
capital investments”. It should not be expected that the supply of venture capital will automatically
create its own high-tech-based demand. Therefore, policies to create or stimulate regional venture
capital funds and investment activity need to be combined with other measures aimed at fostering

215
and supporting regional clusters of high-technology research, innovation, and small firm start-ups
(Martin et al. 2001, p.27)
Innovation policy
The literature also highlights the important role of venture capital in regional innovation. This thesis
contributes to this literature further but highlights some of its limitations. First, although innovation
policy approaches tend to support the value of interactions between different players of the regional
innovation system, the findings of this thesis suggest that interaction on each on it is not enough to
provoke success. In line with Lovering’s (1999) critical view that much of the discussion around
regional innovation system is little more than a debate about how to create collaborators, the
findings of this thesis suggest that there is a need for such collaborations and interactions to have
substance and quality.
More particularly, in the venture capital framework, the success of the investment depends on the
quality of “deal flow” i.e. investment opportunities in ventures. The search process of finding
promising deal flow suffers from information asymmetry as the entrepreneur frequently has better
information about their venture than the investor (Hall 2005). According to Peneder (2008) the
accuracy of the allocation of resources depends on two critical factors: (i) the availability of
information; and (ii) the ability to interpret information properly, i.e. knowledge. In addition, this
thesis argues that the ability to access this information is of similar significance - condition (iii). If we
assume that conditions (i) and (iii) have been meet in all UK regions, in the case of publicly backed
venture capital funds, it appears that the second condition - the ability to interpret information
properly - has been problematic. Despite the fact that publicly backed investment managers are
more actively involved in information seeking - and perhaps acquiring - procedures (i.e. interact
more often with innovation bodies than their counterparts from the private sector), they seem to be
less capable of interpreting this information properly. Possible explanations of why this is happening
lie with the different skills between publicly and privately backed fund professionals. Professionals
from the public venture capital funds have a wider network of active contacts which enable them to
reach valuable information, but they may not be as “smart” as their counterparts from the private
sector in terms of adding value (Shäfer and Shilder 2009).
Second, according to cluster policy approaches, regions need to build on their competitive
advantage with the aim of increasing indigenous capacity. Such approaches often encourage the
implementation of targeted initiatives in sectors that are seen as having a competitive advantage in
the region. Venture capital funds are often specialised in specific sectors allowing them to benefit

216
from a regional research institute or a cluster. As such, venture capital funds should be seen as an
integral part of a dynamic regional innovation system. However, in the case of the public VC
initiatives, funds were established without taking into consideration the regional innovation system,
its specific needs, characteristics and indigenous competitive advantages.
Third, although the role of the firm has been seen as critical within the existing literature on regional
innovation systems, the role of firm financing intermediaries has received considerably less analysis
despite its recognition as a central actor of the system (Zook 2004). In line with Lovering’s (1999)
critical view on the sole emphasis of regional innovation policies on firms as the only type of regional
economic actor, the findings of this thesis emphasise the equally important role of investors and of
public sector in the innovation community.
A well functioning regional venture capital community is a major contribution to a flourishing
regional innovation system as is evident from the examples of Cambridge and Silicon Valley.
However, such venture capital communities are privately driven. The findings of this thesis suggest
that venture capital communities which are publicly driven do not share the same attributes with
privately run venture capital communities. In that respect, missing in the existing literature on
venture capital and innovation is the role of the source of venture capital communities. In line with
the pioneer work of Cooke (2001) on private regional innovation systems, this thesis provides
evidence to support the argument that venture capital supports the regional innovation system to a
greater extent when it is privately driven or when it involves private players.
In addition, current publicly backed schemes have been implemented by adopting a top down
approach i.e. the central government created such schemes that could (in theory) be
homogeneously implemented in each UK region. Such schemes did not allow for adjustments or
changes to reflect regional heterogeneity. Although the aim of such initiatives was to increase
regional entrepreneurial activity, the theoretical thinking behind them ignored the fundamentals of
the evolutionary approaches that give space to regional complexities and allow regions to decide for
themselves on their particular needs and implementation methods. Future initiatives need to be
adjusted in different context, for example, in less developed regions such as Wales, initiatives
related to venture capital investment must be accompanied by other measures aimed at fostering
and supporting regional clusters of high-technology research, innovation, and small firm start ups.

217
8.2.2 Empirical contributions
In empirically pursuing the examination of the relationship between venture capital and regional
innovation, this thesis mainly built on the following premises: the work of Mason and Harrison
(2001, 2002) who found that there is large disparities amongst the UK regions in terms of venture
capital investments, with London and South East dominating the industry; on pioneering work of
Gompers and Lerner (2001) and Kortum and Lerner (2000) who found that venture capital spurs
innovation, the work of Brander et al. (2010) on the importance of moderate government venture
capital support in patents creation; and the work of various scholars that examined interactions
within the VC community (Sorenson and Stuart 2001; Rosenberg 2002; Smith 2005; Powell et al.
2002; Pinch and Sunley 2009) .
However, in this thesis an attempt has been made to go beyond the work of those researchers in
three ways. First, in their examination of the regional differences, Mason and Harrison (2001, 2002)
focused only on the supply of VC in this regions and the potential impact of the publicly backed VC in
a regional context; in contrast, although this thesis also focuses on the supply side, it investigates the
combination of VC in these regions by providing a detailed analysis of the extent of VC public
dependency of each UK region. It also elaborates on previous analysis undertaken by those
researchers on the potential implications of the public sector domination in several UK regions. The
regional dimension of the analysis is therefore of special interest as it is the first comprehensive
analysis of the source of VC investments (public or private) for each UK region.
Second, Kortum and Lerner (2000) measured the impact of VC in innovation using patents as a proxy
variable for business innovation. Barden et al. (2010) expanded the existing literature on the
relationship between venture capital and patenting by including an additional parameter in this
relationship, which is the source of venture capital (public or private). This thesis uses a much larger
UK sample than Barden et al. (2010) and expands the literature by analysing the relation between
patenting practices of VC backed firms paying particular attention to two aspects: first, their
acquisition of venture finance and progress through the venture capital journey and second, the
relationship between patent practices and source of VC finance in the UK regions.
Third, the literature review shows that there is a strong body of research concerned with VC-
business interactions, mainly focuses on the relationship between venture capitalists and investee
companies (Sapienza and Amason 1993; Smith 2005) and also the reasons that may influence such
relationship (Gorman and Sahlman 1989; Sahlman 1990). However, the analysis of VC with other
bodies outside the strictly VC-business framework is very scarce. This thesis extends the literature by

218
investigating, mapping and measuring the extent of interaction between venture capital funds with
other members of the finance community such as business angel networks, banks, companies
outside the portfolio. There is also little analysis on how the VC community interacts with the
outside world. Therefore, this thesis provides the first detailed empirical investigation of the
relationship between VC and other players of the innovation system such as universities incubators,
research institutes, regional authorities etc. Although it does not analyse empirical factors that may
be responsible for such relationship and it collects data from VC management only, it provides a new
insight into the differences in the extent of interactions between different types of venture
capitalists and the outside world. Existing studies do not distinguish between private and public
funds and therefore their findings may not necessary apply to publicly backed funds since such funds
often have additional or different to private funds objectives. Second, existing studies are mainly
concerned with the likely impact that interactions between VC funds and other bodies may have on
the fund’s financial performance and therefore do not investigate the likely impact of these
interactions in regional innovation. As a result, very little is currently known as to the role of the
publicly VC backed funds in spurring innovation at the regional level.
The thesis thus seeks to explore whether locality is still important for interactions for VC
professionals and how it may differ between regions led by publicly provided VC systems compared
with these led by private VCs.
In addition, the relationship between the venture capital industry and regional governments and
institutions of governance has been mainly explored from the point of the government’s role (and
the need) in supporting the industry (see Lerner 2002, 2009; Murray 2007). Overall, there has been
very little research to date on mapping and understanding the relationships between these different
bodies and how they may affect the overall innovation system (with the only exception of
universities perhaps - substantial research has been carried out into the role of VC in stimulating
university spin outs etc.). Various scholars suggest that substantial differences exist between
regions’ venture capital institutions; especially their ability to product and use tacit knowledge (Zook
2004). Based on Cooke’s, Mason’s and Zook’s observations, this thesis provided evidence to support
the relationship observed by Cooke et al. (2003) between public venture capital and regional
innovation in the US, showing that less innovative regions also tend to rely on public venture capital
in the UK .

219
8.3 Summary of research findings
8.3.1 Public venture capital investments
The first research question of the thesis was concerned with the changes in the supply of private
sector venture capital and the supportive public interventions at the national and the regional level.
At the national scale, the supply of venture capital recovered during the mid 2000s after its collapse
in the wake of the dotcom boom in 2001, but fell back in 2008 with the onset of the financial crisis.
During this period the provision of early stage venture capital has changed, with public sector
venture capital funds becoming more important, largely as a result of the growth of co-investment
schemes which invest alongside Business Angels and private sector funds. Both public sector funds
investing on their own and private investors investing on their own have declined in both relative
and absolute significance since 2004-2005. The composition of private sector investors has also
changed, with funds declining in significance and various types of Business Angels (high net worth
individuals and angel groups) becoming more important. At the regional scale, the disparity between
regions has been widened in terms of private equity as a whole but it has been narrowed in terms of
early stage investments. Several regions have more than their expected shares of early stage venture
capital investments, measured by number of deals, mainly due to the increase in publicly backed
investments. However, the high level of investment activity is largely a function of the public sector
venture capital funds, either investing on their own or in conjunction with private sector investors.
Indeed, over the period 2000-2008, the public sector has been involved in more than three-quarters
of the early stage investments made in the midlands and north, rising to more than 90 percent in
some regions in 2008. So, from a regional perspective the UK now appears to have two early stage
venture capital markets. In London, the South East and, to a lesser extent, the East of England,
private sector investors dominate investment activity, investing for the most part on their own
rather than with public sector co-investors. This contrasts with the remainder of the UK where the
early stage venture capital market is under-pinned by extensive public sector involvement. In some
regions this takes the form of free-standing investments by public sector funds whereas in other
regions it takes the form of co-investments with the private sector. Moreover, this gap between
London and the South East and the rest of the country has widened since 2001, during periods of
both declining and expanding venture capital investment activity.
The remarkable increase in co-investment activity is not surprising for various reasons. The most
important reason is that publicly backed funds are obliged to co-invest with private funds due to
state aid rules and due to the fact that one of their objectives is to leverage private money into the

220
market. Apart from this, there are other reasons that contribute to this unbalanced preferential of
co-investments. First, publicly backed funds are fairly new concept in the UK. Although 3i was
created in 1946, only at the beginning of the 21st century were a large number of funds created with
the direct support of the government. Therefore, it is not yet an established industry that has proved
itself in the market. Second, private funds perform significantly better than publicly backed funds in
terms of financial returns (see NAO 2009) making them desirable co-investment partners. Third,
anecdotal evidence suggests that professionals working at the publicly backed funds do not have the
experience of those from the private sector, nor do they receive the same remuneration incentives.
Forth, the objectives of a publicly backed fund quite often go beyond the financial returns and touch
social aspects (with all the implications this may have in the skills of the personnel of the fund and
the location and the industry of the funded companies). Fifth, all these parameters have created a
vicious circle, as the top graded companies may first approach the private funds and if rejected turn
to the public ones because they believe that they will get better support from the private
professionals, better contacts with the market and more possibilities for an exit.
As mentioned earlier, the fact that the overwhelming majority of early-stage venture capital
investments in many UK regions are publicly backed, in itself is not necessarily a cause for concern: if
the alternative is sensible investments not being made, public intervention may be justified.
However, the results of the NESTA and BVCA (2009) study imply that regions which are dominated
by public VC investment will be overwhelmed by VC backed companies that do not perform much
better than those that do not receive venture capital investments. In other words, regions that are
heavily dependent on public investments may not be able to receive the benefits of a functional
venture capital industry. This is also extended to innovation performance of these regions as chapter
6 indicates. The case study of Wales illuminates this further by showing that despite the significant
presence of publicly backed investments, the regional venture capital market has not succeeded in
attracting private investors, capitalising on the existing knowledge base of the region or making
significant number of successful exits. The findings from this case study suggest that the
environment that Wales start-ups face could be a major contributor to the absence of a vibrant
venture capital community in the region. Efforts to improve the conditions faced by those young
innovative companies that could become the ‘google’ of tomorrow should be made.
8.3.2 Relationship between venture capital and innovation
In order to investigate the suggestion that publicly backed investments may affect the innovation
performance of the regions, this thesis also analysed the relationship between VC activity and
volume of innovation and investigated whether this relationship is affected by the different types of

221
venture capital. More particularly, the analysis examined whether increases in venture capital
activity is positively associated with increases in volume of innovation. A strong and positive
relationship between VC activity and volume of innovation was observed. This part of the thesis was
also concerned with regional variations in VC activity and innovation performance of the twelve UK
regions.
An important finding of this analysis which is in line with the literature is that there is a clear
relationship between VC and patents. Companies with patents are more likely to secure follow up VC
finance compared with companies without patents. Due to the importance of patents in the VC
investments, the analysis examined whether there are any factors that may affect the company’s
possession of a patent, such as where the company is based, industry operation, source of VC
finance, amounts received and stage of finance. The results of the analysis show that there are
significant variations between companies that operate in different industries. Several industries have
significant higher number of patents. The thesis also examined the geographical aspect and the
volume of patents for companies that received VC investments at each particular region and found
that there are significant differences amongst UK regions.
The study also examined the role of difference sources of VC investment (public or private) in
supporting innovation. The empirical results suggest that co-investments are positively related with
companies with patents while solely public investments are negatively related with patents. This is
in line with Brander et al. (2010) work which illustrates that enterprises with moderate government
venture capital support, outperform enterprises with only private venture capital support and those
with extensive government venture capital support both in value creation and patent creation.
The findings of this chapter suggest that publicly backed funds do not support innovation to the
same extent that private funds do, when they invest alone, which has important implications for
regional development. Firstly, innovative companies that are based in regions with high dependency
on public VC funds may find it more difficult to raise VC finance compared with similar companies
based in regions with strong presence of private VC funds. As a result, such companies may decide to
relocate to regions with active private VC markets.
Secondly, co-investments (when public and private funds invest together) are more likely to back
companies with the potential to innovate than private or solely public investments. As a result,
regions with proportionally higher volume of co-investments would also demonstrate a higher
volume of VC backed companies with the potential to innovate. From a policy perspective, this
222
finding suggests that from an innovation point of view, public free standing investments should be
minimised while co-investments should be further encouraged.
In that respect, when a region is dominated by publicly backed funds, it would be hard for these
funds to find co-investors from the private sector and therefore the amount of co-investments
would be limited. Alternatively, public funds in publicly dominated regions should be encouraged to
attract private investments from outside investors. They could be seen as the pipeline of valuable
information about investable opportunities in peripheral regions to London and South East based
private VC funds. Again, the study of Wales highlights the need for regional publicly backed funds to
expand their remits outside their base region. While there are encouraging signs that Finance Wales
is expanding outside the regional borders, its success in attracting private co-investors into Wales
cannot be taken for granted without an improvement in the regional entrepreneurial environment.
Smaller publicly backed funds that do not possess the human or financial capital of Finance Wales
should rethink their operational model and seek to establish stronger links with private venture
capital funds from the south east of the country.
The statistically significant negative association between solely publicly backed investments and
patents, is not explained by sectoral structures or investments characteristics: differences between
regions, industry focus, investments size or investments stage. Such differences could be the result
of some unmeasured investment characteristics or the environment in which funds operate. The
plausibility of this suggestion was examined in chapter 7.
8.3.3 Ecology of interactions
The final research question of the thesis investigated whether the environment in which funds
operate may explain observed differences by examining the ecology of interaction between different
types of venture capital and regional innovation systems.
An important aim of government investment in VC (including regional venture funds) has been to
attract funds from private investors, and develop a vibrant private regional venture capital sector.
The evidence from the UK regions is that this has not happened as shown in previous chapters.
Outside London, Cambridge and the South East, public sector VC investments vastly outweigh
private sector ones. There may be various reasons for such failure such as the quality of regional
business (demand side problem), competence of VC professionals, structure of the publicly backed
funds or regional environment in which the funds operate. An attempt has been made to explain
what drives these differences in the performance of the funds by examining the dynamics of the

223
regional environment, the attitudinal and behavioural characteristics of the different types of
venture capital funds.
Three important findings emerged from this analysis. First, public dependence is strongly and
significantly associated with higher volumes of interactions with the outside world. The more
publicly dependent a fund is, the more it interacts with other players of the innovation system. This
suggests that publicly backed venture capitalists have the capacity to activate the search and
screening process over a wide network of contacts within a geographical space and can deploy the
extensive reach of their networks to identify and evaluate investments opportunities.
Second, the role of proximity is still important within the VC industry. Venture capitalists from both
the private and the public sector, are more likely to interact with their counterparts from the same
region.
Third, there is some evidence to suggest that operators of publicly backed funds are lacking close
connections with their counterparts from the private sectors. This may have implications in their
ability to approach and attract private heavy weighted venture capital funds and LPs that can
provide follow on investments or raise further funding for the fund.
This development reinforces earlier suggestions that there are currently two distinctive venture
capital communities in the UK. One which is privately led and includes London, South East and East
of England, and one which is publicly backed led and includes all the remaining regions. The
distinction between the two venture capital markets is not limited to the volume of VC activity and
other innovation indicators but it is expanded into the ecology of interactions between venture
capitalists and other players of the regional innovation system.
There are some common characteristics in the way that the two communities operate and also some
distinctive differences. On one hand, venture capitalists from both communities consider personal
business contact as the main source of deals. They also treat management expertise as the most
important strength of a business opportunity followed by the customers and market potential of the
product, and their most preferred industry for investments is software followed by medical devices.
On the other hand, venture capitalists employed by a publicly backed fund, interact with the other
bodies from the VC community more often than the private venture capitalists do and are more
engaged with the innovation community. Publicly backed venture capital professionals interact with
public funds within their region and business angel networks substantially more than their private
counterparts. Publicly backed venture capitalists interact twice as much with regional R&D
institutes, RDAs, law companies, specialists, managers of technology parks, and IP protection bodies

224
compared with their counterparts from the private sector. This result may be explained by the fact
that professionals from the publicly backed funds have the – sometime implied – objective to
interact with other players of the regional innovation system in order to foster the entrepreneurial
and innovation community. In order to meet these objectives, such professionals have established
links with the above bodies. Alternatively, public organisations such as RDA, technology parks and
incubators did not manage to attract the interest of the private VC funds. This is open to two
interpretations. First, either the professionals of these bodies are not active enough in the area and
have not made the private VC funds aware of their pool of opportunities, or second these
organisations do not contain a pool of business proposals that the private venture capitalist would
be interested in investing.
Overall, public funds are mainly responsible for most of the interaction that is taking place between
the business angel networks and the formal VC community. This is an important finding that policy
makers need to take into consideration given the fact that Business Angels are emerging as
prominent players in the early stage risk finance community. This relationship is also reflected in the
source of deals.
It is widely acknowledged that interactions between venture capitalists and other players promotes
tacit knowledge (Zook 2004), but the results of this thesis suggests that interaction on its own is not
enough to provoke success. Although publicly backed venture capitalists interact to a greater extent
than the private counterparts, they experience less success (measured as financial performance or
business performance), (NAO 2009; NESTA 2009). The financial performance of the publicly backed
fund has been negative. According to the NAO, most of the publicly backed funds recorded negative
returns. Although there is no comprehensive analysis as to what have caused publicly backed funds
negative performance, it may be suggested that the publicly backed funds have invested in
companies without great potential to grow.
Recent work by NESTA (2010a) has shown that for UK firms, being innovative is strongly associated
with high growth, with innovative businesses growing twice as fast as non-innovative ones. Given
this strong linkage between innovation and growth, the evidence of this thesis provide some support
to the argument that publicly backed funds have invested in companies with less potential to grow
since companies that received only investments from publicly backed funds did not have the same
innovation potential as those that received investments from private funds. However, when public
funds co-invest with private funds, are more likely to invest in companies with the potential to
innovate compared with those that the private funds invest in.

225
8.3.4 The region of Wales
The region of Wales represents a publicly led regional innovation system in which all major players
are either a public organisation or publicly backed entities. The case of Finance Wales is not an
exception. Clearly, in the absence of Finance Wales, venture capital activity in Wales would have
been far less as there is no evidence that Finance Wales has crowded out private investors coming
from the rest of the region.
The innovation system in Wales is publicly oriented and therefore it is not surprising that the venture
capital community in Wales is dominated by a publicly backed fund, namely Finance Wales. It is
however important to note that the Wales venture capital community differs from other publicly
dominated venture capital communities in English regions. More particularly, the public funds that
operate in English regions are relatively small and have limited ability to follow up their investments.
In contrast, Finance Wales, which is the main investment vehicle in Wales, is a large and established
financial institution with larger funds under management. Despite this important difference, the
Wales venture capital community shares several characteristics with those in other publicly
dominated regions.
More particularly, publicly backed investments count for the vast majority of all venture capital
investments made in Wales. In addition, venture capital professionals in Wales exhibit similar
behaviour characteristics with their counterparts in other publicly oriented venture capital regions,
in terms of the relationship to the “external environment”. The ecology of interactions amongst
venture capitalists and other players of the regional innovation system in Wales shares similar
characteristics with the ecology of interaction of the average publicly backed UK region.
However, Welsh venture capital professionals interact significantly less with several bodies of the
finance community compared with their counterparts from both the public and the private sector
(companies outside their portfolio, other private venture capital funds inside or outside Wales and
other public venture capital funds within Wales). Although Finance Wales shares common
organisational characteristics with private VC funds, it is clearly lagging a more active involvement
with the private VC community which may be due to the absence of privately own VC funds
operating in the region. In addition, and as discussed earlier, publicly backed funds often have social
objectives that need to be met , as well as an ethos of social responsibility. Finance Wales is not an
exception. This has implications for its operational activities and the skills of its personnel. As a
publicly backed fund, FW is also constrained by state aid rules and geographical restrictions (i.e. it
can only invest in Wales).

226
Interestingly, Wales is the only publicly oriented venture capital community with a relatively ‘fair
share’ of early stage venture capital investments (in both, number of deals and amounts invested),
perhaps reflecting the ability of FW to make more investments due to its relatively larger assets
under management. This may suggests that there is no shortage in the supply of finance to Welsh
based companies seeking venture capital finance, or at least that this shortage, if exists, it is smaller
than in other publicly oriented regions.
Nevertheless, there is still an absence of a vibrant venture capital community in Wales, capable of
attracting private investors into the market and capitalising on the excellent research outcomes that
its main university is undoubtedly capable of producing.
This suggests that the Welsh environment could be largely responsible for the underdevelopment of
a vibrant venture capital community. For example, the research outputs from the universities or
research laboratories cannot be effectively commercialised within the regional innovation system.
There are three main reasons that support this argument. First, despite the establishment of FW and
the relatively large number of early stage investments to Welsh companies, it is clear that the there
is still an absence of a vibrant privately led VC community in the region. Second, there are a
relatively small number of investments made to Welsh companies by funds located outside Wales
(which again may indicate the lack of investable opportunities in Wales). Finally, despite the history
of venture capital investments, FW has not had numerous successful exits which is the ultimate
indication of a successful venture capital environment.
The latter point is of particular importance for two reasons. First, it indicates either a poor
performance of FW venture capital investment managers or a poor local business environment
incapable of producing companies that can exit. However, FW is performing well in other types of
financial instruments such as mezzanine finance (interviews), indicating the calibre of its personnel.
Second, without a successful track record, it would be difficult (if not impossible) for FW to raise
money from private investors (limited partners) if it wishes to become independent from the public
sector. It is the case of a ‘vicious circle’ where neither private funds can be established in Wales nor
it is sensible to abolish the existing public funds. Without publicly backed funds, Wales would have
been in the bottom part of the list of venture capital investments by region in the UK.
Even if Finance Wales decides to be privatised (following the example of the Scottish Equity
Partners, which has been privatised and now invests without regional restrictions), it may find it
difficult to effectively operate within a publicly oriented regional innovation system that does not
spur entrepreneurial activity. Realising the issues provoked by regional constraints, Finance Wales

227
has already expanded to other regions of the UK, opening offices in the North West and North East
(after two successful applications to run local funds in these two regions). Although these funds are
not venture capital funds, FW is laying the ground for a more active involvement in the venture
capital market if at a later stage its decides to pursue this. Interestingly, the aspiration of Finance
Wales is to eventually become a self-sustained privately led organisation (interviews).This is a
positive sign indicating the professionalisation of the organisation which, if it is to be successful in
long term, it needs to expand outside the regional borders.
The evidence shows the progress that Wales has made over the last two decades, but it also
highlights the important challenges that lie ahead. Whether the Welsh venture capital industry will
be able to match the activity (in terms of quality and volume) of the privately led regional venture
capital markets in the next decade will depend on the decisions taken by fund managers and
policymakers among others. The findings in this case study can help inform investors’ and fund
managers’ decisions, but they have particularly important implications for Wales’s policymakers.
Policy makers should be more interested in improving the Welsh entrepreneurial environment
rather than simply pouring more money into the market by establishing new publicly backed funds.
Wales does not need more investments in venture capital, but it is essential that the investments
made are made to good companies. Therefore more actions need to be taken in order to improve
the quality of the entrepreneurial environment in the region.
A future research study could look in more detail at the entrepreneurial environment of Wales, by
empirically examining the characteristics of the portfolio companies of FW and other funds
operating in the region. What are the characteristics of companies that Welsh venture capitalists
back and how do they compare with those backed by other publicly backed and private venture
capital funds around the country? How can the lessons learned from the Wales experience in terms
of the role of venture capital and regional innovation, influence relevant policies in other less
developed regions?
8.4 Policy implications and contributions
The thesis contributes to the literature on the role of government in fostering venture capital activity
by examining the investments and source of finance in the UK and its regions. Perhaps the most
important contribution is the investigation of the relation between the type of VC funds (private or
public) and the investment activities in which they are engaged. The data allows the relations
between private and public VC investments to be compared across regions and therefore brings
some light into the underdeveloped literature on the regional variations in venture capital markets.

228
However, any attempt to produce policy recommendation in the area must take into account the
complexity of the venture capital investment, in fact:
“given the complexity, suggesting how venture capitalists should respond to regional variations in
funding, and recommending government policies to promote regional supplies of risk capital – let
alone high technology based economic development – are far from straightforward issues” (Martin
et al. 2001, p.25).
The findings of this thesis highlight the highly localised nature of venture capital activity and this has
a variety of implications for policy makers wishing to stimulate venture capital activity at the regional
level. Those regions that are dependent on the public sector for early stage venture capital therefore
face two challenges. First, there is no evidence to suggest that this approach has been effective in
stimulating indigenous private investments and currently publicly backed deals dominate several
regional VC markets. Second, existing regional venture capital funds are approaching their lifespan
and the limitations of regionally focused funds have been widely outlined (Murray 1998, 2007;
NESTA 2009, 2009a). The limited success of the current public interventions can be attributed to
four main assumptions made by their designers.
First, the regional dimension of the schemes was based in the implicit assumption that
administrative boundaries are a sensible definition of regions. However, “region” is both not clearly
understood or unequivocally defined (Bristow 2010). Especially in the field of entrepreneurship and
venture capital, regional restrictions have been seen as a major drawback in the success of venture
capital activity (NESTA 2009). Regions are now shaped more by relational flows of innovation and by
their networks, rather than their geographical or administrative boundaries (see Uyarra 2007).
Second, such initiatives were based on the assumption that all regions contain an untapped pool of
smart entrepreneurs (investable opportunities) and such initiatives will unleash a wave of new
entrepreneurs. It may well be true that all regions should contain some very smart entrepreneurs
that cannot progress due to lack of finance. However, this does not mean that the region has or can
develop an entrepreneurial culture by simply increasing the supply of finance in the region. This is of
course not to say that all regions without an existing entrepreneurial culture should be left
unsupported. However, only regions with strong evidence of development potential can truly
benefit from venture capital funds. Such evidence may include strong research led institutions,
developed infrastructure and established regional ability to absorb new knowledge. In less
developed regions, initiatives related to venture capital investment must be accompanied by other

229
measures aimed at fostering and supporting regional clusters of high-technology research,
innovation, and small firm start ups.
Third, this leads to a further assumption which is related to the heterogeneity of regions. Uneven
development and regional heterogeneity has been in the centre of the debate between regional
geographers and economist for several decades. A major drawback in the success of all government
schemes has been the remarkable failure of policy makers to spot regional heterogeneity within the
UK. The current schemes ignore regional differences and characteristics and treat all regions in the
same away. For example, the schemes had the same objectives whether there were established in
London or in North East. This is a fundamental error that the notion of a simple supply gap
overlooks. In the words of Martin et al. (2005):
“the way in which the localised form of the industry is based on a dynamic learning process in which
demand and supply processes combine with their embeddedness in social networks and individual
perceptions in a mutually reinforcing way. Less-favoured regions, with low investment rates, few
local venture capital firms, and a dearth of experienced specialist intermediaries, may thus be
trapped in a situation of both depressed demand for and supply of venture capital investment”
(Martin et al. 2005, p.1).
This leads to the fourth assumption related to the design of the schemes, and more particularly the
tendency of these policies – both in the UK and elsewhere – to be overwhelmingly supply-side in
approach, with little attention given to the demand side (Beatty and Fothergill 2004). As Queen
(2002) noted:
“the temptation of all policy makers is to target the superficially attractive short-term policy of
subsidised venture capital on the ‘supply side’. Tempting as it might be, this should be avoided if
more sustainable growth businesses are the objective” (Queen 2002, p.5).
8.4.1 What kind of policy is needed?
As shown in chapter 5, public funds now participate in around 42% of venture capital deals in the
UK. However it is questionable whether public financing would ever invest in ventures otherwise
ignored by other financiers (Peneder 2008). There is a need for such initiatives to change in order to
incentivise private investments in the early stage market, foster the demand side and accommodate
regional heterogeneity.

230
Incentivise private investments
One of the primary objectives of the government intervention in the area has been to increase the
availability of finance to early stage companies by leveraging private money and sharing the inherent
risk that early stage investments entail. However, what really determines the supply of venture
capital according to Gompers and Lerner is:
“simple: the willingness of investors to provide money to venture firms. This willingness in turn hinges
on the kinds of returns these investors expect to receive from their venture activity compared with
what they think they can earn from other investments...” (Gompers and Lerner 2001, p.119).
In fact, the government schemes’ adopted a subordinate role which allowed greater returns to be
made by private investors. However, even if government interventions made it cheaper for private
funds to invest in early stage, private investors are continuing to leave the early stage and prefer to
invest in the later stages where return potential is higher. This is mainly due to the very poor returns
made in the early stage market in recent years (NESTA 2011). The involvement of the General
Partner and any private sector Limited Partners in a publicly backed fund will require the engineering
of more attractive profit expectations in order for them to be willing to participate (Maula and
Murray 2003). If the compensation structure is identical to those of venture capital funds operating
at other (later) stages of the investment cycle, the returns to the management partners of a
governmental program are likely to be lower (Jääskeläinen et al. 2002).
As a result, the government’s attempt to increase the supply of private money into the early stage
finance has been approached from the wrong angle and regardless of the volumes of money the
government allocates to the early stage finance, unless returns are favourable, private investors will
refrain from the market and future governments will keep subsiding the industry.
Clearly, leveraging private capital is better value for the Government. The challenge is to provide
terms on which private capital will be willing to invest in the early stage market. The low returns in
the venture capital market makes them unattractive for private investments as it entails high risks
and small rewards. The risk is inherent and it will always remain in this area of the market but
market professionals and high-skilled venture capital investors can reduce it. The issue of small
rewards to private investors is something that the government can effectively deal with by providing
the appropriate structure to diminish low returns.

231
Avoid geographical restrictions
A number of publicly backed funds are geographically focused, with a requirement to concentrate on
certain English regions or UK nations. Although venture capital certainly has a role to play in
stimulating regional economies, limiting funds to regions has significant risks. It constrains funds’
ability to source high-quality investments as economic activity frequently crosses the borders
between regions, which in the UK are relatively small in geographic terms. This means that a fund
that can only invest in its local region is likely to turn down many potentially attractive but non-local
investments it encounters, reducing its chances of striking good deals. In addition, since venture
capital is a priori locally concentrated (see Mason 2007 and Chen et al. 2010), there is no need to
impose artificial regional restrictions.
Foster the demand side
The lack of private VC investments in several regions is driven by the lack of investable opportunities
in these regions. This requires grants, mentoring and support that will prepare companies to receive
VC finance. First, there is a need to foster the development of regionally-based angel groups. With
traditional venture capital funds facing challenges to their investment model, angel groups are now
assuming a much more significant role as a source of early stage venture capital. Equally important is
that their hands-on involvement plays a significant accreditation role and moves their investee
businesses to the point where they are potentially investable by venture capital firms (Madill et al.
2005).
Second, the pipeline of information between traditional sources of investable opportunities such as
universities, incubators, laboratories, technology parks and VC professionals is not well established
in the UK and needs to be strengthened. Given the emphasis that venture capitalists place on
trusted networks for deal referrals, there is a need to develop funding ‘pipelines’ (Bathelt et al.
2004) between the key players in the regional entrepreneurial eco-systems (e.g. universities,
incubators, angel groups, local venture capital funds) and non-local private sector venture capital
sources.
Third, the objectives of the public funds should vary according to regional needs. Less favoured
regions may not fully benefit from a conventional venture capital fund. Instead, funds established in
these regions should assume different responsibilities. For example, public venture capital programs
could play a role in certifying new firms to outside investors (Lerner 2002). This is one way to
overcome the informational asymmetries problem identified in the literature. The idea is that

232
government programs can identify and support the creation of new firms in industries that do not
attract private venture capital (for example, technology-intensive industries).
Promote co-investment schemes
It is essential that a fully functional regional innovation system should provide business finance
through vehicles based in partnership between public and private players of the regional innovation
system. All the evidence from this thesis suggests that the investment model that encourages public
private co-investments seems to be the most appropriate for various reasons. Venture capitalists
from public funds may not have the skills required for nurturing high growth ventures. Therefore,
there is a need to attract highly qualified and experienced private VC professionals in the regions.
Co-investment is a learning process for the public funds and eventually professionals from the public
funds will acquire the same skills as their private counterparts by syndicating with them (as it
happens when local funds syndicate with international funds, see Chemmanur et al. 2010). Co-
investment schemes also help publicly backed VCs to establish a track record that will eventually
allow them to attract better quality businesses and raise further capital from private LPs.
Public fund venture capitalists should be seen as conduit of information and deal flow between the
innovation community and the venture capital community. They have the ability to mobilise their
network but perhaps they do not have as yet the ability to identify good investment opportunities or
effectively support their portfolio companies. It should be a two way process: a learning process for
the public venture capitalists to become better professionals, and for private venture capitalists a
way of making the connection with the innovation community (e.g. universities, laboratories and
incubators) that still remains a largely untapped source of innovative businesses.
8.5 Future research questions
The research revealed several research questions that could be addressed in future studies. First,
there is an assumption amongst the VC industry stakeholders that top graded companies may first
approach the private funds and if rejected turn into the public ones and this creates a vicious circle
for the public venture capital funds as they will struggle to perform well. At the moment, there is not
any comprehensive analysis which examines the differences in the quality of the companies when
approaching private and publicly backed funds. This will be an interesting future research topic.
This analysis of the relationship between venture capital and innovation has several important
limitations. First, the time when the company was granted the patent is not known. Therefore, it
was not possible with the given data to examine whether the patent was granted before or after the

233
VC investment. A future study could capture the date of patent application and associate it with the
date of VC investment. Second, although the literature accepts that patent creation is an important
figure for innovation, additional proxies for innovation could be used in future analysis such as
licenses, trademarks, number of new products in the market, copyrights etc. Third, additional
depended variables could be used in future analysis such as the performance of the VC backed
companies and its association with patent and public or private investment. In this sense,
performance could be defined as company turnover, employment growth etc. Finally, a further
research could control for other characteristics of the firm that may affect its innovation outputs,
such as size of firm, foreign ownership, export activity, openness, structure, R&D activity etc.
One of the limitations of this ecology of interaction analysis has been the relatively small sample size
which is a result of the reluctance of venture capitalists to participate in academic studies. Several
other limitations should also be kept in mind in interpreting the results of this study. First, because
the data is based on self-reports, one must be cautious as regards their analysis and interpretation.
Future studies may seek to supplement the self-reported measures used in this study with objective
measures of interactions (such as number of emails exchanged, number of meetings attended,
duration of telephone calls, and number of visits to the sites).

234
9 REFERENCES
1. Acharya, V., Franks, J. and Servaes, H. 2007. Private Equity: Boom and Bust? Journal of
Applied Corporate Finance, Morgan Stanley, 19(4), p. 44-53.
2. Achen, C. 1982. Interpreting and using regression, Series: Quantitative Applications in
the Social Science, Sage University Paper
3. Acs, Z., Anselin, L., and Varga, A.. 2002. Patents and Innovation Counts as measures of
regional production of New Knowledge, Research Policy, 31, p.1069-1085
4. Adams, J., Robinson, P. and Vigor, A. 2003. A new regional policy for the United
Kingdom, IPPR, London
5. Allen, N. 2001. English regional venture capital funds: correcting market failure or
subsidising private investors? MBA dissertation, Imperial College of Science, Technology
and Medicine, London.
6. Allen, D.N. and McCluskey, R. 1990. Structure, policy, services, and performance in the
business incubator industry. Entrepreneurship Theory & Practice, 15(2), p. 61–77.
7. Almeida Capital. 2005. A Mapping Study of Venture Capital Provision to SMEs in England
and Wales, Small Business Service
8. Altman, E. 2007. Global Debt Markets in 2007: New Paradigm or the Great Credit
Bubble? Journal of Applied Corporate Finance, 19(3), pp. 17-31.
9. Amin, A. 1998. Globalisation and regional development: a relational perspective,
Competition and Change, 3, pp.145-165
10. Amin, A. and Thrift, N. 2000. What kind of economic theory for that kind of economic
geography? Antipode 32 (1), p. 4-9
11. Amuedo-Dorantes, C. and Kimmel, J. 2005. Moonlighting Behavior over the Business
Cycle, Discussion Paper Series, Institute for the Study of Labor, IZA DP No. 1671
12. Babbie, E. 2004. The Practice of Social Research. Wadsworth: Belmont, CA.
13. Bathelt, H., Malmberg, A., Maskell, P., 2004. Clusters and knowledge: local buzz, global
pipelines and the process of knowledge creation. Progress in Human Geography, 28 (1),
31–56
14. Beatty, C. and Fothergill, S. 2004. The diversion from ‘unemployment’ to
‘sickness’across British regions and districts Sheffield, Centre for Regional Economic and
Social Research
15. Bergemann, D. and Hege, U. 1998. Venture Capital Financing, Moral Hazard, and
Learning, Journal of Banking and Finance, 22, p. 703–735
16. BIS. 2011. Annual report on Business Angel Activity 2010

235
17. Boschma, R.A. and Frenken, K. 2005. Why Is Economic Geography not an Evolutionary
Science? Towards an Evolutionary Economic Geography, Papers in Evolutionary
Economic Geography, 05.01, Urban and Regional research centre Utrecht (URU)
18. Brander. J., Du, Q. and Hellman, T. 2010. Government as venture capitalists: striking the
right balance, The Global Economic Impact of Private Equity Report 2010, in
Globalisation of Alternative Investments, World Economic Forum Working Papers
Volume 3
19. Brenner, N. 1998. Global Cities, 'Glocal' States: Global City Formation and State
Territorial Restructuring in Contemporary Europe. International Political Economy, no. 1,
pp. 1-37.
20. Bristow, G. 2005. Everyone’s a ‘winner’: problematising the discourse of regional
competitiveness, Journal of Economic Geography , 5, p. 285–304.
21. Bristow, G. 2010. Critical Reflections on Regional Competitiveness. Theory, Policy,
Practice. London: Routledge.
22. Bryman, A. 2004. Social Research Methods. OUP Oxford
23. BVCA. 1997. Report on Investment Activity, London: BVCA
24. BVCA. 1998. Report on Investment Activity, London: BVCA
25. BVCA. 1999. Report on Investment Activity, London: BVCA
26. BVCA. 2001. Report on Investment Activity, London: BVCA
27. BVCA. 2003. Report on Investment Activity, London: BVCA
28. BVCA. 2006. Report on Investment Activity, London: BVCA
29. BVCA. 2007. The Economic Impact of Private Equity in the UK 2007 Report. London
30. BVCA. 2008. Creating business from ideas; Improving the availability of venture capital
in the UK, November 2008
31. BVCA. 2008. Report on Investment Activity. London: BVCA
32. Bygrave, W. B., and Timmons, J. A. 1992. Venture Capital at the Crossroads, Boston:
Harvard Business School Press
33. CBR. 2008. Financing UK Small and Medium-sized Enterprises, the 2007 Survey,
Cambridge University
34. CBR. 2009. Start-up finance: The role of Micro Funds in the financing of new technology-
based firms, Cambridge University
35. Cegielski. C., Rebman, C., Kitchens, F. and Lang, T., 2003. What is a dot-com worth? An
exploration of the value estimates of information technology-based firms. Journal of
Computer Information Systems. 43(2).
36. Charles, D., Nauwelaers, C., Mouton, B. and Bradley, D. 2000. Assessment of the
regional innovation and technology transfer strategies and infrastructure (RITTS)
scheme, Final Evaluation report August 2000
236
37. Chemmanur, T. J., T. Hull, and Krishnan, K. 2010. Do local and international venture
capitalists play well together? A study of international venture capital investments,
Working paper, Boston College.
38. Chen, H., Gompers, P., Kovner, A., and Lerner, J. 2010. Buy local? The geography of
venture capital. Journal of Urban Economics: Special Issue: Cities and Entrepreneurship,
67(1), p. 90-102
39. CI Research. 2007. RVCF and EGF interim evaluation, Qualitative Research Paper, URN
09/1478
40. Clark, G. L. 1998. Stylized Facts and Close Dialogue: Methodology in Economic
Geography', Annals of the Association of American Geographers, 88(1), p. 73-87
41. Clark, R., 1988. Venture capital in Britain, America, and Japan, London: Croom Help.
42. CM International. Finance Wales: A reflection on the first 5 years. Unpublished
43. Cooke, P. 1985. Regional innovation policy: problem and strategies in Britain and
France, Environment and Planning C: Government and Policy, 3, p. 253-267
44. Cooke, P. 2003. Economic globalisation and its future challenges for regional
development” Int. J. Technology Management, 26(2/3/4), p. 401-420
45. Cooke, P. 2008. Regional innovation systems: origin of the species, International
Journal of Technological Learning, 1(3), p. 393-409
46. Cooke, P. (ed.), 1995. The Rise of the Rustbelt. Revitalizing Older Industrial Regions.
Taylor & Francis Books, London
47. Cooke, P. 2001. Knowledge Economies Clusters, learning and cooperative advantage
London, New York, Routledge
48. Cooke, P. 2002. Regional Innovation Systems: General Findings and Some New Evidence
from Biotechnology Clusters, The Journal of Technology Transfer, Springer Netherlands,
Volume 27(1), p. 133-145
49. Cooke, P. 2003. Strategies for Regional Innovation Systems: Learning Transfer and
Applications, UNIDO – United Nations Industrial Development Organisation, Vienna,
2003,
50. Cooke, P. and Morgan K. 1998. The Associational Economy: Firms, Regions, and
Innovation, Oxford University Press, Oxford
51. Cooke, P. and Morgan, K. 1994, The Creative Milieu: A Regional Perspective on
Innovation, In: The Handbook of Industrial Innovation, M. Dodgson, R. Rothwell (eds.),
Edgar Elgar Publishing.
52. Cooke, P. M. Uranga and G. Etxebarria. 1997. Regional innovation systems: Institutional
and organisational dimensions”, Research Policy, 26, p. 475-491
53. Cooke, P., Davies, C. and Wilson. R. 2002. Innovation Advantages of Cities: From
Knowledge to Equity in Five Basic Steps. European Planning Studies, 10(2), p. 233-250

237
54. Corvers, F. 2000. Regional Innovation Policy at Community level-Evidence from the
RITTS Programme to Promote Regional Innovation Systems. Fourth International
Conference on Technology Policy and Innovation on Learning and Knowledge Networks
for Development. Curitiba, Brazil, 28-31 August 2000
55. Daft, R. L. and Lengel, R. H. 1986. Oraganizational Information Requirements, Media
Richness and Structural Design. Management Science. 32(5), p. 554-571.
56. Dave, V., and Rein, P., 2004. Inflating the bubble: examining dot-com investor
behaviour, Venture Capital, 6(1), pp. 1-22
57. De Clercq, D., P.K. Goulet, M. Kumpulainen, and Mäkelä, M. 2001. Portfolio
investment strategies in the Finnish venture capital industry: A longitudinal study.
Venture Capital 3(1): 41-62
58. Deas, I. and Ward, K. G. 2000. From the ‘new localism’ to the ‘new regionalism’? The
implications of the Regional Development Agencies for local-regional tensions. Political
Geography, 19 (2), p. 273-292.
59. Dee, N., and Minshall, T. 2011. Finance, Innovation and Emerging Industries – a Review.
Institute for Manufacturing, at the University of Cambridge Engineering Department
60. DIUS. 2008. Innovation Nation
61. Druilhe, C. and Garnsey, E. 2004. Do academic spin-outs differ and does it matter? The
Journal of Technology Transfer, 29(3-4), p. 269-285
62. DTI. 2001. UK innovation survey
63. ECOTEC. 1999. Ongoing Evaluation of Regional Innovation Strategies Pilot Projects,
ECOTEC Research and Consulting Ltd. 1999
64. European Commission. 2002. Benchmarking Business Angels. Brussels: Office for
Official Publications of the European Communities.
65. European Commission. 2006. Investment readiness; Summary report. Brussels: Office
for Official Publications of the European Communities.
66. European Commission. 2009. Interim Evaluation of the entrepreneurship and innovation
programme, Final Report. Brussels: Office for Official Publications of the European
Communities.
67. EVCA. 2009. Annual Survey 2009
68. Feser, E., 1998. Enterprises, External Economies, and Economic Development. Journal of
Planning Literature, 12:283
69. Florida, R. 1995. "Towards the learning region", Futures, 27(5), p. 527-536.
70. Florida, R. and D.F. Smith jr.1991. Venture capital formation, investment, and regional
industrialisation, Annals of the Association of American Geographers, 83, p. 434-451.
238
71. Florida, R. and D.F. Smith jr.1992. Venture capital’s role in economic development: an
empirical analysis, in E. S. Mills and J.F. McDonald (eds.) Sources of Metropolitan
Growth, New Brunswick, NJ: Center for Urban Policy Research, p. 183-209.
72. Florida, R.L., and Kenney, M. 1988. Venture capital-financed innovation and
technological change in the USA. Research Policy, 17, p. 119-137
73. Freeman, C., 1992. The Economics of Hope, London: Pinter Publisher
74. Frenz, M. and Oughton, C. 2005. Innovation in the UK Regions and Devolved
Administration: A Review of the Literature, Final report for the Department of Trade
and Industry and the Office of the Deputy Prime Minister, London, June 2005
75. Fried, V. H. and Hisrich R. D. 1994. Toward a model of venture capital investment
decision making. Financial Management, 23 (3), p. 28-37.
76. Fritsch, M., and Schilder, D. 2006. Does Venture Capital Investment Really Require
Spatial Proximity? An Empirical Investigation, Technical University Bergakademie
Freiberg, Faculty of Economics and Business Administration, Working Paper 07/2006
77. Fuchs, G. and Shapira, P. (Eds.). 2005. Rethinking Regional Innovation and Change: Path
Dependency or Regional Breakthrough, Series: Economics of Science, Technology and
Innovation. 30
78. Global Insights. 2007. Venture Impact: The Economic Importance of Venture Capital
Backed Companies to the U.S. Economy. Washington DC: Global Insights and NVCA.
79. Gompers P., and Lerner, J. 2001. The venture capital revolution. Journal of Economic
Perspectives, 15(2), p. 145-168
80. Gompers, P. 1995. Optimal investment, monitoring, and the staging of venture capital.
Journal of Finance, 50, p. 1461–89
81. Gompers, P., A. Kovner, J. Lerner and D. Scharfstein. 2010. Performance persistence in
entrepreneurship. Journal of Financial Economics, 96(1), p. 18-32
82. Gorman, M. and Sahlman A.W. 1989. What do venture capitalists do? Journal of
Business Venturing, 4, p. 231-248
83. Griliches, Z. 1990. Patent Statistics as Economic Indicator: A Survey. Journal of Economic
Literature 28, p. 1661-1707
84. Griliches, Z. 1998. Patent Statistics as Economic Indicators: A Survey, NBER, p. 287 - 343
85. Guellec, D., and van Pottelsberghe, B., 2000. Applications, grants and the value of
patent, Economics Letters, 69, p. 109-114.
86. Gupta, A.K., and Sapienza, H. 1992. Determinants of venture capital firms' preferences
regarding the industry diversity and geographic scope of their investments. Journal of
Business Venturing, 7(5), p. 347-362.
87. Haeussler C., D. Harho and E. Mueller. 2009. To Be Financed or Not. . . - The Role of
Patents for Venture Capital Financing. CEPR Discussion Papers 7115

239
88. Hall, B. 2005. “The Financing of Innovation”. In Blackwell Handbook of Technology and
Innovation Management , Edited by: Shane, S. Oxford: Blackwell Publishers, Ltd
89. Hall, B. H. and Lerner, J. 2010. The Financing of R&D and Innovation, UNU-MERIT,
Working paper series 2010-012
90. Hall, B.H., Jaffe, A.B. and Tratjenberg, M. 2001. The NBER Patent Citation Data File:
Lessons, Insights and Methodological Tools, NBER Working Paper 8498
91. Harris, M. N. & Rogers, M. & Siouclis, A. 2001. Modelling Firm Innovation Using Panel
Probit Estimators. Melbourne Institute Working paper, No 20/01. University of
Melbourne, Melbourne, Australia
92. Harrison, J. 2006. Re-reading the new regionalism: A sympathetic critique Space and
Polity. 10(1), p. 21 - 46
93. Hassink, R. 2005. How to unlock regional economies from path dependency? From
learning regions to learning clusters, European Planning Studies, 13(4), p. 521-535
94. Hayton, K., Thom, G., Percy, V., Boyd, C. and Latimer, K. 2008. Evaluation of the
Scottish Co-Investment Fund, A Report to Scottish Enterprise, Glasgow
95. Hellman, T. 1998. The allocation of control rights in venture capital contracts, Rand
Journal of Economics, 29(1), p. 57-76
96. Hellman, T., and Purin M., 2002. Venture capital and the professionalisation of start-
ups: Empirical Evidence, Journal of Finance, 57, p. 169-197
97. Hellmann, T., and Puri, M., 2000, The interaction between product market and financing
strategy: The role of venture capital, Review of Financial Studies, 13(4), p. 959-984.
98. Hicks, E.A., Lee, S-G., 1994. Regional economic impacts of federal R&D by funding
source and performer type. Regional Studies 28, p. 619-632.
99. Hirukawa, M. and M. Ueda. 2008. Venture Capital and Innovation: Which is First? CEPR
Discussion Paper No. DP7090. Available at SSRN: http://ssrn.com/abstract=1344669
100. HM Revenue. 2008. New Industry New Jobs
101. HM Treasury and Department of Business. March 2008, Enterprise and Regulatory
Reform BERR: Enterprise: Unlocking the talent, London
102. HM Treasury. 2003. Bridging the Finance Gap: next steps in improving access to growth
capital for small businesses, HMSO
103. Hochberg, Y., A. Ljungqvist, and Lu, Y. 2007. Whom You Know Matters: Venture Capital
Networks and Investment Performance. Journal of Finance, 62, p. 251 − 301.
104. Howells, J. 2005. Innovation and regional economic development: A matter of
perspective? Research Policy, 34, p. 1220-1234
105. Hudson, R. 1999. The learning economy, the learning firm and the learning region: a
sympathetic critique of the limits to learning, EURS, 6(1), p. 59-72.

240
106. Hudson, R., 2002. Fuzzy concepts and sloppy thinking: reflections on recent
developments in critical regional studies”, Regional Studies, 37 (6&7), p. 741-746
107. Hudson, R., Odgaard, M, 1998. The “misplacement” of learning into economic
geography? Paper presented at Economic and Political Restructuring in Contemporary
Europe , Univ. of Oslo, mimeo.
108. Jääskeläinen, M., Maula, M., and Seppä, T. 2002. The Optimal Portfolio of Start-Up
Firms in Venture Capital Finance: The Moderating Effect of Syndication and an
Empirical Test. Paper presented at the Babson Kaufmann Entrepreneurship Conference
2002
109. Jaffe, A. B., and Lerner, J. 2004. Innovation and Its Discontents. Princeton University
Press, Princeton
110. Johnson S, Webber D j and Thomas W. 2007. Which SMEs use external business advice?
A multivariate subregional study, Environment and Planning A, 39(8), p. 1981-1997
111. Kanniainen, V. and Keuschnigg, C. 2004. Start-up investment with scarce venture capital
support. Journal of Banking and Finance, 28, p. 1935-1959.
112. Kaplan, S., N., and Lerner, J., 2010. It Ain’t Broke: The Past, Present, and the Future of
Venture Capital, Journal of Applied Corporate Finance, 22(2).
113. Kaplan, S., N., and Stromberg, P. 2001, Financial contracting meets the real world: an
empirical analysis of venture capital contracts’, Review of Economic Studies, 2002, p. 1-
35.
114. Kaplan, S., Sensoy, B., and Strömberg, P. 2009. Should investors bet on the jockey or the
horse? evidence from the evolution of firms from early business plans to public
companies. Journal of Finance, 64, p. 75–115
115. Keating, M. 1998. The New Regionalism in Western Europe. Territorial Restructuring
and Political Change, Aldershot: Edward Elgar.
116. Kedrosky, P., 2009. Right-Sizing the U.S. Venture Capital Industry, Kauffman Foundation,
June 2009
117. Kenney, M., and Florida, R. 2000. Venture capital in Silicon Valley: Fuelling new firm
formation. In Understanding Silicon Valley: the anatomy of an entrepreneurial region,
ed. M. Kenny, 98-123. Stanford: Stanford University Press
118. Komninos, N. 2004. Regional intelligence: Distributed localised information systems for
innovation and development”, Int. J. Technology Management, 28(3-6), p. 483-506
119. Kortum, S. and Lerner, J. 2000. Assessing the contribution of venture capital to
innovation, RAND Journal of Economics, 31(4), p. 674–692
120. Koschatzky, K., 2000. The regionalisation of Innovation Policy in Germany – Theoretical
Foundations and Recent Experience, Fraunhofer ISI, Arbeitspapiere Unternehmen und
Region No. R1

241
121. Krugman, P.R. 1991. Increasing returns and economic geography, Journal of Political
Economy, 99, p. 483-499.
122. Landabaso, M, Oughton, C and Morgan, K. 2001. Innovation Networks and Regional
Policy in Europe, in: K Koschatzy, M Kulicke and A Zenker (eds) Innovation Networks:
Concepts and Challenges in the European Perspective, Physica-Verlag, Heidelberg and
New York.
123. Landabaso, M., 2001. Innovation and Regional Development Policy, in: Knowledge,
Innovation and Economic Growth, Edward Elgar publishing, Northampton USA
124. Landabaso, M., C. Oughton, and Morgan, K. 1999. Learning Regions in Europe: Theory,
Policy and Practice through the RIS Experience. Paper prepared for the 3rd International
Conference on “Technology and Innovation Policy: Assessment, Commercialisation and
Application of Science and Technology and the Management of Knowledge”, Austin,
USA, 30 August-2 September 1999.
125. Langlois, R.N. and Roberston, P.L. 1995. Firms, Markets and Economic Change, London:
Routlege
126. Leitner, H., Pavlik, C. and Sheppard, E.2002. Networks, Governance and the Politics of
Scale: Inter-urban Networks and the European Union”, in: Herod A and Wright M W
(Eds) Geographies of Power: Placing Scale, Blackwell: London, p. 274-303.
127. Lerner, J. 1994. The syndication of venture capital investments. Financial Management
23, p. 16–27.
128. Lerner, J. 1995. Patenting in the shadow of competitors. Journal of Law and Economics
38(2), p. 463–495
129. Lerner, J. 2002. When bureaucrats meet entrepreneurs: The design of effective ‘‘public
venture capital’’ programmes. Economic Journal, 112(477), F73–F84.
130. Lerner, J. 2009. Boulevard of Broken Dreams: Why Public Efforts to Boost
Entrepreneurship and Venture Capital Have Failed – and What to Do about It. Princeton,
N.J: Princeton University Press
131. Lerner, J. and Watson, B. 2008. The public venture capital challenge: the Australian
case. Venture Capital, 10(1), p. 1–20
132. Lerner, J., Moore, D., and Shepherd S., 2005. A study of New Zealand’s venture capital
market and implications for public policy, To the Ministry of Research Science
&Technology, LECG Ltd
133. Lerner, J., Sørensen, M., and Strömberg, P., 2008 Private Equity and Long-Run
Investment: The Case of Innovation, NBER Working Paper No. 14623.
134. Library House. 2007. Spinning out quality: University spin-out companies in the UK, May
2007
135. Lord Sainsbury of Turville, 2007. The Race to the Top - A Review of Government's Science
and Innovation Policies
242
136. Lovering, J., 1999. Theory led by policy: the inadequacies of the ‘new regionalism’
(illustrated from the case of Wales). International Journal of Urban and Regional
Research 23, p. 379-95
137. Lundvall, B. (ed) 1992. National Systems of Innovation: Towards a theory of innovation
and interactive learning, London Pinter
138. Lundvall, B., 1996. The Social Dimension of The Learning Economy, DRUID Working
Papers 96-1, DRUID
139. Madill, J., G. Haines, and Riding, A. 2005. The Role of Angels in Technology SMEs: A Link
to Venture Capital. Venture Capital, 7, p. 107-129.
140. Malecki, E. J. 1991. Technology and Economic Development: The Dynamics of Local,
Regional, and National Change. Burnt Mill: Longman & New York: Wiley
141. Malecki, E. J. 2000.Knowledge and Regional Competitiveness. Erdkunde 54, p. 334-35
142. Manigart, S. and Meuleman, M., 2004. Financing entrepreneurial companies - How to
raise private equity as a high-growth company, Larcier
143. Mann, J. R. and Sager , W. T., 2007. Patents, venture capital, and software start-ups,
Research Policy, 36, pp. 193-208
144. Mann, R.J. 2005. Do Patents Facilitate Financing in the Software Industry? Texas Law
Review, 83, p. 961-1030.
145. Martin, J. 1992. Cultures in Organizations: Three Perspectives. New York: Oxford Univ.
Press
146. Martin, R, P. Sunley, P and Turner, D. 2002. Taking risks in regions: the geographical
anatomy of Europe’s emerging venture capital market’, Journal of Economic Geography,
2 (2), p. 121-150.
147. Martin, R. (ed.) 1999. Money and the Space Economy, Chichester: Wiley.
148. Martin, R. 1989. The Growth and Geographical Anatomy of Venture Capitalism in the
United Kingdom, Regional Studies, 23(5), p. 389-403.
149. Martin, R., and Simmie, M., 2008. Path dependence and local innovation systems in city-
regions, Innovation: Management, policy & practice, 10, p. 183-196
150. Martin, R., and Sunley, P., 2001. Deconstructing clusters: chaotic concept or policy
panacea? Journal of economic geography, 3, p. 5-35.
151. Martin, R., and Sunley, P., 2006. Path dependence and regional economic evolution,
papers in evolutionary economic geography, Paper prepared for the European Science
Foundation Exploratory Workshop on Evolutionary Economic Geography, St Catharine’s
College, University of Cambridge, 3-5 April, 2006
152. Martin, R., C. Berndt, B. Klagge and Sunley, P. 2005. Spatial proximity effects and
regional equity gaps in the venture capital market: evidence from Germany and the UK,
Environment and Planning A, 37, p. 1207-1231.

243
153. Maskell, P and Malberg, A. 1999. Localised learning and industrial competitiveness,
Cambridge journal of economics, 23, p. 167-185
154. Mason, C. M. and Harrison, R.T. 1991. Venture capital, the equity gap ad the north-
south divide in the United Kingdom , in Green, M.B. (ed.) Venture Capital: International
Comparisons, London: Routledge
155. Mason, C., and Harrison, R., 1999. Financing entrepreneurship: venture capital and
regional development in, Martin R ed Money and the space economy Wiley, New York,
p. 157–83.
156. Mason, C. M. and Harrison, R. T., 2001. ‘Investment Readiness’: A critique of
government proposals to increase the demand for venture capital. Regional Studies,
34, p. 663-66
157. Mason, C., and Harrison, R., 2002a. The geography of venture capital investments in the
UK, Royal Geographical Society (with the Institute of British Geographers)
158. Mason, C., and Harrison, R., 2002b. Barriers to investment in the informal venture
capital market, Entrepreneurship and Regional Development, 14, p. 271-297.
159. Mason, C., and Harrison, R., 2003. Closing the Regional Equity Gap? A Critique of the
Department of Trade and Industry's Regional Venture Capital Funds Initiative, Regional
Studies, 37(8), p. 855-868.
160. Mason, C., and Harrison, R., 2008. Measuring business angel investment activity in the
United Kingdom: a review of potential data sources, Venture Capital: an international
journal of entrepreneurial finance, 10, p. 309-330.
161. Mason, C., 1987. Venture Capital in the United Kingdom: A geographical Perspective,
National Westminster Quarterly Review, 2, p. 47-58 .
162. Mason, C.M., 2007. Venture capital: a geographical perspective. In Handbook of
Research on Venture Capital, edited by H. Landström. Edward Elgar, Cheltenham, p 86-
112.
163. Massey, D., Quintas, P., and Wield, D. 1992. High Tech Fantasies: Science Parks in
Society, Science and Space, Routledge, London
164. Maula, M. V. J., Murray, G. C., 2003. Finnish Industry Investment Ltd: An International
Evaluation, (Publications 1/2003). Ministry of Trade and Industry, Helsinki
165. McCarthy, L., 2000. Competitive Regionalism: Beyond Individual Competition, Reviews
of Economic Development, Literature and Practice No 2, US Economic Development
Administration exciting
166. McLeod, G., 2001. New Regionalism reconsidered: globalization and the remaking of
political economic space, IJURR, 25(4), p. 804-829
167. Min H, J., Caltagirone and Serpico, A., 2008. Life after a dot-com bubble, International
Journal of Information Technology and Management, 7(1), p. 21-35

244
168. Mondher C., and Sana, E., 2009. Venture Capital Financing: A Theoretical Model,
University of Reims OMI-LAME, ISG-Sousse
169. Morgan, K., 1997. The learning region: institutions, innovation and regional renewal,
Regional Studies, 31(5), p. 491-503
170. Morgan, K., 2004. The exaggerated death of geography: learning, proximity and
territorial innovation systems, Journal of Economic Geography, 4(1), p. 3-21
171. Morgan, K., and Nauwelaers, C., 1999. The new wave of innovation-oriented regional
policies: retrospects and prospects in Regional Innovation Strategies. The challenge for
less-favoured regions Policy Series Eds. Morgan, K. and Nauwelaers, C. The Stationery
Office. Regional Studies Association. p. 224-237
172. Morten, H., Chesbrough, H., Nohria, N., and Sull, D., 2000, Networked incubators:
hothouses of the new economy. Harvard Business Review, Sep.-Oct. p. 74-84
173. Munari, F., and L., Toschi, 2010. Assessing the impact of public venture capital
programmes in the UK: do regional characteristics matter? Department of
Management, Università degli Studi di Bologna
174. Murray, G., 1998. A policy response to regional disparities in the supply of risk capital to
new technology-based firms in the European Union: the European seed capital fund
scheme. Regional Studies 32(5), p. 405-419.
175. Murray, G., 2007, Venture capital and government policy, in H Landström (ed)
Handbook of Research on Venture Capital, Cheltenham: Edward Elgar, p 113-151.
176. Musyck. B., Reid. A., 2007, Research Technological Development and Innovation (RTDI)
related actions: have lessons been learned?, European Planning Studies, 15(7), p. 961-
983.
177. NAO. 2009. Venture Capital support to small business
178. Nelson, R. and Winter, S., 1982. An evolutionary theory of economic change, Harvard
University Press
179. NESTA . 2007. Making money at the early-stage: the challenge for venture capital in the
UK, Policy Briefing
180. NESTA. 2008a. Shifting sands, the changing nature of the early stage venture capital
market in the UK, London
181. NESTA. 2008b. Stimulating Venture Capital, policy brief
182. NESTA. 2008c, Unlocking the potential of innovative firms, Policy Briefing
183. NESTA. 2009. Reshaping the UK economy, London
184. NESTA. 2010. Venture Capital: now and after the dotcom crash, London
185. NESTA. 2011. Atlantic Drift: Venture capital performance in the UK and the US, London
186. NESTA and BVCA. 2009. From funding gaps to think markets: UK Government support
for early-stage venture capital, London

245
187. Nielsen, P., and Lundvall, B., 2003. Innovation, Learning Organizations and Industrial
Relations, DRUID Working Papers 03-07, DRUID
188. Norton, R. 2000. Creating the New Economy: The Entrepreneur and the U.S.
Resurgence. Cheltenham: Edward Elgar
189. Norton., E., and Tenenbaum, B., 1993. Specialization versus diversification as a venture
capital investment strategy”, Journal of Business Venturing, 8, p. 431-442
190. OECD Science, Technology and Industry Scoreboard 2003
191. Oughton, C., Landabaso, M., Morgan, K., 1999. Innovation Networks and Regional
policy in Europe, Kalsruhe, 18 November 1999
192. Oughton, C., Landabaso M., Morgan, K., 2004. The Regional Innovation Paradox:
Innovation Policy and Industrial Policy, Journal of Technology Transfer, 27 (2)
193. Paasi, A. 1991. Deconstructing regions: Notes on the scales of spatial life. Environment
and Planning A, 23, p. 239–56.
194. Peneder, M. 2008. The problem of private under-investment in innovation: A policy
mind map. Technovation, 28, p. 518–53
195. Pinch, S., and Sunley, P., 2009. Understanding the Role of Venture Capitalists in
Knowledge Dissemination in Technology Agglomerations: A Case Study of the University
of Southampton Spin-Off Cluster, Venture Capital, 11, (4), . 311-333
196. Pissarides, F., 1999. Is lack of funds the main obstacle to growth? ebrd's experience
with small- and medium-sized businesses in central and eastern Europe, Journal of
Business Venturing, 14, (5-6), pp. 519-539
197. Porter, M., 1990. The Competitive Advantage of Nations. New York: Free Press; Michael
198. Porter, M., 1994. The Role of Location in Competition, Journal of Economics of Business
I(1), p. 35-9,
199. Porter, M., 1996. Competitive Advantage, Agglomerative Economics and Regional
Policy, International Regional Science Review, 19 (1 and 2), p. 85-94.
200. Porter, M., 1998. Clusters and the new economics of competition, Harvard Business
Review 76(6), p. 77-90
201. Porter, M., 2000. Location, Clusters, and Company Strategy, Oxford Handbook of
Economic Geography, G. Clark, M. Gertler, and M. Feldman, eds Oxford: Oxford
University Press, 2000
202. Porter, M., 2000. Location, competition and economic development: local clusters in a
global econony; Economic Development Quarterly, 14(1)
203. Powell, W., Koput, K., Bowie, J., and Smith-Doerr, 2002. The Spatial Clustering of Science
and Capital: Accounting for Biotech Firm-Venture Capital Relationships’, Regional
Studies, Volume 36(3), p. 291-305.
204. Puri, M., and Zarutskie, R., 2008. On the Lifecycle Dynamics of Venture-Capital- and
Non-Venture-Capital-Financed Firms, NBER Working Paper No. w14250

246
205. Queen M 2002. Editorial, Government policy to stimulate equity finance and, investor
readiness, Venture Capital, 4(1), p. 1- 5
206. Robinson, P, 2001. Industrial policy and the New Economy, New Economy, 8(3),
September 2001 , p. 125-126(2), Blackwell Publishing
207. Rosenberg, D. 2002. Cloning Silicon Valley: The next generation high tech hotspots.
London: Pearson.
208. Rosenfeld, S. 1996. Does Co-Operation Enhance Competitiveness? Assessing the
Impacts of Inter-Frim Collaboration, Research Policy 25(2), p. 247-263
209. Rosiello A. and Parris S. 2008. The Patterns of Venture Capital Investment in the UK
BioHealthcare Sector: on Geography, Co-Evolution and the Provision of Added Value”,
Innogen Working Paper
210. Sahlman, S., 1990. The structure and governance of venture-capital organisations,
Journal of Financial Economics, 27, p. 473-521
211. Sapienza, H., and Amason, A., 1993. Effects of Innovativeness and Venture Stage on
Venture Capitalist-Entrepreneur Relations, Interfaces, 23(6), p. 38-51
212. Sapienza, H., and Gupta, A., 1994. Impact of agency risks and task uncertainly on
venture capitalists – CEO interaction, Academy of Management Journal; 37 (6), p. 1618-
1632
213. Saxenian, A., and C., Sabel, 2008. Roepke Lecture in Economic Geography Venture
Capital in the 'Periphery': The New Argonauts, Global Search, and Local Institution
Building, Economic Geography, 84(4), p. 379-394
214. Sayer, A., 2000. Method in Social Science: a realist approach, New York: Routledge.
215. Schäfer and Schilder, D. 2009. Smart capital in German start-ups: an empirical analysis,
Venture Capital: an international journal of entrepreneurial finance, 11(2), p. 163-183
216. Schwartz, D., and R. Bar-El, 2007, "Venture investments in Israel – A regional
perspective," European Planning Studies 15 (5), p. 623-644
217. Scott, A., Steyn, G., Geuna, A., Brusoni, S., Steinmueller, E., 2002. The economic returns
to basic research and the benefits of University-Industry Relationships: A literature
Review and update of findings. Report for the office of Science and Technology SPRU,
University of Sussex
218. Simonsen K, 2005. Networks, flows and fluids- reimagining spatial analysis?
Commentary, Environment and Planning A. 36(8), p. 1333–1340
219. Smith, J., 2005. Empirical study of a venture capital relationship, Accounting, Auditing &
Accountability Journal, 18(6), p.756 -783
220. Soete, L., A. Arundel (eds.), 1993. An Integrated Approach to European Innovation and
Technology Diffusion Policy. A Maastricht Memorandum. Commission of the European
Communities: Luxembourg.

247
221. Sorenson O., and Stuart, T., 2001. Syndication Networks and the Spatial Distribution of
Venture Capital Investments1ucsd.edu - ajs, 2001 – University of Chicago Press
222. SQW. 1985. The Cambridge Phenomenon Cambridge
223. Storper, M. 1997. The regional world: territorial development in a global economy.
Guildford Press, New York
224. Sunley, P., Klagge, B., Berndit, C., and Ron, M., 2005. Venture capital programmes in the
UK and Germany: In what sense regional policies? Regional Studies, 39(2), p. 255-273
225. Taylor P J, Derudder B, Saey P,Witlox F, 2006. Cities in Globalization.Routledge, London
226. Thomas, K., 2000. Creating Regional Cultures of Innovation? The Regional Innovation
Strategies in England and Scotland, Regional Studies, 34(2), p. 190-198
227. Timmons A. J. and Spinelli, S. , 2003. New Venture Creation, Entrepreneurship for the
21st Century, New York: McGraw-Hill
228. Ueda M., Hirukawa M. 2006. Venture Capital and Industrial Innovation. Working Paper,
May 200
229. UNICO. 2005. UK University Commercialisation Survey: Financial Year 2004, October
2005
230. Uyarra, E., 2007. Key dilemmas of regional innovation policies. Innovation- The
European Journal of Social Science Research 20 (3), p. 243–261
231. Verdolini, E., and M., Galeotti. 2009. At Home and Abroad: An Empirical Analysis of
Innovation and Diffusionin Energy-Efficient Technologies. Working Paper n. 26
November 2009, IEFE - The Center for Research on Energy and Environmental
Economics and Policy at Bocconi University
232. Wiltbank., R., 2009, Siding with the Angels, NESTA 2009
233. Woodward, D., and P., Guimaraes, 2005. Porter’s cluster strategy and industrial
targeting, University of South Caroline
234. Wright, M., and Lockett, A., 2006. University spin-out companies and venture capital.
Research Policy, 35(4), p. 481-501
235. Zhang, J. 2007. Access to venture capital and the performance of venture capital-backed
star-ups in Silicon Valley, Economic Development Quarterly, 21, p. 124-140
236. Zook, M. A., 2000. Grounded Capital: Venture Capital’s Role in the Clustering of Internet
Firms in the US, paper presented to Association of Collegiate Schools of Planning
Conference, Atlanta
237. Zook, M.A., 2002. Grounded capital: venture financing and the geography of the
Internet industry, 1994-2000, Journal of Economic Geography, 2 (2), p. 151-177
238. Zook, M.A., 2004. The knowledge brokers: Venture capitalists, tacit knowledge and
regional development. International Journal of Urban and Regional Research, 28 (3), p.
621-641.

248
239. Zook M.A., 2005. The Geography of the Internet Industry: Venture Capital, Dot-coms
and Local Knowledge , Blackwell Publishers: Oxford
249
10 APPENDICES
10.1 - Appendix I: Venture capital Government schemes
Regional Venture Capital Funds (RVCFs)
RVCFs established in 2001 in nine UK regions in order to encourage start-ups and early stage
investments. They are managed by fully commercial VC management companies
The RVCFs are limited to investing £250,000 at a time and may not invest more than £500,000 in a
single company. They are also required to be the first source of institutional capital, which means
they are generally able only to co-invest with angel networks rather than other venture capital
providers. RVCFs have an implicit social motive; they are intended to maximise profit at the same
time as being required to invest within certain size parameters as part of the government’s ambition
to encourage more private sector capital to address an equity size gap.
The RVCFs do not have specialist focuses, although some of them have made technology
investments. By and large, the limit on the size of investment they can make prohibits them from
investing in technology because it generally requires greater capital capacity. They also lack the
resource to pay for the technical skills needed for effective specialist investing.
In order to assist fund managers to attract private sector investors, the government decided to
subordinate its investment position by firstly putting a cap on its investment return, thereby
boosting the anticipated return to private sector investor and the EIF along with agreeing to act as
'first loss'. This means that, in the event of an erosion of a fund's capital base, the public investment
suffers the loss first.
Enterprise Capital Funds (ECFs)
ECFs were launched in 2003 but since then there have been several rounds. The concept of
Enterprise Capital Funds (ECFs) aims to improve access to growth capital for small and medium-sized
enterprises by applying a modified US Small Business Investment Company (SBIC) model to the UK
by: i) bringing more entrepreneurial investors into the management of funds aimed at smaller, early

250
stage deals; ii) offering incentives to investors to make these investments and; iii) enhancing the
impact of business angel networks in providing sources of risk capital and expertise to SMEs.
Early Growth Funds (EGFs)
This programme was developed to encourage risk funding for start-ups and growth firms. The
objective: to increase the availability of small amounts of risk capital of on average £50,000 for
innovative and knowledge intensive businesses, as well as for other growth businesses. EGFs are
able to make maximum initial investments of up to £100,000. Most funds require matched private
sector investment to at least the same amount as Early Growth Fund investment.
University Challenge Seed Funds (UCSFs)
The aim of the University Challenge Seed Fund Scheme is to fill a funding gap in the UK in the
provision of finance for bringing university research initiatives in science and engineering to the
point where their commercial viability can be demonstrated. Certain charities and the Government
have contributed around £50 million to the scheme. These funds are divided into 15 University
Challenge Seed Funds that have been donated to individual universities or consortia and each one of
these has to provide 25% of the total fund from its own resources. Maximum initial investments of
up to £100k. Maximum investment per firm: £250k
European Regional Development Fund (ERDF)
ERDF supported venture capital and loan funds in Scotland (including the Scottish Co-Investment
fund) and Wales (Finance Wales). The North West, Yorkshire and the Humber, South West, North
East and West Midlands have all used ERDF Objective 1 and/or Objective 2 fund monies to develop
additional specific solutions for their regions.
Fiscal incentives
Venture capital trusts (VCTs)
The government attempted to address the aggregate supply-side problem by using fiscal incentives
to draw more capital into the venture sector with the creation of venture capital trusts (VCTs) in the
mid-1990s
Venture capital trusts (VCTs) are listed funds that invest according to a set of criteria to qualify for
privileged tax treatment. The source of their capital is typically high net worth individuals or retail
investors. The rules attached to VCT qualification require a large proportion of the fund to be

251
invested within a given period of time. This means that they often have a few years of high levels of
activity and then a much slower stretch while the investments are harvested.
Many VCTs concentrate their investment activity on AIM-listed companies or buy-out opportunities,
often pooling their resources to finance much larger deals than would be achievable or allowable
from a single fund. A number of VCT managers have more than one fund under management, often
with similar investment strategies. These are sometimes managed by the same team and often
invest alongside one another
Enterprise Investment Scheme EIS
EIS was introduced in January 1994 as the natural successor to the Business Expansion Scheme (BES).
It was set up by the Government in order to encourage Business Angels to invest in certain types of
smaller unquoted UK companies. The Enterprise Investment Scheme (EIS) aims to incentivise
investment in smaller, higher-risk companies that have growth potential but sometimes struggle to
raise finance. The EIS plays a significant role in the provision of venture capital for small businesses,
having helped rise over £6.1 billion, invested in over 14,000 companies. In 2008 the annual investor
limit was raised to £500,000 (subject to State aid approval).

252
10.2 Appendix II: Data sources and analysis
Venture capital deals data
The main challenge when undertaking research on venture capital is the availability of suitable data
(Hellman and Puri 2002; Mckenzie and Janeway 2008). To overcome this challenge, several data
sources have been examined for this study:
Thomson One
Thomson One (previous known as Venturexpert), which is a division of Venture Economics, is a
private equity dataset provided by Reuters. Venture Economics receives quarterly reports from VC
organizations and from major institutional investors on their portfolio holdings and, in exchange,
provides summary data on investments and returns (Ueda and Hirukawa 2006). VentureXpert
reports daily VC investment data from 1960 to date.
VentureSource
Dow Jones’ VentureSource collects data on firms that have obtained venture capital finance since
1987. The database include the identity of the key founders, as well as the industry, strategy,
employment, financial history, and revenues of the company. Data on the firms are updated and
validated through monthly contacts with investors and companies. The companies are initially
identified from a wide variety of sources, including trade publications, company web pages, and
telephone contacts with venture investors. Venture Source then collects information about the
businesses through interviews with venture capitalists and entrepreneur (Gompers et al. 2010).
Library House
The Library House database reports individual investments along with various additional information
on the investor and business which enabled customised tables to be generated. The availability of
such information on individual deals allows considerable flexibility in analysis. However, its coverage
is restricted to publicly reported investments, with attendant limitations in information capture and
classification. It is important to note that Library House’s coverage of investment activity is
narrower than that of the BVCA, and in particular does not extend to private equity investments. In
addition, its database is built up from reported investments and so does not capture all the
investments that BVCA reports in its annual investments activity reports. In addition, the amount of
information that is provided about each investment in Library House’s database is limited, which
restricts the amount of disaggregation possible. On the other hand, it does capture some

253
investments, notably those by angel groups and high net worth individuals making large business
angel investments, which are not included in BVCA investment statistics. However, there is no
source which provides a comprehensive coverage of angel investments (Mason and Harrison, 2008).
Library House classifies its investments in terms of financing rounds rather than stages of finance.
However, it does identify companies at the product development stages, defined as companies that
have produced prototypes with a product being improved for commercialisation.
The Library House database disaggregates the type of investments into two categories:
• Those involving one or more private sector investors. This category primarily captures
venture capital firms, but also identifies investments made by some types of Business Angels,
notably investor networks (e.g. angel syndicates), family offices and named and un-named high net
worth individuals. On account of their size these investments are much more visible than those of
typical Business Angels. However, a key limitation of the data is that investments by Business Angels
are only identified where they have co-invested with either private or public sector funds.
• Those involving one or more publicly backed funds (e.g. Regional Venture Capital Funds,
University Challenge Funds). These are funds which have received some or all of their capital from
the public sector, including central government departments, regional development agencies and
the European Union (e.g. ERDF). They are normally managed by independent fund managers.
Taking into account the limitation of each dataset, it was decided to proceed with the Library House
dataset for three reasons. First, while all commercial databases capture private equity investments,
Library House concentrated solely on the venture capital and especially at the early stage market,
which is our area of interest. Second, Library House was the only database that allowed the user to
identify investment deals in which one or more publicly backed funds participated. Finally, Library
House included details on Business Angel investments when there were part of a syndicate with a
private or publicly backed fund.
As a result, using Library House database, a dataset of 4117 individual investments to 2359 UK based
companies spread to all UK regions for the period 2000-2008 was created. The period covered in the
analysis, 2000-2008 was determined by data availability.
This information has allowed for the classification of investments into the following categories:
• Deals involving solely private sector investors. This includes both venture capital funds and
Business Angels.
• Deals solely made by publicly-backed funds.
254
• Deals - which are termed as co-investments here - in which one or more private sector
investors has invested alongside one or more public sector funds. Investments in this category
include both ad hoc syndications between public sector funds and private investors, and also
investments involving Co-Investment Funds that have been established specifically to invest
alongside private investors.
Patent data
The UK Patent Office provides access to the European Patent Office (EPO) database through an
online facility. EPO database contains information of patents granted at UK patent office. For the
empirical analysis, the patent data was sorted by both year of application and year of grant. Each
company from the Library House database has been hand-checked to identify which of the 2359
companies that received one or more of the 4117 individual VC investments had received or applied
for a patent. One complication was to accurately match the names of the companies in the two
datasets (Library House and EPO). When there was a difference in the company name, additional
information on the company location and industry operation were cross checked. In few cases that
there was still ambiguity, companies were excluded from the analysis.
Survey data
The data collected for this study included responses to a questionnaire from 50 different venture
capitalists. Using the BVCA directory, commercial databases, venture capital funds websites,
government websites such as BIS and Capital for Enterprise, and utilising personal knowledge of the
market, it was possible to identify individual venture capitalists.
The venture capitalists were geographically dispersed across the UK and in a variety of high tech
industries. In order to minimise sample bias each venture capitalist was asked to fill out the
questionnaire for the fund that he or she is most heavily involved in (GPs often manage more than
one venture capital fund). The survey was restricted to venture capitalists that mainly invest in seed
and very early stage companies. This allowed the research to focus exclusively on the interactions of
the key individuals within the early stage technology venture capital community and to control for
the variations on the findings that the inclusion of other sectors might have caused (e.g. retail
sector).
As a starting point, 48 early stage venture capital funds were identified and the employees from 43
of them were contacted. Those funds contacted met the criteria of being sufficiently sized, active in
the last three years, focused on high tech innovative companies and invest in seed, start-up, early

255
growth, late growth and expansion stage. Five funds were either closed or too small (i.e. less than
£5m). Using desk research (internet, brochures and the BVCA directory) 309 individual venture
capitalists that worked in these 43 early stage venture capital fund were identified. These funds are
specialised in high technology and innovative ventures and are members of the British Venture
Capital Association (BVCA). Correct and update details were acquired for 273 of them. A list of the
funds that took part in the survey together with copy of the questionnaire can be found in appendix
II.
The questionaire itself was developed in three stages. In the first stage two academics were
consulted and asked to provide feedback on the draft questionnaire. At a second stage, the revised
questionaire was presented to five venture capitalists and similalry, their feedback was provided.
During this process several questions were changed or added. When the questionnaire was ready
two venture capitalists were asked to complete it and provide feedback.
The questionnaire was sent out via personalised emails in an electronic format. The survey was
completed in four stages, the first stage took place on 08-09 July 2009, the second stage on 15-16
July 2009, the third on 22-23 July 2009 and a final reminder was sent out on the 27th July 2009. This
was then followed by a number of personal telephone calls to various selected individuals to
encourage them to complete the survey or forward the questionnaire to the appropriate person at
the fund.
During the survey completion, some individuals were reluctant to answer the questions either
because they did know the answers to some of the questions or thought that they did not need to
complete the survey because a colleague of them completed it already on behalf of the VC fund.
Indeed, several emails were received stating that the answer to the survey represented all the staff
from the fund.
Table 45: Response rate
Value Percentage
Total number of people identified as
relevant to complete the survey 368
Total number of people contacted 309 100.00%
Total number of valid email addresses 273 88.35%
Total number of responses related to
the number of people contacted 52 16.8%

256
Total number of responses as a
percentage of valid email addresses 52 19%
Total number of fully completed
responses 50
The response rate of completed questionnaires is 19 percent. Due to the sensitivity of the industry
the questionnaire was completed on an anonymous basis however, participants were invited to
complete the name of their fund and their job title and a few of them did. Therefore, it is known that
venture capitalists from at least 20 named venture capital funds took part in the survey (49 percent
of contacted funds). The remaining 30 questionnaires were completed by venture capitalists from
different or the same funds.
Therefore, the response rate of 19 percent of the venture capitalists contacted represents a much
larger sample of the contacted individuals and at least 49 percent of the venture capital funds that
were contacted and currently operate in the early stage market and invest in high technology and
innovative companies.
10.2.1 Descriptive statistics and sample bias control
In order to check whether the sample generated is representative of the population of UK early
stage venture capitalists in 2009, a number of tests were conducted. First, the study sample was
compared with the population on two characteristics, geographical distribution and size.
Geographical coverage
Table 46: Geographical representation of the sample
Early stage (2008)
Amount
invested (£m)
BVCA %
No of responses in
the study sample %
South East 64 18% 5 11%
London 172 48% 18 38%
South West 12 3% 4 9%
East of England 20 6% 3 6%
West Midlands 12 3% 4 9%
East Midlands 9 3% 0 0%
Yorkshire 5 1% 3 6%
North West 23 6% 2 4%
North East 10 3% 1 2%
Scotland 24 7% 2 4%
Wales 2 1% 5 11%
Northern Ireland 7 2% 0 0%
360 100% 47* 100%
* 3 venture capitalists did not indicate the region they are based

257
BVCA data was used to measure the proportion of amount invested in each UK region in 2008. The
results are illustrated in the third column of the above table. The last column of the table illustrates
the proportion of responses by each UK region. With the exeption of Wales which has provided
more responses than expected (perhaps due to personal links) the percentages between the two
proportion columns do not significanly vary. In order to minimise bias in the geographical sample ,
two responses from Wales were randomly excluded.
10.2.1.1 Chi-square goodness of fit analysis
A chi-square goodness of fit test allows us to test whether the observed proportions for a categorical
variable differ from hypothesized proportions. For assume that the amounts invested in each
region, will be closely correlated to the number of venture capitalists operating in this region (South
East 18%, London 48%, South West 3%, East of England 6%, West Midlands 3%, East Midlands 3%,
Yorkshire 1%, North West 6%, North East 3%, Scotland 7%, Wales 1%, Northern Ireland 2%. Based on
this assumption, it is possible to test whether the observed proportion from the survey sample differ
significantly from these hypothesized proportion.
Regions
Observed N Expected N Residual
South East 5 8.8 -3.8
London 18 23.5 -5.5
South West 4 1.5 2.5
East of England 3 2.9 .1
West Midlands 4 1.5 2.5
Yorkshire 3 .5 2.5
North West 2 2.9 -.9
North East 1 1.5 -.5
Scotland 2 3.4 -1.4
Wales 5 .5 4.5
Total 47
Test Statistics
Regions
Chi-Square 67.132a
df 9
Asymp. Sig. .000

258
Test Statistics
Regions
Chi-Square 67.132a
df 9
Asymp. Sig. .000
a. 8 cells (80.0%) have expected
frequencies less than 5. The
minimum expected cell
frequency is .5.
These results show that the regional composition in survey sample does not differ significantly from
the hypothesized values supplied (p = .000).

259
10.3 Appendix III: List of contacted venture capital funds
Name of VC Fund Contacted
Known
response
1 Abingworth Management Ltd x x
2 AFM Limited x x
3 Amadeus Seed Fund x
4 Angle x
5 Avlar BioVentures Limited x x
6 Biofusion/ Fusion IP x
7 Capital Fund/YFM x
8 Carbon Trust x
9 Catapult x
10 Close Ventures/Albion Ventures
11 Cre8Ventures x x
12 Dawn Ventures x
13 Eden Ventures x x
14 Enterprise Ventures x x
15 E-Synergy x
16 Exomedica
17 Finance South East x x
18 Finance Wales x x
19 Hafren Ventures x x
20 Imperial Innovations x
21 Index x x
22 Invest Northern Ireland x
23 IP Group x
24 IPSO Ventures
25 Liverpool Seed Fund x
26 London Tech Fund x x
27 Mercia Technology Fund x
28 Midven x
29 MMC
30 MTI/UMIP x
31 NESTA x x
32 North West Equity Fund x
33 NorthStar x x
34 NW Brown/IQ Capital x
35 Oxford Capital Partners x
36 Oxford Technology Management Ltd
37 Partnership Fund/YFM x x
38 Partnerships UK x x
39 Pentech Fund II x
40 Questor now Spark x
41 Seraphim/GLE/YFM x x
42 Sigma Technology Management x x
43 South East Growth Fund x x

260
44 South West Ventures/YFM x
45 South Yorkshire/YFM x
46 TTP Ventures x x
47
Wales Fund Managers
Limited/Excalibur x
48 WME x x

261
10.4 Appendix IV: Survey questionnaire
1 Have any of the following bodies invested in your fund? (select all that apply)
Regional Development Agency
European Union
University
Government Department
Devolved Administration
Regional Authority
Other public body (please specify)
2 If yes, what proportion of the funds under management do they account for?
100%
75-99%
50-74%
25-49%
under 25%
3 What is the size of the fund (total assets under management)?
0-£5m
£6m-£10m
£11m-£20m
£21m-£30m
£31m-£40m
£41m-£50m
£51m-£100m
£100m+
4 In which region is the fund based?
Region - (drop down list of regions)
5 In which industry sector do you prefer to invest? (select all that apply)
Biotechnology
Business product and services
Computer and peripherals
Consumer products and services
Electronics/instrumentation
Financial services
Healthcare services
Industry/energy
IT services
Media and entertainment
Medical devices and equipment
Networking and equipment
Retail/distribution
Semiconductors
Software
Telecommunication

262
6 What proportion of your portfolio companies generated sales revenue at the time of your initial investment?
7 What proportion of your deals are co-investment deals (if applicable)
8 What proportion of your co-investment deals are made with
Private VC fund
Public (publicly backed) VC fund
Bank Loan
Loan Fund
R&D Grant
9 What is your preferred stage of investment? (select all that apply)
Seed
Start-up
Early growth
Late growth
Expansion
Other
10 How often do you interact with the following bodies ?
(indicate the frequency of your contact face-to-face, telephone or email)
(drop down menu: never; hardly ever - once a year at most; occasionally – a few times a year;
regularly – once a month; often – more than once a month; very frequently – at least once a week)
Your portfolio companies
Companies outside your portfolio
Other private venture capital funds (within your region)
Other private venture capital funds (outside your region)
Other publicly backed venture capital funds (within your region)
Other publicly backed venture capital funds (outside your region)
Business Angel networks (within your region)
Business Angel networks (outside your region)
Business Angel individuals
Banks
Universities with no flexible IP policy
Universities with flexible IP policy
Regional R&D institutes (if not universities)
RDAs (when applicable)
Other public regional bodies (e.g. endowments, councils etc)
Regional authorities
Law companies
Specialists (e.g. experts in a particular technology)
Community organisations and charities
Managers of technology parks or incubators
Companies based in technology parks or incubators
IP protection bodies
11 How often do you participate in the following networking events?
Investment forums organised by private bodies
Investment forums organised by public bodies
Networking events organised by private bodies
Networking events organised by public bodies
Internet forums and blogs

263
12 What proportion of your deals come from the following sources?
Other private VC funds
Other public (publicly backed) VC funds
Business Angel networks
Personal business contact
The entrepreneur approaches you directly
13 Select the top 3 strengths of a business opportunity that normally motivates your investment
Management team expertise
Business model scalability
Great products/services- USP
Defensible I.P.
Customers and market potential
Financial track record
Remarkable value proposition
14 Do you hold any advisory position within a public organisation?
15 If not, have you ever been approached by a public body to take such position?
16 If you have been approached to take such position but you decided not to accept it,
what was the main reason of your decision?
17 Do you hold any position in an private association or network?
18 Are you on the boards of any economic development bodies?
19 How long have you lived/worked in the region?
20 How long have you worked in your present position?
The information you report in the survey is handled in a completely confidential process,
stored and analyzed in an anonymous fashion, and will be used exclusively for research purposes.
However, it will be very useful if you could provide us with the name of your company
and your job title (optional)
Job Title:
Company:
Address:
City/Town:
Postal Code: