phd program in geoinformation disp - tor vergata ... · phd program in geoinformation disp - tor...
TRANSCRIPT

Riccardo Duca
Earth Observation LaboratoryPhD Program in GeoInformation
DISP - Tor Vergata University
Optical multi-spectral images: processing and
applications

The last time• What means “Optical Remote Sensing”• The history of a success: from Bievre Valley to the entire World• The electromagnetic spectrum
• Some applications• The optical measurement and the signal components
Image Copyrignt M.Disney, UCL, http://www.geog.ucl.ac.uk/about-the-department/people/academics/mat-disney/

The last time• Spatial features discrimination
• Radiometric resolution• The spectral resolution: from panchromatic to hyperspectral• The evolution of optical sensors:
Image Nasa, http://landsathandbook.gsfc.nasa.gov/handbook/handbook_htmls/chapter6/chapter6.html
• Very high resolution multi-spectral• High/medium resolution multi-spectral • High/medium resolution hyperspectral• Multi-spectral wide swath for global coverage

T
Copyright UDEC, from http://www.profc.udec.cl/

And today…
Wiskbroom and pushbroom instruments
From the acquisition to the radiance• Data reformatting and geometric correction• Conversion to radiance• Correction of radiometric artifacts: destriping
From the radiance to the surfaces reflectance• The effects of the atmosphere • Atmospheric correction and reflectance calculation• Reflectance of surfaces
Applications• Classification: basic concepts, techniques and examples• Vegetation indexes: why, technique, examples
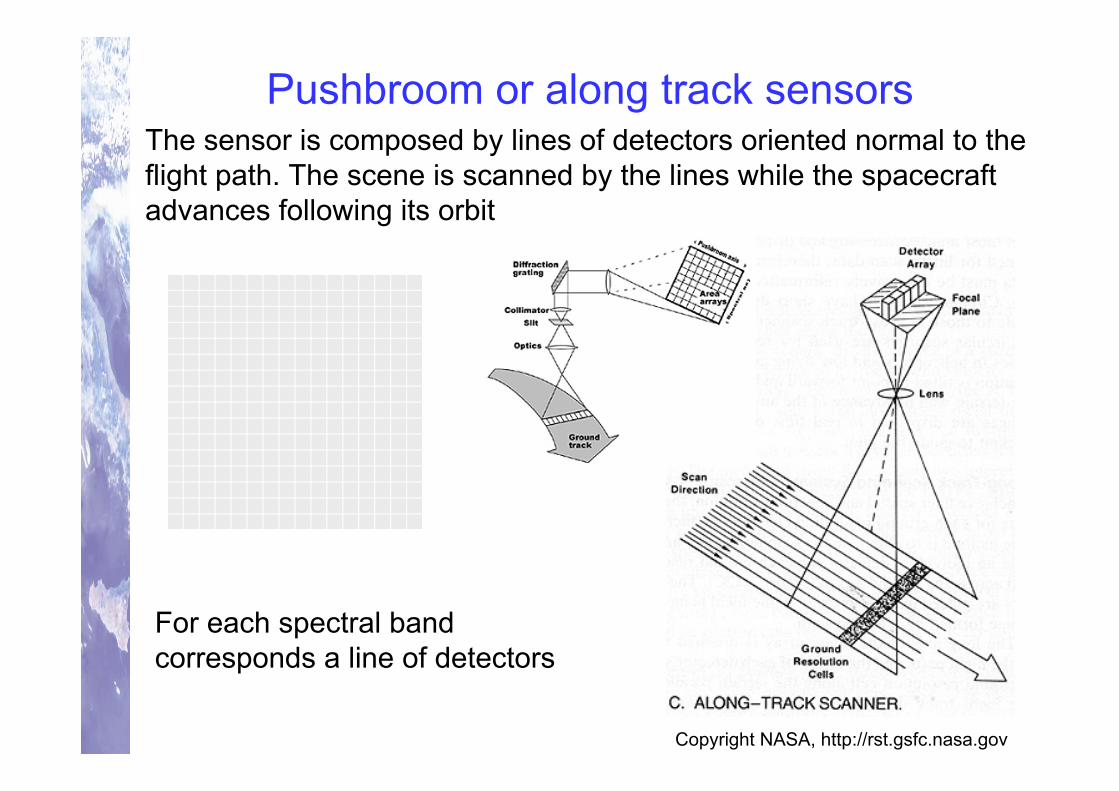
Pushbroom or along track sensorsThe sensor is composed by lines of detectors oriented normal to the flight path. The scene is scanned by the lines while the spacecraft advances following its orbit
For each spectral band corresponds a line of detectors
Copyright NASA, http://rst.gsfc.nasa.gov

Wiskbroom or across track sensorsThe radiance is addressed toward a small line of detectors by a rotating mirror which sweeps the scene along the line trasversing to the orbit direction
Copyright NASA, http://rst.gsfc.nasa.gov

Copyright Image Nasa, http://landsathandbook.gsfc.nasa.gov

Copyright Image Nasa, http://landsathandbook.gsfc.nasa.gov

Spot5 HRG camera
Copyright SPOT, from http://spot5.cnes.fr

Data reformatting and geometric correction
The data reformatting processing aims to organize the information coming from the detectors in order to reproduce the real scenario
Geometric correction is undertaken to avoid geometric distortions from a distorted image, and is achieved by establishing the relationship between the image coordinate system and the geographic coordinate system
ETM Reformatted ETM Geometrically correctedImages Copyright Image Nasa, http://landsathandbook.gsfc.nasa.gov

Conversion to radiance (i)This step aims to calculated the physical radiances reaching thesensor starting from the digital numbers (DN) associated to the levels of signal captured by the electro/optic transducers
The formula used:Lλ = Gain * DN + Bias
Also expressed as
Lλ = ((LMAXλ - LMINλ)/(DNMAX-DNMIN)) * (DN - DNMIN) + LMINλ
LMAXλ corresponds to the max quantized DN (DNMAX)LMINλ corresponds to the min quantized DN (DNMIN)
Considering values at 8 bit:DNMAX = 255DNMIN = 0 or 1 (according to the considered standard)
Ditributed by NASA, http://landsathandbook.gsfc.nasa.gov

Conversion to radiance (ii)
158.3-4.7243.1-4.7158.40-5.0244.00-5.0810.80-0.3516.54-0.3510.932-0.3516.60-0.35712.653.217.040.012.653.217.040.0631.06-1.047.57-1.031.76-1.047.70-1.05157.4-5.1241.1-5.1157.5-4.5235.0-4.54152.9-5.0234.4-5.0158.6-4.5235.5-4.53196.5-6.4300.9-6.4202.4-6.0303.4-6.02191.6-6.2293.7-6.2194.3-6.2297.5-6.21LMAXLMINLMAXLMINLMAXLMINLMAXLMIN
High GainLow GainHigh GainLow GainAfter July 1, 2000Before July 1, 2000
Band Numb
er
Table 11.2 ETM+ Spectral Radiance Rangewatts/(meter squared * ster * µm)
Values calculates during the satellite life
Ditributed by NASA, http://landsathandbook.gsfc.nasa.gov

Correction of radiometric artifacts: destripingThe stripes problemIts source can be traced to individual detectors that are miscalibratedwith respect to one another. It means that illuminating the array with the same radiance, the transducers provide different quantized values
The application of the calibration coefficients (gain and bias) could in some cases delete this noise.
But in many cases an additional processing is required in order to compensate the residual stripes effect
Solution• Spatial filtering• Histogram matching using the recalibration formula• Advanced filtering

Some examples
Landsat MSS
MOS-B band 12
Hyperion band 1
CHRIS band 1
More than 30 years of hard work against the stripes!

Destriping using spatial filters
+
•http://isis.astrogeology.usgs.gov/IsisWorkshop/Lessons/Destripe/
Low pass filterVery wideNot very tall
High pass filterVery wideVery short
Immagine combinataDepurata da stripes

Destriping based on advanced filtering
Since two years also the Tor Vergata PhD Programme has given an important contribution to the solution for the stripes noise
A tool to destripe the optical images of CHRIS Proba-1 has been developed and tested in several cases
The algorithm is based on the low pass filtering in the spatial frequency domain.
PRINCIPAL STEPS:• Calculation of the radiance average of each column (each detector)• FFT over the averages• Low-pass filtering step• Estimation of the parameters for the equalization• Correction

Examples of correction
Lybian desert
Before destriping After destriping

Examples of correction
Before destriping After destriping
Frascati/Tor VergataNo more stripes in our campus

Examples of correction
Before destriping After destriping
Tampa bay (USA)
And also no more stripes in USA… but nor really…
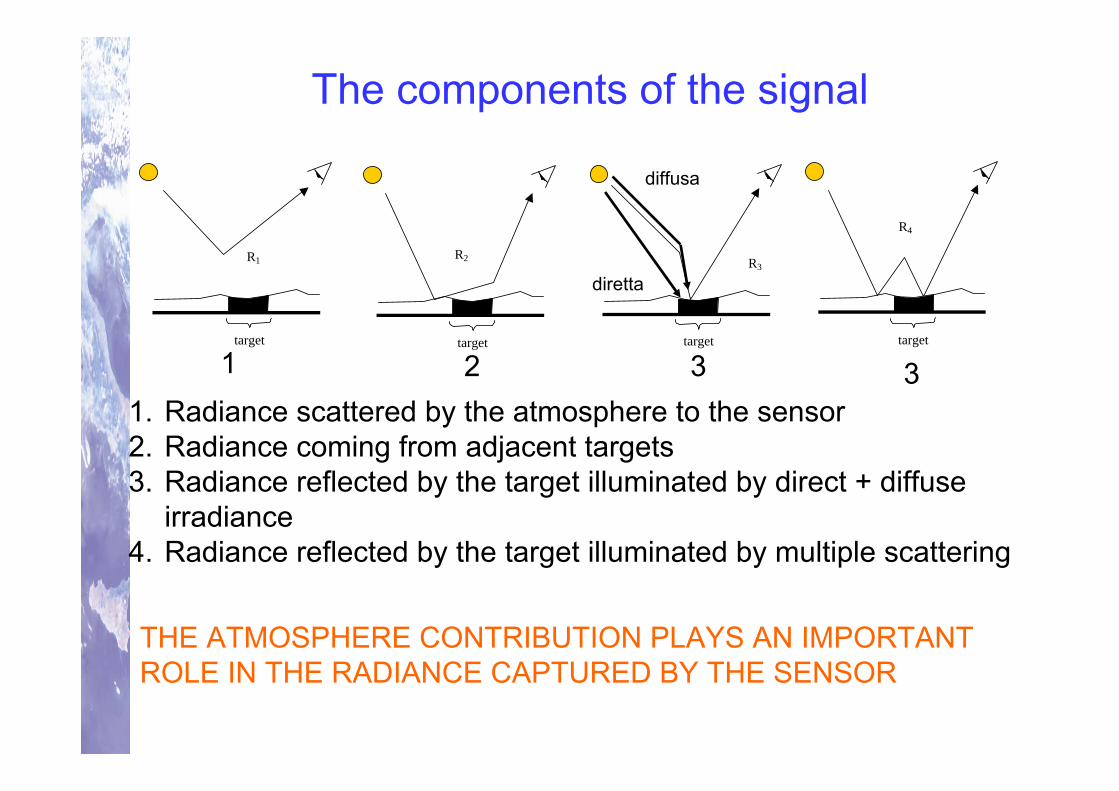
The components of the signal
R1
target
R2
target
R3
target
R4
target
diretta
diffusa
1. Radiance scattered by the atmosphere to the sensor2. Radiance coming from adjacent targets3. Radiance reflected by the target illuminated by direct + diffuse
irradiance4. Radiance reflected by the target illuminated by multiple scattering
1 2 3 3
THE ATMOSPHERE CONTRIBUTION PLAYS AN IMPORTANT ROLE IN THE RADIANCE CAPTURED BY THE SENSOR

The atmospheric scatteringIt is due to the gasses present in the atmosphere
It depends by:• λ of radiation• amount and type of molecules of gas• length of the path
1. Scattering of Rayleigh2. Scattering of Mie3. No selective

The Rayleigh scattering
Molecules << λ of radiation
Presence of powder, N2, O2
It is prevalent for short λ and in the highest layers of the atmosphere
And more…• It tends to decrease if λ increases, it is predominant in the blue with respect to the red λ• During the day prevails in the blue visible• During the sunset and the sunrise the blue is totally scattered, in fact the sky appears more yellow and red• The presence of dust and powder can enhance the effect
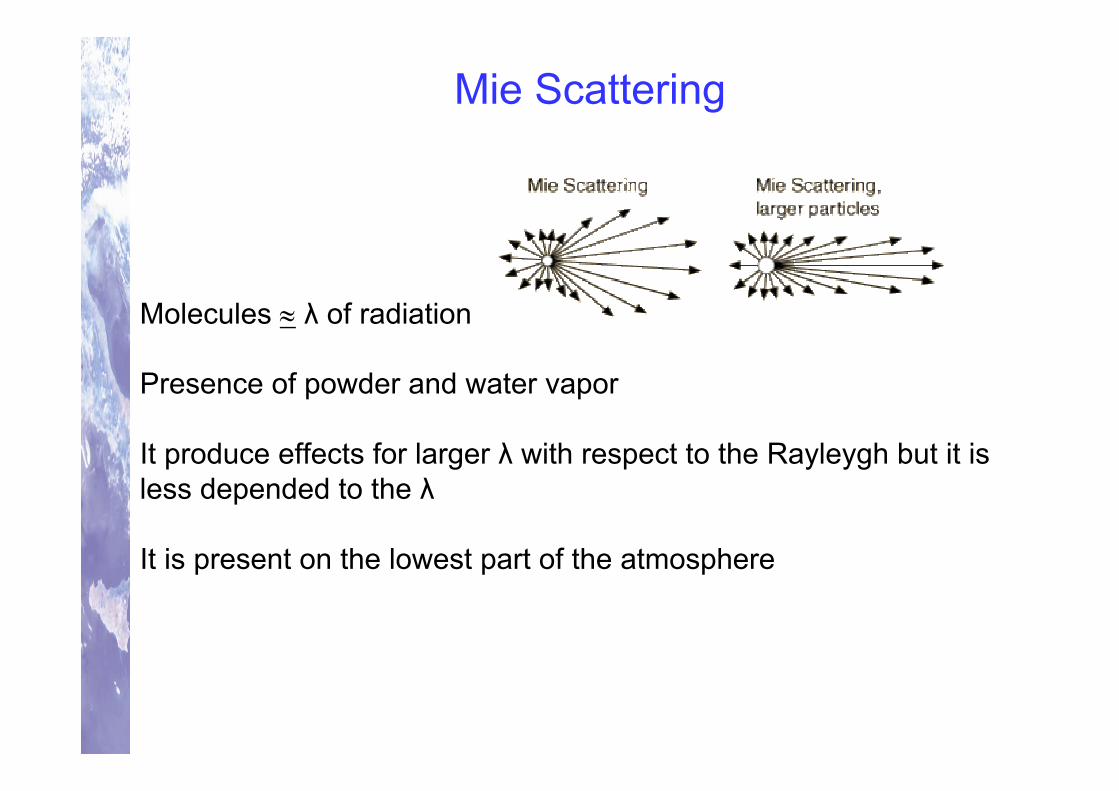
Mie Scattering
Molecules ≈ λ of radiation
Presence of powder and water vapor
It produce effects for larger λ with respect to the Rayleygh but it is less depended to the λ
It is present on the lowest part of the atmosphere

No selective
Molecules >> λ of radiation
Presence of large dust or powder, little drops of water
The scattering is the same for all λ
Presence of clouds, fog, large amounts of aerosols
White optical effects

Atmospheric absorption
Photons absorbed by molecules of gasses
Strong dependence to the λ of radiation
Gasses like CO2 and O3
O3 absorbs for lower λ, for this reason the UV rays do not burn the human beings
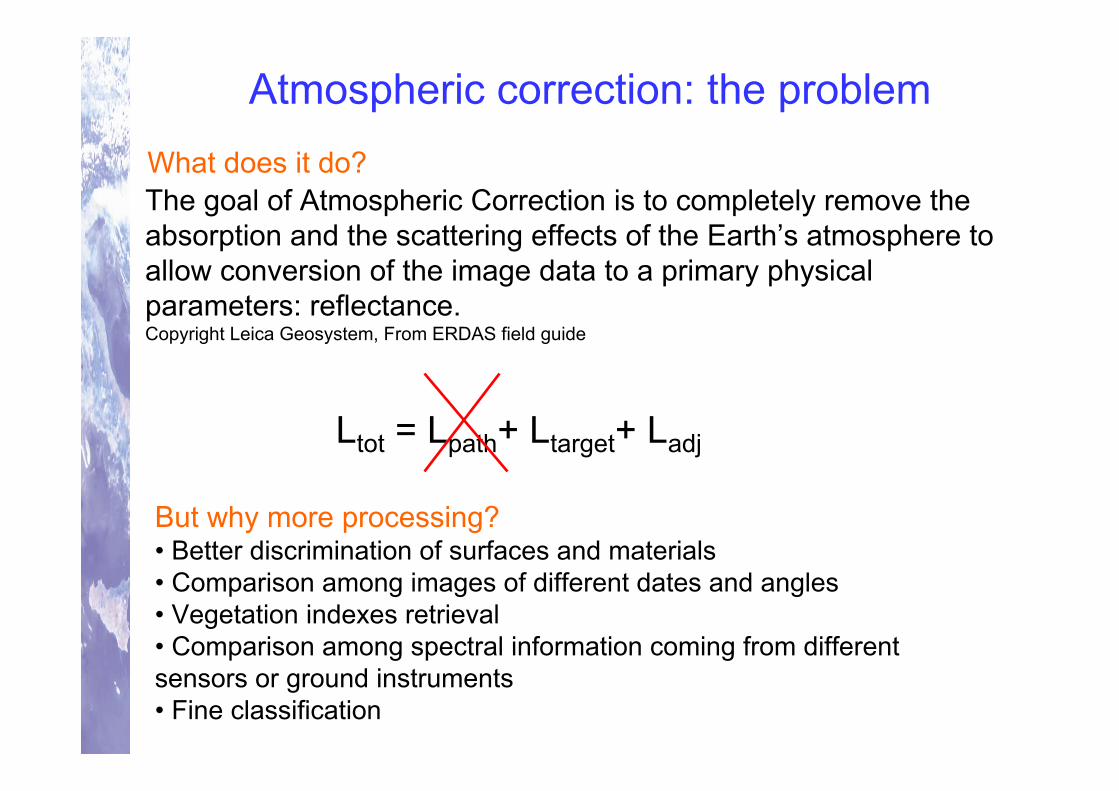
Atmospheric correction: the problemWhat does it do?
Ltot = Lpath+ Ltarget+ Ladj
But why more processing?• Better discrimination of surfaces and materials• Comparison among images of different dates and angles• Vegetation indexes retrieval• Comparison among spectral information coming from different sensors or ground instruments• Fine classification
The goal of Atmospheric Correction is to completely remove the absorption and the scattering effects of the Earth’s atmosphere to allow conversion of the image data to a primary physical parameters: reflectance.Copyright Leica Geosystem, From ERDAS field guide

Atmospheric correction: the goalOur purpose is to compensate the atmospheric noise in order to calculate the reflectance
The flux of energy which illuminated a surface Φ(λ) Wµm-1 can be divided in three main components
Φ(λ) = rλ + tλ + aλ a(λ) + ρ(λ) + t(λ) = 1
r λ refelcted componenttλ transmitted componentaλ absorbed component
They depend on the physical and chemical properties of the target

What is the reflectance?• It describes the reflective properties of target and surfaces in function of the λ• It is indicated with a number between 0 and 1 or between 0% and100%
SURFACESMirror like: energy in the angle of illumination = energy in the angle of reflection
Perfect diffusive: energy measured under every angle of view does not change
SUPERFICINATURALI

Surfaces
Figure 2.1 Four examples of surface reflectance: (a) Lambertian reflectance (b) non-Lambertian (directional) reflectance (c) specular (mirror-like) reflectance (d) retro-reflection peak (hotspot).
(a) (b)
(c) (d)
Image Copyrignt M.Disney, UCL, http://www.geog.ucl.ac.uk/about-the-department/people/academics/mat-disney/

From the radiance to the reflectance
15 20 25 30Water vapor (cm)Conifer Landsat
Landsat 7 multispectral channels 30 m of spatial resolution
Radiances simulated for a conifer forest, changing different water vapor content

Examples of reflectance signatures
Copyright UDEC, from http://www.profc.udec.cl/

Atmospheric correction: methodologiesEMPIRICALIs based on the knowledge of the radiometric and reflective properties of predefined areas or targets inside the image.• Areas: the histogram of corrupted areas is matched to the histogram of clean areas• Targets: the analysis performed using well defined spectral control points allows the correction of the whole image.
Simple methods, very fast, not much processing, mostly usedIn some cases not good correction, the correction can not be absolute, a priori knowledge
ATMOSPHERIC MODELINGThe atmospheric propertied are estimated or obtained by externalsensors. The radiative quantities (irradiance, transmittance and scattering) are simulated by the use of a model and used during the correction.
Very effective methods, good correctionExpensive, in some case difficult, difficulties on the retrieval of atmospheric parameters

Esempio: Immagini corrette atmosfericamente
Correzione atmosferica applicata
Immagine originale di radianza TOA
Bosco denso
CHRIS Proba 2007

Esempio: Immagini corrette atmosfericamente
Correzione atmosferica applicata
Immagine originale di radianza TOA
AsfaltoParcheggio policlinico TV
CHRIS Proba 2007

The classification processing (i)DefinitionMultispectral classification is the process of sorting pixels into a finite number of individual classes, or categories of data, based on their data file values. If a pixel satisfies a certain set of criteria, the pixel is assigned to the class that corresponds to that criteria.From ERDAS field guide
The classed could be associated to real features on the ground (asphalt, vegetation, bare soil,…) or simply because they appear different according a specific criteria.
Pattern recognitionIs the science (and art) of finding meaningful patterns in data (using spectral or spatial information), which can be extracted throughclassification.From ERDAS field guide

The classification processing (ii)Training PhaseIt is possible to instruct the system to identify patterns in the images
Supervised trainingSeveral training patterns are submitted to the system and it uses these example to build the knowledgeUnsupervised trainingIs more computer-automated. Some statistical information are provided to the system which organizes the knowledge in order toidentify a certain number of pattern according to the information
Classifying phaseAll the image are processed and the pixel are divided in classesusing a pre-defined rule
Signatures of reference

The classification processing (iii)
Decision rule is a mathematical algorithm that, using data contained in the signature, performs the actual sorting of pixels into distinct class values.
Parametric rules: there is a statistical characterization of the information contained in the signatures• Minimum distance• Mahalanobis distance• Maximum Likelihood/Bayesan rule
Non parametric rules: not based on the statistics, definition of intervals (spaces) related to the decision • Parallelepiped

Non parametric rule: parallelepiped
Copyright Leica Geosystem, From ERDAS field guide

Highway asphaltRoad asphaltResidentialBare soil-arable landUnclassifiedClouds (withe)Commercial-IndustrialVegetated areasForest
Production of land cover maps

Very high resolution land cover
Bare SoilAsphaltVegetationUrban Fabrics (white)Copyright PhD Programme Tor Vergata University

The importance of vegetation monitoring
Remote sensing has proven a powerful "tool" for assessing the identity, characteristics, and growth potential of most kinds of vegetative matter at several levels (from biomes to individual plants)
Copyright NASA, from http://rst.gsfc.nasa.gov

Vegetation indexes and mapsAnalysis of the reflective properties in several spectral bands can be carried out to monitor the status, the development, the density and the productive potentiality of vegetated areas and cultivated fields
Spectral bands are properly combined to produce indexes related to the vegetation condition• NDVI
NDVI = (NIR - red) / (NIR + red) • LAI• FAPAR
For this kind of analysis sensors at medium and low resolution wide swath are used (MODIS, AVHRR, MERIS, SPOT Vegetation,…)
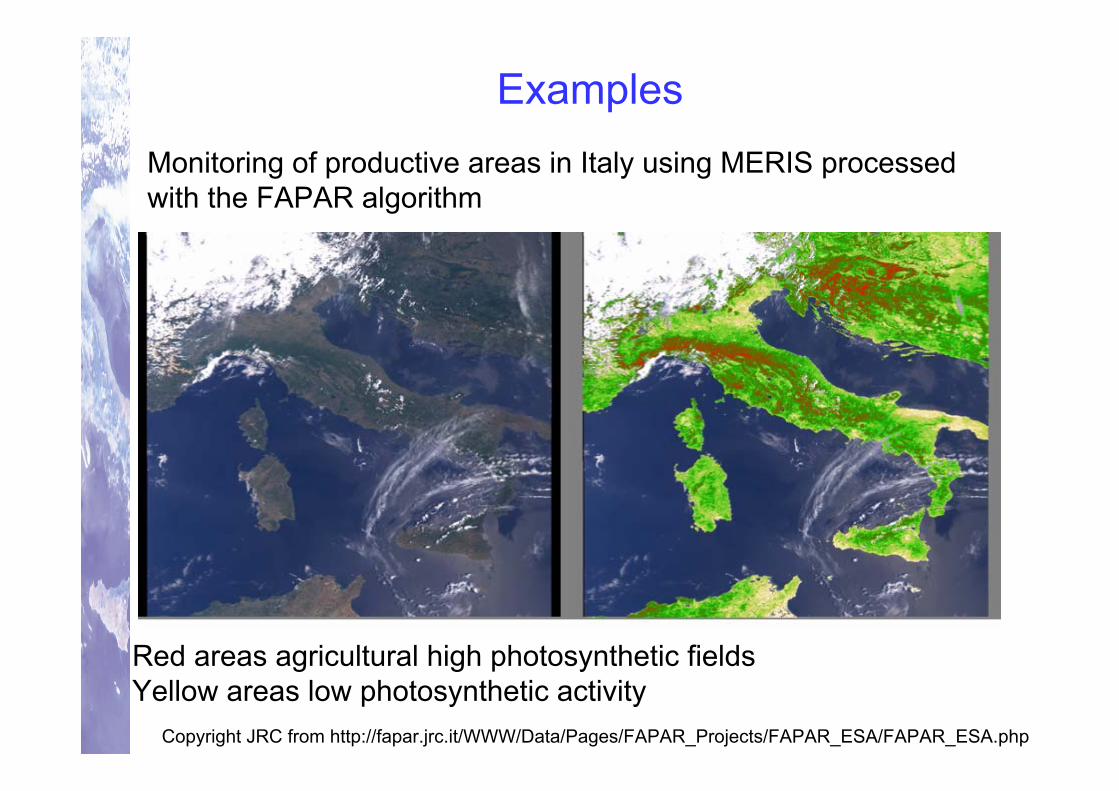
ExamplesMonitoring of productive areas in Italy using MERIS processed with the FAPAR algorithm
Red areas agricultural high photosynthetic fieldsYellow areas low photosynthetic activity
Copyright JRC from http://fapar.jrc.it/WWW/Data/Pages/FAPAR_Projects/FAPAR_ESA/FAPAR_ESA.php
And now you…
http://www.disp.uniroma2.it/geoinformazione/